Abstract
Due to the size limitations of shaking tables, dynamic scale models of large-span space structures for engineering have small cross-sections and thin wall thicknesses. It is difficult to use the structural steels commonly used in prototypes to make dynamic scale models. In this paper, 304 stainless steel is proposed for making the scale model, and the similarity relationship between the structural-steel prototype and the 304-stainless-steel dynamic scale model was studied. Firstly, a uniaxial test was conducted to study the elastic modulus similarity and the yielding stress similarity. The test results demonstrated that the elastic modulus similarity ratio was 1:1, and the stress similarity ratios of the 304 stainless steel and the three typical structural steels were 1:1 (Q235 steel), 1:1.5 (Q355 steel) and 1:1.8 (Q420 steel). Then, the similarities of other variables were derived using the dimensional analysis method. In the end, a numerical analysis was conducted to verify the similarity relationship between the structural-steel prototype and the 304-stainless-steel dynamic scale model. In the numerical analysis, a single-layer spherical reticulated shell structure and a dynamic scale model with a length similarity ratio of 1:20 were established by using the ABAQUS 2021 software, and the node displacement, the element internal force and natural vibration characteristics were analyzed. The results show that standard deviations of the displacements, the internal forces and the natural vibration frequencies between the prototype and the scale model were within 5%. It turns out that the proposed similarity between the structural-steel prototype and the 304-stainless-steel dynamic scale model was applicable in the elastic stage. The findings provide a reference for designing a dynamic scale model of large-span space structures for engineering by using 304 stainless steel.
1. Introduction
In addition to various advantages, large-span spatial structures also have characteristics such as a frequency density, complex vibration modes, and significant spatial effects in terms of earthquake action [1]. The seismic response of large-span spatial structures is complex, and seismic damage events are often reported [2]. The shaking table test is an important means of seismic research [3,4,5,6]. The size of the shaking table is limited, but the span of the spatial structure is often large. A scale model for large-span spatial structures for dynamic studies has to be made. In addition, the similarity of the length for large-span spatial structures is very small. The similarity relationship between the prototype structure and the dynamic scale model is a key parameter of the shaking table test.
The shaking table test can be separated into a scientific-research-oriented test and an engineering-oriented test according to its purpose. The differences between the two in terms of the scale model design requirements and the limiting conditions are obvious.
In terms of scientific research, the shaking table test is used for validating the research results of engineering seismic theory. Ye et al. [7] conducted a shaking table test to study the strong earthquake collapse of single-layer spherical-shell structures. Three dynamic scale models with a geometric similarity ratio of 1/10 were designed. The three models were made of oxygen-blown steel pipes and welded hollow steel balls. However, significant residual deformation during the welding made the welding quality poor. Wang et al. [8] conducted a shaking table test to study the dynamic collapse mechanism of grid shell structures. They designed a dynamic scale model with a geometric similarity ratio of 1/10. The components were made of structural steel. Li et al. [9] conducted a shaking table test to study the seismic response of a single-layer cylindrical-lattice shell with friction pendulum isolation under multiple seismic inputs, and they designed a dynamic scale model with a geometric similarity ratio of 1/10. The model was made of structural steel.
For the shaking table test for scientific research, the geometric similarity of the dynamic scale model can be determined with a suitable value of about 1/10. Then, based on the geometric similarity relationship, the geometric dimensions and cross-sectional dimensions of the prototype structure can be inferred. With a suitable geometric similarity, the cross-sectional dimension of the scale model will be suitable, and the materials of the scale model and the prototype structure can be consistent. Overall, the design of dynamic scale models for scientific research has low complexity.
In terms of practical engineering, the purpose of the shaking table test is to verify the reliability of engineering structures under earthquake conditions. Zhang et al. [10,11] conducted a shaking table test on a 93-meter-span dome structure. A dynamic scale model with a geometric similarity ratio of 1/10 was manufactured, and structural steel was used for both the scale model and the prototype structure. It was found that it was difficult to obtain structural-steel pipes that met the similarity relationship. Zhang et al. [12] conducted a shaking table test on the large-span roof structure of the Beijing Daxing International Airport Terminal and designed a dynamic scale model with a geometric similarity ratio of 1/60. Since the geometric similarity was very small, yellow bronze was used for the dynamic scale model. It was also difficult to obtain yellow bronze pipes that met the similarity relationship. However, the elastic modulus and yield strength between the structural steel and the yellow bronze were different; it affected the accuracy of the shaking table test results.
Since the geometric dimensions, component cross-sections, and material categories of actual engineering structures cannot be changed, the geometric similarity ratio of dynamic scale models is constrained by the size of the shaking table. The small geometric dimensions and cross-sections bring various difficulties when making dynamic scale models. In an actual large-span spatial roof structure, there are dense components and various cross-sections. When a small geometric similarity ratio is used, the dense structural components, various small cross-sections and super-thin-walled members make it difficult to obtain small-cross-section thin-walled components that fully meet the similarity relationship using the same materials as the prototype structure. When it is necessary to design a dynamic scale model using alternative materials, the differences in the elastic modulus and yield strength between the alternative materials and the prototype materials make the similarity relationship more complex. Overall, the design of dynamic scale models for large-span spatial structures facing practical engineering has more limitations and greater difficulty.
Stainless steels have attracted extensive interest due to their distinguished mechanical properties [13]. It has been recognized that one of the most important microstructural properties that allows an optimum balance between strength and ductility in these steels is the presence of metastable austenite [14]. It was found that austenitic 304 stainless steel is commonly used to process small-cross-section, thin-walled, hollow pipes and solid rods. There are many types of standard section specifications available, and hot extrusion molding technology [15,16] can also be used to process non-standard hollow pipe sections. In summary, using austenitic 304 stainless steel to design dynamic scale model components for engineering-oriented large-span spatial structures makes it easy to obtain component sections that meet geometric similarity ratios. In addition, austenitic 304 stainless steel plates can be used for welding hollow ball joints or other commonly used solid joints. Gas-shielded welding can effectively achieve the high-quality welding of austenitic 304 stainless steel rods and nodes [17]. In summary, the difficulty in manufacturing austenitic 304-stainless-steel dynamic scale models with a small geometric similarity is not significant.
Hence, in this paper, austenitic 304 stainless steel is proposed for designing a dynamic scale model for engineering-oriented large-span spatial structures. The similarity between the 304-stainless-steel dynamic scale model and the structural-steel prototype structure was the key parameter for designing the dynamic scale model in this study. In this paper, a uniaxial tensile test was conducted to determine the elastic modulus similarity and the stress similarity between the 304 stainless steel and three typical structural steels. Then, the similarity of other variables was derived by the dimensional analysis method. Furthermore, taking a finite element model of a single-layer cylindrical reticulated shell as an example, the static similarity and the dynamic similarity of the dynamic scale model and the prototype structure were verified.
2. Materials and Methods
2.1. Experimental Methods
2.1.1. Design of Test Specimens
The test specimens were designed and produced according to the EN10002-5-1992 [18] and GB/T 228.1-2010 standards [19]. The original cross-sectional area of the parallel length, , was taken as 4 mm, and the original width, , of the parallel length of the plate specimen was taken as 20 mm. According to the specifications, the transition arc, , of plates with a thickness greater than or equal to 3 mm should be more than 12 mm, and 20 mm was taken for the specimens in this study. The head width should be more than 1.2 , and in this experiment, the head width was taken as 60 mm.
The original gauge length, , can be calculated using Equation (1), where is the proportion coefficient.
The proportion coefficient is usually taken as 5.65, and the original length , calculated from Equation (1), is 49.7 mm. In the experiment, it was taken as 50 mm. The parallel length, , can be calculated from the original gauge distance, , by Equation (2).
From the above, it can be calculated that the parallel length, , is at least 63.4 mm, and in this experiment, 64 mm was taken. Taking into account all the dimensions, the total length, , was 304 mm. The specific style and size are shown in Figure 1.
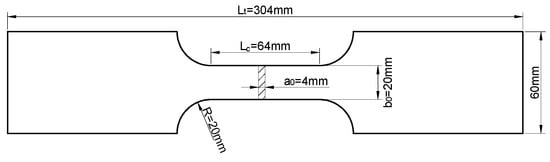
Figure 1.
Dimensions of the test piece.
2.1.2. Loading of the Test Piece
Upon loading startup, the test machine was warmed up. The cross-sectional area of the test piece was measured at the parallel length. Gause was pasted onto the test piece. Then, the testing machine was set up, and zeroing of the machine was completed. In addition, the gripping of the test piece was restricted to the grip section. The speed of testing was defined in terms of that is the rate of the testing machine, and that is the straining rate of the parallel length of the test piece. The loading history was recorded by a computer, as shown in Figure 2. The rate of the machine, , was calculated by Equation (3).
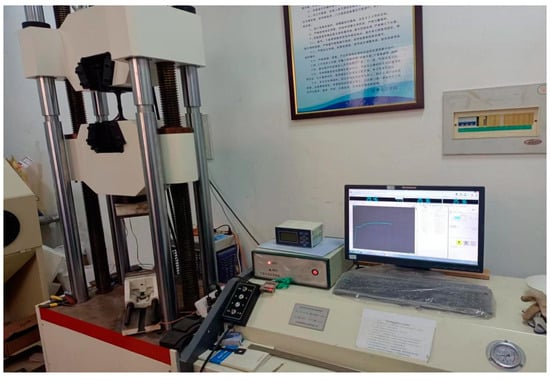
Figure 2.
Testing and recording equipment.
was taken as 0.00025 , and was calculated as 0.96 mm/min, taking 1 mm/min.
2.1.3. The Elastic Modulus and Yield Stress
When steel is subjected to tension, the initial elastic stage conforms to Hooke’s law, and its proportional coefficient is the elastic modulus. Therefore, the proportion coefficient is calculated within the linear deformation section of the steel stress–strain curve. During the manufacturing process, some minor defects on the test pieces may occur, such as internal stress, welding areas, surface finish, etc. These issues may have an impact on the test results. Due to various uncertain factors, the final curve is not perfect. Therefore, a linear segment interval was selected for the calculation. The elastic modulus of each specimen was calculated according to Equation (4), and the average elastic modulus of the specimen was calculated using Equation (5).
In Equation (4), i represents the specimen number, represents the elastic modulus of the ith specimen, represents the upper boundary value of the stress interval, represents the lower boundary value of the stress interval, represents the strain value corresponding to the upper boundary of the stress interval and represents the strain value corresponding to the lower boundary of the stress interval. In Equation (5), represents the average elastic modulus, represents the elastic modulus of the first specimen and represents the total number of specimens.
In the nonlinear stage of a material, its stress and strain will no longer form a linear deformation relationship, that is, from the elastic stage to the nonlinear stage, the material exhibits a straight to curved stress–strain curve. The turning point from a straight-line segment to a curved-line segment on the stress–strain curve can be taken as the yield stress.
2.2. Similarity Relationship of the Main Physical Parameters
The length, the stress and the acceleration can be selected as the control constants for a similarity relationship. Except for some response values and a similarity relationship that can be directly determined by experimentation, other similar data can be determined using dimensional analysis or the quasi-dimensional method [20]. The mass density, concentrated force, moment and surface load similarity ratio of the prototype structure and the scale model can be derived.
The dimensionality is a type of physical quantity such as the time, mass, velocity, acceleration, etc., which are all specific physical quantities. Therefore, the type of each physical quantity is called the dimensionality. Dimensions are divided into basic dimensions and derived dimensions. Basic dimensions are the fundamental physical quantities among physical quantities. In physical quantities, dimensions are divided into two systems, including mass systems and force systems. The basic dimensions of a mass system are the mass, the length and the time. All other dimensions are derived dimensions expressed by the dimensions of these three physical quantities. Another system is the system of force. Its basic dimensions are the force, the length and the time. The basic principles of the mass system and the force systems are the same, and the mass system was used for the dimensional analysis in this paper.
The Mass Density Similarity Constant
In the mass system, the dimensions of length, , stress, , and acceleration, , are , , , respectively, and their power exponents are listed in Table 1, Table 2, Table 3 and Table 4. The dimension of mass density is , the dimension of concentrated force is , the dimension of the bending moment is and the dimension of the surface load is . The corresponding power exponents are also listed in the following table and were linearly transformed until they were all zero. Therefore, the mass density similarity, , the concentrated force similarity, , the moment similarity, , and the surface force similarity, , can be expressed as per Equation (6), Equation (7), Equation (8) and Equation (9), respectively. The similarity of other quantities can be calculated with the same theory.

Table 1.
Power exponents for calculating the mass density similarity constant.
Table 2.
Power exponents for calculating the concentrated force similarity constant.
Table 3.
Power exponents for calculating the moment similarity constant.
Table 4.
Power exponents for calculating the surface load similarity constant.
In Equations (6)–(9), represents the stress similarity, represents the acceleration similarity and represents the length similarity.
3. Results
3.1. The Elastic Modulus Similarity and the Yield Stress Similarity
Q235 steel is a plain carbon structural steel that is widely used in China. Q355 steel and Q420 steel are low-alloy, high-strength structural steels used in China. For Q235 steel, “Q” is the first letter of the Chinese spelling of “Qufu dian”, which means yield point. The number “235” refers to the minimum yield strength of 235 MPa tested with a steel bar diameter or plate thickness ≤ 16 mm. Q355 steel and Q420 steel have the same meaning as Q235 steel.
The test results of the elastic modulus are shown in Table 5. The average elastic modulus was used as the actual elastic modulus of the material. The average yield stresses for the Q235, Q355, Q420 and 304 stainless steel were 237 MPa, 347.43 MPa, 423.89 MPa and 238.92 MPa, respectively. Based on the elastic modulus and yield stress of the different steels, the similarities of the Q235, Q355 and Q420 to the property data of the stainless steel were calculated. According to the experimental results, the ratio of the yield stresses of the three typical structural steels to the yield stress of the 304 stainless steel were 0.99, 1.46 and 1.77, respectively. The ratios of the elastic modulus were 1.06, 0.96 and 1.04, respectively. For the convenience of engineering use, the elastic modulus similarities among the steels were taken as 1.0, and the yield stress similarities were taken as 1.0, 1.5 and 1.8, respectively.
Table 5.
Elastic modulus of 304 stainless steel and three low-alloy, high-strength structural steels.
3.2. Similarities of Other Main Physical Quantities
3.2.1. Similarity Relationship of the Main Physical Parameters of the Scaled Model
Following the test results as well as given the length similarity of 1:20 and the acceleration similarity of 1:1, the similarity relationship of other physical parameters could be calculated according to the dimensional analysis method. The similarity ratios of the mass, the length and the time were 1:1, 1:20 and 1:1, respectively. Compared with the static performance of structures, the difference in the structural dynamic performance is mainly caused by the inertial action of the structure itself. Therefore, the design of structural dynamic scale models should also carefully consider the similarity relationship between the physical quantities related to those used in practice. In summary, the similarity relationships of the main physical parameters of the three typical structural steels are listed in Table 6.
Table 6.
Similarity relationship of main physical parameters.
3.2.2. Additional Mass for Scaled Models
When using materials with the same mass density as the prototype structure, its volume will be reduced by the cubic ratio of the length similarity. Meanwhile, the cross-sectional area of the structure will be reduced by the square of this ratio. Therefore, the stress generated by self-weight in a dynamic scale model is smaller than the self-weight stress in a prototype structure. To maintain the consistency of the self-weight stress between a scale model and a prototype structure, it is necessary to use a material with a mass density that is several times larger than the prototype material.
The mass densities of the structural steels and the 304 stainless steel were the same. Due to the similarity ratio of the acceleration being taken as 1:1, the mass density of the scaled model did not meet the relationship in Table 6. Hence, additional mass was required to achieve the same self-weight stress between the scale model and the prototype. The calculation of the additional mass, , was conducted as per Equation (10), in which m is the mass before compensation.
3.3. Example
3.3.1. Model Design Parameters
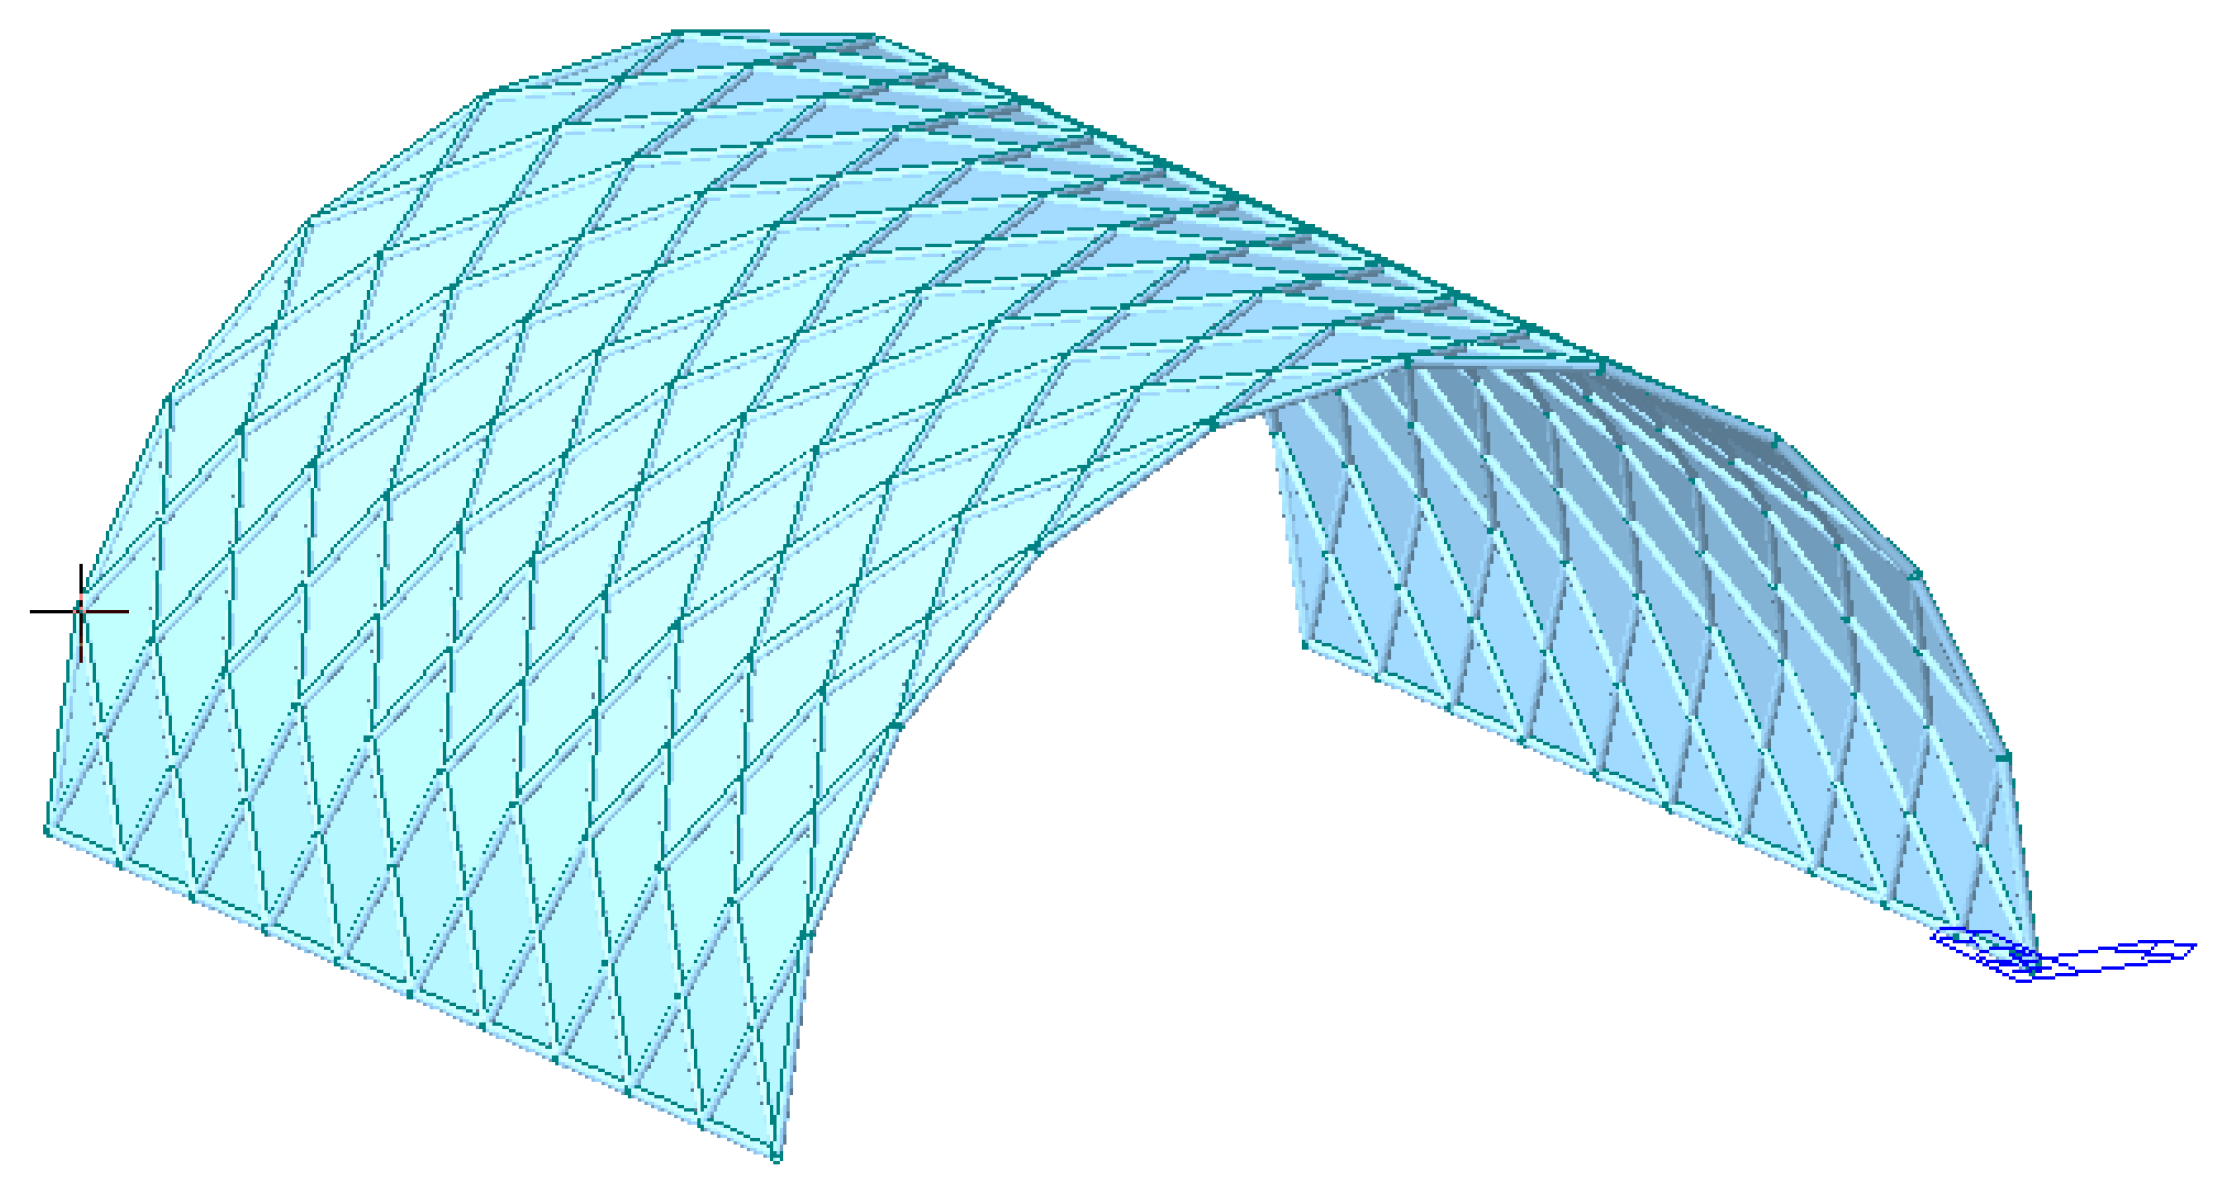
A single-layer cylindrical reticulated shell was selected as the analysis model, as shown in Figure 3. The span and longitudinal length of the prototype structure were both 20 m, the shell height was taken as 10 m and the number of vertical and horizontal grid divisions was 10. The material was structural steel, and the cross-section was a uniform 180 mm × 10 mm circular steel pipe. The dynamic scale model was made of 304 stainless steel, and all the other dimensions were scaled to a length similarity of 1:20. The specific data are shown in Table 7.

Figure 3.
Overall view of the single-layer cylindrical reticulated shell.
Table 7.
Design parameters of the prototype structure and the scale model.
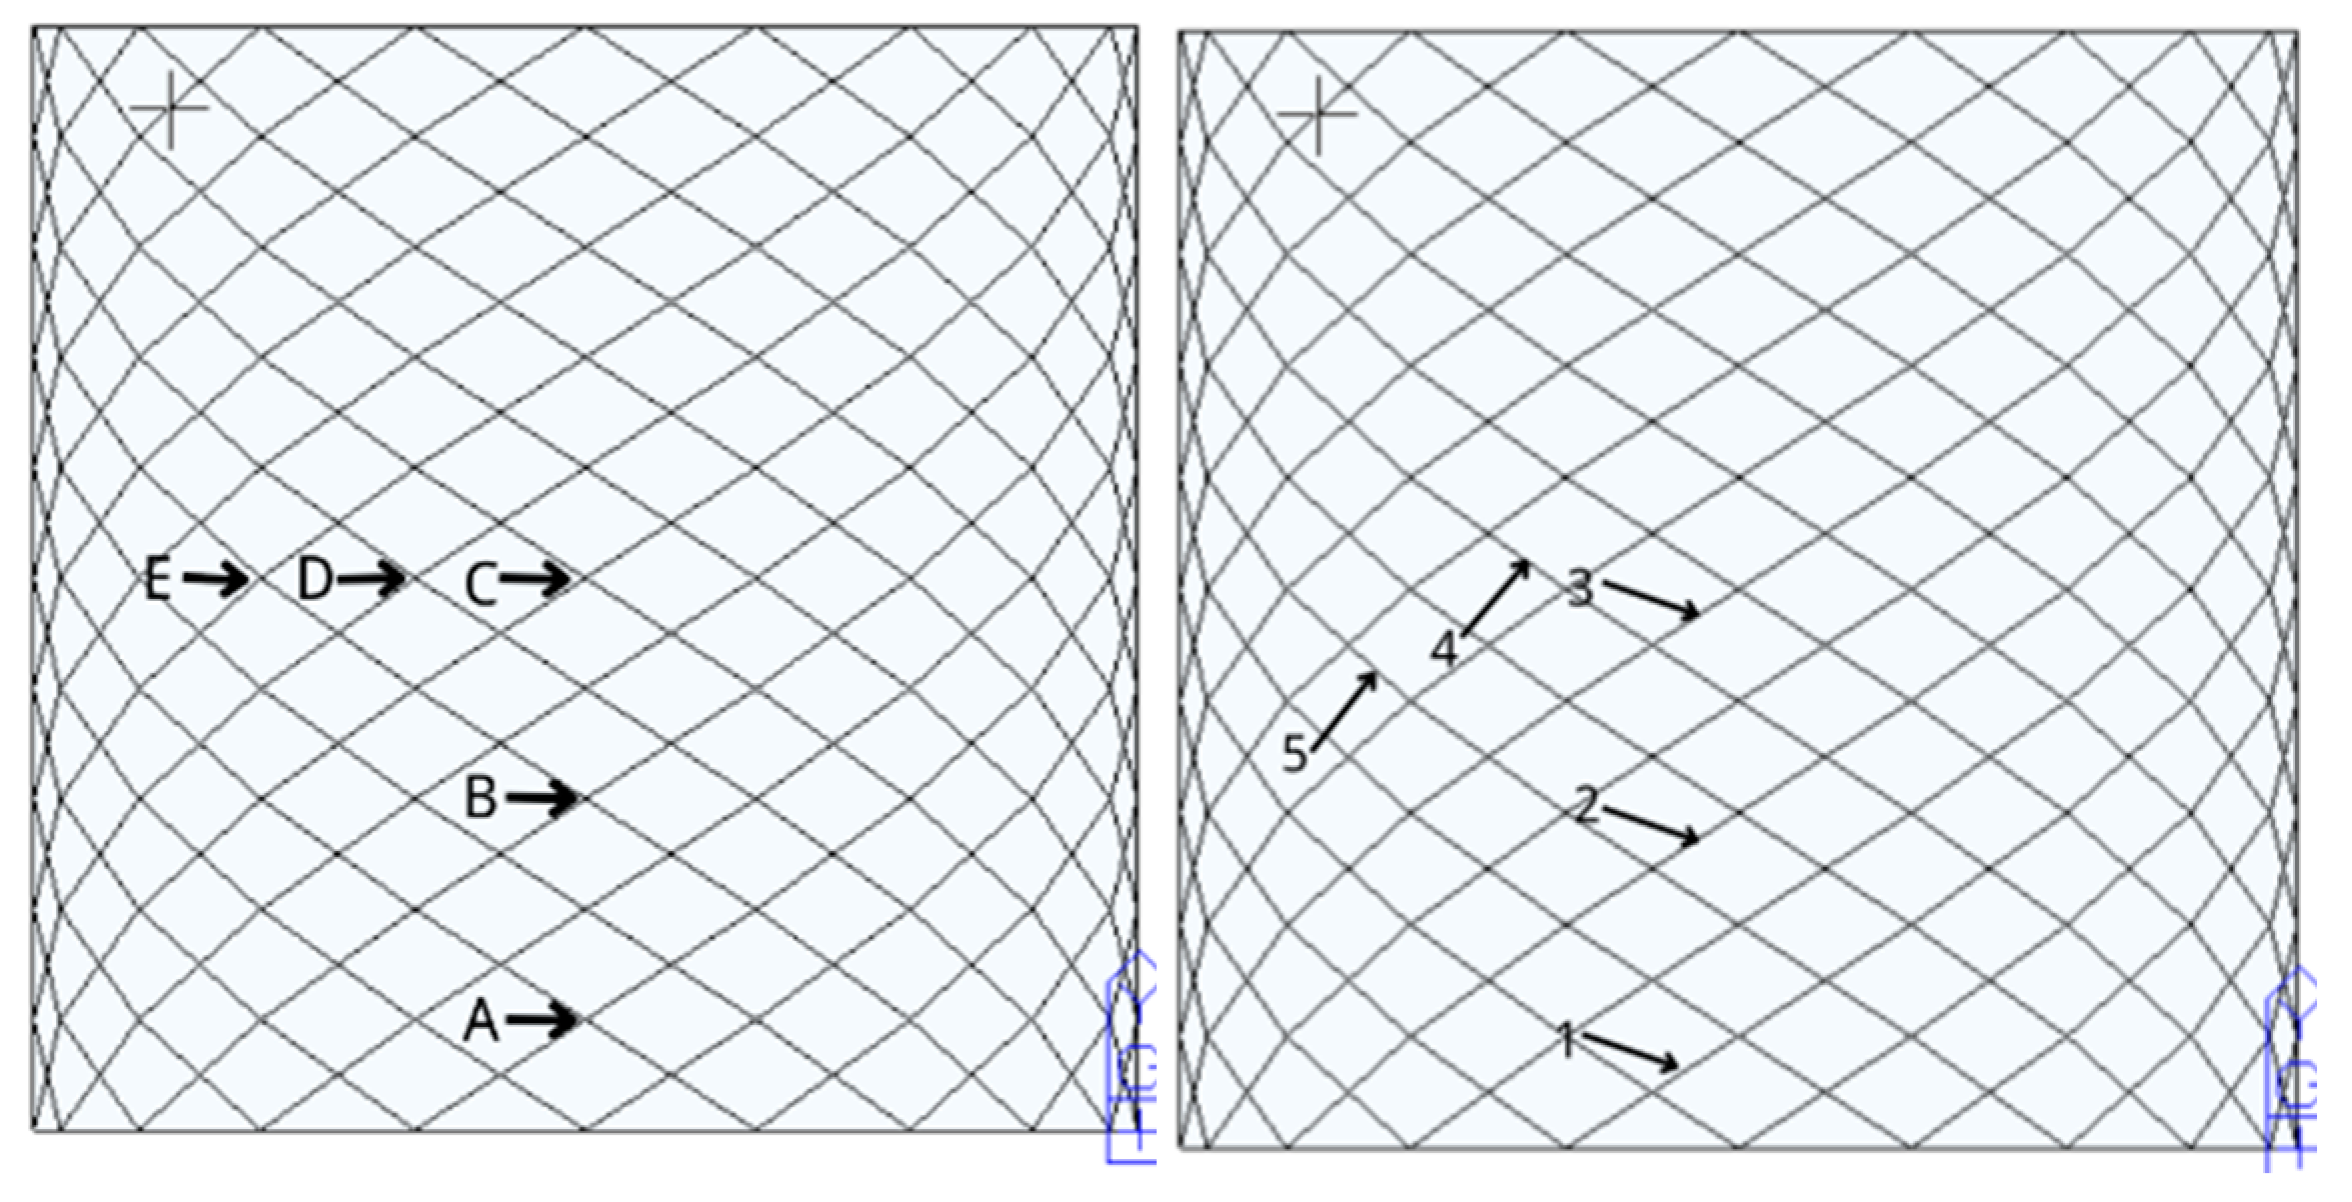
3.3.2. Layout of Observation Nodes and Elements
Five nodes and five elements on the prototype structure and the scale model were taken as the observation nodes and elements, respectively. The nodes and elements are shown in Figure 4. By comparing the displacement, internal force, etc., of these nodes and elements, the feasibility of the similarity relationship of the scale model can be demonstrated. In Figure 4, A–E means the node number, and 1–5 means the element number.
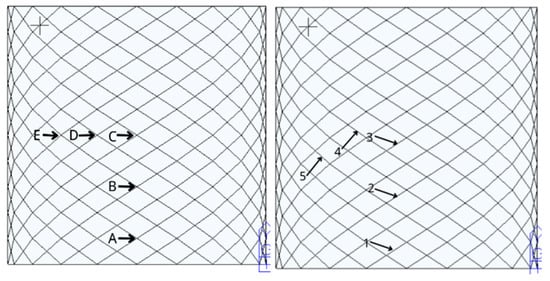
Figure 4.
Locations of observation nodes and elements.
3.3.3. Static Analysis Results
The static analysis of the prototype structures and the dynamic scale model was performed using the Midas Gen V2021 software. In addition to considering the weight of the steel structure itself, the distributed dead load of the prototype structure was taken as 0.6 kN/m2, and the distributed live load was taken as 0.5 kN/m2. The external loadings of the scale model were correspondingly reduced according to the similarity relationship shown in Table 6. In addition to applying the above loads, the scale model should also undergo additional mass Considering that an actual scaled model usually applies additional mass blocks at nodes, the finite element model should also apply additional mass in the form of nodal forces, and the magnitude of the nodal forces should be converted according to the additional mass. The load combination of the prototype structures and the scale model was taken as the standard combination, which was 1.0 dead load + 1.0 distributed dead load + 1.0 distributed live load + 1.0 additional node force.
In Table 8, Table 9, Table 10, Table 11 and Table 12, it is shown that after considering the similarity relationship, the displacement, axial force, bending moment standard deviations of the prototype structure and the scale model under static load could be controlled within 5%. In summary, the static behavior of the prototype structure and the scale model satisfied the similarity relationship.
Table 8.
Displacements of prototype structure and corresponding scaled model.
Table 9.
Axial forces of prototype structure and corresponding scale model.
Table 10.
Bending moments of prototype structure and corresponding scaled model.
Table 11.
Frequency of prototype structure and corresponding scaled model.
Table 12.
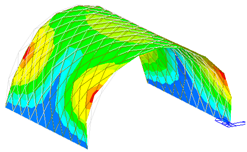
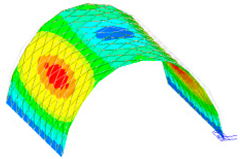
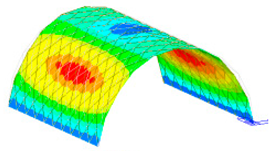
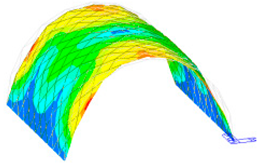
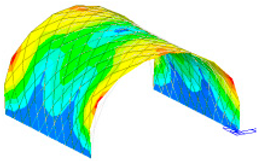
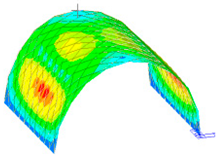
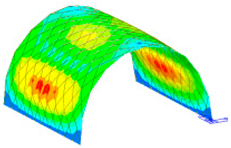
Mode shapes of Q420 prototype structure and corresponding scaled model.
3.3.4. Dynamic Analysis Results
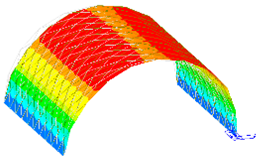
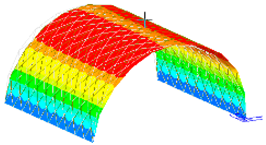
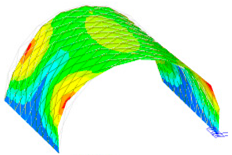
The frequency and vibration mode shapes were compared. The frequencies corresponding to the first five modes of the prototype structure and the scale model are listed in Table 11. Since the mode shapes of the scale models corresponding to different steels were the same, the Q420 prototype structure and its corresponding scale model was selected as an example, and the first five mode shapes are displayed in Table 12.
From the comparison of the natural frequencies of the prototype structure and the scale model, it can be seen that the natural frequency deviation of the two could be controlled within 5% after considering the similarity relationship. Hence, the natural frequency of the two conformed to the similarity relationship. From the comparison of the first five modal modes of the prototype structure and the scale model, it can be seen that the vibration modes could maintain consistency during the vibration process, and the scaled model could reflect the dynamic characteristics of the prototype structure.
4. Discussion
This article provides a design method for a dynamic model of a large-span spatial structure with a small geometric similarity using 304 stainless steel. The similarity relationship between the 304 stainless steel and three typical structural steels, including Q235, Q355 and Q420, was studied. There are several limitations with this paper.
Firstly, the research in this article verified that the proposed similarity relationship was applicable to the elastic stage. The similarity in the inelastic stage requires further study. Secondly, only three typical structural steels were studied in this paper. Other structural steels require investigation. In addition, some references mentioned the use of bronze tubes to design engineering-oriented dynamic scale models, and further research is needed to determine the similarity relationship between bronze and structural steels.
5. Conclusions
Due to the size limitation of shaking tables, dynamic scale models of large-span-space structures for engineering have small cross-sections and super-thin-wall components. It is difficult to use structural steels in prototypes to make dynamic scale models. It was proposed in this paper to use 304 stainless steel to make a scale model, and the similarity relationship between the structural-steel prototype and the 304-stainless-steel dynamic scale model was studied.
A uniaxial tensile test was performed to determine the elastic modulus similarity and the yield stress similarity. The results of the uniaxial tensile test show that the elastic modulus similarity ratio was taken as 1:1, and the stress similarity ratios of the 304 stainless steel and the Q235, Q355 and Q420 steels were taken as 1:1, 1:1.5 and 1:1.8, respectively.
The similarity relationship of other main physical parameters was studied using the dimensional analysis method. The mass density, length and time were defined as the three basic physical parameters. The length similarity ratio, yield stress similarity ratio and acceleration similarity ratio were selected as the control constants of the similarity relationship.
For verifying the similarity, a single-layer spherical reticulated shell and a dynamic scale model with a length similarity ratio of 1:20 were established, and the static analysis and natural vibration characteristics were analyzed. The analysis results verified the similarity between the low-alloy, high-strength structural steel prototype and the 304 stainless steel dynamic scale model.
In future research, static loading experiments on prototype structures and scaled models will be conducted. The similarity between the two in terms of the structural stiffness and ultimate bearing capacity will be studied, and the differences in the failure characteristics between the two will be discussed to verify that the proposed similarity relationship is applicable in the inelastic stage.
Author Contributions
Conceptualization, R.L. and J.X.; methodology, R.L.; software, G.W.; validation, R.L.; formal analysis, J.X.; investigation, R.L.; resources, J.X.; data curation, G.W.; writing—original draft preparation, J.X.; writing—review and editing, R.L.; visualization, G.W.; supervision, R.L.; project administration, J.X.; funding acquisition, R.L. All authors have read and agreed to the published version of the manuscript.
Funding
This study was funded by the Natural Science Foundation of Shandong (ZR201911030049).
Data Availability Statement
Data are contained within the article.
Acknowledgments
Thanks are given for the assistance from undergraduate student Qiubao Liu in this study.
Conflicts of Interest
The authors declare no conflict of interest.
References
- Zhang, C.; Zhu, Z.; Wang, S.; Shi, C.; Li, W. Seismic response and deformation mechanism of near-fault deep tunnels in a strong earthquake area. Acta Geotech. 2023, 18, 4847–4869. [Google Scholar] [CrossRef]
- Yang, Y.; Du, H.; Yao, G.; Ma, X.; Men, W. Time-Varying Mechanical Analysis of Long-Span Spatial Steel Structures Integral Lifting in Construction Basing Building Information Model. Sustainability 2023, 15, 11256. [Google Scholar] [CrossRef]
- Xu, H.; He, W.; Zhang, L.; Liu, W. Shaking table test of a novel Three-dimensional seismic isolation system with inclined rubber bearings. Eng. Struct. 2023, 293, 116609. [Google Scholar] [CrossRef]
- Dinh, D.G.; Quan, T.Q. Nonlinear dynamic analysis of imperfect functionally graded material double curved thin shallow shells with temperature-dependent properties on elastic foundation. J. Vib. Control 2015, 21, 1340–1362. [Google Scholar] [CrossRef]
- Zhang, C.X.; Nie, G.B.; Dai, J.W.; Zhi, X.D. Experimental studies of the seismic behavior of double-layer lattice space structures I: Experimental verification. Eng. Fail. Anal. 2016, 64, 85–96. [Google Scholar] [CrossRef]
- Yang, M.F.; Xu, Z.D.; Zhang, X.C. Experimental study on lead extrusion damper and its earthquake mitigation effects for large-span reticulated shell. Steel Compos. Struct. 2015, 18, 481–496. [Google Scholar] [CrossRef]
- Ye, J.H.; Pan, R. Shaking table test on collapse process of single-layer spherical shells. J. Build. Struct. 2013, 34, 81–90. [Google Scholar] [CrossRef]
- Wang, X.L.; Wu, C.; Ma, X.T.; Liang, Y. Dynamic collapse of spherical shell under unsymmetrical load distribution and study of shaking table test. Eng. Mech. 2015, 32, 91–98. [Google Scholar] [CrossRef]
- Li, X.Y.; Shan, M.Y.; Xue, S.D.; Huang, F.Y. Experimental study on seismic response of single-layer cylindrical latticed shell with FPS. J. Vib. Shock. 2018, 37, 68–75+98. [Google Scholar] [CrossRef]
- Zhang, A.L.; Wang, D.M.; Liu, X.C.; Ge, J. Dynamic performance experiment and theoretical analysis on the suspend-dome structure model of the badminton gymnasium for 2008 Olympic Games. J. Build. Struct. 2007, 28, 68–75. [Google Scholar] [CrossRef]
- Wang, D.M.; Zhang, A.L.; Liu, X.C. Novel dynamical feature and anti-seismic experiment about the big span suspend-dome structure. J. Beijing Univ. Technol. 2007, 28, 58–67. [Google Scholar]
- Zhang, A.L.; Wang, X.Q.; Liu, X.C.; Shu, W.; Zhu, Z.; Qiang, S.; Jiang, Z.; Feng, S. Shaking table test on overall-scale model of long-span steel structure of Beijing Daxing International Airport terminal. J. Build. Struct. 2021, 42, 1–13. [Google Scholar] [CrossRef]
- Cui, P.; Xing, G.; Nong, Z.; Chen, L.; Lai, Z.; Liu, Y.; Zhu, J. Recent Advances on Composition-Microstructure-Properties Relationships of Precipitation Hardening Stainless Steel. Materials 2022, 15, 8443. [Google Scholar] [CrossRef] [PubMed]
- Li, Y.; Martín, D.S.; Wang, J.; Wang, C.; Xu, W. A review of the thermal stability of metastable austenite in steels: Martensite formation. J. Mater. Sci. Technol. 2021, 91, 200–214. [Google Scholar] [CrossRef]
- Tuo, L.F.; Zhou, G.S.; Yu, Z.Q.; Kang, X.T.; Wang, B.W. Extrusion process of 304L H-shaped stainless steel used in passive residual heat removal heat exchanger. Nucl. Sci. Tech. 2019, 30, 61. [Google Scholar] [CrossRef]
- Xu, T.; Long, F.; Liang, Y.; Zhang, H.; Shi, S.; Cheng, Y.; Xu, G.; Li, Z.; Ge, Y. 3D extrusion printing of 304 stainless steel/polypropylene composites and sintering process optimization. Appl. Phys. A 2023, 129, 285. [Google Scholar] [CrossRef]
- Patterson, T.; Hochanadel, J.; Sutton, S.; Panton, B.; Lippold, J. A review of high energy density beam processes for welding and additive manufacturing applications. Weld World 2021, 65, 1235–1306. [Google Scholar] [CrossRef]
- BS, EN 10002-5:1992; Tensile Testing of Metallic Materials—Method of Test at Elevated Temperatures. British Standards Institution: London, UK, 1992.
- GB/T 228.1-2010; China Iron and Steel Association. Metallic Materials—Tensile Testing—Part 1: Method of Test at Room Temperature. China Quality Press: Beijing, China, 2010.
- Tan, Q. Dimensional Analysis; Press of University of Science and Technology of China: Hefei, China, 2005. [Google Scholar]


Disclaimer/Publisher’s Note: The statements, opinions and data contained in all publications are solely those of the individual author(s) and contributor(s) and not of MDPI and/or the editor(s). MDPI and/or the editor(s) disclaim responsibility for any injury to people or property resulting from any ideas, methods, instructions or products referred to in the content. |
© 2023 by the authors. Licensee MDPI, Basel, Switzerland. This article is an open access article distributed under the terms and conditions of the Creative Commons Attribution (CC BY) license (https://creativecommons.org/licenses/by/4.0/).