Article

Research on the Shear Performance of Cold-Formed Thin-Walled Steel-Glued Laminated Wood Composite Beams

1
School of Civil Engineering and Transportation, Northeast Forestry University, Harbin 150000, China
2
China Academy of Building Research, Beijing 100000, China
*
Author to whom correspondence should be addressed.
Buildings 2023, 13(12), 2903; https://doi.org/10.3390/buildings13122903
Submission received: 21 October 2023 / Revised: 11 November 2023 / Accepted: 15 November 2023 / Published: 21 November 2023
(This article belongs to the Section Building Structures)

Abstract

:
This paper proposes a new type of composite box beam combined with cold-formed thin-walled steel and glued laminated timber to develop green building structures while improving the load-carrying capacity of a single steel girder and glued timber girder. Two composite beams composed of laminated timber and Q235 cold-formed thin-walled steel were designed and fabricated. Then, the shear performance test with quadratic loading was carried out to analyze the load carrying capacity, damage modes, and deformation characteristics of the test beams, as well as their influencing factors. Subsequently, a finite element model of the composite beam was established, and the loading mode was the same as that of the test to further study the parameters affecting the shear performance of the composite beam. The results of the study indicate that steel and glued timber in composite beams connected by adhesive bonding can work and deform together under load and each give full play to its material properties, especially the composite beams, which exhibit higher shear strength than a steel or timber beam. The effects of parameters such as steel cross-sectional area, shear span ratio, steel skeleton form, and steel cross-sectional strength on the shear capacity of the composite beams were observed, among which the shear span ratio had the greatest effect on the shear capacity of the composite beams. The shear capacity decreased by 14.3% and 19.5% when the shear span ratio was increased from 1.5 to 2.0 and 2.5, respectively. The shear capacity of the combined composite beams increased by 10.6%, 6.3%, and 5.8% when the thickness was increased from 1.5 mm to 2.0 mm, 2.5 mm, and 3.0 mm, respectively. When the combination of the steel cross-section was a box beam, the overall shear-bearing capacity could be increased by 12% compared with the “I” type composite beam, although its shear stiffness was close to that of the “I” section composite beam.

1. Introduction

Glued laminated wood (Glulam) is a new green building material with green environmental protection. It is formed by drying, planing, and other processing; stacking according to a certain cross-section combination; and sizing and pressing [1]. It has the advantage of low energy consumption, is renewable, and offers green environmental protection. Wood structures made of glulam have the characteristics of light weight, high strength, good seismic resistance and durability, thermal insulation, energy-saving properties, and environmental protection, which is in line with the direction of high performance and sustainable development. In recent years, some scholars have carried out research on glued laminated timber beams [2,3]. Rammer et al. [4] proposed a shear strength formula of a glulam rectangular beam by studying the relationship between the shear strength of the glulam beam and its size, as well as the relationship between shear strength and bending strength. Liu Weiqing et al. [5] proposed several new cross-section forms of glulam beams based on plywood, laminated wood and laminated veneer lumber, and found that their strength and stiffness were higher than those of sawn timber beams. Because pure glulam beams are prone to brittle failure due to wood fiber breakage, many scholars have begun to study the performance enhancement of glulam beams and composite members. Julio Soriano et al. [6] attempted to symmetrically implant steel bars in glulam and carry out experimental research on the bending performance. It was found that the stiffness of glulam beams with embedded steel bars was 50% higher than that of glulam beams without embedded steel bars, and the bearing capacity of normal use was increased by 53.1%. Hassanieh et al. [7] carried out a four-point bending performance test on steel-laminated veneer lumber (LVL) composite beams with self-tapping screws, bolts, and glued self-tapping screws. It was found that the bending stiffness of the bolt connection was higher than that of the self-tapping screw connection, and the glue interface of the composite beam with the glued connection had almost no slip. Li Guodong et al. [8] conducted an experimental study on the shear performance of a new type of cold-formed thin-walled steel–glulam composite beam, and used ABAQUS software (2020) for the numerical analysis. It was found that the bearing capacity and deformation capacity of the composite beam were more prominent than those of the glulam beam. Da Shi et al. [9] studied the monotonic and cyclic axial tensile behavior of bolted steel-laminated veneer lumber (LVL) and bamboo connections. By combining Hill’s yield and element removal criteria, a new, high-fidelity finite element model was proposed. Wu et al. [10] carried out the shear performance test on steel–wood composite beams, and established the calculation formula of shear capacity of composite beams according to the bending shear flow theory. Wang et al. [11] performed four-point bending on a new type of I-LVL beam strengthened by cold-formed thin-walled channel steel, and found that considering the slip effect when calculating the flexural capacity was closer to the actual deformation than the section method.
In summary, glulam composite members have become the main research direction at present. Accordingly, due to the low elastic modulus of glued laminated wood, the elastic modulus of glulam is low, and the strength is degraded during use. It is prone to cracks and moisture, and to corrosion and insect corrosion due to environmental impact [12,13,14]. Therefore, the design of glulam composite beams needs to be able to accurately achieve the corresponding shear failure mode along the grain, and provide data support for its shear performance design. Accordingly, there are few studies on the shear performance or numerical simulation of glulam composite beams. In this paper, two cold-formed thin-walled steel–glulam composite beams were subjected to a four-point loading test. The bearing capacity, failure mode, and deformation characteristics of the test beams were analyzed. At the same time, a pure steel beam and an equal-section pine composite beam were introduced as comparison beams. The finite element model of the composite beam was established to predict the failure mode of wood under a complex stress state under the premise of accurately describing the orthogonal anisotropy of wood. The influences of the steel section area, shear span ratio, steel skeleton form, steel strength, and other parameters on the shear capacity of the composite beam were further analyzed. The purpose was to provide a reference for engineering applications involving the shear performance of steel–glulam composite beams.

2. Experimental Study

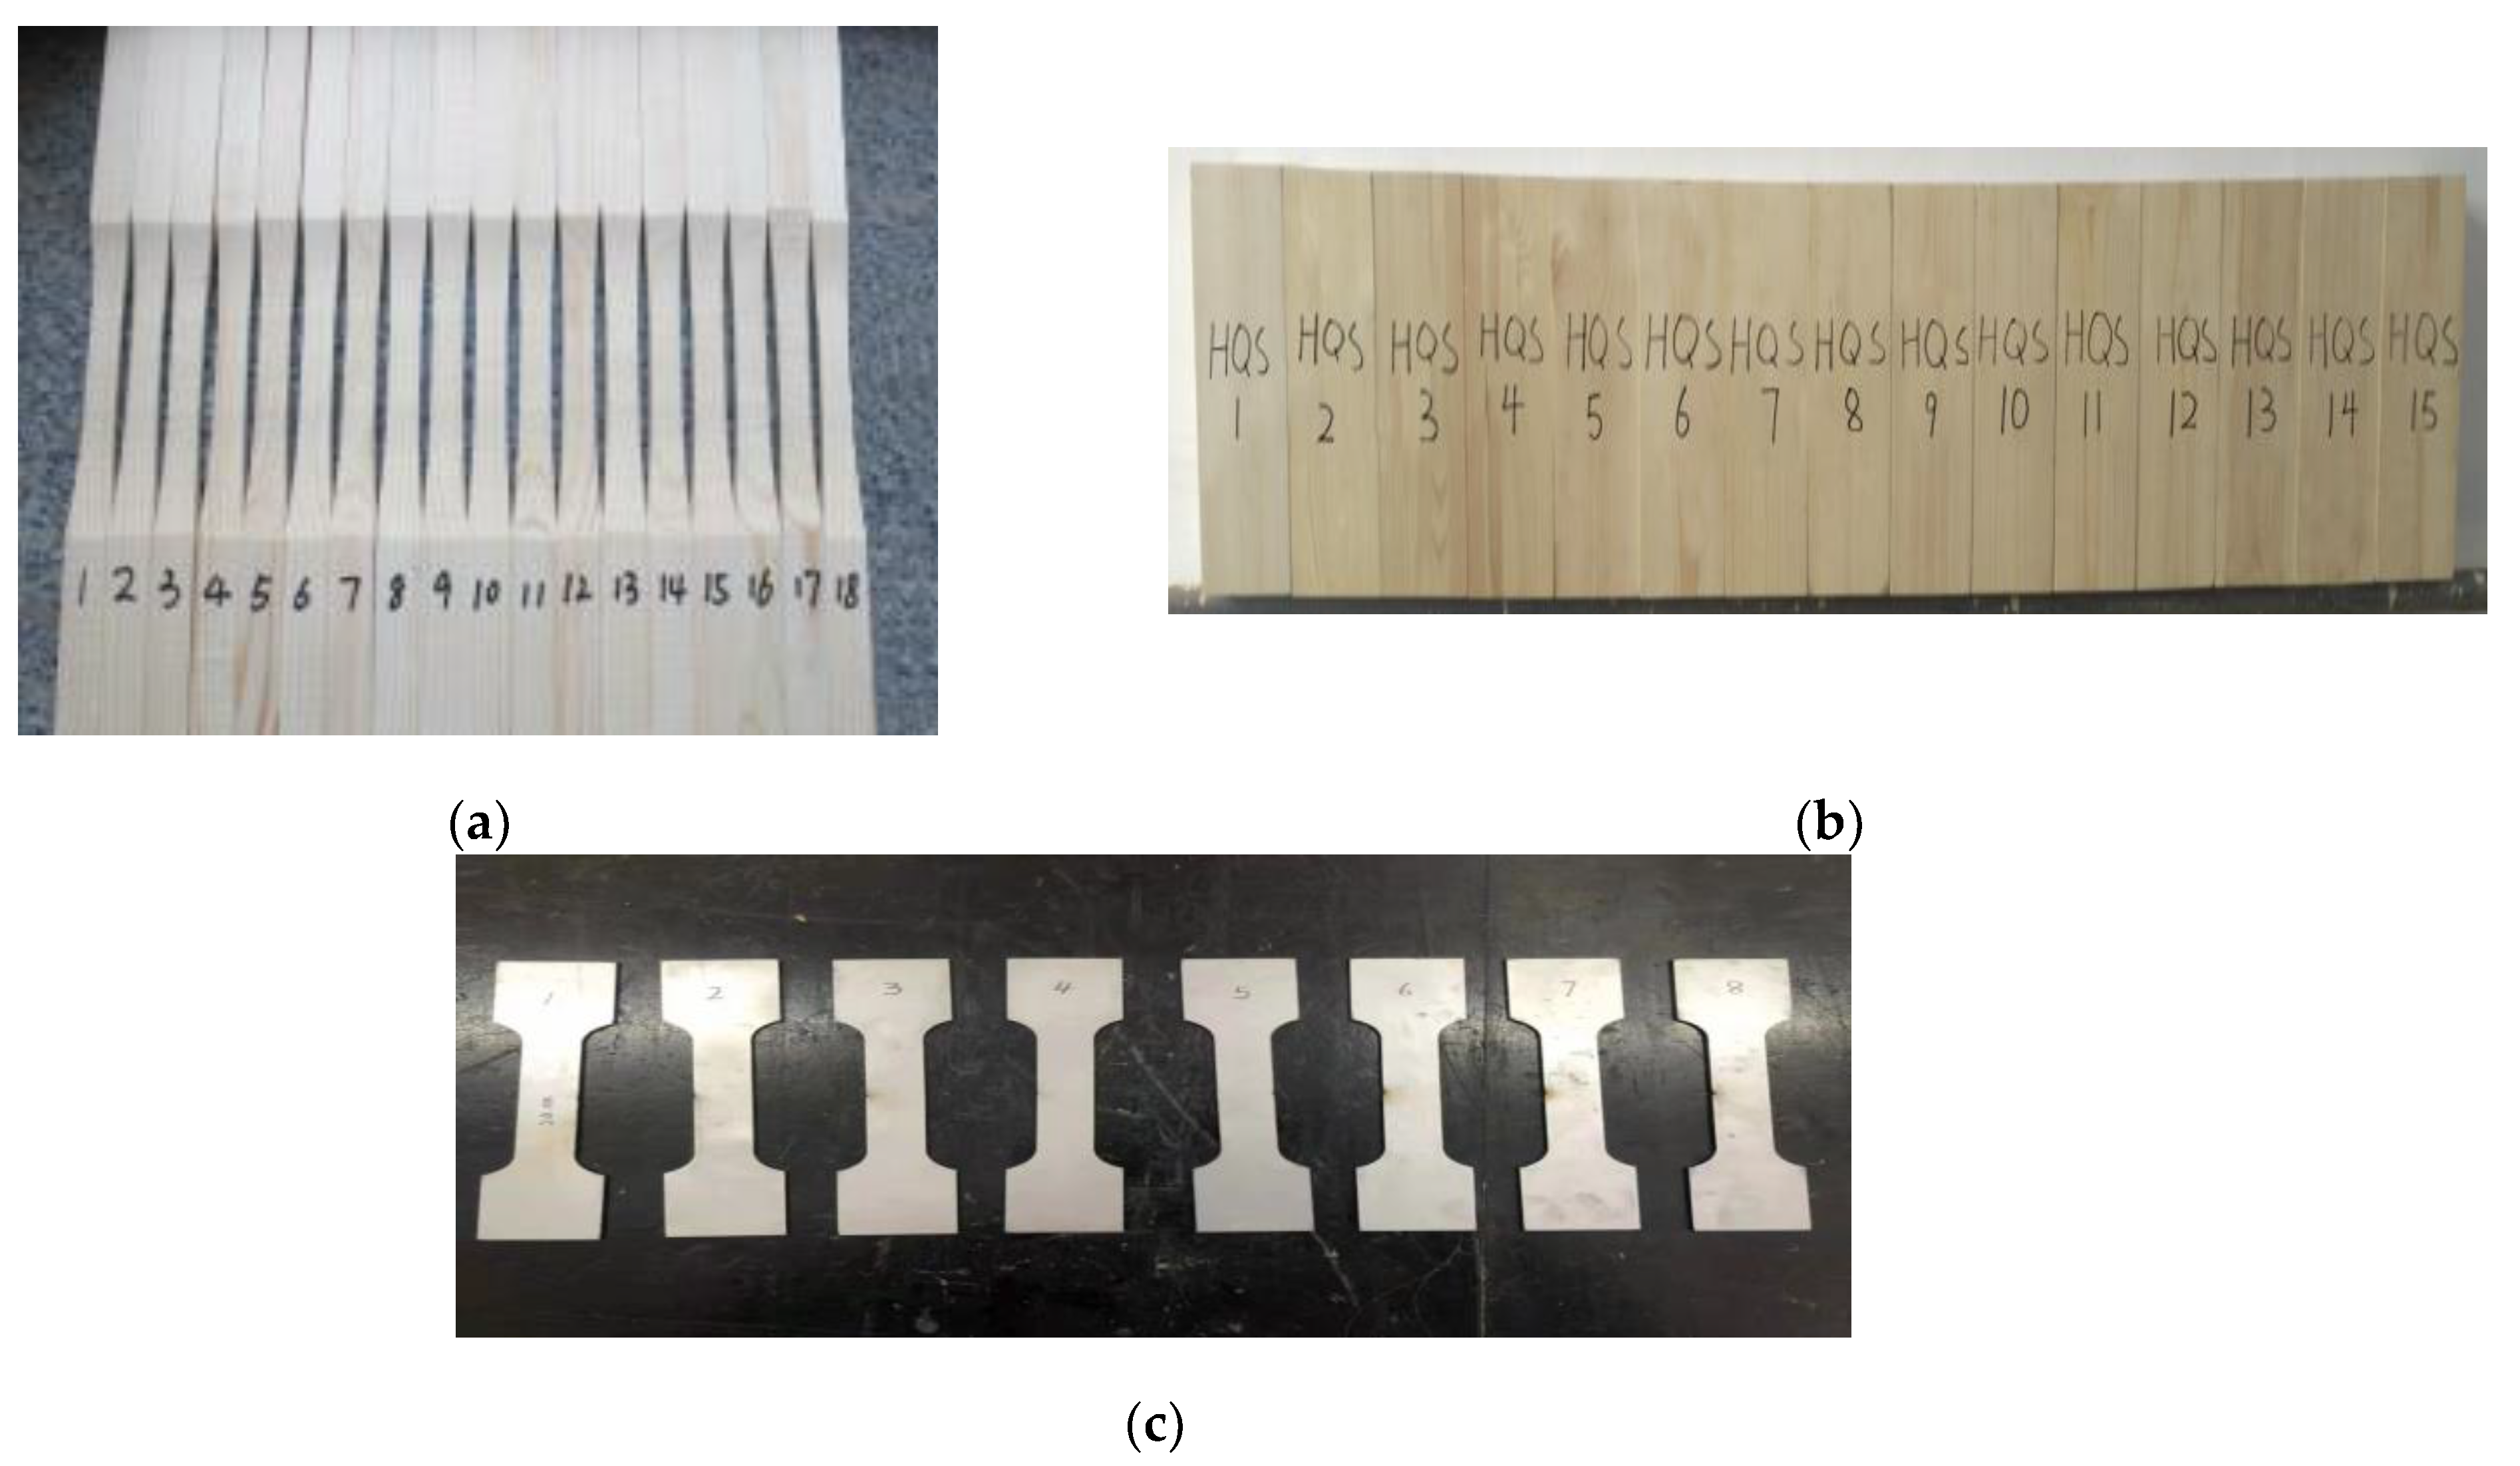
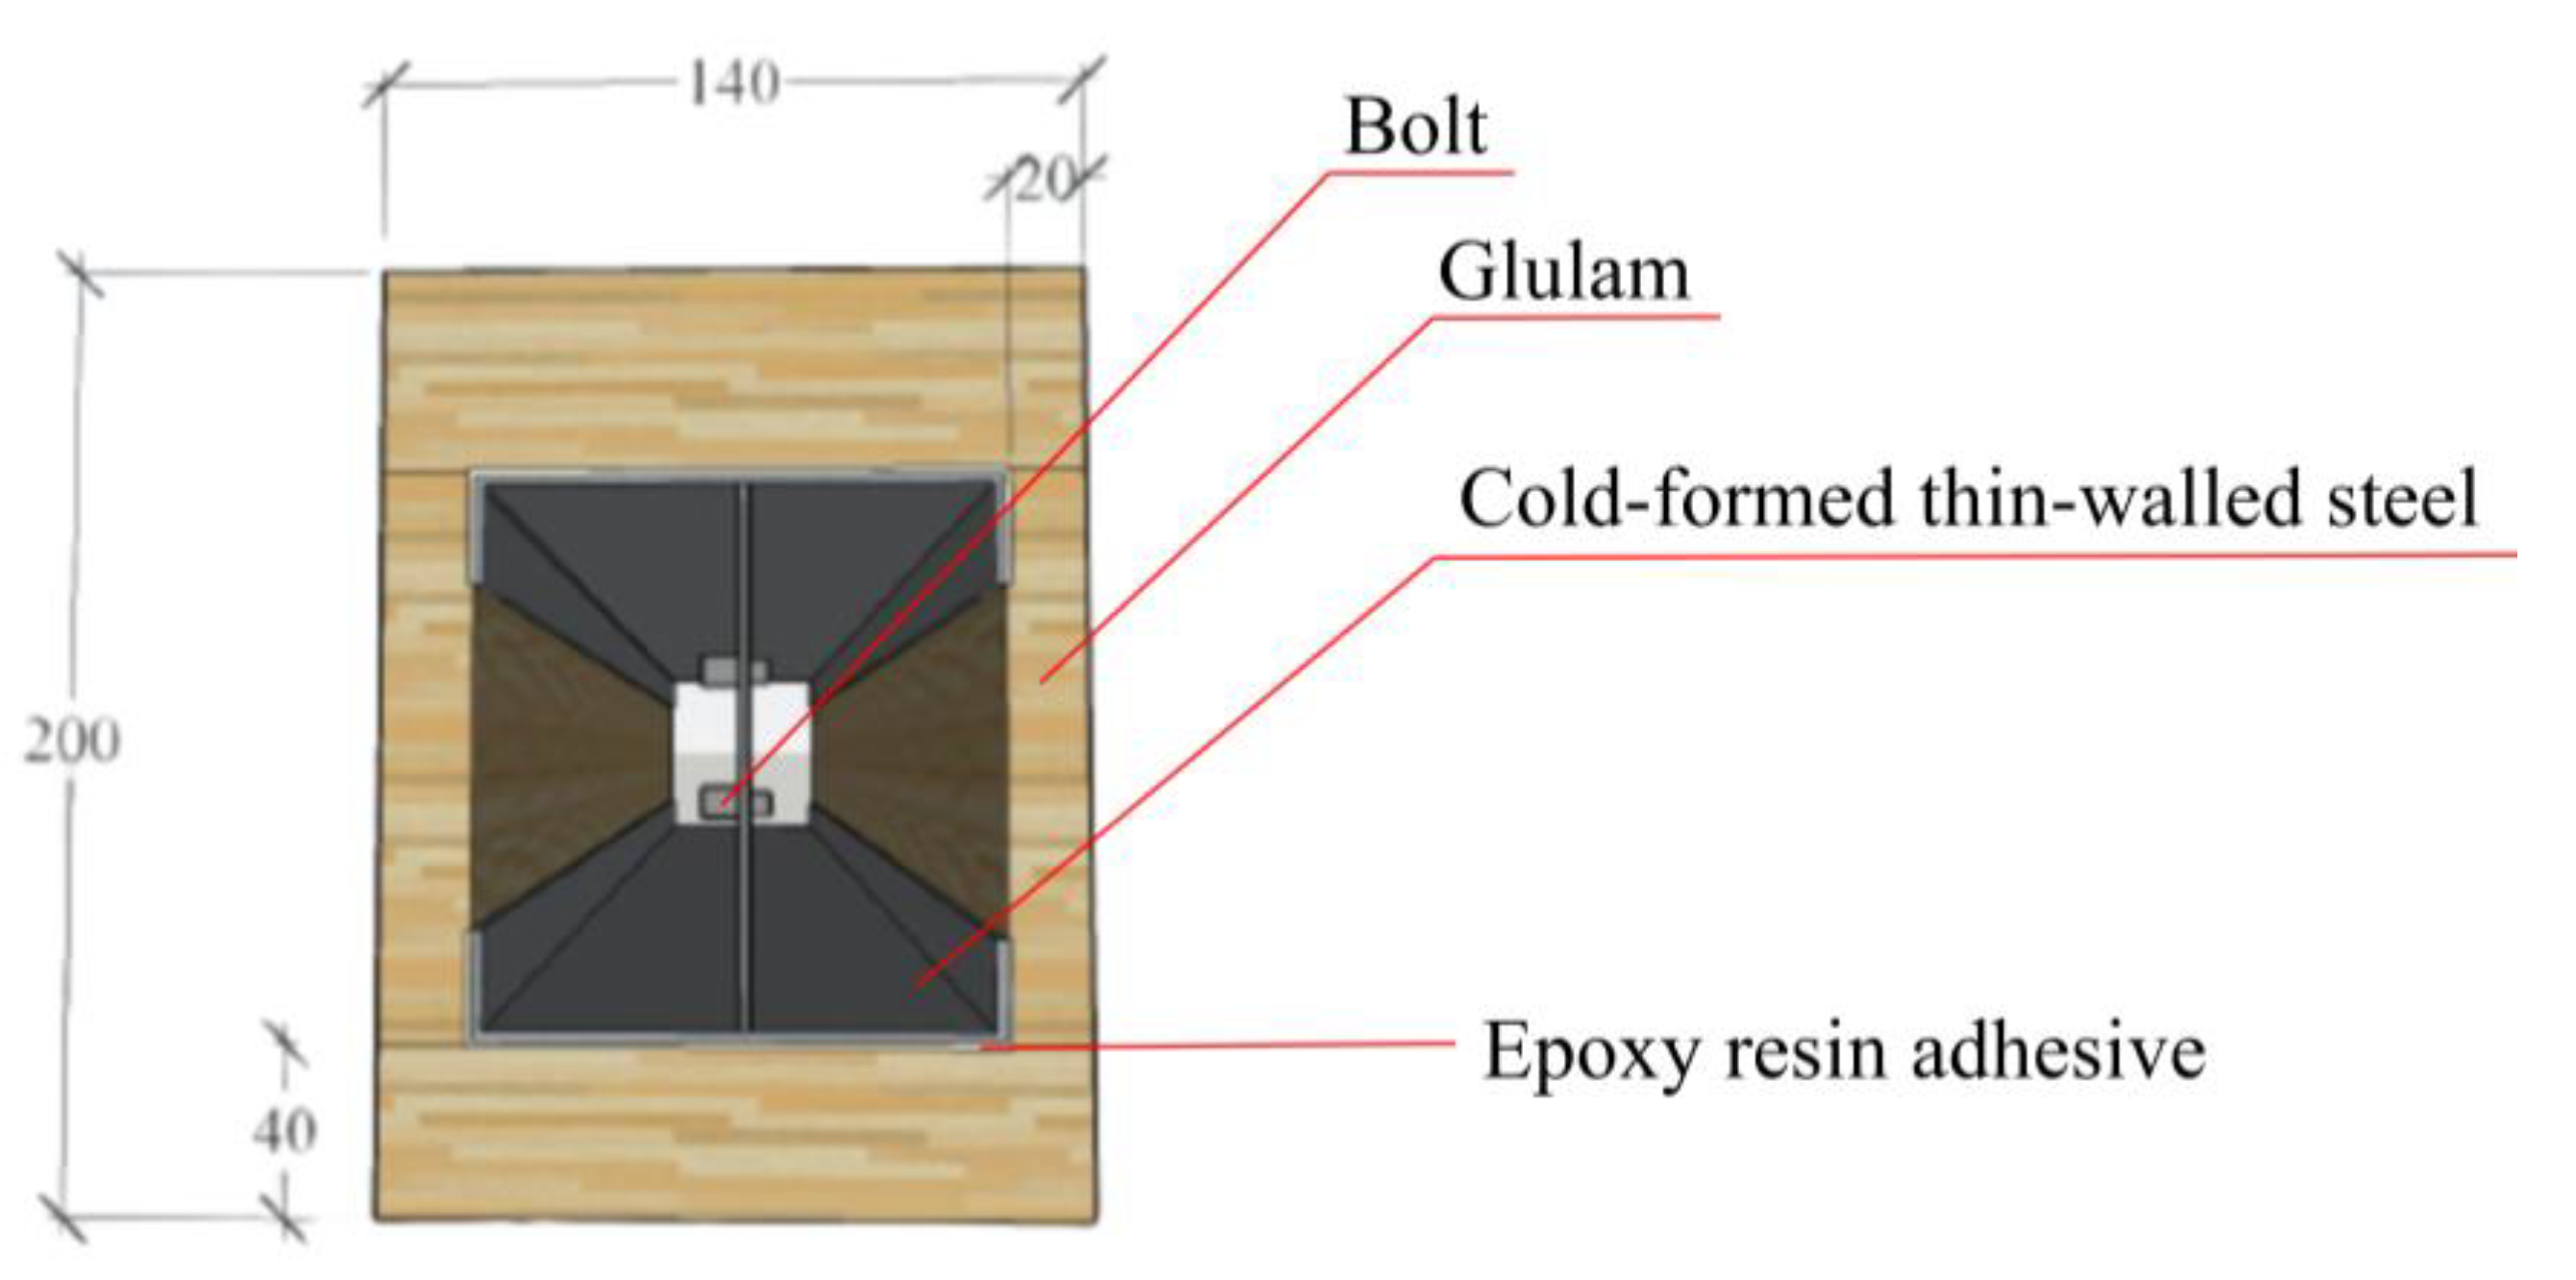
2.1. Materials and Methods

The moisture content of the Douglas fir used in the test was 12.4%, referring to “Standard for Test Methods of Timber Structures” [15], “Method of Testing in Tensile Strength Parallel to Grain of Wood” [16] and “Method of Testing in Compressive Strength Parallel to Grain of Wood” [17]. In this study, a smooth-grain tensile strength test and a smooth-grain compressive mechanical property test were carried out on glulam, while a tensile strength test was carried out on steel. The other materials which we used were provided by the manufacturer. The specimens used for the material mechanical property tests are shown in Figure 1. The mechanical property parameters of the glued wood are shown in Table 1, the mechanical property parameters of steel plate are shown in Table 2, the mechanical property parameters of the epoxy resin glue provided by the manufacturer are shown in Table 3, and the mechanical property parameters of the bolt provided by the manufacturer are shown in Table 4.
To determine the shear performance of the cold-formed thin-walled steel-glued beams under static loading, shear tests were performed on two composite beams numbered L-1 and L-2. The same tests were also conducted on two comparison beams, i.e., a steel beam SL-1and a pine beam PL-1 of the same size, to compare the shear capacity with the two composite beams. The mechanical properties of pine wood used in PL-1 are given in reference [18].
As shown in Figure 2, two pieces of cold-formed thin-walled C-beams were bolted back-to-back to form an “I”-shape, and the glulam boards were wrapped around the steel frame to form a fully enclosed box-shaped composite beam. The thicknesses of the glulam panels on the upper and lower flanges were 40 mm each, and the thicknesses of the lateral glued laminated wood panels were 20 mm each. The bolt diameters of the holes in the web of the “I”-shaped steel skeleton were 5 mm, the spacing between the adjacent holes was 300 mm, and the holes were arranged as shown in Figure 3. The length of the test beam was 2500 mm, and the lengths of the beams protruding out of the supports at both ends were 50 mm. All of the specific specimen parameters are shown in Table 5.

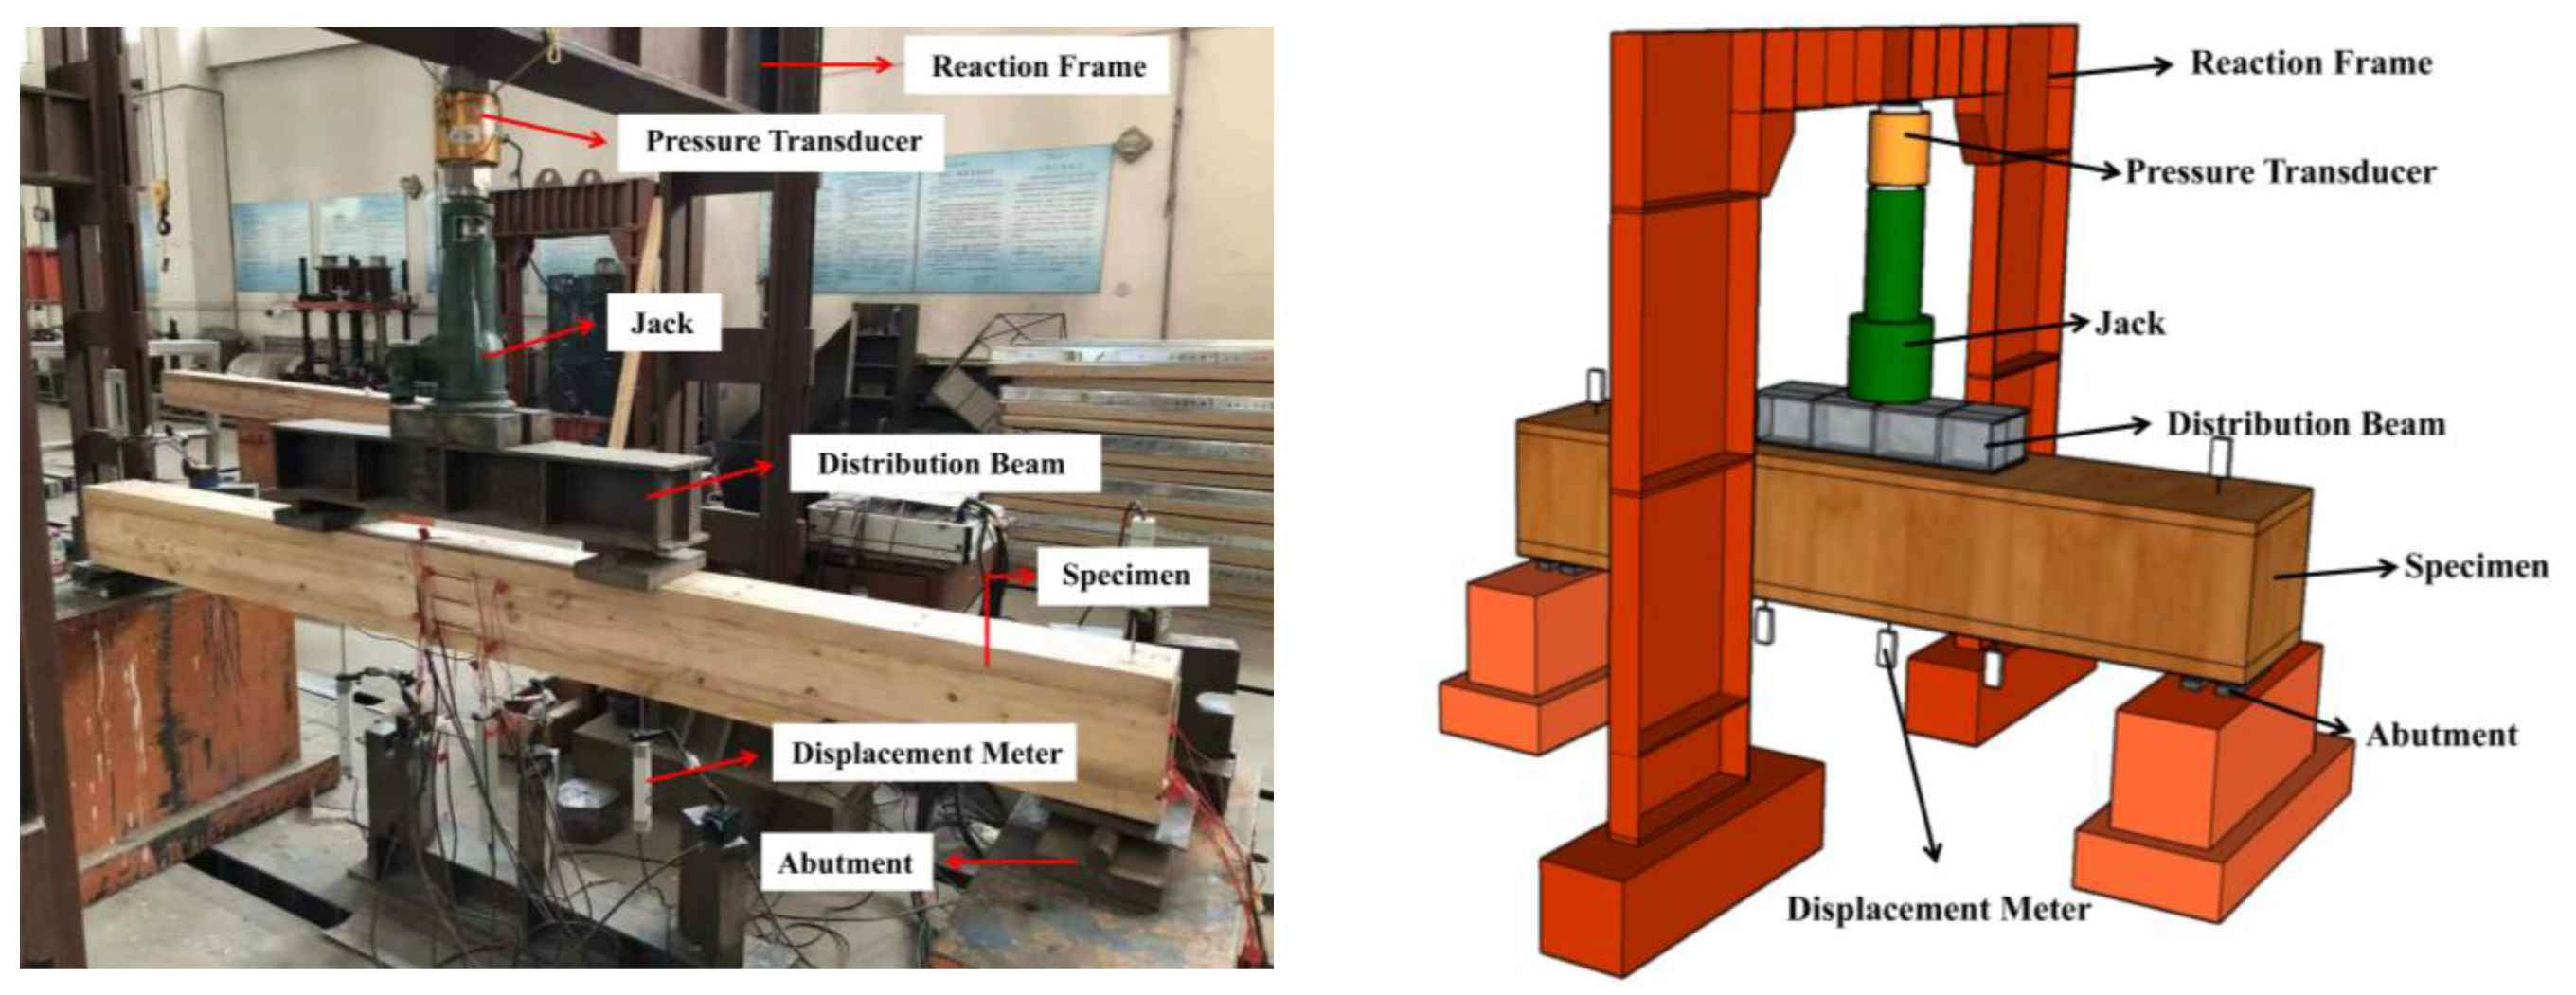
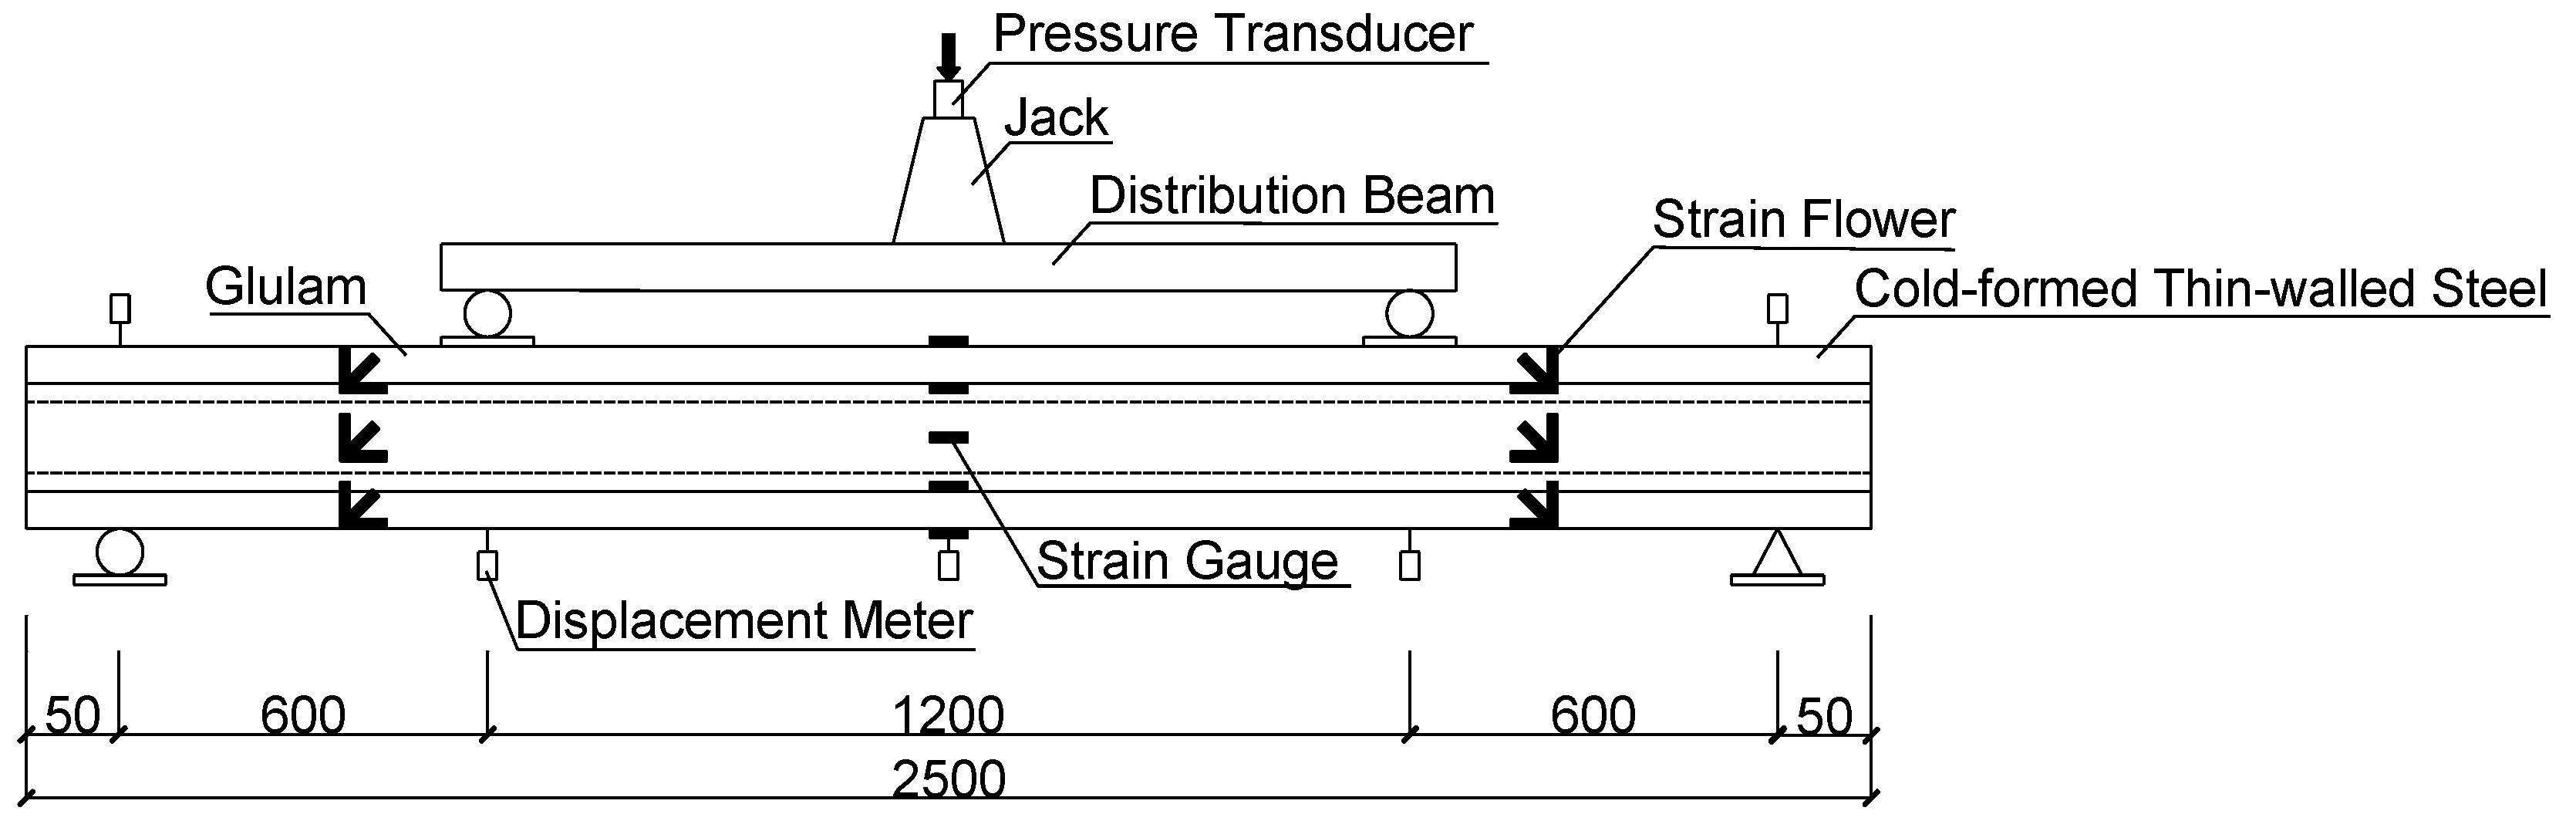
2.2. Loading Devices and Measurement Points

The test adopted monotonic static four-point grading loading with one end of the support as a fixed support and the other as a sliding support, and the distance between the two supports from the end of the beam was 50 mm. The mechanical jack was manually graded by a pressure transducer, jack, and distribution beam, and the loading device is shown in Figure 4. Displacement gauges were set in the span, below the loading point and above the support at the end of the beam. To measure the shear strain change in the glulam, strain gauges and displacement gauges were arranged as shown in Figure 5 and Figure 6.

3. Experimental Phenomena and Analysis
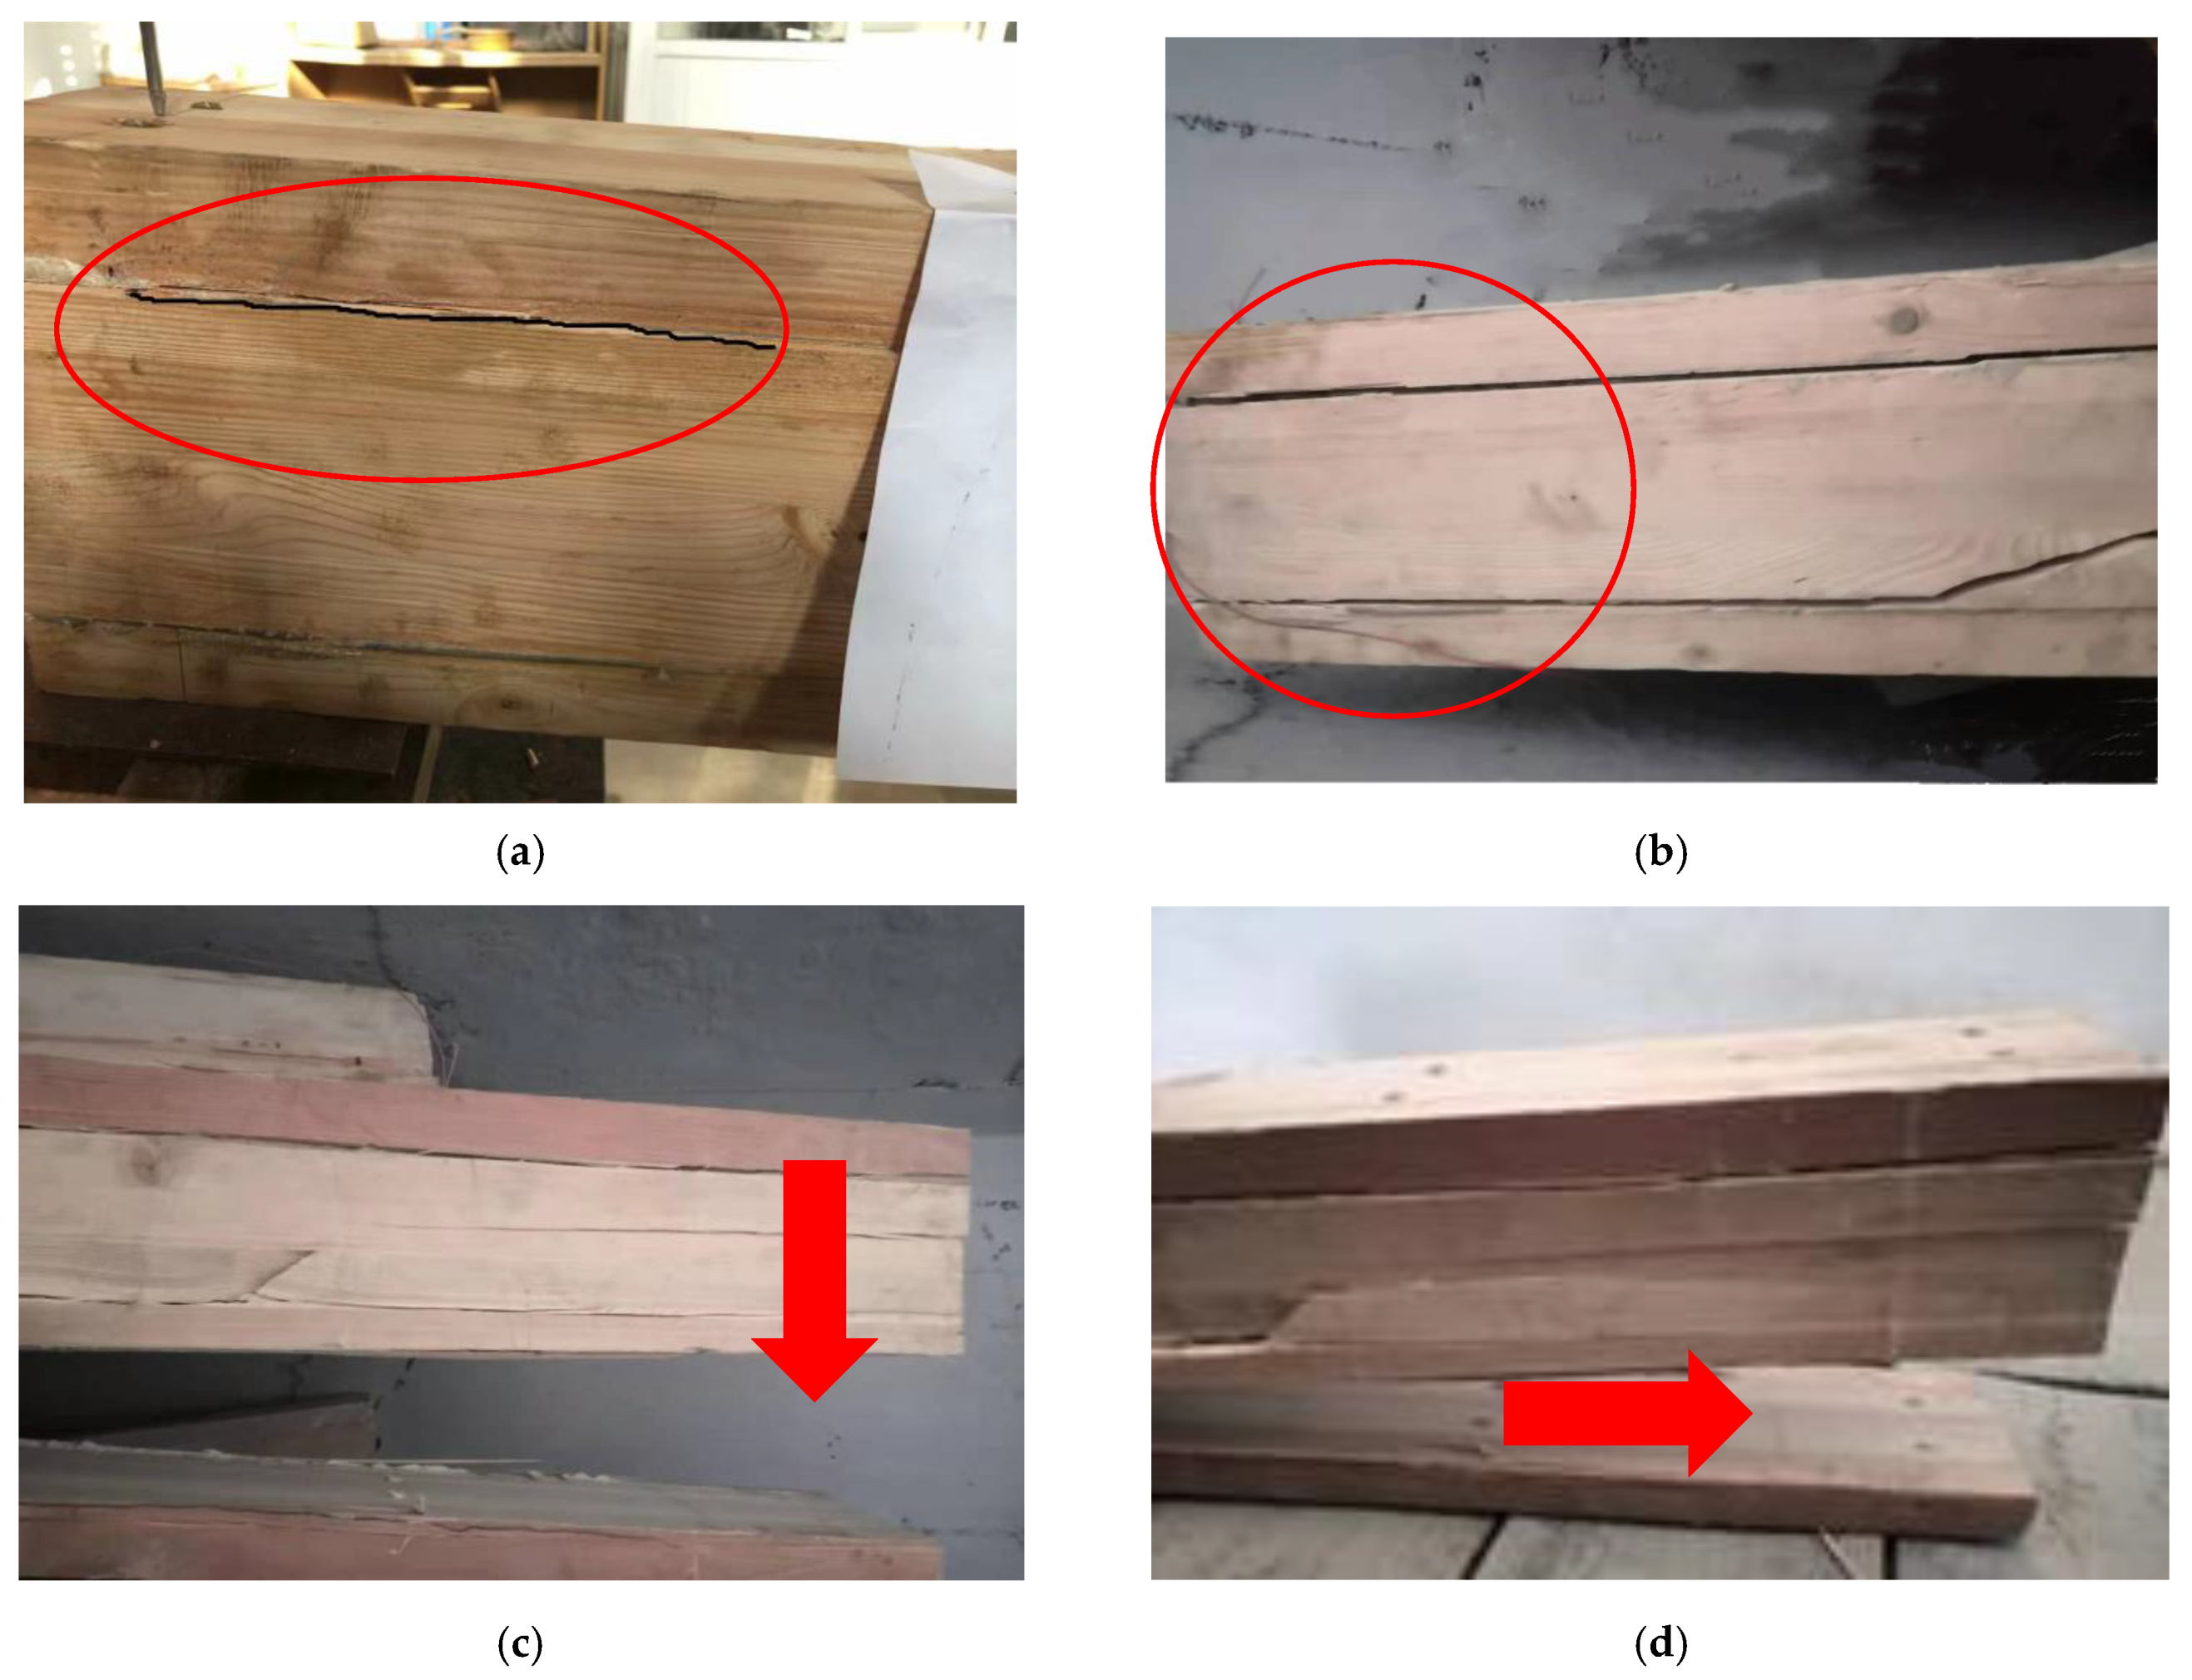
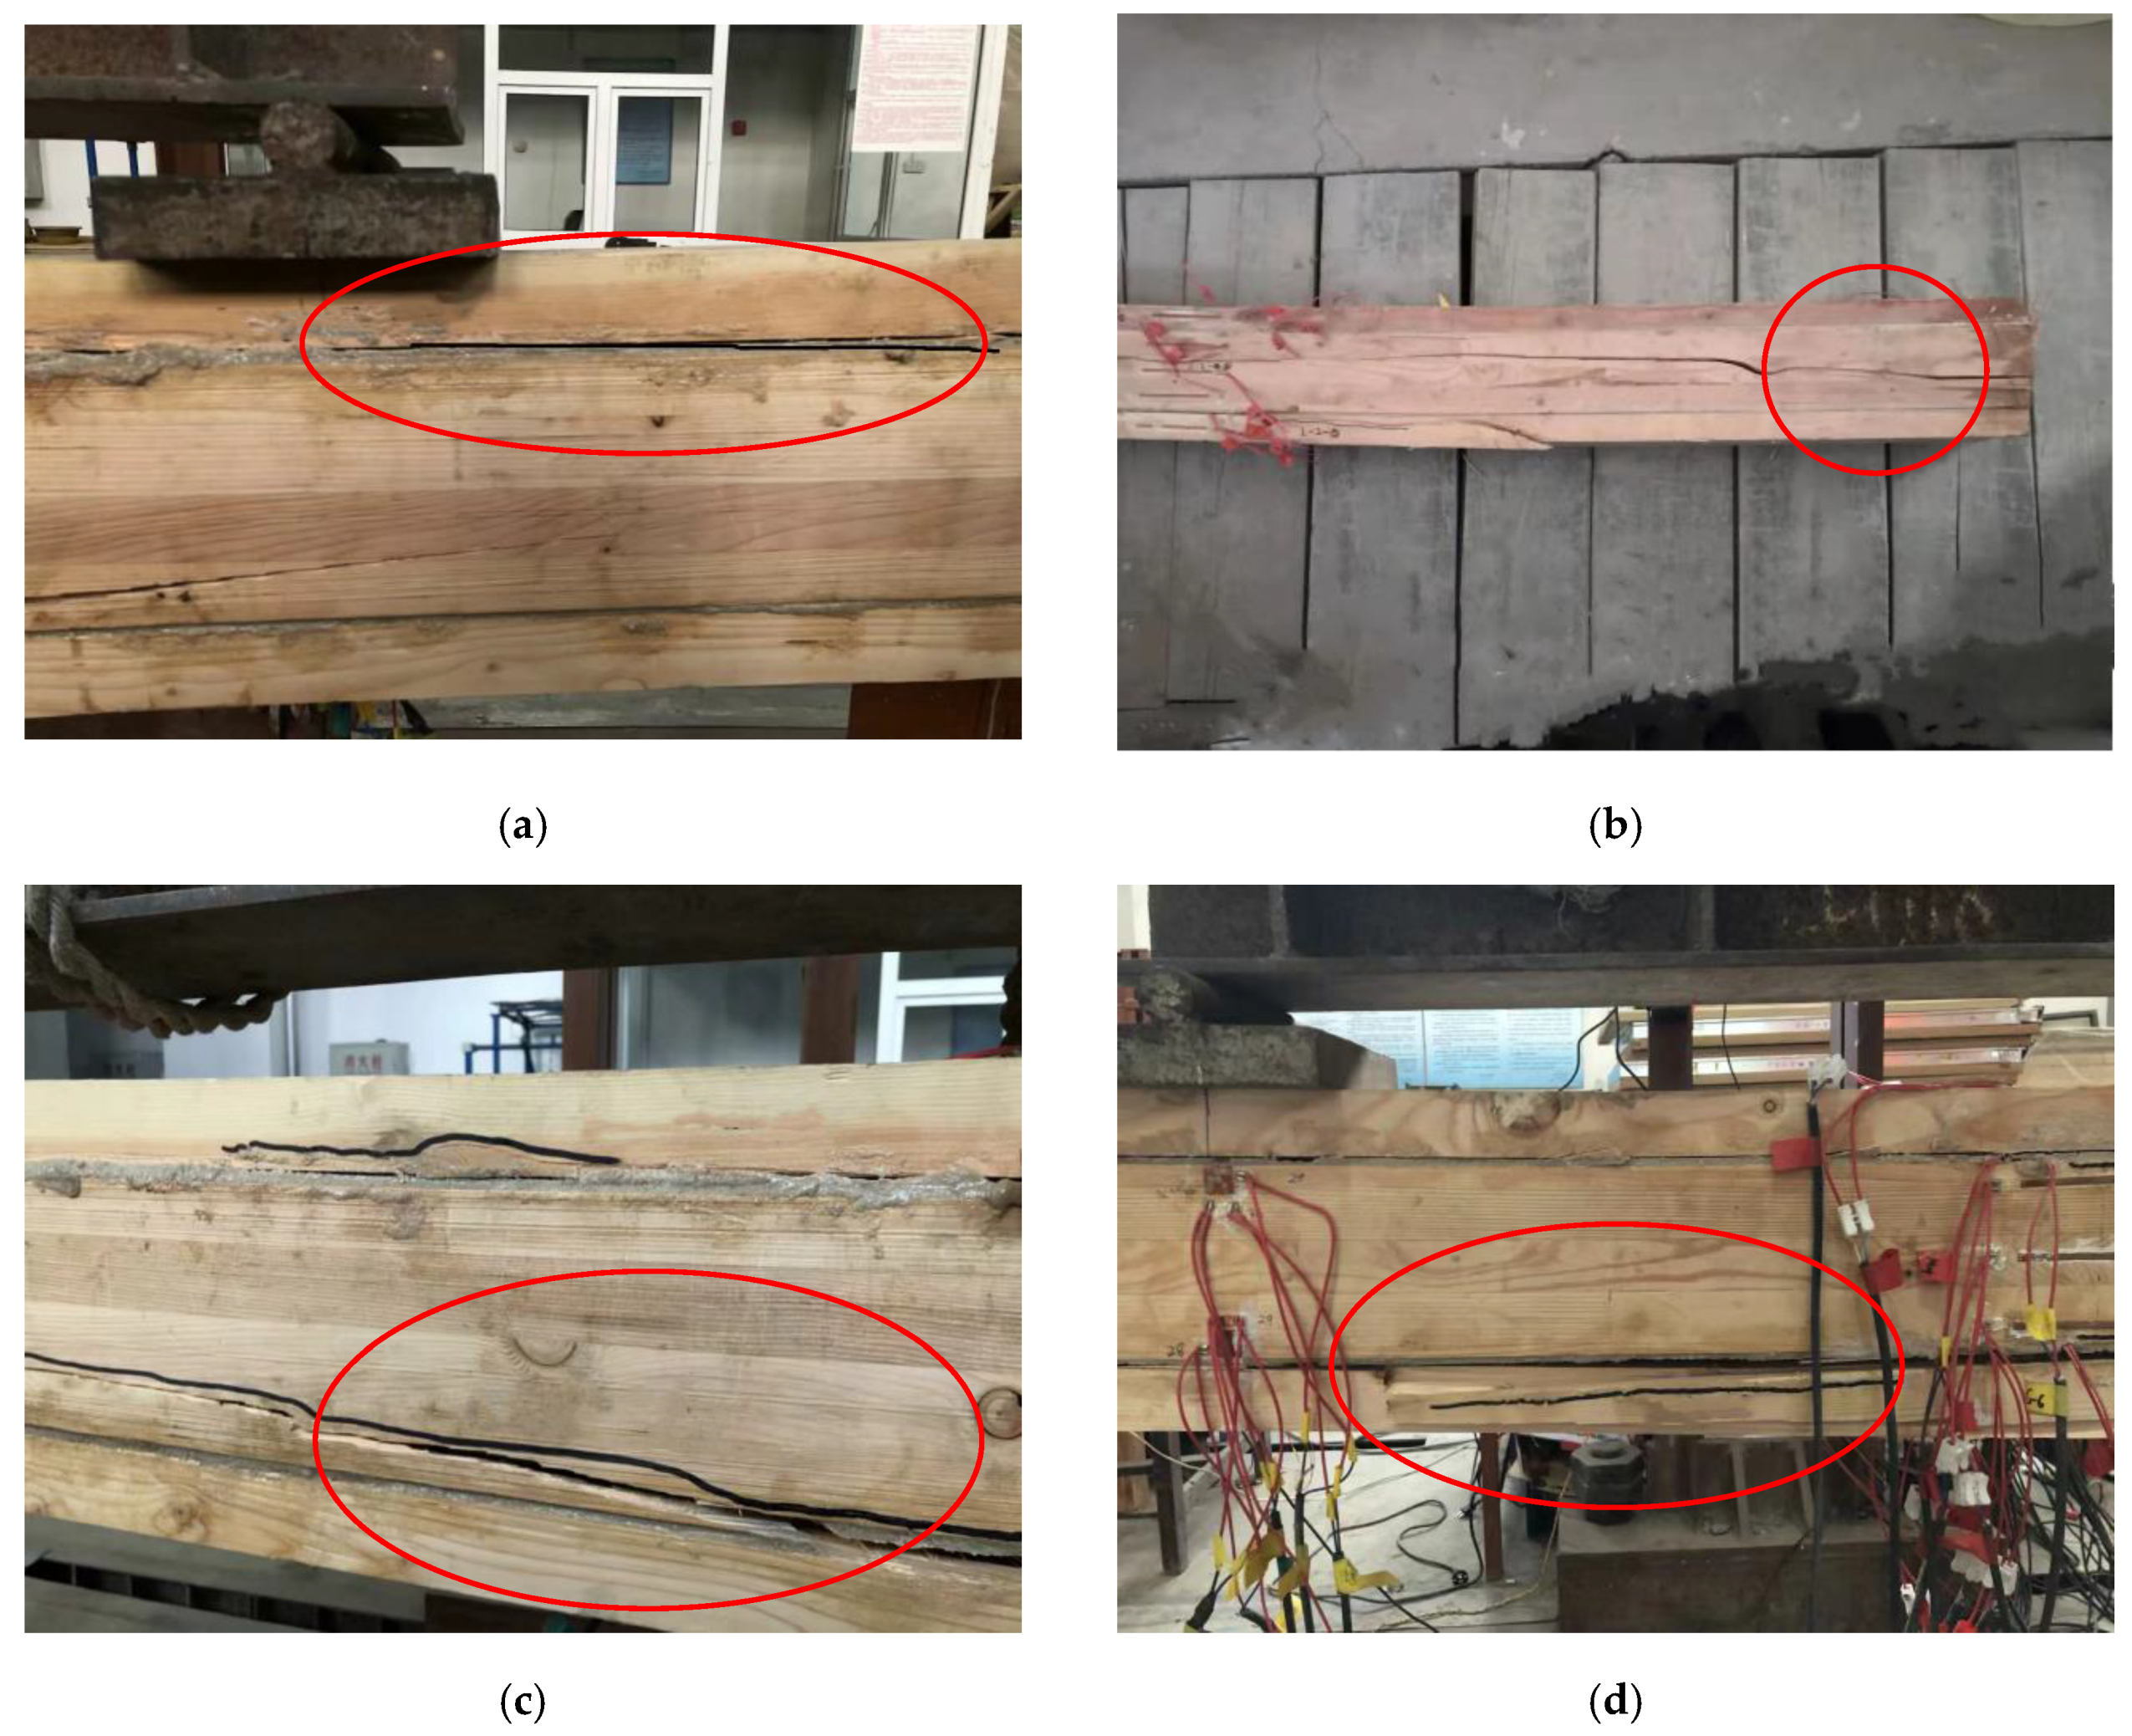
3.1. Failure Mode

Figure 7 shows the loading damage process of composite beam L-1. At the beginning of the loading process, the deflection in the span of the composite beam increased with the load, and then there was a gradual sound of degumming; when the load was 50kN, cracks appeared at the gluing site of the flange and the lateral gluing site, and the cracks expanded along the longitudinal direction as the load increasing. When the load reached 140 kN, the lateral laminated timber plate was located at 1/2 of the height of the beam, and a wooden star appeared. The load continued to be loaded, the crack expanded along the direction of the grain until a sudden loud sound was heard, and a shear split was produced between the lower flange plate and the rubber layer. When the load value reached 200 kN and continued loading, the deflection in the span increased, but the load value decreased, and the composite beam lost its bearing capacity.
Figure 8 shows the loading damage process of the composite beam L-2. When the load reached 65 kN, a slight debonding sound appeared in the shear span section, and the frequency of the debonding sound gradually increased as the loading continued. Firstly, cracks in the glue layer appeared near the loading point in the shear span area, while no obvious abnormalities were seen in the pure bending section. The longitudinal cracks unfolded along the fiber layer at the fracture until the end of the beam, and when the load reached 150 kN, the fracture in the tensile zone below the loading point, bending damage occurred, and the composite beam lost its load-carrying capacity. After unloading, the shear crack was not a longitudinal straight crack, but was oblique. Our analysis revealed that the crack development process encountered wood joints, which caused the crack trend to shift.

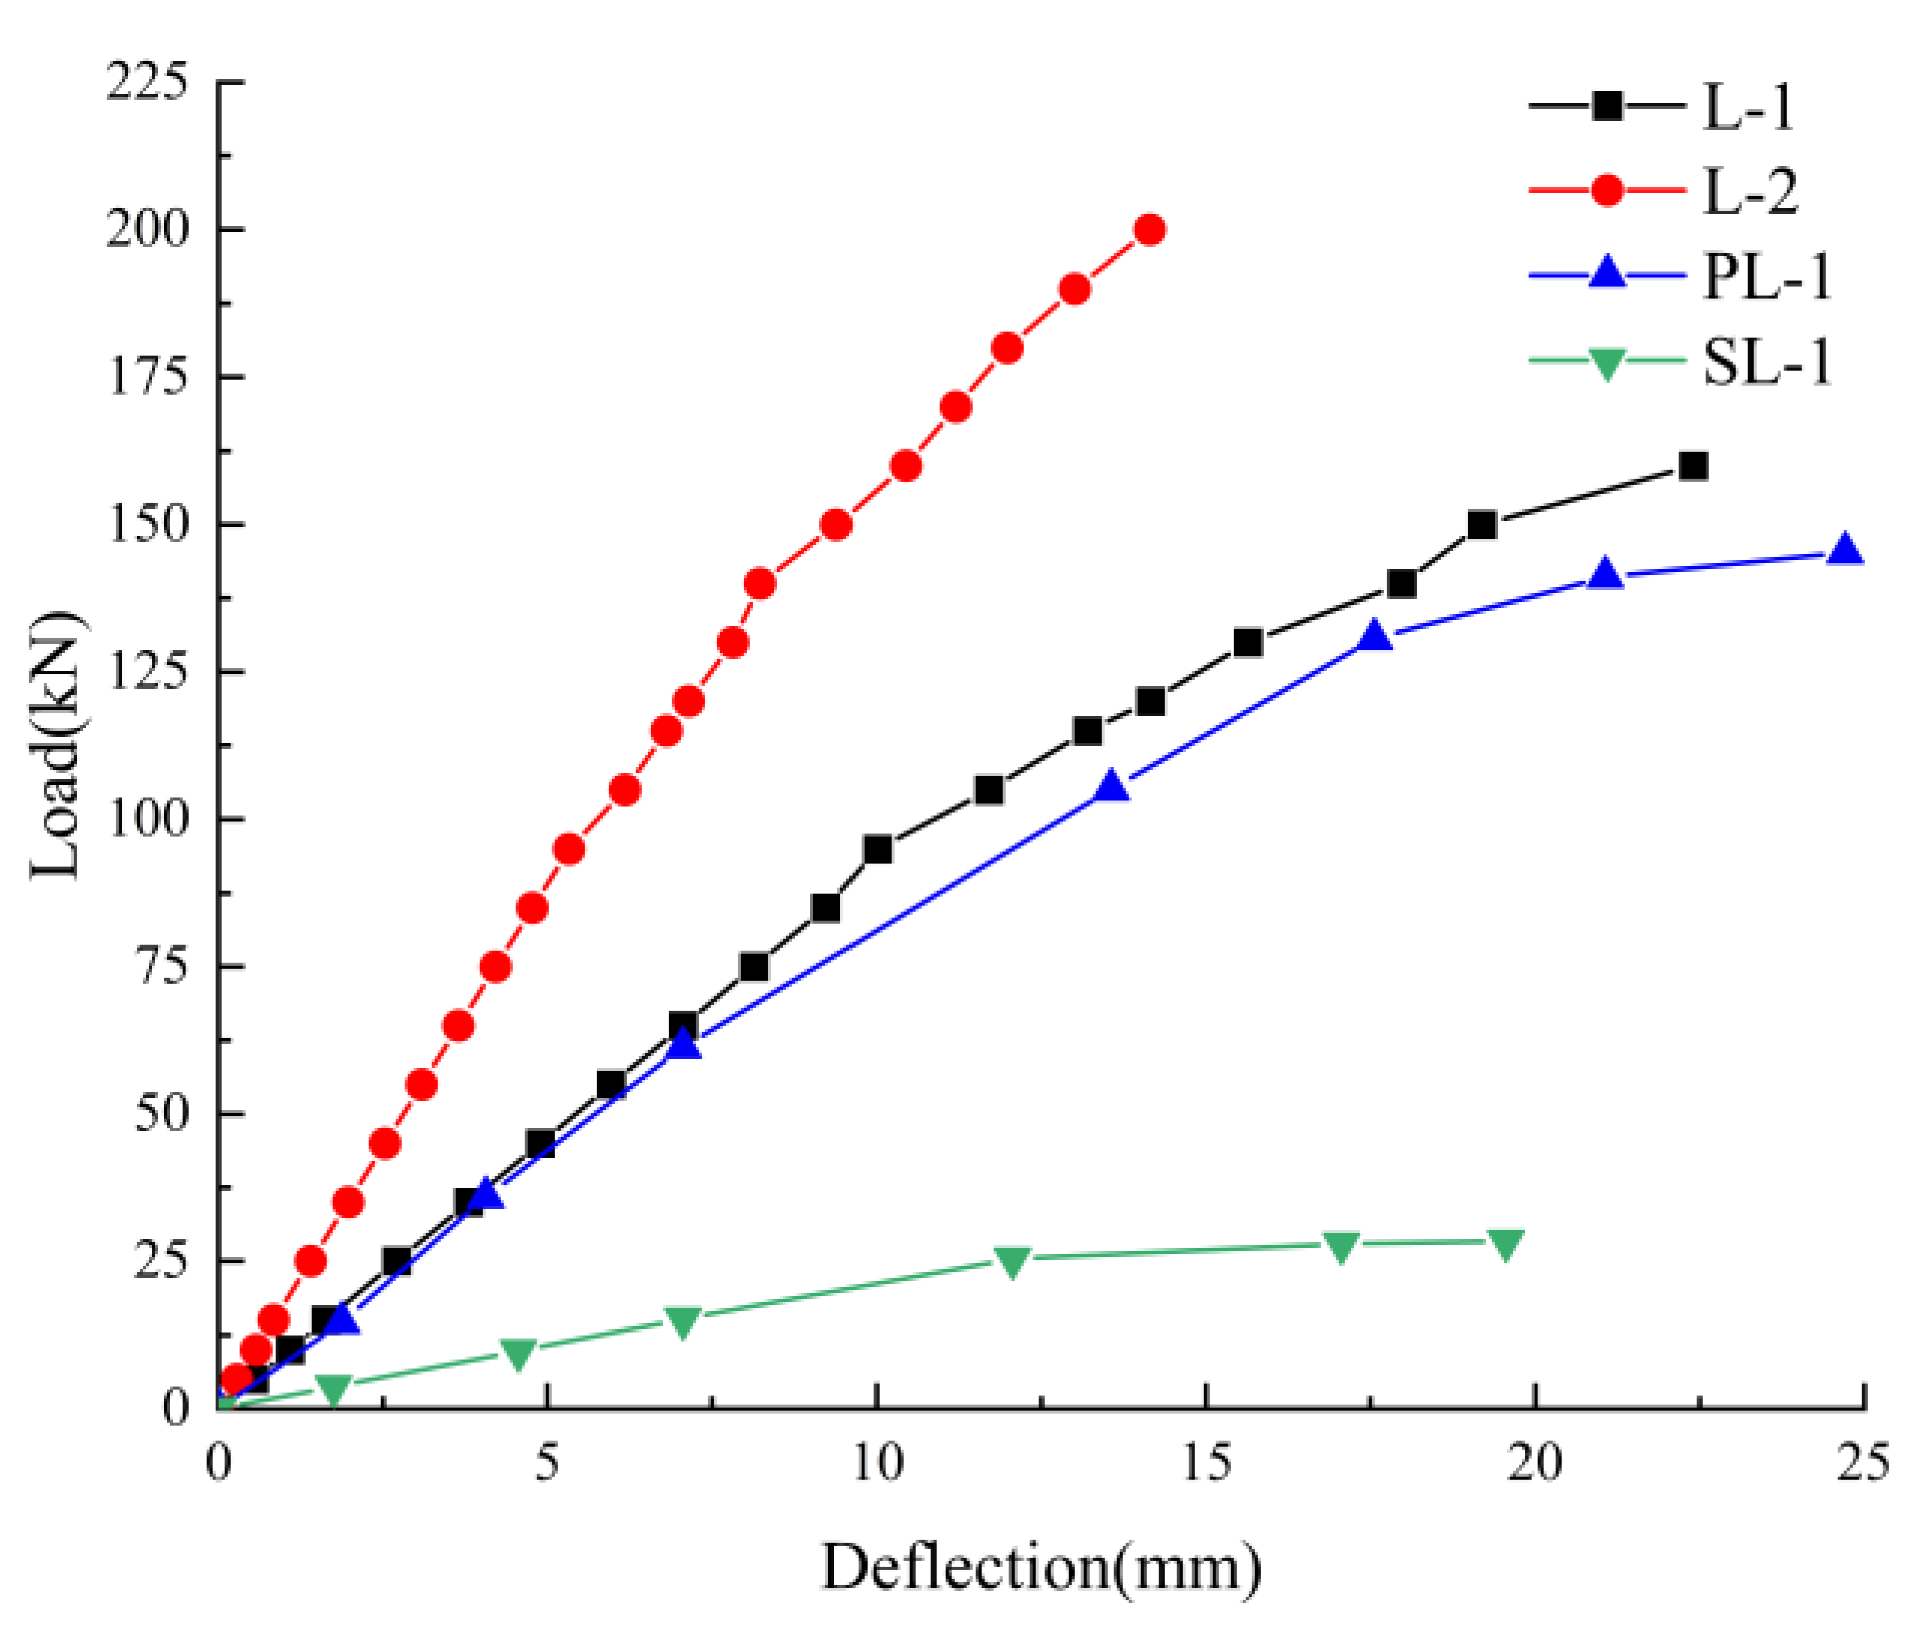
3.2. Load Deflection Curve Analysis

The load deflection curve of the composite beams is shown in Figure 9. Figure 9 shows that the specimen underwent elastic, elastic–plastic, and plastic failure stages during loading. In the elastic phase, from the beginning of the loading to 1/2 of the ultimate load value, the span deflection of the composite beam increased linearly with the increase in load. The cold-formed thin-walled steel and glulam in the combined beam showed good overall working performances, and were able to work together. When the composite beam entered the elastic–plastic stage, with the increase in load value, the load midspan deflection curve gradually deviated from the straight line and no longer showed a linear change. The stiffness of the composite beam gradually decreased, and the deflection grew faster. When the ultimate bearing capacity was reached, the bearing capacity decreased due to the gradual increase in cracks in the glulam and the fracture of the glued layer, but at this time, the member continued to carry the load and continued to deform, meaning that the composite beam had good elasticity. When the shear span ratio of the composite beam was 2, the maximum bearing capacity of L-1 was 9.2% higher than that of PL-1, and 4.6 times higher than that of SL-1 with external unbonded glulam.

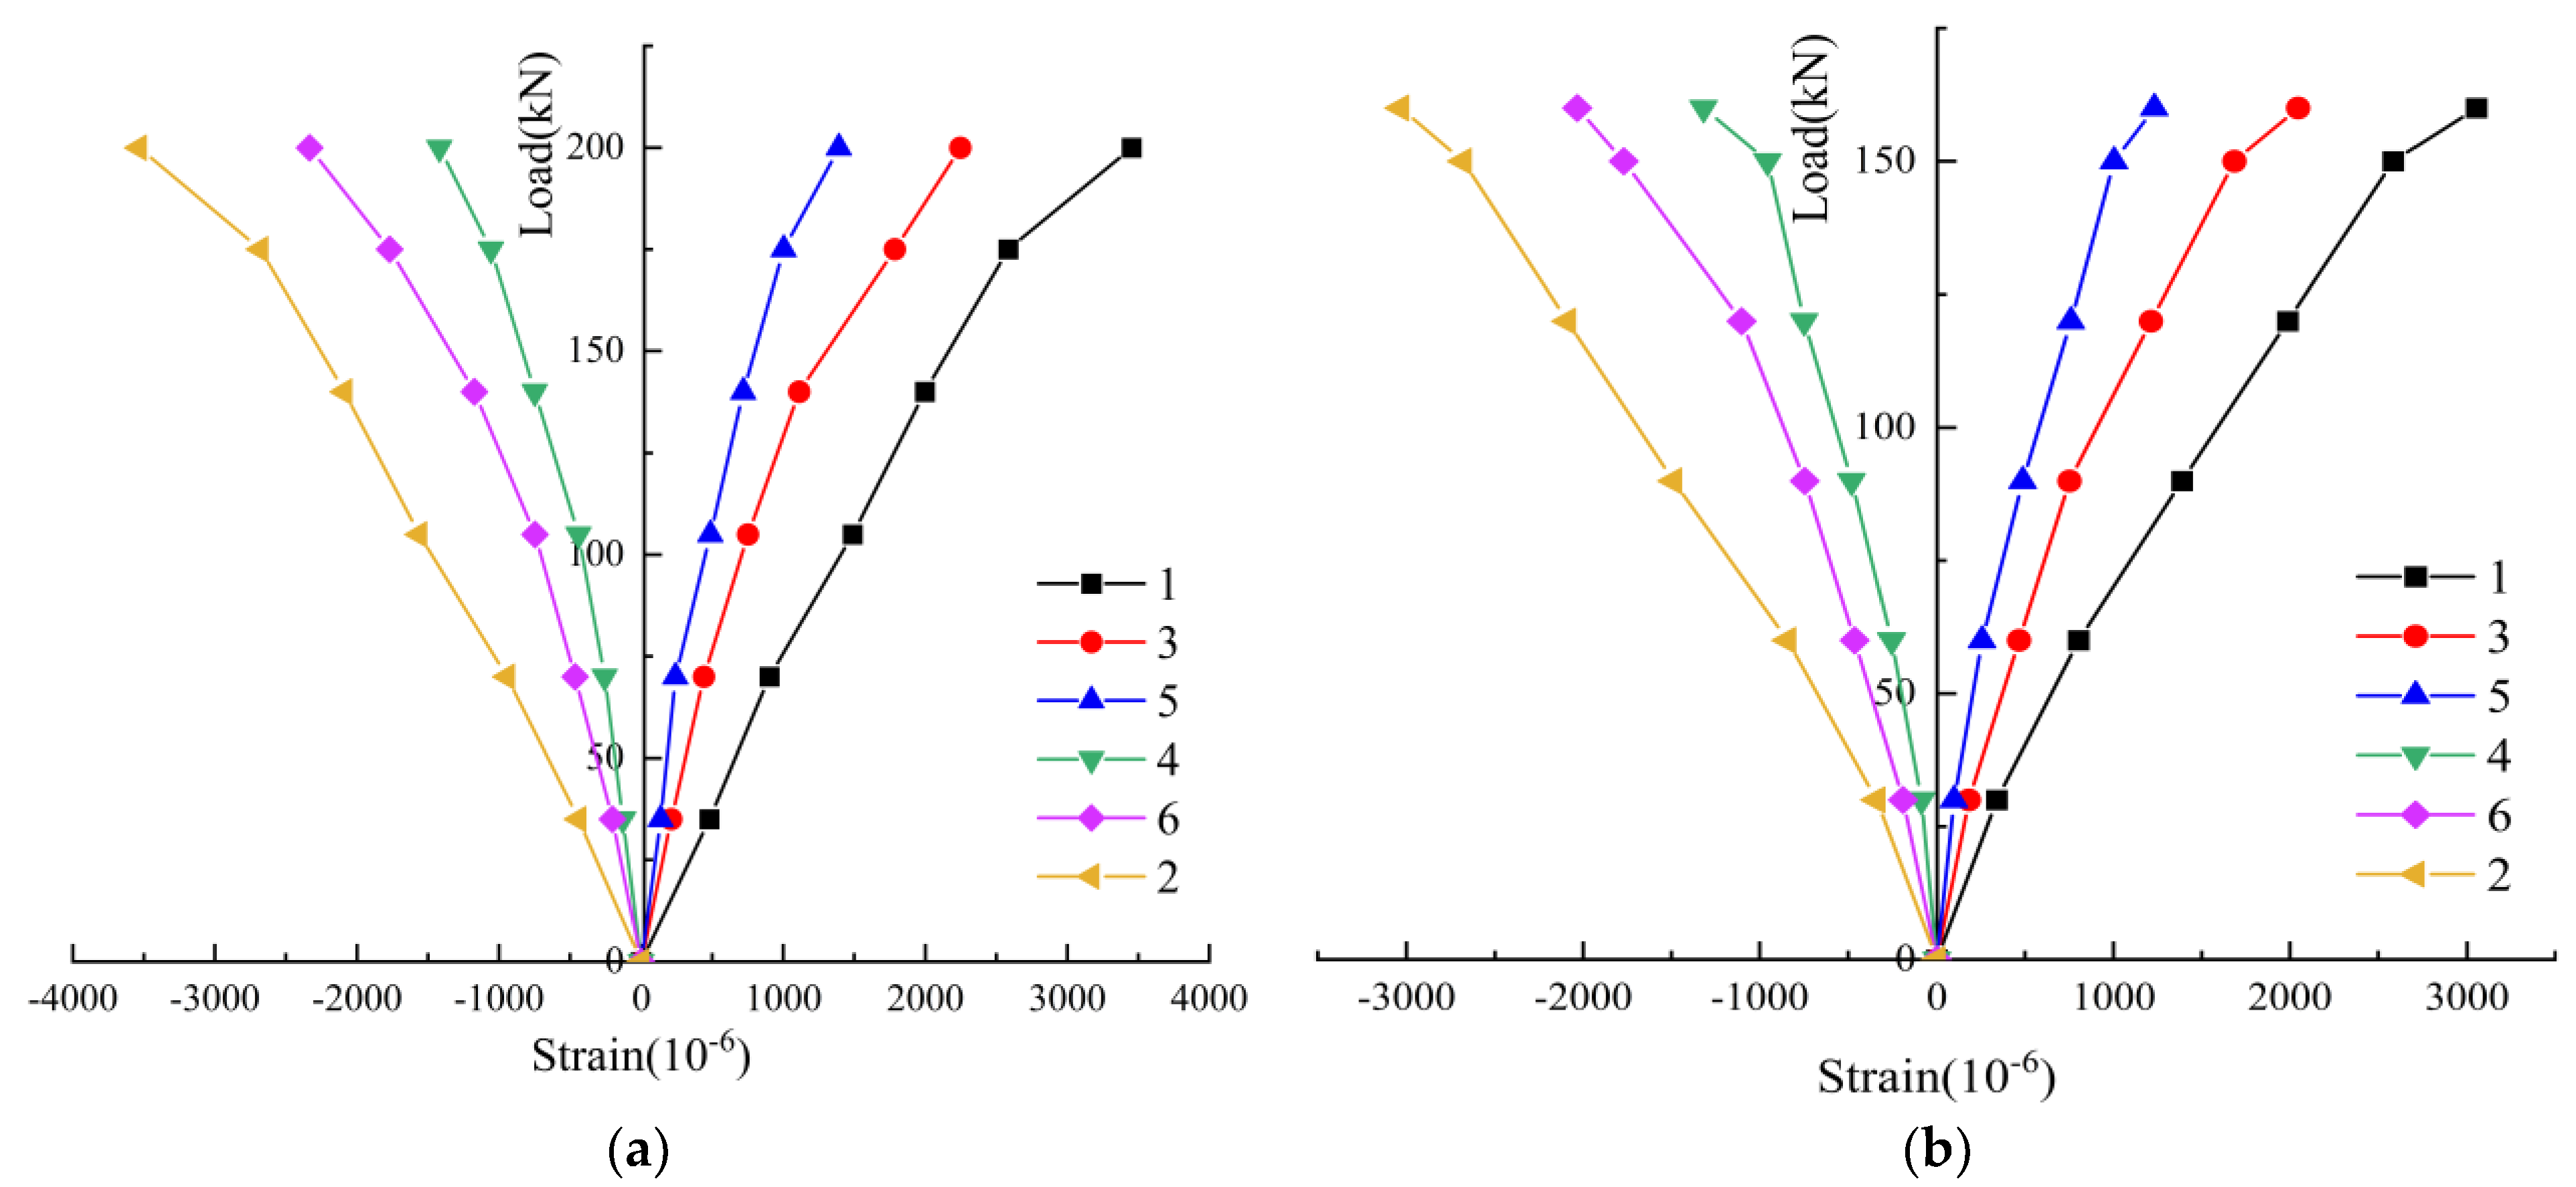
3.3. Load–Strain Curve Analysis

Figure 10 shows the load–strain curves of the L-1 and L-2 composite beams. The strain changed linearly with the increase in load. When the composite beam entered the plastic stage, the curve tended to shift, but the two sides of the curve were still close to a symmetrical distribution, indicating that the glulam and steel can deform synergistically during the stress process.

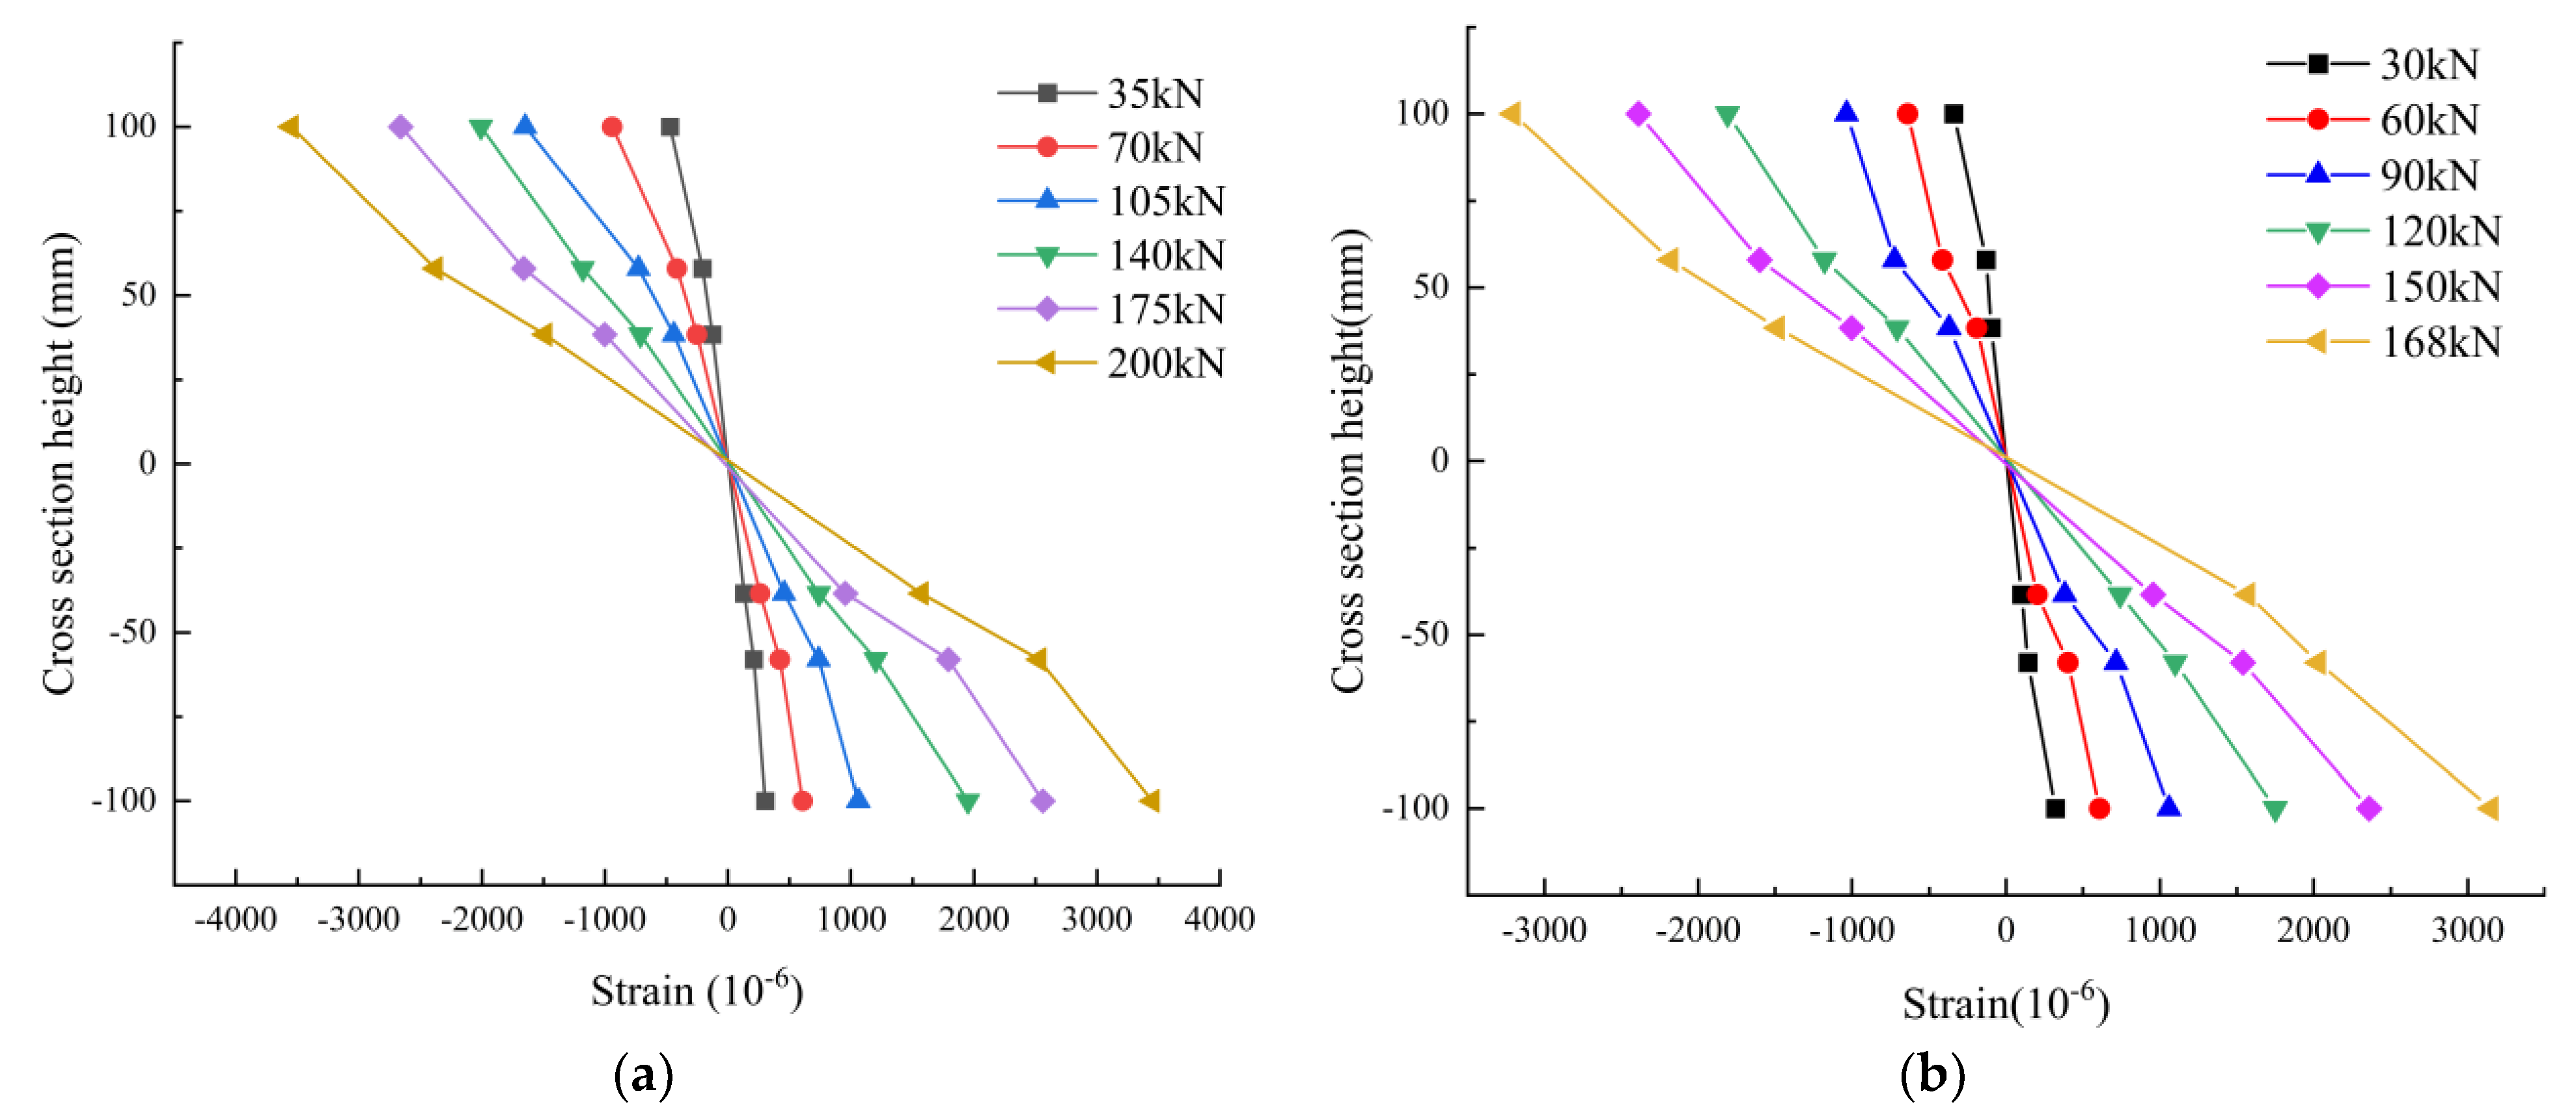
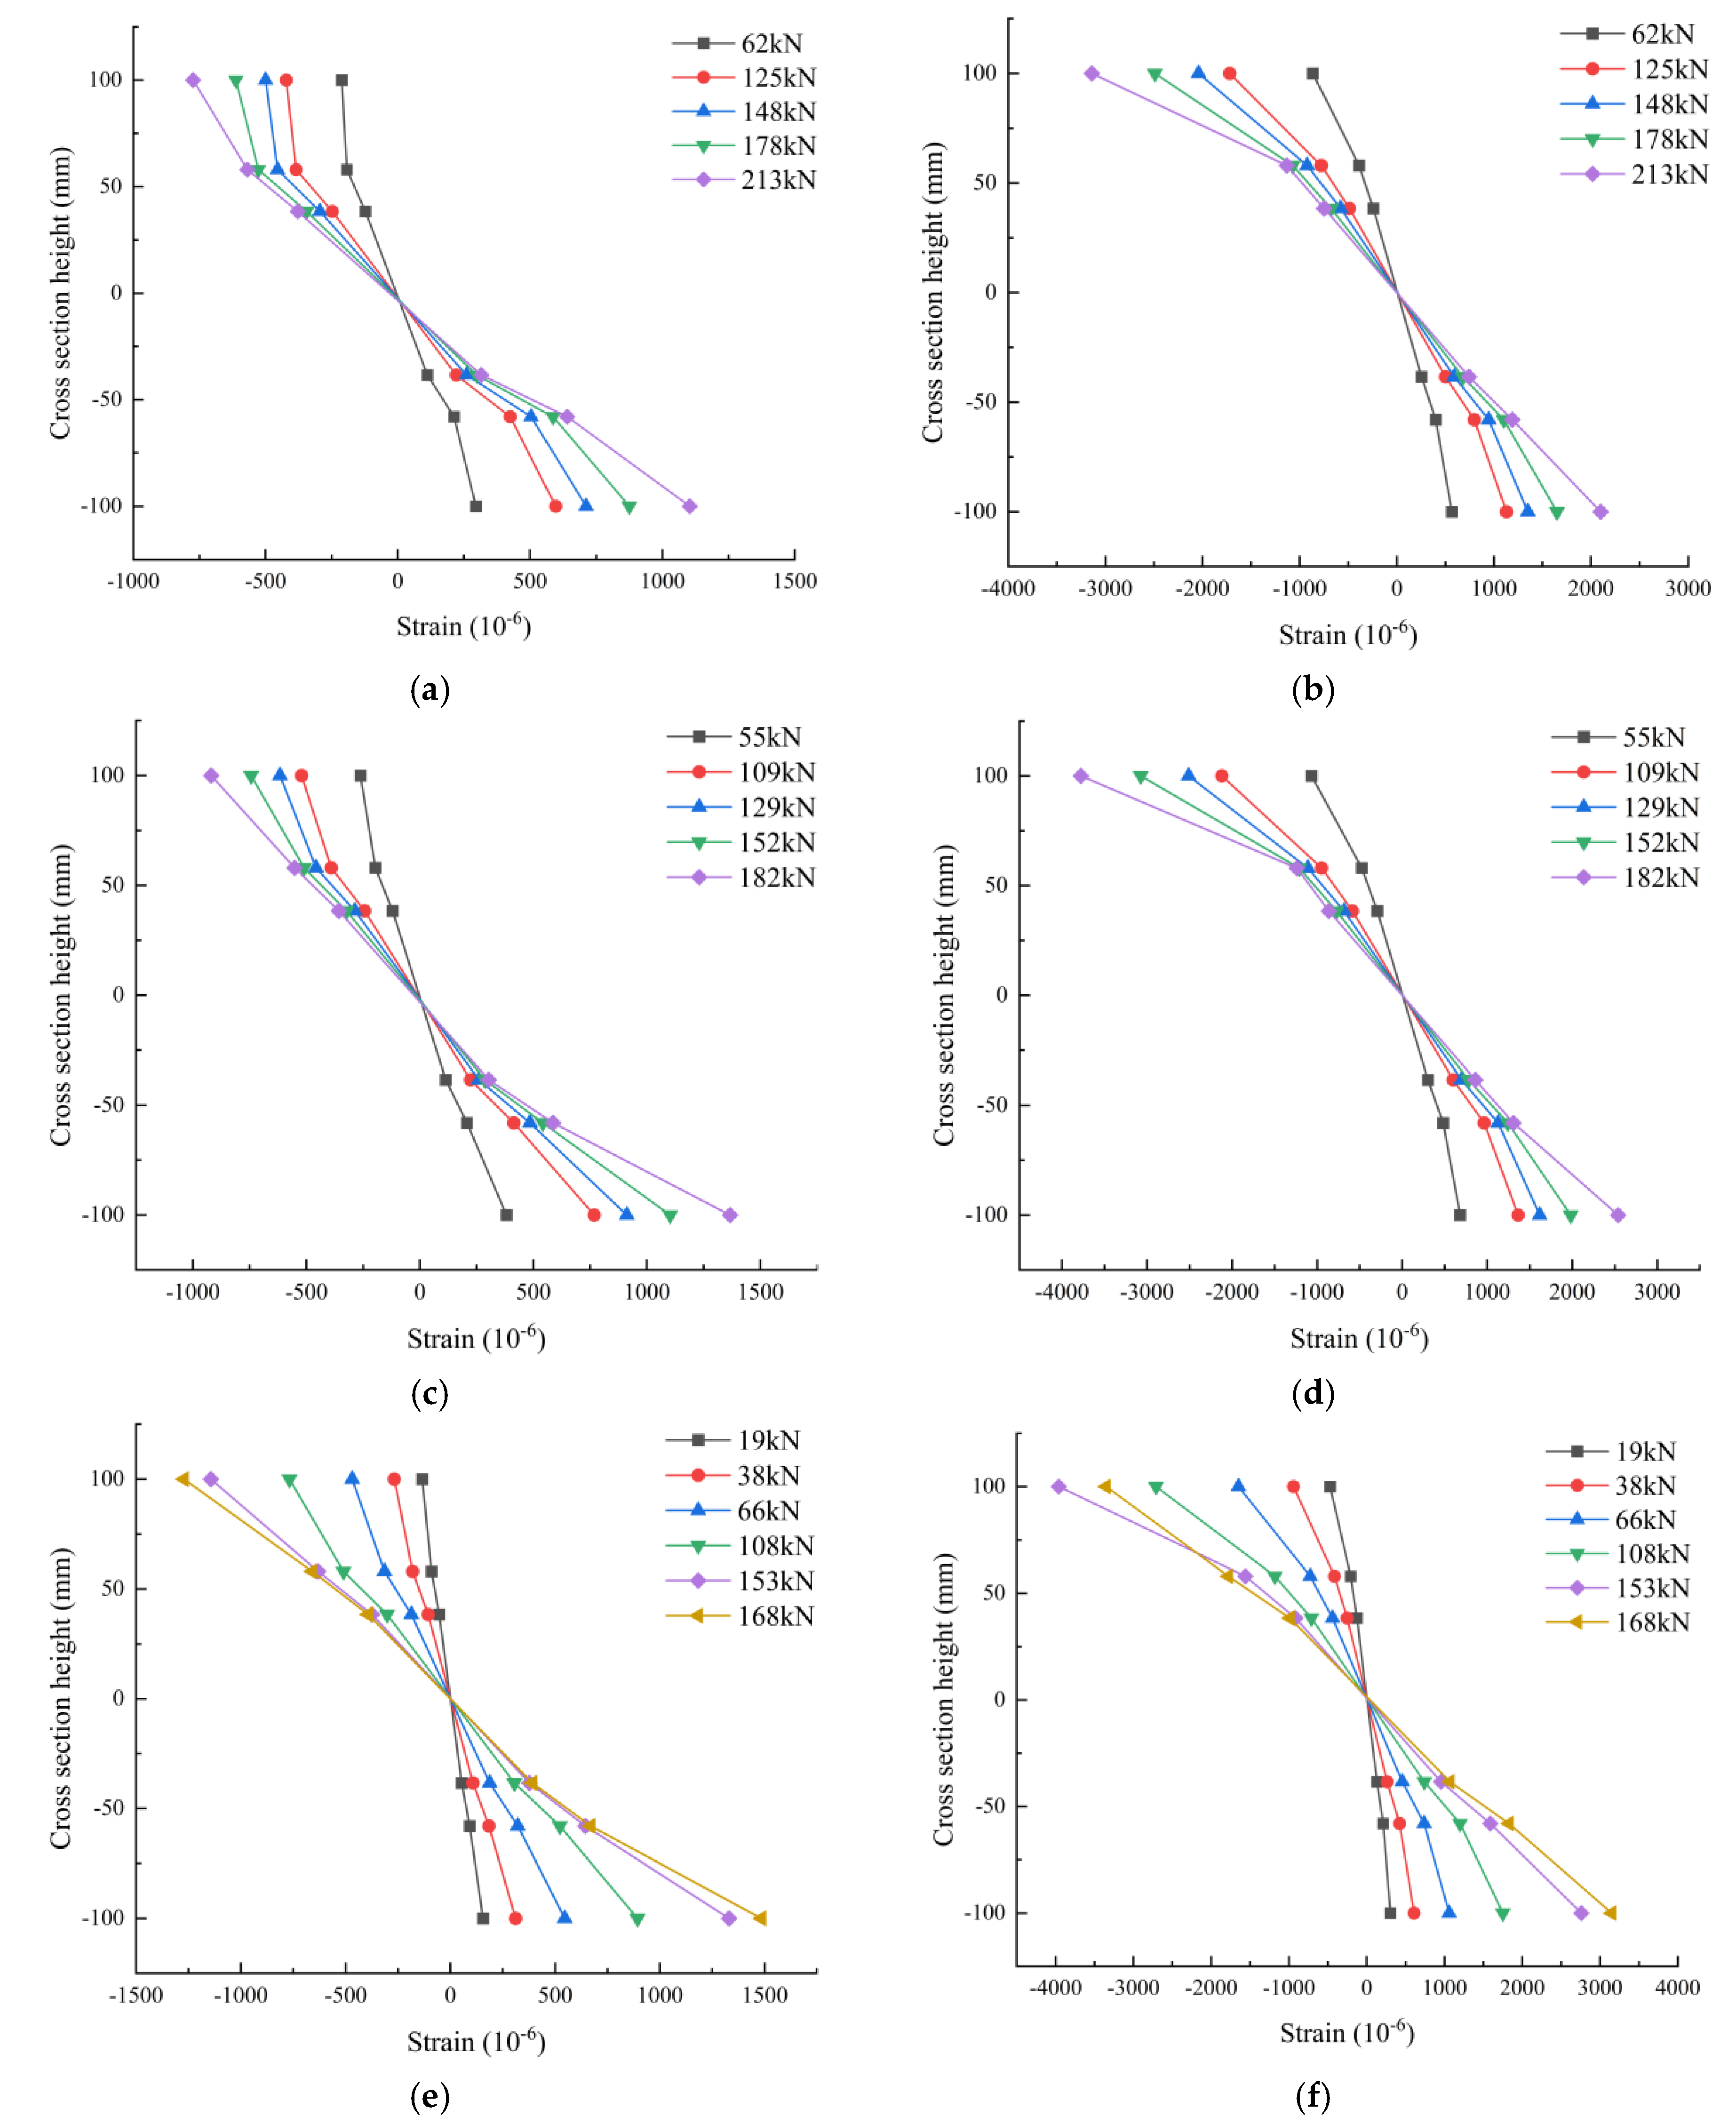
3.4. Cross Section Height–Strain Curve Analysis

Figure 11 is the cross-section height–strain curve of the composite beam. The mid-span strain of composite beams L-1 and L-2 changed linearly with the height of the section before failure. From the beginning of the loading process to the end, the neutral axis position basically did not shift, which satisfies the plane section assumption.

4. Finite Element Analysis

4.1. Finite Element Modeling

This paper used ABAQUS finite element software to simulate and analyze the smooth shear performance of the glulam beams. Since glulam has complex mechanical properties and there are differences in strength values in the same direction, according to the existing functions of ABAQUS, the intrinsic structure relationship of wood in the down-grain shear direction has not been defined in the material library. Thus, a computer subroutine was prepared to establish a user unit for the cold-formed thin-walled steel–glulam composite beam, which was used to numerically simulate and analyze the shear resistance of the composite beam.
The direction needs to be specified when defining the material properties of glulam. The orthogonal three-way axis and three-way section diagram are shown in Figure 12, and the three elastic principal directions of longitudinal (L), radial (R), and chordal tangential direction (T) are represented by the numbers 1, 2, and 3. In this paper, the elastic stage of glulam is regarded as orthogonal anisotropy. The nine engineering constants of the elastic stage of glulam are shown in Table 6, and the material direction of the glulam beams is schematically shown in Figure 13.
To make the model easy to converge, when defining the mesh properties, the twenty-node quadratic hexahedral cell reduction integral C3D20 was used for the meshing of the glulam, and the eight-node linear reduction integral cell C3D8R was used for the meshing of the steel plate. The meshing diagram is shown in Figure 14. The assumptions for the establishment of the finite element model were as follows: (1) The yielding of the material conforms to the simplified Hashin yield criterion [19,20,21]; and (2) the material is, ideally, linearly elastic before yielding to shear, and enters the plastic flow stage after yielding.
The finite element analysis in this paper completed the web-plate interaction setup by the following two steps. First, the “Embedded region” command was used to achieve cooperative deformation between the bolt and the steel section. The “surface-to-surface contact” command was used to prevent the web plates from separating from each other. The upper and lower flange glulam boards and the glulam boards of the two sides used “tie” binding constraints. The upper flange of the plywood and the upper flange of the steel section were connected by a “Cohesive” unit to obtain a relative slip between the interfaces of the two materials.

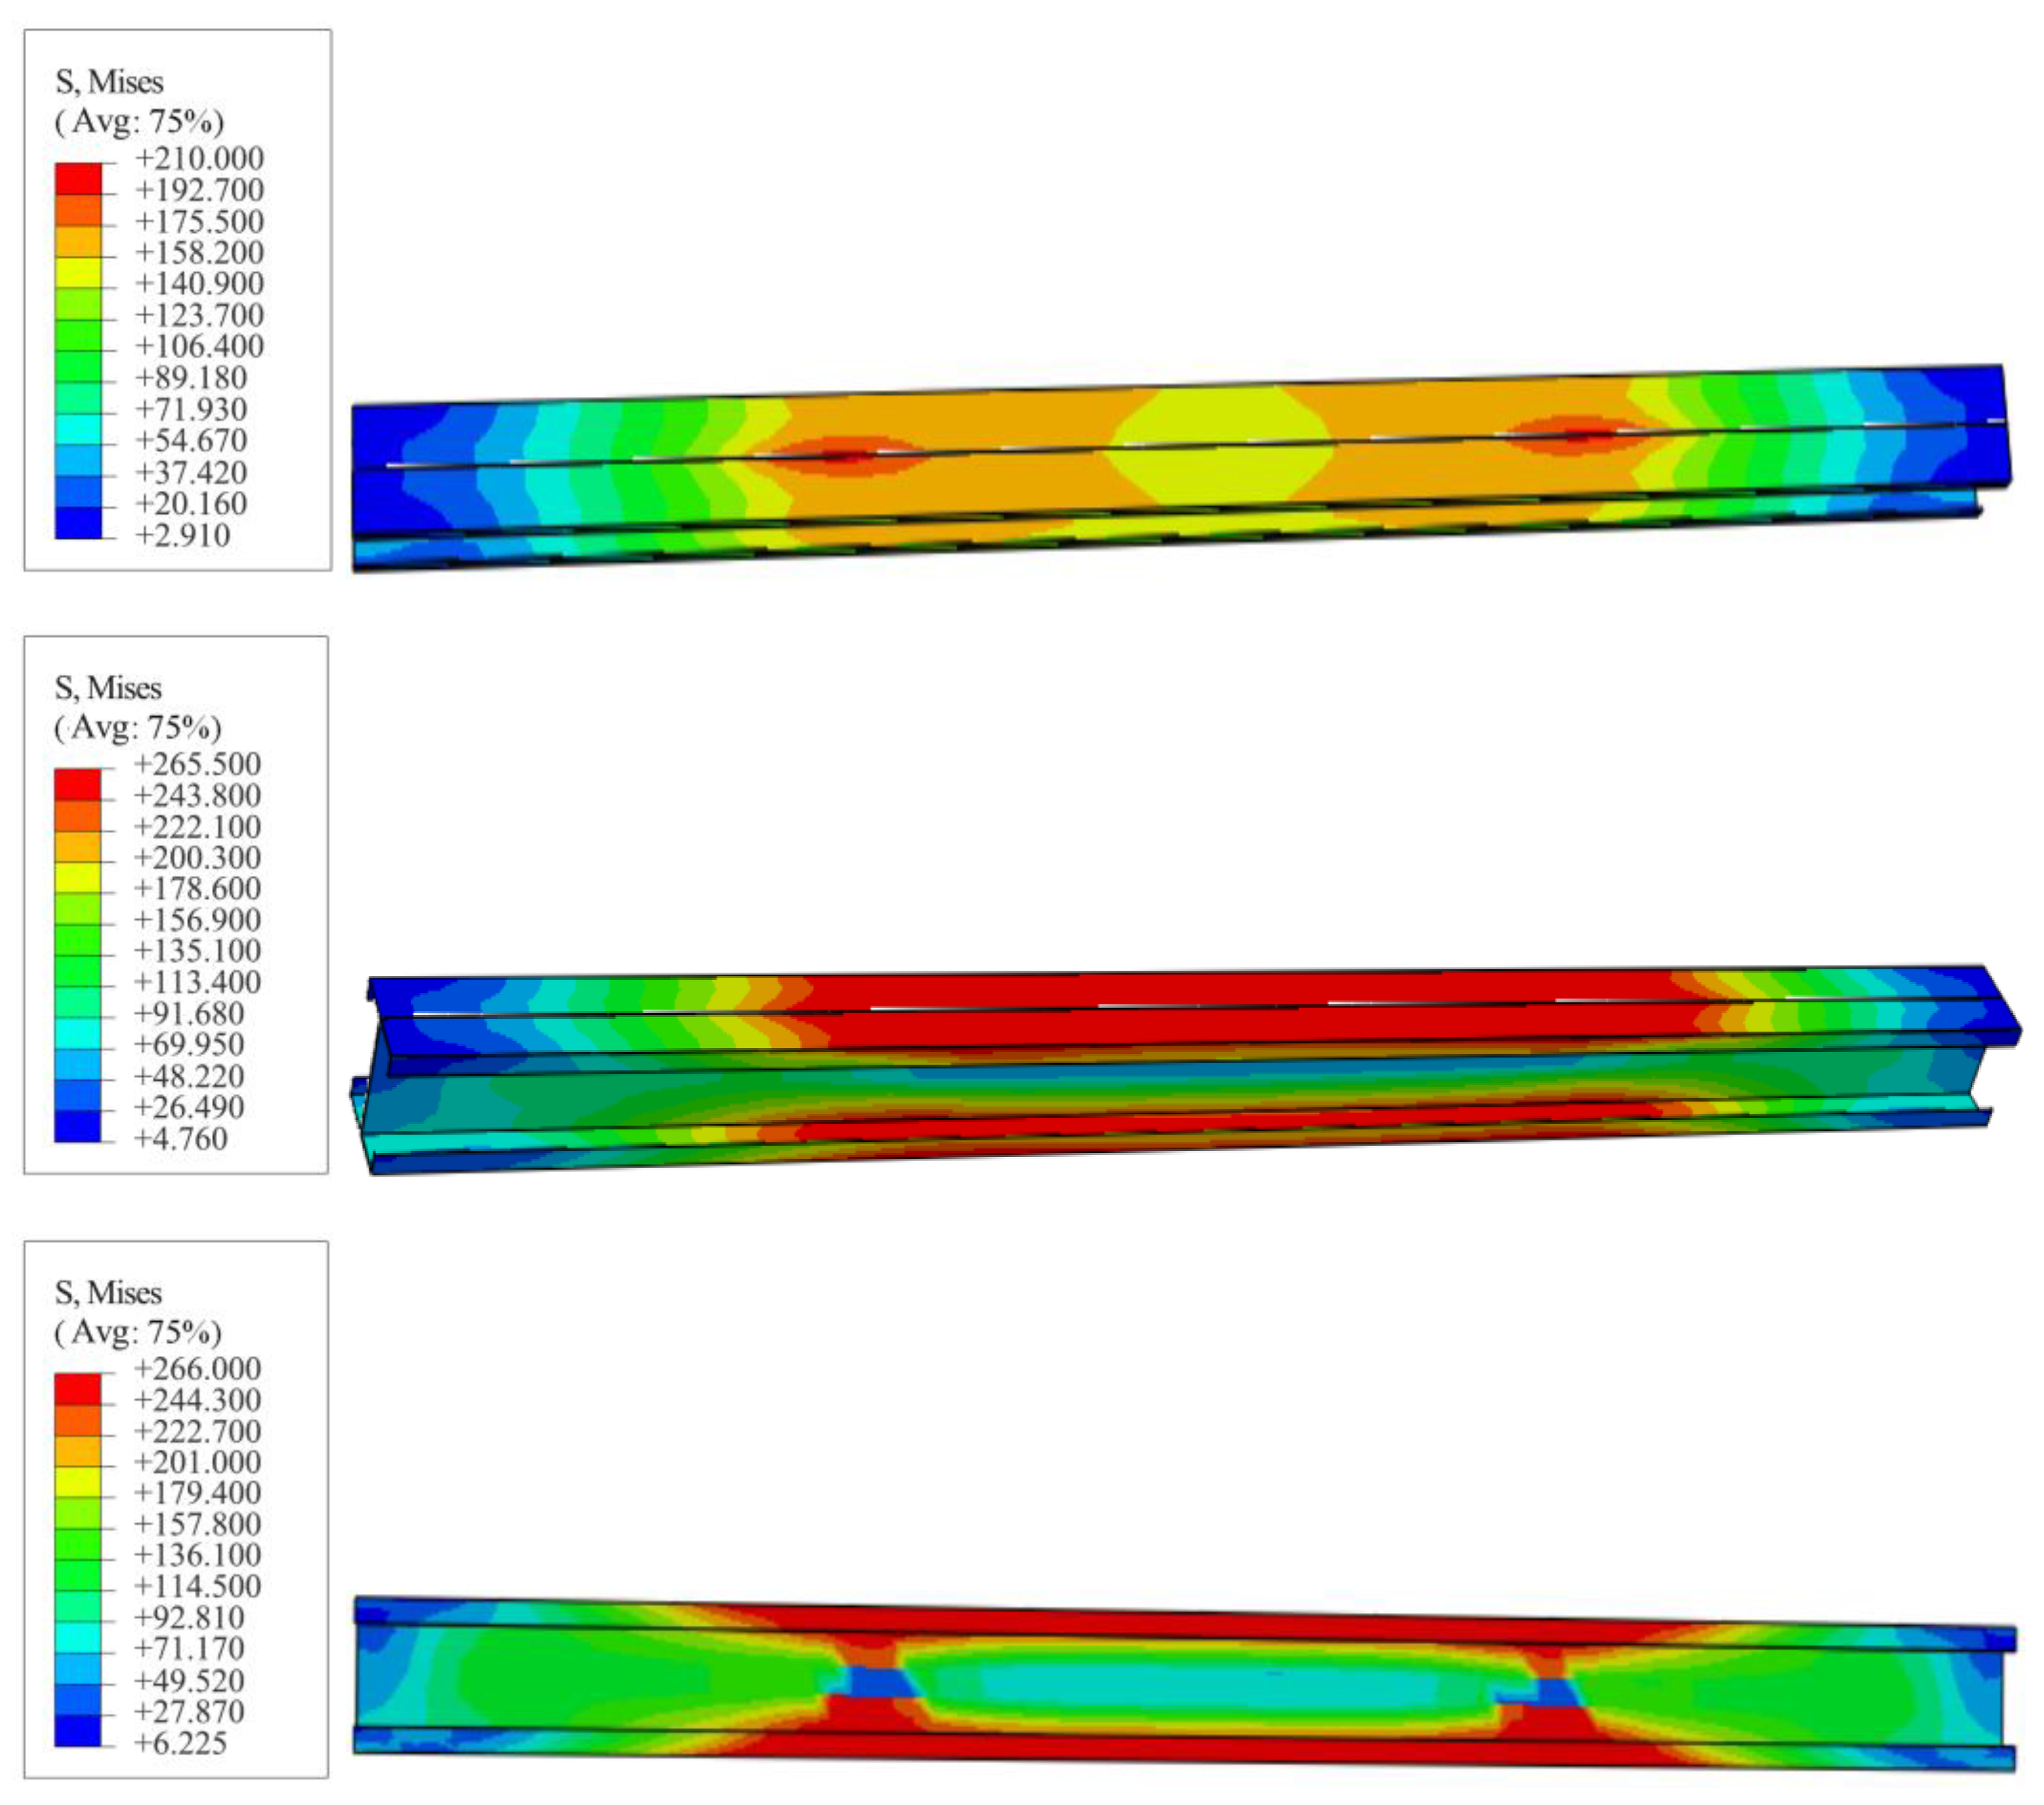
4.2. Finite Element Model Stress Analysis

This paper analyzes only a composite beam with a shear-to-span ratio of 2.5. As shown in Figure 15, the initial loading was located in the shear span area on the left and right sides of the glulam plate. Firstly, the shear stress concentration area appeared near the neutral axis near the bottom of the loading point. The maximum shear stress was 7.29 MPa, with the neutral axis as the reference line. The shear stress on the upper and lower sides was symmetrically distributed and decreased in a gradient; the farther away from the neutral axis, the smaller the shear stress. The minimum was 7.11 MPa, indicating that cracks did not appear in the shear span section. When the load reached 168kN, the shear stress in the concentrated area was roughly between 8.11–8.30 MPa. It was located at 1/2 of the beam height, exceeding the shear strength of the parallelepiped. Shear damage occurred in the model, after which the fiber linkage damage expanded rapidly until the final penetration of the bending shear section was reached, marking a loss of shear resistance in the composite beam. This damage phenomenon was consistent with the test phenomenon.
Figure 16 shows the distribution of stress clouds in the loading process of thin-walled sections when the shear-to-span ratio was 2.5. When the load reached 110 kN, the stress at the flange of the thin-walled section first reached a maximum of 265 MPa at the location corresponding to the loading point, and then began to enter the plastic stage. When we continued to load, the stress at the upper and lower flanges of the pure bending section gradually increased until reaching 129 kN, completely entering the plastic stage; at this time, the stress values of the left and right sides of the rolled edge had not yet reached the steel yield strength, and the stress size from the root of the flange decreased step by step. When loaded to 153 kN, the stress at the web of the steel section near the loading point increased from the upper and lower side to 1/2 of the height of the beam, but only a small part reached the yield strength. At the same time, stress distribution in the shear span section was observed, in which the maximum stress at the flange was 184 MPa and the maximum stress at the web was 157 MPa, both of which were lower than its yield strength.
Figure 17 shows the load deflection curve between the test value and the simulated value of the shear capacity of the composite beam L-2. It can be seen that the initial slope and curve trends of the finite element simulation results and the test results were in good agreement in the elastic stage, but there was a slight separation between the two in the plastic stage. The reason for this is that the test beam had an initial crack, which reduced its deformation performance. The relative error between the experimental value and the simulated value of the ultimate load and deflection of the composite beam was less than 10%. The simulation phenomena corresponded to the experimental phenomena, and the finite element model was able to accurately reflect the failure process and the corresponding deflection deformation of the composite beam.

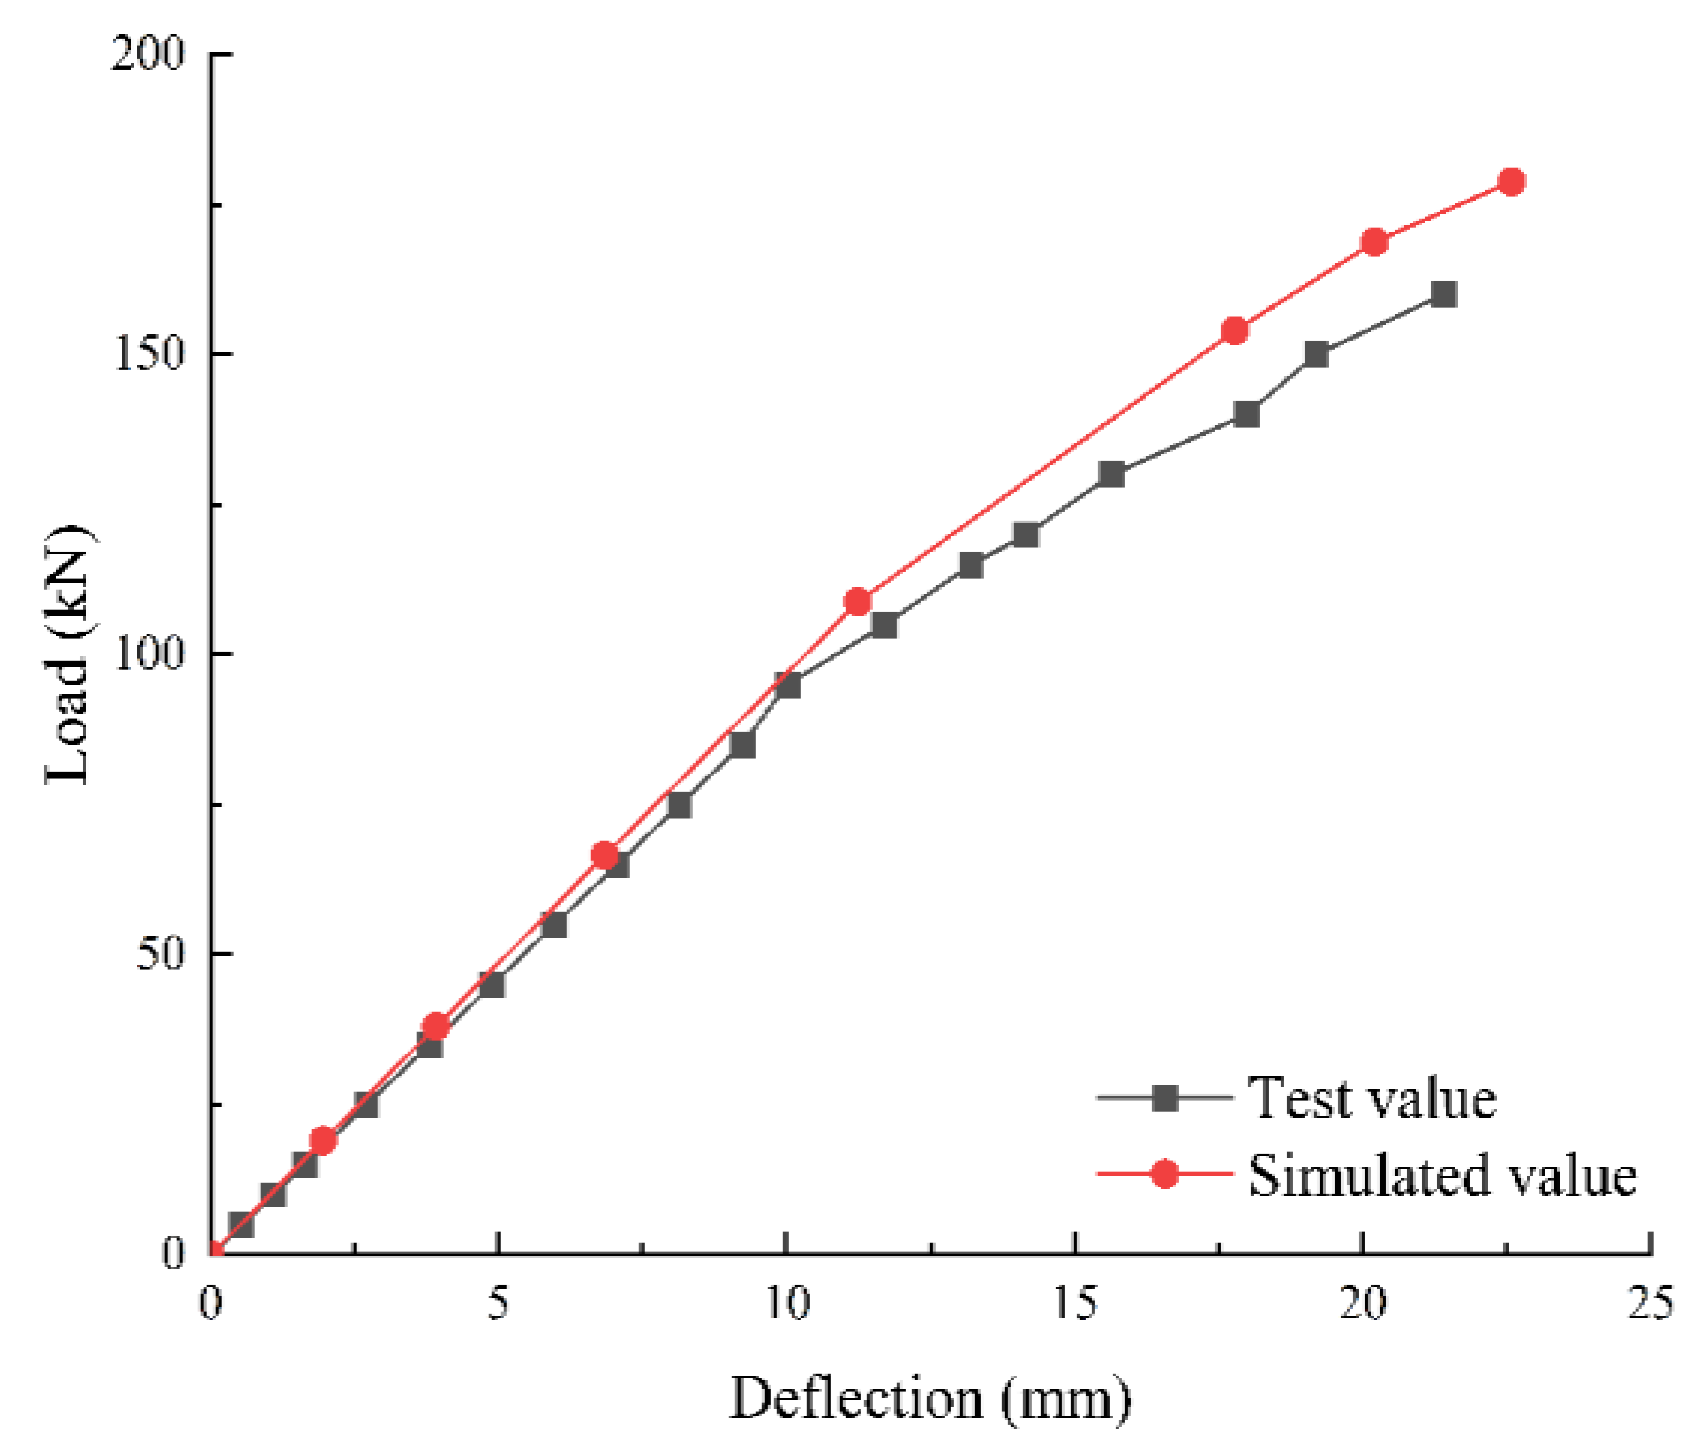
4.3. Load–Span Deflection Analysis

Figure 18 shows the load deflection curve during the static loading process of the composite beam with different shear–span ratios; from the figure, it can be seen that the different curve changes of the shear–span ratios were the same. The initial loading was the elastic stage, and the load and deflection curve represented linear growth. Continuous loading was maintained with more than 66–70% of the ultimate load, that is, when the cold-formed thin-walled steel flange yielded, the curve began to deviate from the linear state, thus entering the elastic–plastic state. The stiffness of the composite beams decreased, and deflection increased more rapidly, soon reaching the ultimate load, which was composite beam in the shear span section of the shear damage. The simulation ended when the lateral plywood of the composite beam broke down due to parallelepiped shear.

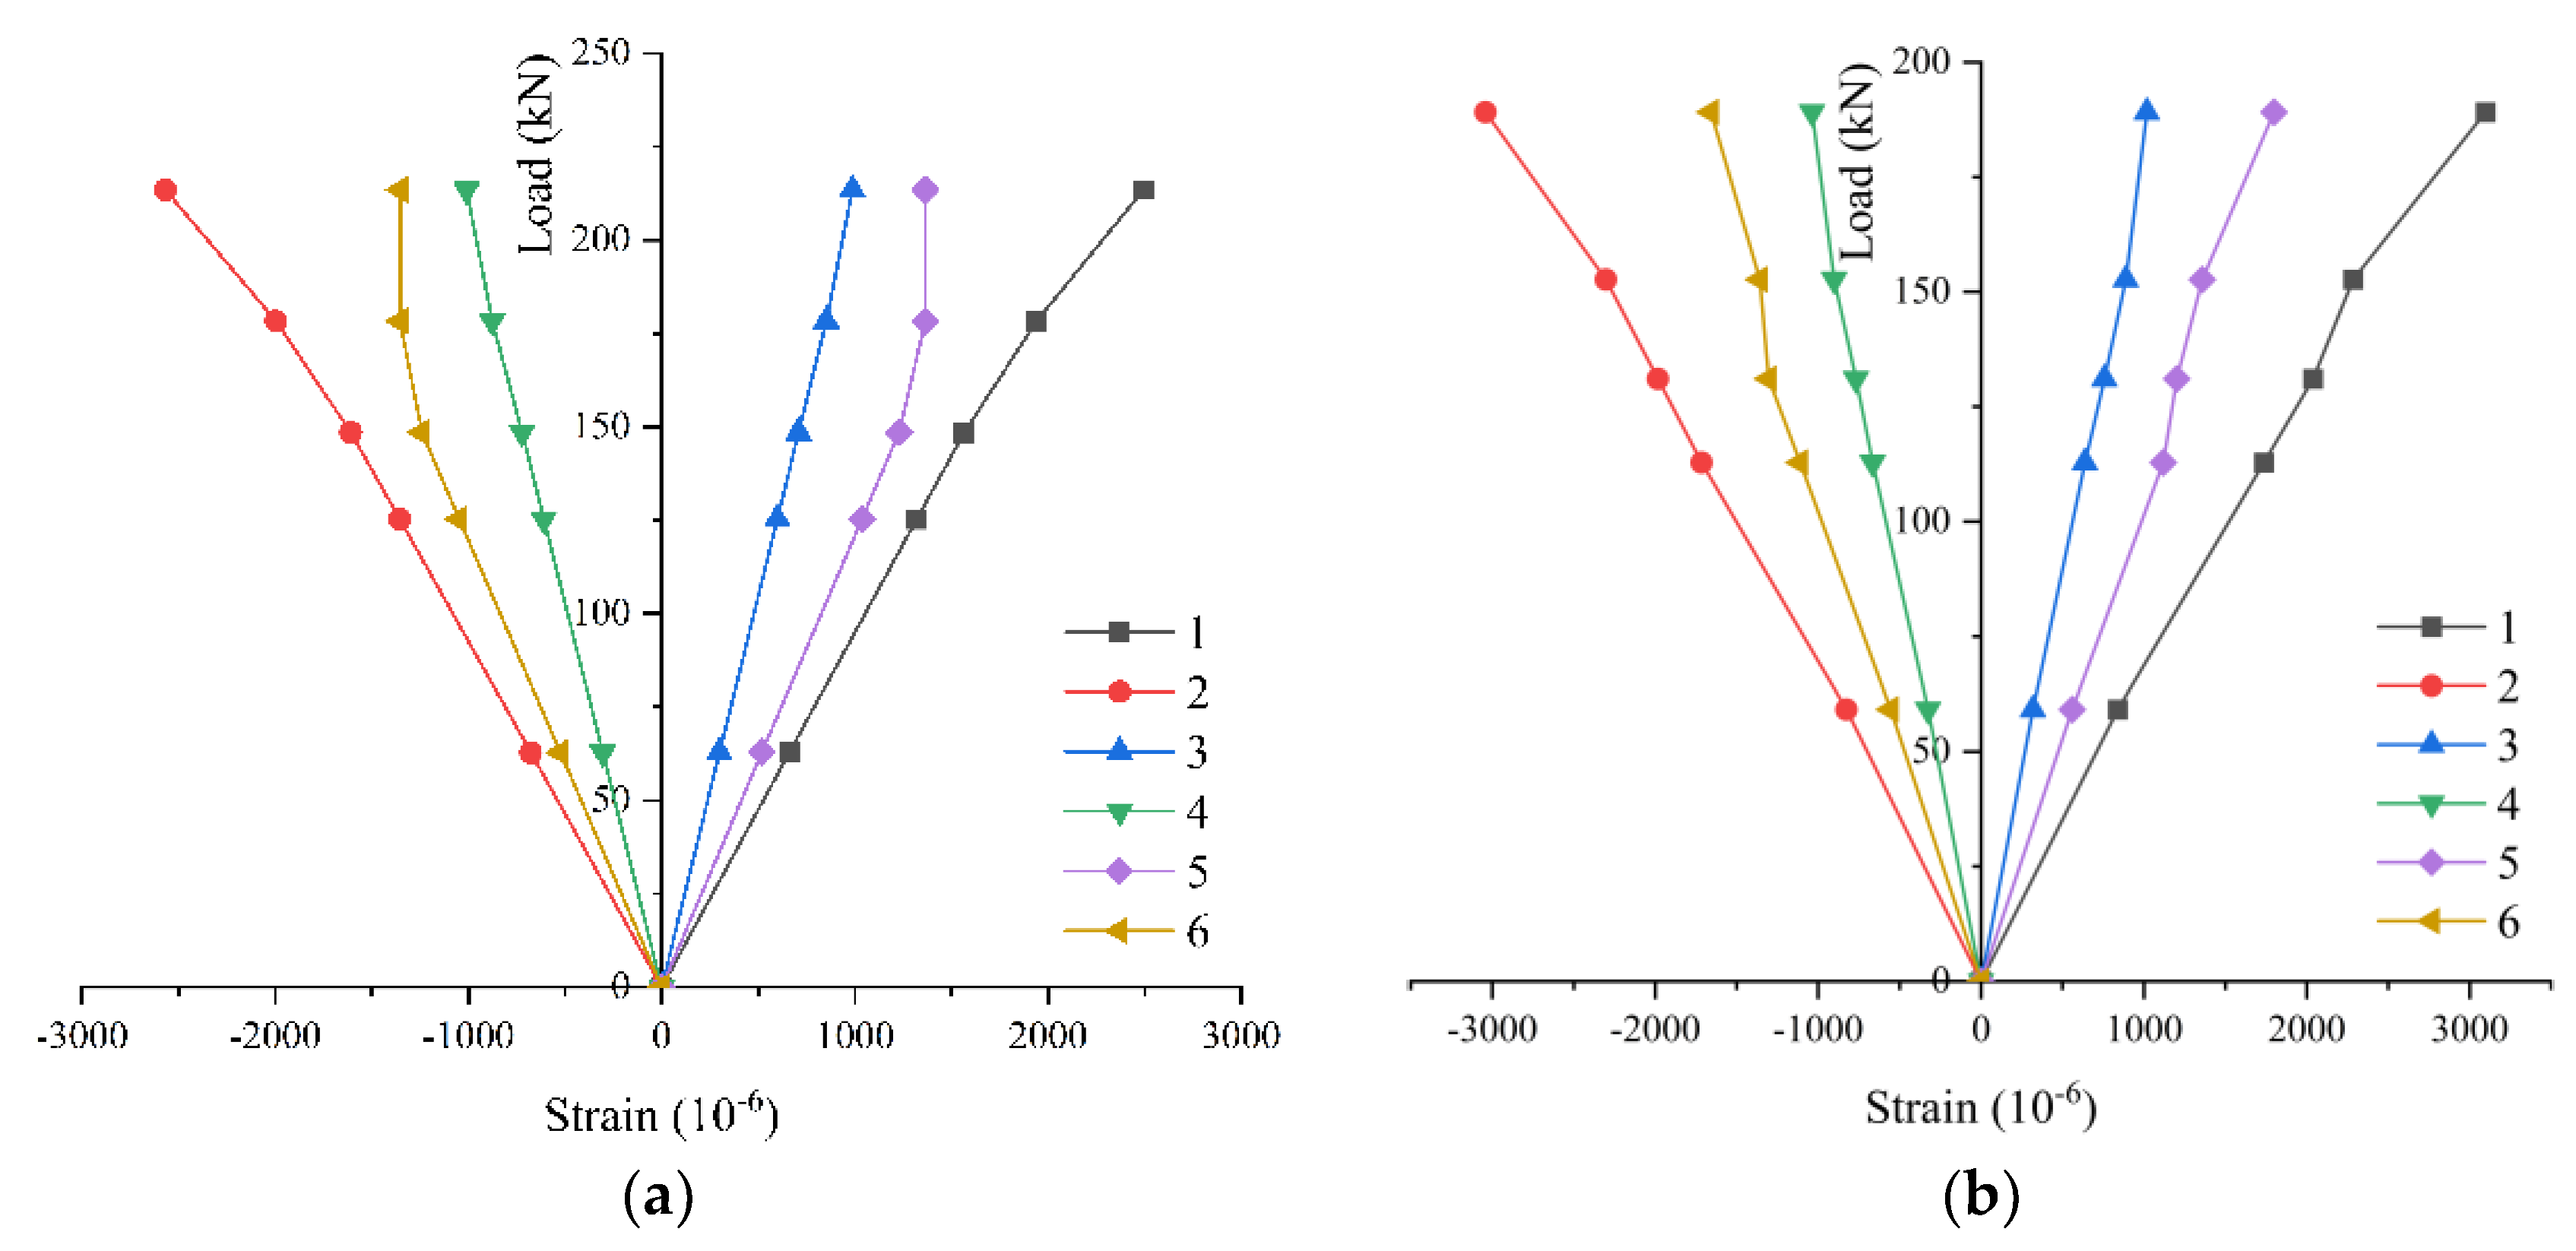
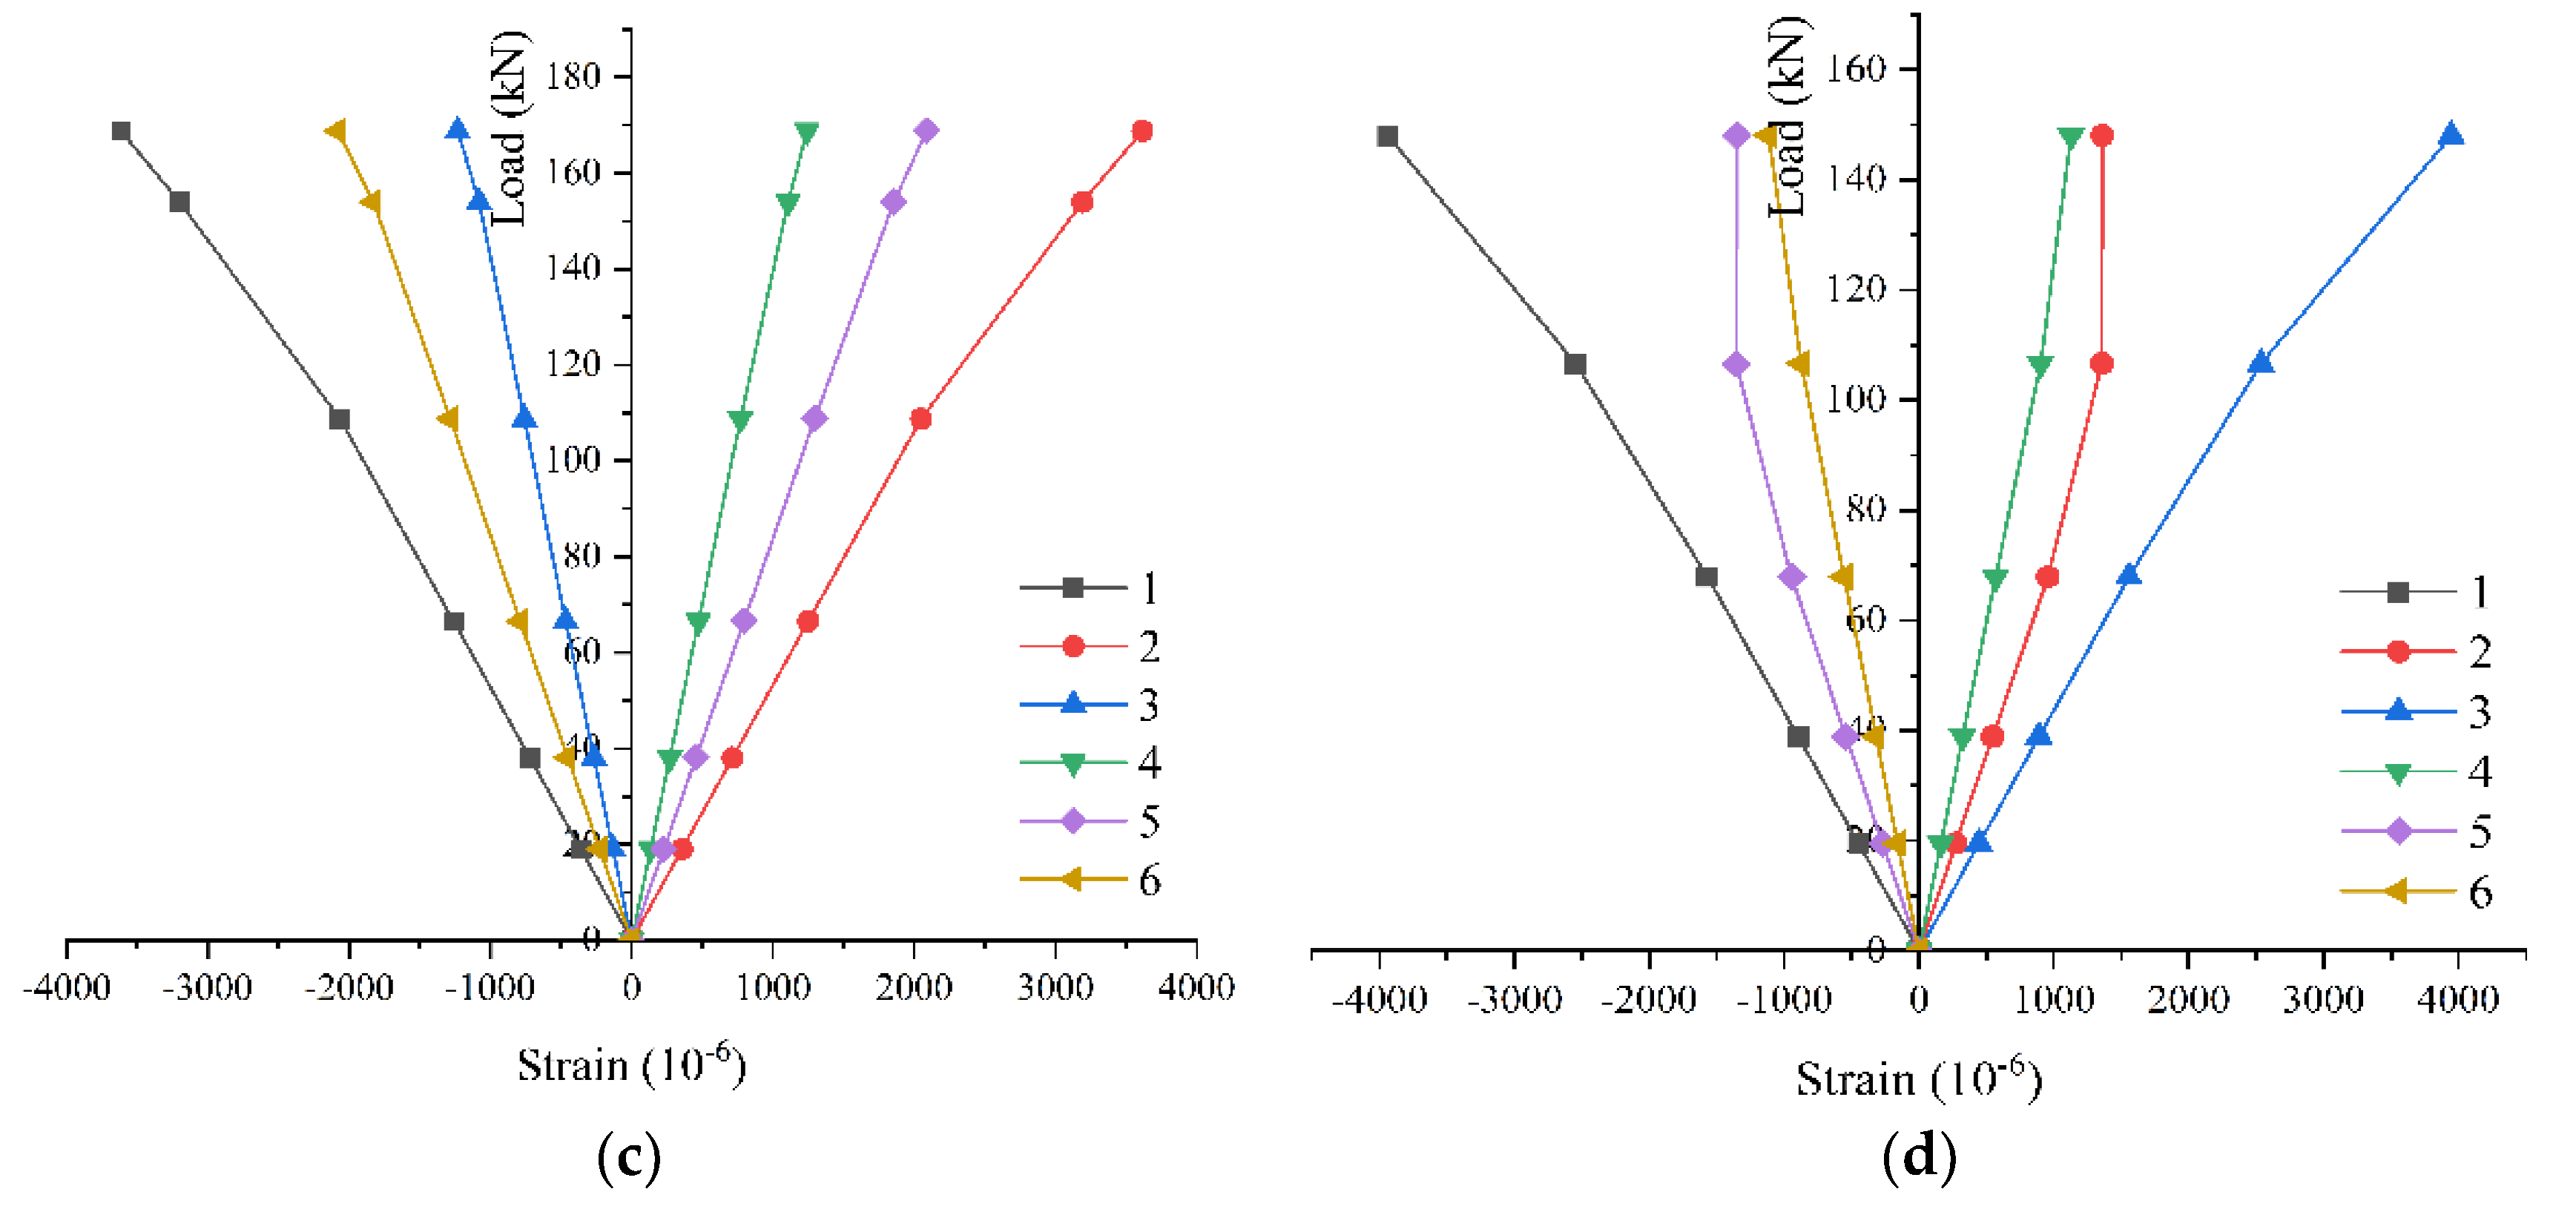
4.4. Load-Strain Curve Analysis

Figure 19 shows the strain–beam-height relationship curve of the test beam at the mid-span section. According to the curve trend, it can be seen that the strain at the corresponding position of the glulam and steel sections in the elastic stage increased when loaded to 70% of the ultimate load; the strain curve at nodes 5 and 6 began to deviate from the linear state; the strain change was nonlinear; and the thin-walled steel flange entered the yielding stage. We continued to increase the load of the model with the shear-to-span ratios of 1.5 and 2.0, and the rate of the increase in tensile and compressive strain values at 5 and 6 suddenly and sharply decreased, and the previous and subsequent strain values changed less.
Figure 20 shows a schematic diagram of the locations of sections 1-1 and 2-2, as well as the locations of measurement points. Sections 1-1 and 2-2 were close to l0/6 and l0/3, respectively. Figure 21 shows the strain–section height relationship graph of the thin-walled steel–glulam composite beams at sections 1-1 and 2-2. When a certain load was applied, the strain value varied linearly with the section height, while the strains of glulam and skeleton I steel exhibited gradient changes, and the observed neutral axis moved very slightly. The section strains remained flat, indicating that the flat section assumption still holds even if there is shear strain. In the late stage of loading, due to the excessive load, a stress concentration occurred near the mat. The compressive strain value of the glulam located at sections 2-2 grew more quickly than that of the tensile area. This changing trend was weakened when the shear span was relatively large, and the shear-bearing capacity decreased.

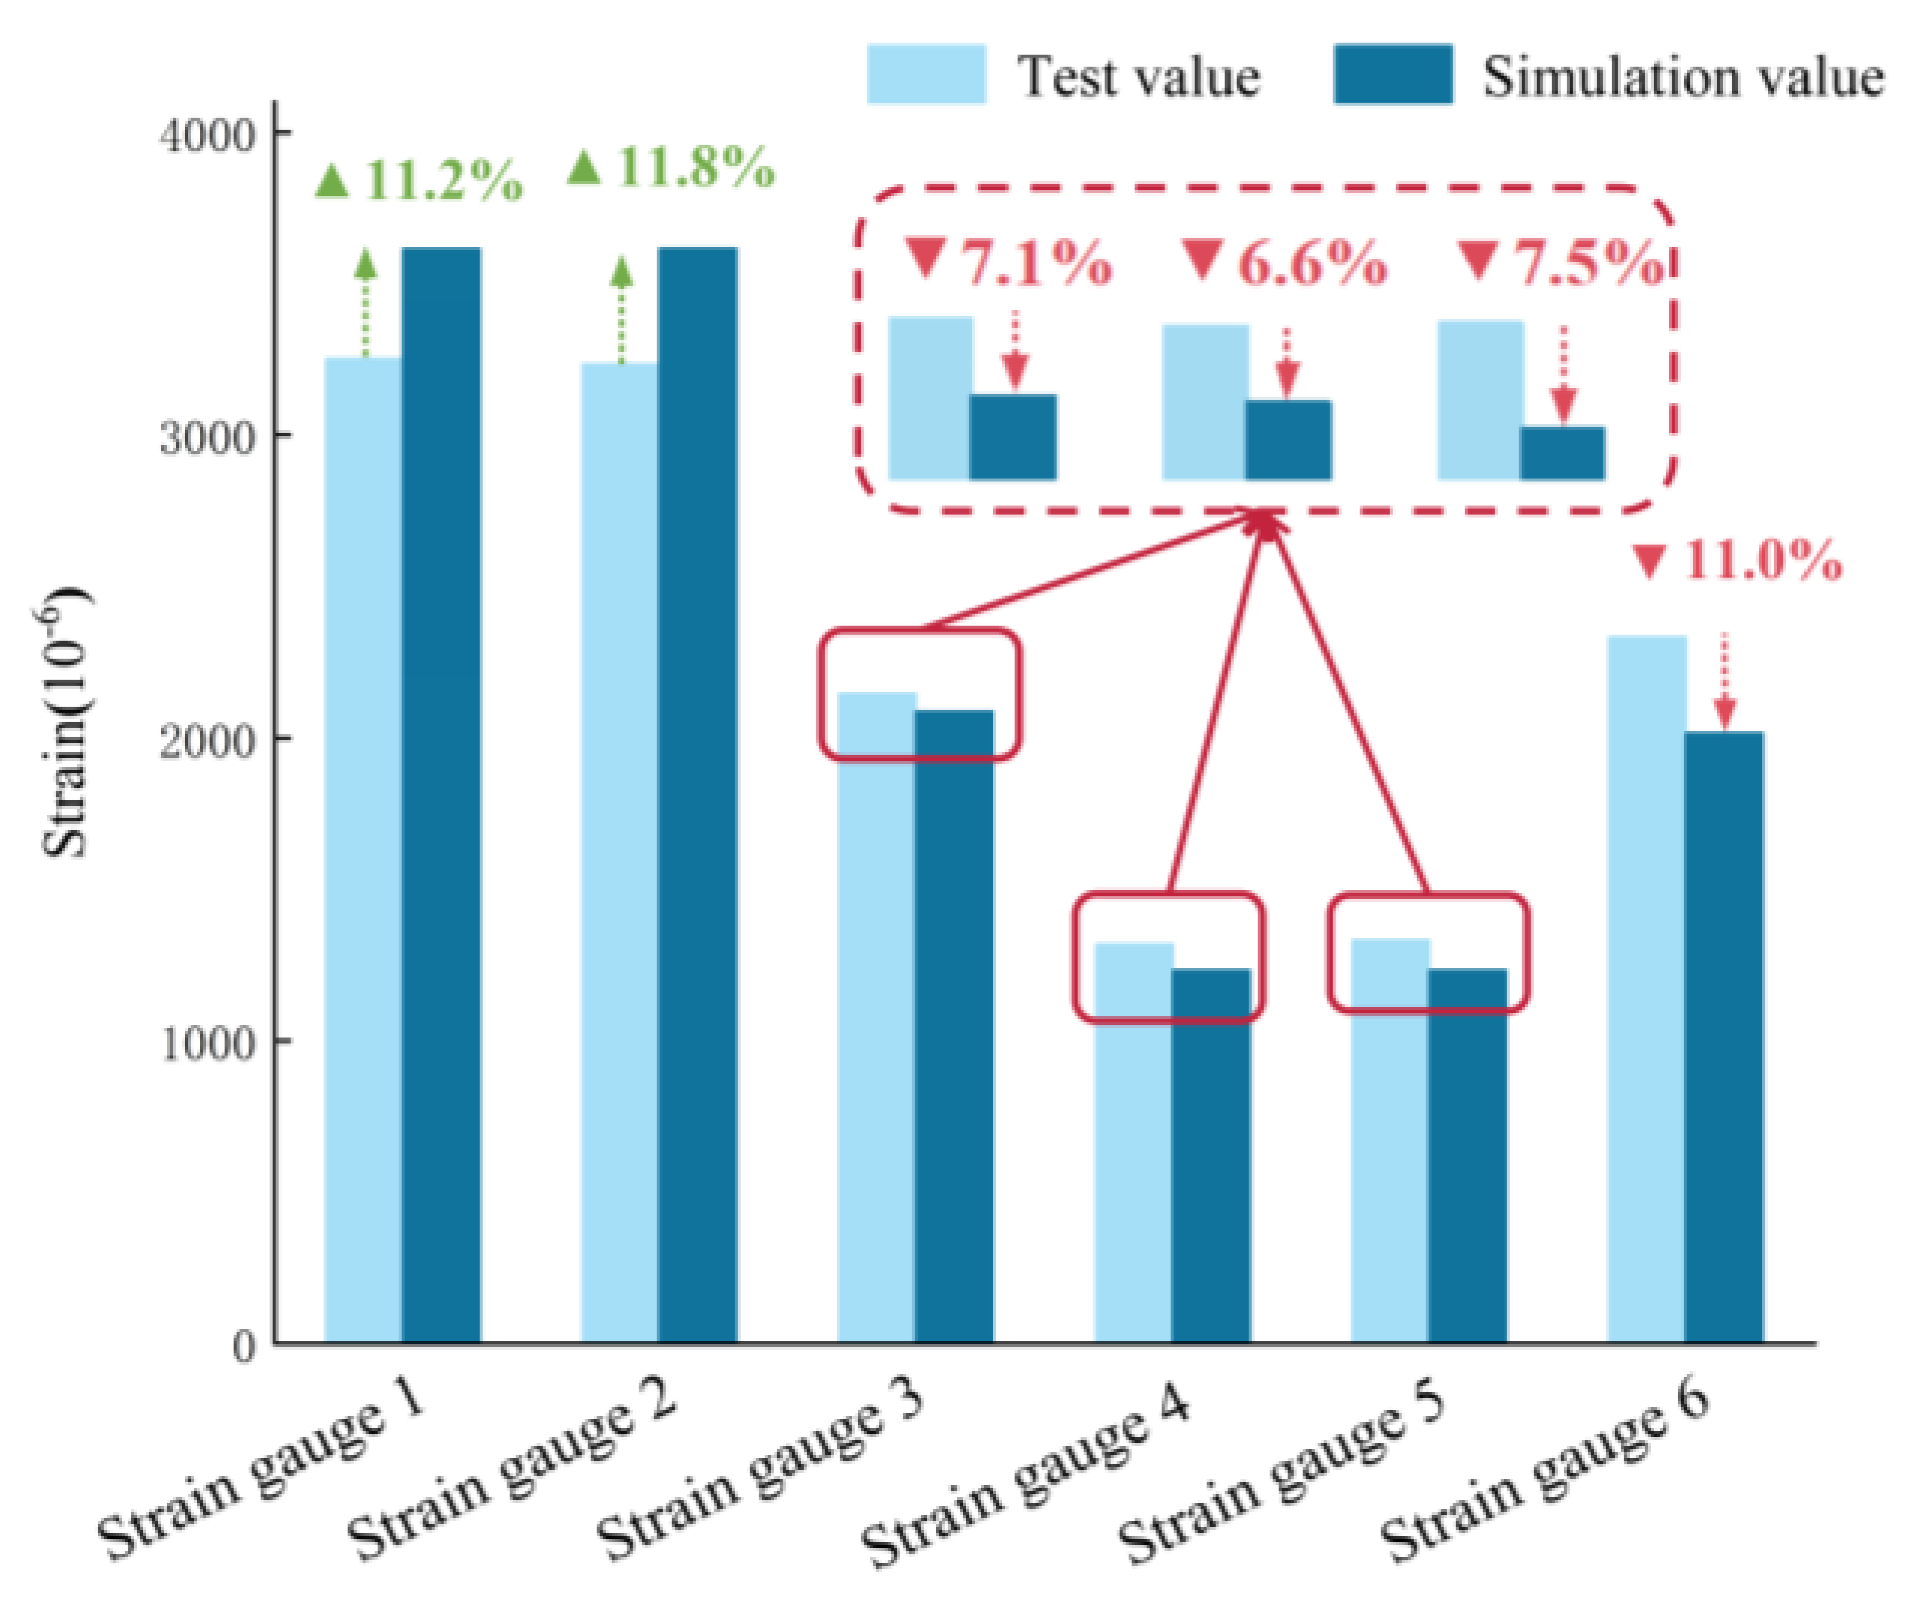
4.5. Comparative Analysis of Strain

Figure 22 shows a maximum strain value comparison diagram of the test and simulation results of the composite beam L-2 (strain gauge 2, strain gauge 4, and strain gauge 6 are negative values, and positive values are shown for convenience). It can be seen from Figure 22 that the error between the simulated value and the experimental value of the strain gauge on the glulam was large. The analysis revealed that this was due to the geometric defects of the glued laminated timber itself. As the load continued to increase, the interior of the glulam gradually appeared, resulting in the actual test strain value and the finite element simulation strain value.

5. Analysis of Factors Influencing Shear Resistance

5.1. Section Area of Steel Sections

Table 7 shows the influence of steel plate thickness on the bearing capacity of composite beams. Figure 23 shows the load-cold-formed thin-walled section thickness relationship curve. The cross-sectional area of the cold-formed thin-walled section had a certain degree of influence on the shear-bearing capacity of the composite beam. Taking the shear-span ratio of a 2.5 composite beam as an example, when the section thickness increased from 1.5 mm to 2.0 mm, the shear rigidity increased by 1.21%, and the shear-bearing capacity of the composite beam increased by 10.6%. When the section thickness increased from 2 mm to 2.5 mm, the shear rigidity increased by 1.19%, and the shear-bearing capacity of the composite beam increased by 6.3%. When the section thickness increased from 2.5 mm to 3.0 mm, the shear rigidity increased by 1.18%, and the shear capacity of the composite beam increased by 5.8%. This shows that the shear capacity of the composite beam increased with the increases in the area of the steel section, and the larger the increase in the area of the steel section, the larger the change in the shear capacity of the composite beam.

5.2. Shear-to-Span Ratio

Figure 24 shows the relationship between load deflection curves for different shear-to-span ratios, taking the cold-formed thin-walled steel composite beam with a thickness of 2.5 mm as an example. After entering the elastoplastic stage, the composite beam with a shear-to-span ratio of 1.5 quickly reached the maximum load, and shear damage occurred. The combination beam, with a shear-to-span ratio of 2.5, showed obvious ductility characteristics, the bearing capacity was able to grow slowly in the larger displacement interval, and the composite beam with the shear-to-span ratio of 2 varied between 1.5 and 2.5. The cutting ratio from large to small, with cutting resistance, increased by 14.7% and 20.1%, respectively. It can be seen that the shear–span ratio greatly influenced the shear-bearing capacity, and the larger the shear-span ratio, the lower the shear-bearing capacity of the composite beam and the lower the overall stiffness.

5.3. Steel Skeleton Form

As shown in Figure 25, it can be seen that the slope of the curve was the same for the “I” combination form and the box combination form during the entire process, from the beginning of loading to the final result regarding damage. Therefore, changing the steel skeleton form has little effect on the shear stiffness of the composite beam, but it can improve the overall shear-bearing capacity of the composite beam. The shear-bearing capacity of the box combination form increased from 168.01 kN to 188.88 kN compared with the “I” combination form, which increased by 12%.

5.4. Strength of the Steel

Figure 26 compares the load deflection curves of the combined beam under different steel yield strengths. In the elastic phase, there was almost no difference between the slopes of the curves of the composite beam, and the strength of the steel sections had less influence on the shear stiffness of the composite beam. When the load increased, the composite beam with steel types Q235, Q345, and Q460 entered the elastic–plastic phase. By comparison, we found that by increasing the strength of the thin-walled section steel, the shear-bearing capacity of the combined beam was improved. Still, for the overall stiffness of the composite beam, the change before and after the increase in section steel strength to a certain value was small.

6. Conclusions

There are two damage modes of composite beams under four-point loading:
(1)
Bond damage caused by the composite damage of smooth shear and glued beam fracture within the shear span area;
(2)
During the loading process, the shear span section first appears as a longitudinal crack with a small angle in the transverse direction, and then continues to load until the lower right flange of the span is pulled out. At this time, the composite beam undergoes bending shear composite failure.
According to the results reflected in the shear test and the finite element analysis of the composite beam carried out in this paper, it can be concluded that:
(1)
According to the load–strain curve of the shear test section, it can be determined that the strain of the composite beam section basically maintains a straight-line shape during the loading period, which is proportional to the distance from the neutral axis, so the composite beam section can be assumed to be a flat section.
(2)
The shear span ratio had the greatest influence on the shear-bearing capacity of the composite beams. When the shear span ratio increased from 1.5 to 2.0 and 2.5, the shear-bearing capacity decreased from 213.41 kN to 182.11 kN and 168.80 kN, respectively, with decreases of 14.7% and 20.1%, respectively. The greater the ratio, the greater the shear-bearing capacity of the composite beam. The larger the ratio, the lower the shear capacity of the composite beam.
(3)
The greater the thickness of the steel, the greater the shear performance of the composite beam with the increase in the thickness of the steel.
(4)
When the steel skeleton adopts a box-shaped combination form, although the shear stiffness of the section changes little, the shear-bearing capacity (calculated stiffness) is increased by 12% compared with the “I”-shaped combination form.
(5)
The strength of different types of steel led to no obvious change in the elastic stage. After entering the plastic stage, the composite beams with high steel strength had greater deformation capacity and ultimate bearing capacity. The steel strength increased from Q235 to Q265, Q345, and Q460 in turn, and the shear-bearing capacity increased by 7.8%, 7.1%, and 4.9% respectively. The increase rate decreased with the increase in the strength grade of the steel; thus, it is impossible to improve the overall shear-bearing capacity by increasing the strength of steel.

Author Contributions

Conceptualization, H.Y. and Z.J.; methodology, H.W.; software, Y.G.; validation, H.Y. and Y.G.; formal analysis, H.W.; investigation, H.Y.; resources, H.W.; data curation, H.Y.; writing—original draft preparation, Y.G.; writing—review and editing, H.Y., Y.G., and H.W.; visualization, Z.J.; supervision, H.Y.; project administration, H.W.; All authors have read and agreed to the published version of the manuscript.

Funding

This research was supported by CHINA CONSTRUCTION FIRST GROUP CORPORATION LIMITED-Urban Renewal Engineering Research Center-Building Health and Treatment Technology (CSCEC1B-PT-009).

Data Availability Statement

Data are contained within the article.

Conflicts of Interest

The authors declare that they have no known competing financial interests or personal relationships that could have appeared to influence the work reported in this paper.

References

  1. Lu, W.; Yang, H.; Liu, W.; Yue, K.; Chen, X. Development, application, and prospects of glulam structures. J. Nanjing For. Univ. Nat. Sci. Ed. 2011, 33, 105–110. [Google Scholar] [CrossRef]
  2. Liu, W.; Yang, H. Research progress on modern timber structures. J. Build. Struct. 2019, 40, 16–43. [Google Scholar] [CrossRef]
  3. Xiao, Y.; Wang, R.; Wen, J.; Li, Z.; Kong, Y.B.; Wang, J. Research progress of cross-laminated timber and bamboo (CLBT). J. Build. Struct. 2022, 43, 126–139. [Google Scholar] [CrossRef]
  4. Rammer, D.R.; Soltis, L.A. Experimental Shear Strength of Glued-Laminated Beams; Research Paper fpl; Forest Products Laboratory: Madison, WI, USA, 1994. [Google Scholar]
  5. Liu, W.; Yang, H. Experimental study on flexural behavior of engineered wood beams. J. Build. Struct. 2008, 29, 6. [Google Scholar] [CrossRef]
  6. Soriano, J.; Pellis, B.P.; Mascia, N.T. Mechanical performance of glued-laminated timber beams symmetrically reinforced with steel bars. Compos. Struct. 2016, 150, 200–207. [Google Scholar] [CrossRef]
  7. Hassanieh, A.; Valipour, H.R.; Bradford, M.A. Experimental and numerical study of steel-timber composite (STC) beams. J. Constr. Steel Res. 2016, 122, 367–378. [Google Scholar] [CrossRef]
  8. Guodong, L.; Wenqiang, C. Research on shear properties of cold-formed steel-glude wood pomposite beams. Low Temp. Archit. Technol. 2020, 42, 49–53. [Google Scholar] [CrossRef]
  9. Shi, D.; Huang, H.; Li, N.; Liu, Y.; Demartino, C. Bolted steel to laminated timber and glubam connections: Axial behavior and finite-element modeling. Int. J. Mech. Sci. 2023, 252, 108364. [Google Scholar] [CrossRef]
  10. Wu, S.; Shan, Q.; Zhang, J.; Tong, K.; Li, Y. Shear Behavior of I-shaped Wood-steel Composite Beams. Bioresources 2021, 16, 583. [Google Scholar] [CrossRef]
  11. Wang, X.; Zhang, J.; Wu, P.; Li, Y. Experimental investigation on the flexural and shear behaviour of LVL I-beam strengthened with steel channels. Constr. Build. Mater. 2022, 341, 127719. [Google Scholar] [CrossRef]
  12. Hoseinpour, H.; Valluzzi, M.R.; Garbin, E.; Panizza, M. Analytical investigation of timber beams strengthened with composite materials. Constr. Build. Mater. 2018, 191, 1242–1251. [Google Scholar] [CrossRef]
  13. Huifeng, Y.; Weiqing, L. Study on flexural behavior of FRP reinforced Glulam beams. J. Build. Struct. 2007, 28, 64–71. [Google Scholar] [CrossRef]
  14. Yingchun, G.; Haiqing, R. Characteristics and Development Prospect of Cross-laminated Timber. World For. Res. 2016, 29, 71–74. [Google Scholar] [CrossRef]
  15. GB/T 50329-2012; Standard for Test Methods of Timber Structures. Chongqing University: Chongqing, China, 2012.
  16. GB/T 1938-2009; Method of Testing in Tensile Strength Parallel to Grain of Wood. Anhui Agricultural University: Hefei, China, 2009.
  17. GB/T 1935-2009; Method of Testing in Compressive Strength Parallel to Grain of Wood. Institute of Chinese Academy of Forestry Timber Industry: Beijing, China, 2009.
  18. Chen, K. Study on Mechanical Behavior of Thin Walled H Type Steel-Wood Composite Beam Connection Interface; Southwest University of Science and Technology: Sichuan, China, 2019. [Google Scholar]
  19. Lei, Z. Experimental Study on the Mechanical Properties of Wood and theNumerical Modeling Strategies of Wood. Master’s Thesis, Beijing Jiaotong University, Beijing, China, 2017. [Google Scholar]
  20. Zhiyong, C.; Enchun, Z.; Jinglong, P. Numerical simulation of mechanical behaviour of wood under complex stress. Chin. J. Comput. Mech. 2011, 28. 629–634+40. [Google Scholar] [CrossRef]
  21. Zhuo, Z. ABAQUS-Based Finite Element Analysis and Applications; Tsinghua University Press: Beijing, China, 2009. [Google Scholar]
Figure 1. Test specimen for mechanical properties of materials. (a) Glulam tensile specimens along the grain. (b) Glulam compression specimens along the grain. (c) Steel tensile specimen.
Buildings 13 02903 g001
Figure 2. Form of a composite beam section (mm).
Buildings 13 02903 g002
Figure 3. Cold-formed thin-walled section steel web at the hole position (mm).
Buildings 13 02903 g003
Figure 4. Composite beam-loading device.
Buildings 13 02903 g004
Figure 5. Strain gauge and displacement meter arrangement (mm).
Buildings 13 02903 g005
Figure 6. Span section measurement point arrangement.
Buildings 13 02903 g006
Figure 7. Composite beam L-1 damage process. (a) When loading to 50 kN, the left side was partially opened. (b) Crack in the left adhesive layer. (c) One-half smooth shear crack on the right side beam height when loaded to 140 kN. (d) Fracture of rubber layer and shear damage to one-half of the beam height when loaded to 200 kN.
Buildings 13 02903 g007
Figure 8. Composite beam L-2 damage process. (a) The shear span section cracked when loaded to 65 kN. (b) Oblique cracks in the shear span section. (c) Splitting cracks into purely curved sections. (d) Loaded to 150 kN when the pure bending section loading point under the wing edge glue plywood board pulled off.
Buildings 13 02903 g008
Figure 9. Composite beam load - deflection curve.
Buildings 13 02903 g009
Figure 10. Load-strain curve of the composite beam. (a) L-1 load-strain curve. (b) L-2 load-strain curve.
Buildings 13 02903 g010
Figure 11. Cross-section height-strain curve of composite beam. (a) Cross-section height-strain curve of L-1. (b) Cross-section height-strain curve of L-2.
Buildings 13 02903 g011
Figure 12. Orthogonal three-way axes and three-way sections of glulam.
Buildings 13 02903 g012
Figure 13. Glulam material direction. (a) Schematic diagram of lateral glulam material direction. (b) Diagram of the upper and lower flange plywood material direction.
Buildings 13 02903 g013
Figure 14. Cell meshing: (a) C-beam meshing; (b) glulam meshing; (c) bolt meshing; (d) composite beam meshing.
Buildings 13 02903 g014
Figure 15. Shear damage process of glulam.
Buildings 13 02903 g015
Figure 16. Stress cloud variation in the thin-walled section steel.
Buildings 13 02903 g016
Figure 17. Comparison of experimental and simulated values.
Buildings 13 02903 g017
Figure 18. Load deflection curves of composite beams with different shear-to-span ratios. (a) Load deflection curves for different section thicknesses at a shear-to-span ratio of 1.5. (b) Load deflection curves for different section thicknesses at a shear-to-span ratio of 2.0. (c) Load deflection curves for different section thicknesses at a shear-to-span ratio of 2.5.
Buildings 13 02903 g018
Figure 19. Load-strain curves of different shear span ratios. (a) Load-strain curve when the shear-to-span ratio was 1.5. (b) Load-strain curve when the shear-to-span ratio was 2.0. (c) Load-strain curve when the shear-to-span ratio was 2.5. (d) Load-strain curve when the shear-to-span ratio was 3.0.
Buildings 13 02903 g019aBuildings 13 02903 g019b
Figure 20. Locations of measurement points of the composite beam.
Buildings 13 02903 g020
Figure 21. Strain curve of shear-span section. (a) Strain relationship of the 1-1 section at a shear-to-span ratio of 1.5. (b) Strain relationship of the 2-2 section at a shear-to-span ratio of 1.5. (c) Strain relationship of the 1-1 section at a shear-to-span ratio of 2.0. (d) Strain relationship of the 2-2 section at a shear-to-span ratio of 2.0. (e) Strain relationship of the 1-1 section at a shear-to-span ratio of 2.5. (f) Strain relationship of the 2-2 section at a shear-to-span ratio of 2.5.
Buildings 13 02903 g021
Figure 22. Comparison of experimental and simulated maximum strain value.
Buildings 13 02903 g022
Figure 23. Load–plate thickness curves of composite beams with different shear-to-span ratios.
Buildings 13 02903 g023
Figure 24. Load deflection curves for different shear-to-span ratios.
Buildings 13 02903 g024
Figure 25. Load deflection curves of composite beams with different steel skeleton forms.
Buildings 13 02903 g025
Figure 26. Load deflection curves of composite beams with different steel strengths.
Buildings 13 02903 g026
Table 1. Physical and mechanical properties of glulam.
MaterialMoisture Content (%)Tensile Strength (MPa)Compressive Strength (MPa)Shear Strength (MPa)Tensile Elastic Modulus (MPa)Compressive Elastic Modulus (MPa)
Glulam1286.4642.2989777.89053
Table 2. Physical and mechanical properties of steel plates.
MaterialMeasured Thickness (mm)Tensile Strength (MPa)Yield Strength (MPa)Elastic Modulus (MPa)Poisson Ratio
Q2352.0325.53218.63196,412.170.3
Table 3. Physical and mechanical properties of epoxy resin adhesive.
MaterialTensile Strength (MPa)Elastic Modulus (MPa)Poisson Ratio
Epoxy resin adhesive5040000.15
Table 4. Physical and mechanical properties of bolt.
MaterialTensile Strength (MPa)Elastic Modulus (MPa)Poisson Ratio
Bolt500200,0000.3
Table 5. Cold-formed thin-walled steel–glulam composite beam parameters.
SpecimenFlange Glulam Thickness (mm)Lateral Glulam Thickness (mm)C section Size (mm × mm × mm)Connection MethodShear Span Ratio
L-14020120 × 50 × 20 × 2.0Adhesive connection2
L-24020120 × 50 × 20 × 2.02.5
PL-14020120 × 50 × 20 × 2.02
SL-1--120 × 50 × 20 × 2.0-2
Table 6. Flexible phase engineering constants.
D1111
(N/mm2)
D2222 = D3333
(N/mm2)
D1122 = D1133
(N/mm2)
D2233
(N/mm2)
D1212 = D1313
(N/mm2)
D2323
(N/mm2)
11,532.10 × 106942.98 × 106620.28 × 106611.72 × 106723.74 × 106193.00 × 106
Table 7. Effect of steel plate thickness on the bearing capacity of composite beams.
Shear–Span RatioPlate Thickness (mm)Shear Rigidity
(kN)
Ultimate Carrying Capacity (kN)Carrying Capacity Increase Rate (%)
1.51.519,667,937.3205.29-
2.019,904,900.4213.41-
2.520,141,864.0239.41-
3.020,378,826.6260.53-
2.01.519,667,937.3168.70−17.82
2.019,904,900.4182.11−14.67
2.520,141,864.0204.49−14.59
3.020,378,826.6220.88−15.22
2.51.519,667,937.3152.60−25.67
2.019,904,900.4168.80−20.90
2.520,141,864.0179.60−24.98
3.020,378,826.6190.10−27.04
Disclaimer/Publisher’s Note: The statements, opinions and data contained in all publications are solely those of the individual author(s) and contributor(s) and not of MDPI and/or the editor(s). MDPI and/or the editor(s) disclaim responsibility for any injury to people or property resulting from any ideas, methods, instructions or products referred to in the content.

