Abstract
A reliable assessment and design of engineering structures requires appropriate estimation and consideration of different sources of uncertainty. The randomness of seismic ground motion is one major uncertainty that needs to be considered from the perspective of performance-based earthquake engineering. To properly account for this uncertainty and its corresponding effect on pile foundations, a stochastic seismic response analytical framework based on a probability density evolution method and a stochastic ground motion model is proposed for the nonlinear stochastic seismic response analysis of pile foundations. A three-dimensional finite element model of a reinforced concrete pile with a large diameter embedded in the soil foundation is firstly established and calibrated using the full-scale lateral load test results from the literature, in which the nonlinear behavior of soil, the soil–pile interaction, the concrete damaged plasticity, and the steel yielding of the pile are properly modeled. Then, the calibrated three-dimensional numerical model is employed as an illustrative example for the stochastic seismic response analysis using the proposed framework. The mean, standard deviation, and probability density function of pile settlement and the dynamic reliabilities of the pile concerning various performance requirements are obtained in the present study. The settlements of the pile show great variability under the excitation of various stochastic ground motions, and the maximum mean value of the pile settlements is about 8 mm. The changing shape of the settlement probability density functions in every moment demonstrates that it is unreasonable to use assumed probabilistic distribution models to characterize the seismic responses of pile foundations during a seismic reliability analysis. Based on the proposed method, it is found that the dynamic reliabilities of the selected reinforced concrete pile concerning four different performance levels are 0, 0.1293, 0.8247, and 1, respectively. The proposed stochastic seismic response analytical method in the present study can provide a proper and comprehensive way to quantify various uncertainties and their corresponding effects on the seismic performance of pile foundations. It can also be used to estimate the actual reliability level of pile foundations that are designed by the current codes when they are subjected to seismic loads.
1. Introduction
Pile foundation has been widely used in the design of various kinds of engineering structures and infrastructures, and the performance assessment of pile foundations is consequently of great significance [1]. However, much of the literature has shown that the bearing capacity and performance of piles are greatly affected by various sources of uncertainty (e.g., soil properties, structural parameters, geometrical parameters, and external loading conditions), and it is better to resort to probability theory and reliability methods for the quantification of these effects.
In recent decades, the bearing capacity and the response of pile foundations under the effects of various sources of uncertainty have been well investigated. Various probabilistic methods, such as approximate moment methods [2,3,4,5,6], response surface methods [3,7,8,9], and Monte Carlo simulation [5,10,11,12], have been used to combine different empirical methods, analytical methods, and numerical models of pile foundations to analyze the probabilistic characteristics of piles under axially/laterally loads. The uncertainty of soil properties is the main factor that has been considered in these studies by modeling soil properties as random variables [3,7,8,9] and random fields [4,10,11,13,14]. The uncertainties of the pile parameters and loading conditions (horizontal and axial loads) have also been taken into account by including them as random variables (e.g., [3,6,15]). For instance, Huh et al. [3] performed the probabilistic reliability estimation of an axially loaded pile by integrating the response surface method, the finite difference method, and the first-order reliability method, in which the uncertainties of the load condition, the pile material, the sectional property of the pile, and the soil properties were explicitly considered. Haldar and Babu [10] used the Monte Carlo simulation approach combined with the finite difference program (FLAC) to analyze the effect of soil spatial variability on the responses of a laterally loaded pile in undrained clay. Kozubal et al. [8] evaluated the reliability of a pile under lateral loads by varying soil properties, in which linear elastic soil constitutive model and a random variable model were used. Zhang et al. [11,12] studied the effect of spatial variability of undrained shear strength of soil on the bearing capacity of piles under horizontal loading. In most of previous studies, the pile is usually regarded as the beam placed vertically in the soil foundation, and the soil around the pile is usually represented by a series of springs and the soil–structure interaction is investigated by analyzing the load–displacement curves.
However, regarding the reliability analysis of pile foundations, most studies only focus on the static performance of axially/laterally loaded piles. The seismic reliability analysis of pile foundations is still limited. For instance, Liu and Zhang [16] employed the random field finite element method to examine the seismic responses of a pile–raft system by considering the randomness in the maximum shear modulus of soils using three-dimensional random fields. Only one input ground motion was input in their study, and the statistical results were analyzed using the Monte Carlo simulation. Esposito et al. [17] assessed and compared the reliability of single vertical pile foundations subjected to various seismic loads. They also investigated if the seismic geotechnical design in Canadian code achieved similar reliability levels as those aimed at by other static designs. However, in the study of Esposito et al. [17], only ten realizations of the site were produced in the seismic reliability analysis of axially loaded piles to represent the soil variability at the site.
On the one hand, in most of the existing studies, the reliability analysis of pile foundations is conducted at a static level. However, in the seismic fortification areas, the reliability of piles needs to be well understood and investigated under seismic loading condition. Under the seismic condition, there is a serious coupling effect of material nonlinearity with randomness, which significantly improves the difficulty of calculating the seismic reliability of pile. Furthermore, most of the existing reliability analysis of pile foundations only considered the uncertainty of soil parameters. The randomness of earthquake loading is another important factor that cannot been neglected in the seismic performance analysis of pile foundations because lots of studies have revealed that the main source of uncertainty and the crucial uncertain factor in the seismic performance evaluation of geotechnical structures is the randomness of ground motion [17,18,19,20,21,22,23,24]. For example, in the study of Esposito et al. [17], only ten realizations of the site were produced in the seismic reliability analysis of axially loaded vertical piles to represent the soil variability at the site, and they thought it was sufficient because the ground motion variability had the largest impact on the site response and the pile performance. As a consequence, the understanding of the effect of ground motion randomness on the seismic performance of pile foundations is far behind the understanding of the effect of soil variability on the static and dynamic behaviors of pile foundations. Additionally, among the studies concerning the reliability analysis of pile foundations, the pile is always treated as a structural beam or entity element with elastic properties, without considering the physical and mechanical characteristics of concrete and rebar. Under a huge lateral load and an earthquake load, plasticity and damage behaviors (e.g., plastic strains, concrete cracking, and steel yielding) will develop in this system according to post-earthquake investigations, experiments, and numerical simulations (e.g., [25,26,27,28,29,30,31]). Neglecting such effect might not acquire the realistic results with regard to the reliability analysis of pile foundations.
On the other hand, the approximate moment methods and the response surface methods are usually used in the static reliability analysis of piles, which need to obtain the limit state functions of piles. It can generally obtain satisfactory and reliable results in static cases. However, under a seismic condition, the coupling effect of randomness and soil nonlinearity will lead to a complex analysis of structural seismic performance and it is quite difficult to obtain the explicit expression of the limit functions of pile foundations. Although the Monte Carlo simulation avoids the influence of nonlinear limit state equation as long as there have been sufficient runs of the simulation, it has low computational efficiency and has the problem of random convergence. The calculation burden will increase sharply if it needs to be combined with the dynamic time history analysis for the seismic dynamic problem. As a consequence, it is necessary to employ a more efficient and reliable stochastic dynamic analytical method to investigate the stochastic seismic responses and the seismic reliability of this kind of complicated soil–structure system.
In the present study, to avoid the deficiencies mentioned above for the dynamic reliability analysis of pile foundations, an efficient stochastic dynamic method, namely the probability density evolution method (PDEM), is proposed for the nonlinear stochastic seismic response analysis of pile foundations. Firstly, the proposed framework for the stochastic dynamic analysis of pile foundations, including the theory of PDEM and the quantification of the uncertainty of seismic ground motions, is introduced. Secondly, a three-dimensional finite element model of a reinforced concrete (RC) pile embedded in sandy soils under horizontal loading is modeled to calibrate the model using the results from a full-scale field load test. This calibrated model is then extended to earthquake scenarios for the stochastic dynamic analysis in the present study. Finally, the stochastic seismic responses under the effect of earthquake randomness, including probabilistic settlement of pile and dynamic reliability, are presented.
2. Framework of Stochastic Dynamic Response Analysis
2.1. Probability Density Evolution Method
A pile foundation with various sources of uncertainty under the excitation of uncertain load can be regard as a multiple-degree-of-freedom stochastic dynamical system according to stochastic dynamics, and its balance equation can be written as follows:
where M and D are the mass and the damping matrix, respectively; R is the linear or nonlinear restoring force vector; F is the random excitation vector; and , and are the seismic acceleration, velocity, and displacement vectors of the system, respectively. is the parameter that reflects the uncertainties in the system and external excitation. It is a multi-dimensional random parameter vector with joint probability density function of , and is the sample realization of the random parameter vector . Only the uncertainty of seismic load was considered in the present study; thus, the only denotes the randomness of input ground motions, and it can be used to combine with stochastic ground motion model in the following section to quantify the randomness of earthquake.
The solution for the above equation Z(t) exists and depends on the basic random variable , time, and initial condition. The most refined stochastic seismic response analysis of a stochastic system is from the perspective of probability density function (PDF). According to the theory of description of random events, which is based on the principle of probability conservation, the generalized probability density evolution (GPDE) equation that governs the joint PDF of pile foundations can be written as follows [32,33,34,35,36]:
where is the joint PDF of Z and at time t; z is the realization of Z; and is the velocity in the condition of and can also be expressed as . The initial condition of the GPDE equation is as follows:
where denotes Dirac’s delta function, and is the initial value of Z. If only one seismic response of pile foundations is of interest in each stochastic analysis, the dimension of Equation (2) is reduced to a one-dimensional GPDE equation (q = 1):
By solving the equation, the instantaneous PDF of seismic response Z(t) can be acquired as follows:
where is the distribution space of . However, the closed-form solution of Equations (2) and (4) is only available for simple cases, for instance, the single-degree-of-freedom system. For the most complicated systems, the closed-form solution of the GPDE equation is difficult to obtain because it is difficult and sometimes even impossible to acquire the analytical solution for the seismic response of multidimensional nonlinear system under seismic excitation [36,37,38]. A numerical strategy, such as the finite difference method [34,36], is consequently usually employed to solve the GPDE equation to obtain the stochastic seismic results of the system. More information about the solving process can be found in Li and Chen [36].
By combining the equivalent extreme-value event and the first-passage probability [39,40] with the GPDE equation, the PDF and cumulative distribution function (CDF) of the extreme value of the seismic responses of a system can also be obtained and, thus, can be used to analyze the seismic reliability of pile foundations.
2.2. Quantification of Randomness of Input Ground Motions
The randomness of seismic load is always quantified by a set of ground motions selected from an earthquake database or generated by stochastic ground motion models. However, it is difficult to select a suite of seismic records that can meet the requirement of the same local site conditions for stochastic analysis. As a consequence, stochastic seismic ground motion models are often used to generate a suite of artificial seismic ground motions, that can easily meet some requirements of site conditions, for the stochastic seismic analysis of various structural systems. In the present study, a random-function-based spectral representation method [34,41,42], combined with a design spectrum in Chinese seismic code, was used to generate 144 fully non-stationary synthetic motions for the stochastic seismic response analysis of the pile foundation in the present study. Using this method, the fully non-stationary stochastic ground motions can be modeled as follows:
where is the evolutionary power spectral density function; and is the frequency interval; t is the time; and is a set of standard orthogonal random variable that can be defined as the function of basic random variables based on the theory of stochastic function [41]:
where is a basic random variable satisfying the uniform distribution in the interval [−π, π].
To account for the nonstationary characteristics of amplitude and frequency, the evolutionary power spectral density function needs to add an intensity modulation function:
where is the power spectral density function that has not considered the nonstationary characteristics of amplitude and frequency; f(t) is the intensity modulation function; c is the time of peak value; and d is the shape control index of f(t).
To generate a set of fully non-stationary random ground motions consistent with the target seismic response spectrum, the power spectral density function that is transformed from the response spectrum in the Chinese seismic code [43] is utilized based on the following transforming equation [44]:
where is the absolute acceleration response spectrum with natural frequency and damping ratio ; is the natural vibration period of single-degree-of-freedom structure; is the duration of earthquake; and is the exceeding probability of response spectrum.
In the Chinese seismic code [43], the seismic response spectrum can be determined as follows:
where is the natural period of system; is the gravitational acceleration; is the natural period of site; is the maximum value of seismic influence coefficient; is the damping adjustment coefficient; is the slope adjustment coefficient; and is the attenuation index. , and can be determined as follows:
The error ratio between the standard response spectrum and the average response spectrum of generated stochastic ground motions can be defined as the following fitting error:
where is the standard response spectrum and is the average response spectrum of generated stochastic ground motions, respectively. The error ratio is controlled to be less than 0.05 during the generation of stochastic ground motions [41,42]. If the error is larger than 0.05, the following response spectrum correction formula can be used to perform a series of iteration until the error is less than 0.05 [41,42]:
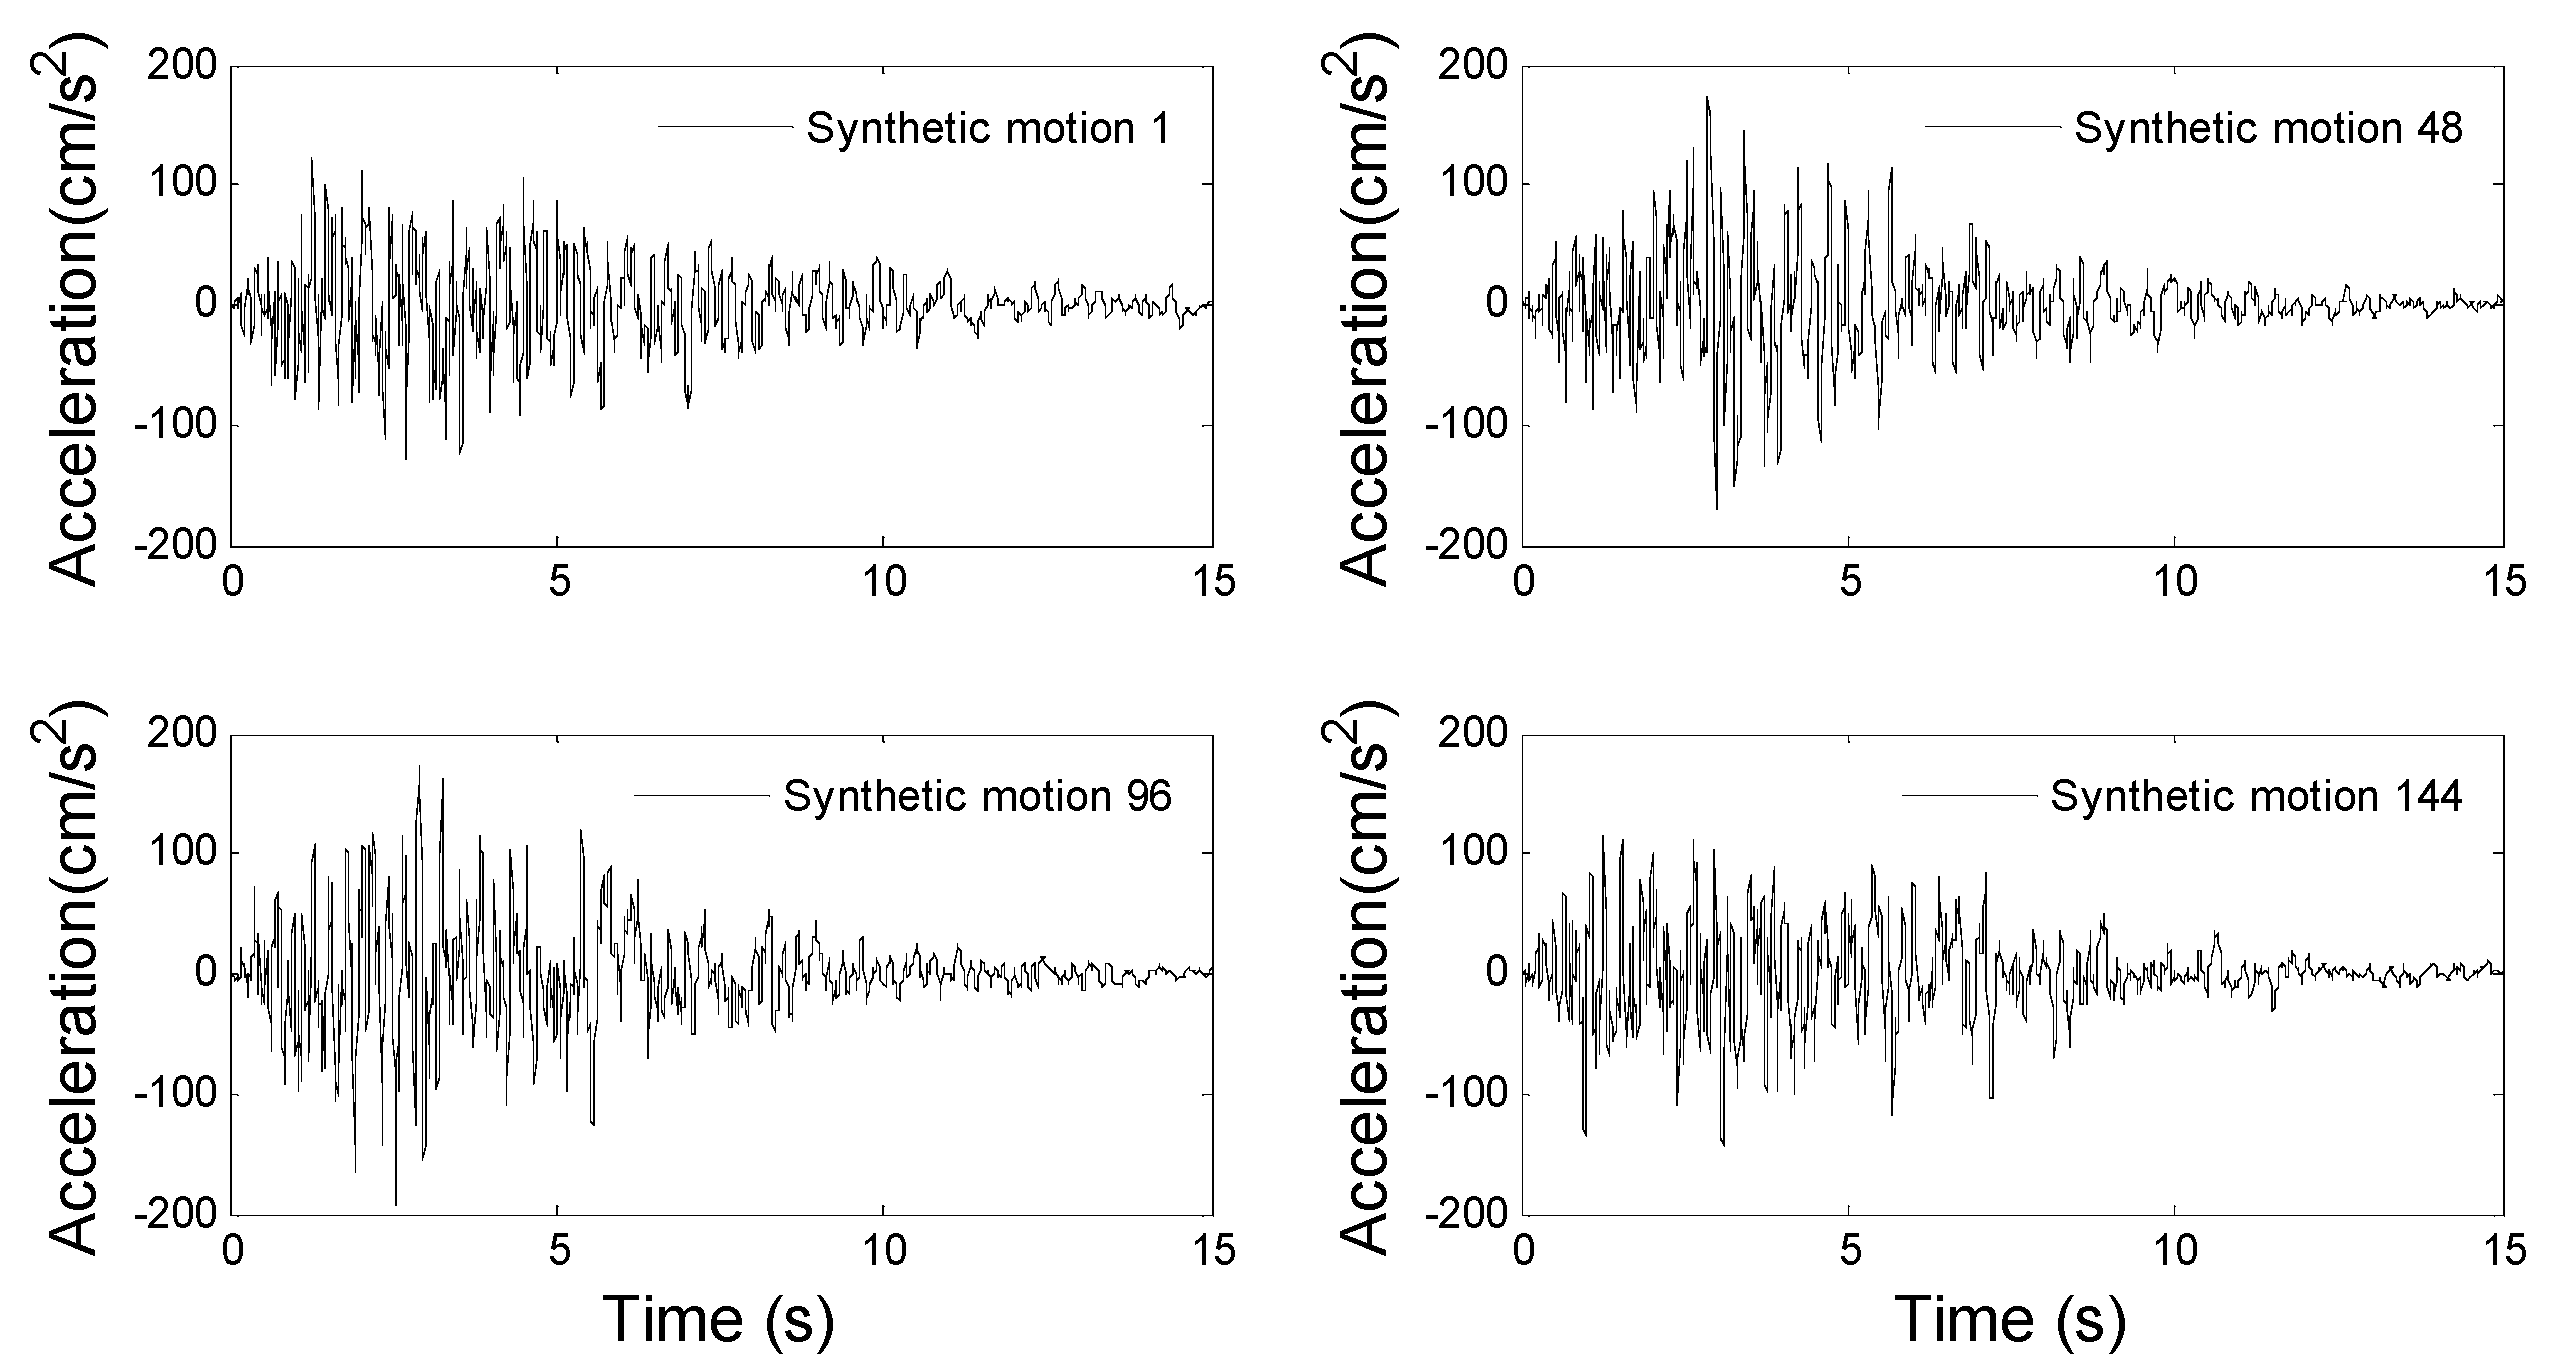
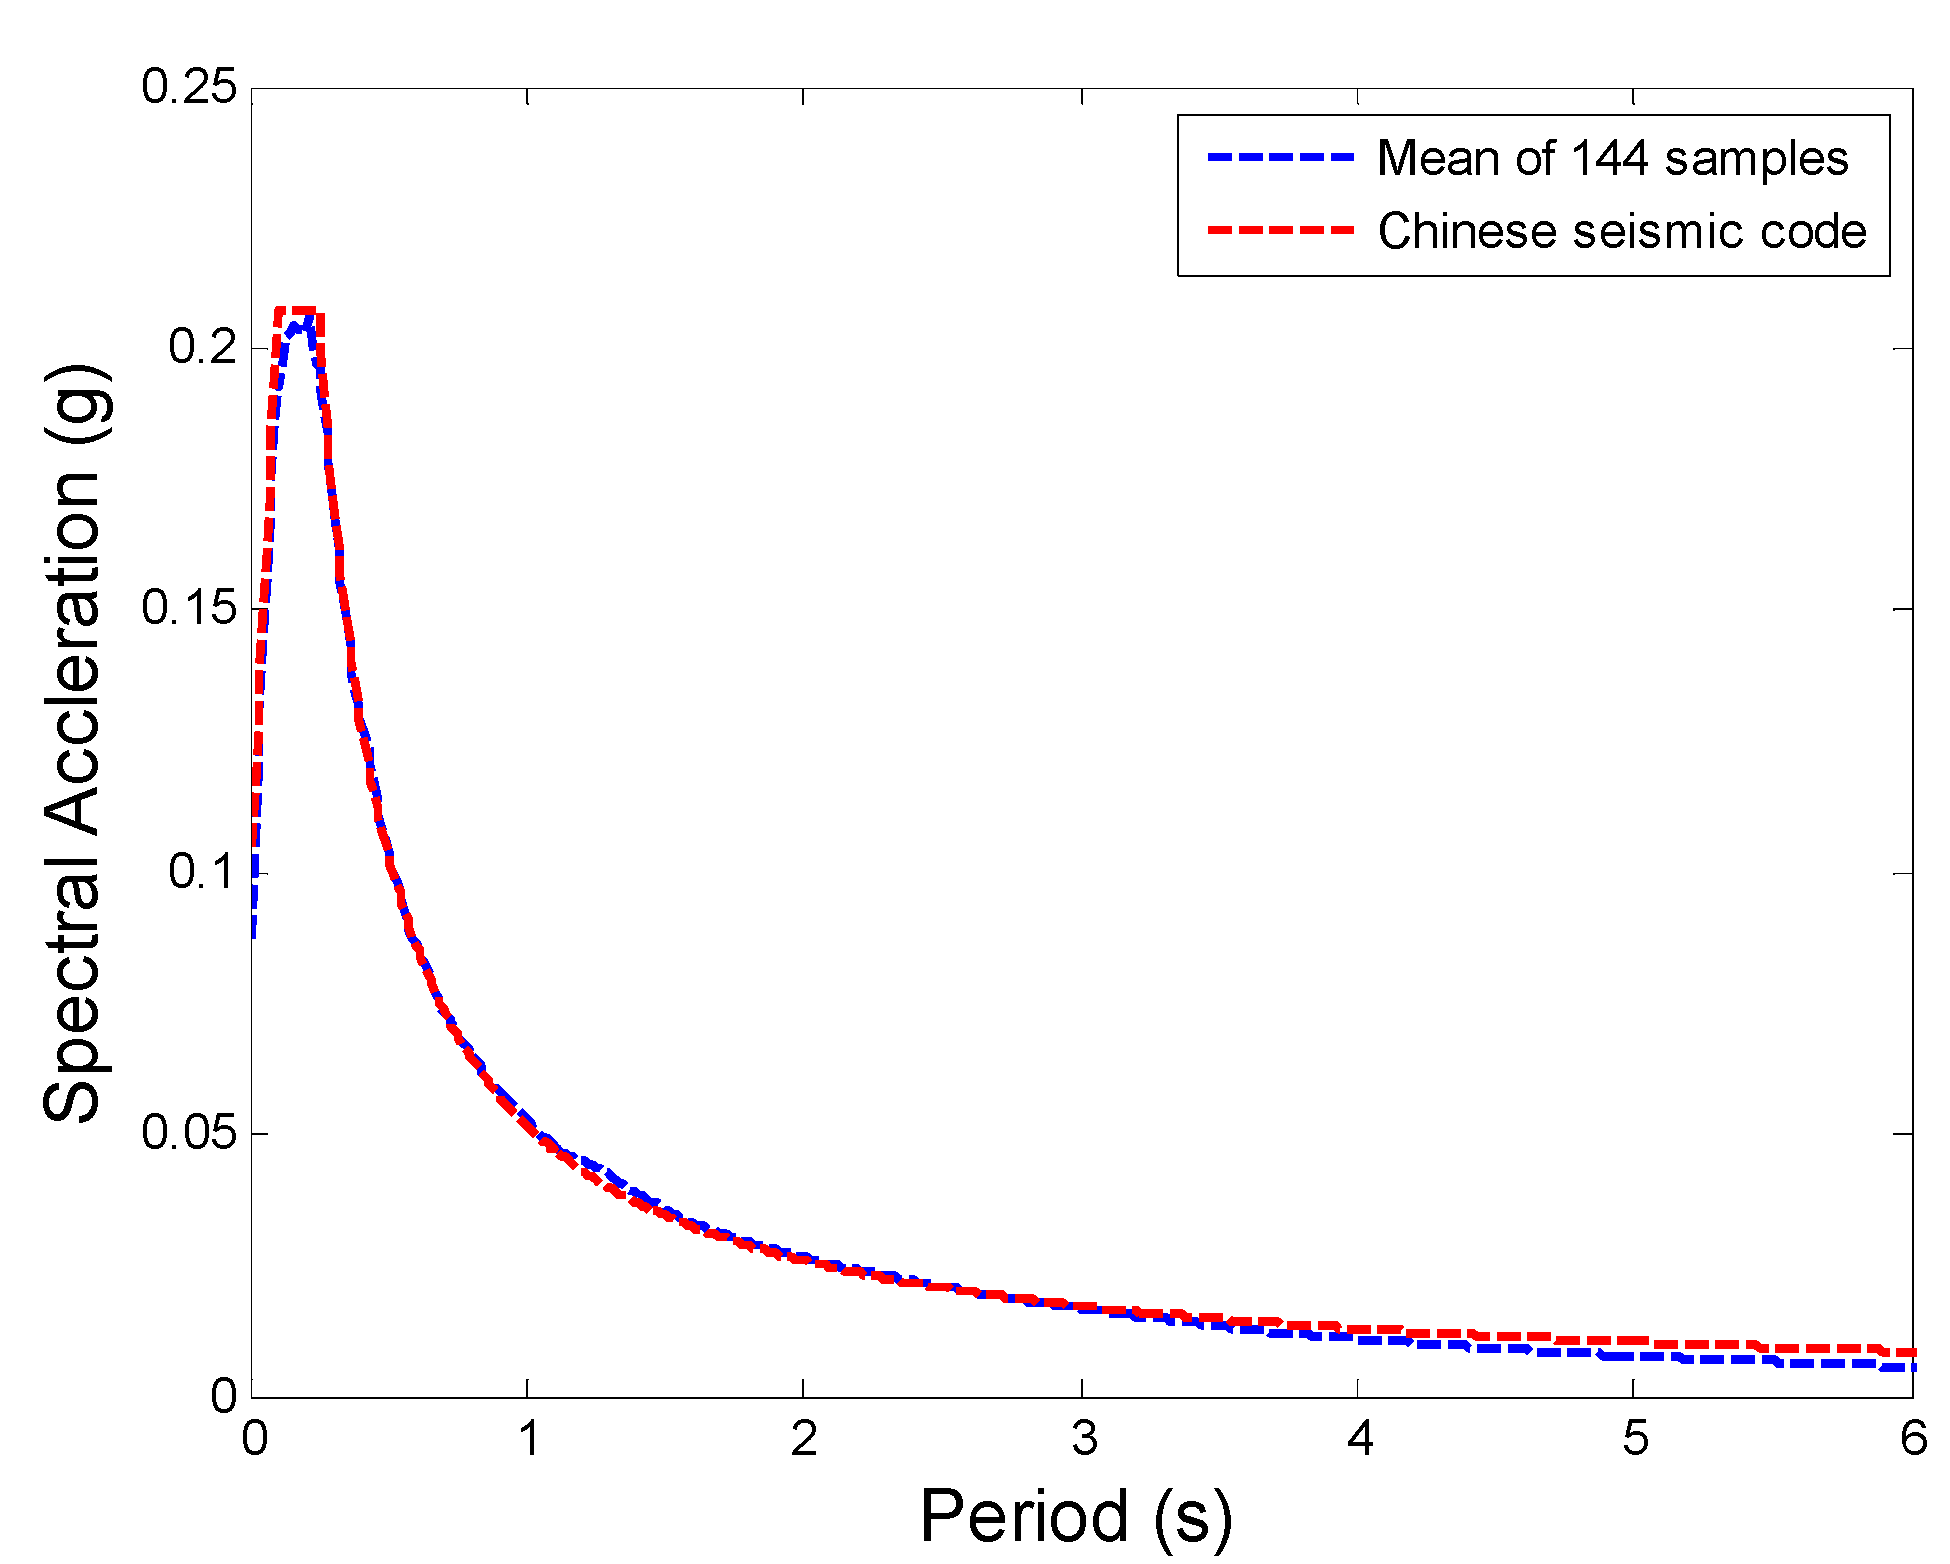
With the above process, a set of fully non-stationary stochastic ground motions that are consistent with the target seismic responses spectrum in the Chinese seismic code can be generated to quantify the randomness of earthquake. To reflect local site effect on the seismic ground motions, the seismic response spectrum of a site type similar to the site where the adopted RC pile is located is used to acquire the power spectral density function for the generation of seismic ground motions, because the seismic response spectrum (Equation (10)) has already considered site effect in the Chinese seismic code. In the present study, a suite of seismic ground motions consisting of 144 acceleration time histories with a mean peak ground acceleration of 0.1 g are generated to quantify the randomness of input seismic ground motions. Figure 1 presents four typical generated acceleration time histories, and it shows that different ground motions have different intensities and spectral characteristics. Figure 2 shows the comparison between the average response spectrum of 144 stochastic ground motions and the target standard response spectrum in the Chinese seismic code [43]. The relatively good consistency between these two lines validates the reasonability of the generated seismic ground motions used in the present study.
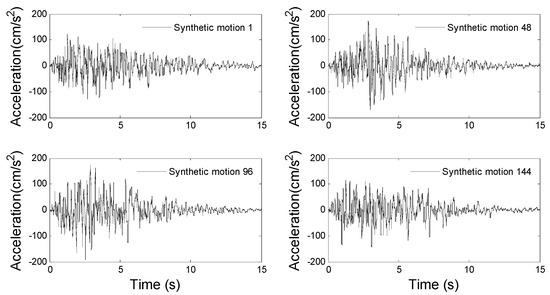
Figure 1.
Four typical acceleration time histories generated in the present study.
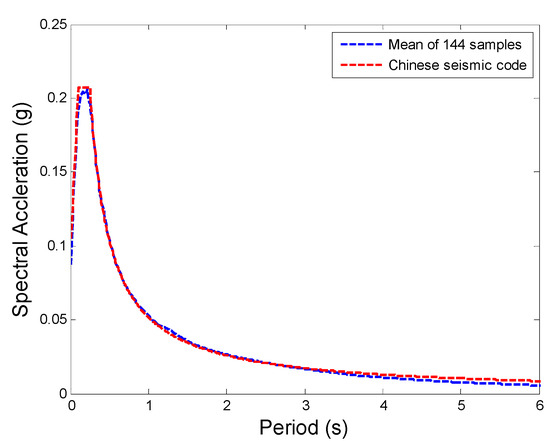
Figure 2.
Comparison of the average response spectrum of 144 stochastic ground motions and the target standard response spectrum in the Chinese seismic code.
3. Model Development and Calibration
3.1. Three-Dimensional Finite Element Model
To illustrate the application of PDEM in the nonlinear stochastic seismic response analysis of RC piles, a large-diameter bored RC pile documented in the literature is adopted for the case study. It has to be noted that it is better to use the shaking table test results to calibrate the finite element model for the dynamic behavioral analysis of pile foundations. However, most of the shaking table tests of pile foundations have been conducted in model scale and cannot fully reflect the seismic behavior of prototype pile foundations. In addition, model-scale tests have usually neglected the characteristics of concrete and rebar by simply using elastic materials without rebars. Thus, to investigate the seismic behavior of full-scale pile foundations with consideration of site effect and the prototypical characteristics of soil, concrete, and rebar, the prototype concrete pile with field measurement results from the full-scale lateral loading tests in Huang et al. [27] is consequently adopted to calibrate and validate the three-dimensional finite element model of the RC pile developed in the present study; this is because cyclic horizontal load test can also be used to investigate the seismic behavior of pile [45,46,47]. The available experimental results from the full-scale horizontal loading tests are firstly used to calibrate the parameters of soil and the RC pile in the three-dimensional finite element model. Then, a suite of stochastic ground motions (144 stochastic ground motions described in Section 2.2) is input into the numerical model for the nonlinear stochastic seismic response analysis.
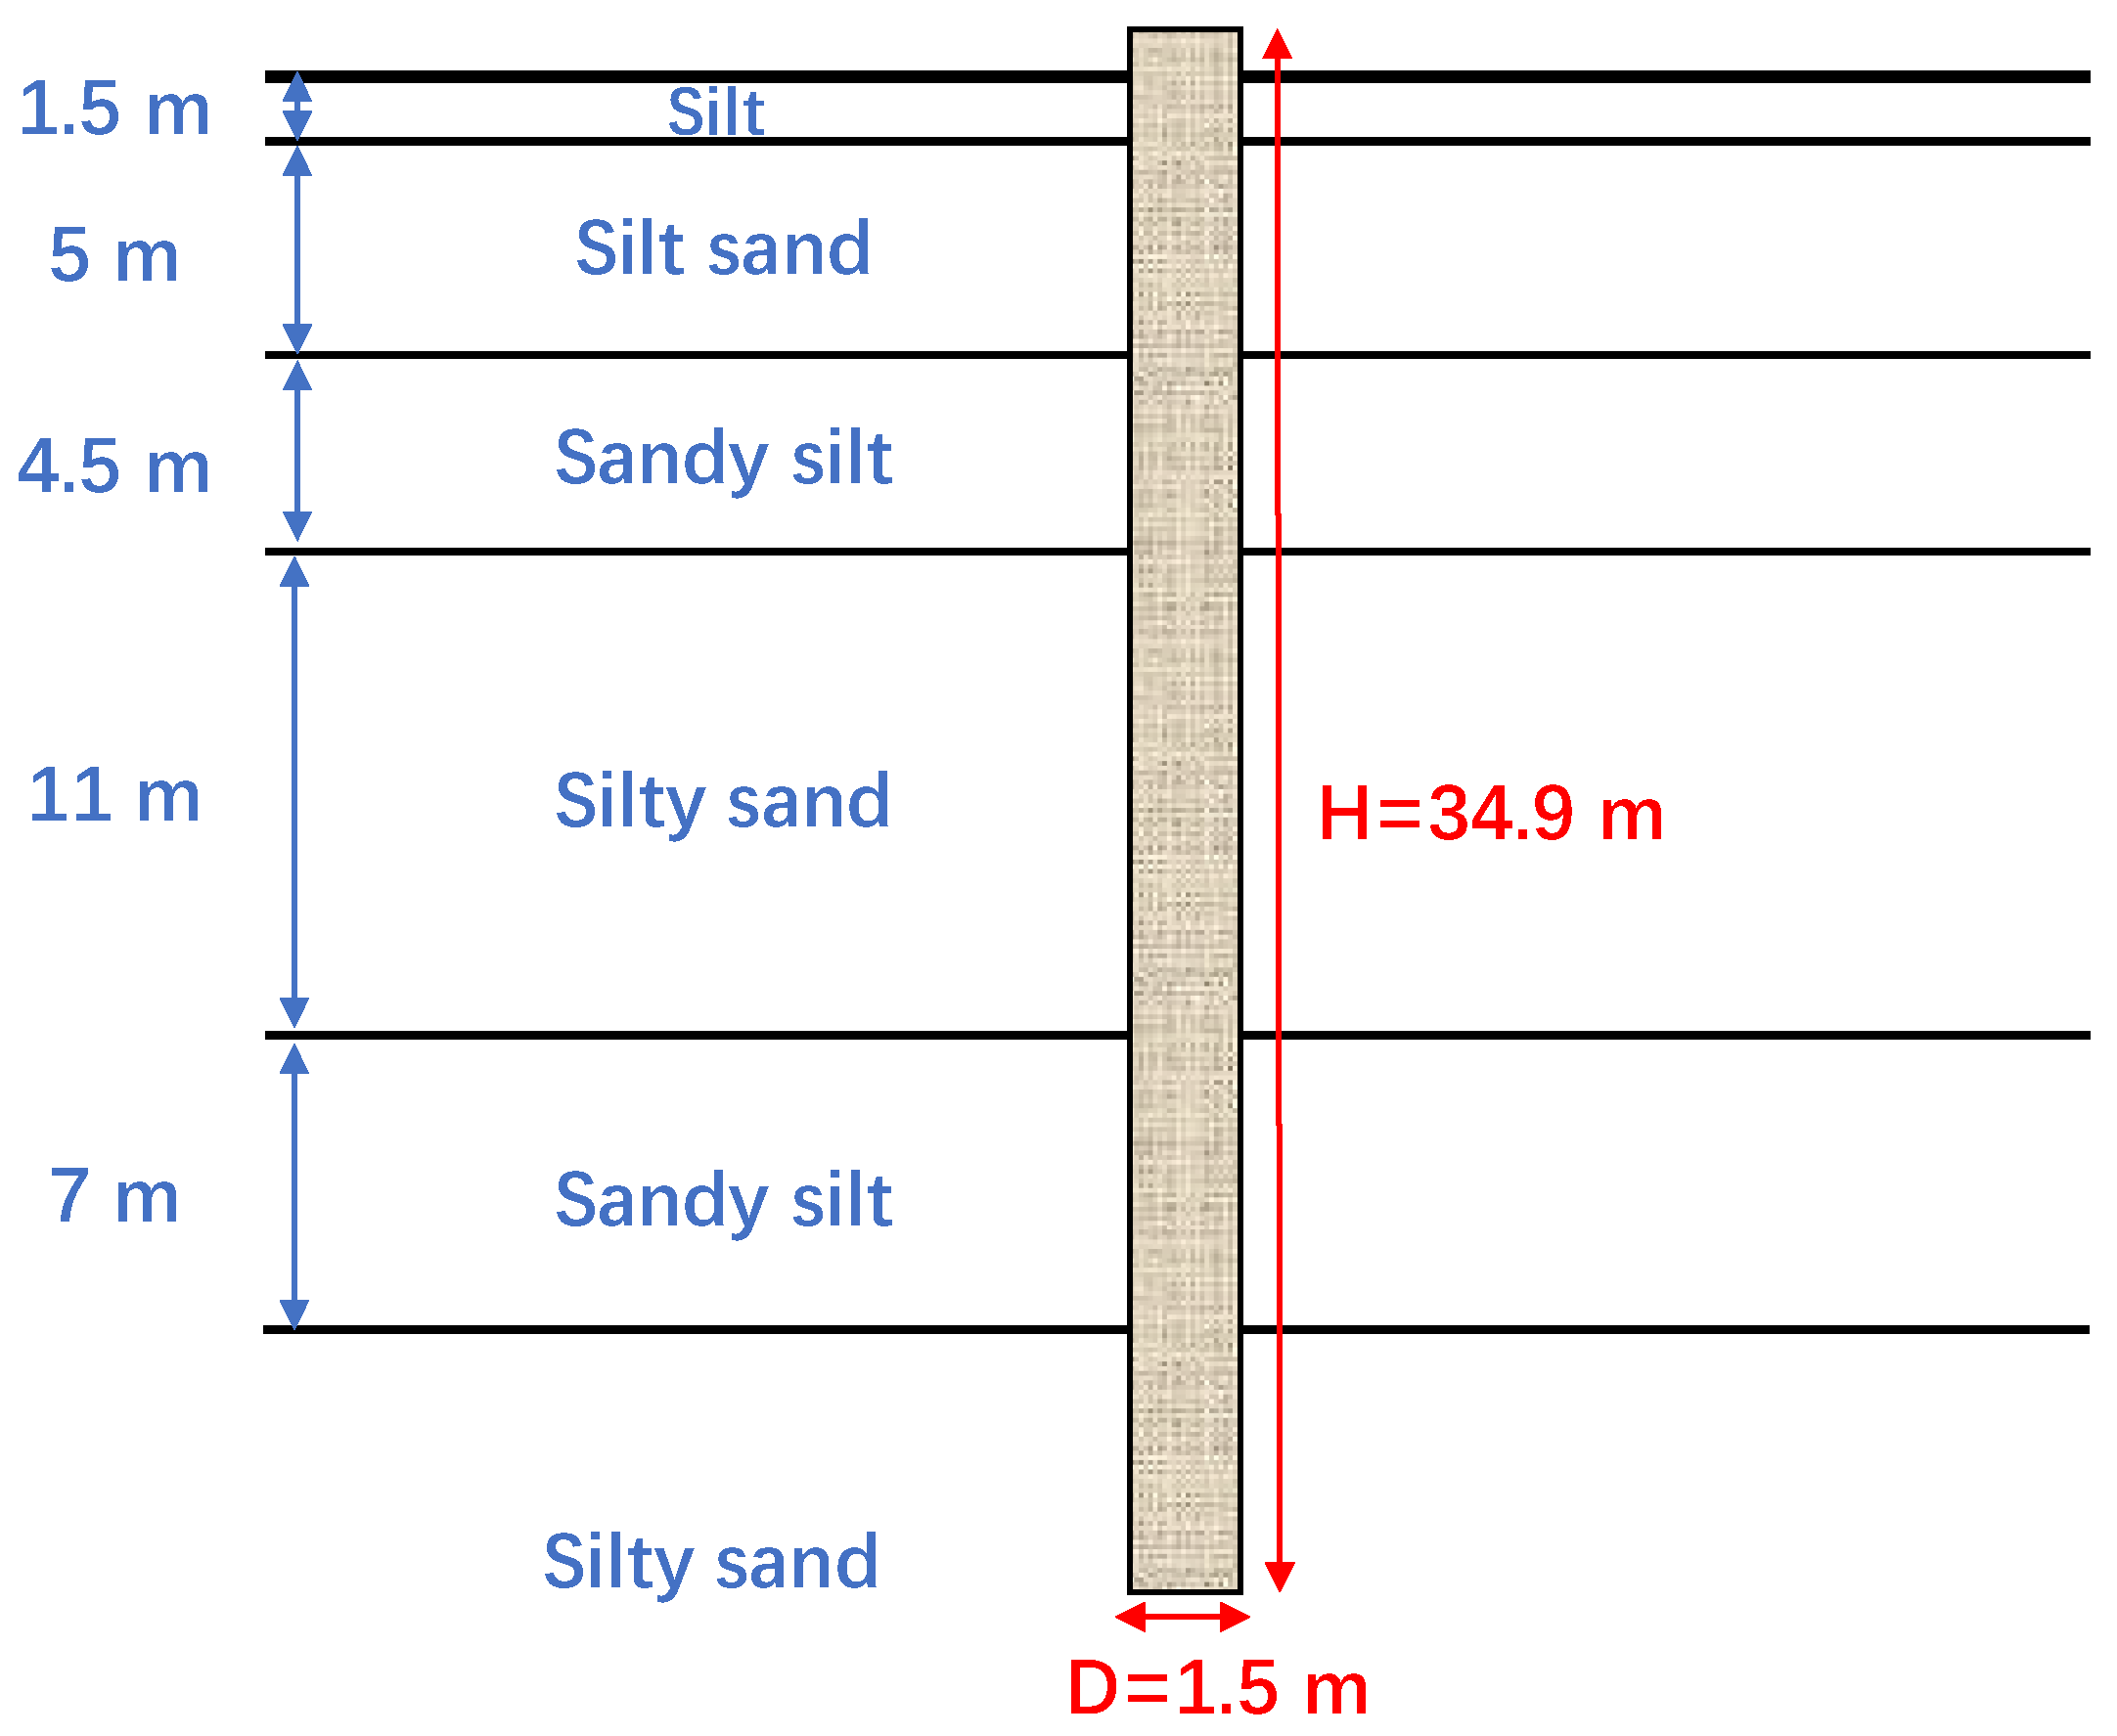
A set of full-scale lateral loading tests of bored and driven precast piles has been performed by Huang et al. [27]. In the present study, the results of the horizontal loading test of a single bored pile B7 are selected. Pile B7 is a large-diameter bored pile with a diameter of 1.5 m and a height of 34.9 m, in which 0.9 m of the pile is above the ground level. The 5232 steel bars are arranged in two rings to reinforce the concrete and the corresponding reinforcement ratio is 0.025. According to the site investigation results in the document of Huang et al. [27], the subsoil within 80 m depth can generally be classified as silty sand with layers of sandy silt and can be classified into six layers, which is illustrated in Figure 3.
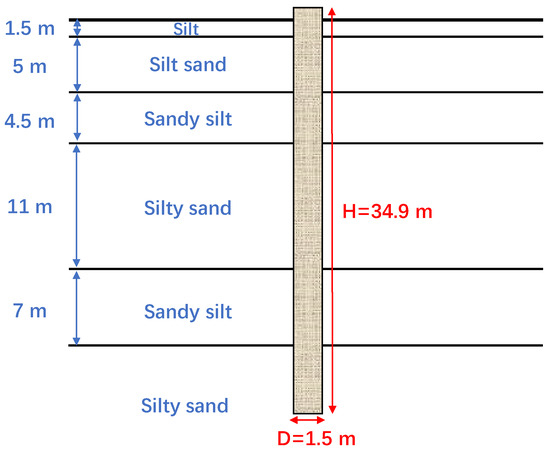
Figure 3.
A diagrammatic sketch of a soil foundation model for the numerical simulation in the present study [25,27].
In the numerical simulation, a linear elastic perfectly plastic model with the Mohr–Coulomb failure criterion and the flow rule of non-associated type is employed to characterize the nonlinear behavior of soil. This model requires few parameters as input data, and the parameters can be readily determined from conventional geotechnical tests. The main physical and mechanical parameters of the soil are listed in Table 1 based on the parameters provided in the studies by Huang et al. [27] and Conte et al. [25].

Table 1.
The physical parameters of soil properties [25,27].
To simulate the nonlinear behavior and the damage characteristics of concrete pile under external load, the concrete damaged plasticity (CDP) model is adopted. This model fully considers the anisotropy and stiffness recovery effect of concrete under both tension and compression states. On the one hand, tensile and compressive damage factors () are defined in this model to simulate the stiffness degradation of concrete under tension and compression states, respectively, which will be introduced by the stress–strain relationship of concrete in the next paragraph. On the other hand, the stiffness recovery factor is also set to simulate the recovery ability of concrete stiffness in the CDP model.
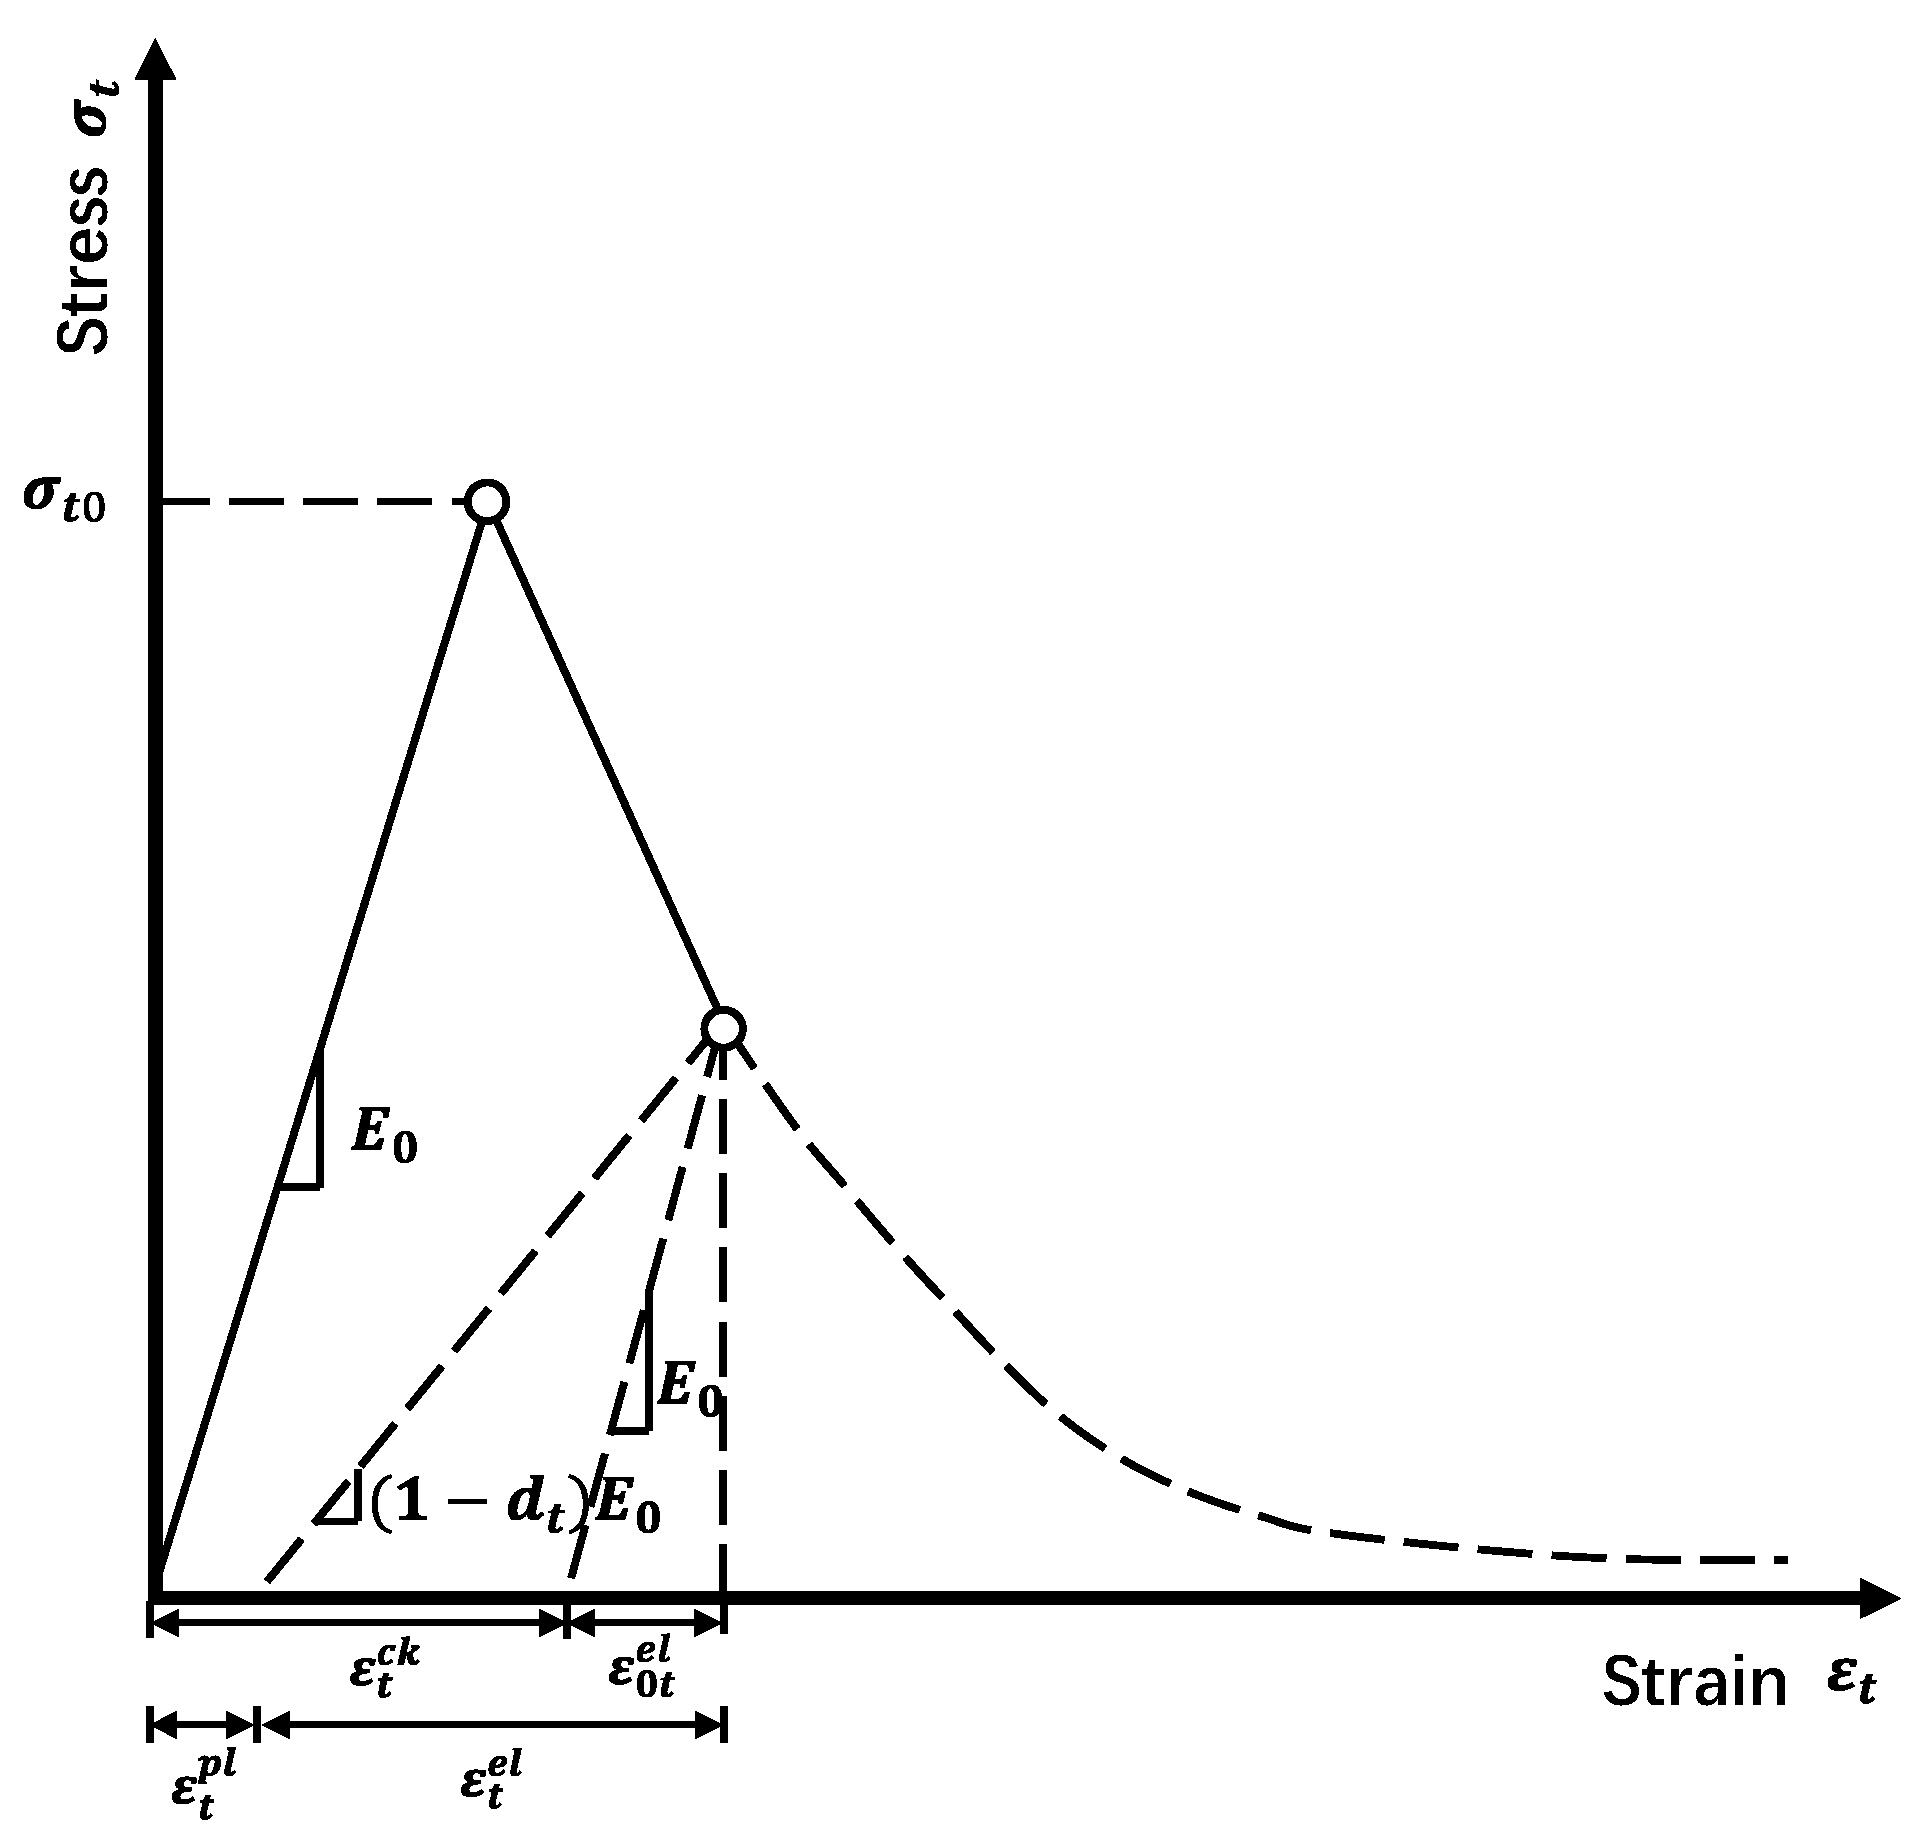
The stress–strain relationship of concrete under a tension condition is shown in Figure 4. When the stress exceeds the elastic limit stress σt0, it will enter the softening stage, and micro cracks will be formed in the concrete material, resulting in certain tensile damage. In the CDP model of concrete, the concrete tension damage characteristic can be characterized by the following stress–strain relationship:
where is the tension stress of concrete; is the tension strain of concrete; is the tensile damage factor; is the tension plastic strain; and is the initial elastic modulus of concrete. The tension crack strain that is needed for the input in the numerical simulation can be determined as follows:
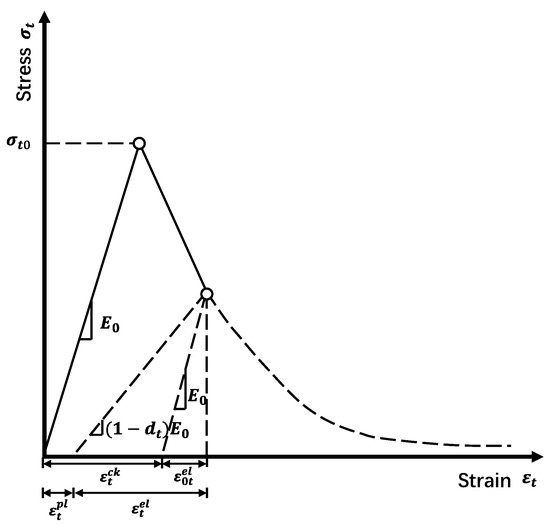
Figure 4.
Stress–strain relationship of concrete under the tension condition considered in the present study.
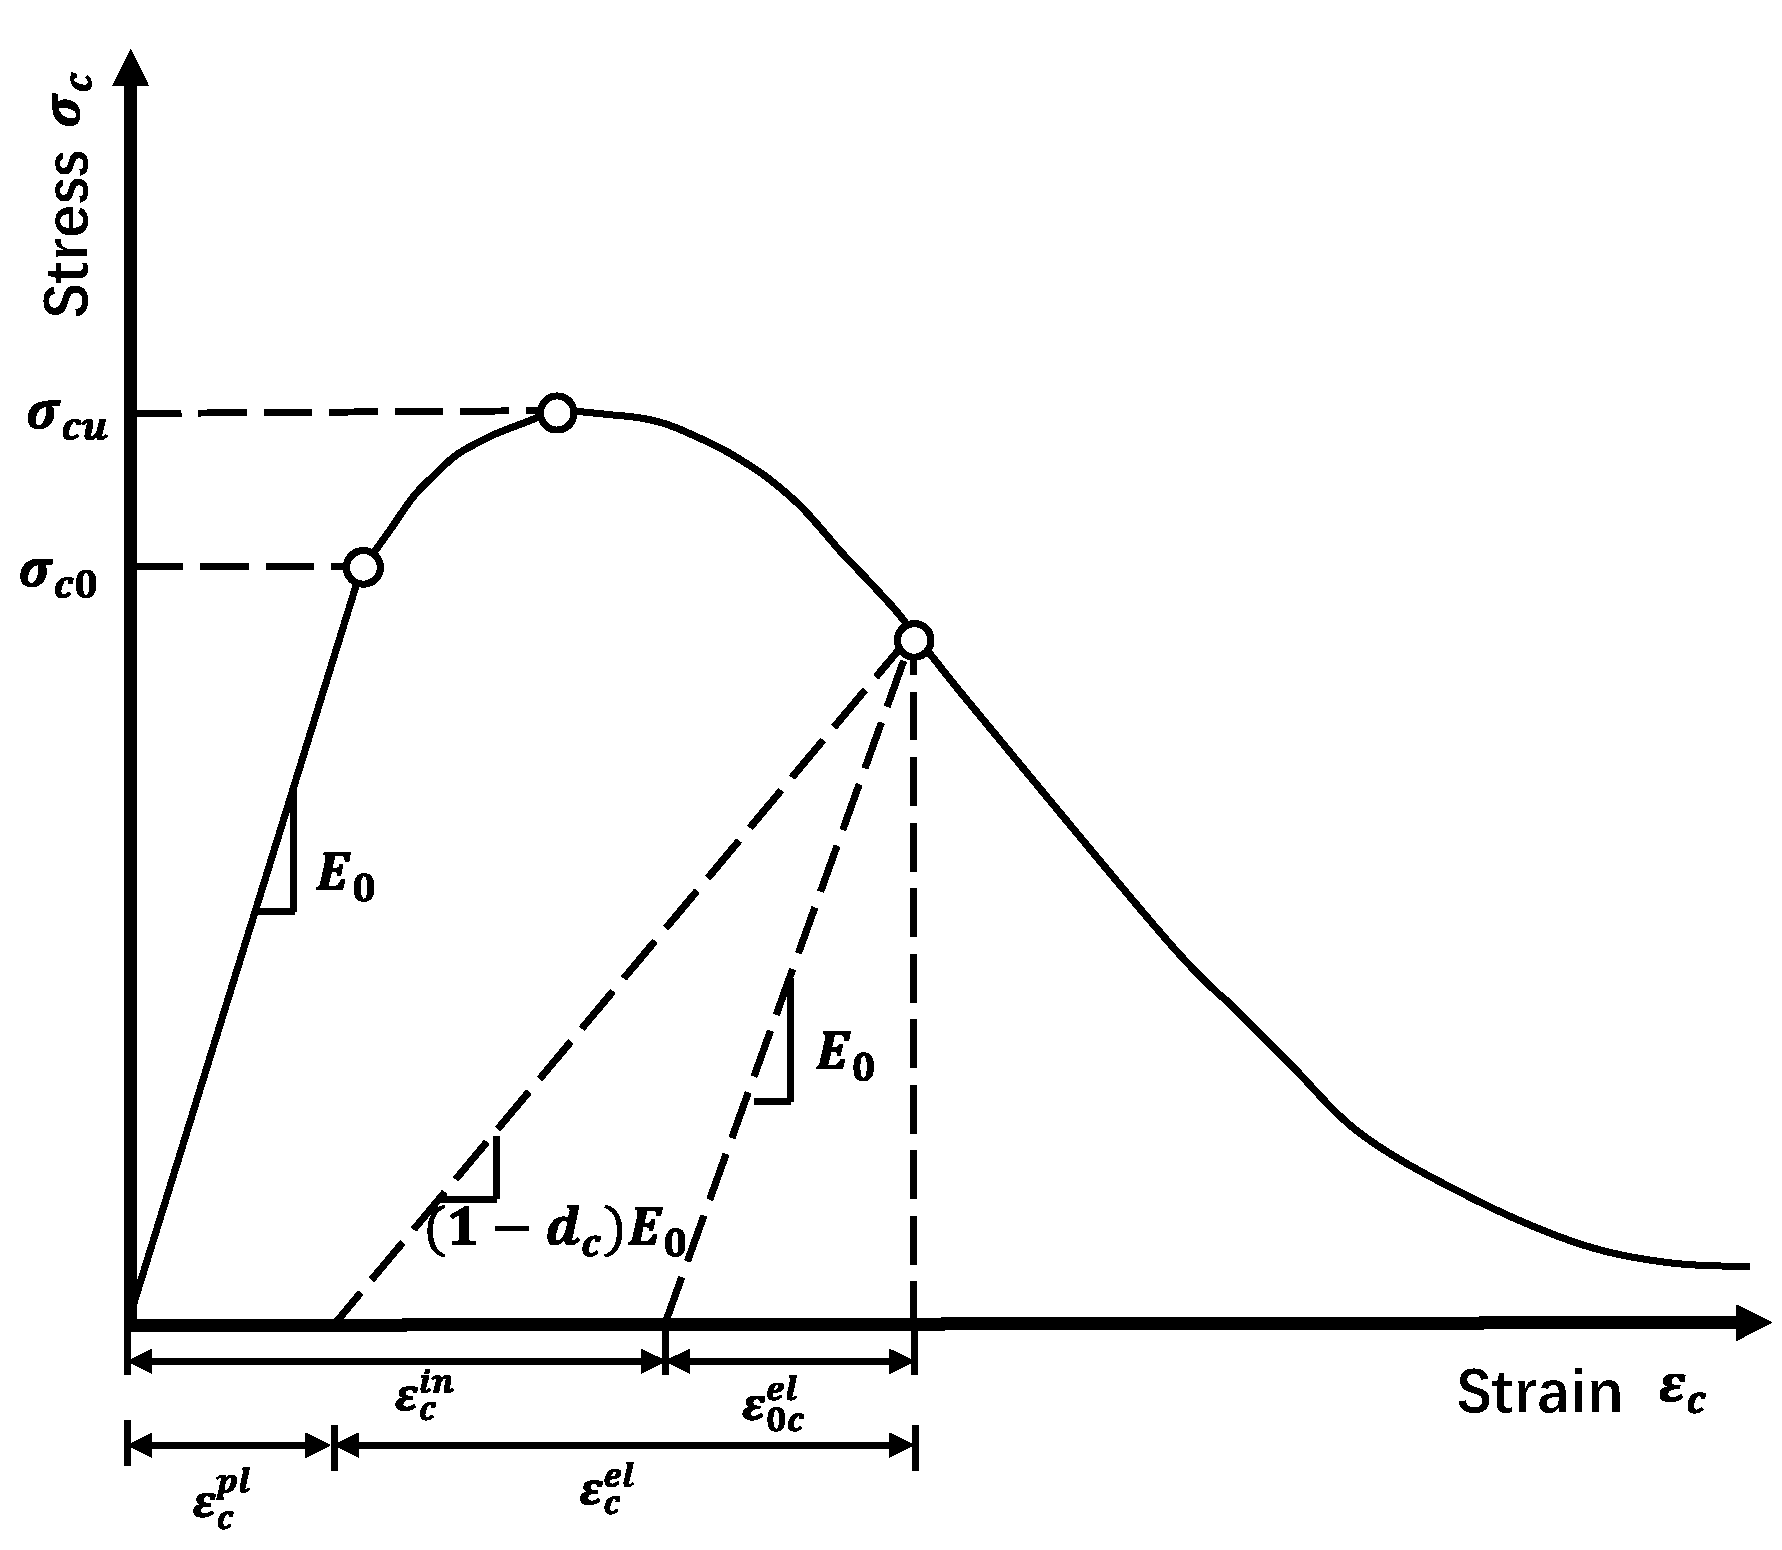
The stress–strain relationship of concrete under the compression condition considered in the present study is shown in Figure 5. When the stress exceeds the elastic limit stress σc0, it will enter the strengthening stage. Thereafter, the stress increases gradually until it exceeds the limit stress σcu, and it will enter the softening stage, and concrete compression damage will happen. The concrete compression damage characteristic can be characterized by the following stress–strain relationship:
where is the compression stress of concrete; is the compression strain of concrete; is the compressive damage factor; is the compression plastic strain; and is the initial elastic modulus of concrete. The compression inelastic strain input in the numerical models can be determined as follows:
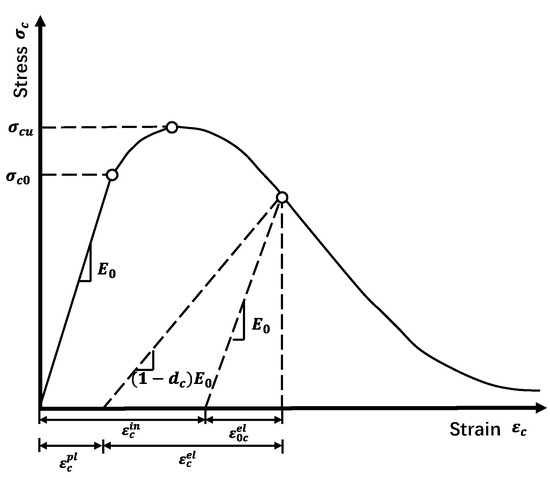
Figure 5.
Stress–strain relationship of concrete under the compression condition considered in the present study.
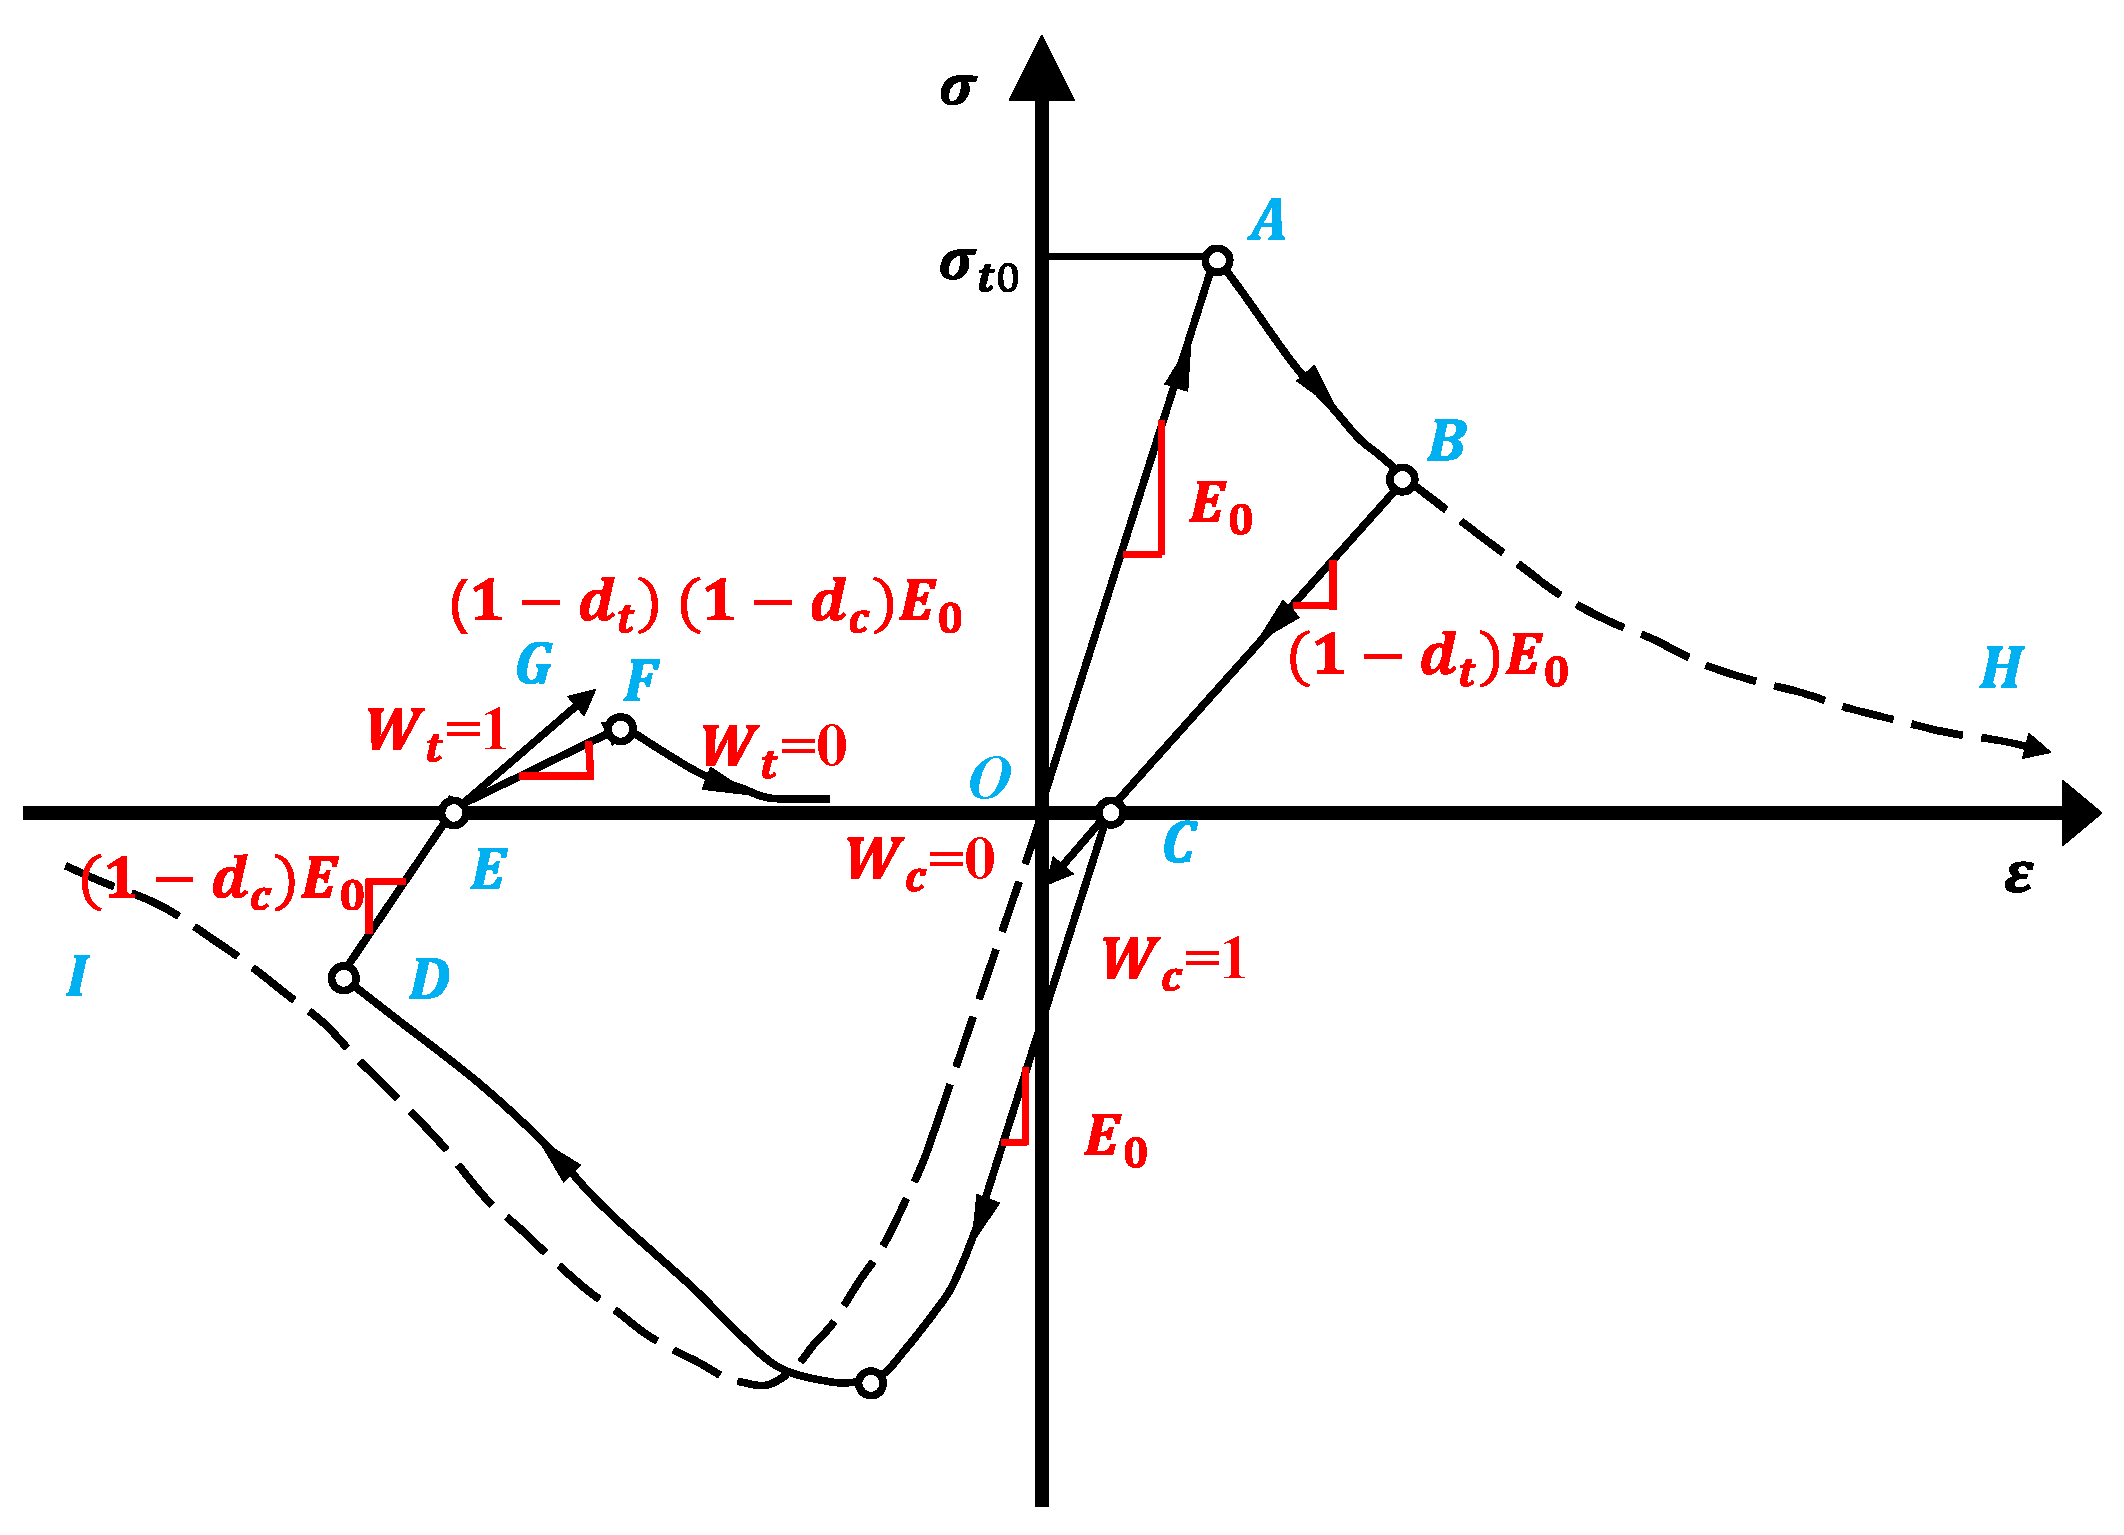
The CDP model under the tension–compression cyclic load considered in the present study is shown in Figure 6. The OABCDEF curve is on cyclic load, and the OABH and OI are the stress strain curves of uniaxial tension and uniaxial compression conditions respectively. The tension and compression stiffness recovery factors Wt and Wc are introduced to illustrate the CDP stress–strain relationship under the tension-compression load of the CDP model to, respectively, simulate the recovery ability of the tensile and the compressive stiffness of the concrete material under tension and compression cyclic loading. The concrete material will produce microcracks under tension, resulting in a reduction of its stiffness. At this time, when it is compressed, these microcracks will be closed again, and the compressive stiffness will recover (Wc = 1). On the contrary, when the concrete is compressed, it will produce crushing cracks, which will also reduce its stiffness. Meanwhile, even if it is under reverse tension, these crushing cracks still exist, and the tensile stiffness will not recover (Wt = 0). If tensile stiffness is assumed to be completely recovered (Wt = 1), the stress–strain relationship will become the curve OABCDEG, not the OABCDEF curve. More detailed information about the selected CDP model for the concrete pile used in this study can be found in the Abaqus manuals [48]. In the present study, the specific stress–stain relationship for concrete in the Code for the design of concrete structures (GB50010–2010) [49] is used to combine with the above CDP model to calculate the input parameters for the numerical simulation of RC pile in Abaqus. Other parameters of concrete are consistent with those used by Huang et al. [27], namely Young’s modulus Ec = 32,173 MPa, Poisson’s ratio υc = 0.2, compressive strength fc = 27.5 MPa, and tensile strength fct = 2.7 MPa.
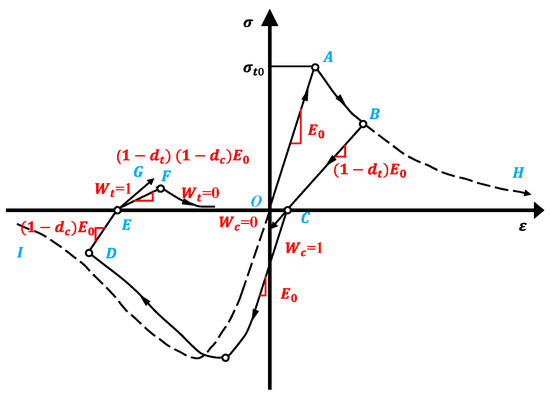
Figure 6.
The concrete damaged plasticity model for the reinforced concrete pile.
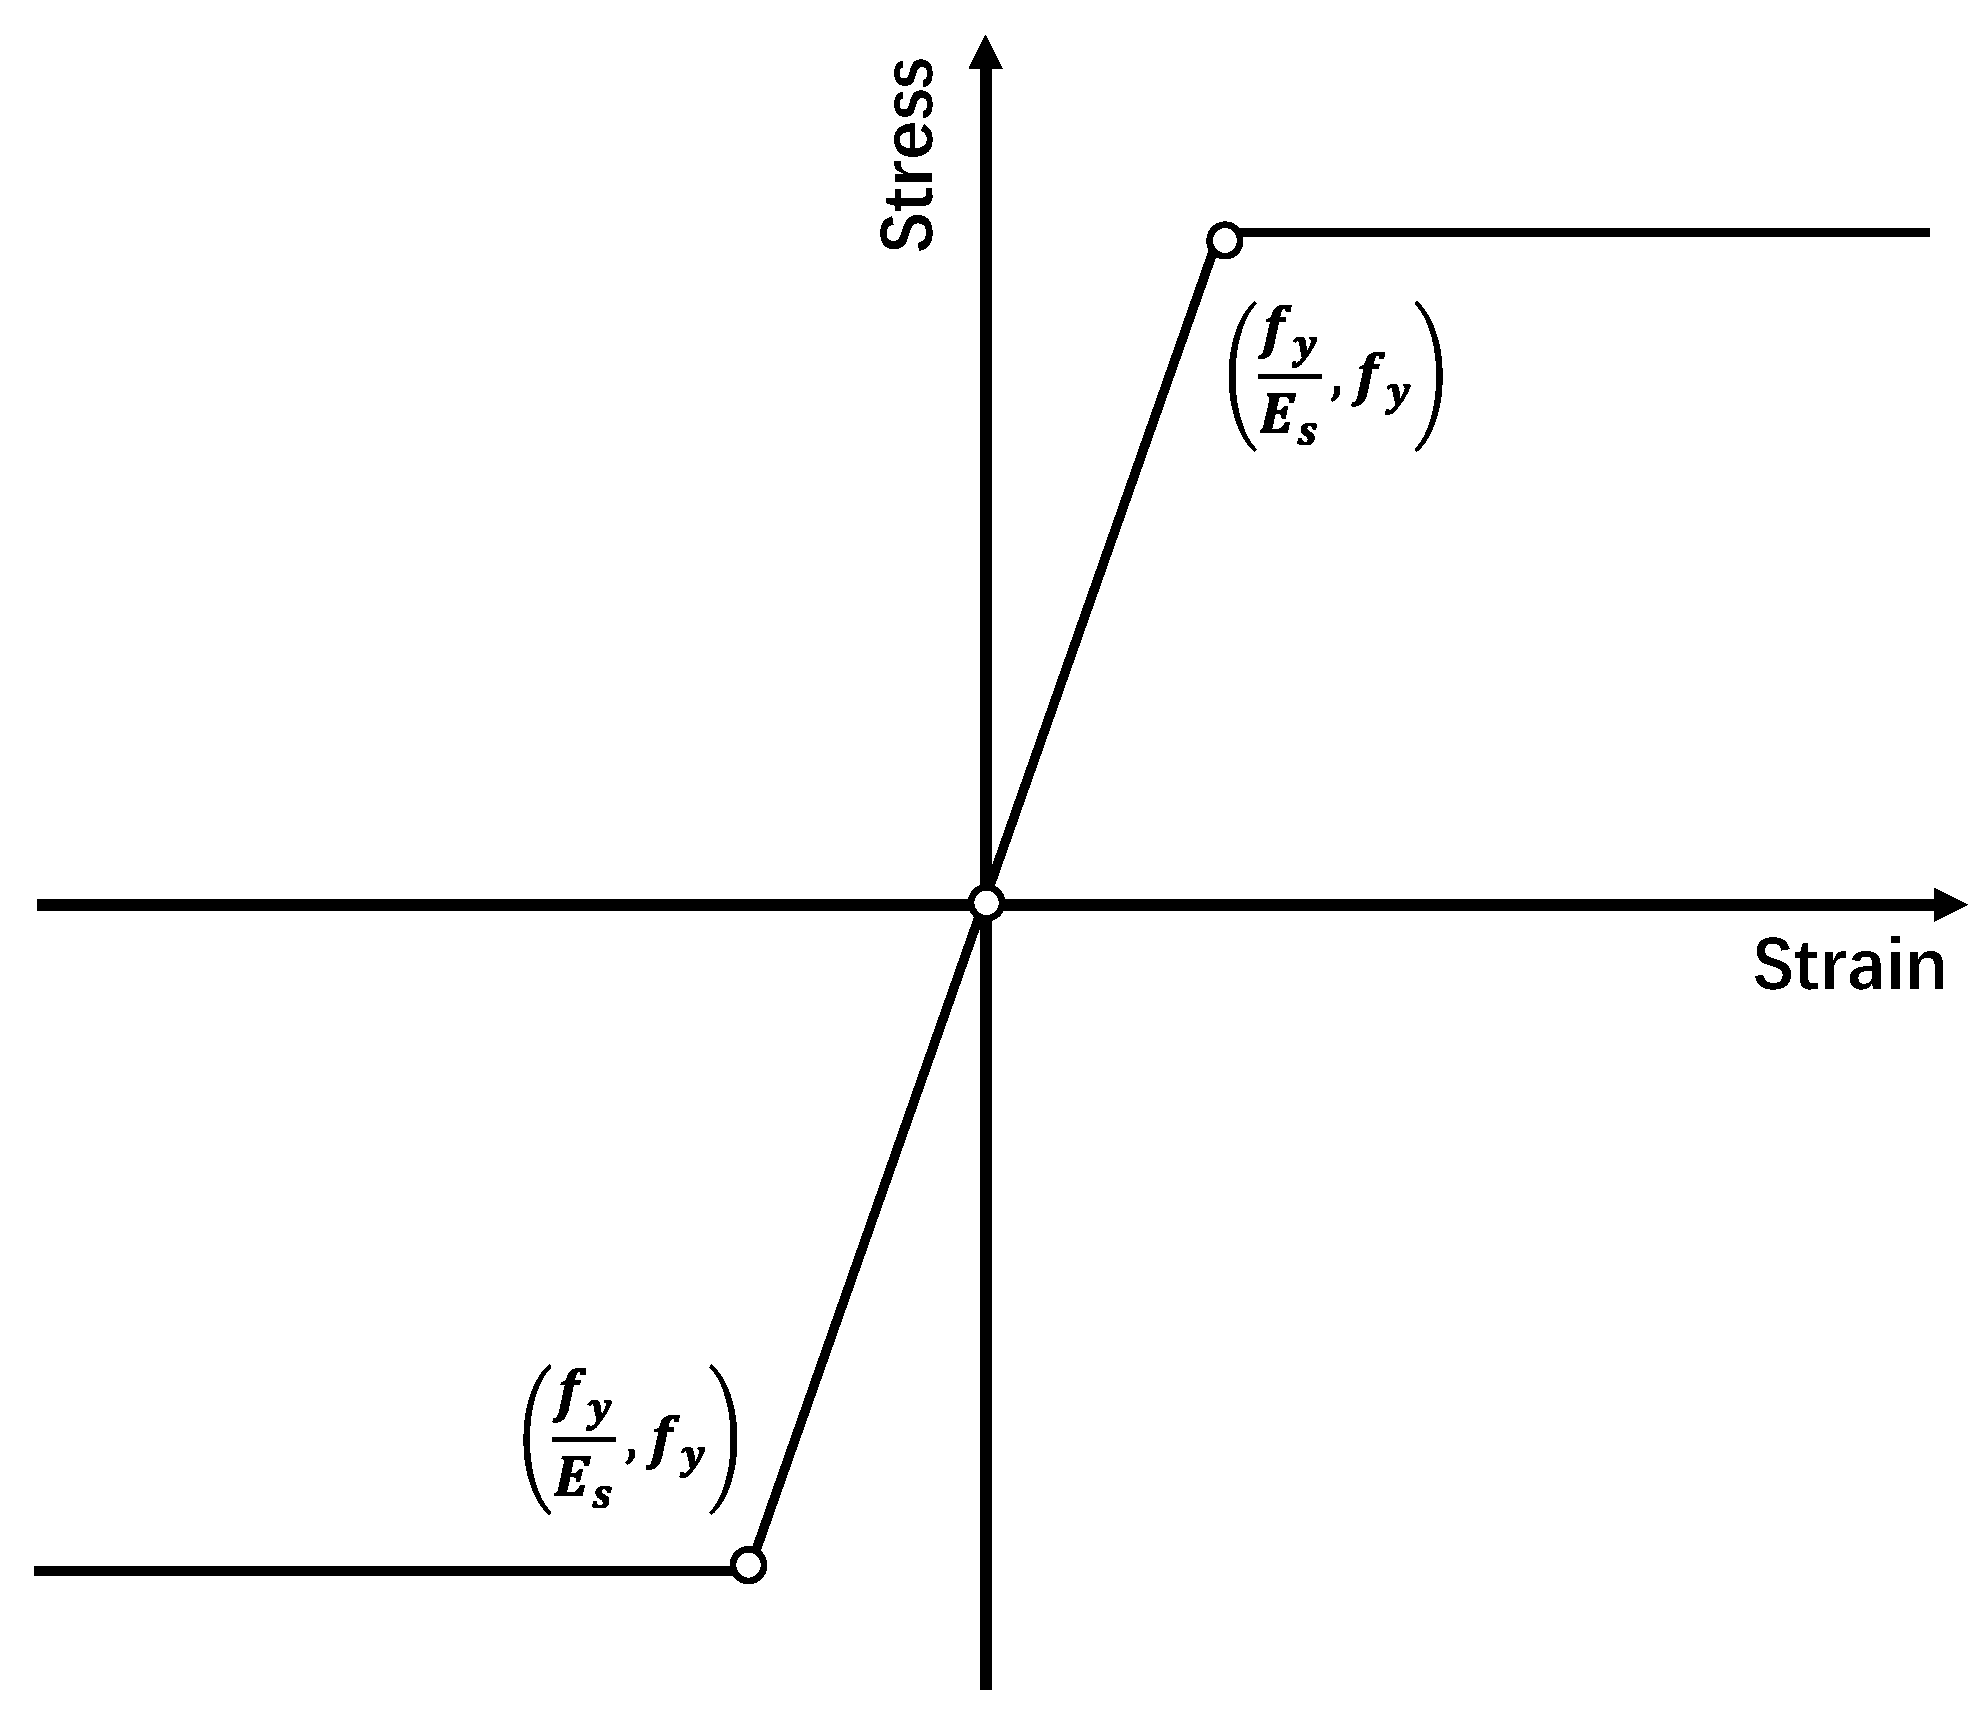
The behavior of the steel bars is characterized by the elastic perfectly plastic constitutive model, which is the same as the model in Conte et al. [25] and is shown in Figure 7. The main parameters of steel bars used in the numerical simulation are Young’s modulus Es = 210,000 MPa and yield strength fy = 471 Mpa. The tension and compression behavior of the steel bars is identical in this model. The steel bars are embedded into the concrete pile and are assumed to be perfectly bonded to the surrounding concrete.
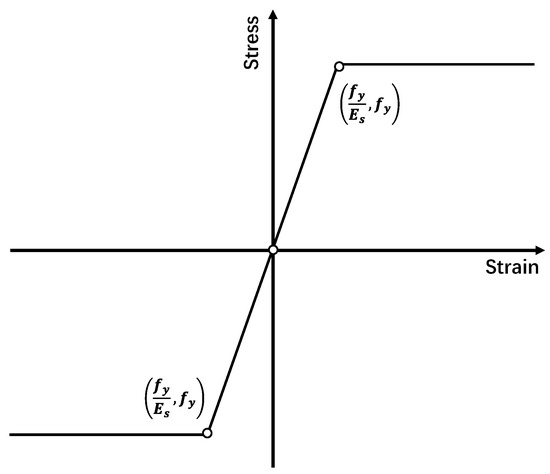
Figure 7.
Stress–strain relationship of steel bars.
The complicated dynamic interaction between the RC pile and soil is considered as the “surface to surface” type in the Abaqus software with the shear-strength criterion of Mohr–Coulomb [25,48] in the 3D numerical model, in which slip and gap can occur at the pile–soil interface.
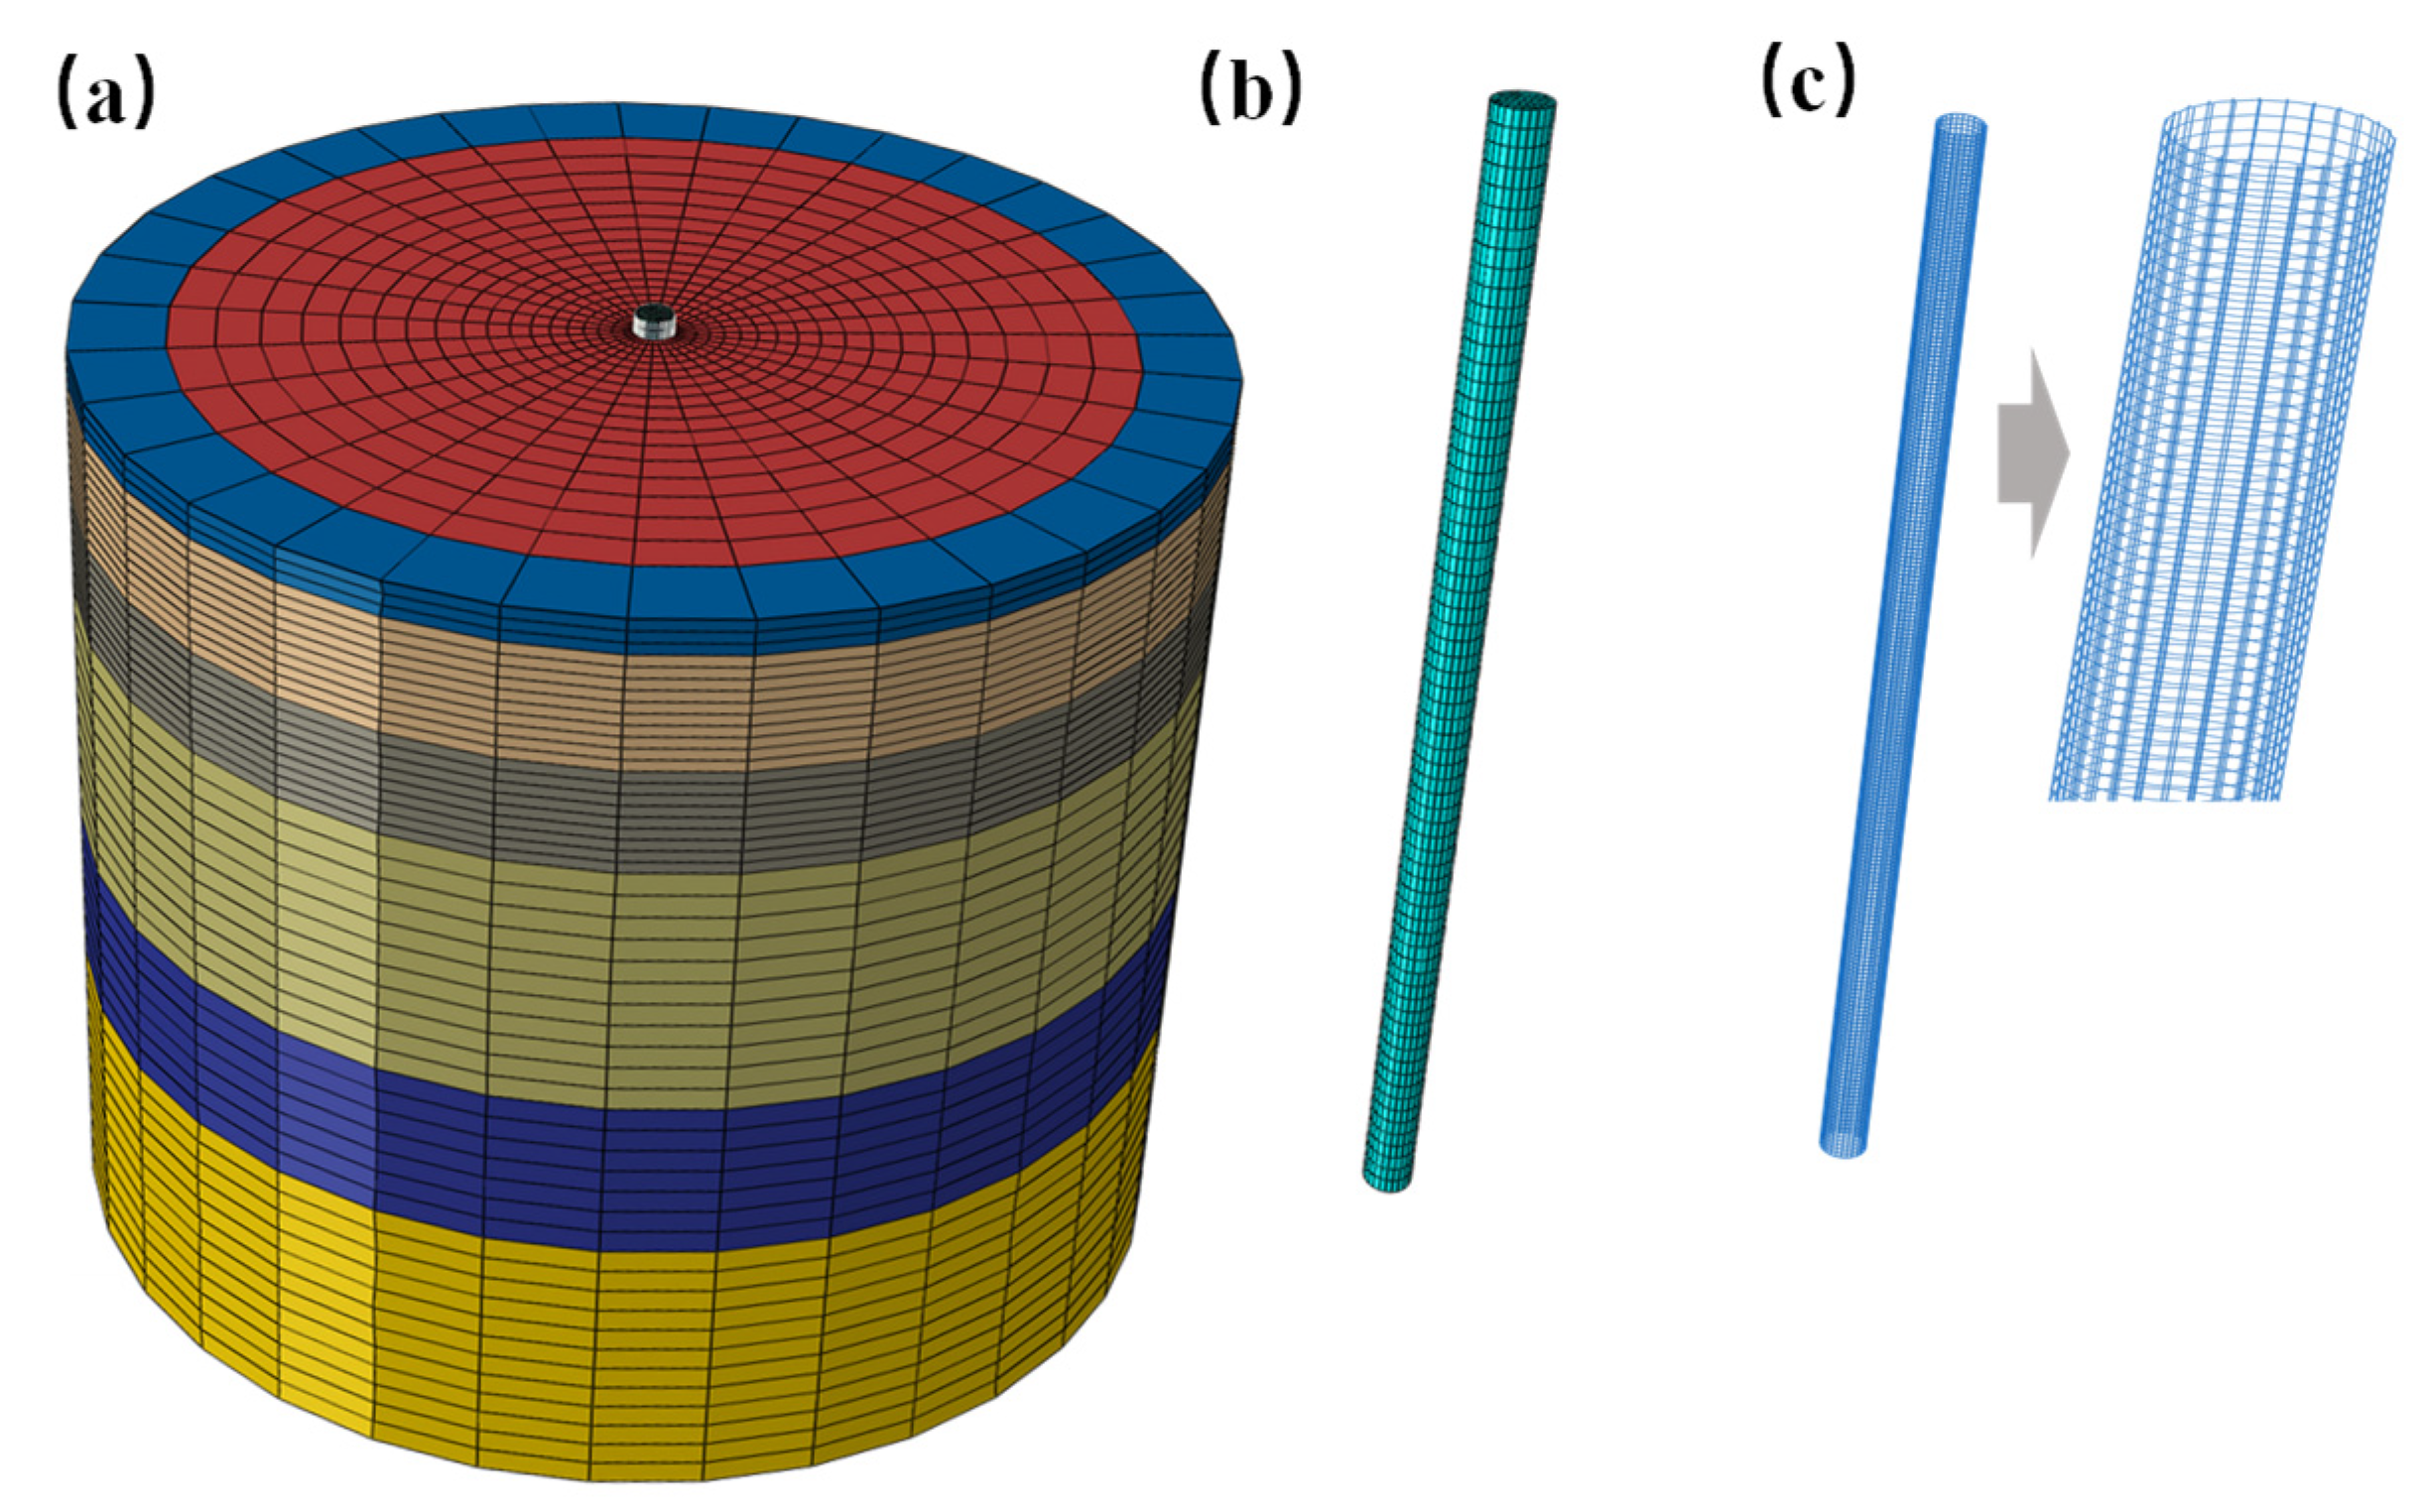
The finite element meshes of soil, RC pile, and reinforcement are shown in Figure 8. A 45 m-depth soil domain with a diameter of 48 m (about 32D, where D is the pile diameter) is constructed to avoid the boundary effect from the bottom and the lateral sides. The 34,320, 5183, and 3728 finite elements are generated in the soil domain, the pile, and the rebar, respectively. Based on the above model, the nonlinear behavior of soil, the concrete damaged plasticity, the steel yielding of the pile, and the occurrence of slip and gap at the soil–pile interface can all be properly and comprehensively simulated.
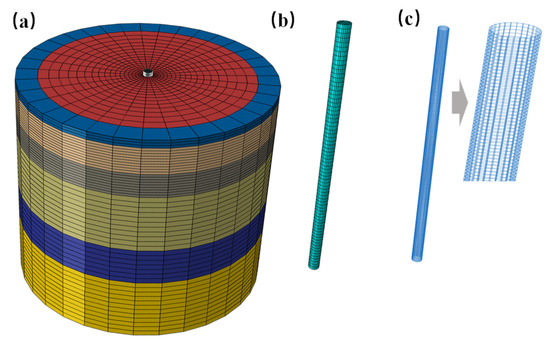
Figure 8.
Finite element model of (a) soil foundation, (b) pile, and (c) reinforcement.
To extend this model to earthquake scenarios for the stochastic dynamic analysis, the infinite elements are employed in the Abaqus to reduce the seismic wave refection and boundary effect during the dynamic analyses. To model the vertical load on the RC pile and the inertial effect from the superstructure, a mass block with a volume of 8 m3 and a density of 36,750 kg/m3 is assumed and tied at the pile head to simulate a vertical load of 2940 kN and an inertial effect in earthquake cases.
3.2. Model Calibration with Field Lateral Load Tests
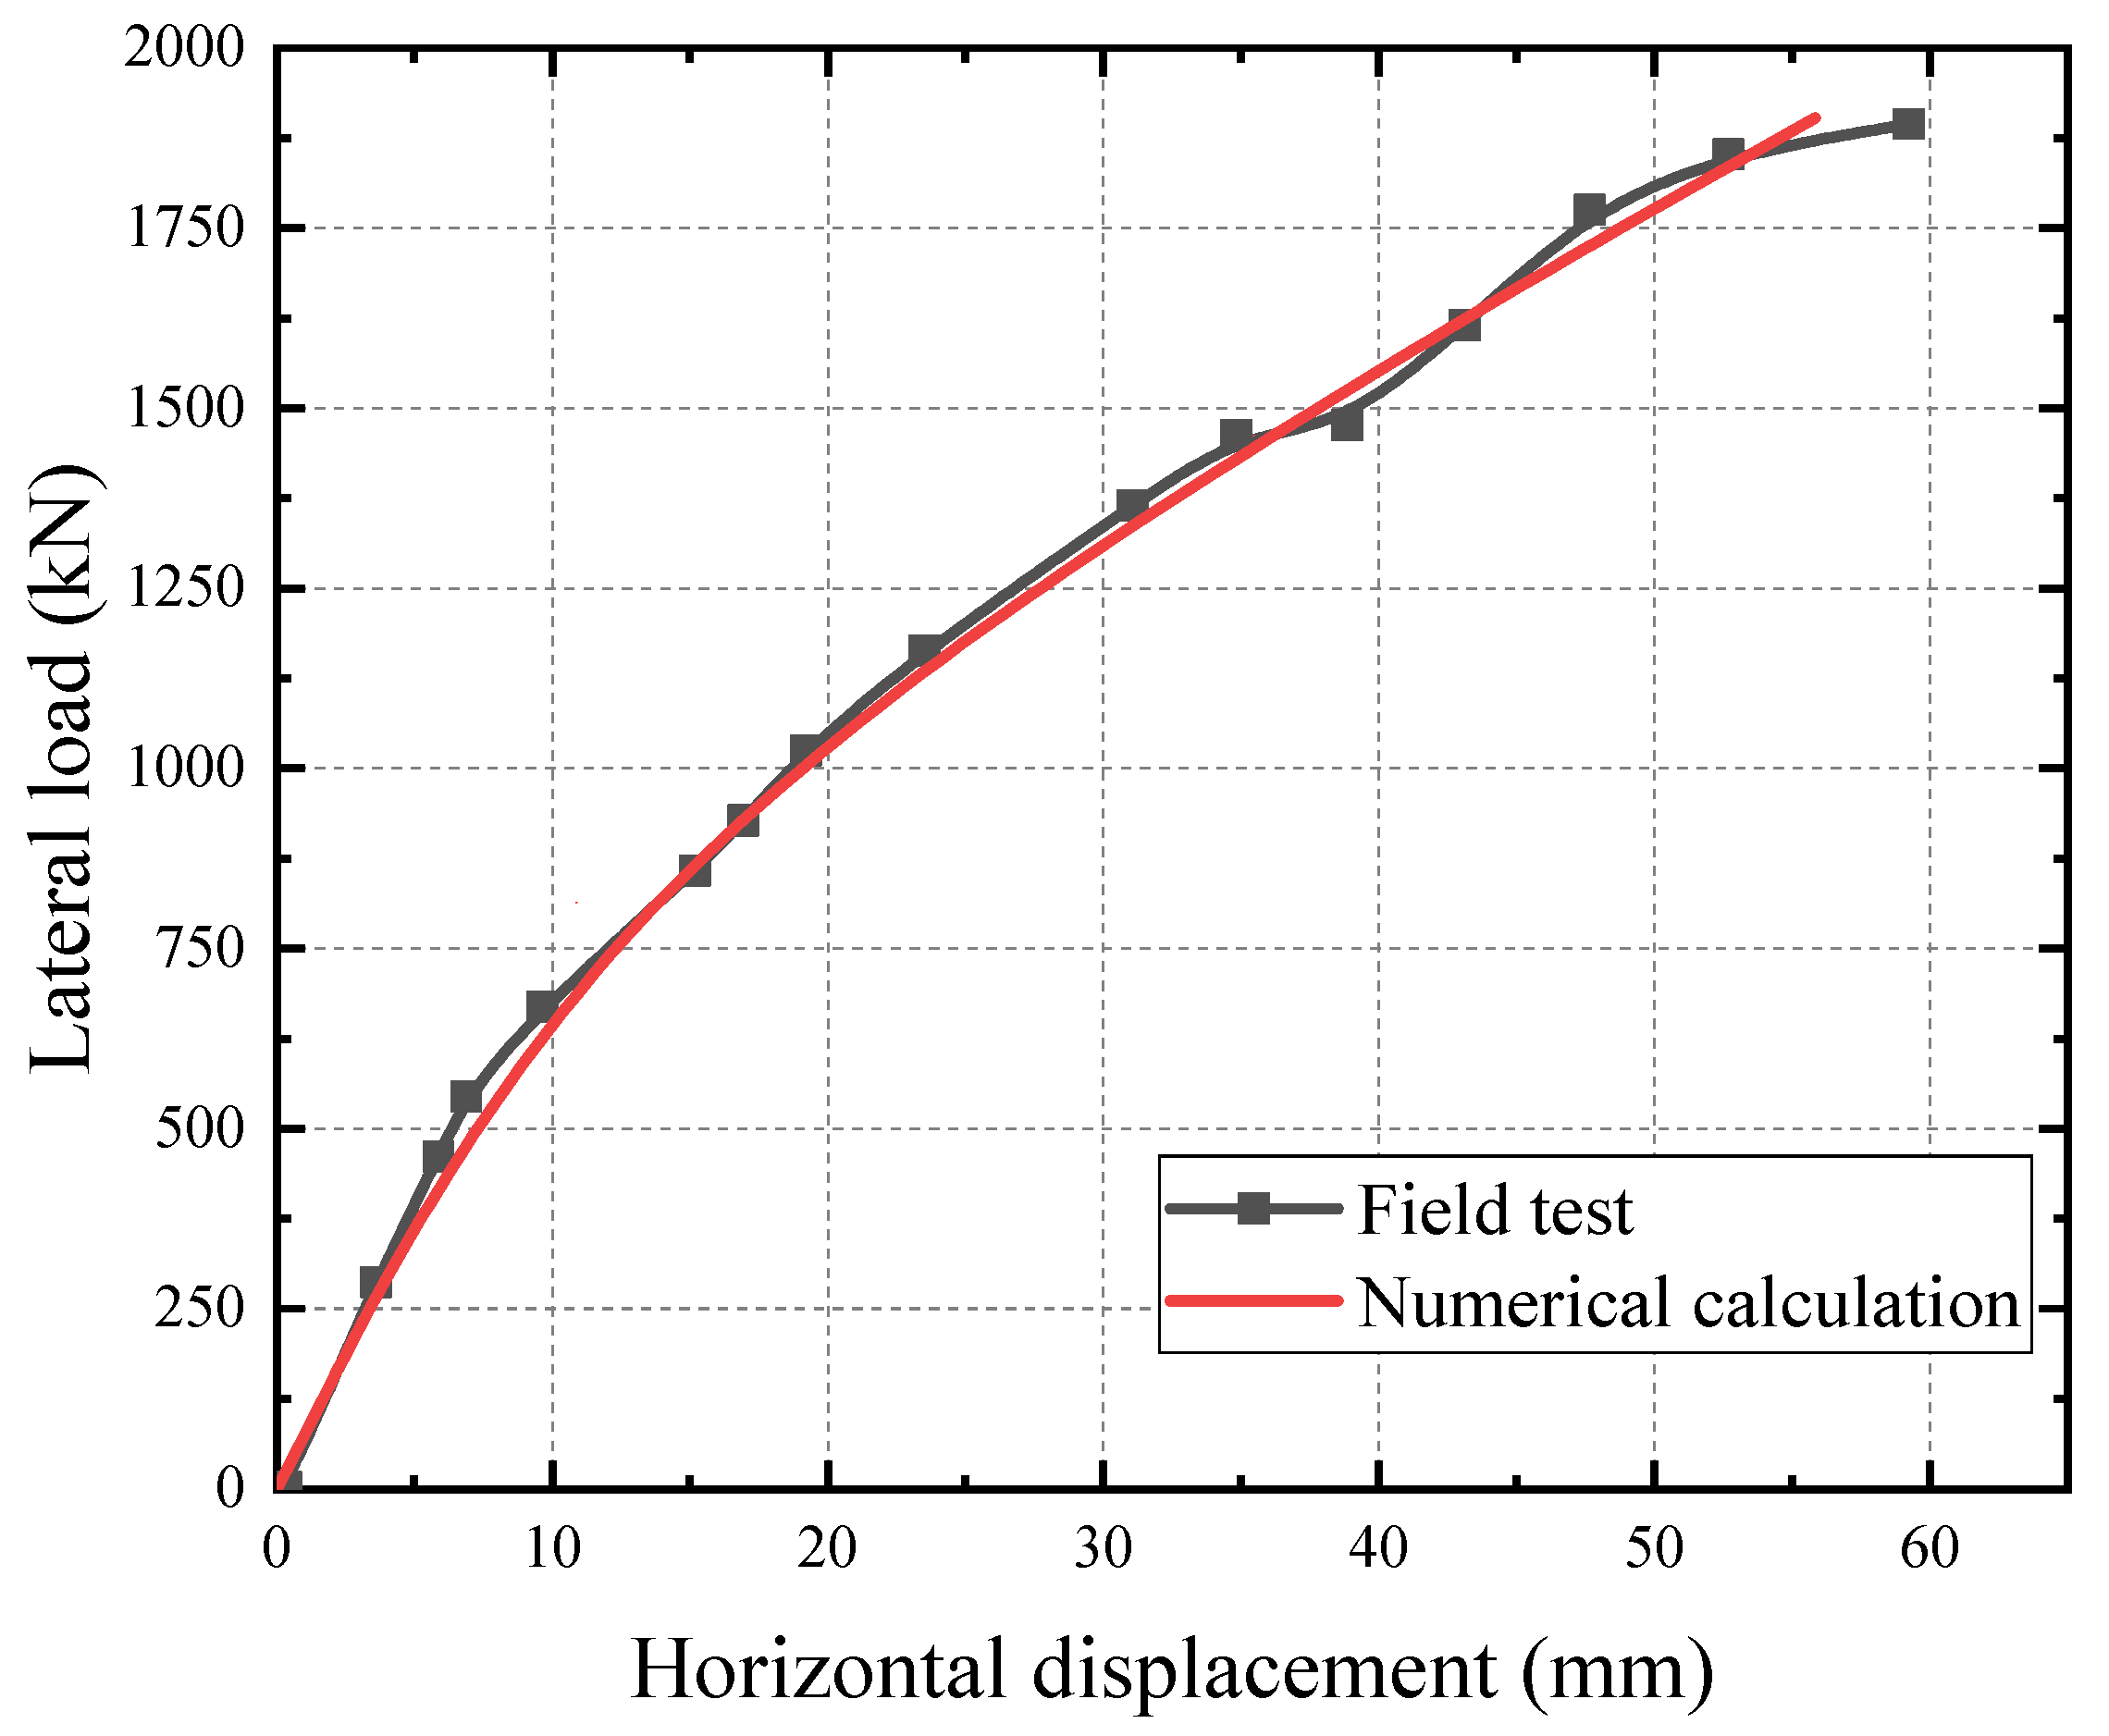
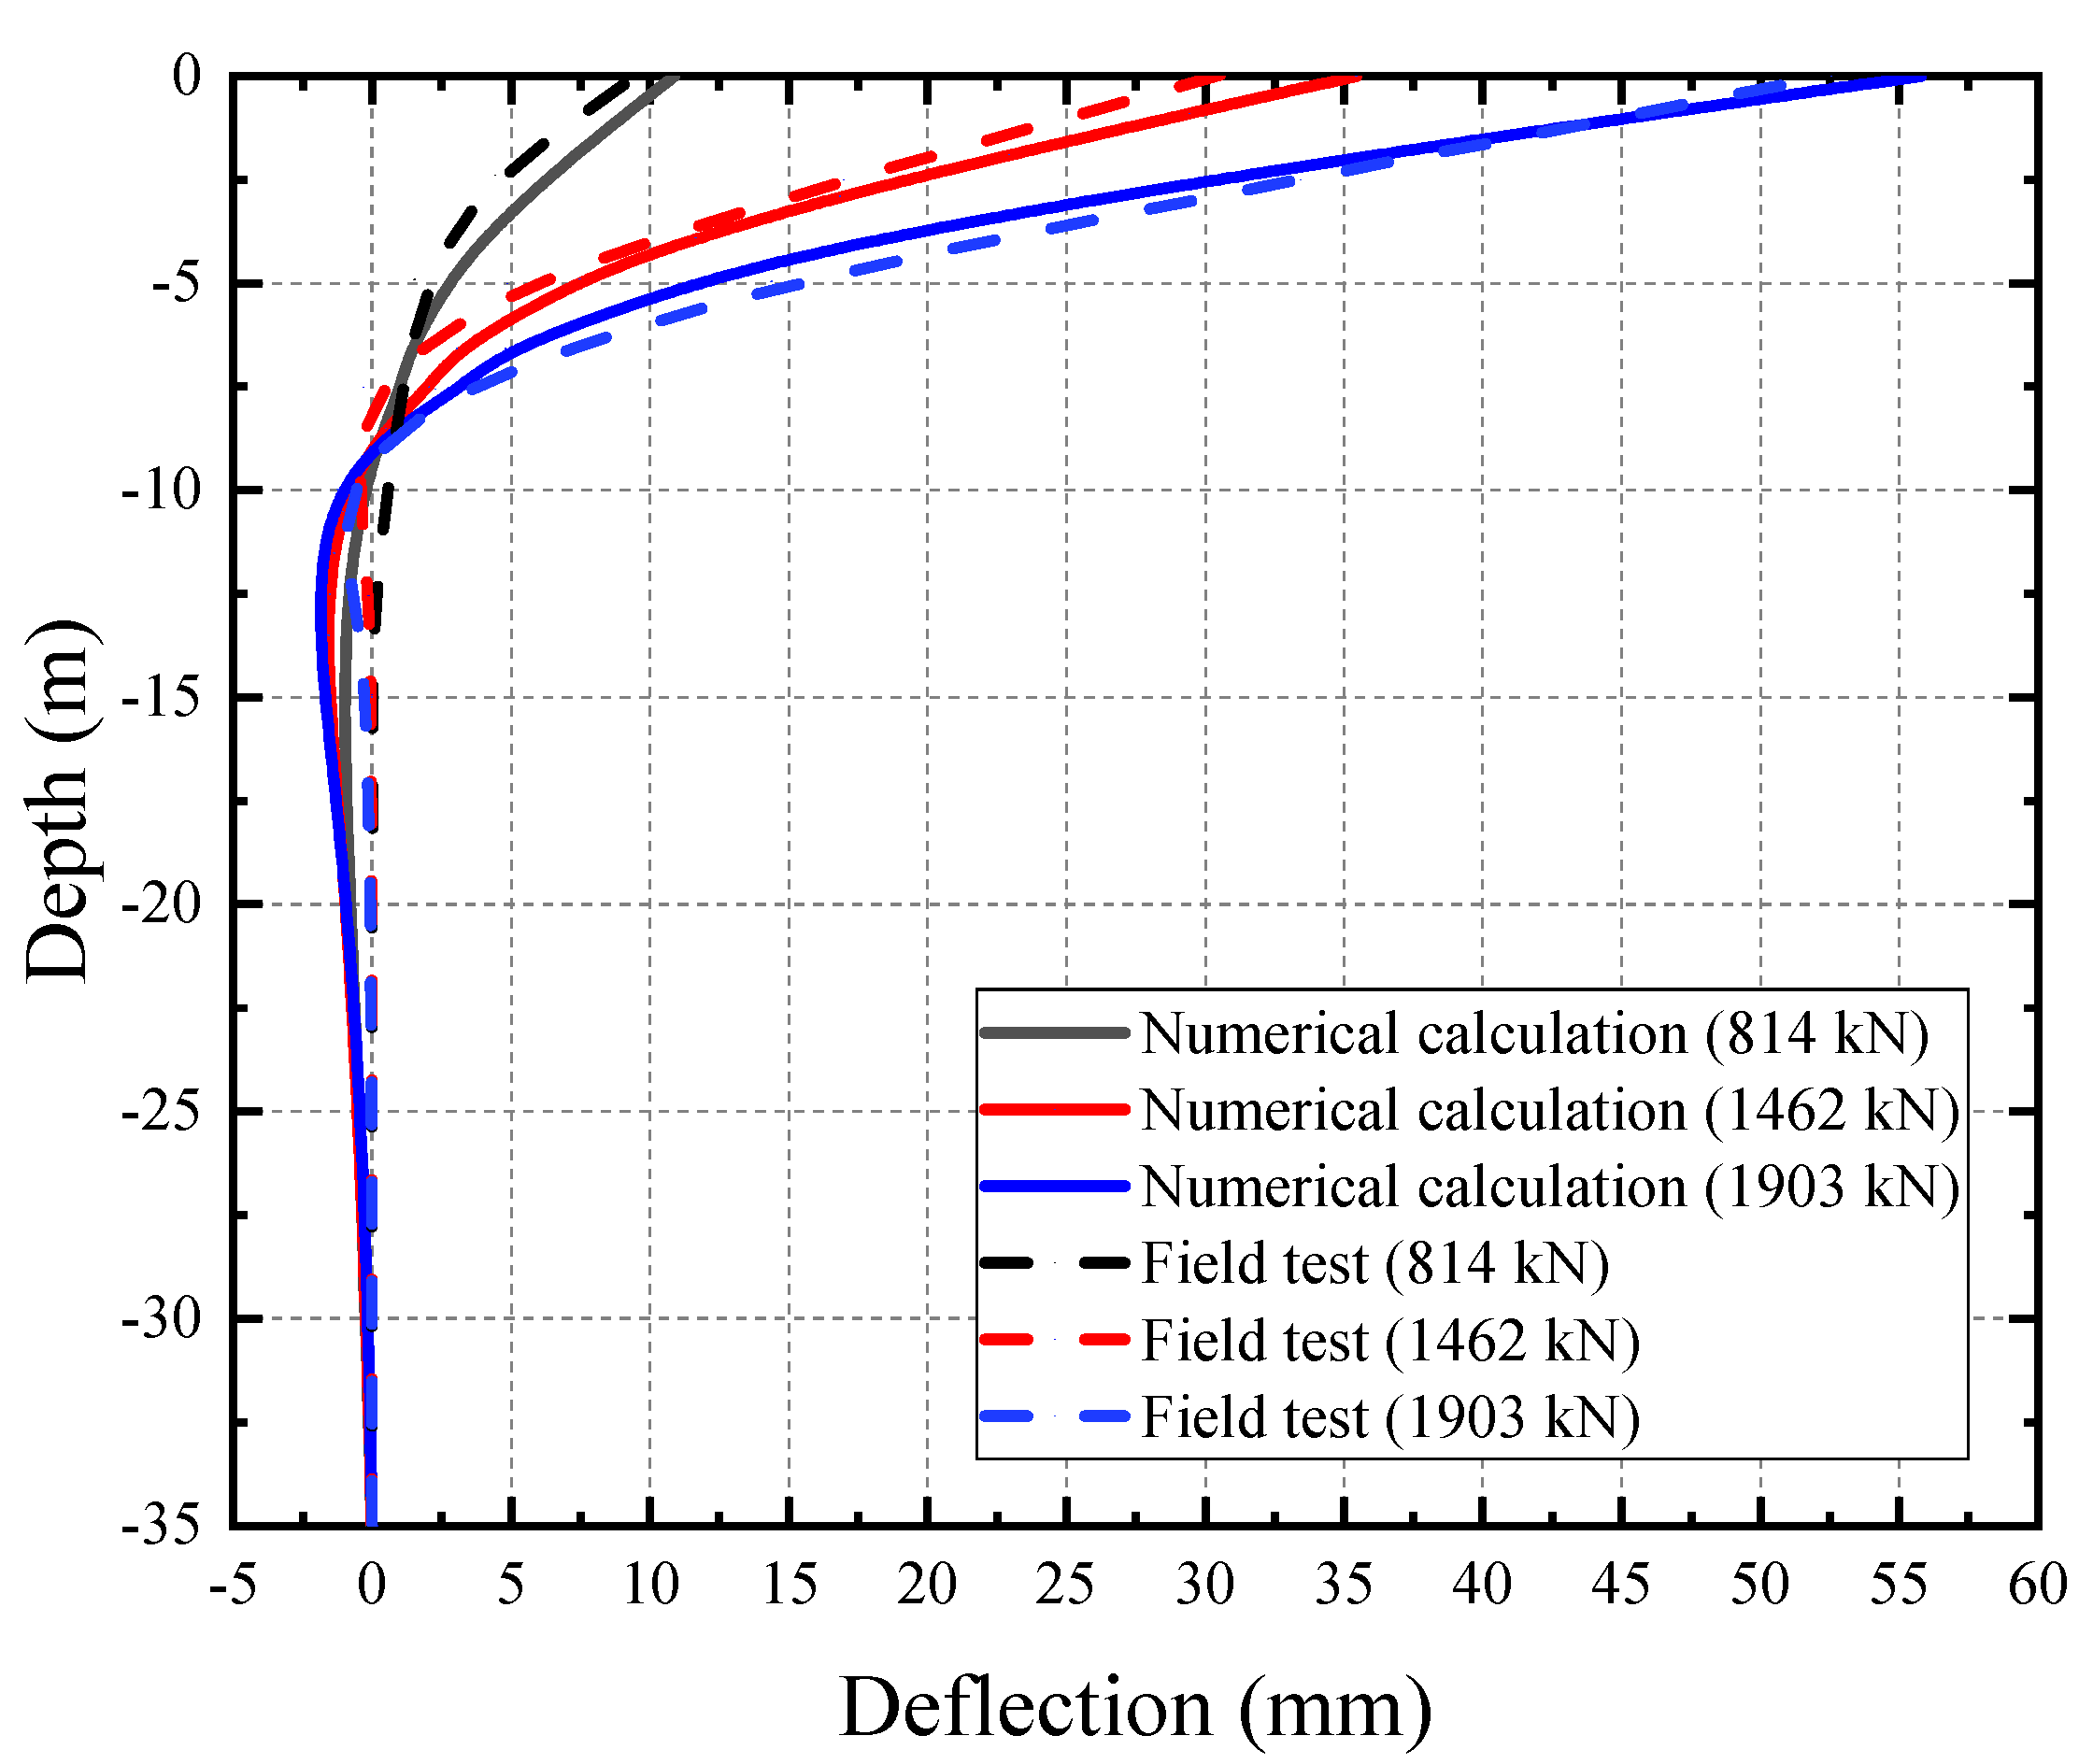
The field measurement results of the full-scale lateral loading tests of B7 bored pile reported by Huang et al. [27] are selected to calibrate and validate the three-dimensional finite element model of RC pile. The horizontal loads are applied to the pile head in the model in a similar way to the field lateral loading tests of the pile. The lateral load–displacement curve from the full-scale field tests and the nonlinear numerical simulation are presented and compared in Figure 9, which shows a fairly good agreement between the field tests and the simulation. The comparison of the deflection results of the pile along the pile length from the field tests and the numerical simulation under different values of horizontal loading is also illustrated in Figure 10, which also shows a relatively good agreement between them. The comparison results in Figure 9 and Figure 10 corroborate the selected parameters of soil, pile, and reinforcement used in the present study for the numerical simulation.
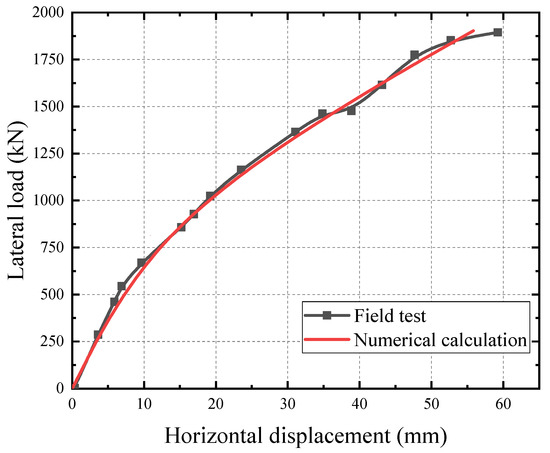
Figure 9.
Comparison of the lateral load–displacement curve at the pile head from the field tests and from the numerical simulation.
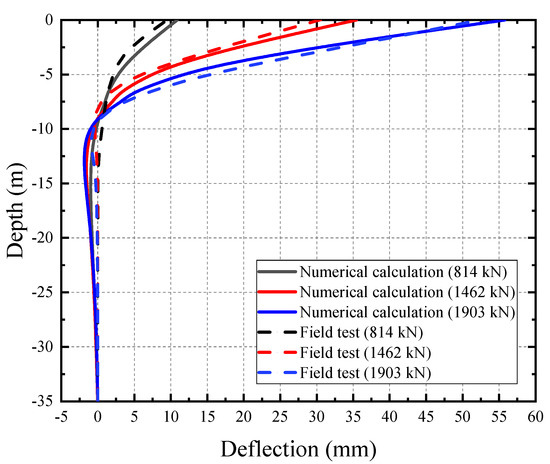
Figure 10.
Comparison of the deflection results of the pile along the pile body between the field tests and the numerical simulation under different values of horizontal load.
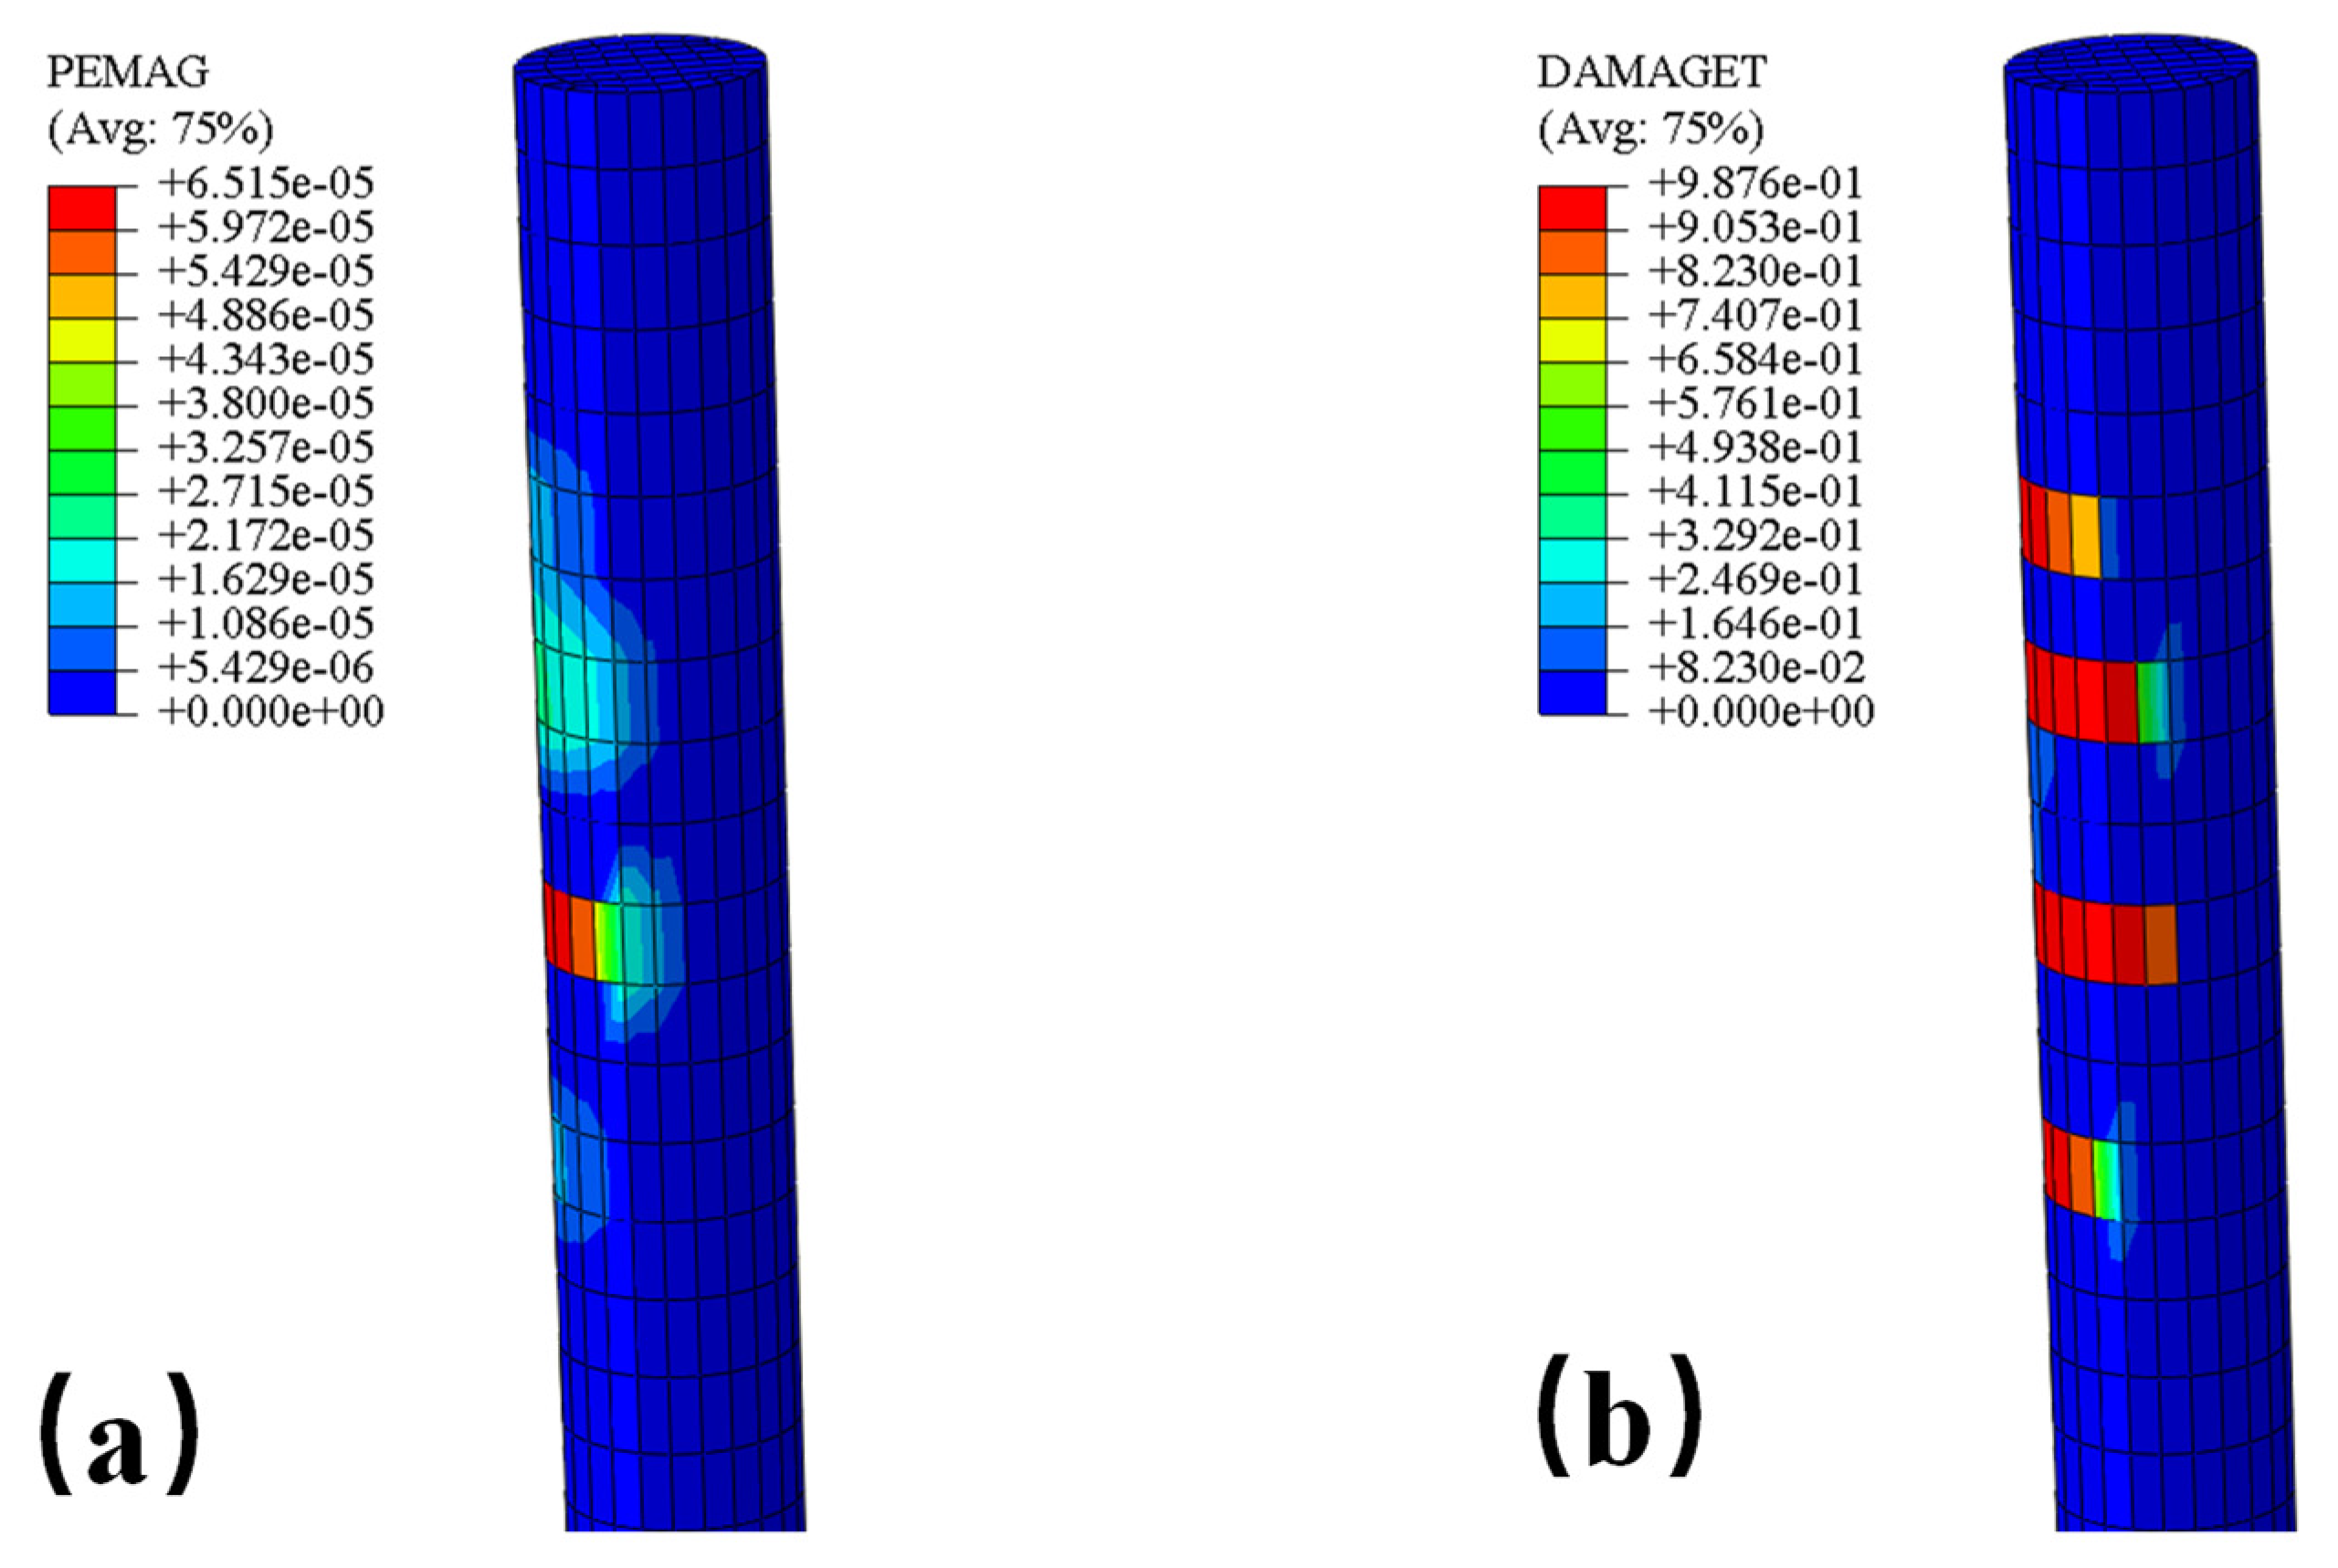
In Figure 10, the horizontal displacement of the pile mainly occurs at a depth of 0 to 10 m, which indicates that the influence of depth of the horizontal loads on the pile head is about 10 m (about 6.5D). Using a nonlinear constitutive model, the nonlinear and damage characteristics of the RC pile under the horizontal loads can be revealed. Figure 11 shows the distribution of plastic strain and concrete tension damage at the upper part of the pile body under 814 kN horizontal load. The plastic strain and concrete tension damage mainly occur at a depth of 2.4~6.9 m, indicating the development and distribution of the cracks in the upper portion of the pile under the horizontal loads.
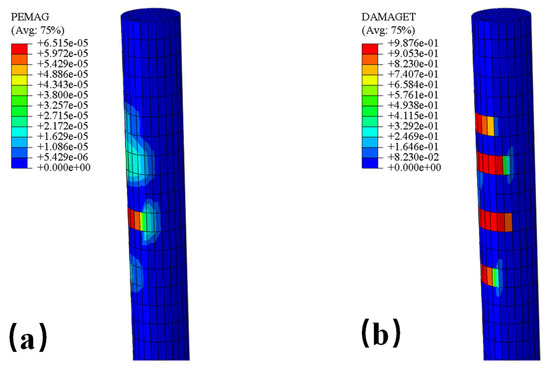
Figure 11.
Distribution of (a) plastic strain, and (b) concrete tension damage at the upper part of the pile body under 814 kN horizontal load.
4. Stochastic Seismic Response Analysis of RC Pile
In the study by Huang et al. [27], the large-diameter RC piles are planned for the construction of a high-speed railway system [27]. To ensure the safety of the train, the settlement of pile foundation is strictly controlled. Therefore, the settlement at the pile head is consequently selected as the seismic performance index to analyze the stochastic seismic responses and the seismic reliability of the RC pile under different seismic loads. Based on the framework of the method stated in Section 2.2, the generated 144 stochastic ground motions are input into the calibrated finite element model of the RC pile for a set of dynamic time history analysis. Then, the 144 time histories of settlement at the pile head are extracted for the stochastic analysis by combining with the GPDE equation (Equation (4)).
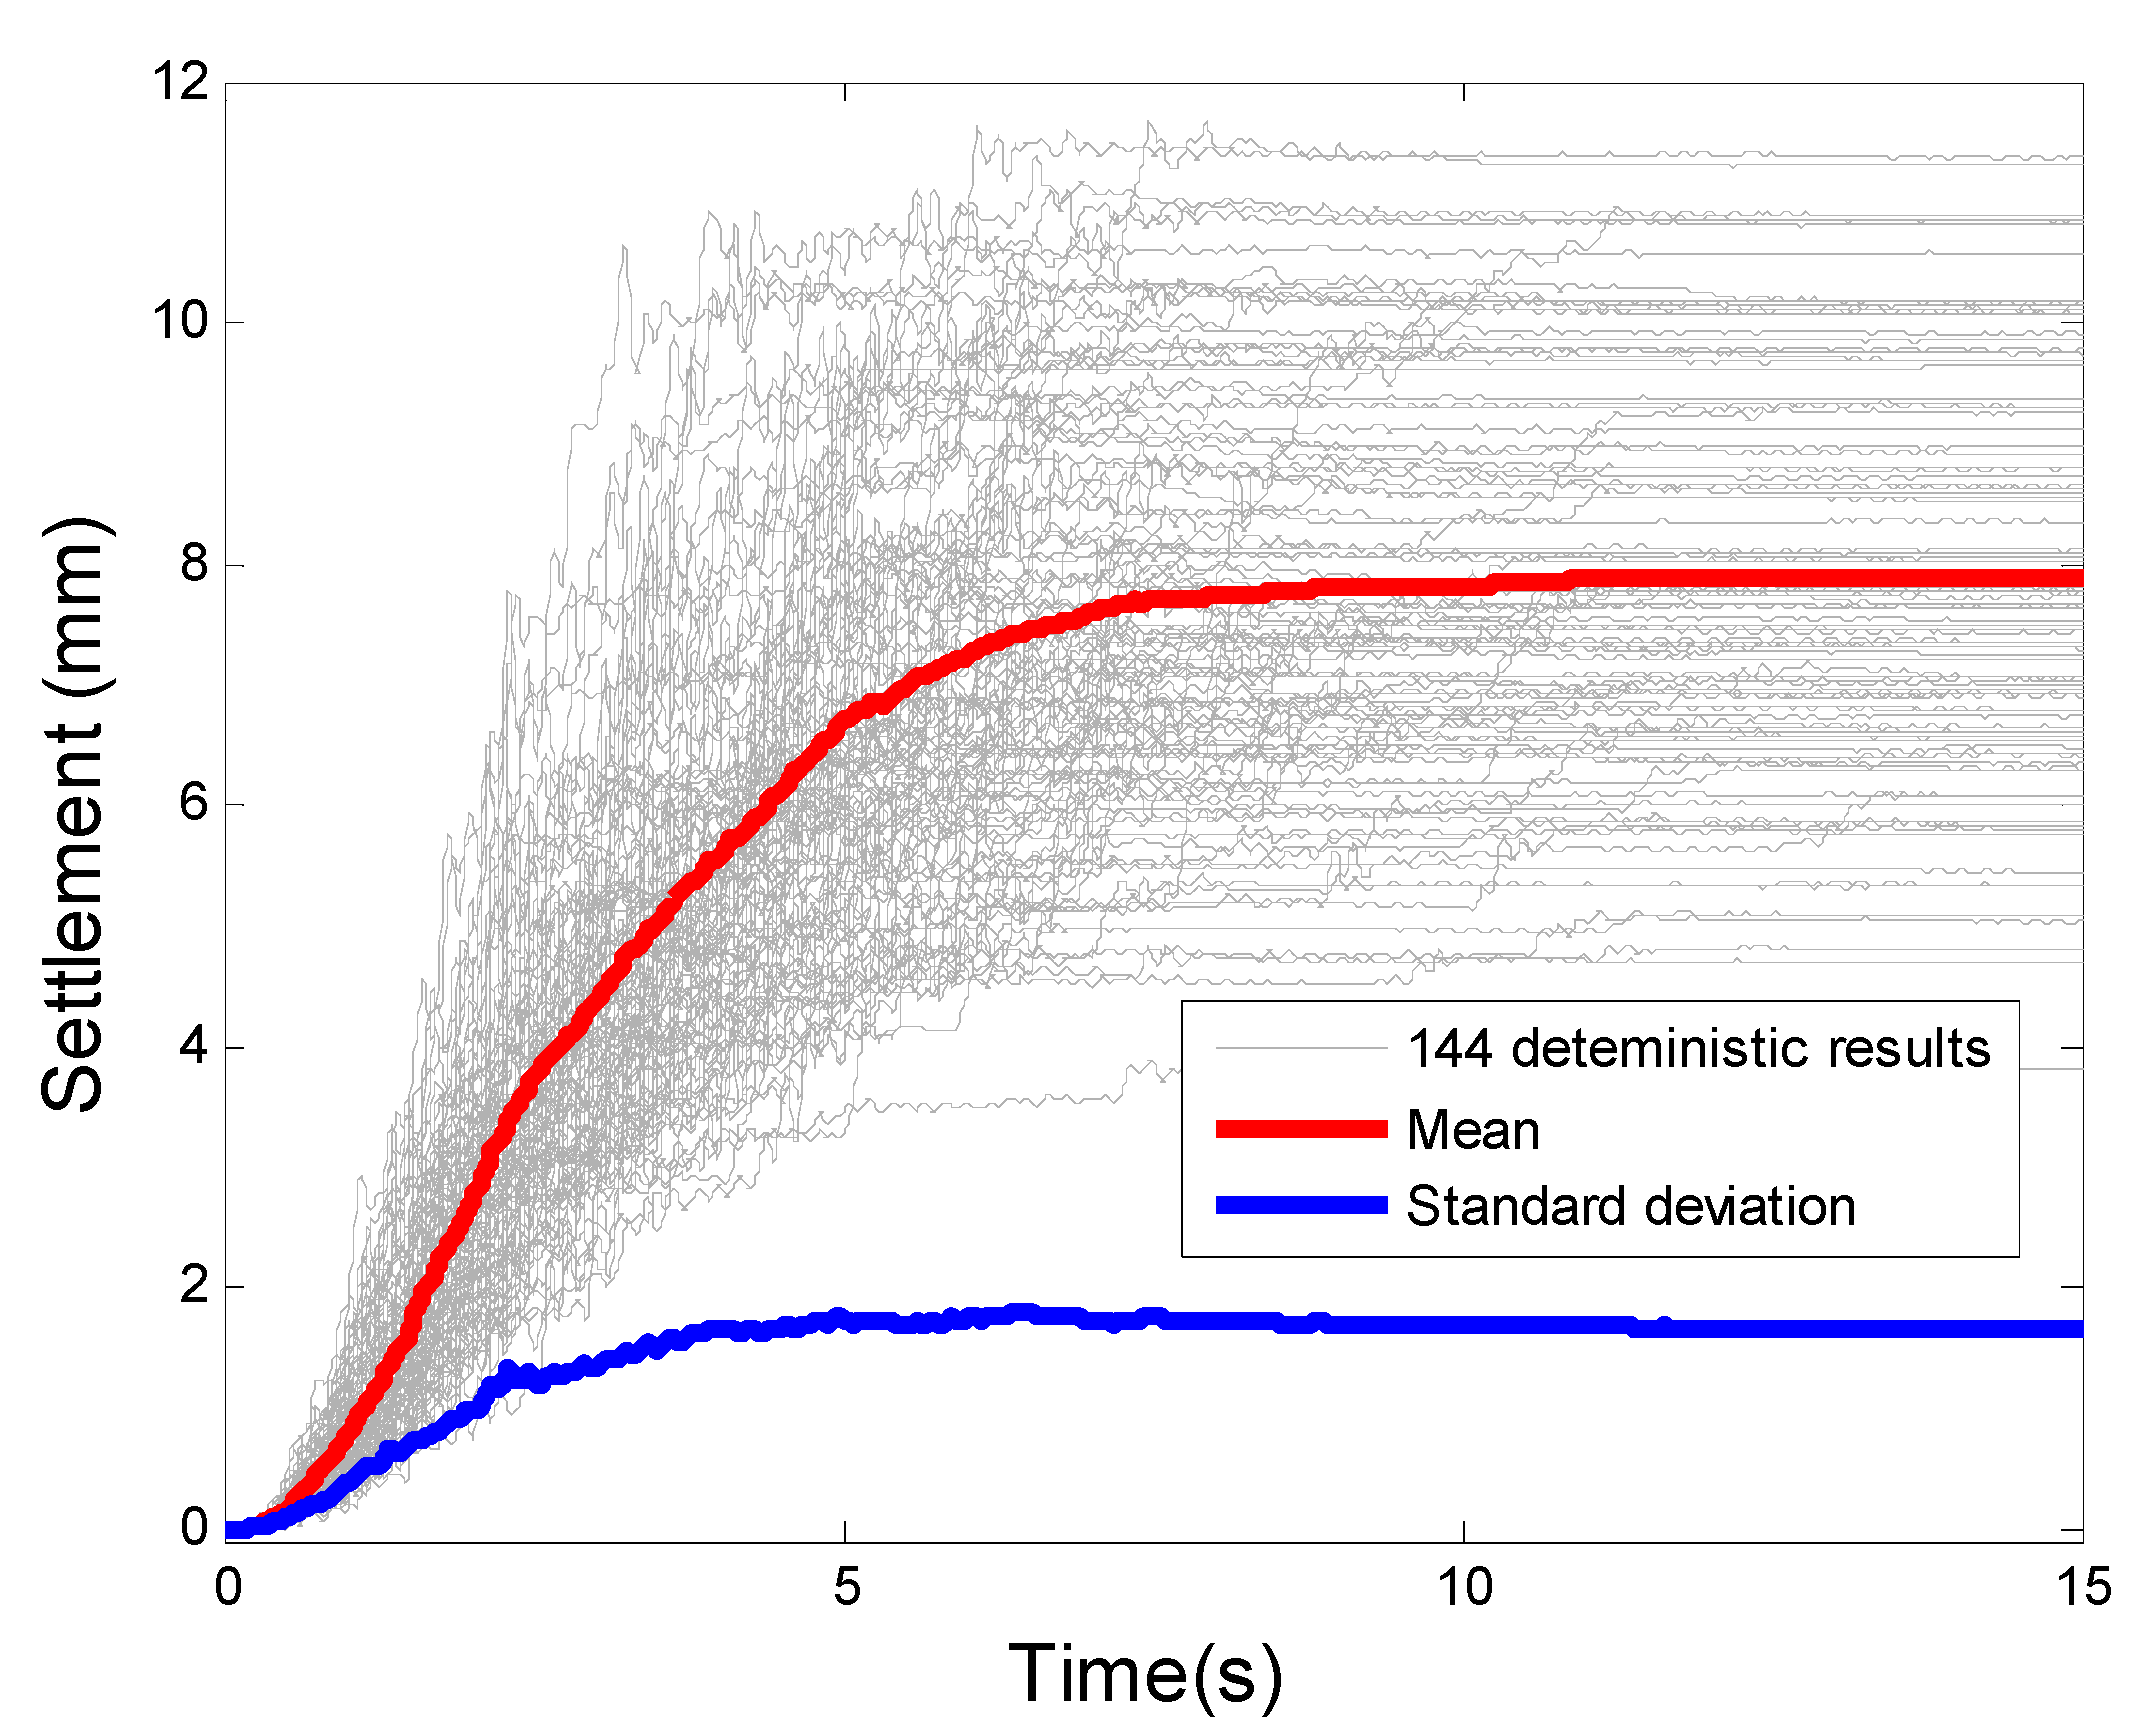
Figure 12 shows the mean value, the standard deviation, and the 144 deterministic results of seismic settlement time histories at the pile head under various stochastic ground motions. It can be seen from the figure that the seismic settlements at the pile head under various seismic ground motions show a similar trend. They increase gradually and then become basically stable at certain permanent values due to the nonlinear characteristics of soil and RC pile. Some maximum settlements of the pile reach about 11 mm under the stochastic ground motion excitation, while some maximum settlements of the pile are only about 3 mm, which demonstrates that the seismic responses of the RC pile under stochastic ground motions have great variability. Thus, it is necessary to resort to stochastic methods to quantify theses great uncertainties. The mean value and the standard deviation of the seismic settlements are also illustrated in Figure 12. They all increase with time because of the increase in accumulative settlement under earthquakes. The maximum mean value of the pile settlement is about 8 mm.
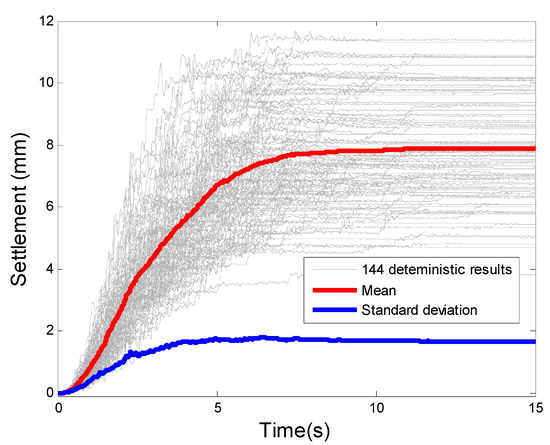
Figure 12.
Mean value, standard deviation, and 144 deterministic results of the seismic settlement at the pile head under stochastic ground motions.
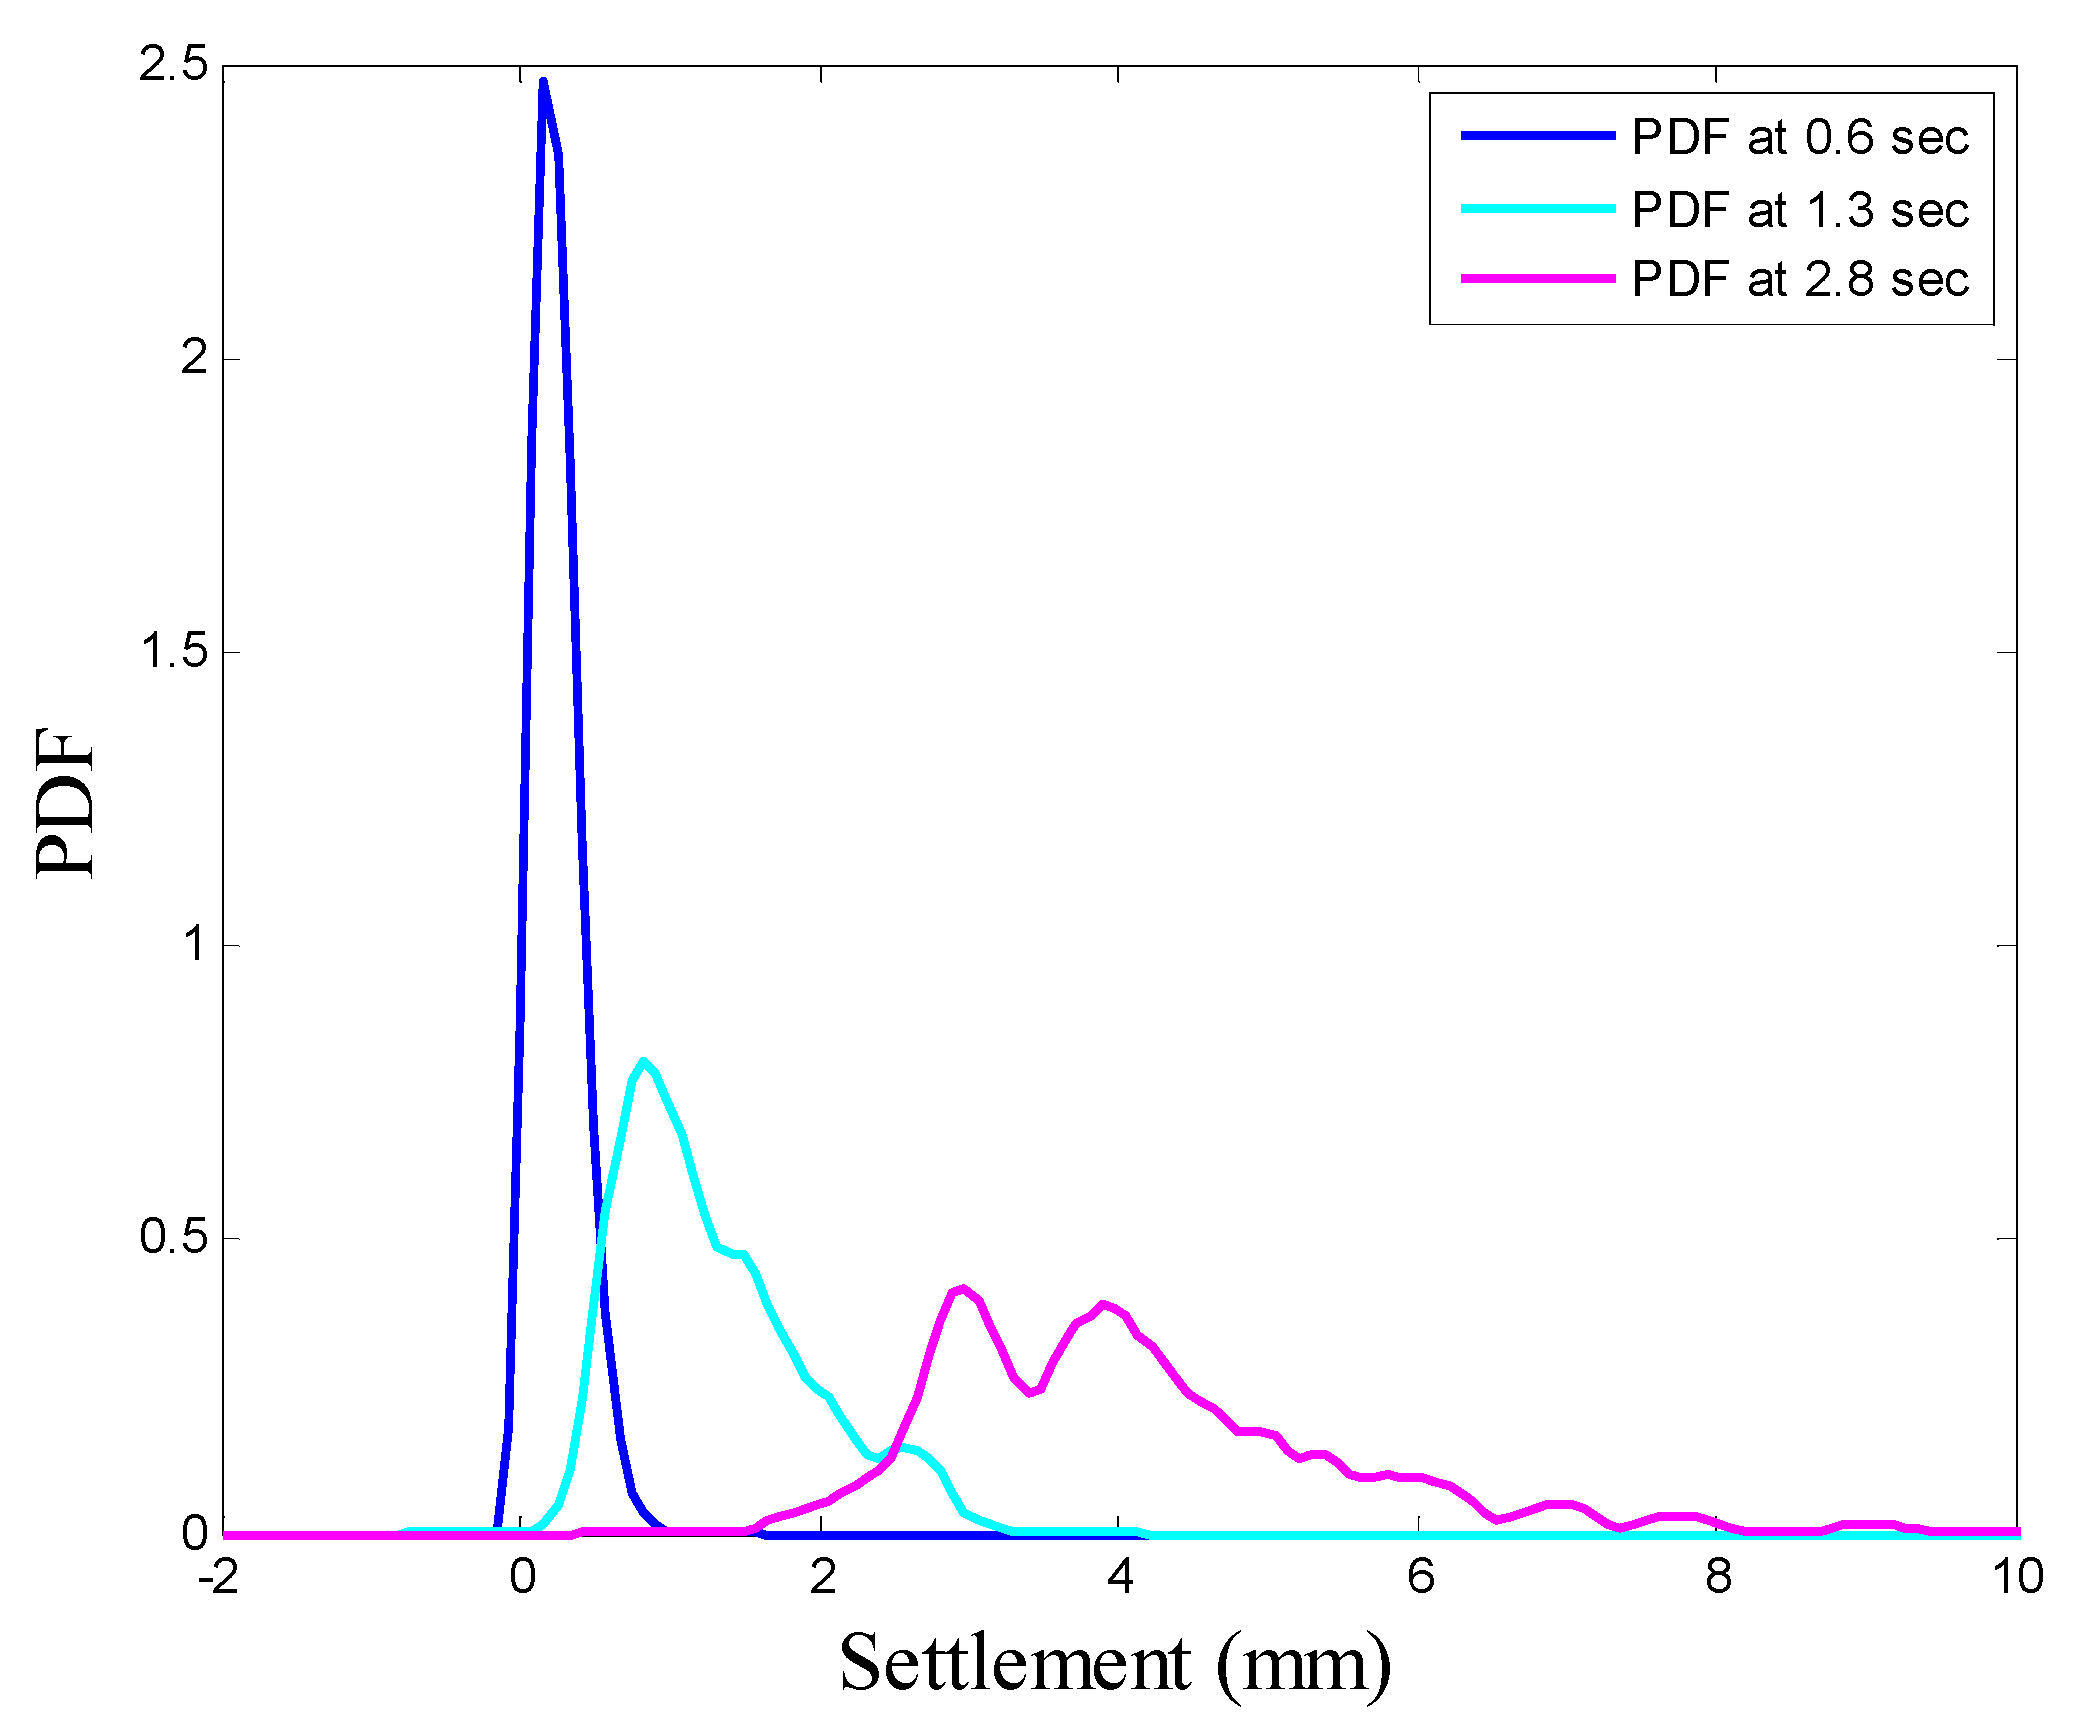
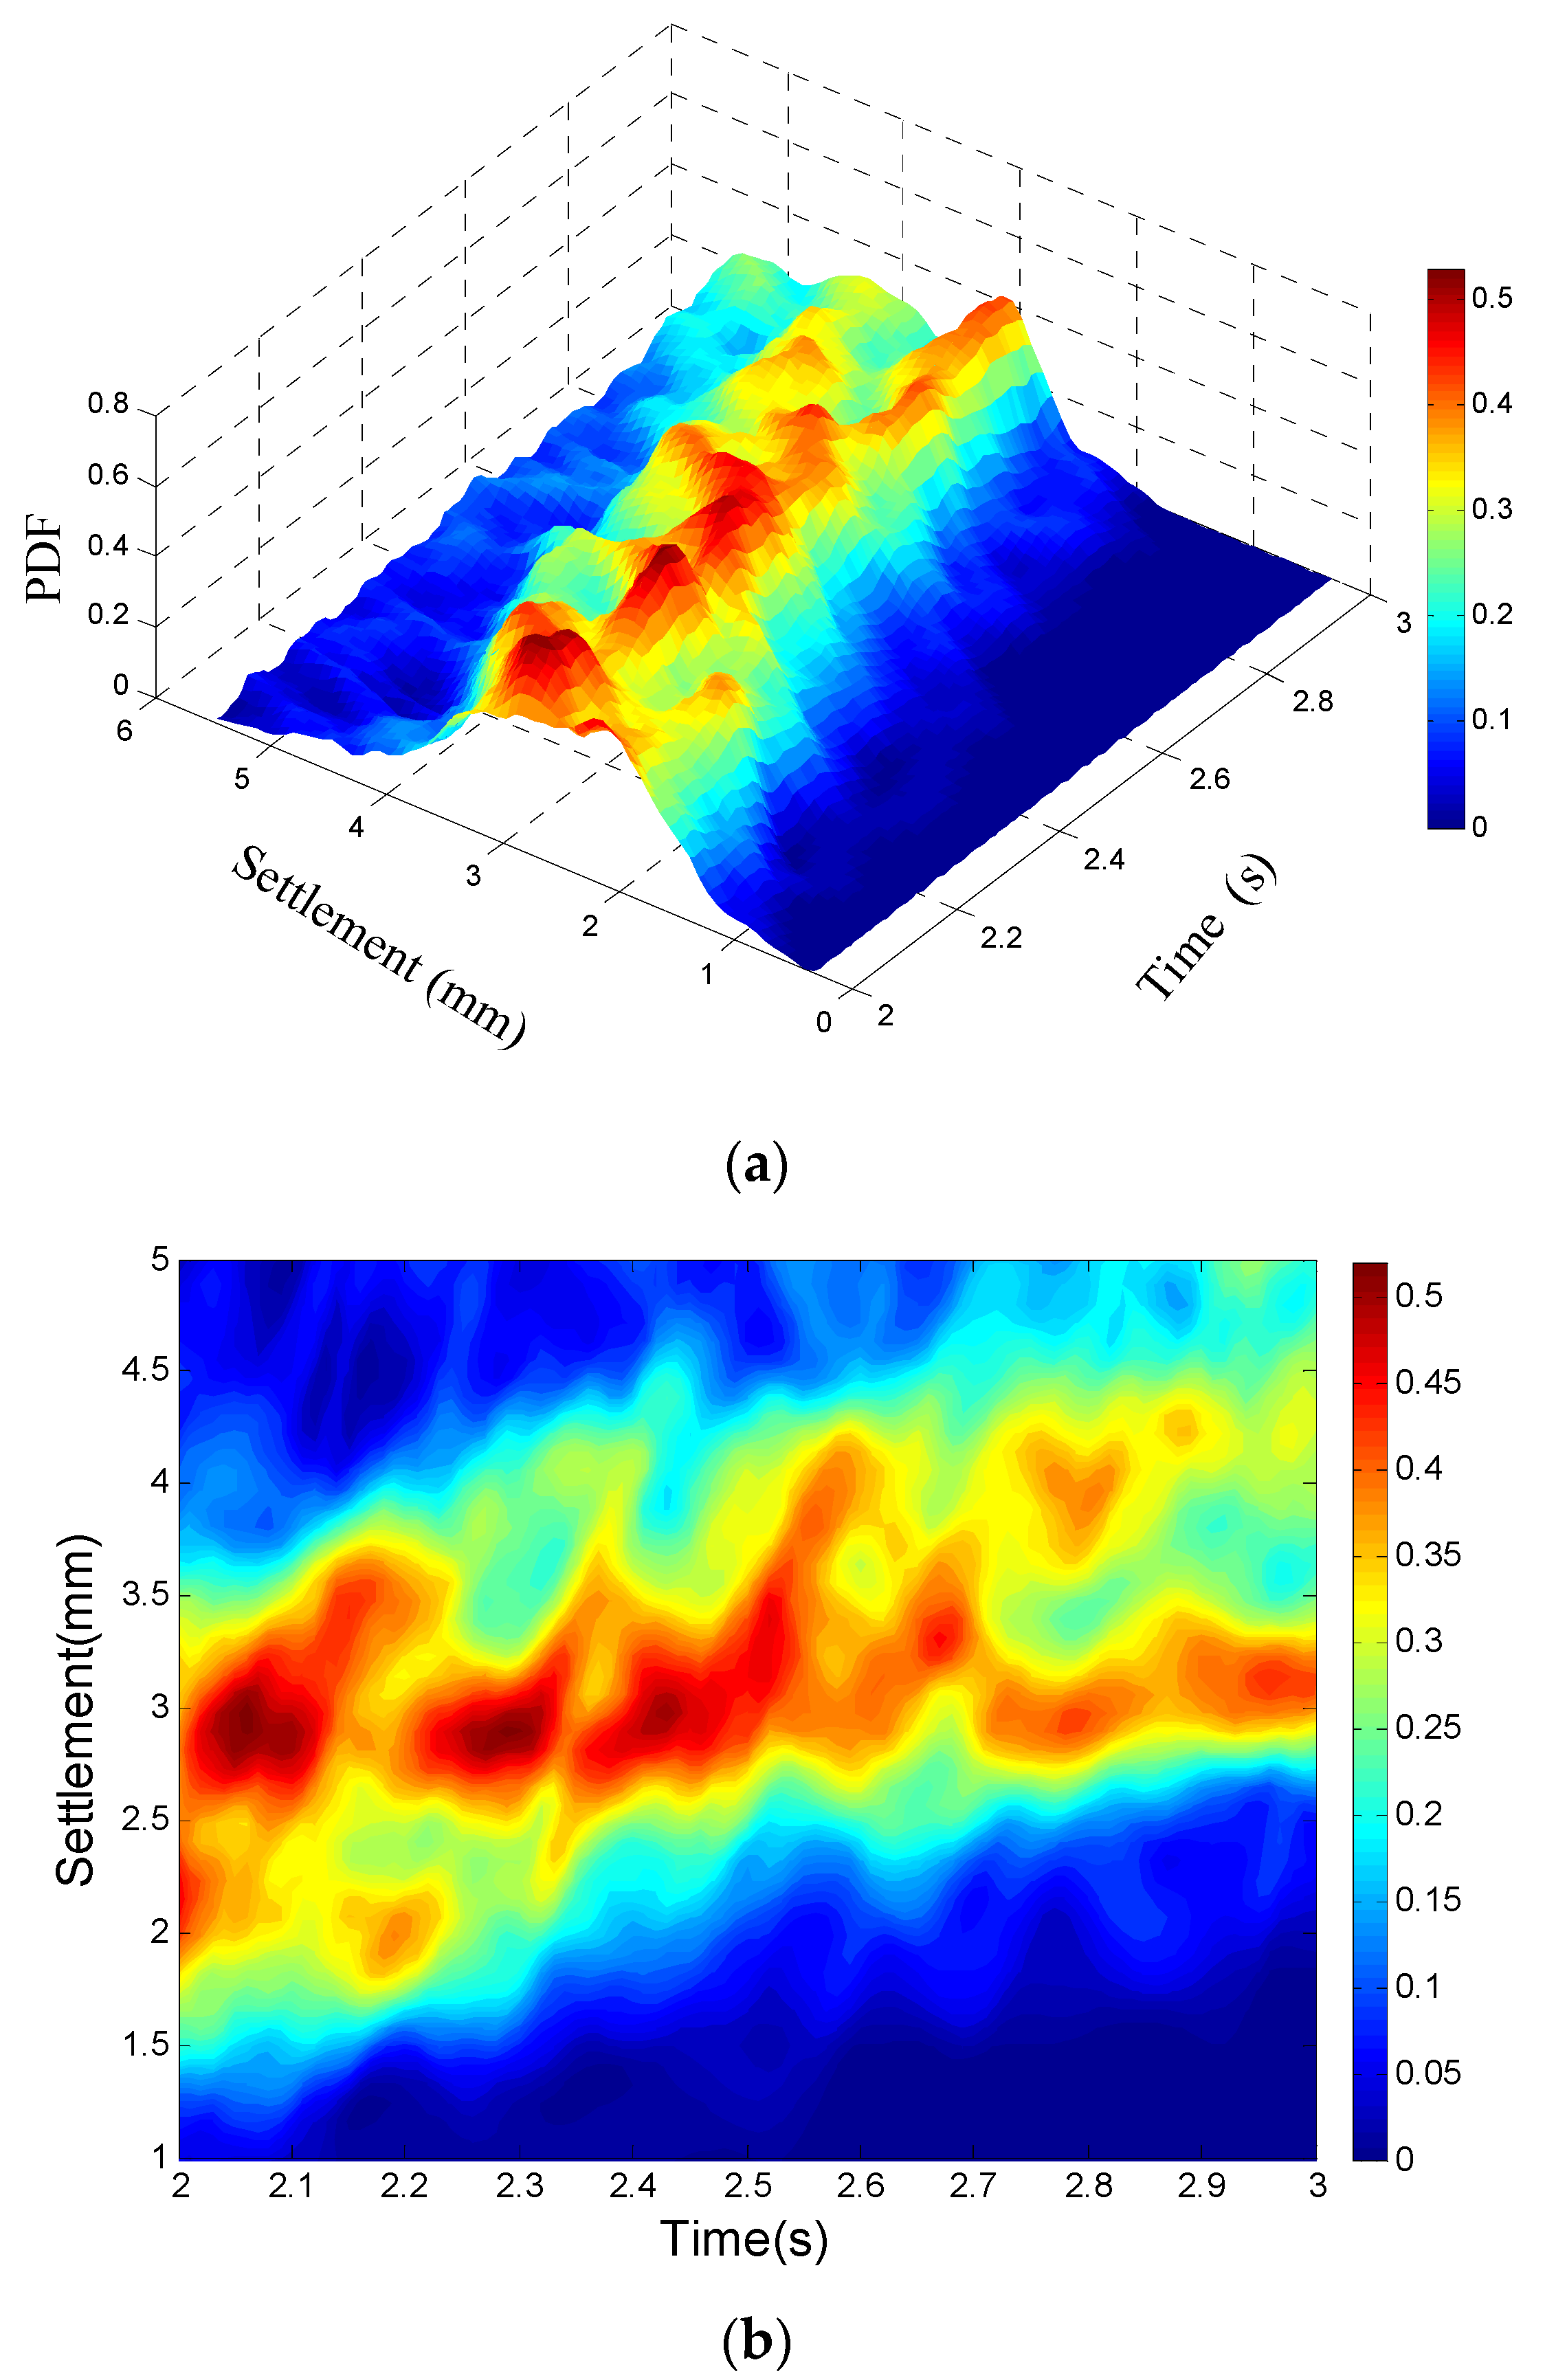
The PDEM has the ability to acquire instantaneous PDFs at different time points and reveal the propagation of uncertainty in nonlinear stochastic systems. The PDFs of the seismic settlements at three different time points (namely 0.6 s, 1.3 s, and 2.8 s) are illustrated in Figure 13. An unusual PDF shape can be observed in this figure, which demonstrates that using ordinary assumed distribution models (e.g., normal distribution, lognormal distribution, and extreme value distribution) to represent the seismic responses of the system for the dynamic reliability analysis of engineering structures is unreasonable and imprecise. The distribution ranges of PDFs at these three time points are enlarged with time, and it is because the accumulative settlement of the pile increases under earthquakes. The enlargement of the distribution ranges of the PDF also indicates that the variability of seismic settlements also increases with time, which is similar to the results observed in Figure 12. The propagation characteristic of the uncertainty in the nonlinear stochastic dynamic system of the RC pile is presented as the settlement PDF surface and the PDF contour in Figure 14. The settlement PDF surface is like a rolling hill and the high points denote the high probabilities of seismic response values. The settlement PDF contour is like flowing water, and it can be seen that the settlement distribution range also increases due to the increase in accumulative settlement under the seismic ground motions.
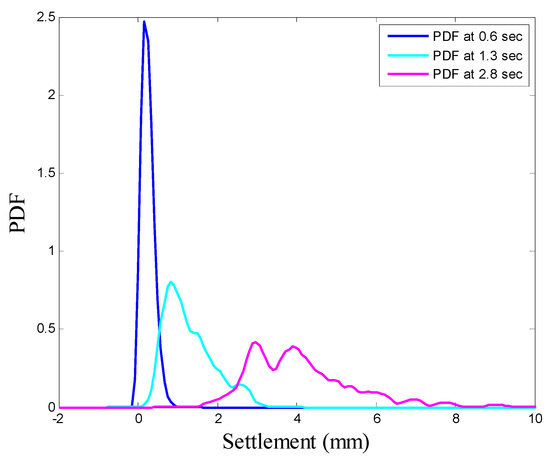
Figure 13.
PDF of seismic settlement at three different time points.
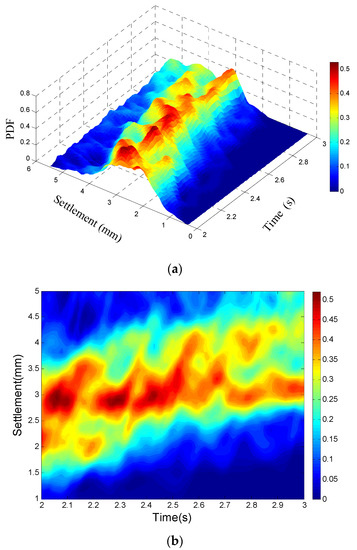
Figure 14.
(a) Settlement PDF surface and (b) PDF contour at a time interval of 2~3 s at the RC pile head.
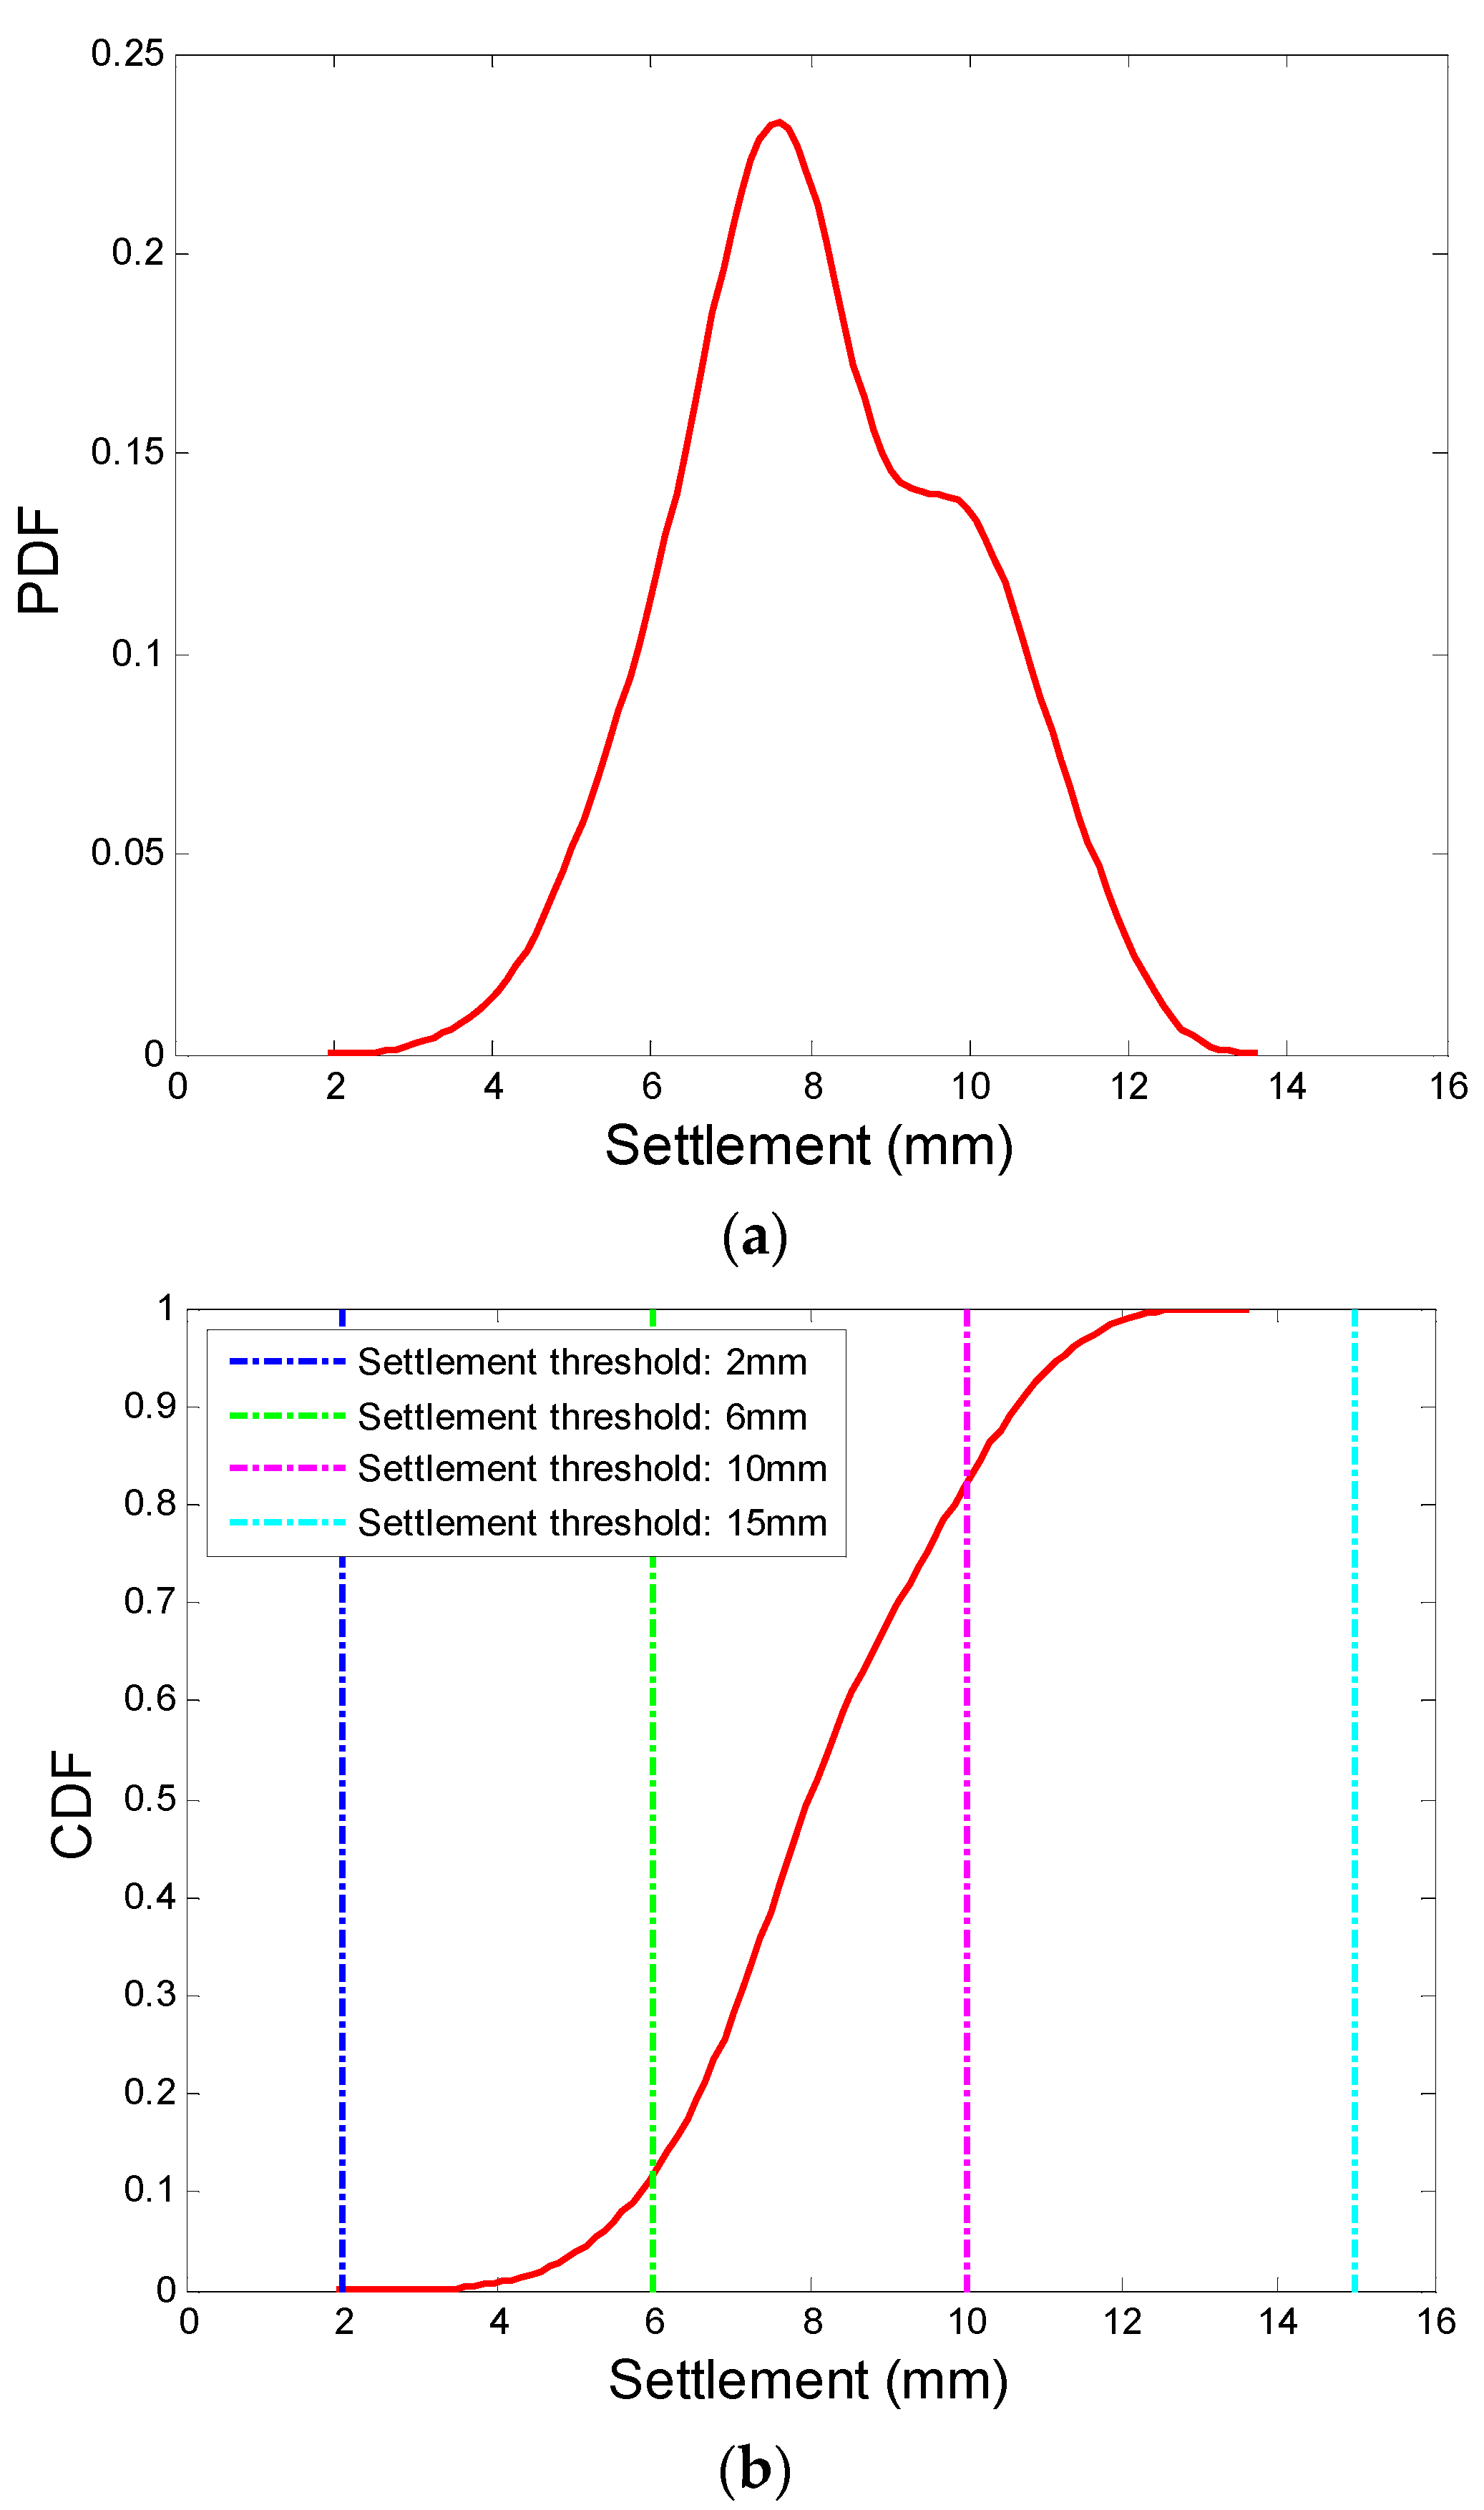
To acquire the dynamic reliability of the RC pile under earthquake, the equivalent extreme event principle [39] combined with the GPDE equation in the PDEM is used to obtain the PDF and CDF of maximum settlement for the dynamic reliability analysis of the RC pile. The maximum settlement PDF and CDF of the RC pile at pile head are illustrated in Figure 15. The distribution range of settlement PDF and CDF is about 2~14 mm, which denotes that the maximum settlement value of the RC pile is about 2~14 mm. The determination of the settlement thresholds concerning various seismic performance requirements is of great significance for the dynamic reliability assessment of pile foundations from the perspective of performance-based earthquake engineering [50]. Because the adopted large-diameter RC piles from the literature [27] are planned for a high-speed railway system, the settlement criteria for different performance levels and operation conditions of high-speed railway [51,52] are adopted for the dynamic reliability analysis of the RC pile in the present study, which is shown in Table 2 and also plotted in Figure 15b. From the figure, it can be observed that the dynamic reliability of the RC pile concerning four seismic settlement thresholds under the suite of stochastic ground motions are 0, 0.1293, 0.8247, and 1, respectively. The corresponding failure probabilities concerning these four seismic settlement thresholds are 1 (settlement thresholds = 2 mm), 0.8707 (settlement thresholds = 6 mm), 0.1853 (settlement thresholds = 10 mm), and 0 (settlement thresholds = 15 mm), respectively.
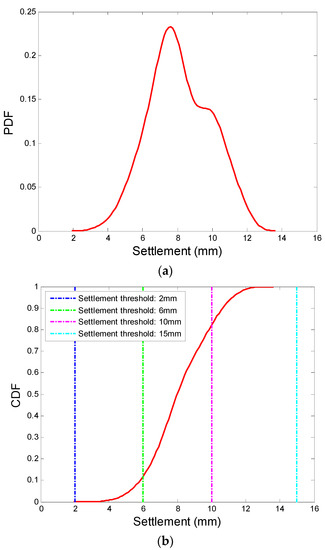
Figure 15.
(a) Maximum settlement PDF and (b) maximum settlement CDF at the RC pile head.

Table 2.
Operation safety control of a high-speed railway system concerning subgrade settlement [51,52].
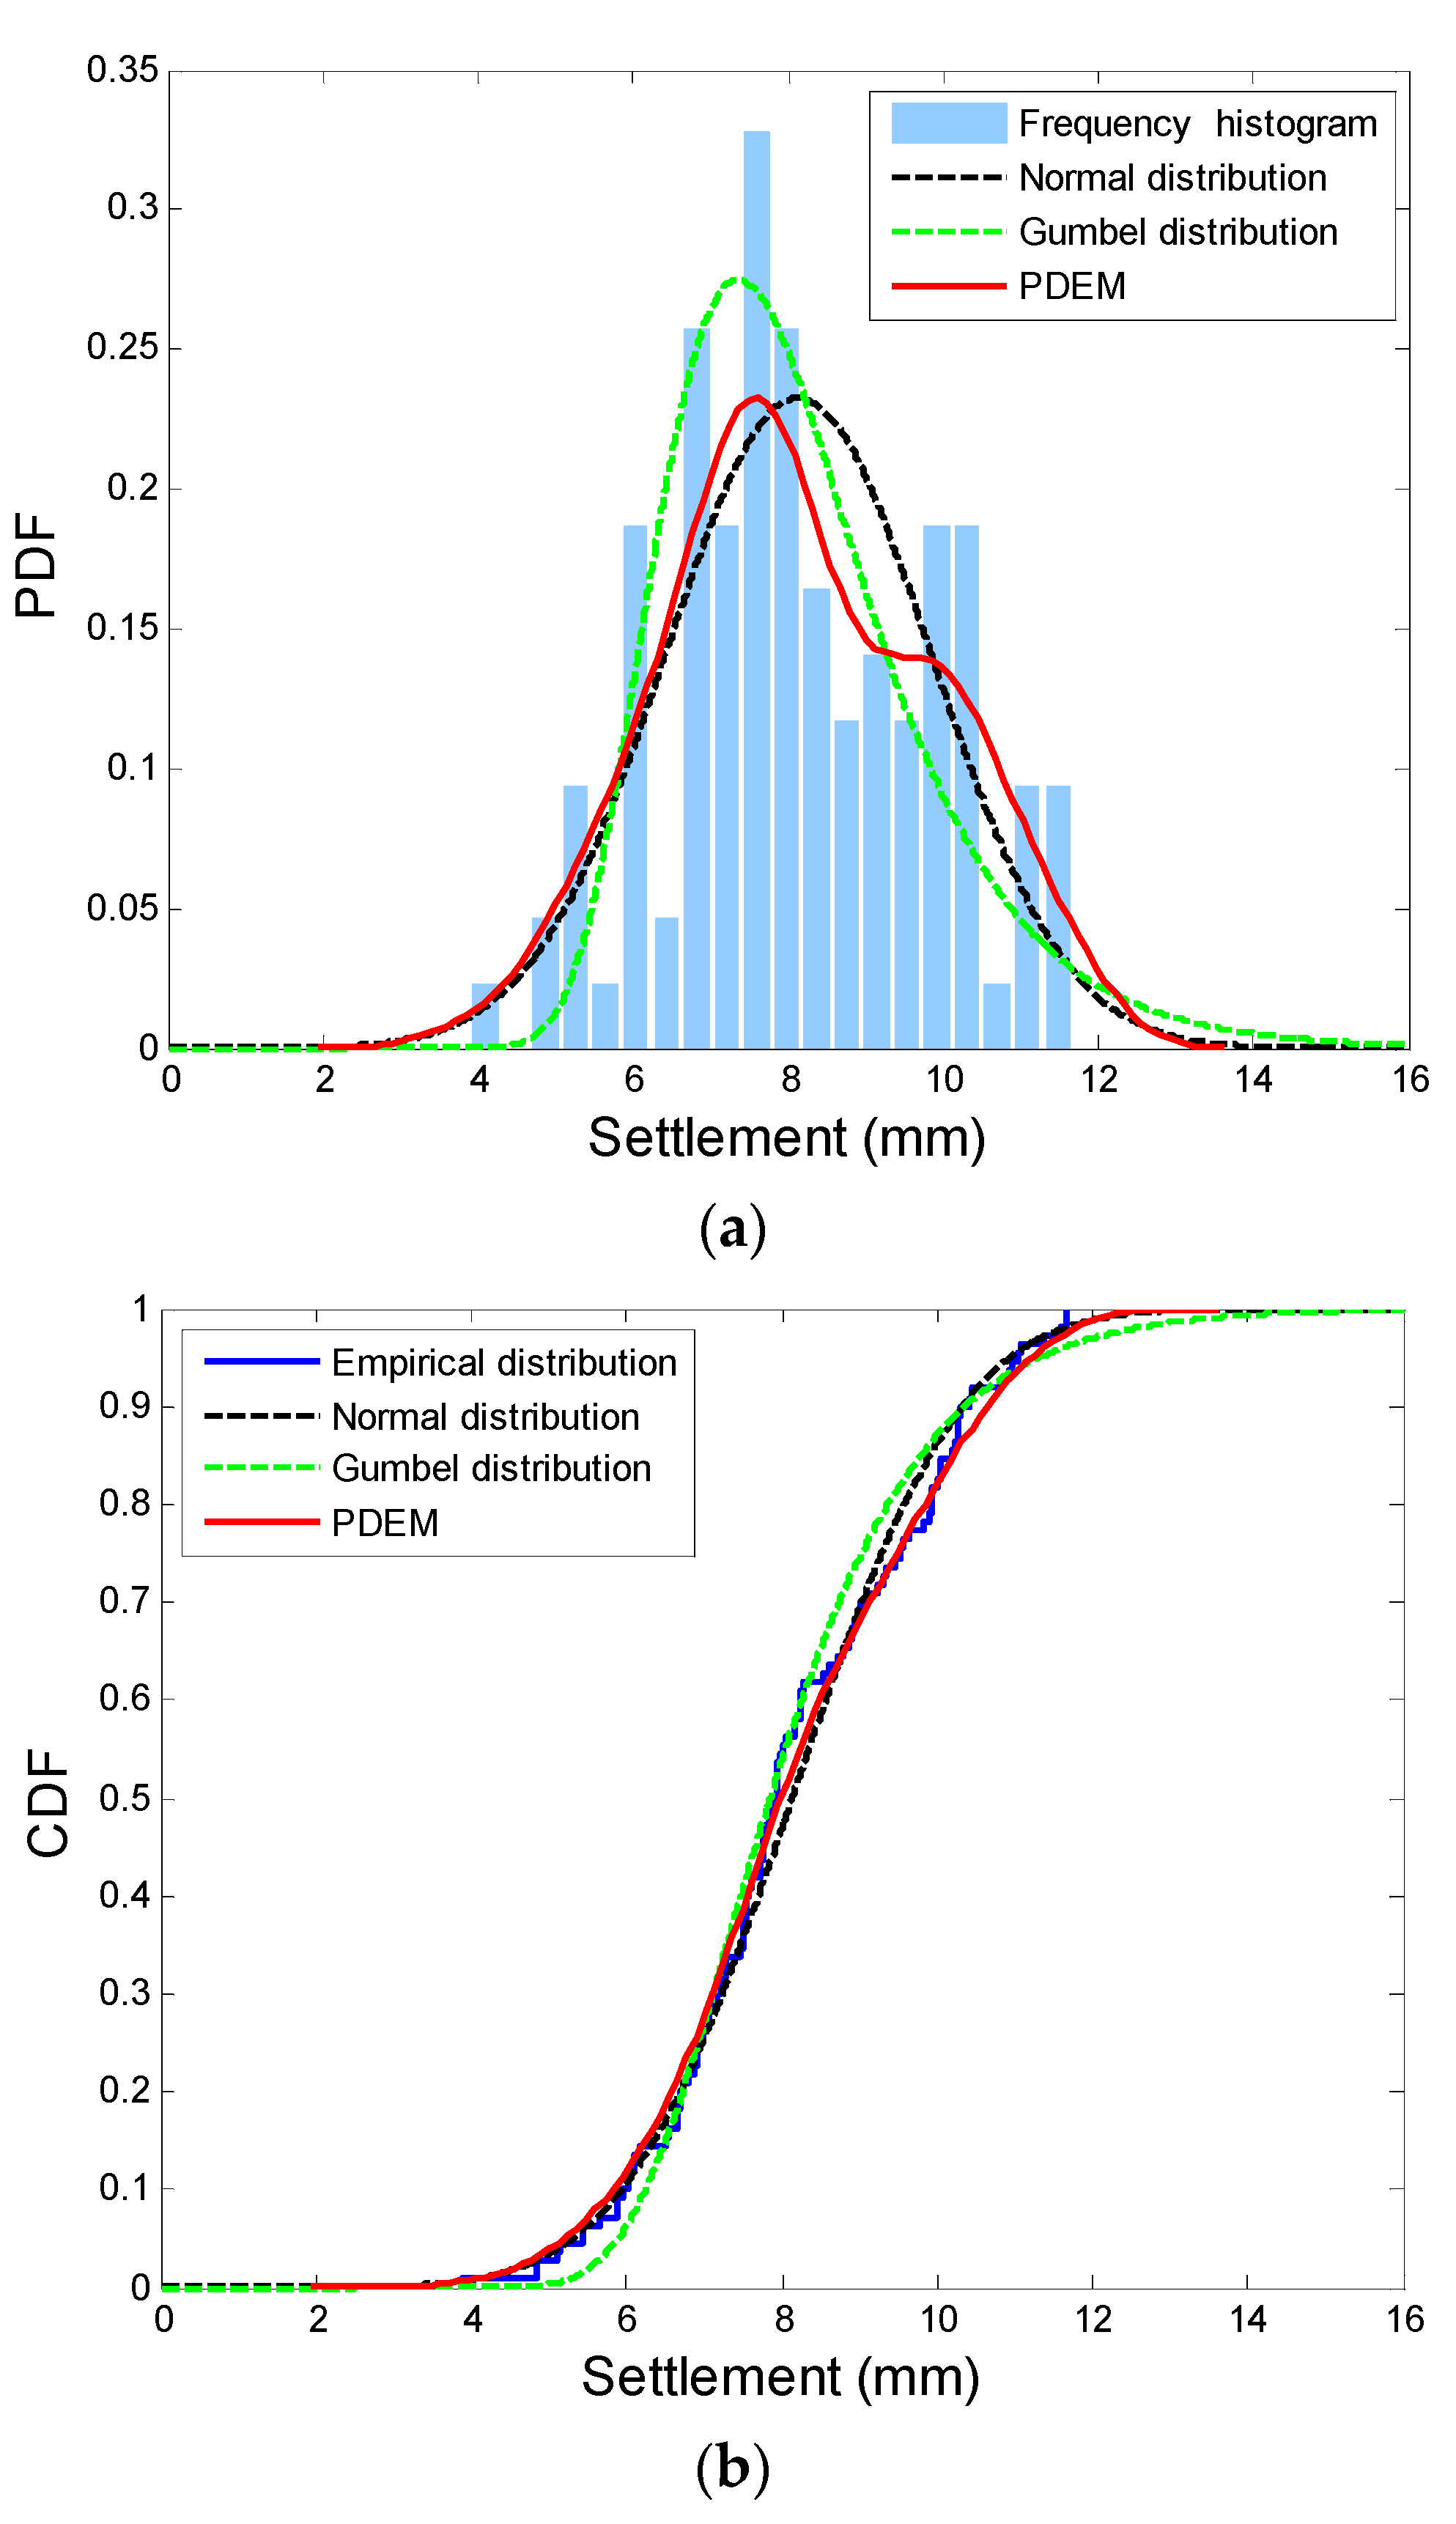
To better illustrate the merits of the PDEM in the stochastic seismic response analyses of RC piles, the maximum settlement PDF and the maximum settlement CDF at the RC pile head obtained using the PDEM, histogram, empirical distribution, normal distribution, and Gumbel distribution are compared in Figure 16. The results obtained using the direct statistical methods (histogram and empirical distribution) are more precise because they can reflect the real structure of the original data. From the figure, it can be seen that the shape of the PDF and the CDF obtained using the PDEM is closest to that obtained using the direct statistical methods, when compared to the normal distribution and Gumbel distribution models. Some non-unimodal and detailed change characteristics in the PDF curves are also presented and reflected by the PDEM, which demonstrate that the PDEM has the ability to more precisely estimate the PDF and CDF compared to other specific assumed distribution forms.
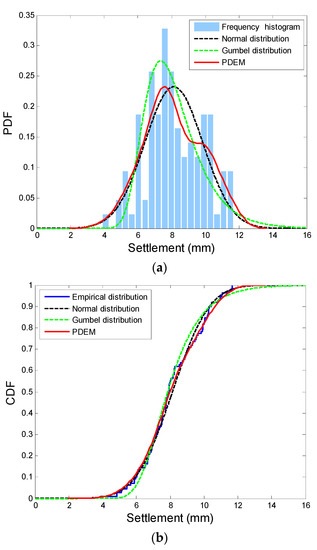
Figure 16.
Comparison of the (a) maximum settlement PDF and (b) maximum settlement CDF at the RC pile head obtained using the PDEM and various distribution models.
By using the proposed method, the actual seismic reliability of pile foundations that are designed using the current seismic codes can be estimated and determined. Furthermore, the proposed method can also be used to quantify the seismic fragility and the seismic risk of pile foundations according to performance-based earthquake engineering and the probabilistic seismic risk assessment framework. In addition, it has to be noted that, although only a concrete pile example is adopted as the case study, the proposed method is applicable for various kinds of pile foundations because this stochastic method can combine various deterministic numerical finite element methods and the solution of the GPDE equation.
5. Conclusions
In the present study, a probability density evolution method (PDEM), combined with a stochastic ground motion model, is proposed for the stochastic seismic response analysis of reinforced concrete (RC) piles. The randomness of earthquake and corresponding effect are properly quantified, and the nonlinear characteristics of soil, pile, and rebar and the soil–pile interaction are also properly modeled.
With the proposed method, the settlement time histories of the pile head, the instantaneous settlement probability density function (PDF), the cumulative distribution function (CDF), and the dynamic reliabilities of the pile concerning different performance levels under the excitation of a suite of ground motions are obtained. The results demonstrate the necessity of using stochastic methods to quantify the variability of RC piles under the effect of ground motion randomness. The shape of settlement PDF and CDF of the pile also demonstrates that it is unreasonable to use assumed probabilistic distribution models to characterize the seismic responses of pile foundations during a seismic reliability analysis.
Author Contributions
Conceptualization, H.H., G.G. and M.X.; methodology, H.H., Y.B. and M.X.; software, H.H. and K.C.; validation, H.H. and M.X.; formal analysis, H.H. and Y.B.; investigation, H.H., Y.B., X.G., X.H., K.C., L.C. and L.W.; resources, H.H., G.G., X.H., K.C. and L.C.; data curation, H.H., X.G. and X.H.; writing—original draft preparation, H.H.; writing—review and editing, H.H., Y.B. and X.G.; visualization, H.H., Y.B., L.C. and L.W.; supervision, H.H. and G.G.; project administration, H.H. and G.G.; funding acquisition, H.H., G.G., M.X. and L.W. All authors have read and agreed to the published version of the manuscript.
Funding
This work was funded by the fellowship of China Postdoctoral Science Foundation (Grant No. 2021M702791), the projects from the Center for Balance Architecture in Zhejiang University (Grant Nos. K20203330C and K20212159), the National Natural Science Foundation of China (Grants Nos. 42272323, 42002272, 41902274 and 42202304), the project from the Ministry of Housing and Urban-Rural Development of China (Grant NO. 2021-K-030), and the project from the Department of Construction of Zhejiang Province, China (Grant NO. 2021K157).
Data Availability Statement
Not applicable.
Conflicts of Interest
The authors declare no conflict of interest.
References
- Chen, K.; Gan, G. Flexural Test and Numerical Simulation of a New Combination Splice for Prestressed, Precast Concrete Piles Using High-Strength Steel Strands. Buildings 2022, 12, 1371. [Google Scholar] [CrossRef]
- Heidarie Golafzani, S.; Jamshidi Chenari, R.; Eslami, A. Reliability based assessment of axial pile bearing capacity: Static analysis, SPT and CPT-based methods. Georisk Assess. Manag. Risk Eng. Syst. Geohazards 2020, 14, 216–230. [Google Scholar] [CrossRef]
- Huh, J.; Haldar, A.; Kwak, K.; Park, J. Probabilistic reliability estimation of an axially loaded pile. In Proceedings of the 12th International Conference of International Association for Computer Methods and Advances in Geomechanics (IACMAG), Goa, India, 1–6 October 2008; pp. 1–6. [Google Scholar]
- Suzuki, M.; Takada, T. Response of pile embedded in stochastic ground media. Struct. Saf. 1997, 19, 105–120. [Google Scholar] [CrossRef]
- Teixeira, A.; Honjo, Y.; Correia, A.G.; Henriques, A.A. Sensitivity analysis of vertically loaded pile reliability. Soils Found. 2012, 52, 1118–1129. [Google Scholar] [CrossRef]
- Zhang, L.; Tang, W.H.; Ng, C.W. Reliability of axially loaded driven pile groups. J. Geotech. Geoenviron. Eng. 2001, 127, 1051–1060. [Google Scholar] [CrossRef]
- Chan, C.L.; Low, B.K. Reliability analysis of laterally loaded piles involving nonlinear soil and pile behavior. J. Geotech. Geoenviron. Eng. 2009, 135, 431–443. [Google Scholar] [CrossRef]
- Kozubal, J.; Puła, W.; Wyjadłowski, M.; Bauer, J. Influence of varying soil properties on evaluation of pile reliability under lateral loads. J. Civ. Eng. Manag. 2013, 19, 272–284. [Google Scholar] [CrossRef]
- Tandjiria, V.; Teh, C.I.; Low, B.K. Reliability analysis of laterally loaded piles using response surface methods. Struct. Saf. 2000, 22, 335–355. [Google Scholar] [CrossRef]
- Haldar, S.; Babu, G.S. Effect of soil spatial variability on the response of laterally loaded pile in undrained clay. Comput. Geotech. 2008, 35, 537–547. [Google Scholar] [CrossRef]
- Zhang, X.L.; Jiao, B.H.; Hou, B.W. Reliability analysis of horizontally loaded pile considering spatial variability of soil parameters. Soil Dyn. Earthq. Eng. 2021, 143, 106648. [Google Scholar] [CrossRef]
- Zhang, X.; Jiao, B.; Han, Y.; Chen, S.; Li, X. Random field model of soil parameters and the application in reliability analysis of laterally loaded pile. Soil Dyn. Earthq. Eng. 2021, 147, 106821. [Google Scholar]
- Phoon, K.K.; Quek, S.T.; Chow, Y.K.; Lee, S.L. Reliability analysis of pile settlement. J. Geotech. Eng. 1990, 116, 1717–1734. [Google Scholar] [CrossRef]
- Zhang, D.; Dai, H.; Wang, H.; Huang, H.; Liu, D. Investigating the Effect of Geological Heterogeneity of Strata on the Bearing Capacity of Shallow Foundations Using Markov Random Field. ASCE-ASME J. Risk Uncertain. Eng.Syst. Part A Civ. Eng. 2021, 7, 04021060. [Google Scholar] [CrossRef]
- Eloseily, K.H.; Ayyub, B.M.; Patev, R. Reliability assessment of pile groups in sands. J. Struct. Eng. 2002, 128, 1346–1353. [Google Scholar] [CrossRef]
- Liu, Y.; Zhang, L. Seismic response of pile–raft system embedded in spatially random clay. Géotechnique 2019, 69, 638–645. [Google Scholar] [CrossRef]
- Esposito, G.; Fenton, G.A.; Naghibi, F. Seismic reliability of axially loaded vertical piles. Can. Geotech. J. 2020, 57, 1805–1819. [Google Scholar] [CrossRef]
- Bazzurro, P.; Cornell, C.A. Ground-motion amplification in nonlinear soil sites with uncertain properties. Bull. Seismol. Soc. Am. 2004, 94, 2090–2109. [Google Scholar] [CrossRef]
- Bray, J.D.; Travasarou, T. Simplified procedure for estimating earthquake-induced deviatoric slope displacements. J. Geotech. Geoenviron. Eng. 2007, 133, 381–392. [Google Scholar] [CrossRef]
- Calabrese, A.; Lai, C.G. Sensitivity analysis of the seismic response of gravity quay walls to perturbations of input parameters. Soil Dyn. Earthq. Eng. 2016, 82, 55–62. [Google Scholar] [CrossRef]
- Kim, J.M.; Sitar, N. Probabilistic evaluation of seismically induced permanent deformation of slopes. Soil Dyn. Earthq. Eng. 2013, 44, 67–77. [Google Scholar] [CrossRef]
- Lopez-Caballero, F.; Modaressi-Farahmand-Razavi, A. Assessment of variability and uncertainties effects on the seismic response of a liquefiable soil profile. Soil Dyn. Earthq. Eng. 2010, 30, 600–613. [Google Scholar] [CrossRef]
- Zhu, C.; Cheng, H.; Bao, Y.; Chen, Z.; Huang, Y. Shaking table tests on the seismic response of slopes to near-fault ground motion. Geomech. Eng. 2022, 29, 133–143. [Google Scholar]
- Zhu, C.; Huang, Y.; Sun, J. Solid-like and liquid-like granular flows on inclined surfaces under vibration–Implications for earthquake-induced landslides. Comput. Geotech. 2020, 123, 103598. [Google Scholar] [CrossRef]
- Conte, E.; Troncone, A.; Vena, M. Nonlinear three-dimensional analysis of reinforced concrete piles subjected to horizontal loading. Comput. Geotech. 2013, 49, 123–133. [Google Scholar] [CrossRef]
- Fujii, S.; Isemoto, N.; Satou, Y.; Kaneko, O.; Funahara, H.; Arai, T.; Tokimatsu, K. Investigation and analysis of a pile foundation damaged by liquefaction during the 1995 Hyogoken-Nambu earthquake. Soils Found. 1998, 38, 179–192. [Google Scholar] [CrossRef]
- Huang, A.B.; Hsueh, C.K.; O’Neill, M.W.; Chern, S.; Chen, C. Effects of construction on laterally loaded pile groups. J. Geotech. Geoenviron. Eng. 2001, 127, 385–397. [Google Scholar] [CrossRef]
- Karkee, M.B.; Kishida, H. Investigations on a new building with pile foundation damaged by the Hyogoken–Nambu (Kobe) earthquake. Struct. Des. Tall Build. 1997, 6, 311–332. [Google Scholar] [CrossRef]
- Maki, T.; Mutsuyoshi, H. Seismic behavior of reinforced concrete piles under ground. J. Adv. Concr. Technol. 2004, 2, 37–47. [Google Scholar] [CrossRef][Green Version]
- Motosaka, M.; Mitsuji, K. Building damage during the 2011 off the Pacific coast of Tohoku Earthquake. Soils Found. 2012, 52, 929–944. [Google Scholar] [CrossRef]
- Tokimatsu, K.; Tamura, S.; Suzuki, H.; Katsumata, K. Building damage associated with geotechnical problems in the 2011 Tohoku Pacific Earthquake. Soils Found. 2012, 52, 956–974. [Google Scholar] [CrossRef]
- Hu, H.; Huang, Y.; Xiong, M. PDEM-based seismic performance assessment of retaining walls considering spatial variability of soil properties. J. Earthq. Eng. 2022, 26, 52–69. [Google Scholar] [CrossRef]
- Hu, H.; Huang, Y.; Zhao, L. Probabilistic Seismic-Stability Analysis of Slopes Considering the Coupling Effect of Random Ground Motions and Spatially-Variable Soil Properties. Nat. Hazards Rev. 2020, 21, 04020028. [Google Scholar] [CrossRef]
- Huang, Y.; Hu, H.; Xiong, M. Probability density evolution method for seismic displacement-based assessment of earth retaining structures. Eng. Geol. 2018, 234, 167–173. [Google Scholar] [CrossRef]
- Li, J. A PDEM-based perspective to engineering reliability: From structures to lifeline networks. Front. Struct. Civ. Eng. 2020, 14, 1056–1065. [Google Scholar] [CrossRef]
- Li, J.; Chen, J. Stochastic Dynamics of Structures; John Wiley & Sons: Hoboken, NJ, USA, 2009. [Google Scholar]
- Huang, Y.; Xiong, M.; Zhou, H. Ground seismic response analysis based on the probability density evolution method. Eng. Geol. 2015, 198, 30–39. [Google Scholar] [CrossRef]
- Pang, R.; Xu, B.; Kong, X.; Zhou, Y.; Zou, D. Seismic performance evaluation of high CFRD slopes subjected to near-fault ground motions based on generalized probability density evolution method. Eng. Geol. 2018, 246, 391–401. [Google Scholar] [CrossRef]
- Li, J.; Chen, J.B.; Fan, W.L. The equivalent extreme-value event and evaluation of the structural system reliability. Struct. Saf. 2007, 29, 112–131. [Google Scholar] [CrossRef]
- Yang, J.; Jensen, H.; Chen, J. Structural optimization under dynamic reliability constraints utilizing probability density evolution method and metamodels in augmented input space. Struct. Multidiscip. Optim. 2022, 65, 1–26. [Google Scholar] [CrossRef]
- Liu, Z.; Liu, W.; Peng, Y. Random function based spectral representation of stationary and non-stationary stochastic processes. Probab. Eng. Mech. 2016, 45, 115–126. [Google Scholar] [CrossRef]
- Liu, Z.; Liu, Z.; Xu, Y. Probability density evolution analysis of a shear-wall structure under stochastic ground motions by shaking table test. Soil Dyn. Earthq. Eng. 2019, 122, 53–66. [Google Scholar]
- GB50011–2010Code for Seismic Design of Buildings; Ministry of Housing and Urban-Rural Development of People’s Republic of China: Beijing, China, 2010.
- Kaul, M.K. Stochastic characterization of earthquakes through their response spectrum. Earthq. Eng. Struct. Dyn. 1978, 6, 497–509. [Google Scholar] [CrossRef]
- Akiyama, M.; Abe, S.; Aoki, N.; Suzuki, M. Flexural test of precast high-strength reinforced concrete pile prestressed with unbonded bars arranged at the center of the cross-section. Eng. Struct. 2012, 34, 259–270. [Google Scholar] [CrossRef]
- Wang, T.C.; Yang, Z.J.; Zhao, H.L.; Wang, W.J. Seismic performance of prestressed high strength concrete piles. Mater. Res. Innov. 2014, 18 (Suppl. 2), S2-515-S2-521. [Google Scholar] [CrossRef]
- Zhang, X.; Niu, S.; Yan, J.B.; Zhang, S. Seismic behaviour of prestressed high-strength concrete piles under combined axial compression and cyclic horizontal loads. Adv. Struct. Eng. 2019, 22, 1089–1105. [Google Scholar] [CrossRef]
- Hibbit, H.D.; Karlsson, B.I.; Sorensen, P. ABAQUS Theory and User’s Manual; USA Pawtucket, Inc.: Pawtucket, RI, USA, 2010. [Google Scholar]
- GB50010–2010Code for Design of Concrete Structures; Ministry of Housing and Urban-Rural Development of People’s Republic of China: Beijing, China, 2015.
- Günay, S.; Mosalam, K.M. PEER performance-based earthquake engineering methodology, revisited. J. Earthq. Eng. 2013, 17, 829–858. [Google Scholar] [CrossRef]
- China Railway. Rules for Subgrade Repair of High-Speed Railway (TG/GW 120—2015); China Railway Publishing House: Beijing, China, 2014. (In Chinese) [Google Scholar]
- Zhang, B.; Qian, W.; Qi, T.; Xiang, Z.; Wang, Y. Prediction of the High-speed Railway Subgrade Settlement Induced by the Tunnel Construction and Its Safety Control. Chin. J. Undergr. Space Eng. 2021, 17, 282–289. (In Chinese) [Google Scholar]
Disclaimer/Publisher’s Note: The statements, opinions and data contained in all publications are solely those of the individual author(s) and contributor(s) and not of MDPI and/or the editor(s). MDPI and/or the editor(s) disclaim responsibility for any injury to people or property resulting from any ideas, methods, instructions or products referred to in the content. |
© 2022 by the authors. Licensee MDPI, Basel, Switzerland. This article is an open access article distributed under the terms and conditions of the Creative Commons Attribution (CC BY) license (https://creativecommons.org/licenses/by/4.0/).

