
Techno-Economic and Environmental Analysis of Decommissioned Flowline, Umbilical, and Tubular for Breakwaters


Abstract

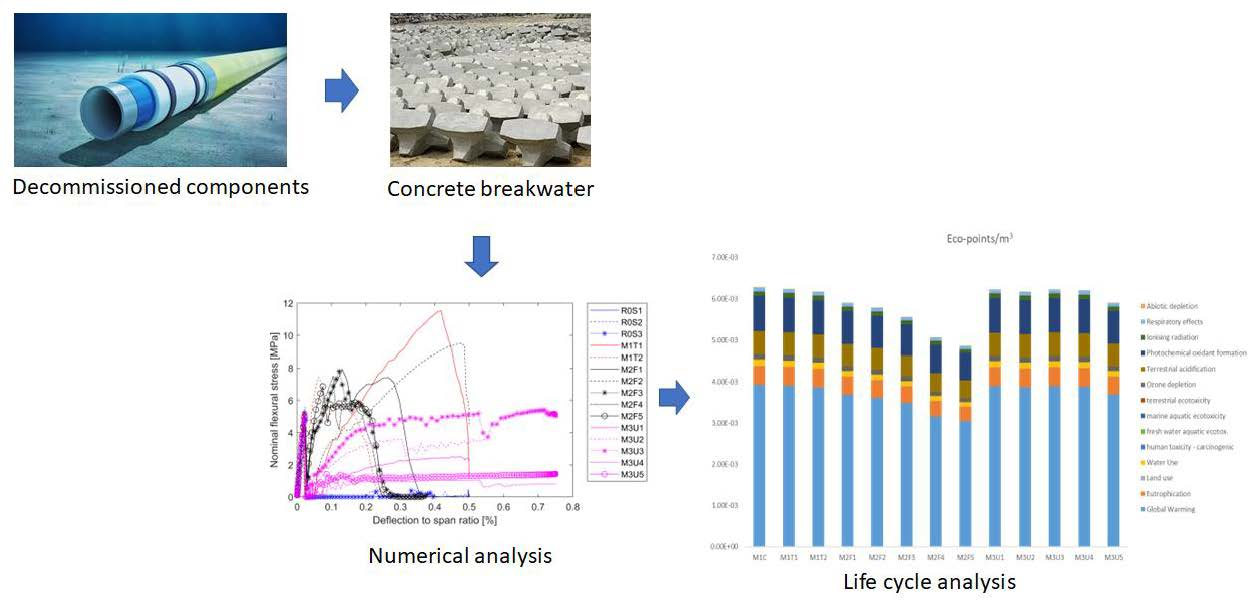
1. Introduction
1.1. Background
1.2. Coastal Protection Concrete Structure
1.3. Environmental and Economic Impacts
2. Materials and Methods
2.1. Concrete Mixes
2.2. Material Properties
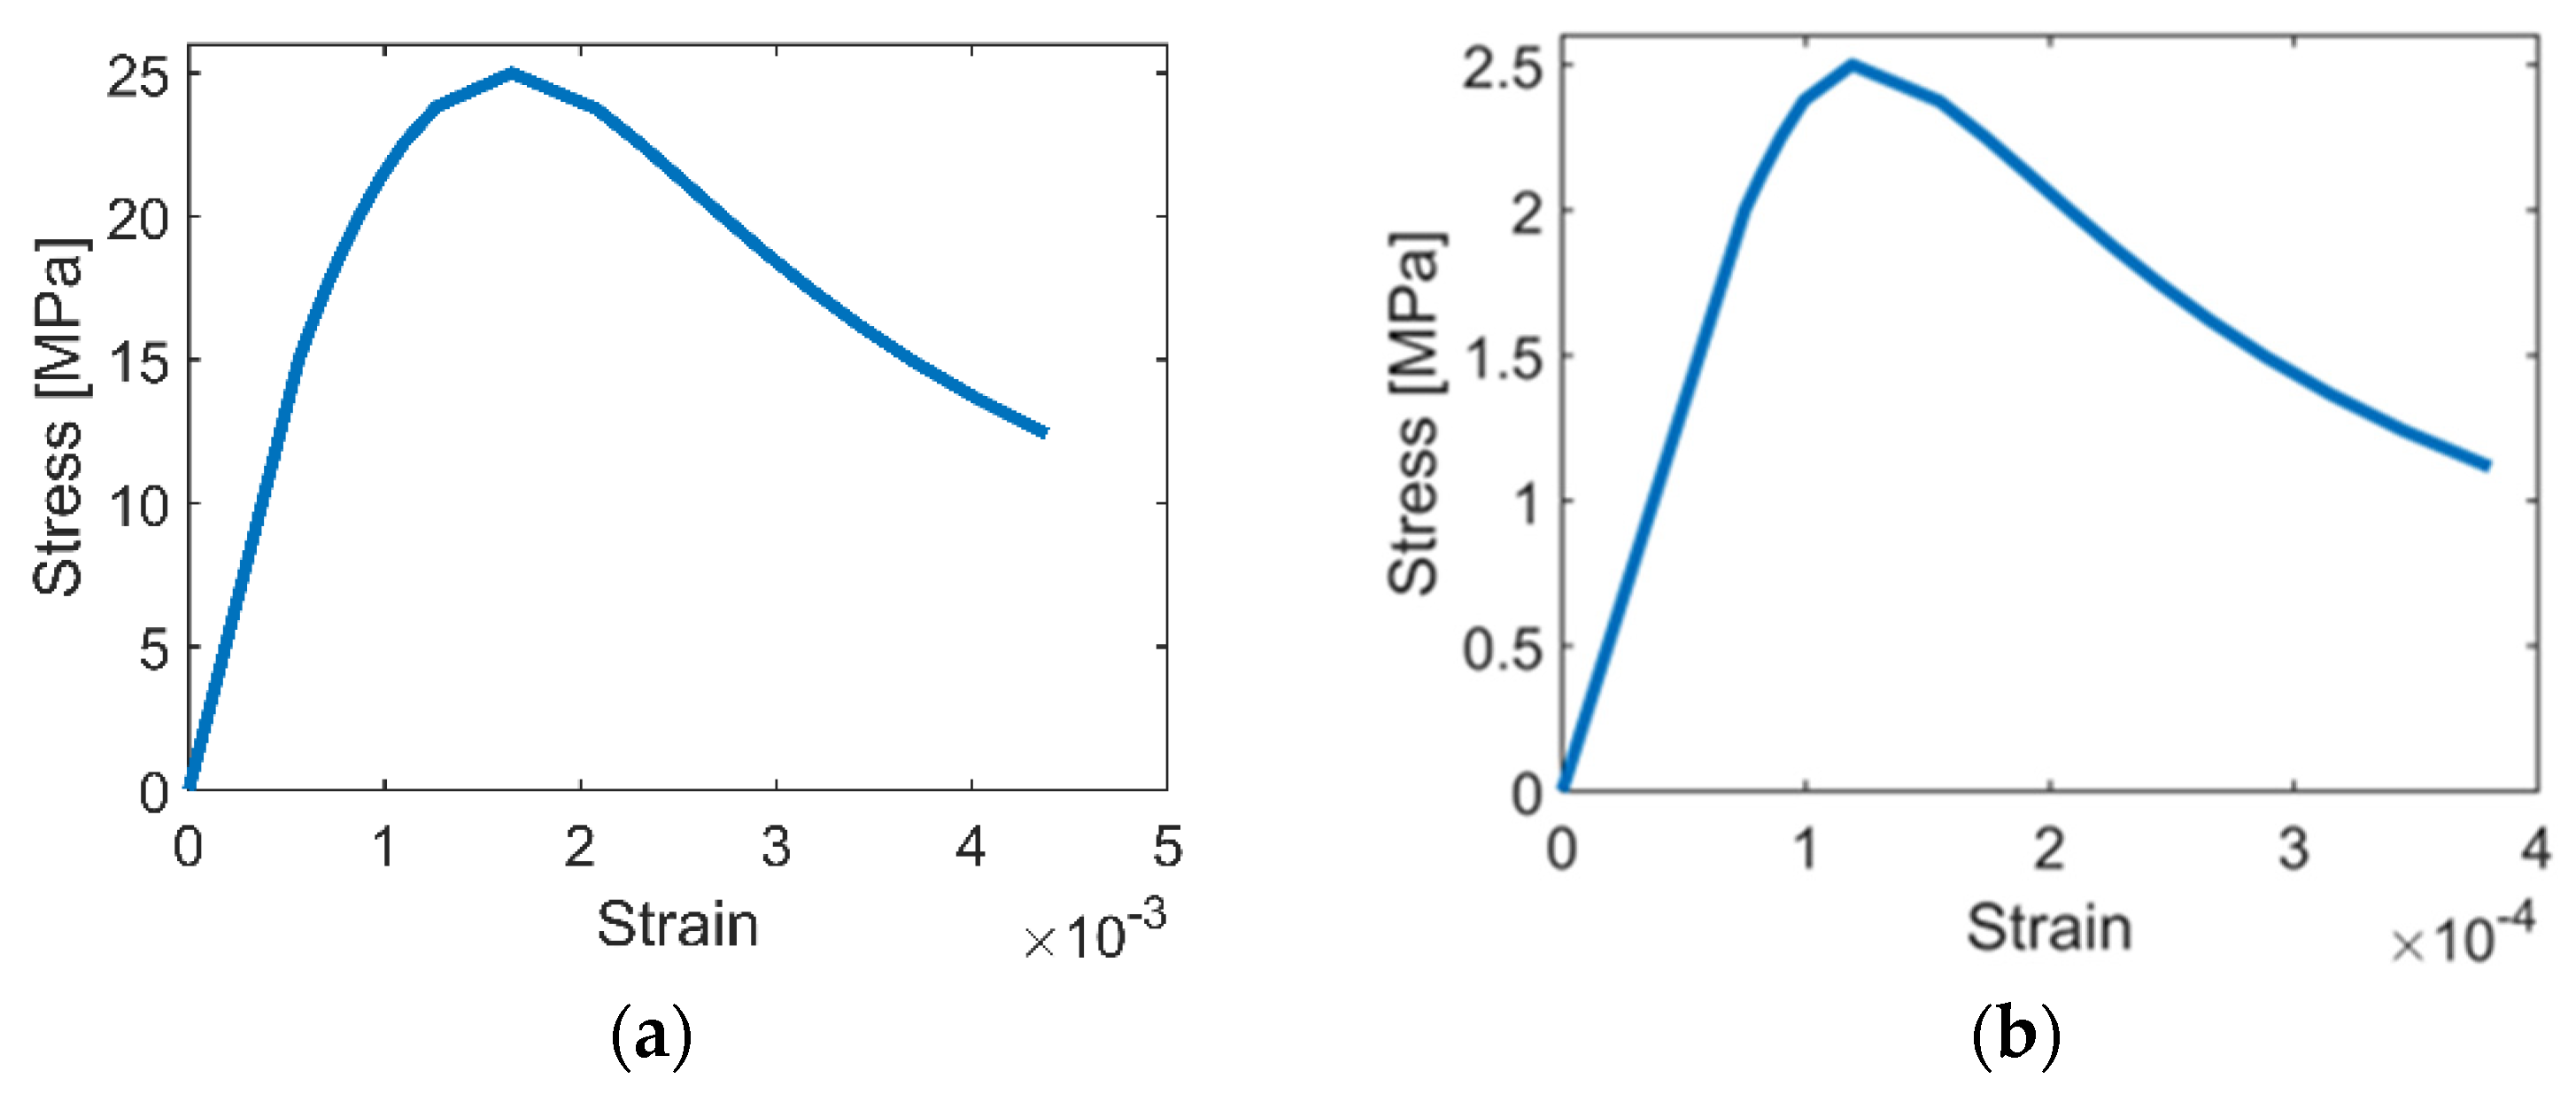
2.2.1. Concrete
2.2.2. Flowline
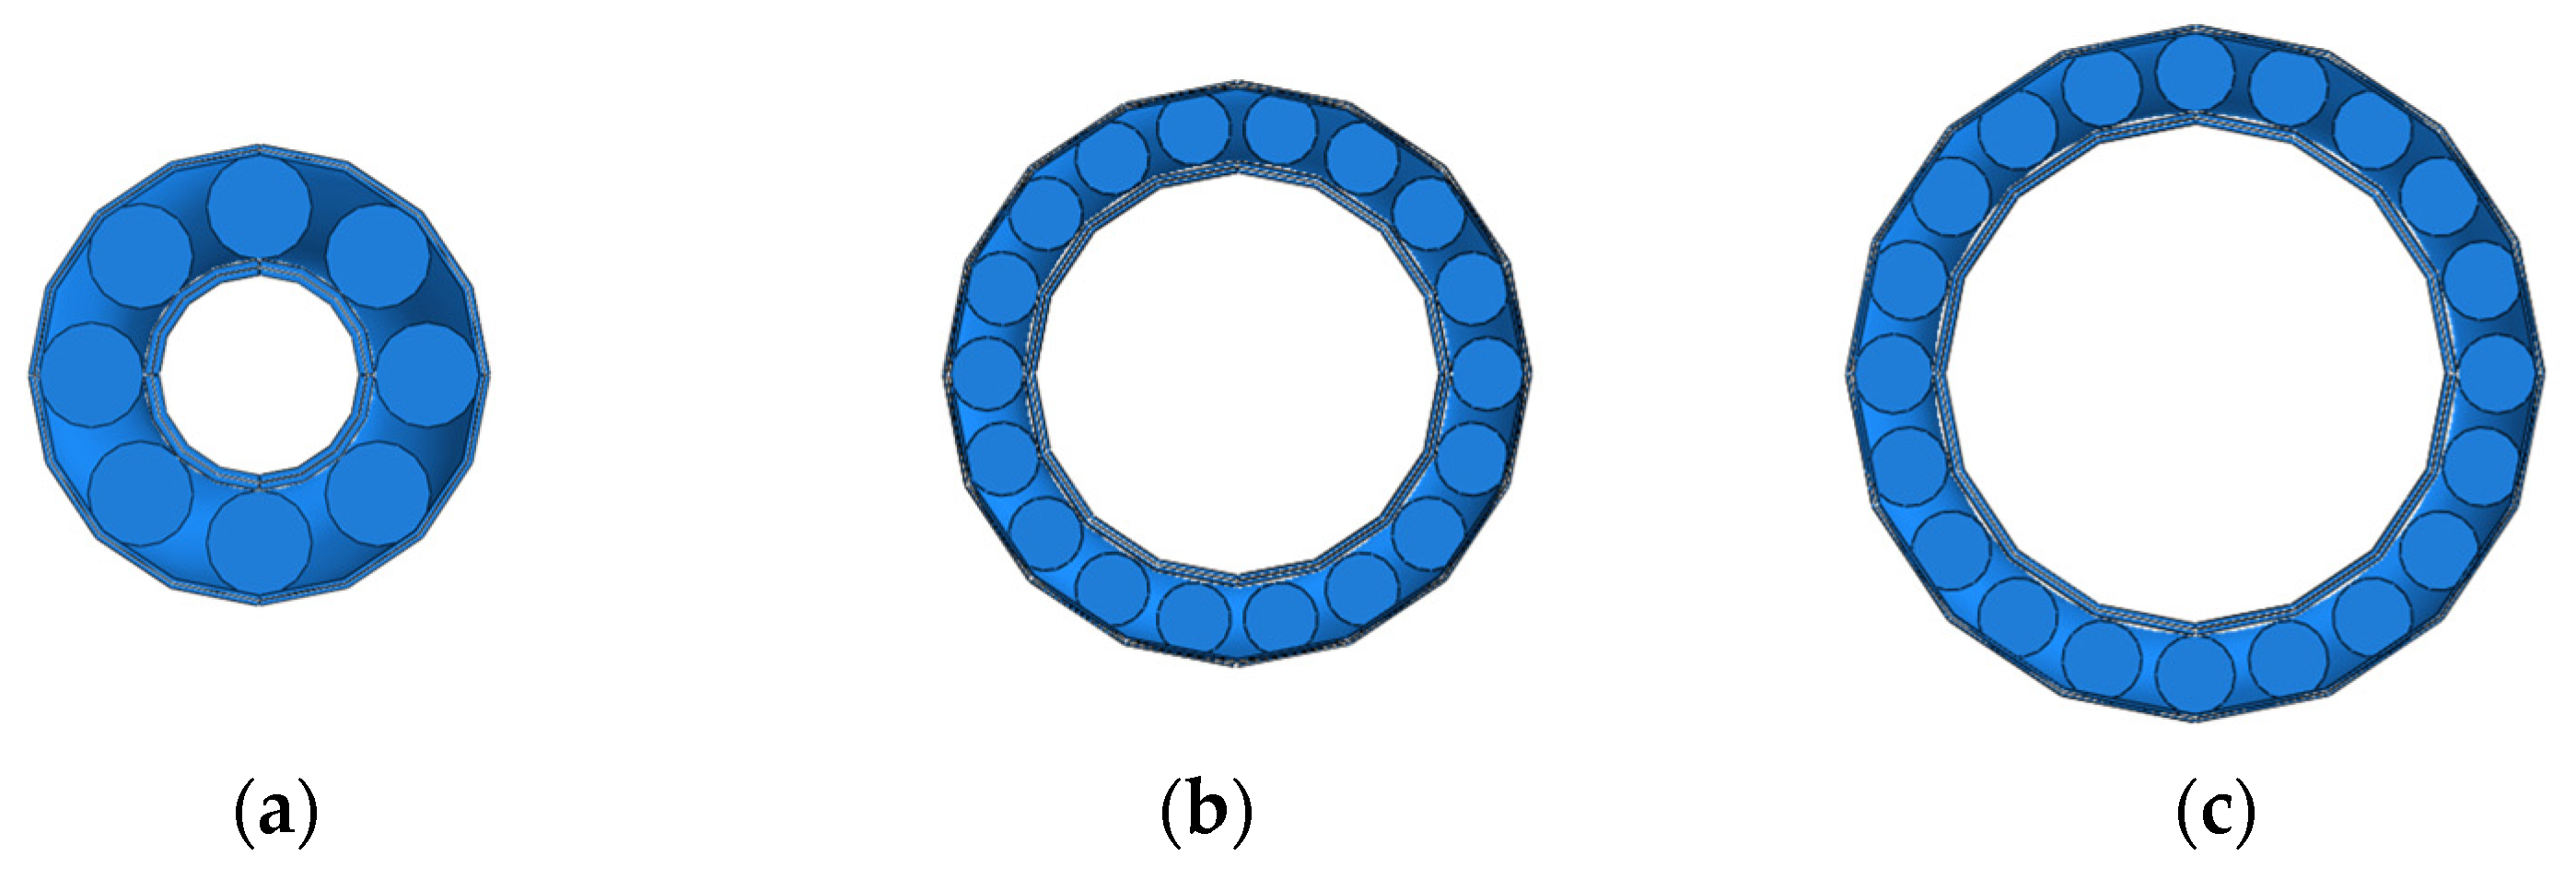
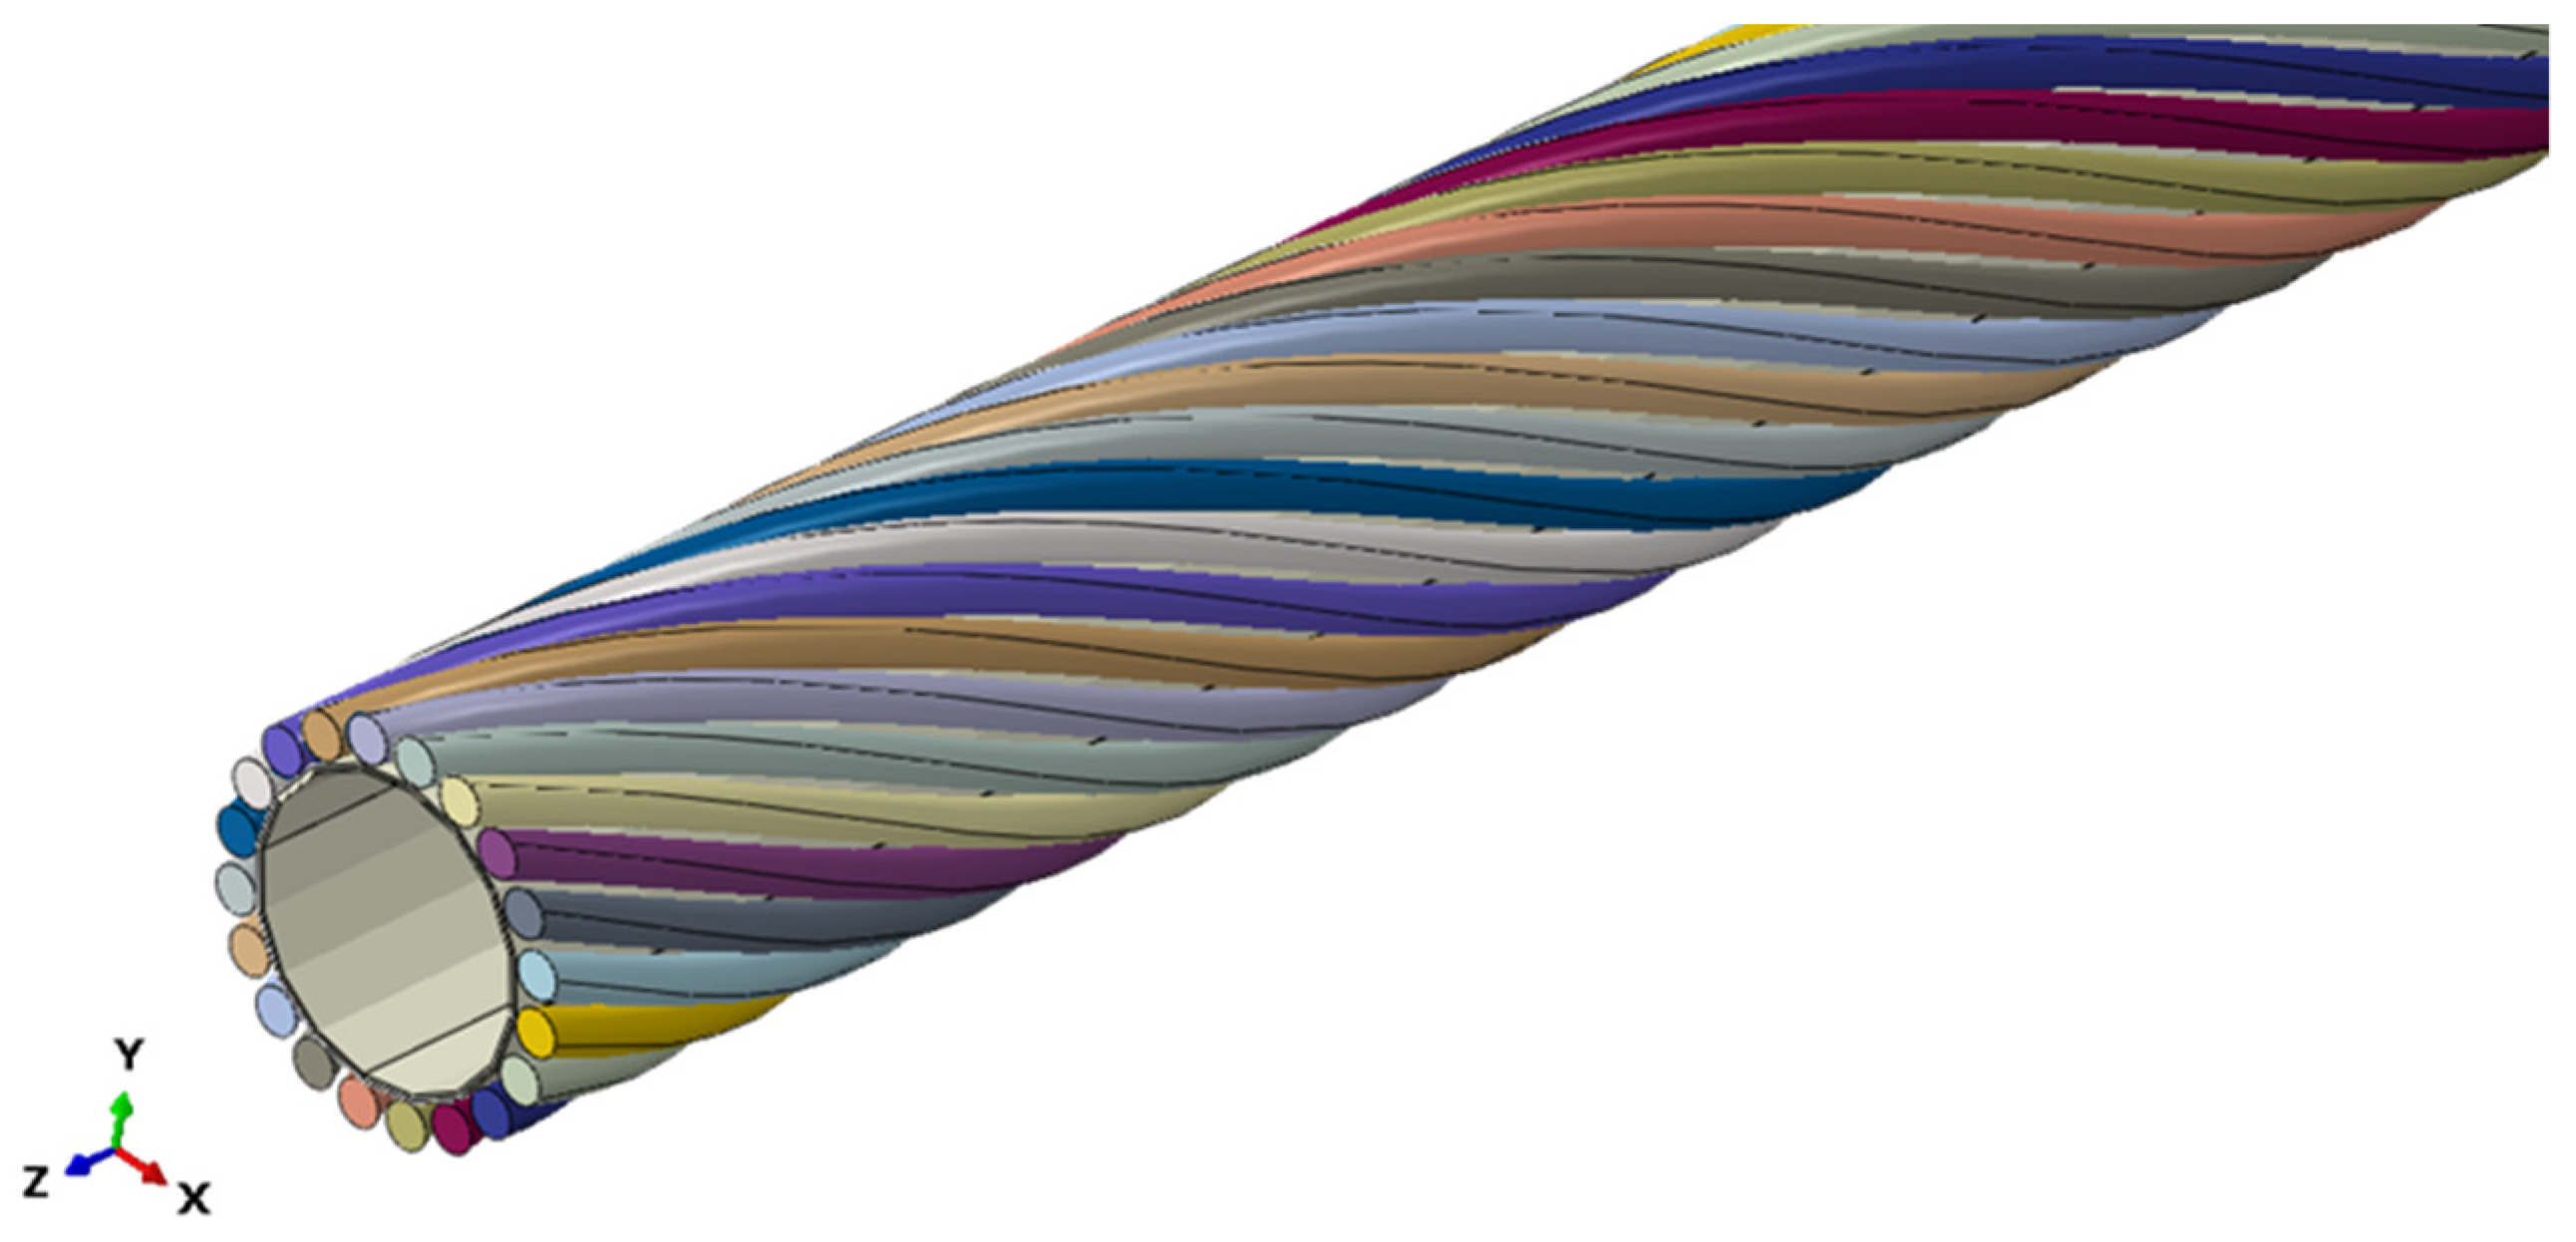
2.2.3. Umbilical
2.2.4. Tubular
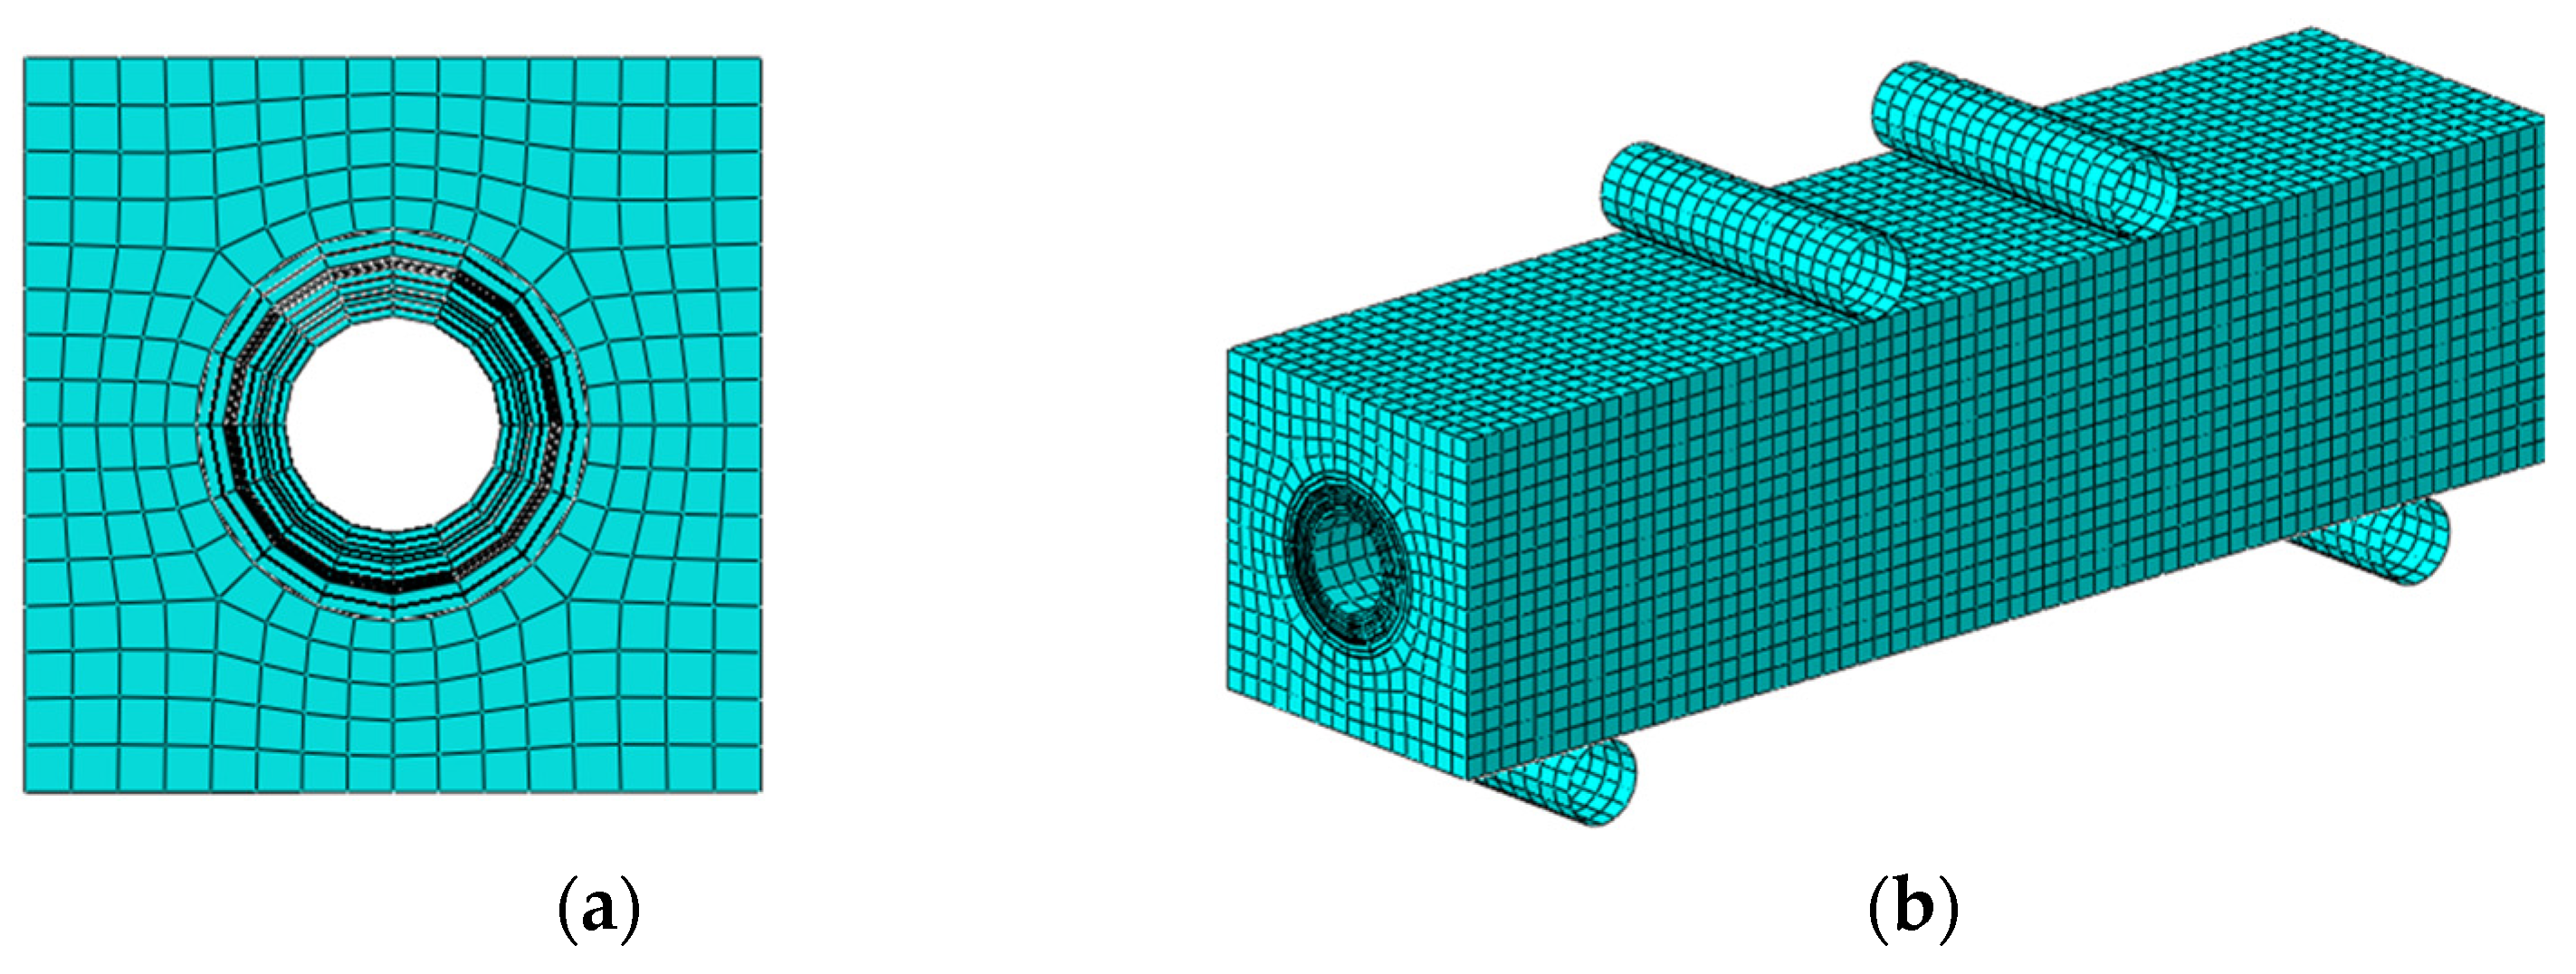
2.3. Element Type and Mesh Strategy
2.4. Contact Properties
2.5. Boundary Conditions
2.6. Type of Solver and Solution Process
2.7. Eco-Efficiency Framework
2.7.1. Life-Cycle Assessment
- The weights of the flowline and the umbilical are specified from the decommissioned offshore oilfield facilities.
- The thicknesses of the decommissioned components, as shown in Table 3, is an input for determining the cutting energy of three different decommissioned components.
- The cutting energy for tubular is predicted informally by Total Metal Recycling in Western Australia, suggesting that a 400 mm 3-phase cut-off saw would be the best on each diameter. The time for each cut would be about 60 s (+/− 10%). The cut-off saws/cutters would be at about 2000 watts to 2500 watts on a three-phase supply. The specifications of the cutters, as shown in Table 7, are obtained from Wachs [18]. The cutting energy for cutting the decommissioned flowlines was later validated at Curtin University, Australia. A cutting machine (BOMAR, STG440DGH) of 3.7 kW was used to cut a 9 inches flowline in 20 min.
- Emissions from cutting decommissioned components for their use in concrete are considered.
- Natural-gas-fuelled reciprocating engine generating sets that are used in Port Hedland are considered as a supplier of this electricity.
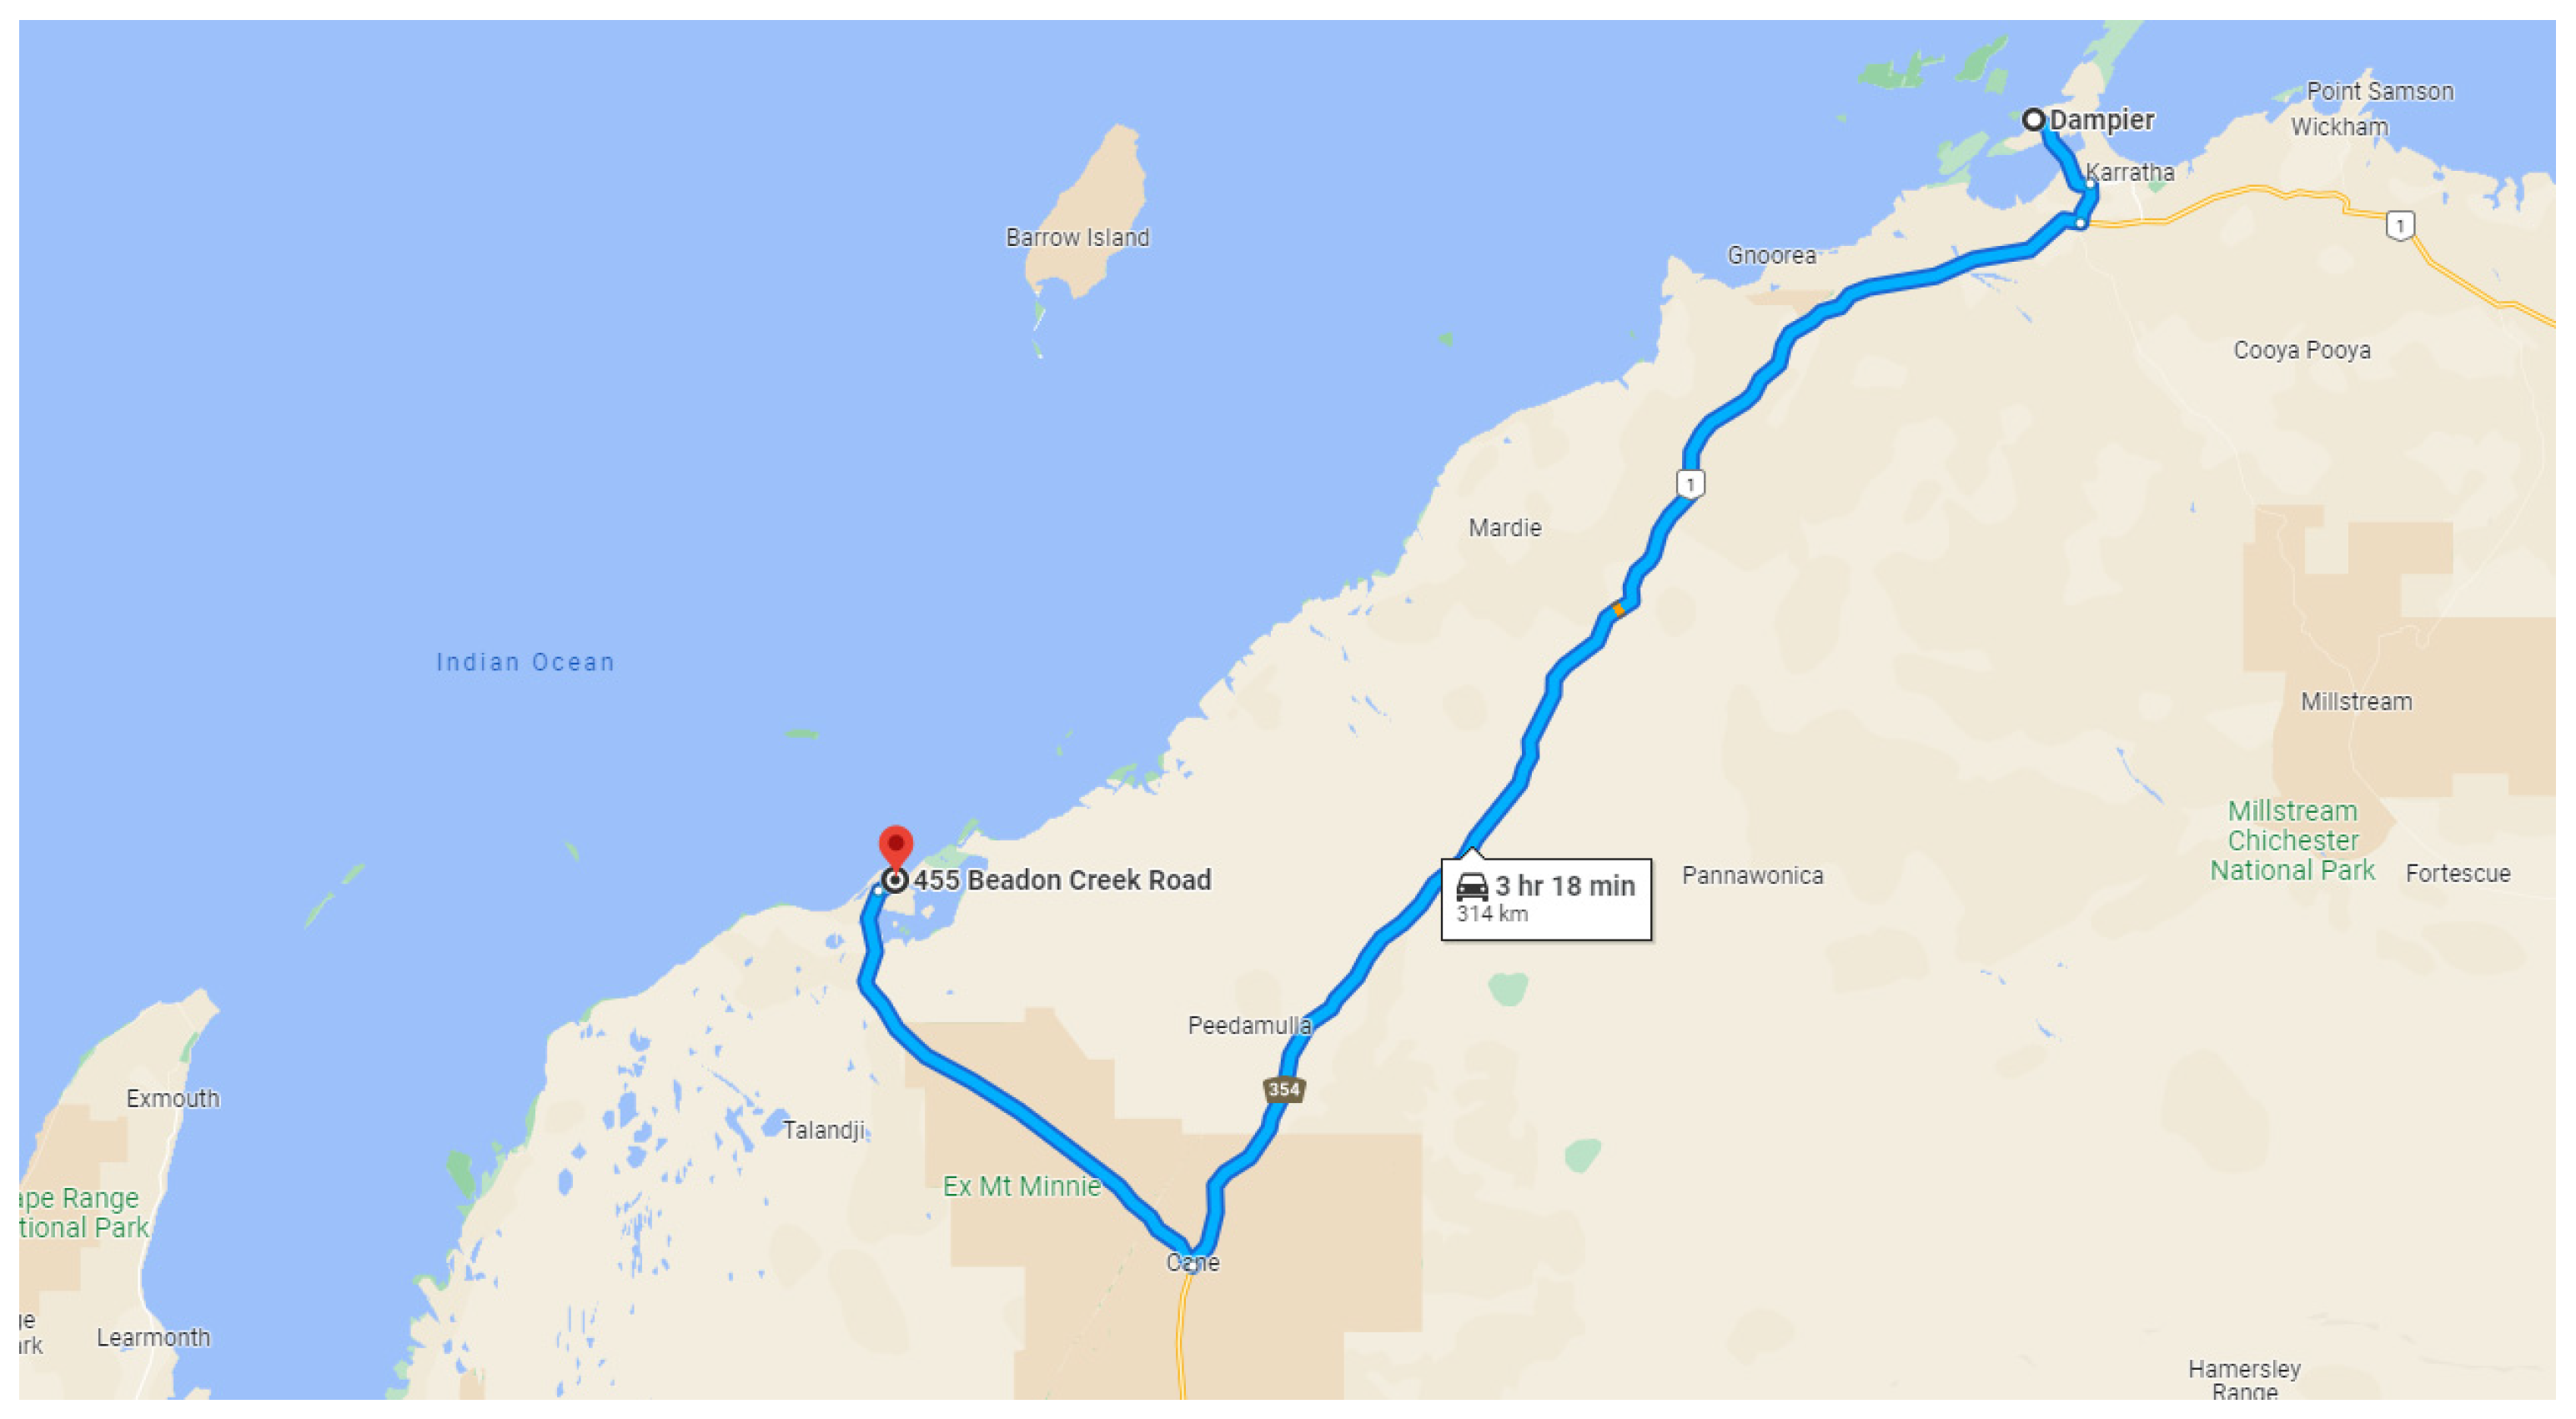
- Emissions from the transportation of decommissioned materials from offshore to Dampier are excluded as they would have been eventually brought back to shore, even though they are not used in the concrete mixes.
2.7.2. Economic Costs
2.7.3. Eco-Efficiency Analysis
- = the normalised value of the environmental impact i of concrete structure n;
- = the life-cycle environmental impact i of concrete structure n over all life-cycle stages;
- = the gross domestic environmental impact i;
- = the net capita of inhabitants;
- = the th impact category considered in the LCIA.
- = the total normalised environmental impact of concrete structure n;
- = the weighting factor of impact category i of a concrete mix n;
- The summation of each must add to 100%.
- n = the normalised total cost of concrete structure n;
- = economic cost of concrete structure n;
- = gross domestic product per capita of the region.
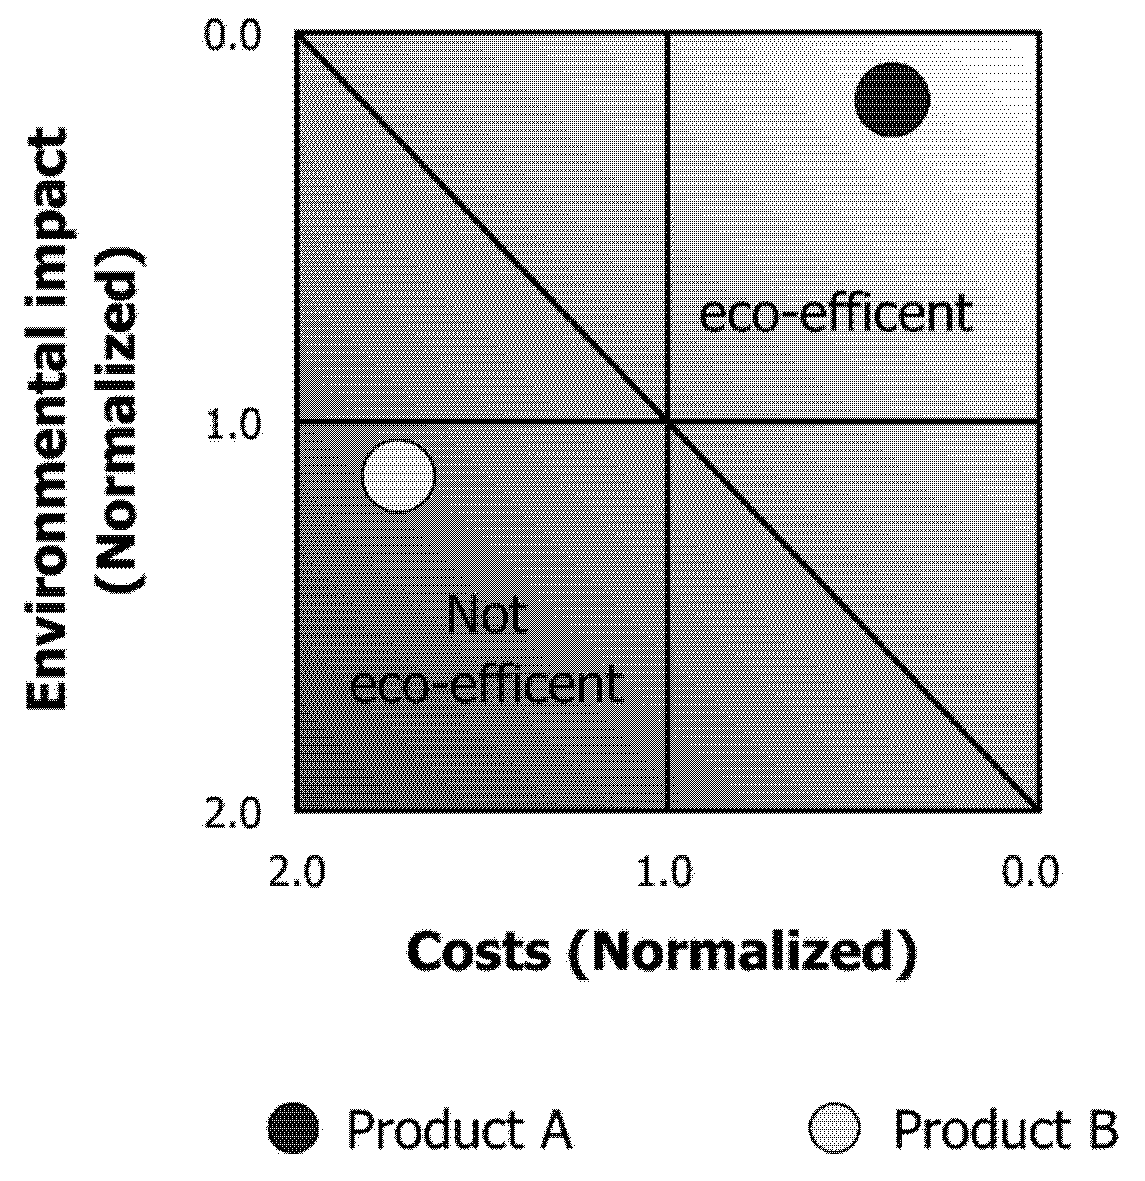
2.7.4. Eco-Efficiency Portfolio
- = environmental impact preliminary portfolio position for option ;
- = cost preliminary portfolio position for option ;
- = refers to the total number of the concrete structures.
- = the relevance factor of environmental impact to cost of all options;
- = the number of concrete structures to be considered in this portfolio.
- = adjusted environmental portfolio position of concrete structure design ;
- = adjusted cost portfolio position of concrete structure design .
3. Results and Discussions
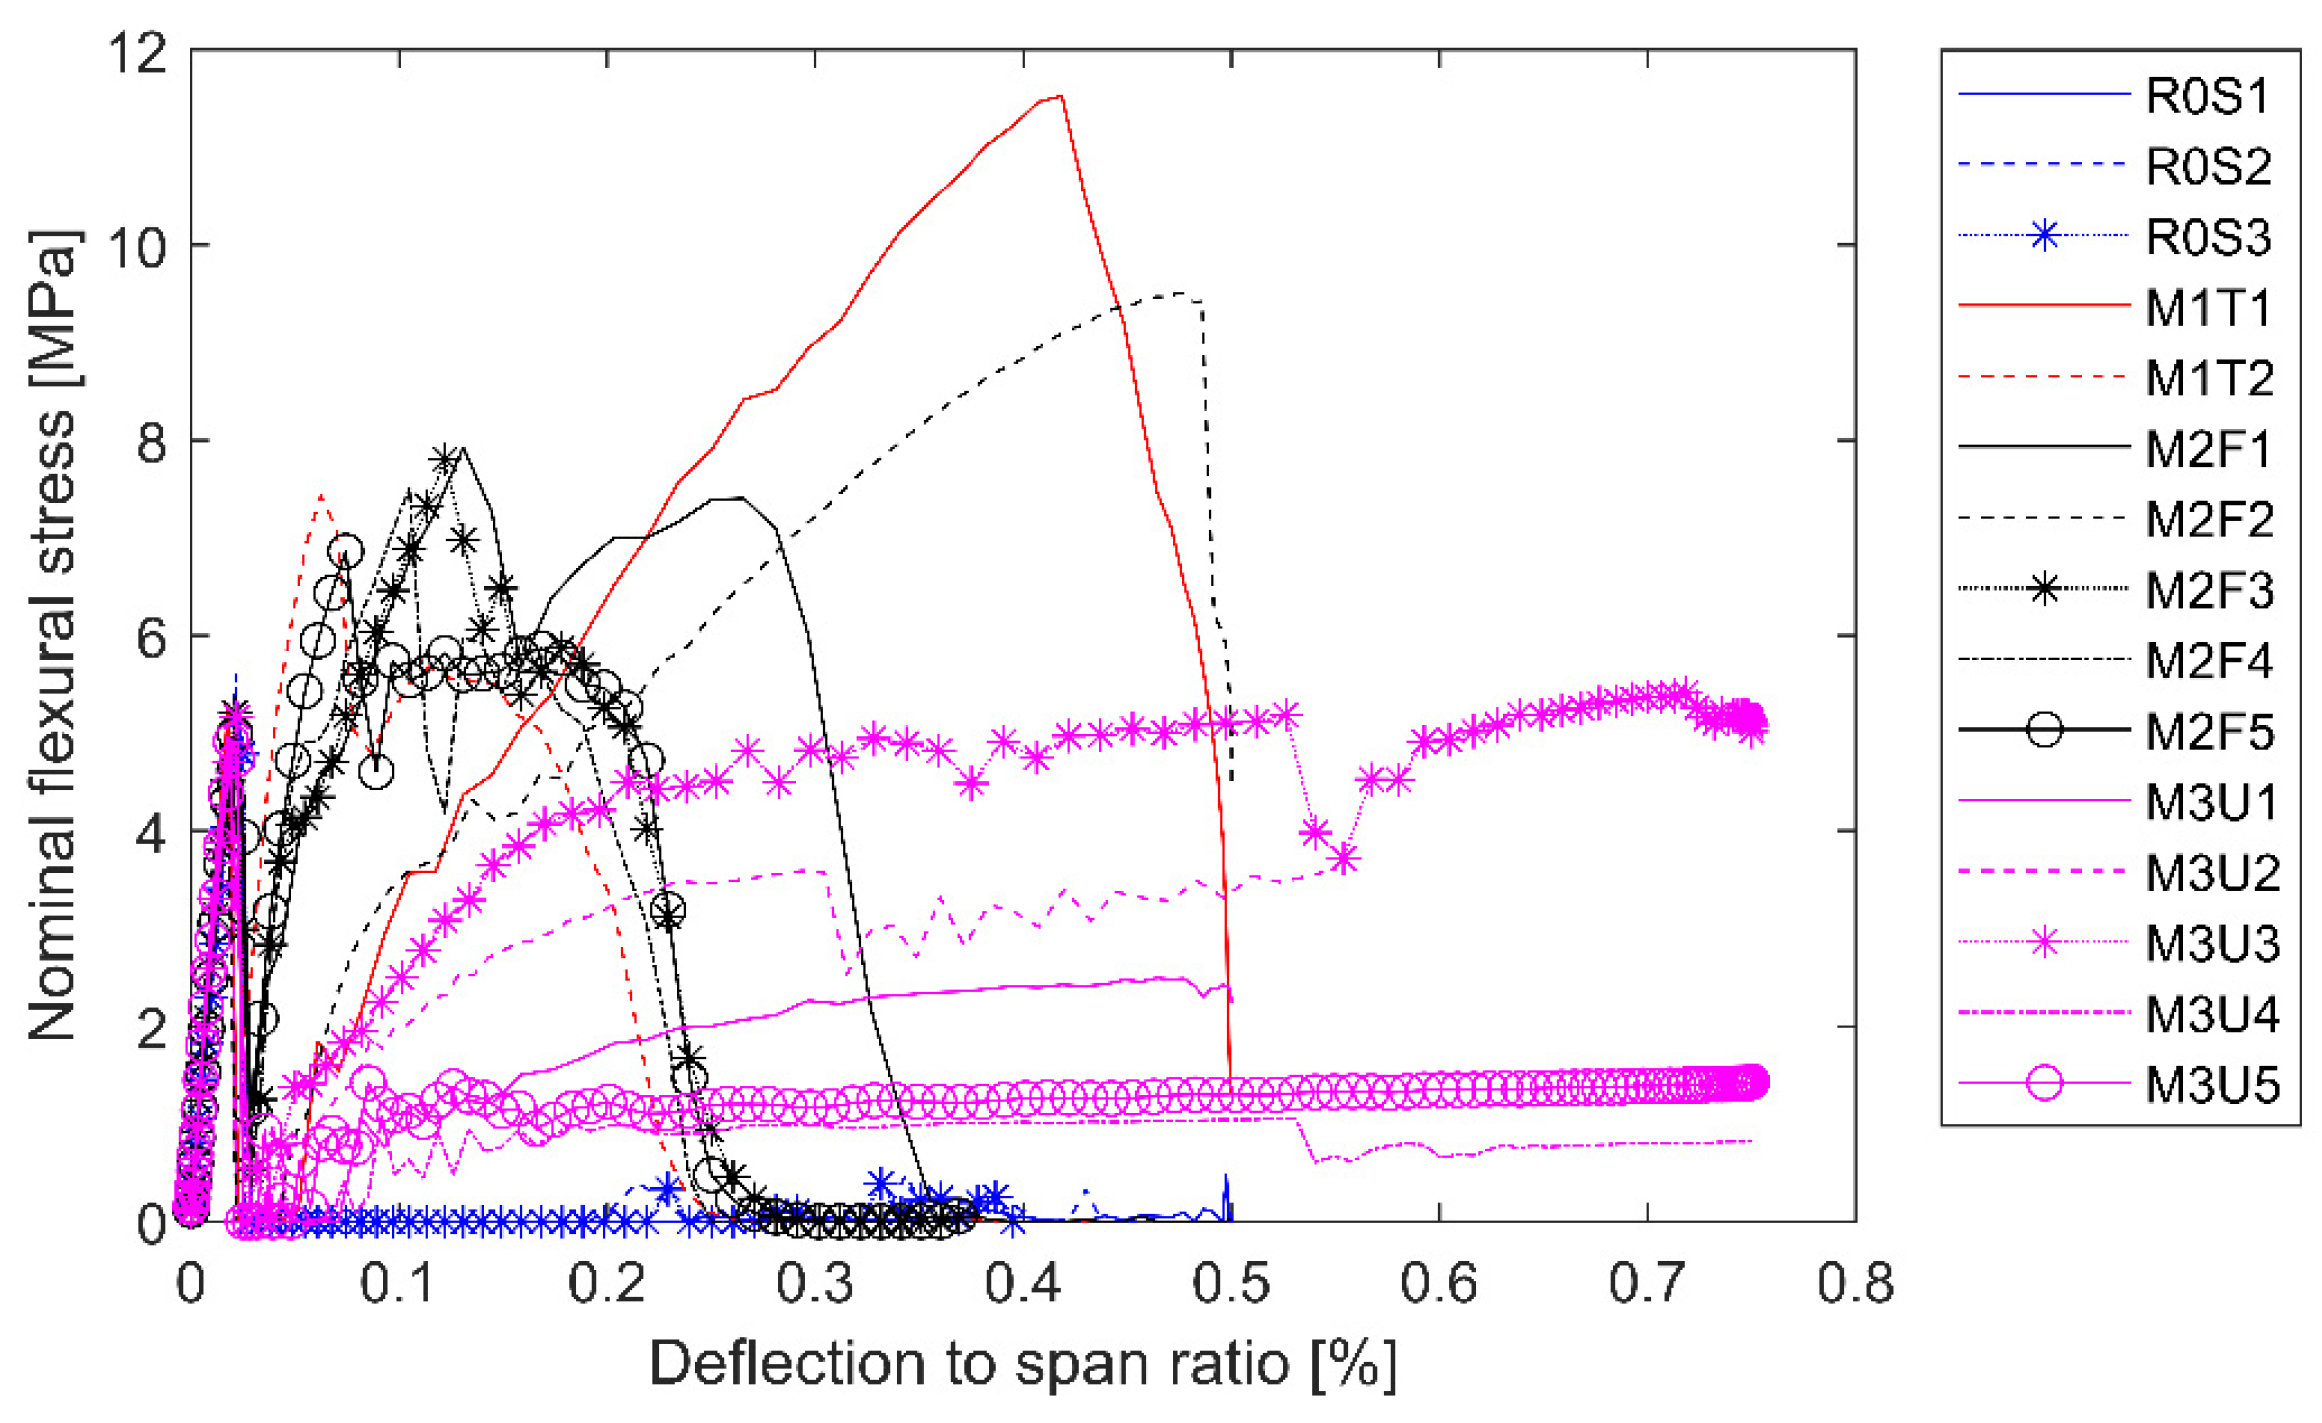
3.1. Flexural Strength
- σf = nominal flexural stress.
- drel = deflection-to-span ratio;
- d = maximum deflection of the beam between the two loading rollers.
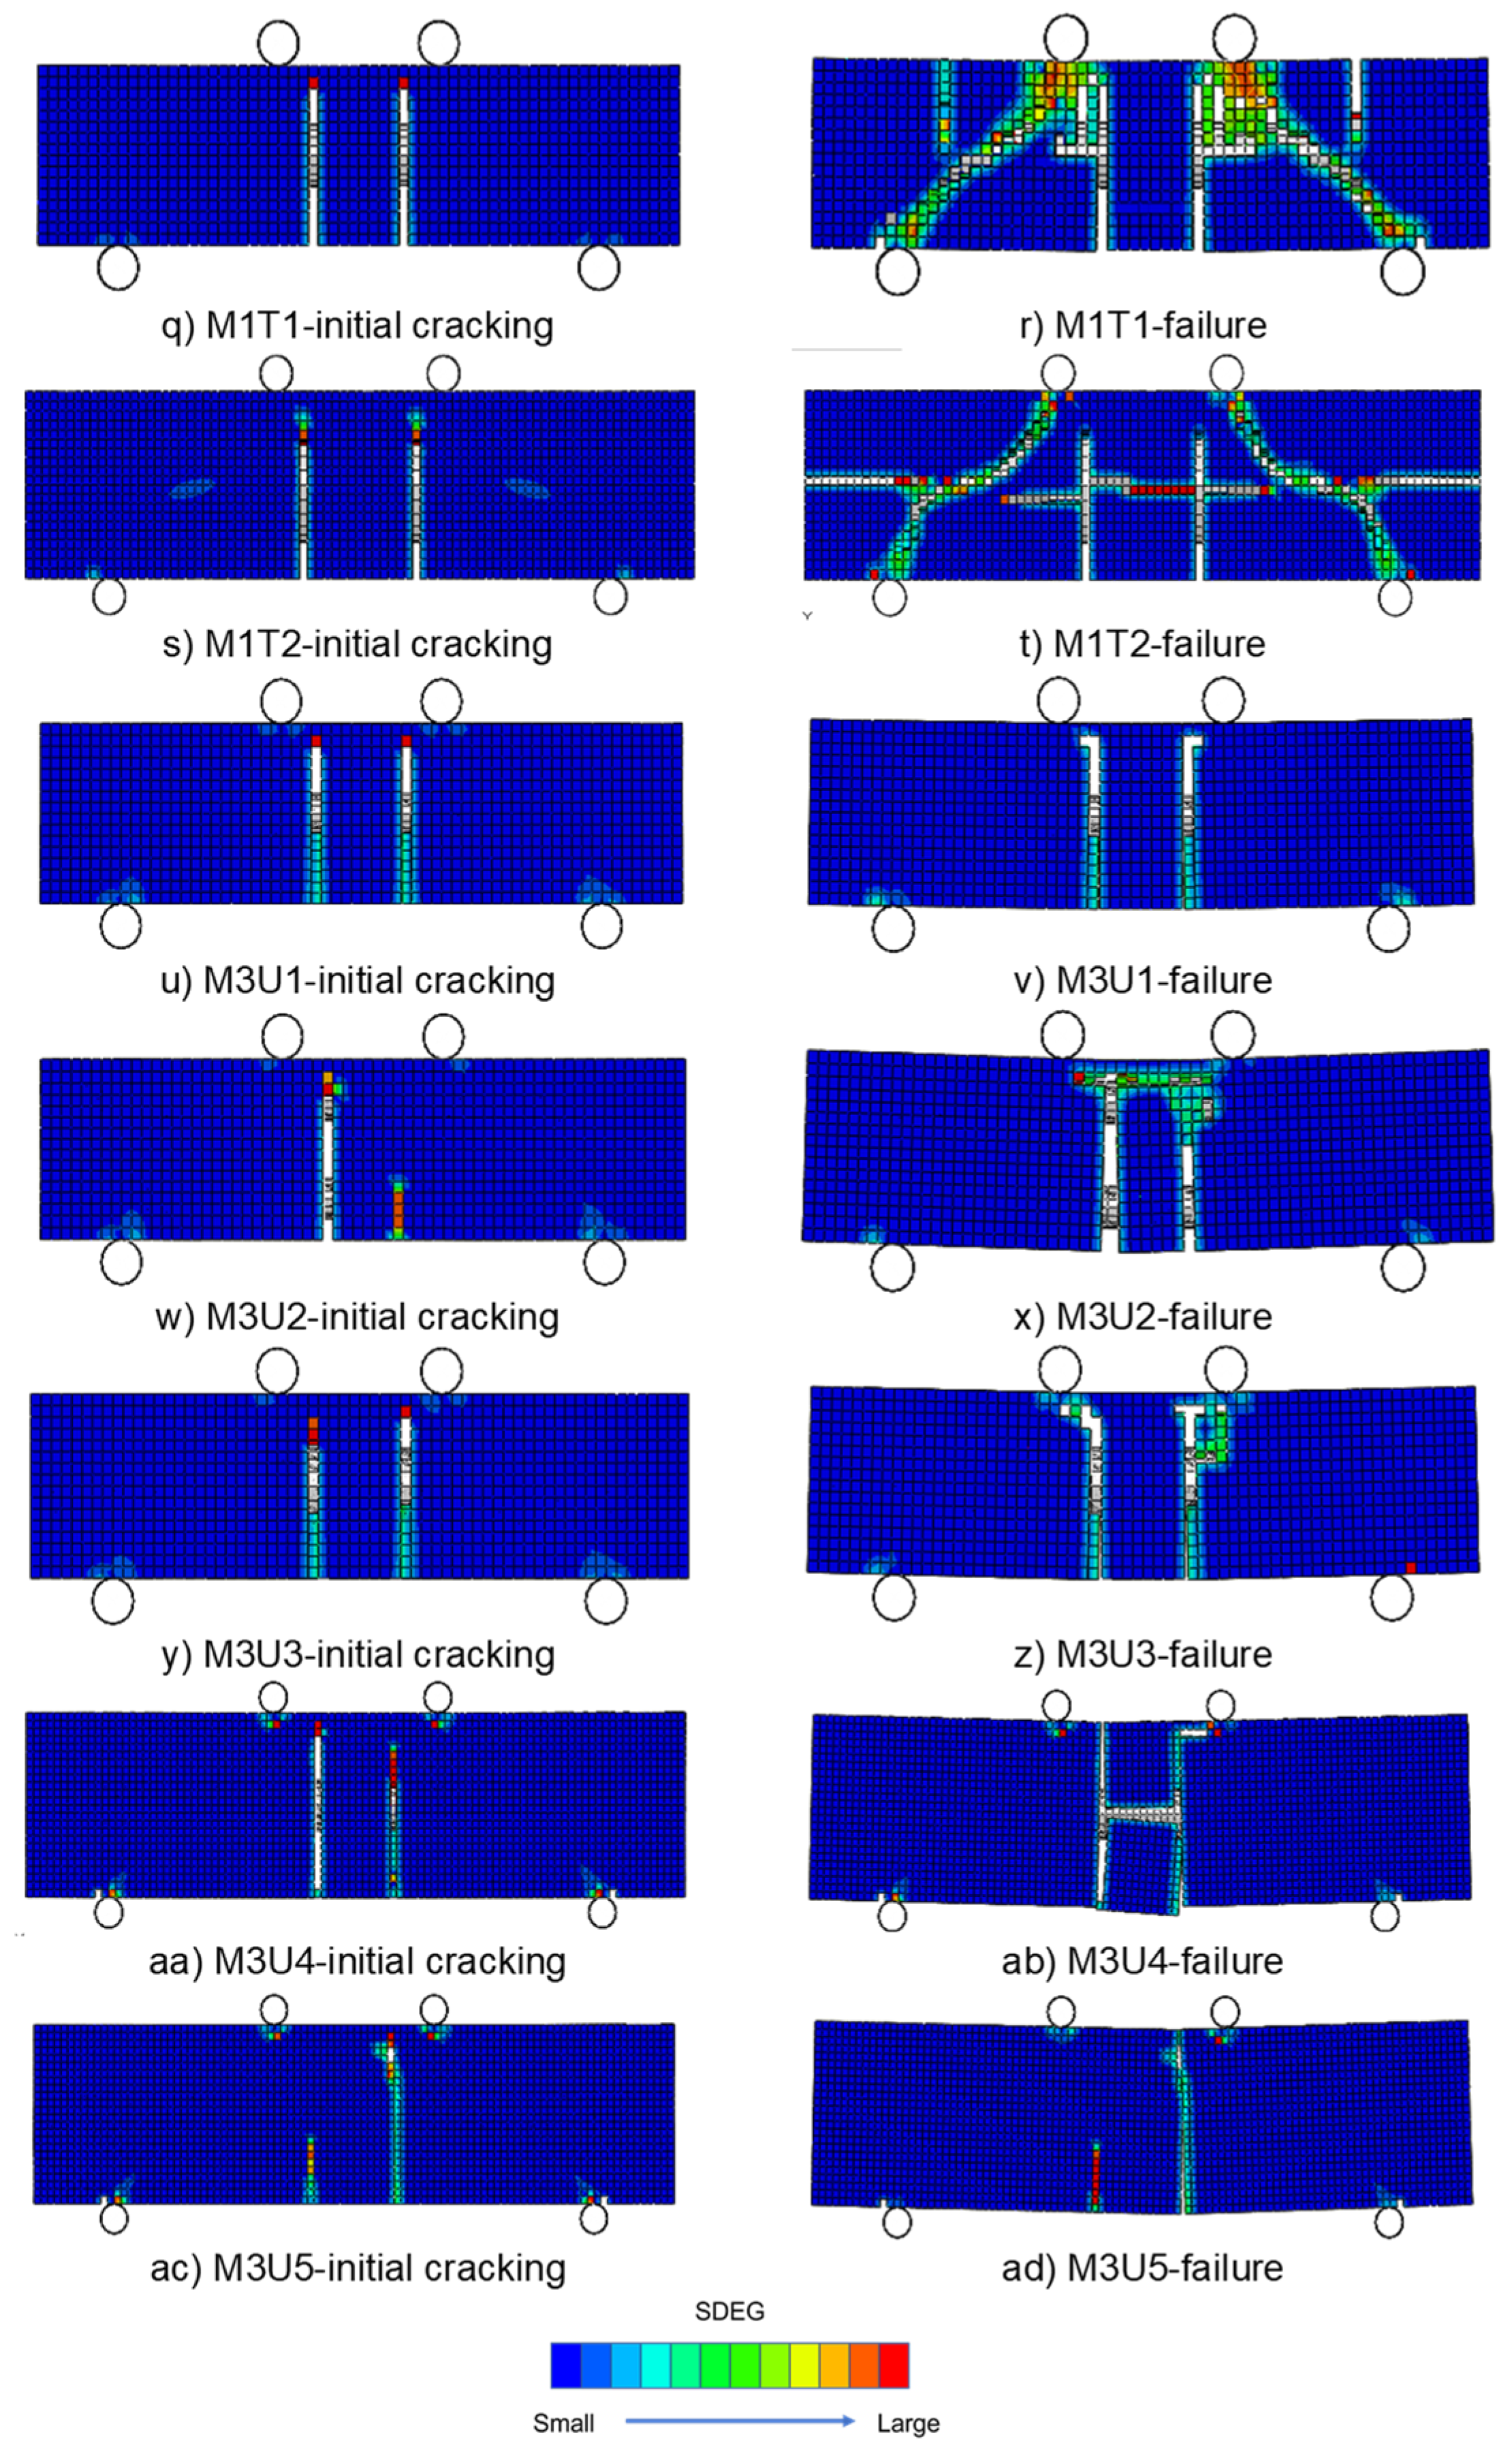
3.2. Damage and Failure Mode
3.3. Bonding between Outer Surface and Concrete
3.4. Concrete Covering Thickness
3.5. Environmental Impacts
3.6. Economic Costs
3.7. Eco-Efficiency Analysis
4. Conclusions
- (1)
- Numerical modelling shows that the embedment of flowline, umbilical, and tubular into concrete beams would be beneficial to the structural performance, which do not noticeably alter the initial cracking strength of the concrete beam but will provide significant post-cracking resistance.
- (2)
- Flexural bending tests find that flowline and tubular will improve the load resistance capacity of concrete beams.
- (3)
- The performance of the umbilical is subjected to further study, which could be improved by optimisation of cross-sectional locations, and/or improved modelling assumptions provided that the bonding properties are quantified.
- (4)
- The accuracy of the preliminary numerical modelling requires further validation, in which bonding between concrete and the outer layer of the flowline and umbilical is important, which will strongly influence the initial cracking behaviour of concrete beams. Further laboratory testing is needed to quantify the bonding behaviour between concrete and the outer layer materials.
- (5)
- Moreover, this study also finds that flowline and tubular could largely increase the flexural bending strength of concrete structures, which will likely lead to a shear-dominated failure mode. Civil engineering applications of adding flowline and tubular in concrete structures should therefore pay special attention to the reduced concrete shear resistance capacity.
- (6)
- Life-cycle analysis reveals that coastal protection concrete structures with decommissioned components accounting for more than 25% of the concrete weight could be both economically viable and environmentally friendly options. Given the limited supply of construction materials in the remote coastal area as well as its proximity to decommissioned oil and gas rig sites, these decommissioned components could have great potential for use as construction materials in concrete mixes.
- (7)
- Global warming is the most dominant impact, accounting for 63% of the total environmental impact. About 22% and 26% of the total carbon footprint can be avoided by using M2F4 and M2F5 concrete mixes, respectively.
- (8)
- Converting decommissioned components to concrete materials and their transportation to the construction site accounts for less than 1% of the total cost of concrete mixes meaning that the maximization of the use of decommissioned components in concrete mixes while maintaining the structural integrity will help achieve the eco-efficiency or a technically, economically, and environmentally viable solution.
Author Contributions
Funding
Data Availability Statement
Conflicts of Interest
References
- Bengtsson, J.; Howard, N. A Life Cycle Impact Assessment Method for Use in Australia. Part 1, Classification and Characterization, Report by Edge Environment Pty Ltd. Australia; Edge Environment Pty Ltd: Manly, NSW, Australia, 2010. [Google Scholar]
- ASBEC. Capitalising on the Building Sector’s Potential to Lessen the Costs of a Broad Based GGHG Emissions Cut; Centre for International Economics: Canberra, Australia, 2007. [Google Scholar]
- Tom Arup, P.H. Paris UN Climate Conference 2015: Tackling Warming ‘Inspires Us’; Turnbull Tells Summit: Sydney, Australia, 2015. [Google Scholar]
- Biswas, W.; Zhang, X. Techno-Assessment of the Use of Recycled Plastic Waste in RE. Sustainability 2021, 13, 8678. [Google Scholar] [CrossRef]
- Zhang, X.; Biswas, W. Development of Eco-efficient bricks—A Life Cycle Assessment Approach. J. Build. Eng. 2021, 42, 102429. [Google Scholar] [CrossRef]
- AS1012.11:2000; Methods of Testing Concrete Determination of the Modulus of Rupture. Standards Australia: Sydney, Australia, 2000.
- Standards Australia. AS 3600: 2018. Concrete Structures, 5th ed.; Standards Australia: Sydney, Australia, 2018. [Google Scholar]
- European Standards. Eurocode 2. Design of Concrete Structures; European Standards: London, UK, 1992. [Google Scholar]
- Dassault Systèmes. Abaqus Documentation R2022x. 2022. Available online: http://help.3ds.com/ (accessed on 1 April 2022).
- Mander, J.B.; Priestley, M.J.; Park, R. Theoretical Stress-Strain Model for Confined Concrete. J. Struct. Eng. 1988, 114, 1804–1826. [Google Scholar] [CrossRef]
- Guttner, W.C.; Santos, C.C.; Pesce, C.P. A finite element method assessment of a Steel Tube Umbilical (STU) cable subjected to crushing load: Comparison between two and three-dimensional approaches. Marine Struct. 2017, 53, 52–67. [Google Scholar] [CrossRef]
- Rabbat, B.G.; Russell, H.G. Friction Coefficient of Steel on Concrete or Grout. J. Struct. Eng. 1985, 111, 505–515. [Google Scholar] [CrossRef]
- Lemos, J. Discrete Element Modeling of the Seismic Behavior of Masonry Construction. Buildings 2019, 9, 43. [Google Scholar] [CrossRef]
- ISO 14044:2006; Environmental Management—Life-Cycle Assessment—Requirements and Guidelines. International Organization for Standardization: Geneva, Switzerland, 2006.
- Biswas, W.K.; Alhorr, Y.; Lawania, K.K.; Sarker, P.K.; Elsarrag, E. Life cycle assessment for environmental product declaration of concrete in the Gulf States. Sustain. Cities Soc. 2017, 35, 36–46. [Google Scholar] [CrossRef]
- Rotech Rural. Steel Pipe Sizes: Dimensions, Diameter & Wall. 2022. Available online: https://rotechrural.com.au/articles/resources/steel-pipe-sizes/ (accessed on 2 May 2022).
- What Is Piping. Pipe Weight Calculation. 2022. Available online: https://whatispiping.com/pipe-weight-calculation-steel-pipe-weight-chart/ (accessed on 2 May 2022).
- Wachs, E.H. TRAV-L-CUTTER Pipe Cutter, 600 Knightsbridge Parkway, Lincolnshire, Illinois 60069. 2022. Available online: https://www.ehwachs.com/assets/pdf/35f8af33426a7e42c45ab50926aed48b.pdf (accessed on 2 May 2022).
- PR’e Consultants. Simapro Version 8.4; PR´e Consultants: Amersfoort, The Netherlands, 2021. [Google Scholar]
- Life Cycle Strategies Pty Ltd. Australasian Unit Process LCI Library and Methods, Version 2015_02_06. 2015. Available online: http://www.lifecycles.com.au/#!australasian-database/cbm5 (accessed on 5 May 2022).
- Shaikh, F.A.; Nath, P.; Hosan, A.; John, M.; Biswas, W.K. Sustainability assessment of Recycled Aggregates Concrete mixes Containing Industrial By-Products. Mater. Today Sustain. 2019, 5, 100013. [Google Scholar] [CrossRef]
- IPCC. Climate Change 2013: The Physical Science Basis. Contribution of Working Group I to the Fifth Assessment Report of the Intergovernmental Panel on Climate Change; Stocker, T.F., Qin, D., Plattner, G.-K., Tignor, M., Allen, S.K., Boschung, J., Nauels, A., Xia, Y., Bex, V., Midgley, P.M., Eds.; Cambridge University Press: Cambridge, UK; New York, NY, USA, 2013; 1535p. [Google Scholar]
- Goedkoop, M.; Oele, M.; Leijting, J.; Ponsioen, T.; Meijer, E. Introduction to LCA with SimaPro; PRé Sustainability: Amersfoort, The Netherlands, 2013. [Google Scholar]
- Guinee, J. Handbook on life cycle assessment: An operational guide to the ISO standards. Int. J. Life Cycle Assess. 2001, 7, 311–313. [Google Scholar] [CrossRef]
- Bare, J.; Young, D.; Hopton, M. Tool for the Reduction and Assessment of Chemical and Other Environmental Impacts; US Environmental Protection Agency: Washington, DC, USA, 2012.
- Government of Western Australia. Onslow Successfully Powered by 100% Renewable Energy in Trial. 2021. Available online: https://www.mediastatements.wa.gov.au/Pages/McGowan/2021/06/Onslow-successfully-powered-by-100-per-cent-renewable-energy-in-trial.aspx (accessed on 2 May 2022).
- Soil Yourself. Gravel and Stones. 2022. Available online: https://soilyourself.com.au/gravels-stones/?gclid=EAIaIQobChMIsYTTuYXK9wIVzA5yCh2QdgWCEAAYASAAEgJO_vD_BwE (accessed on 5 May 2022).
- Kicherer, A.; Schaltegger, S.; Tschochohei, H.; Pozo, B.F. Eco-efficiency. Int. J. Life Cycle Assess. 2007, 12, 537–543. [Google Scholar] [CrossRef]
- Trading Economics. Australia GDP per Capita. 2021. Available online: https://tradingeconomics.com/australia/gdp-per-capita (accessed on 6 May 2022).
- Arceo, A.; Biswas, W.K.; John, M. Eco-efficiency improvement of Western Australian remote area power supply. J. Clean. Prod. 2019, 230, 820–834. [Google Scholar] [CrossRef]
- Vintzēleou, E.N.; Tassios, T.P. Mathematical models for dowel action under monotonic and cyclic conditions. Mag. Concr. Res. 1986, 38, 13–22. [Google Scholar] [CrossRef]
- Nath, P.; Sarker, P.K.; Biswas, W.K. Effect of fly ash on the service life, carbon footprint and embodied energy of high strength concrete in the marine environment. Energy Build. 2018, 158, 1694–1702. [Google Scholar] [CrossRef]
- Crossin, E. Comparative Life Cycle Assessment of Concrete Blends; Centre for Design, RMIT University: Melbourne, Australia, 2012. [Google Scholar]
- Braga, A.M.; Silvestre, J.D.; de Brito, J. Compared environmental and economic impact from cradle to gate of concrete with natural and recycled coarse aggregates. J. Clean. Prod. 2017, 162, 529–543. [Google Scholar] [CrossRef]
- Kurda, R.; Silvestre, J.D.; de Brito, J. Life cycle assessment of concrete made with high volume of recycled concrete aggregates and fly ash. Resour. Conserv. Recycl. 2018, 139, 207–217. [Google Scholar] [CrossRef]


| Case No. | Span (L) (mm) | Width (B) (mm) | Depth (D) (mm) | Component Type | Component Diameter (dc) (mm) | dc/D |
|---|---|---|---|---|---|---|
| R0S1 | 1600 | 400 | 400 | N/A | N/A | N/A |
| R0S2 | 2080 | 520 | 520 | N/A | N/A | N/A |
| R0S3 | 2400 | 600 | 600 | N/A | N/A | N/A |
| M2F1 | 1600 | 400 | 400 | flowline | 214 | 0.54 |
| M2F2 | 2080 | 520 | 520 | flowline | 214 | 0.41 |
| M2F3 | 2400 | 600 | 600 | flowline | 336 | 0.56 |
| M2F4 | 2400 | 600 | 600 | flowline | 352 | 0.59 |
| M2F5 | 2400 | 600 | 600 | flowline | 382 | 0.64 |
| M1T1 | 1600 | 400 | 400 | tubular | 140 | 0.35 |
| M1T2 | 2080 | 520 | 520 | tubular | 320 | 0.62 |
| M3U1 | 1600 | 400 | 400 | umbilical | 92 | 0.23 |
| M3U2 | 1600 | 400 | 400 | umbilical | 92 (2 pcs) | 0.23 |
| M3U3 | 1600 | 400 | 400 | umbilical | 167 | 0.42 |
| M3U4 | 2400 | 600 | 600 | umbilical | 167 | 0.28 |
| M3U5 | 2400 | 600 | 600 | umbilical | 184 | 0.31 |
| Units ≤ 4 m3 | 5 m3 ≤ Units ≤ 15 m3 | Units > 15 m3 | |
|---|---|---|---|
| Concrete class | C25/30 | C30/35 | C30/35 |
| Tensile strength | 2.5 MPa | 3.0 MPa | 3.0 MPa |
| Layer | Thickness (mm) | Elastic Modulus (MPa) | Yield Strength (MPa) | Ultimate Strength (MPa) | Ultimate Plastic Strain |
|---|---|---|---|---|---|
| External plastic sheath | 14.8 | 2580 | 63.6 | 64.5 | 0.03 |
| Fabric tape | 1.15 | 2100 | 100 | 100 | 0.1 |
| Crosswound armour | 2 | 1480 | 51 | 51 | 0.1 |
| Crosswound armour | 3 | 76,000 | 1240 | 1240 | 0.1 |
| Zeta spiral | 10 | 5.86 | 8.62 | 8.62 | 0.1 |
| Pressure plastic sheath | 6.6 | 3290 | 49.2 | 61.8 | 0.0415 |
| Interlocked steel carcass | 10 | 193,000 | 290 | 558 | 0.1 |
| Item | Elastic Modulus (MPa) | Yield Strength (MPa) | Ultimate Strength (MPa) | Ultimate Plastic Strain |
|---|---|---|---|---|
| Outer sheath | 1680 | 33 | 80 | 1.312 |
| Side rope | 193,000 | 290 | 558 | 0.1 |
| Inner sheath | 1680 | 33 | 80 | 1.312 |
| Case No. | Cement | Sand | Aggregate | Decom. Components | Transport | Cutting Energy | Manufacturing |
|---|---|---|---|---|---|---|---|
| (kg) | (kg) | (kg) | (kg) | (km) | (Wh) | (Wh) | |
| M1T1 | 398 | 553 | 1261 | 14 | 766 | 266 | 74.9 |
| M1T2 | 393 | 546 | 1245 | 41 | 758 | 609 | 74.9 |
| M2F1 | 373 | 517 | 1180 | 155 | 723 | 407 | 74.9 |
| M2F2 | 364 | 506 | 1153 | 202 | 709 | 407 | 74.9 |
| M2F3 | 348 | 484 | 1103 | 291 | 681 | 639 | 74.9 |
| M2F4 | 311 | 432 | 985 | 498 | 618 | 670 | 74.9 |
| M2F5 | 296 | 411 | 937 | 580 | 593 | 727 | 74.9 |
| M3U1 | 397 | 551 | 1257 | 20 | 764 | 35.9 | 74.9 |
| M3U2 | 393 | 546 | 1245 | 40 | 758 | 71.9 | 74.9 |
| M3U3 | 397 | 551 | 1256 | 21 | 764 | 65.2 | 74.9 |
| M3U4 | 395 | 548 | 1251 | 31 | 761 | 65.2 | 74.9 |
| M3U5 | 373 | 519 | 1182 | 151 | 724 | 71.9 | 74.9 |
| Controlled | 401 | 556 | 1268 | 0 | 770 | 0.0 | 74.9 |
| Ingredients | Per m3 | % |
|---|---|---|
| Cement | 398 | 18 |
| Sand | 566 | 25 |
| Aggregate | 1261 | 57 |
| Total | 2225 | 100 |
| Water | 175 |
| Cutter Drive Pneumatic | Worm Gearbox Is Coupled with the Governed Air Motor. |
|---|---|
| Capacity | 4 hp (2.9 kW) hydraulic motor |
| Work speed | 1 inch/min of pipe diameter is the cutting speed. 10 in (254 mm) = 10 min. |
| Ingredients | Distance (km) | Locations |
|---|---|---|
| Cement | 525 | Cockburn Cement Port Hedland, 12 Peawah St, Wedgefield WA 6721 |
| Sand | 307 | Karratha |
| Aggregate | 307 | Karratha |
| Decommission components | 314 | Dampier port |
| Impact Assessment Method | Environmental Impact | Unit |
|---|---|---|
| IPCC GWP 100 [22] | Global warming | t CO2 eq |
| Australian indicator set v2.01 | Eutrophication | kg PO43− eq |
| Water depletion | m3 H2O | |
| Land use and ecological diversity | Ha a | |
| ReCiPe 2008 [23] | Human toxicity | kg 1,4-DB eq |
| Terrestrial ecotoxicity | kg 1,4-DB eq | |
| Freshwater ecotoxicity | kg 1,4-DB eq | |
| Marine ecotoxicity | kg 1,4-DB eq | |
| CML 2 baseline 2001 [24] | Abiotic depletion | kg Sb eq |
| ReCiPe Midpoint (E) V1.12/Europe Recipe E | Ozone depletion | kg CFC-11 eq |
| [25] | Acidification | kg SO2 eq |
| Photochemical smog | kg NMVOC | |
| Ionising radiation | kg U235 eq | |
| TRACI v2.1 [26] | Respiratory inorganics | kg PM2.5 eq |
| Cement a | Sand b | Aggregate b | Decommissioned Components | Transport c | Construction c | Labour c |
|---|---|---|---|---|---|---|
| (per kg) | (per kg) | (per kg) | (per kWh) | (tkm) | (kWh) | (per hour) |
| $0.35 | $0.04 | $0.06 | $0.55 | $0.09 | 0.55 | 32.25 |
| Indicator | Units | GDEI | WF (%) |
|---|---|---|---|
| Global Warming Potential | kg CO2 eq | 28,690 | 19.5 |
| Eutrophication | kg PO4 eq | 19 | 2.9 |
| Land Use | Ha a | 26 | 20.9 |
| Water Depletion | m3 H2O | 930 | 6.2 |
| Terrestrial acidification | kg SO2 eq | 123 | 3.1 |
| Ozone Depletion | kg CFC−11 eq | 0.002 | 3.9 |
| Abiotic Depletion | kg Sb eq | 300 | 8.2 |
| Photochemical Oxidant Formation | kg NMVOC eq | 17 | 2.8 |
| Terrestrial Ecotoxicity | kg 1,4-DB eq | 88 | 10.3 |
| Freshwater Ecotoxicity | kg 1,4-DB eq | 172 | 6.9 |
| Marine Ecotoxicity | kg 1,4-DB eq | 12,117,106 | 7.7 |
| Human Toxicity | kg 1,4-DB eq | 3216 | 2.7 |
| Ionising Radiation | kBq U235 eq | 1306 | 1.9 |
| Particulate Matter Formation | kg PM2.5 eq | 45 | 3 |
| Case No. | Modulus of Rupture (MPa) | Deflection-to-Span Ratio (%) | Strength Increase |
|---|---|---|---|
| R0S1 | 5.3 | 0.02 | N/A |
| R0S2 | 5.6 | 0.02 | N/A |
| R0S3 | 4.79 | 0.02 | N/A |
| M2F1 | 7.93 | 0.13 | 49.6% |
| M2F2 | 9.5 | 0.48 | 69.6% |
| M2F3 | 7.81 | 0.12 | 63.1% |
| M2F4 | 7.51 | 0.1 | 56.8% |
| M2F5 | 6.86 | 0.07 | 43.2% |
| M1T1 | 11.53 | 0.42 | 117.6% |
| M1T2 | 7.43 | 0.06 | 32.7% |
| M3U1 | 4.96 | 0.02 | −6.4% |
| M3U2 | 4.75 | 0.02 | −10.4% |
| M3U3 | 5.17 | 0.02 | −2.5% |
| M3U4 | 4.91 | 0.02 | 2.5% |
| M3U5 | 4.92 | 0.02 | 2.7% |
| Case | OPC | Sand | Aggregate | Decom. Components | Transport | Construction | Labour | Total |
|---|---|---|---|---|---|---|---|---|
| (per kg) | (per kg) | (per kWh) | ||||||
| M1C | 88.11 | 20.58 | 42.28 | - | 69.33 | 41.19 | 31.25 | 292.74 |
| M1T1 | 86.50 | 20.20 | 41.50 | 0.95 | 68.21 | 41.19 | 31.25 | 289.81 |
| M1T2 | 81.96 | 19.14 | 39.32 | 0.22 | 65.05 | 41.19 | 31.25 | 278.14 |
| M2F1 | 81.96 | 19.14 | 39.32 | 0.22 | 65.05 | 41.19 | 31.25 | 278.14 |
| M2F2 | 80.11 | 18.71 | 38.44 | 0.22 | 63.77 | 41.19 | 31.25 | 273.69 |
| M2F3 | 76.60 | 17.89 | 36.75 | 0.35 | 61.32 | 41.19 | 31.25 | 265.36 |
| M2F4 | 68.41 | 15.98 | 32.82 | 0.37 | 55.62 | 41.19 | 31.25 | 245.64 |
| M2F5 | 65.12 | 15.21 | 31.25 | 0.40 | 53.34 | 41.19 | 31.25 | 237.76 |
| M3U1 | 87.32 | 20.40 | 41.89 | 0.02 | 68.78 | 41.19 | 31.25 | 290.85 |
| M3U2 | 86.52 | 20.21 | 41.51 | 0.04 | 68.23 | 41.19 | 31.25 | 288.95 |
| M3U3 | 87.29 | 20.39 | 41.88 | 0.04 | 68.76 | 41.19 | 31.25 | 290.80 |
| M3U4 | 86.88 | 20.29 | 41.68 | 0.04 | 68.48 | 41.19 | 31.25 | 289.81 |
| M3U5 | 82.14 | 19.19 | 39.41 | 0.04 | 65.18 | 41.19 | 31.25 | 278.40 |
Disclaimer/Publisher’s Note: The statements, opinions and data contained in all publications are solely those of the individual author(s) and contributor(s) and not of MDPI and/or the editor(s). MDPI and/or the editor(s) disclaim responsibility for any injury to people or property resulting from any ideas, methods, instructions or products referred to in the content. |
© 2023 by the authors. Licensee MDPI, Basel, Switzerland. This article is an open access article distributed under the terms and conditions of the Creative Commons Attribution (CC BY) license (https://creativecommons.org/licenses/by/4.0/).
Share and Cite
Zhang, X.; Biswas, W.K.; Watt, A.; Philip, L.; Sadler, S. Techno-Economic and Environmental Analysis of Decommissioned Flowline, Umbilical, and Tubular for Breakwaters. Buildings 2023, 13, 225. https://doi.org/10.3390/buildings13010225
Zhang X, Biswas WK, Watt A, Philip L, Sadler S. Techno-Economic and Environmental Analysis of Decommissioned Flowline, Umbilical, and Tubular for Breakwaters. Buildings. 2023; 13(1):225. https://doi.org/10.3390/buildings13010225
Chicago/Turabian StyleZhang, Xihong, Wahidul K. Biswas, Andy Watt, Lendyn Philip, and Shaun Sadler. 2023. "Techno-Economic and Environmental Analysis of Decommissioned Flowline, Umbilical, and Tubular for Breakwaters" Buildings 13, no. 1: 225. https://doi.org/10.3390/buildings13010225
APA StyleZhang, X., Biswas, W. K., Watt, A., Philip, L., & Sadler, S. (2023). Techno-Economic and Environmental Analysis of Decommissioned Flowline, Umbilical, and Tubular for Breakwaters. Buildings, 13(1), 225. https://doi.org/10.3390/buildings13010225