Abstract
The shallow tunnelling method (STM) is usually used to construct shallow tunnels buried in soft ground. It consists of primary lining and secondary lining (tunnel). In the seismic design of STM tunnels, it is usually assumed that the secondary lining (tunnel) is resistant to all seismic effects. However, the soil–primary–secondary lining system may generate complex interaction phenomena during ground shaking. Compared with the case where the primary lining is not considered, the existence of the primary lining alters the seismic response of the secondary lining (tunnel). The paper attempts to investigate this complex interaction, focusing on the response of the secondary lining (tunnel). The full dynamic time history analysis is adopted to investigate the interaction in the transversal direction. A case history of the Hohhot (China) arched STM tunnel buried in a stratified soil deposit has been analyzed. Two tunnel configurations for a two-dimensional plane strain model of STM tunnels in Hohhot are studied and compared, including a model with primary lining and one without primary lining. A numerical parametric analysis was conducted to elucidate critical response characteristics of STM tunnels. Salient parameters that may affect the dynamic response of the tunnel were studied, including the characteristics of ground motion, the characteristics of contact interface, the characteristics of the soil, and the characteristics of the tunnel lining. The response characteristics of the tunnel are compared and discussed, including horizontal acceleration, deformation mode, lining internal force, and lining damage. The results show that the primary lining has a significant influence on the magnitude and distribution of the seismic response, especially considering the nonlinearity of the soil and the nonlinear characteristics of the tunnel lining. The effect of primary lining on the seismic response is about 5–35%.
1. Introduction
With the development and utilization of underground space in China, the number of underground structures represented by urban underground transportation projects is gradually increasing. Since underground structures play a significant role in the urban economy, it is increasingly critical to ensure its safety during an earthquake. Previous earthquake events (Loma Prieta, 1989; Northridge, 1994; Kocaeli, 1999; Chi-Chi, 1999; Wenchuan, 2008; Tohoku, 2011) indicate that underground structures such as pipelines, tunnels, and subway stations will also suffer severe damage during earthquakes [1,2,3,4,5,6,7,8,9,10]. In particular, the Dakai subway station underwent severe damage [11] and even collapsed during the 1995 Kobe earthquake in Japan. The Longxi tunnel caved during the 2008 Wenchuan earthquake in China [12]. These cases stimulated researchers to pay more attention to the seismic design of underground structures. Since then, researchers have implemented a series of experiments [13,14,15,16,17] and numerical [1,18,19,20,21,22,23,24,25] and analytical methods [26,27,28,29] to study the seismic response of underground structures. Compared with aboveground structures, the seismic response of underground structures primarily depends on the deformation of the surrounding soil, while the former mainly relies on inertial force [9,28]. During strong earthquakes, the interaction between underground structures and soil is complicated and is mainly affected by the following factors: (1) the relative stiffness between soil and structure, (2) the dynamic characteristics of the interface between soil and structure, and (3) earthquake motion characteristics. These factors also change with dynamic interaction, which is also a vital issue to be considered when it comes to the seismic response of underground structures.
In recent years, a large number of analysis methods for the seismic response of underground structures have been proposed [9,26,29,30,31,32]. The research results show that the deviation between the seismic response results obtained by different analysis methods is evident for the same structure. The deviations are caused by insufficient awareness of some factors that can affect the seismic response of underground structures. The possible impacts of the soil-structure interaction mechanism and failure evolution mode during ground shaking are still under investigation.
In China, the shallow tunnelling method (STM) is commonly used to construct tunnels shallowly buried in soft soil, especially subway projects in urban areas with a high building density. The STM is not a set of excavation and support techniques but rather, a philosophy for tunnelling in soft ground. Although the STM is derived from the NATM (New Austrian Tunnelling Method) and adopts some techniques such as shotcreting, sequential excavation, and monitoring as in the NATM, the STM has two distinct characteristics relative to the NATM, including the limited arching effect of cover soil and limited ground strength mobilization. In order to solve the problem of the underdeveloped arching effect of overlying soil caused by the shallow burial of the tunnel, and the limited ground strength mobilization, which is restricted to the requirement of strictly controlled ground settlement, the STM simultaneously adopts forepoling, pipe roof protection, grouting reinforcement, and other auxiliary techniques. The primary purpose of STM is to overcome the above two distinct characteristics to control ground deformation to ensure the stability and safety of the tunnel and environmental safety. A more detailed description of the STM can be found in the literature [33]. The STM has been successfully applied to subway construction in urban areas with high built density in China.
According to the STM, the tunnel consists of a primary and secondary lining, also known as a composite lining tunnel. In China, codes for seismic design and the available seismic design methods for composite lining tunnels usually assume that the secondary lining is subjected to seismic action and exclude the influence of the primary lining on the secondary lining. However, the existence of the primary lining changes the relative stiffness of soil-structure and the interface characteristics of soil-structure. Therefore, the influence of primary lining on the seismic response of secondary lining for STM tunnel cannot be ignored. Furthermore, the impact stemming from primary lining is less specific.
This paper aims to reveal the transversal seismic response of arched STM tunnels when considering the influence of the primary linings. For this purpose, a series of numerical experiments have been implemented on an STM tunnel, assuming different seismic waves as well as the physical and mechanical properties of the soil and tunnel through the finite element software ABAQUS [34]. The research mainly discusses the response to different inspection scenarios, which are the acceleration, deformation, and internal forces, and damage of the secondary lining. The influence of the primary lining on the dynamic response of the secondary lining is systematically studied.
2. Numerical Modelling
2.1. Subsection
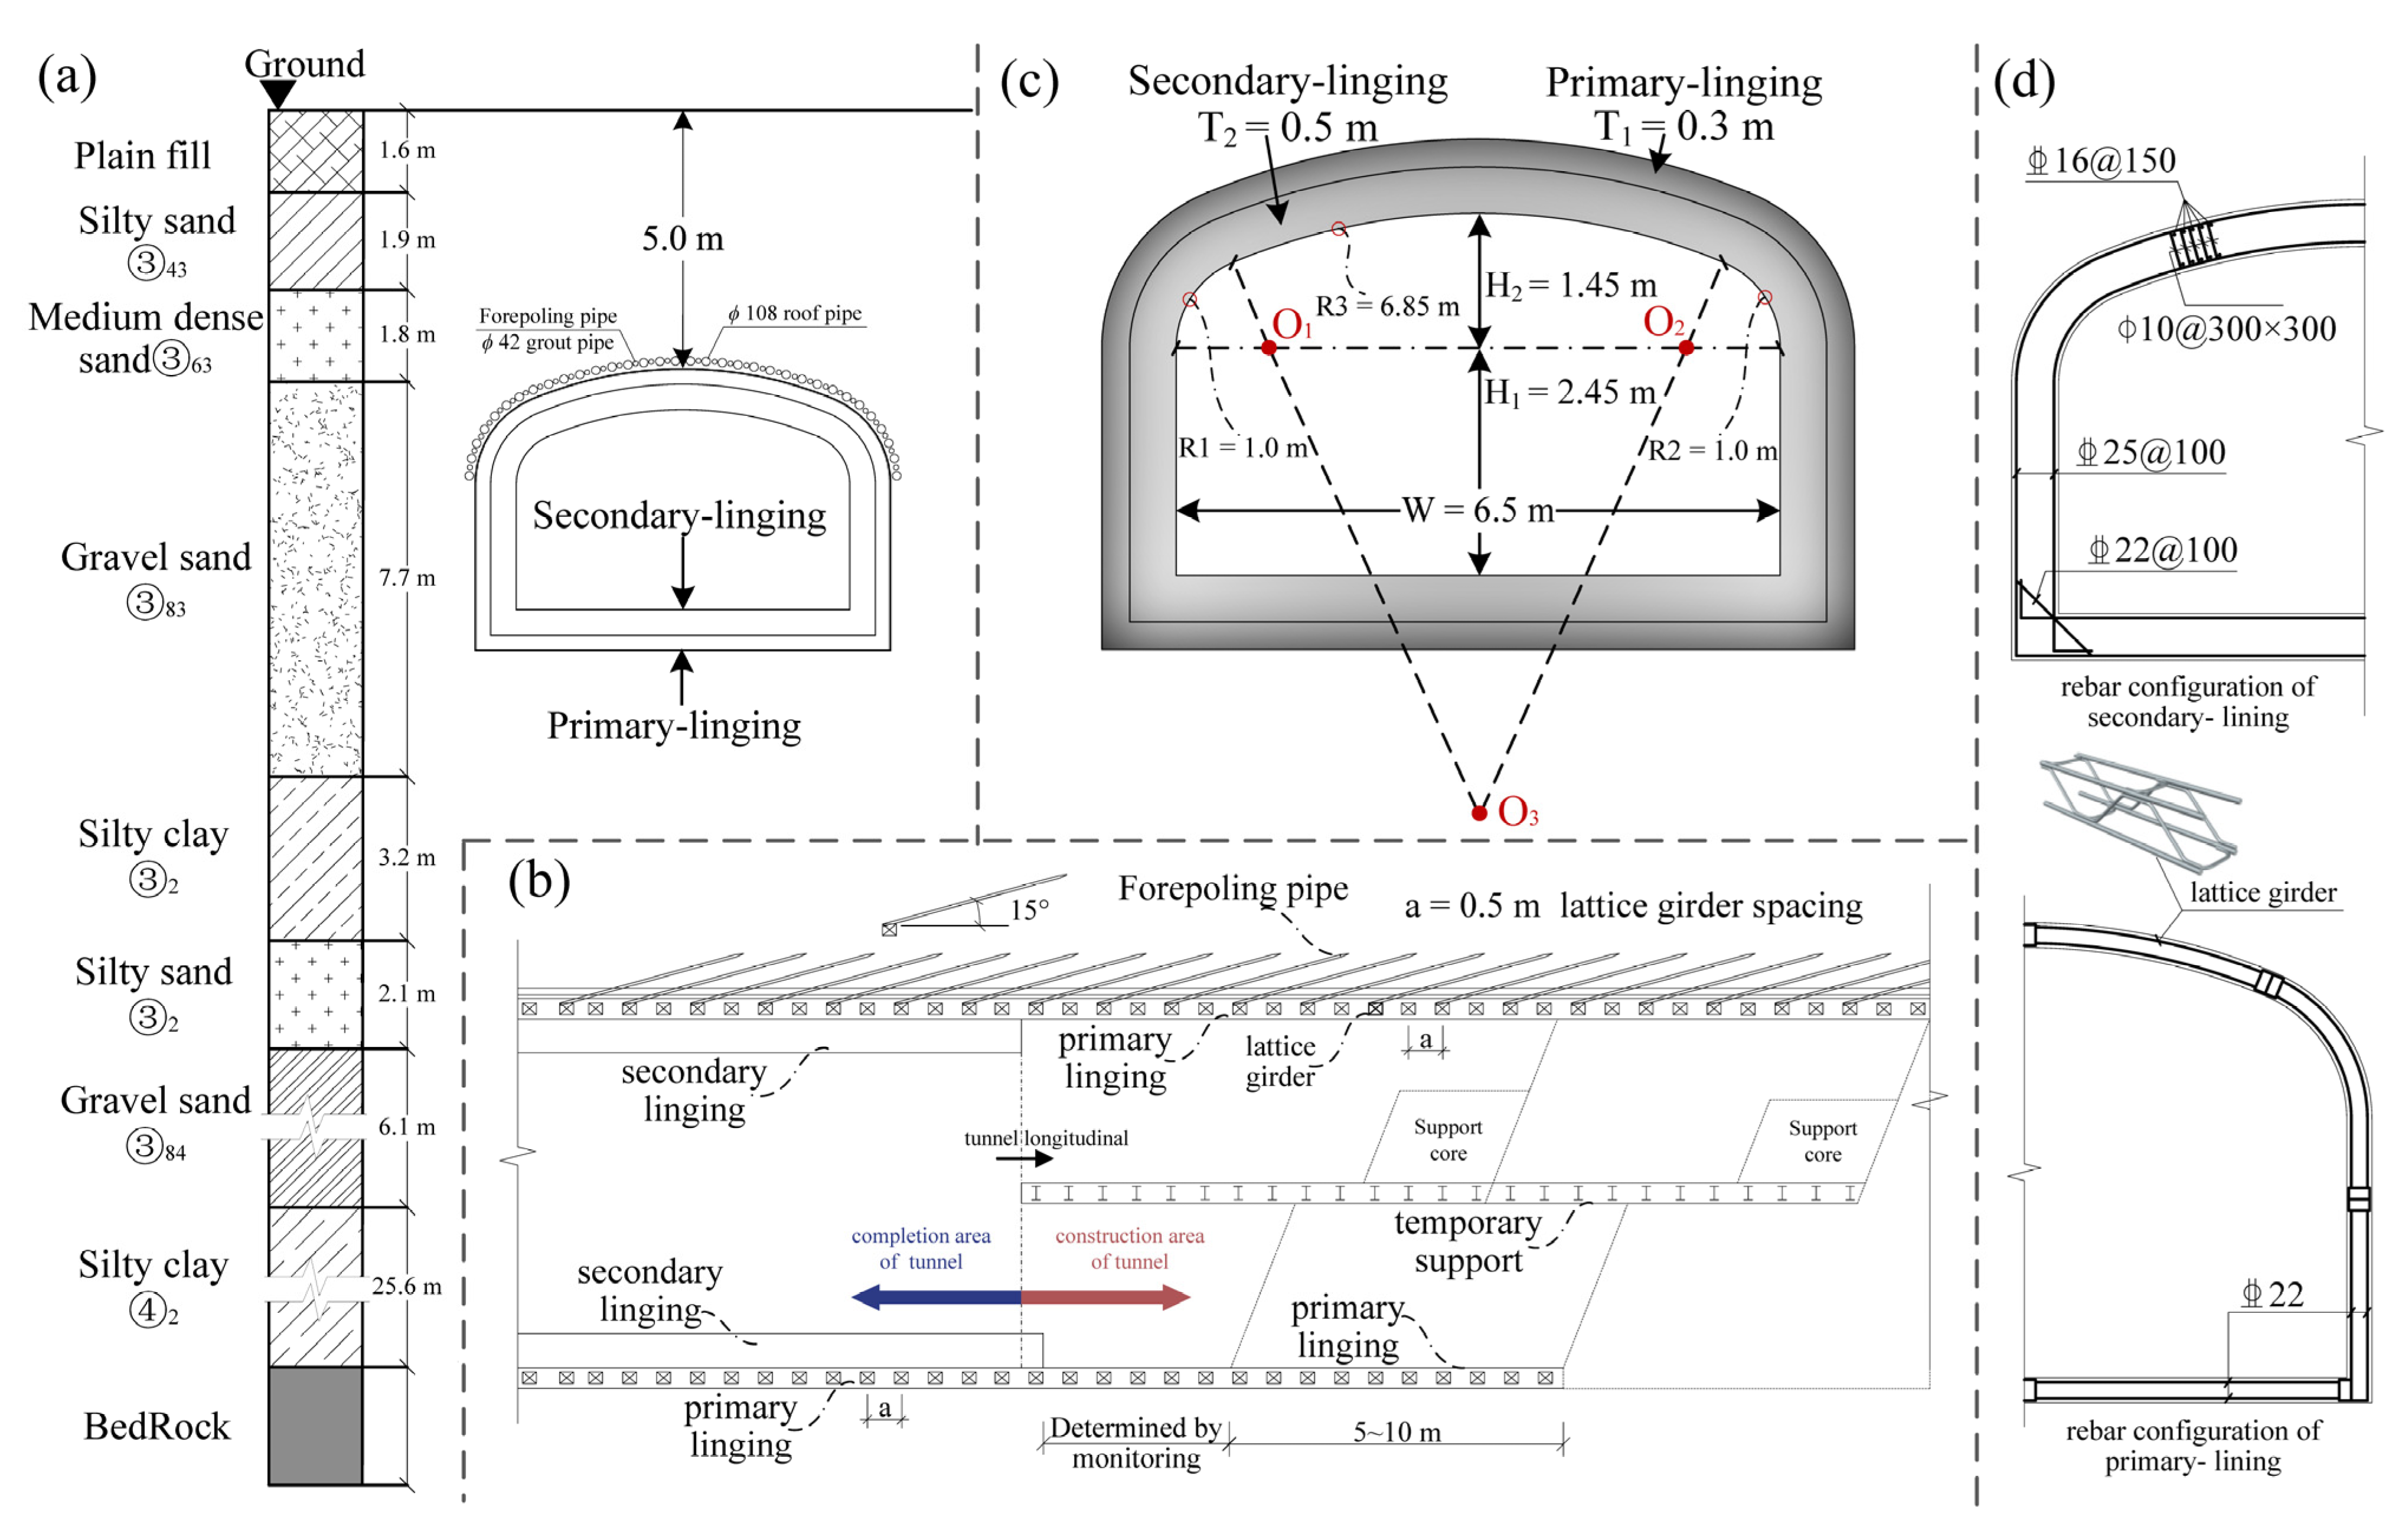
A comprehensive set of soil–primary–secondary linings configurations is examined in this paper, as illustrated in Figure 1. To be more specific, a subway station located in Hohhot, northern China, which belongs to Metro Line 1, was designed. The entrance and exit tunnel of subway station, which is embedded in a stratified soil deposit and rests on rigid bedrock, is investigated. The subway entrance and exit tunnels are constructed by the STM, as shown in Figure 1b. The reason for choosing to investigate the seismic behavior of subway entrances and exits is mainly due to its special construction method and the ambiguous approach of seismic design according to Code for Design of Railway Tunnel (TB10003-2016). The design parameters of the STM tunnel, including its geometric and material properties, are described below. The shape of the STM tunnel section is an arched roof with vertical walls. The arched roof is formed by three tangent arcs, the centers of which correspond to points O1, O2, and O3. The geometrical properties of the tunnel are summarized in Figure 1c. The thickness of the primary and secondary lining is 0.3 m and 0.5 m, respectively. The primary lining is made of C25 shotcrete with a grid steel frame, and the secondary lining is composed of C35 reinforced concrete. The rebar configuration of the tunnel is illustrated in Figure 1d. The waterproof materials are set between the primary lining and the secondary lining. Table 1 summarizes the material mechanical properties of the tunnel.
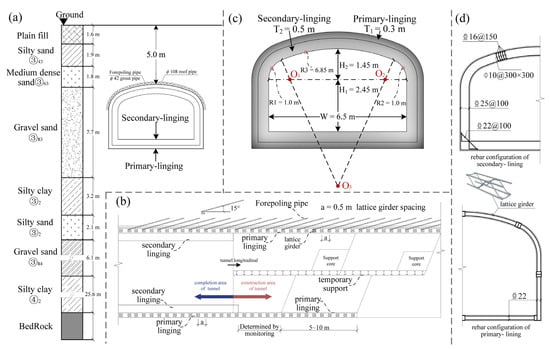
Figure 1.
Tunnel configuration (a) distribution of soil layers (b) the direction of the longitudinal axis of the tunnel (c) the shape of tunnel section (d) reinforcement configuration of tunnel.

Table 1.
Tunnel mechanics parameters.
The buried depth H of the tunnel structure is 5.0 m. Figure 1a shows the distribution of the soil profile of the tunnel. It reveals that soil deposits are typically composed of plain fill①2, silty sand③43, medium dense sand③63, gravel sand③83, silty clay③2, silty sand③43, gravel sand③84, and silty clay④2. Gravel sand③83 is mainly distributed around the tunnel. Table 2 summarizes the physical and mechanical parameters of the soil deposits from the geotechnical survey report. The profiles are categorized as soil type II according to the Code for Seismic Design of Buildings [35].

Table 2.
Soil mechanics parameters.
The analyses assumed that the STM tunnel is entirely in a homogeneous soil deposit, corresponding to gravel sand③83. The distribution of shear wave velocity along the depth of the homogeneous soil deposit is consistent with Table 2. The soil nonlinear response characteristics under dynamic action are characterized by the G-γ-D curve proposed by Seed and Idriss [36]. The constitutive model of the soil is corrected through these curves and shear wave velocity from the geotechnical survey report, which will be discussed in Section 2.3. The soil layers are assumed to be located on a rigid bedrock. In addition, the analyses ignore the effects of forepoling and grouting reinforcement on the tunnel dynamic response. Although the configurations adopted in the analyses are unrealistic in practice, these assumptions were made to investigate the influence of the primary lining on the dynamic response of the STM tunnel.
2.2. Numerical Analysis
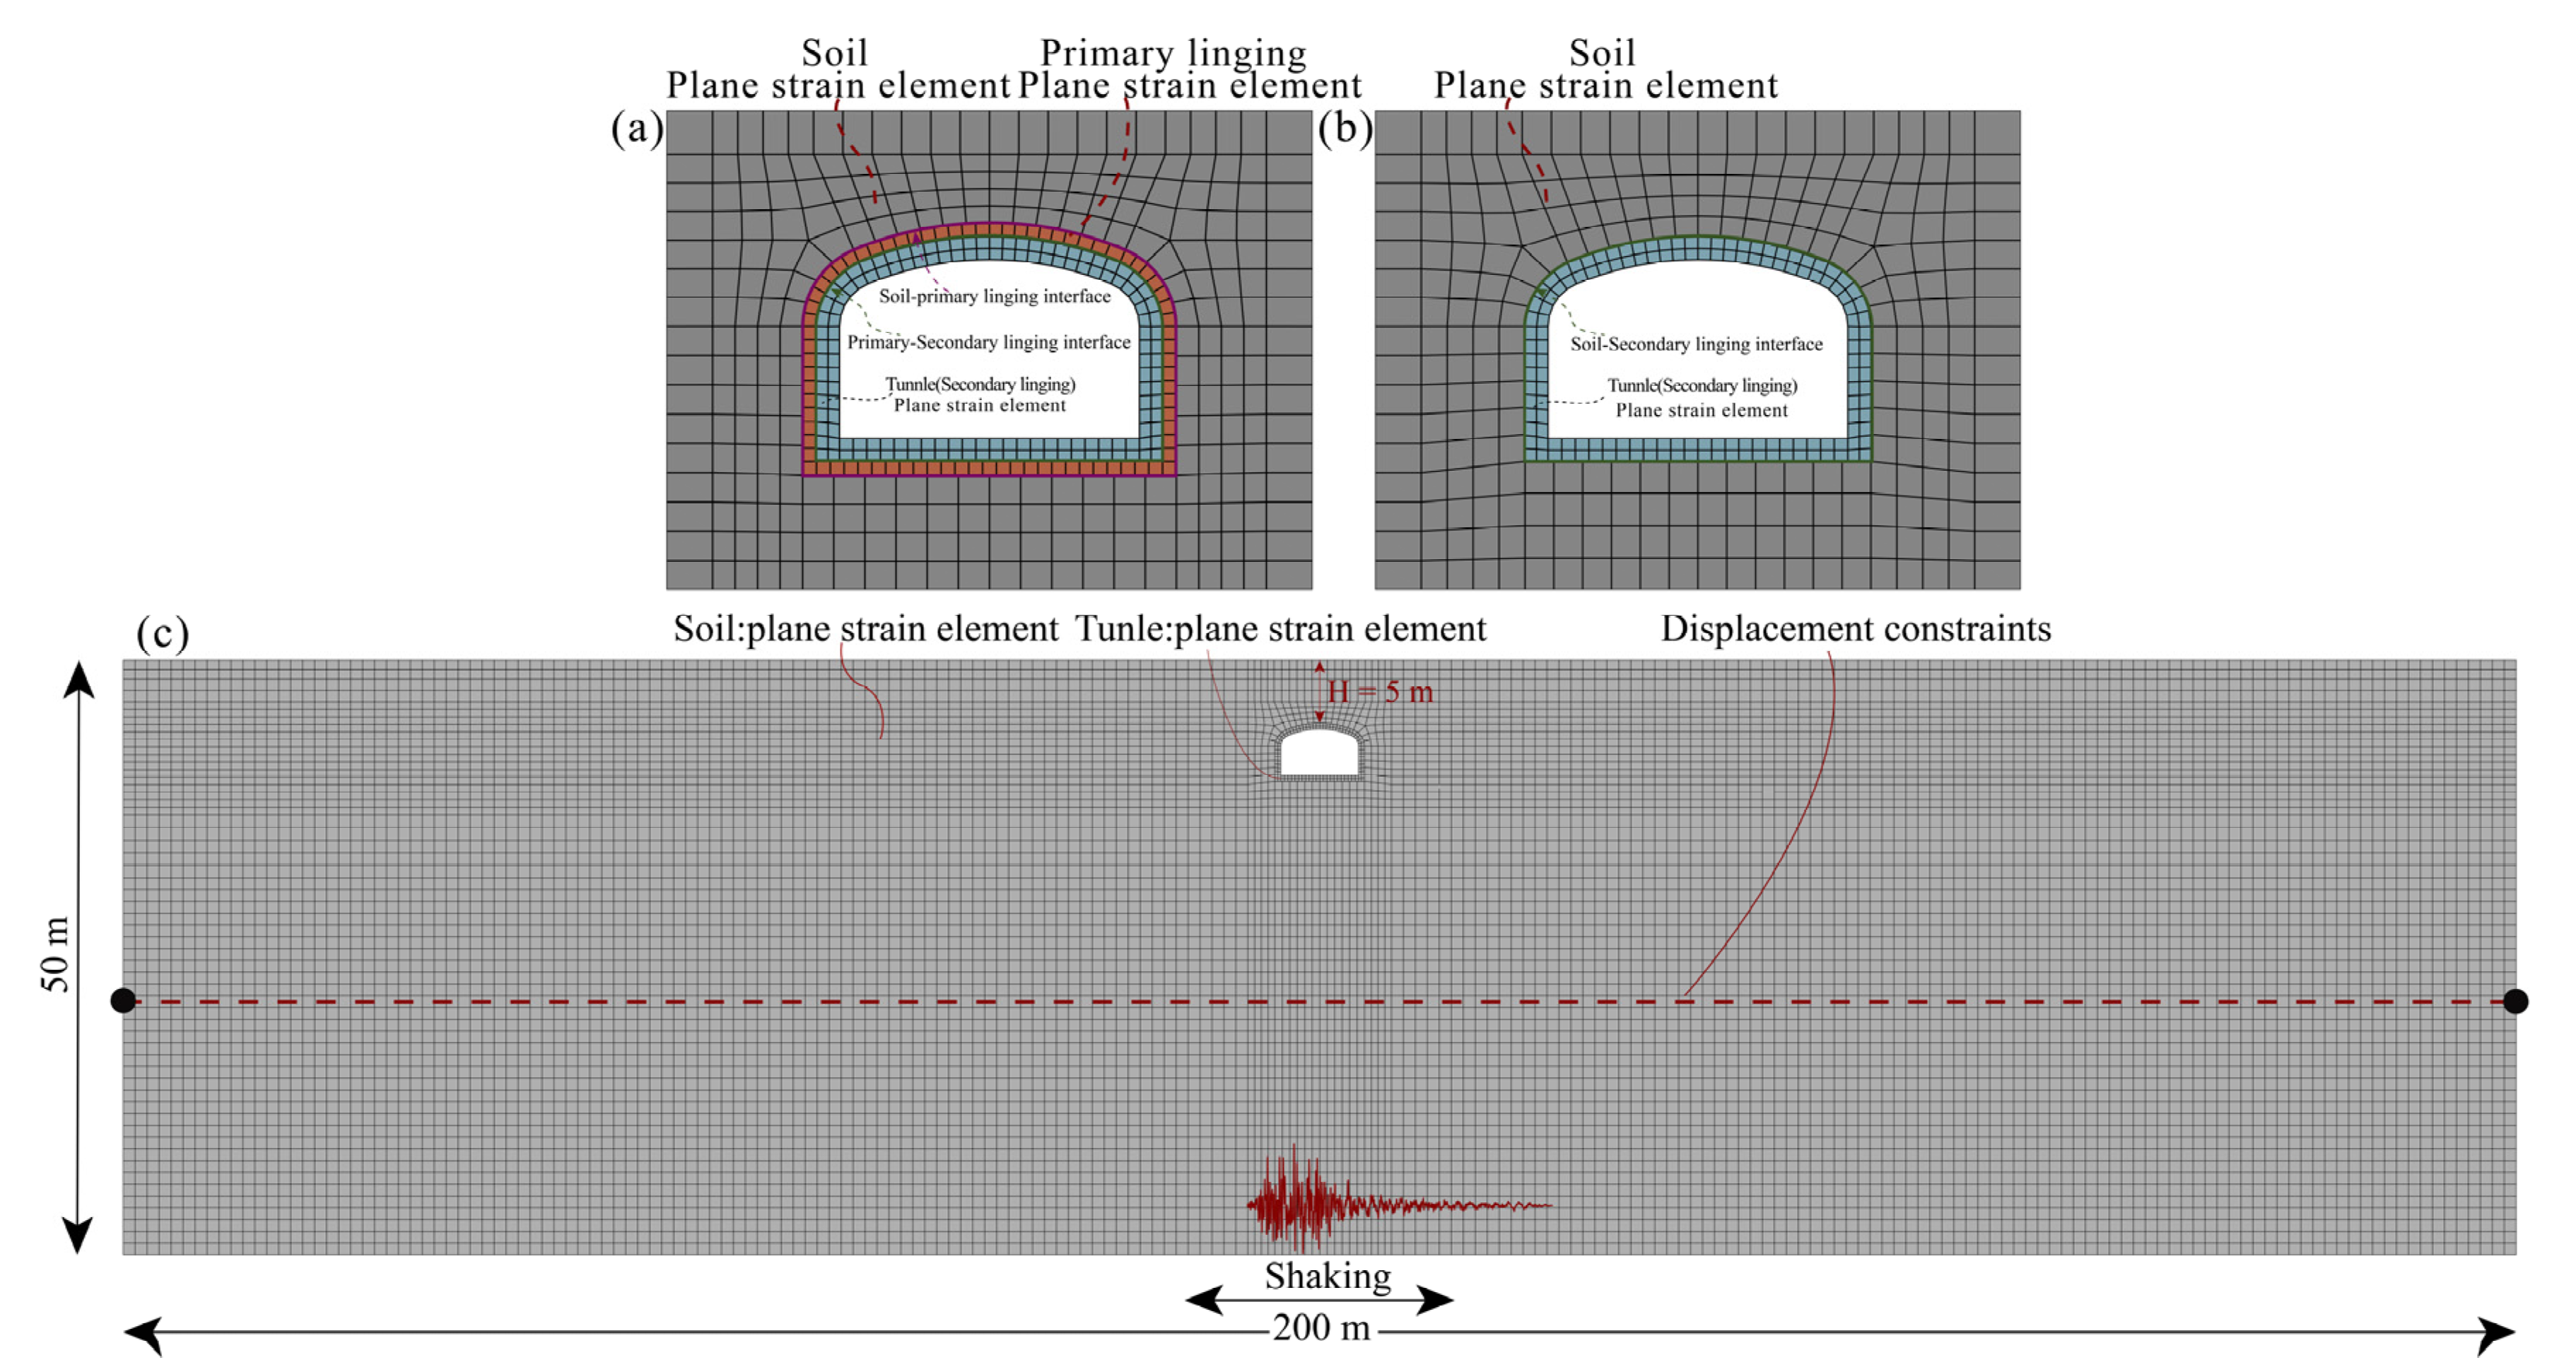
The full dynamic time analysis of the STM tunnel is performed under two-dimensional (2D) plane strain conditions using the ABAQUS finite element program. The reliability of the 2D model for tunnel seismic response analysis has been verified by Tsinidis and Pitilakis et al. [37] through centrifuge tests and numerical modeling in the dynamic response to tunnels. The analysis is based on effective stress, ignoring the influence of groundwater on the STM tunnel system. Figure 2 shows the layout of the finite element model of the STM tunnel system. For all analysis conditions, the distance between the vertical boundary and tunnel center should be six times greater than the geometric size of the tunnel, which can reduce the influence of the artificial boundary on the dynamic response of the STM tunnel system. The geometric width of the soil layer is taken as 150 m and the depth is taken as 50 m. Specifically, the soil and tunnel lining are meshed with a 4-node plane strain element (CPE4). The rebar is simulated with a 2D beam element (B21) embedded in the lining concrete. The embedded element technique built into Abaqus is utilized to simulate the constraint relationship between rebar and concrete. The mesh size should be small enough to avoid filtering out the effective waves of interest. The mesh size was calculated as shown in Equation (1) [38]. The Vmin and ƒmax are the minimum velocity of soil and the highest frequency of the input motions, respectively. The minimum velocity and highest frequency are 188.3 m/s and 15 Hz, respectively. Hence, the maximum mesh size equals 1.26 m by Equation (1), and the maximum mesh size was set equal to 1.0 m.
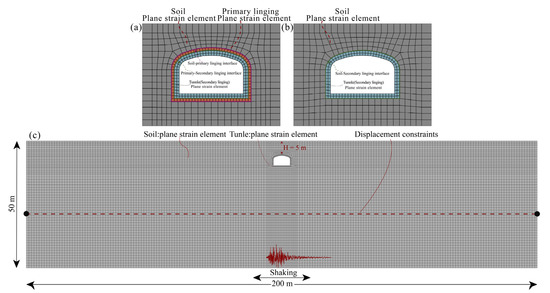
Figure 2.
2D Finite element model (a) tunnel with primary lining (b) tunnel without primary lining (c) soil-tunnel model layout.
The dynamic response of the primary and secondary concrete lining of the tunnel under earthquake is simulated using an elastic model and a damage plastic model built into ABAQUS, which is defined by damage and compression factors. The parameters of the damage plasticity model are discussed in Section 2.3. The rebar is simulated using a linear elastic material, including elastic modulus and density. The response of soil under earthquake is simulated by an elastic-plastic model, which includes an elastic and elasto-plastic analysis. First, in the elastic analyses, the soil is considered as a visco-elastic model, and the dynamic properties of the soil at small strain states are evaluated by 1D equivalent linear analysis, which mainly refers to the equivalent shear modulus and equivalent viscous damping of the soil. Secondly, in the 2D full dynamic time analysis of the STM tunnel, the elasto-plastic model is used for the nonlinear plastic deformation analyses of soils under seismic action, which mainly combines the equivalent linear properties of soils and the Mohr–Coulomb yield criterion to characterize the permanent deformation and hysteretic energy dissipation of soils under large strain states. The aforementioned nonlinear models of soils have been proven to be effective by many researchers [1,39,40], as their parameters are easily calibrated and controlled. The material mode of the soil and the tunnel are summarized in Table 3, where three different numerical cases for the dynamic response of tunnel are examined.

Table 3.
Numerical cases for dynamic response.
The soil–primary linings and primary–secondary linings interfaces are modelled by a finite sliding hard contact algorithm and a penalty friction formulation. A more detailed description of the interfaces will be discussed in Section 2.4.
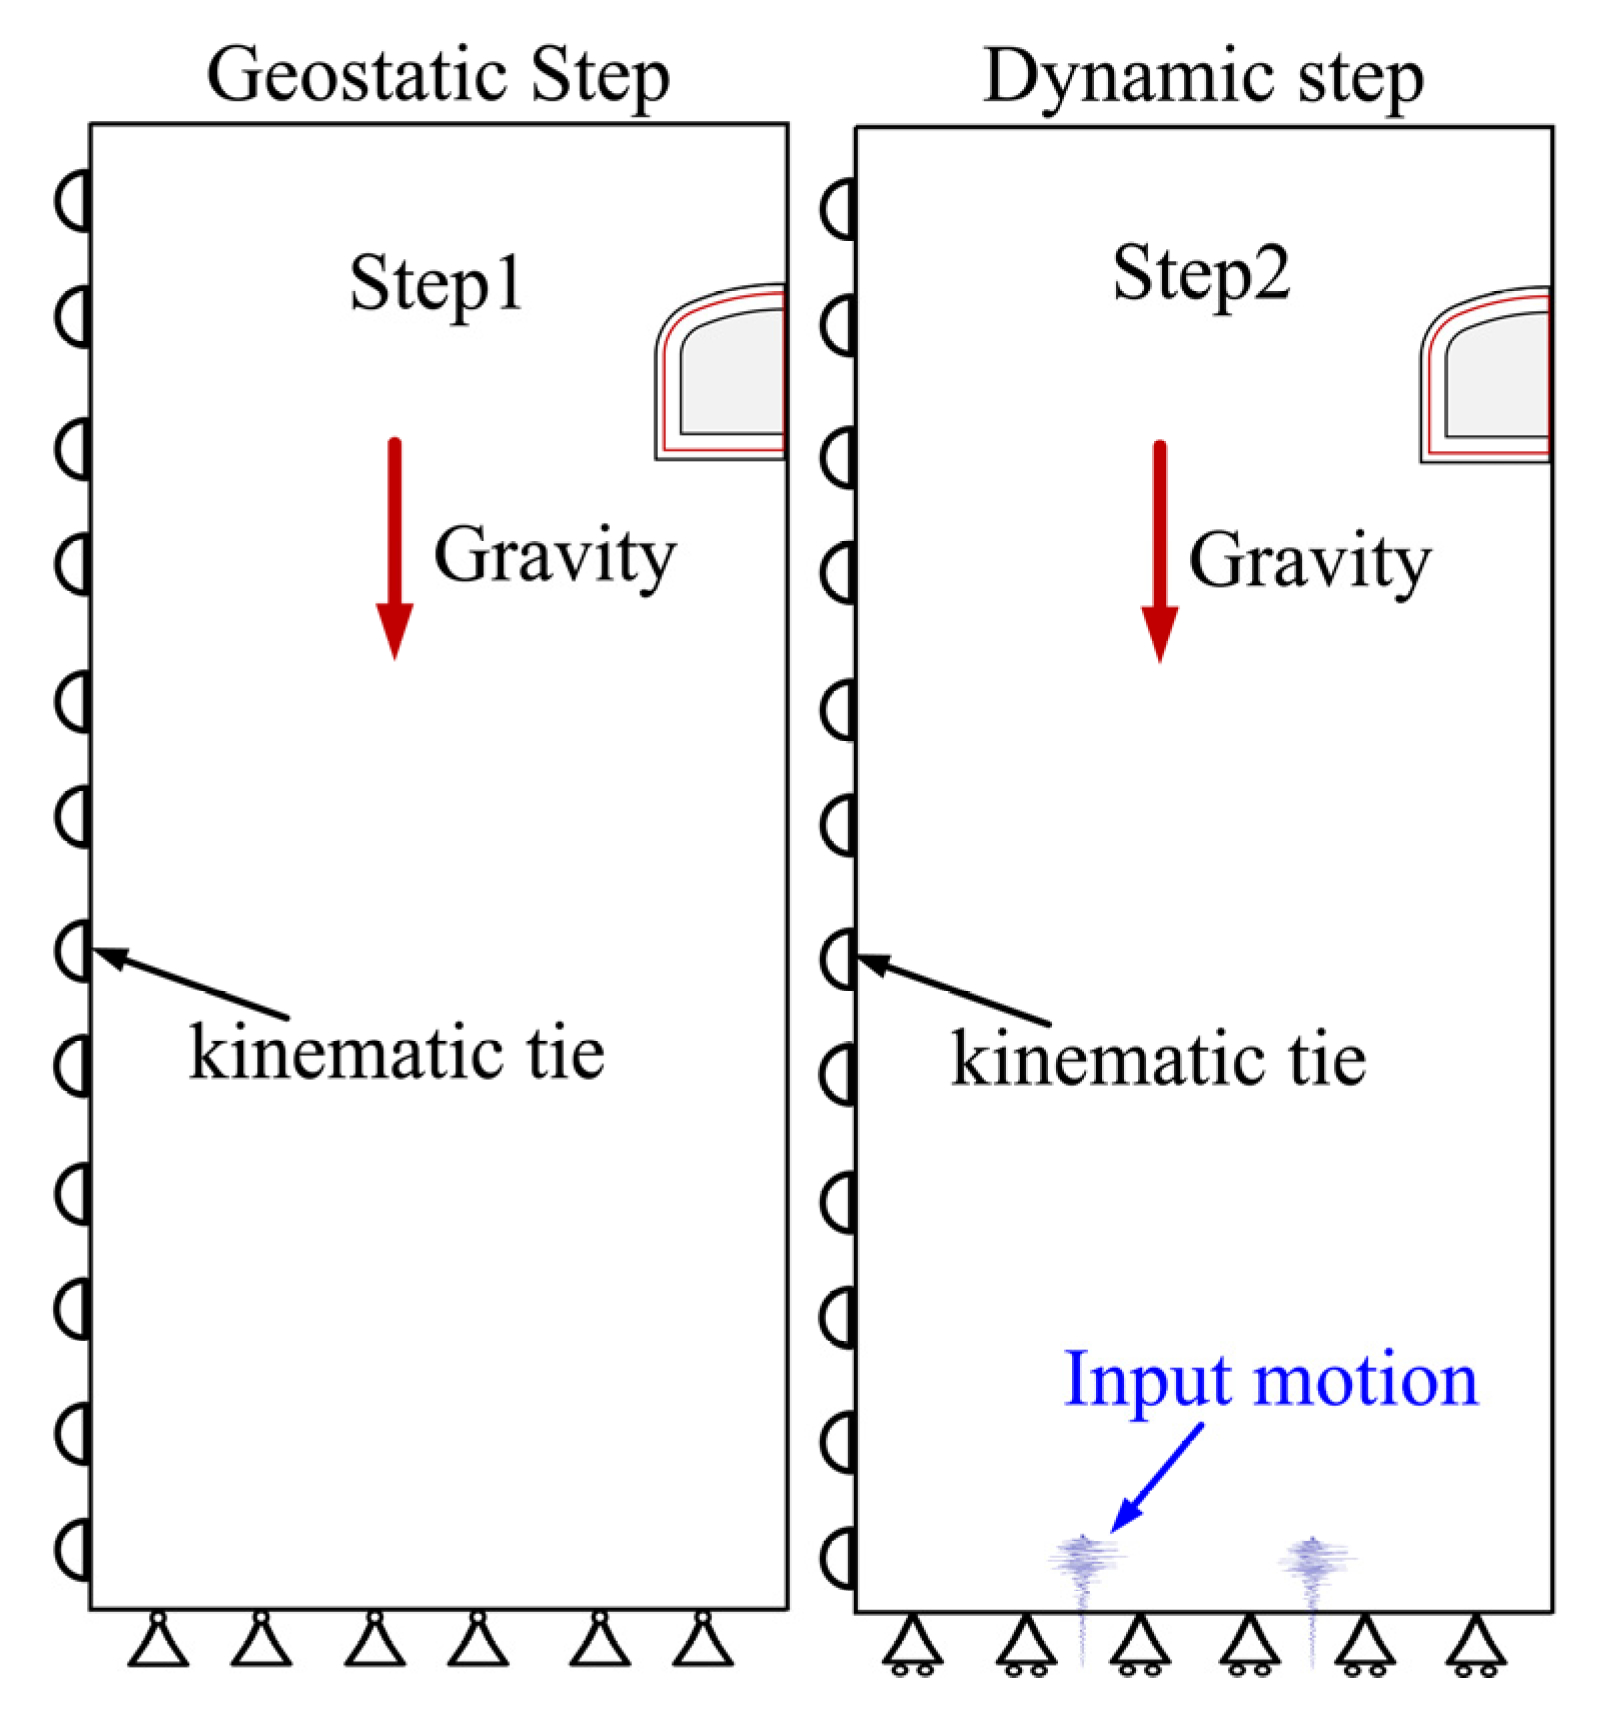
The full dynamic time analysis is performed in two steps, which are illustrated in Figure 3. First, gravity loads are applied in a static analysis step to obtain the STM tunnel system’s initial geostatic stress state, in which the effect of tunnel construction on the initial geostatic stress state is ignored. Subsequently, seismic motions are applied to the bottom boundary of the model in a dynamic analysis step in the form of acceleration time histories. The bottom boundary of the finite element model is modeled as rigid bedrock. During the geostatic analysis step, the vertical and horizontal directions of the bottom boundary are constrained. In the dynamic analysis step, the horizontal direction of the bottom boundary is released. Kinematic tie constraints are applied to the lateral boundaries of the model to ensure that the nodes of the opposing lateral boundaries at the same depth location have the same displacement pattern during the earthquake, thus simulating the response pattern of the shear beam.
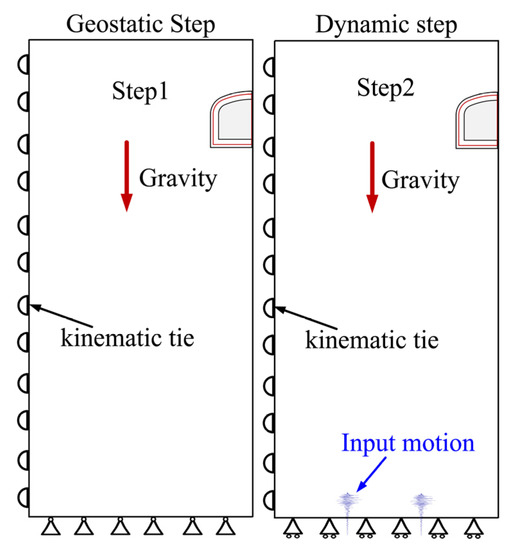
Figure 3.
Full dynamic time analysis.
2.3. Mechanical Properties of Soil and Tunnel
2.3.1. Dynamic Properties of Soil
The dynamic properties of the small-strain shear modulus of soils are proposed by Hardin and Drenvich [41], which can better match the results of resonant columns and triaxial cyclic tests. Many scholars have verified the effectiveness of the small-strain shear modulus model. The soil’s small-strain equivalent shear modulus and damping properties can be obtained by a one-dimensional (1D) equivalent linear response analysis implemented in the frequency domain. The whole site response is computed in the EERA software. The initial shear modulus of the soil is estimated through equation G = ρVs2 before EERA iterative analysis. A typical G-γ-D curve is used throughout the analysis. The calculated results compared with the small-strain shear modulus formula proposed by Hardin and Drnevich show that the empirical formulations are high for the estimated shear modulus. After a series of numerical computer comparisons, the following Equation (2) is used in this paper to describe the variation of the soil shear modulus during the earthquake. The introduction of the constant C to correct the shear modulus computed by empirical formulations has been proven effective [42].
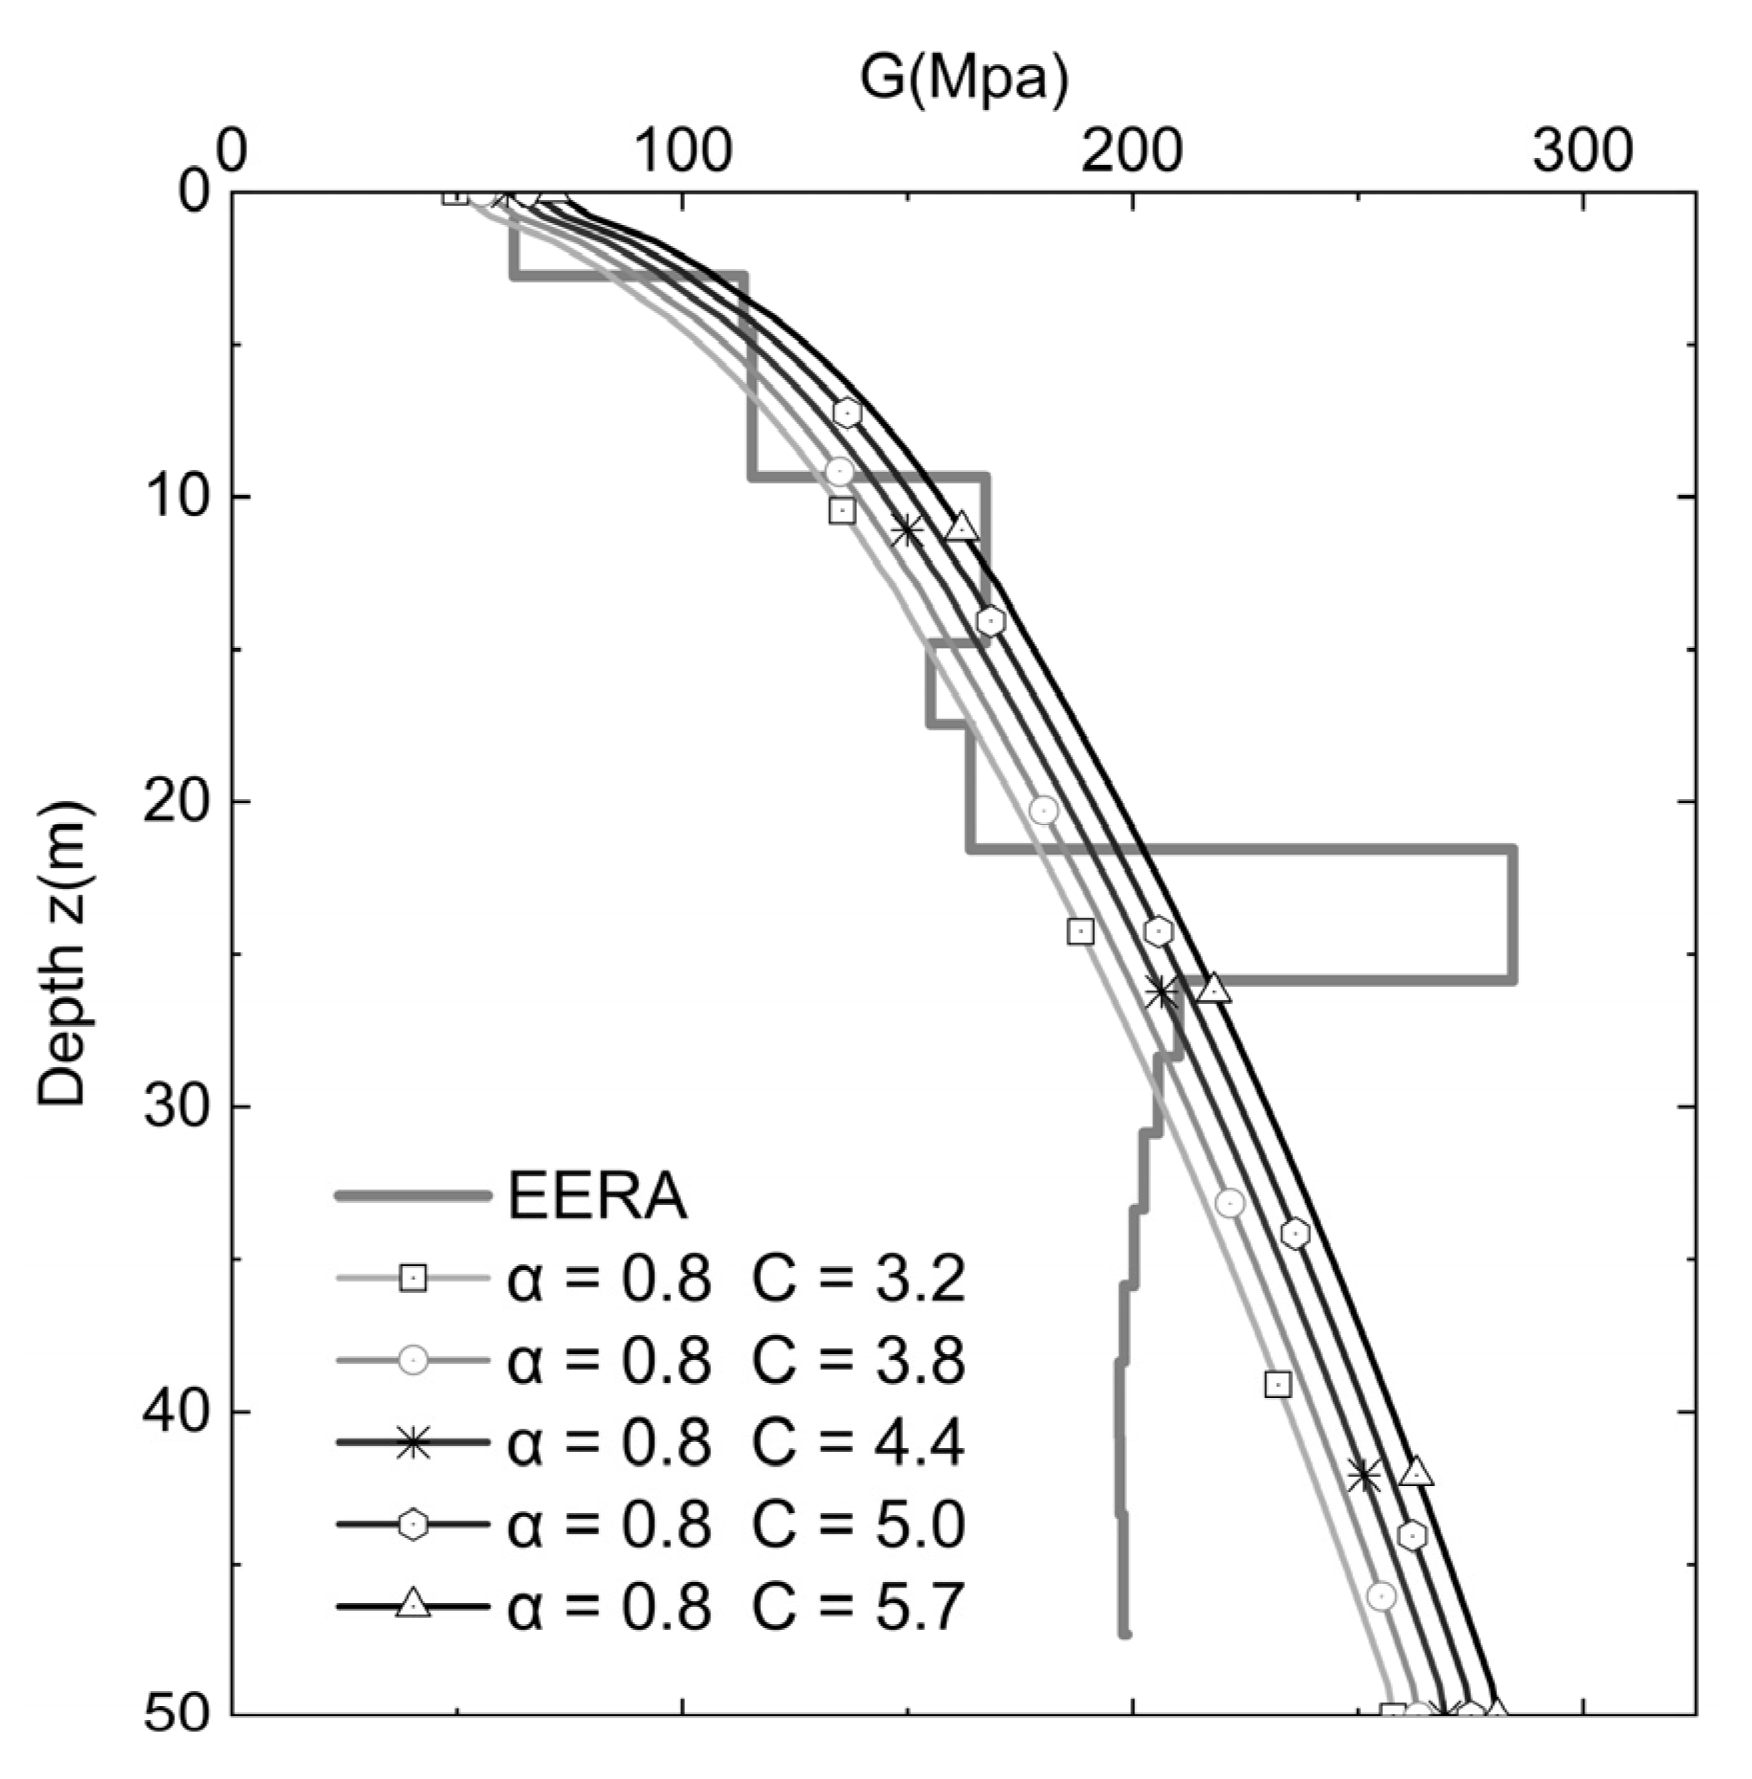
is the dynamic shear modulus (kPa), is the pore ratio, σ is the mean effective stress, α is the attenuation coefficient during each vibration, and C is a constant. The parameters α and C are obtained by a sensitivity analysis through the EERA and ABAQUS codes. In this paper, α takes the value of 0.8 and C takes the value of 3.8 (Figure 4). Equation (2) is finally implemented in the 2D finite element numerical model through the FORTRAN user subroutine, which mainly relates the mean effective stress and shear stiffness at the numerical integration point of the soil elements. The main strength parameters of the soil include the internal friction angle of 35°, according to Table 2. The dilatancy angle is assumed to be 3° [43]. To ensure the stability of Mohr–Coulomb calculation in the numerical model, the cohesion of the soil is taken as a small number (c = 2 kPa). For the three numerical cases of seismic response analysis, the soil’s viscous damping is introduced in the form of Rayleigh damping. Rayleigh damping is derived by the dual frequency method, and the damping matrix is introduced into the finite element model in the following form:
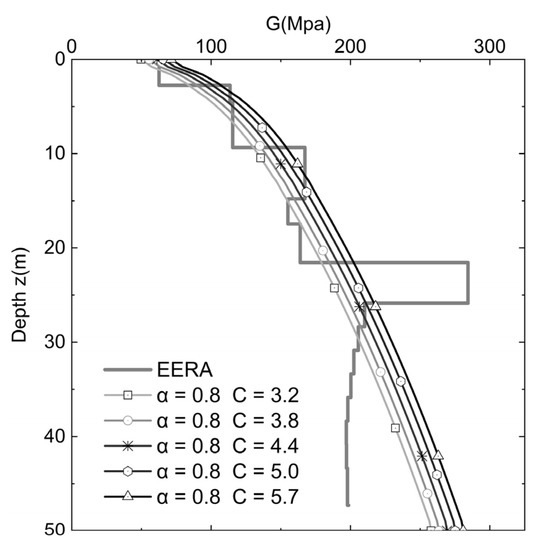
Figure 4.
Sensitivity analysis for shear step and boundary condition modulus varying with depth.
The Rayleigh damping parameters a and b are calculated and determined to be 0.4627 and 0.0042, respectively.
2.3.2. Constitutive Models for Rebar and Concrete
The behavior of concrete under earthquake action is simulated by the plastic damage constitutive model proposed by Lee and Fenves [44,45], which is built into ABAQUS. It can describe the damage and deformation of concrete under dynamic cyclic loading. The constitutive parameters of C25 and C35 concrete are shown in Table 4, Table 5, Table 6 and Table 7 computed according to code for the design of concrete structures. The rebar is simulated by a linear elastic constitutive method. Its elastic modulus is 210 GPa, and its density is 7800 kg/m−3.

Table 4.
Relationship of compressive stress, plastic strain, and damage factor of concrete(c25).

Table 5.
Relationship of tensile stress, cracking strain, and damage factor of concrete(c25).

Table 6.
Relationship of compressive stress, plastic strain, and damage factor of concrete(c35).

Table 7.
Relationship of tensile stress, cracking strain, and damage factor of concrete(c35).
2.4. Contact Characteristics
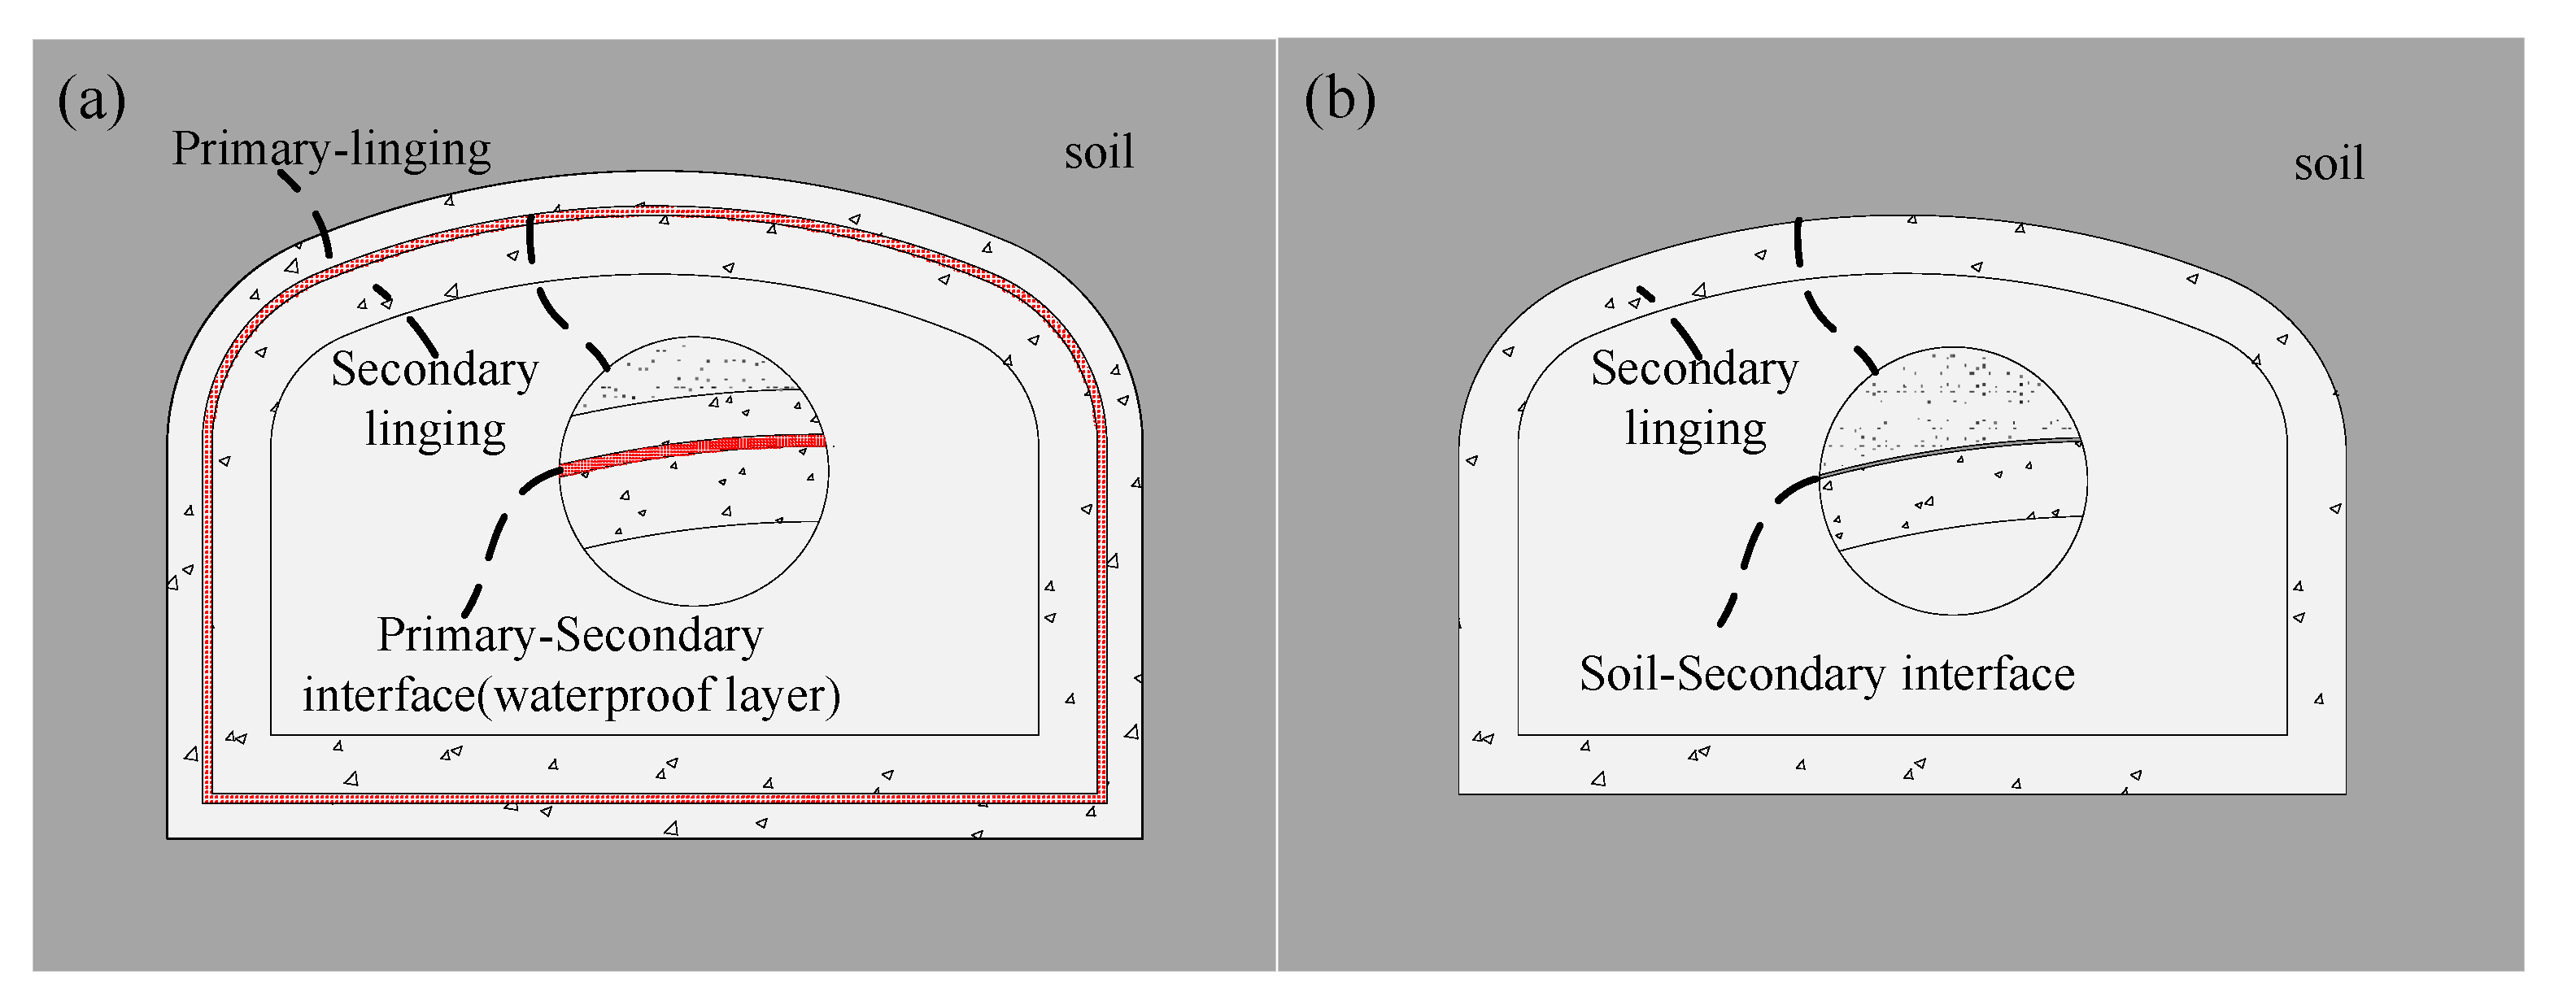
Figure 5 illustrates the contact interface of the STM tunnel. The interfaces between the soil and primary linings, as well as between the primary linings and the secondary linings, are modelled by implementing a finite sliding hard contact algorithm (ABAQUS). The algorithm can describe the potential separation or sliding behavior between interacting surfaces during ground seismic shaking. The penalty friction formulation describes the tangential behavior of interacting surfaces by introducing a classical Coulomb friction, μ1. The coefficient of Coulomb friction μ1 is respectively set to be equal to 0.2, 0.3, 0.4, 0.5, 0.6, 0.8, and no-slip (i.e., tie interface condition) for the soil-primary linings interfaces to investigate the effect of the interface friction on the soil-tunnel system response.
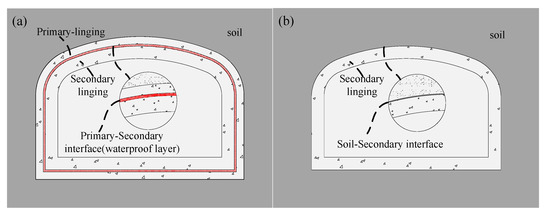
Figure 5.
Contact interface schematic (a) with primary lining (b) without primary lining.
Because of the existence of waterproof layer between the primary and secondary linings, the contact interface is too fragile to withstand intense shearing action when the primary linings and the secondary lining slide relative to each other. The friction coefficient μ2 is respectively set equal to 0, 0.2, 0.4, 0.6, and 0.8 to examine the effect of the primary–secondary lining interfaces on the soil-tunnel system response.
2.5. Seismic Input Motion
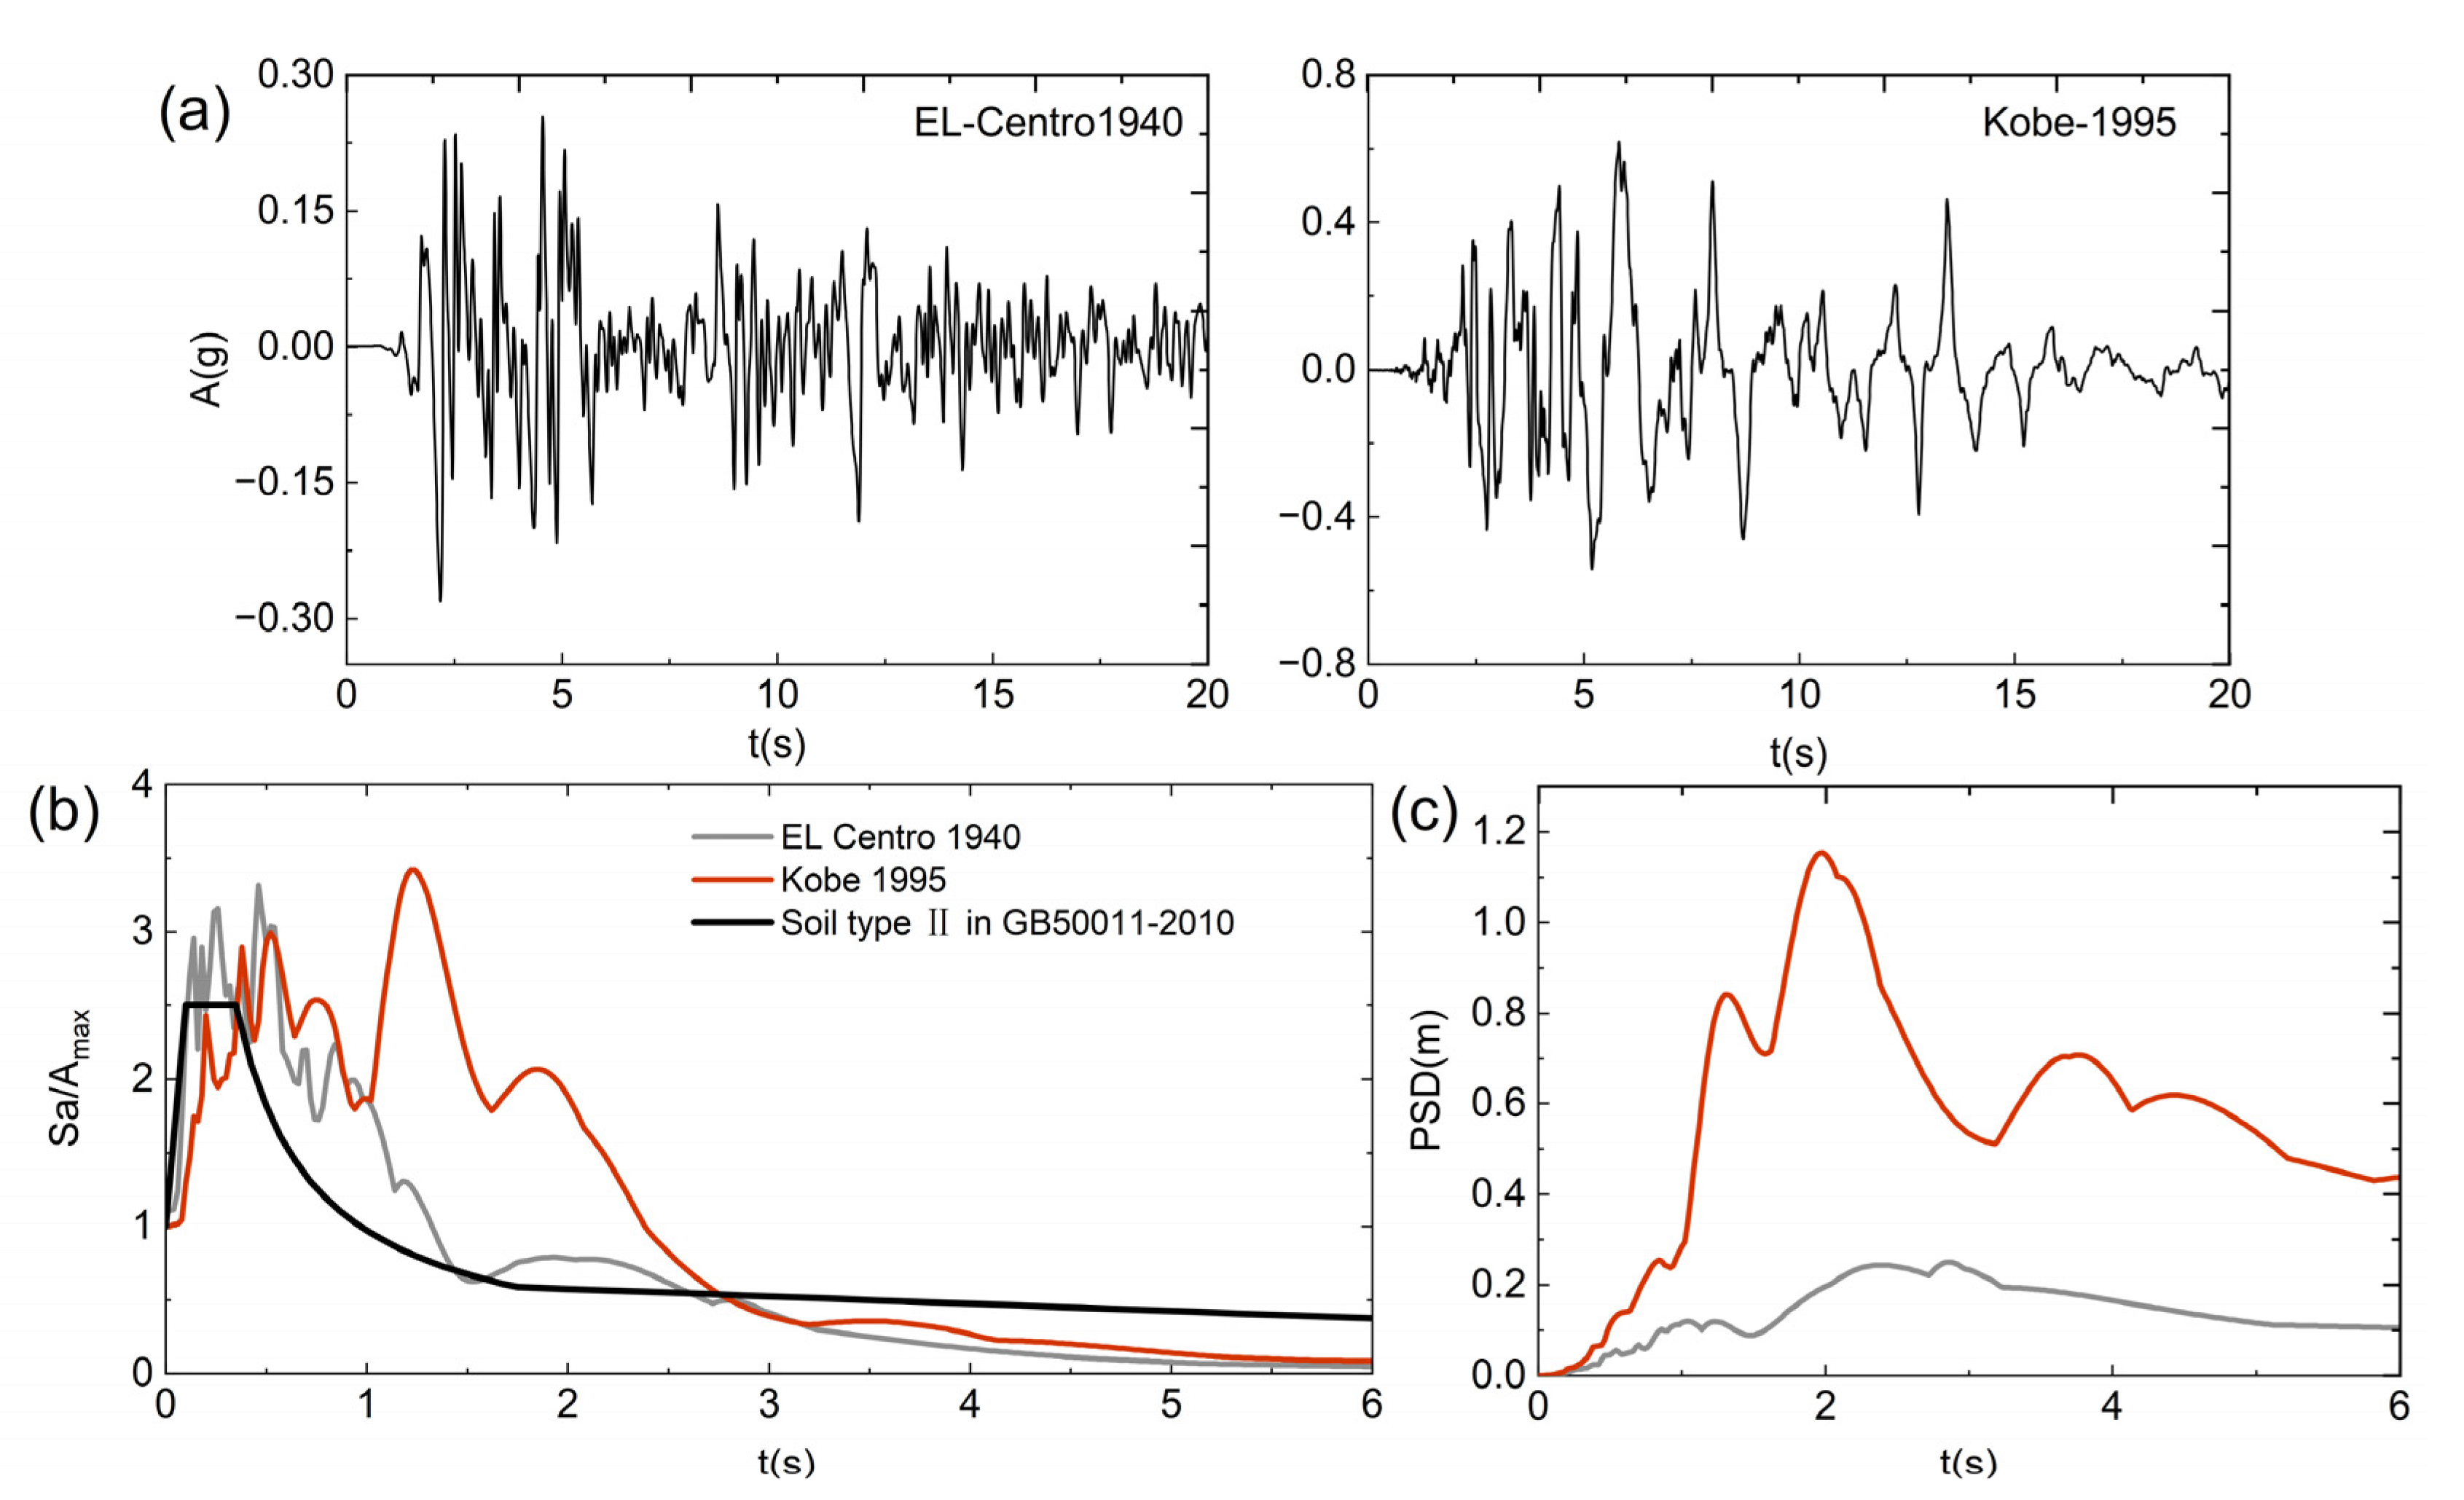
Two actual acceleration records (Table 8) are selected as seismic input motion for the 2D coupled STM tunnel system dynamic analysis. The selection of EL-Centro was made on the basis of spectral matching with the GB50011-2010 spectrum for soil type II. Since the seismic response of the tunnel mainly depends on the deformation of the surrounding ground, the Takatori record, which can generate a notable displacement response of soil, as shown in Figure 6c, was selected to evaluate the response of the STM tunnel. The seismic motion is input from the bottom of the numerical model. The EL-Centro record from the 1940 Imperial Valley earthquake is characterized by a duration of 30 s and a maximum acceleration of 0.35 g. The Takatori record from the 1995 Kobe earthquake is characterized by a duration of 41 s and a maximum acceleration of 0.65 g. The PGA of input records is scaled from 0.1 to 0.3 g to investigate the dynamic response of the SPS systems to increasing seismic intensity levels. The duration of input records is intercepted for the 20 s. Figure 6 portrays the acceleration time histories of the input motions.

Table 8.
Input seismic motion.
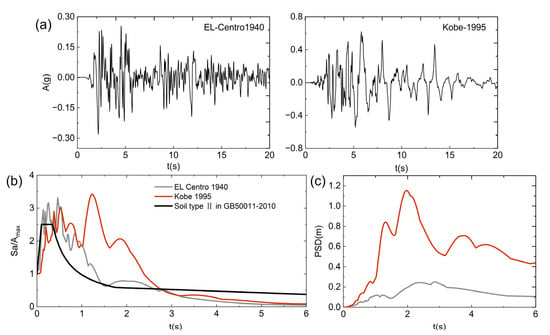
Figure 6.
(a) Time histories of the input motions (PGA scaled to 0.1 g, 0.2 g, and 0.3 g) (b) acceleration response spectra of the input motions and design response spectrum of soil type II in GB50011-2010 (c) displacement response spectra of the input motions.
3. Results
Representative results of the 2D analyses, including: (1) deformation modes of the tunnel, (2) horizontal acceleration, (3) dynamic internal forces of the tunnel, and (4) dynamic damage of the tunnel are presented and discussed in the following sections.
3.1. Deformation Modes of Tunnel
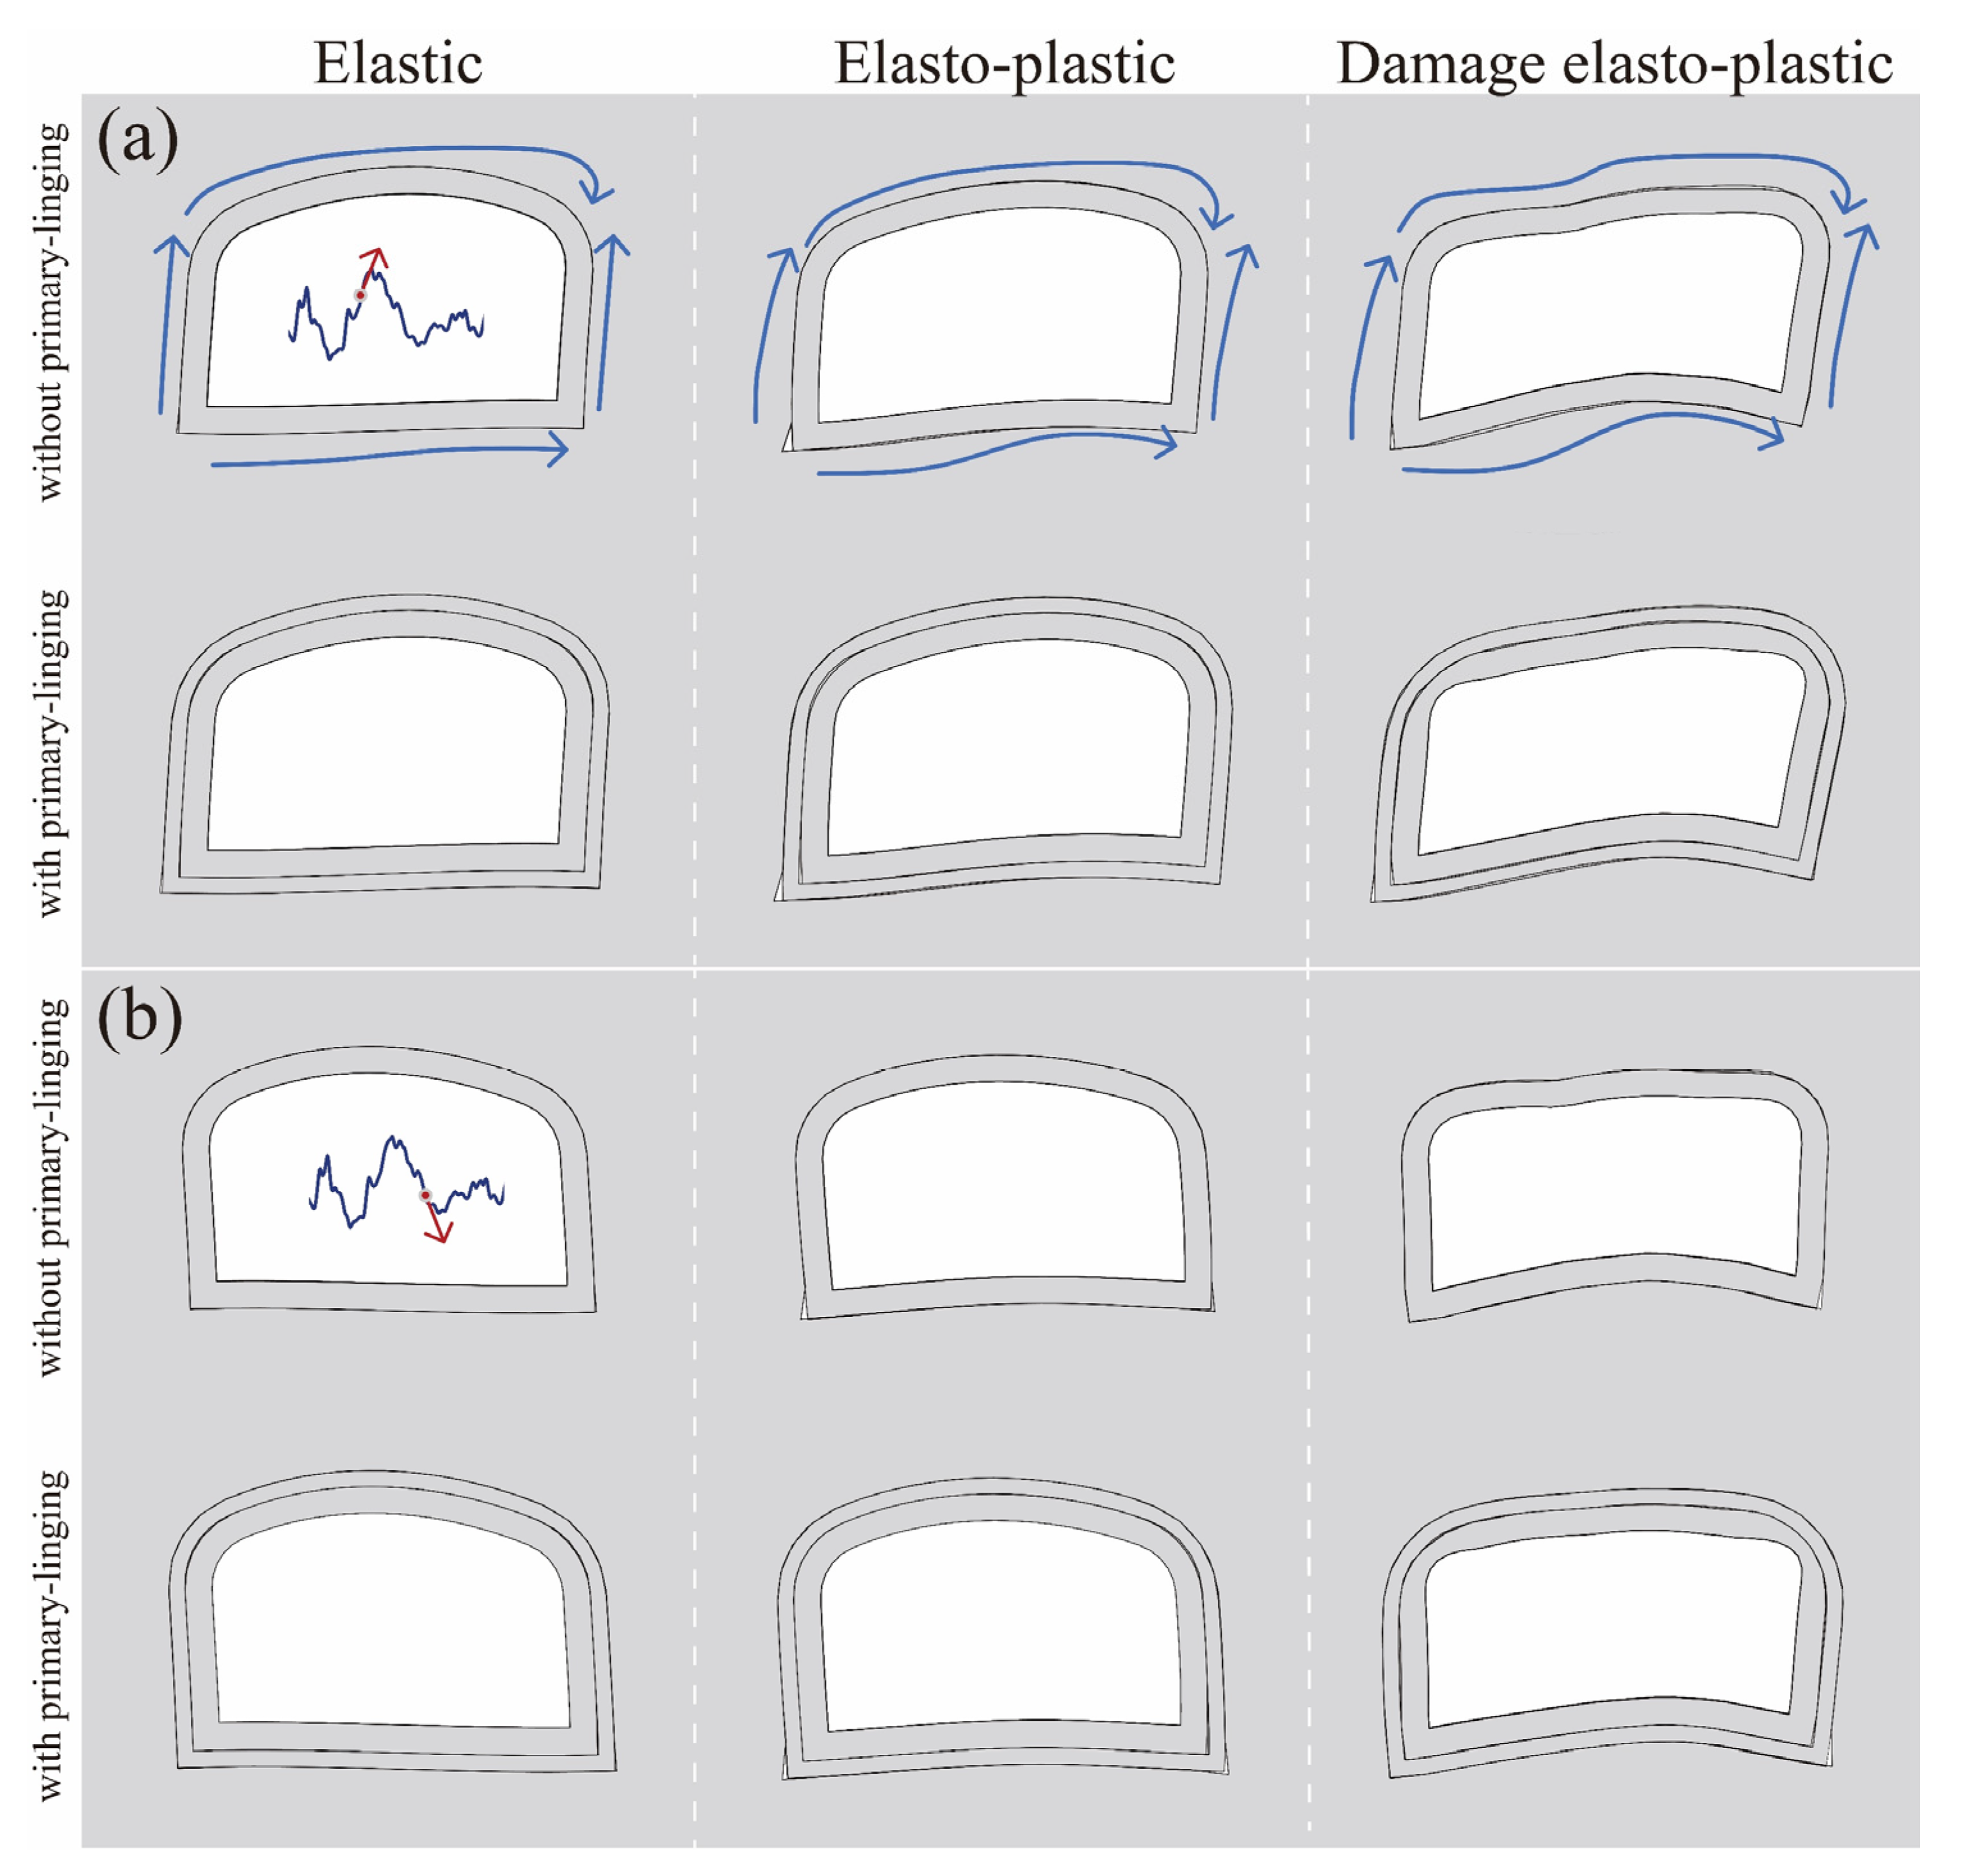
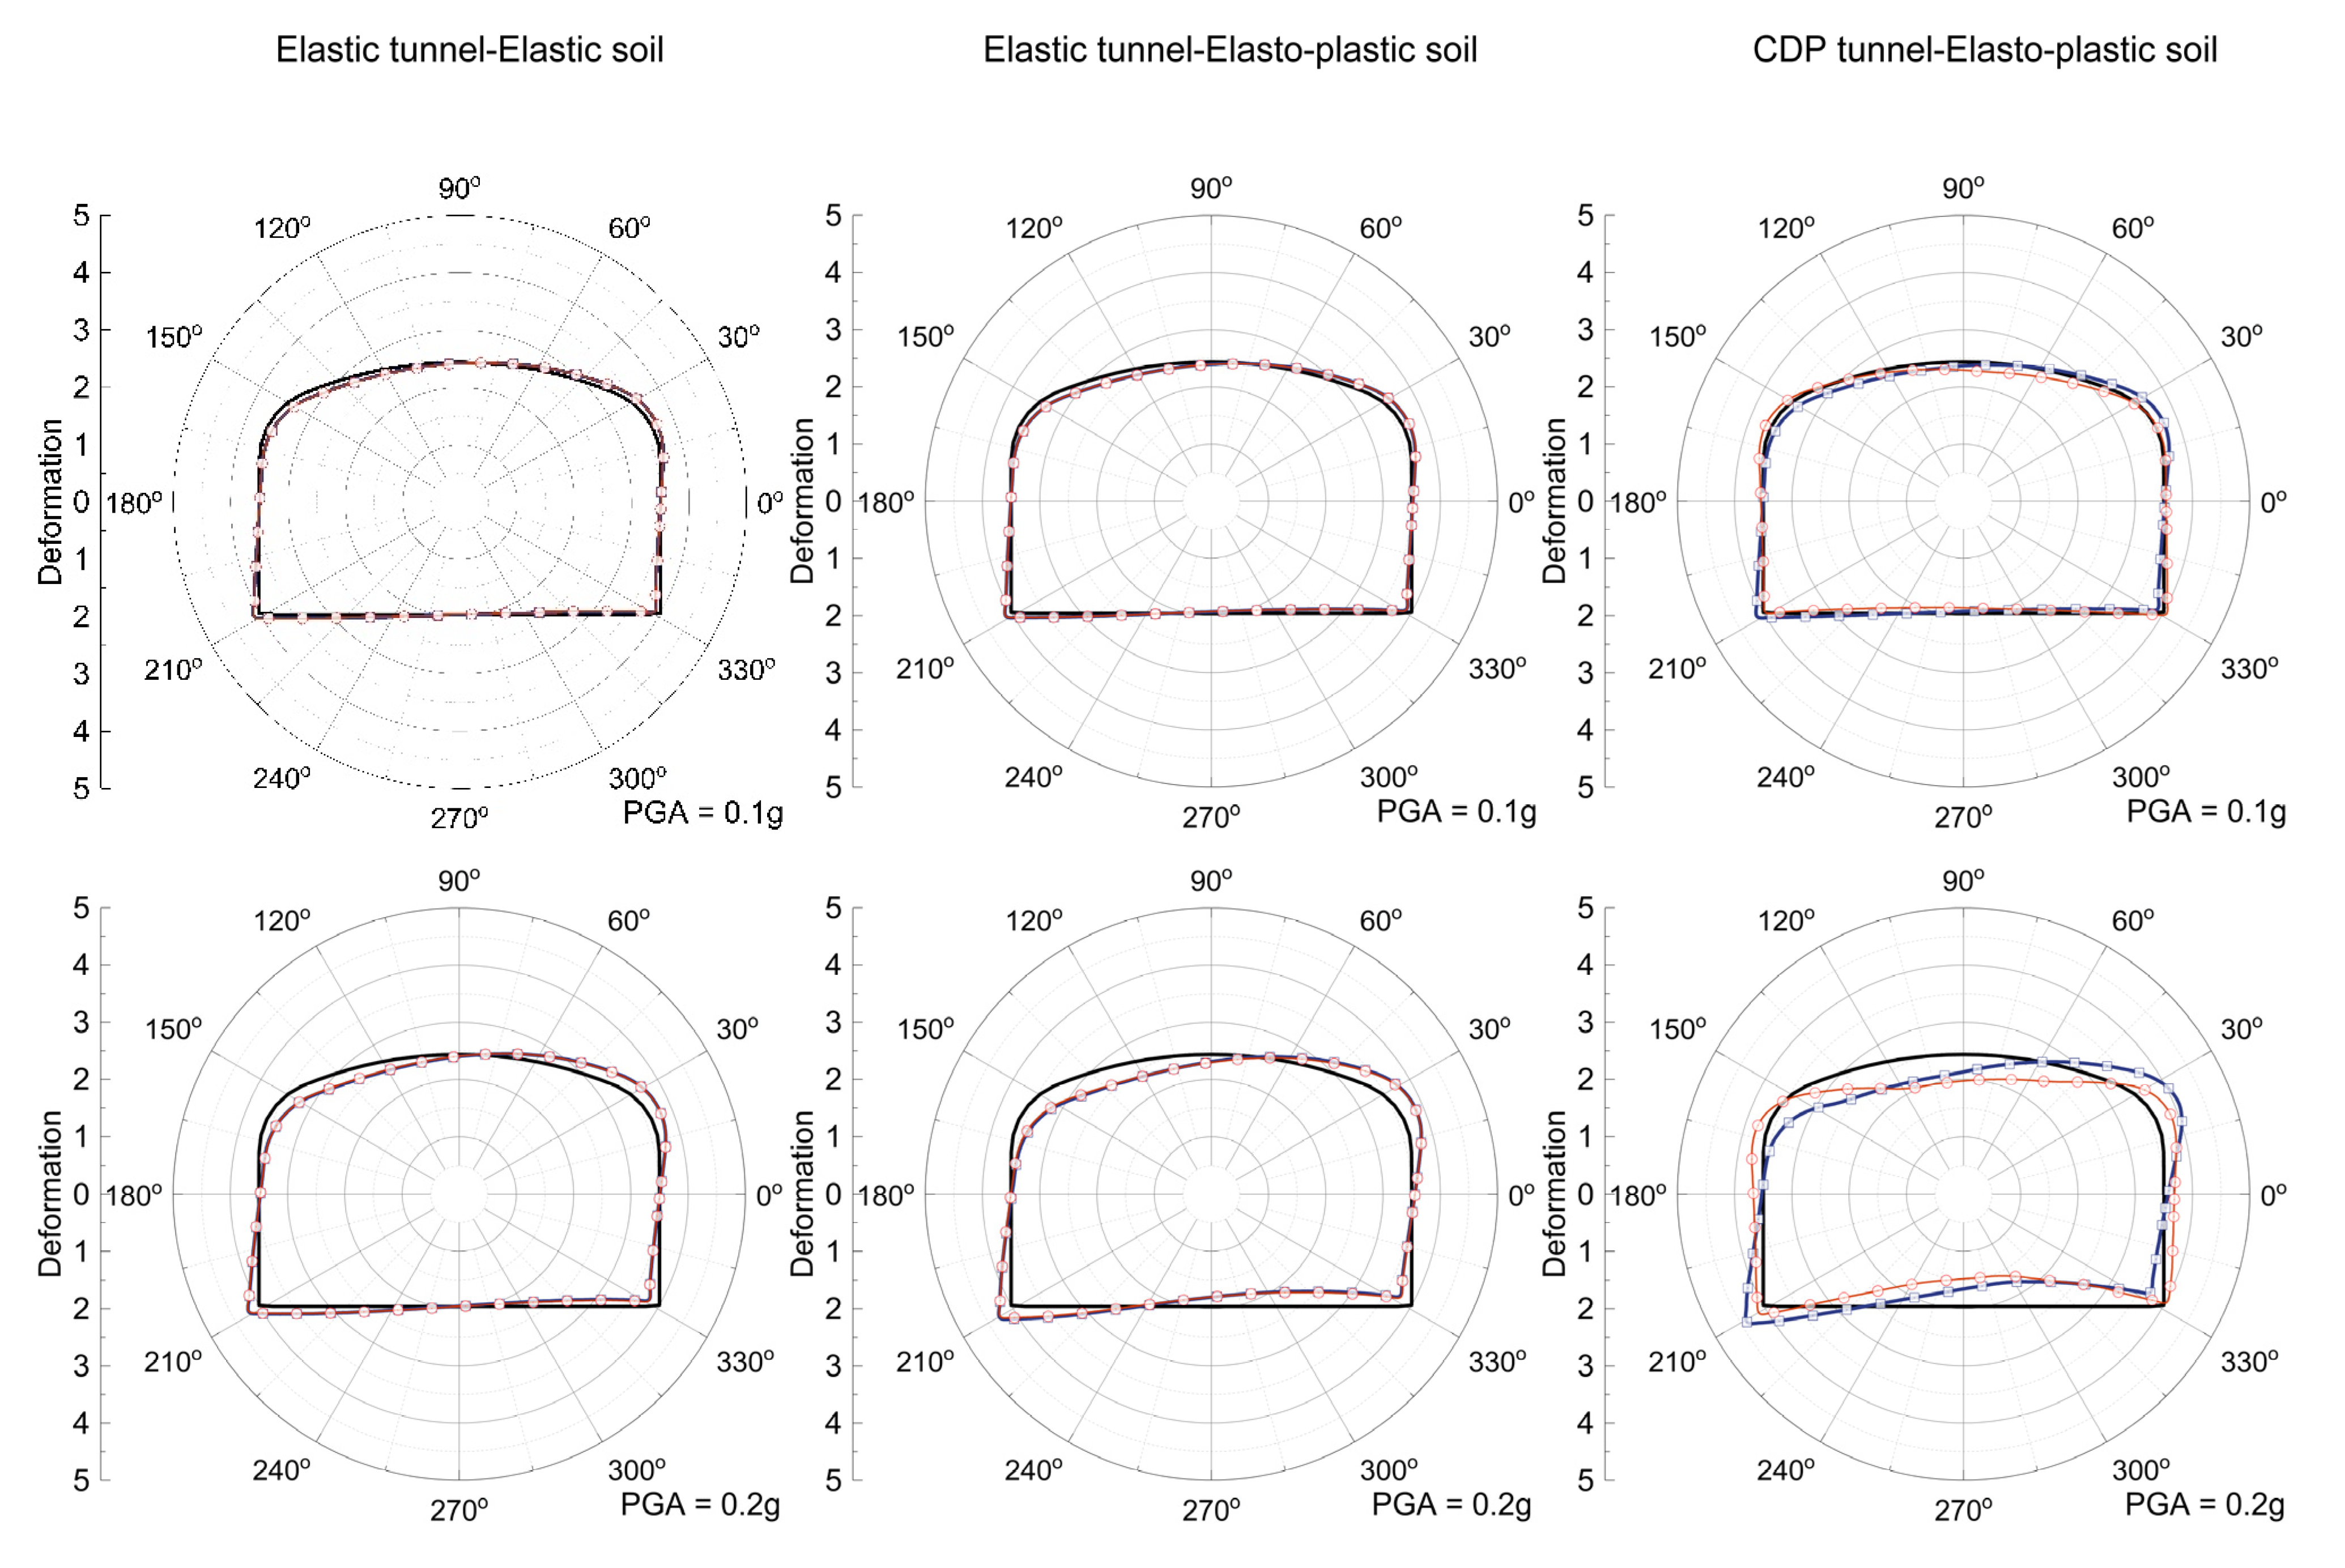
Figure 7 portrays the representative deformation shape of the tunnel, calculated from different soil and concrete constitutive models at the maximum shear deformation step. The results indicate that the tunnel undergoes ovalling and racking-rocking deformation during seismic wave propagation. The principal axes of the ovalling deformation approximately correspond to 30° and 150° in the counterclockwise direction, which can be more clearly observed in the distribution of soil plastic strain around the tunnel.. Noticeable deflection of the tunnel side wall can also be observed, that is, racking deformation. In addition, in the elasto-plastic analysis, different degrees of inward deformation can also be observed for the roof slab, side walls, and bottom slab of the tunnel. To a certain extent, the deformation state of the tunnel is consistent with the research of Wang and Hashash and Y.M.A. et al. [9,28,46,47,48].
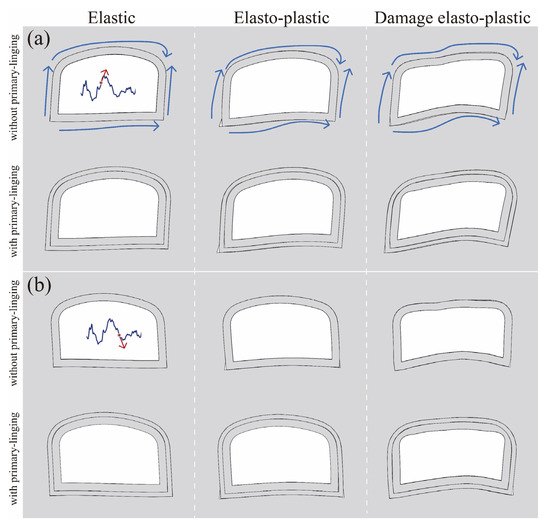
Figure 7.
The shape of the deformed tunnel for time steps of the computed maximum distortion, elasto-plastic analysis: (a) ground motion towards the right (b) ground motion towards left; (deformations scale 100).
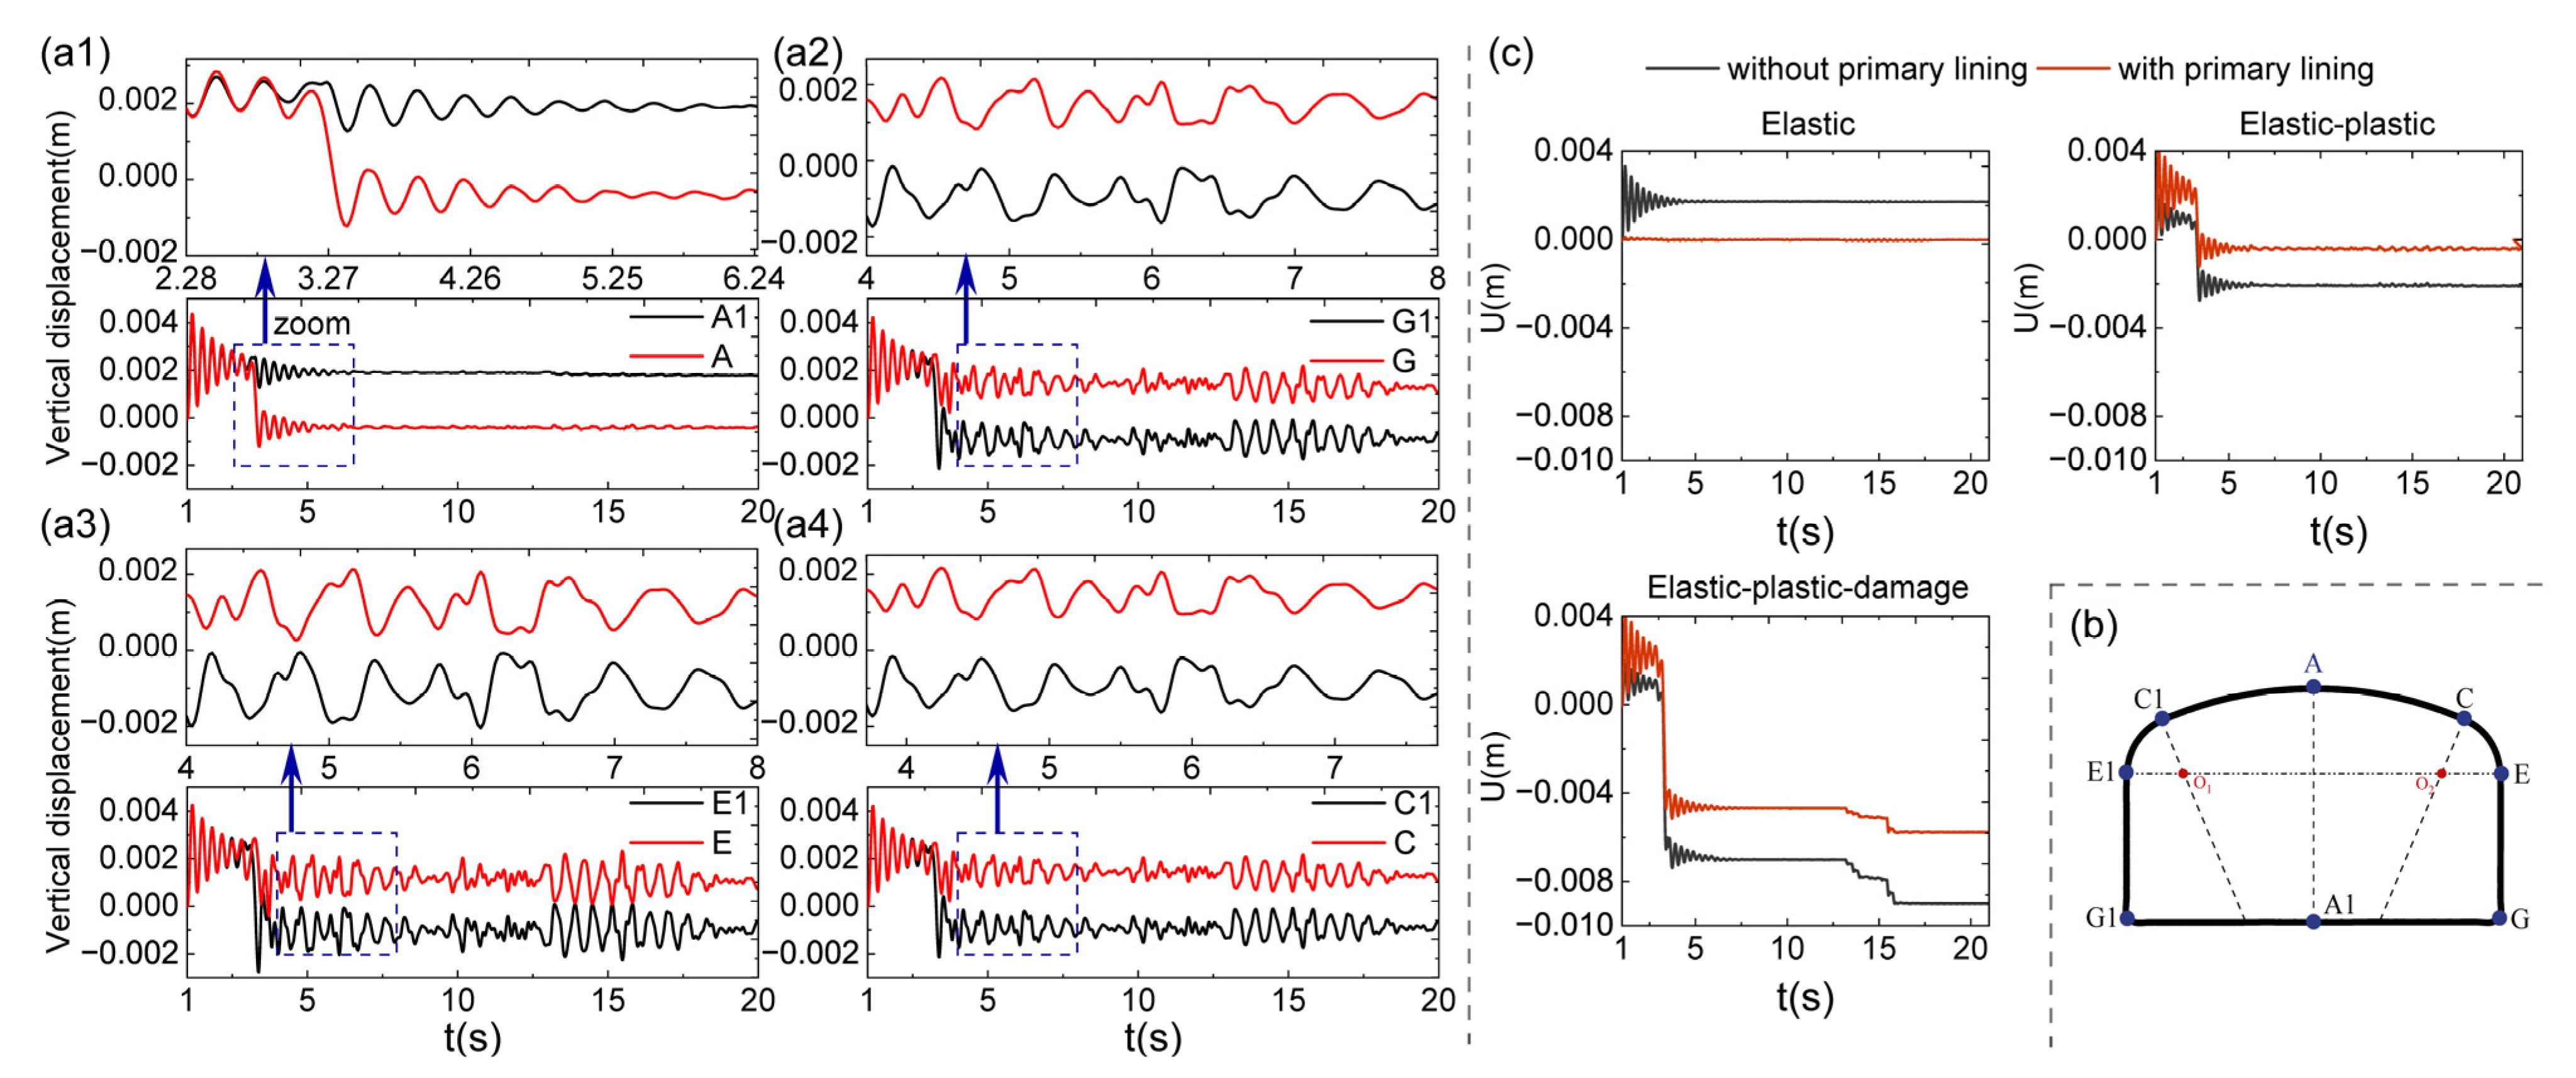
Figure 8a presents the vertical displacement time histories of the tunnel with primary lining, recorded on the roof slab, side wall, and bottom plate of the tunnel. The results refer to the elasto-plastic analysis. The vertical displacement time histories of the relative position of the tunnel (C to C1, E to E1, and G to G1) are out of phase, which indicates that the tunnel has experienced a rocking-racking distortion mode. Figure 8c summarizes the time histories of the vertical displacement of the tunnel crown under different earthquake conditions. The results refer to the elastic, elasto-plastic, and damage elasto-plastic analysis of the tunnel. The input motion is an EQ1 with PGA scaled to 0.2 g. The figure shows that, for the three analysis cases, the existence of the primary lining reduces the settlement of the tunnel’s roof, mainly because the primary lining bears vertical deformation from the soil. In addition, when the soil yields plastically, the tunnel produces residual settlement after the earthquake. In particular, when the tunnel is damaged (CDP), the residual settlement after the earthquake is more pronounced. With the yield of the soil and the tunnel itself, the settlement at the tunnel’s roof causes multiple residual settlements.
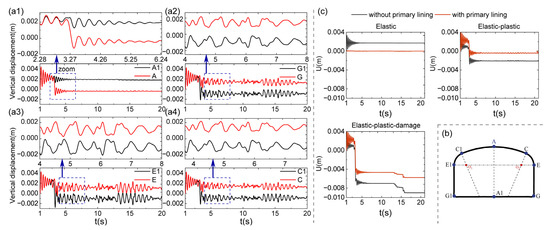
Figure 8.
Vertical displacement of the tunnel with primary lining (a1–a4) time histories (b) monitoring stations (c) time histories of the vertical displacement of the tunnel crown.
Figure 9 illustrates the effect of the primary lining on the deformation of the tunnel. These results refer to the elastic, elasto-plastic, and damage elasto-plastic analysis of the STM tunnel. The input motion is EQ1 with PGA scaled to 0.1 g, 0.2 g, and 0.3 g. For both elastic and elasto-plastic analysis, the existence of primary lining has a slight reduction effect on the deformation of the tunnel. When considering the damage and plastic deformation of the tunnel, the existence of primary lining leads to significantly different tunnel deformation modes. Additionally, this effect will become more pronounced as the PGA value increases.
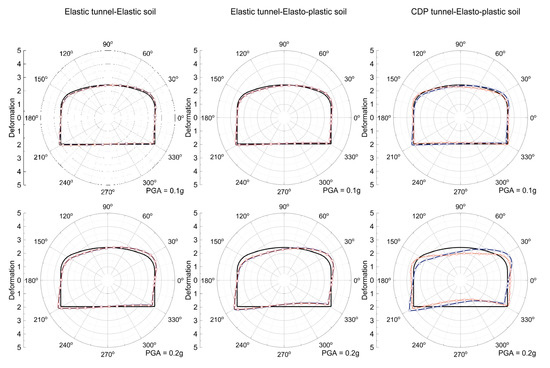

Figure 9.
The shape of deformed tunnel for time steps computed.
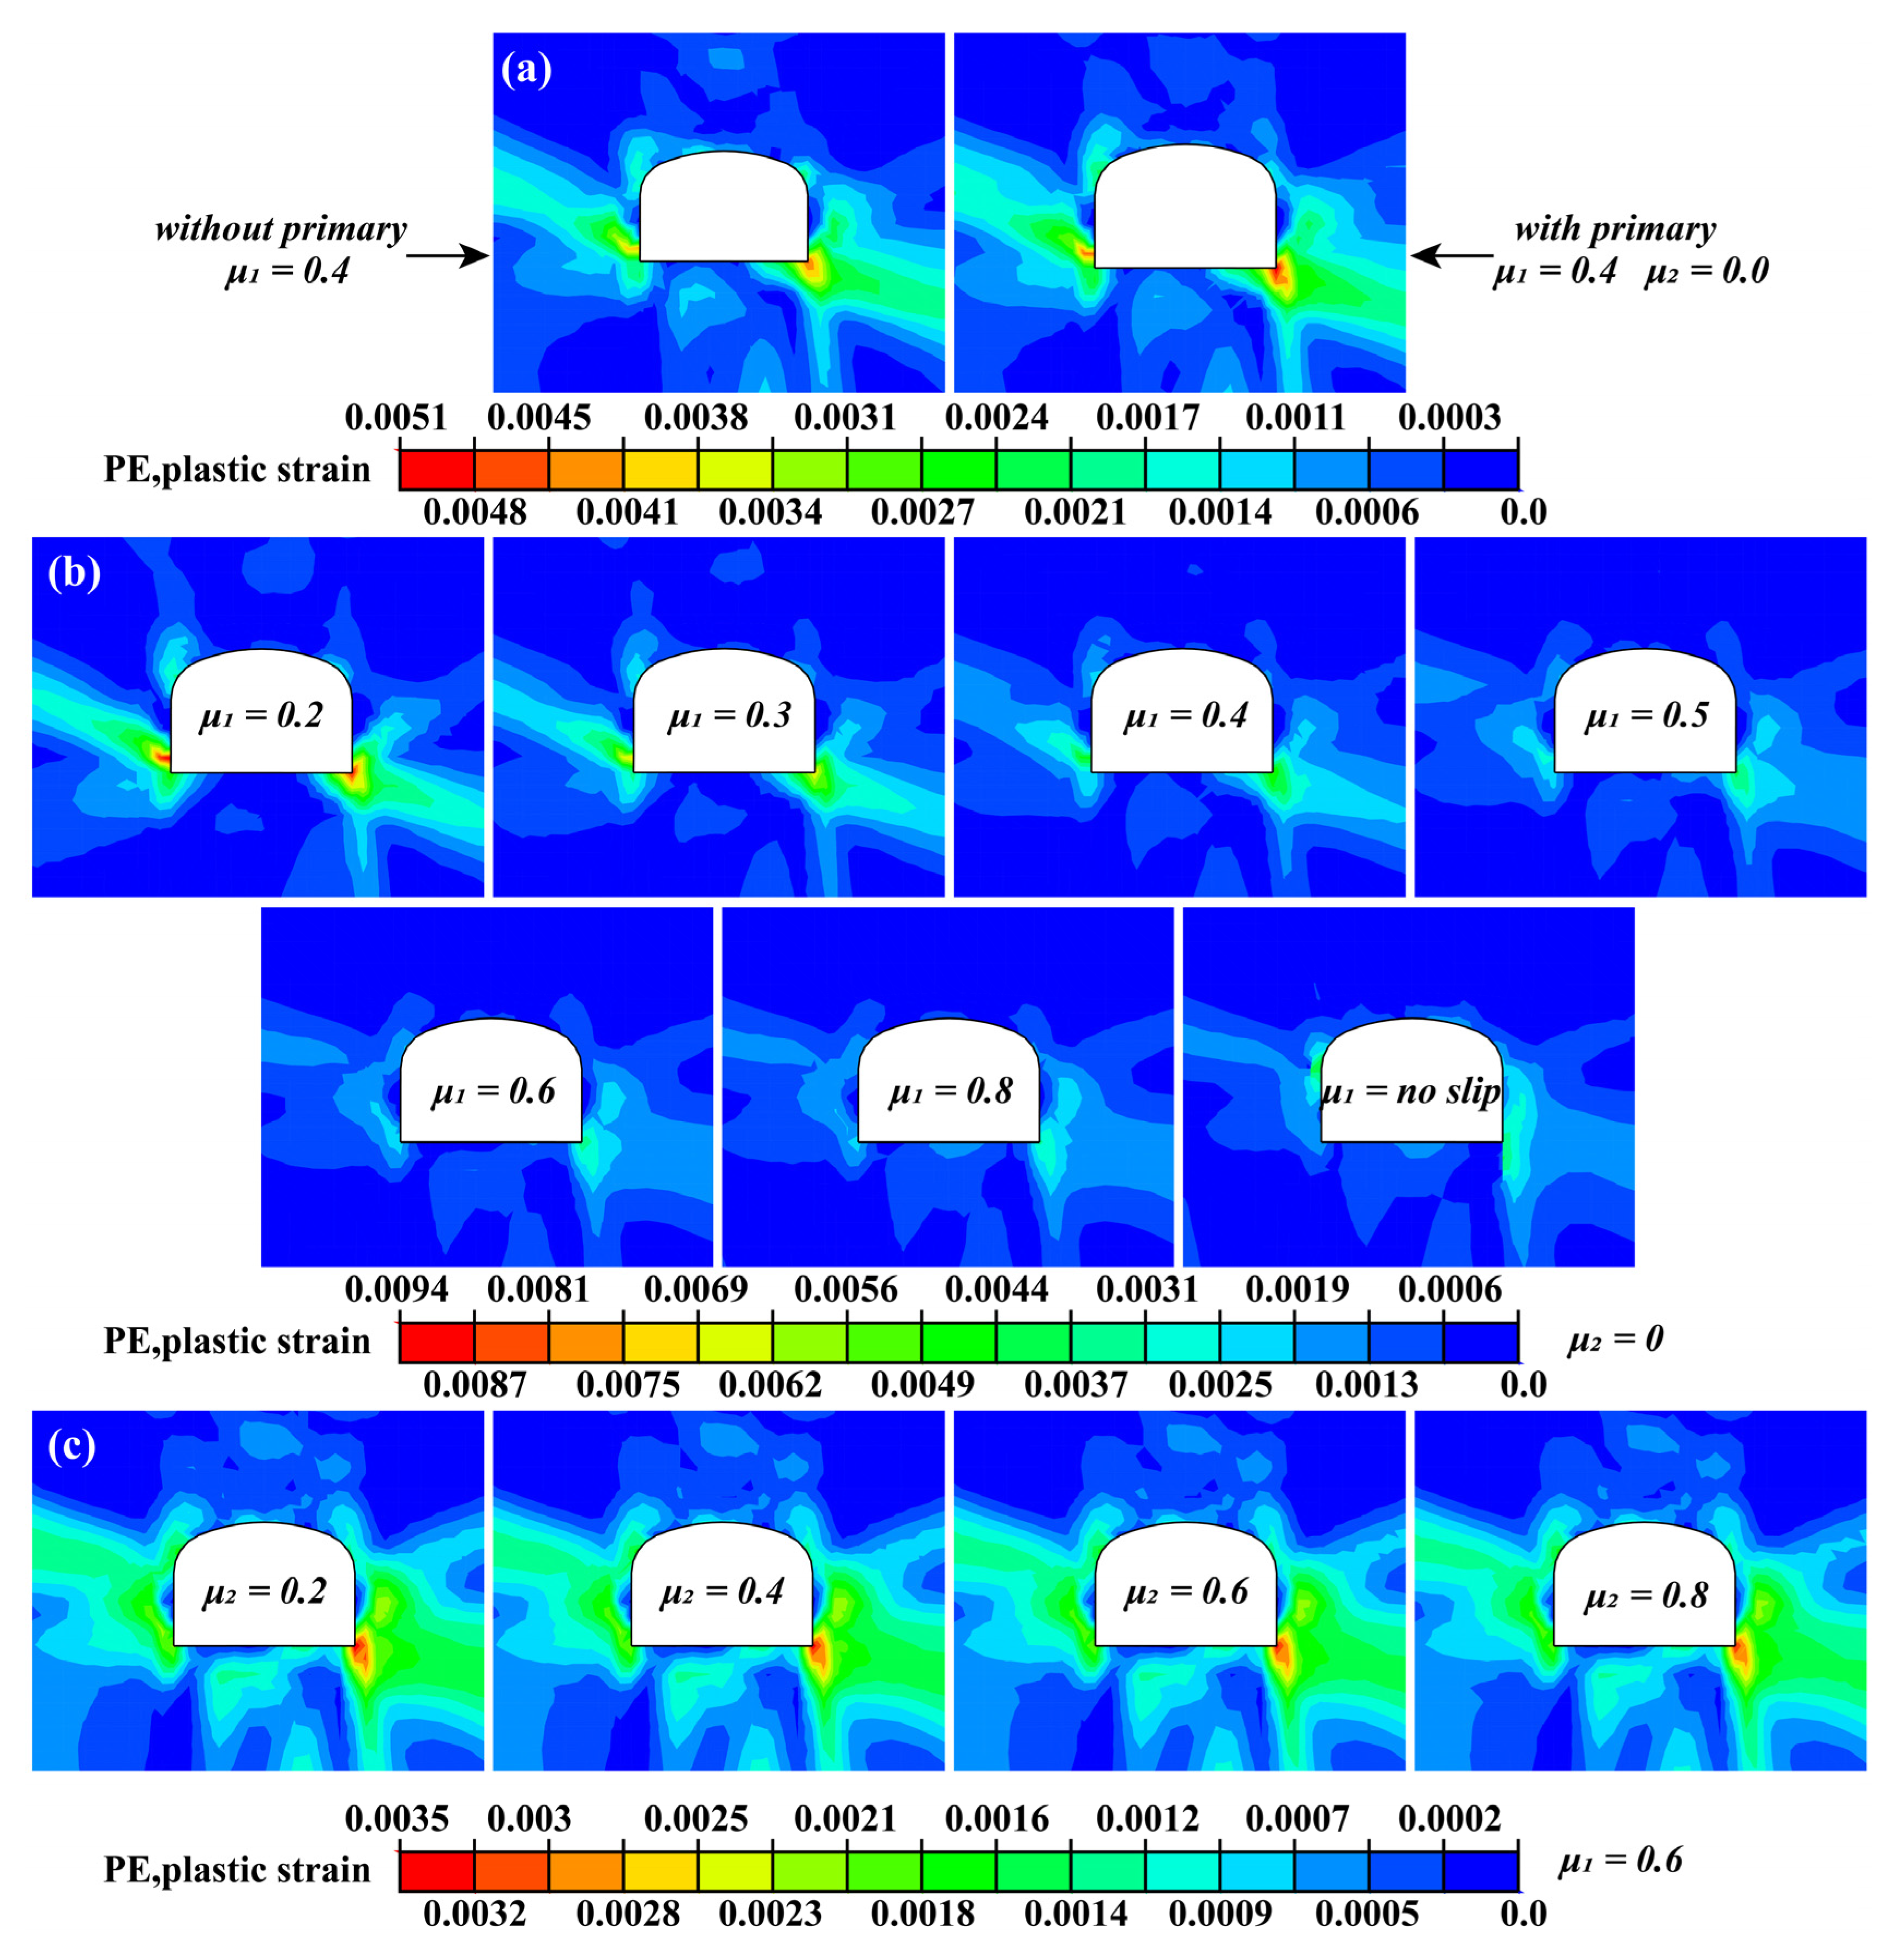
Figure 10 portrays a typical distribution of soil plastic strain around the tunnel at the end of EQ2 with PGA = 0.3 g. These results refer to the elasto-plastic analysis of the tunnel, highlighting the effects of primary lining, soil–primary linings, and primary–secondary linings interface condition, on the soil yielding in the vicinity of the STM tunnel. Figure 10a shows that the existence of primary lining leads to an increase of the soil plastic strain when the primary–secondary lining interface condition is full-slip. Figure 10b shows the effect of soil–primary lining interface conditions on soil plastic strain, considering that the primary–secondary lining interface condition is full-slip (i.e., μ2 = 0). For the sliding soil-primary lining interface condition, the soil plastic strain is mainly concentrated in the bottom corner of the tunnel, and the soil plastic strain decreases with the increase of the friction between the soil and the primary lining (i.e., μ1 increases from 0.2 to 0.8). For the no-slip soil–primary lining interface condition (i.e., μ1 = no-slip), the plastic strain of the soil around the tunnel is mainly concentrated in one side wall and the arc roof at the diagonally opposite position of the side wall. Figure 10c shows the effect of the primary–secondary lining interface condition on the soil plastic strain, considering that the primary-soil interface condition is slip (i.e., μ1 = 0.6). The soil plastic strain is mainly concentrated near the bottom corner and side wall, and the soil plastic strain does not change significantly with the increase of the friction of the primary–secondary lining interface condition (i.e., μ2 increases from 0.2 to 0.8).
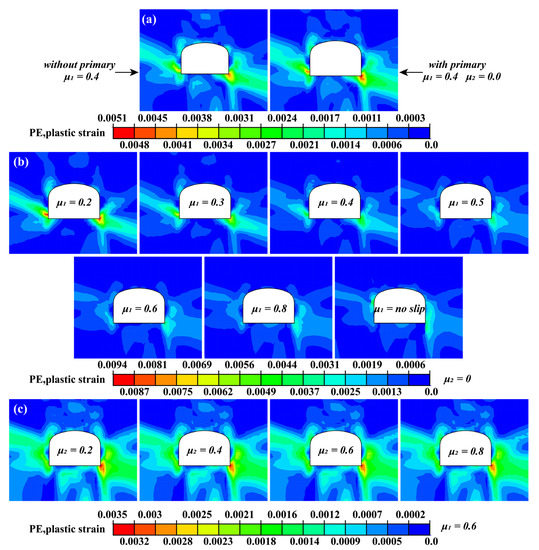
Figure 10.
Soil plastic strain distributions (a) tunnels without and with primary lining (b) tunnels with primary lining; μ1 = 0.2, 0.4, 0.6, 0.8 and no-slip; μ2 = 0 (c) tunnels with primary lining; μ1 = 0.6; μ2 = 0.2, 0.4, 0.6, 0.8.
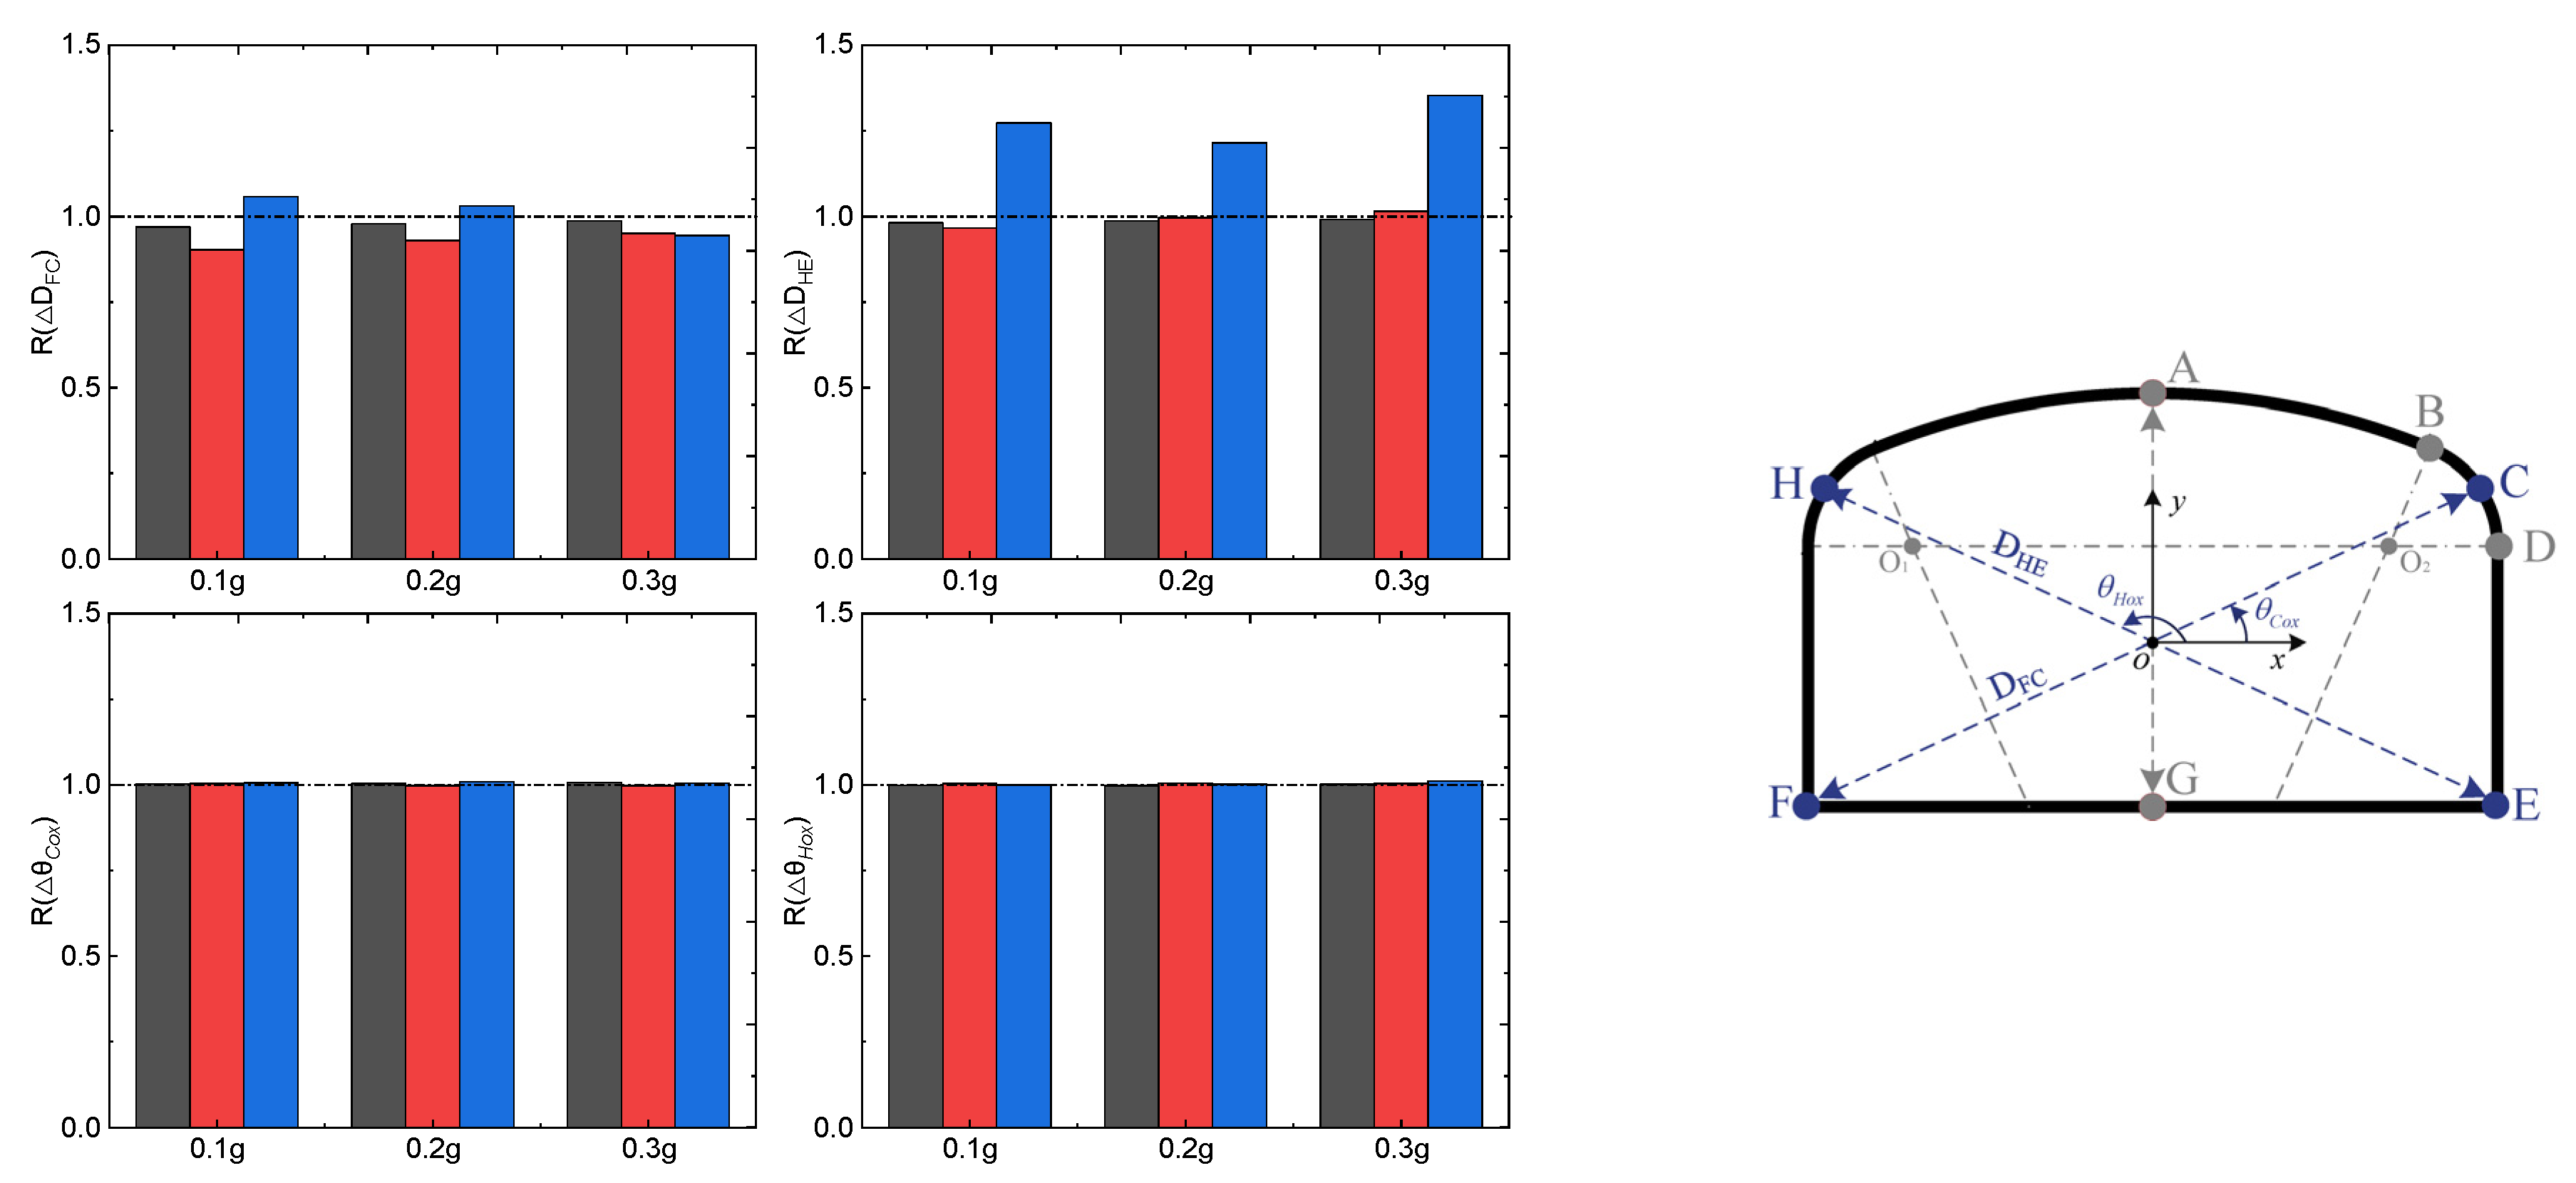
Generally, in most cases, the consideration of the existence of primary lining constrains the deformation of the tunnel. For a preliminary quantitative analysis of this effect, the response ratios of the oblique reference line CF, the line HE, and the angle θ between the oblique reference line and the horizontal line are calculated by Equations (4) and (5). The detailed configuration can be found in Figure 11.
where is the displacement increment of the tunnel with primary lining, the displacement increment of the tunnel without primary lining is , is the angle increment of the tunnel with primary lining, is the angle increment of the tunnel without primary lining.
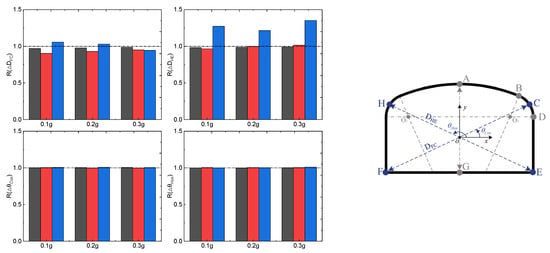
Figure 11.
The response ratios of the oblique reference line CF and the line HE, and the angle θ.
Figure 11 portrays the representative response ratio referring to the reference line of the tunnel at the time step of the maximum deformation of the tunnel. The figure shows that for most of the examined cases, the deformation of tunnel is constrained by the primary lining, while magnified in a few cases. In particular, in terms of ΔDFC, the difference is within 5% for elastic analysis, 10% for elasto-plastic analysis, and 6% for damage elasto-plastic analysis. In terms of ΔDHE, the difference is within 5% for elastic and elasto-plastic analysis, while the differences may reach 35% for damage elasto-plastic analysis. The deviations change insignificantly with the increase of ground motion. Compared with the deformation of the reference axis, the primary lining has almost no obvious effect on the rotation angle increment of the reference axis (θCox and θAox). The increase or decrease of the rotation angle of each reference axis is within 1%. The potential weak tangential behavior of the contact surface between the primary and secondary lining may cause unobvious rotation angle deviation.
3.2. Horizontal Acceleration
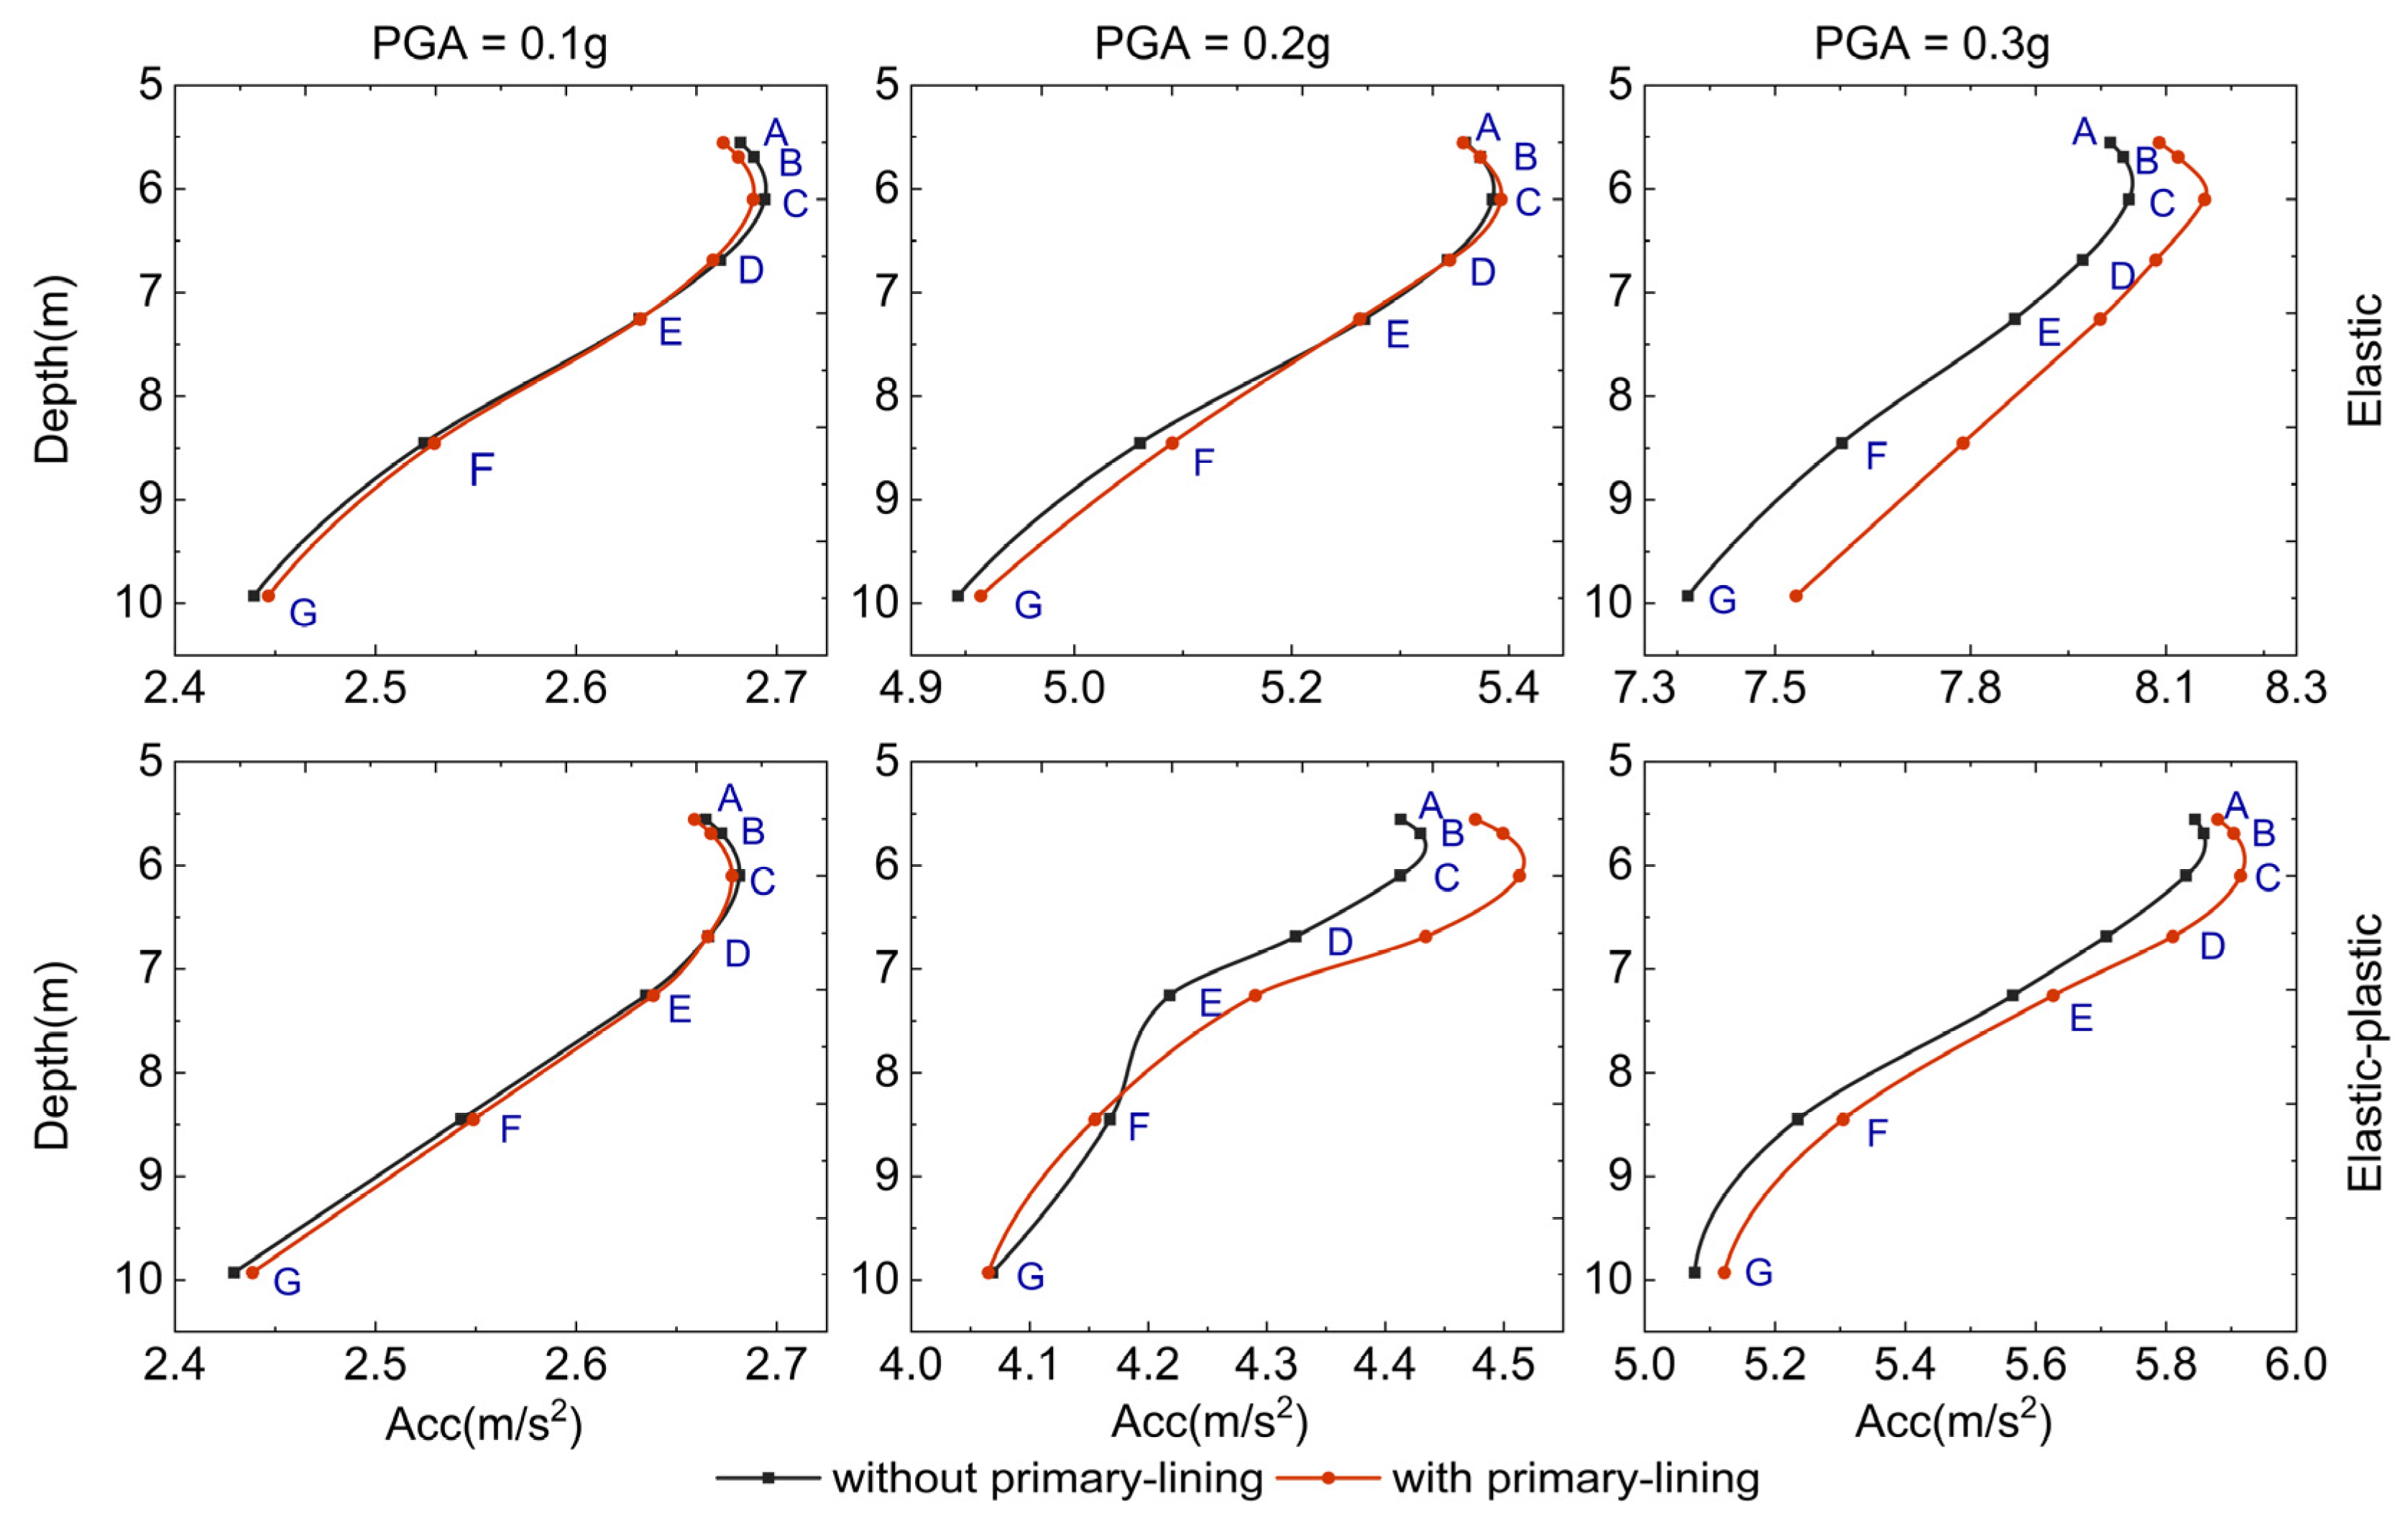
Figure 12 shows the distribution of horizontal acceleration along the vertical direction of the tunnel. The calculation results mainly refer to the elastic and elasto-plastic of the tunnel corresponding to the time step of maximum racking distortion. Elastic analysis shows that when the PGA of the seismic wave is small, the acceleration of the tunnel vault is slightly reduced by the primary lining, while the acceleration of the side wall of the tunnel is slightly amplified. The horizontal acceleration of the entire tunnel is amplified with the increase of the PGA of the input motion EQ1. For the elasto-plastic analysis, the effect of the primary lining on the horizontal acceleration of the tunnel follows a similar trend to the elastic analysis. The amplification from the primary lining on the horizontal acceleration of the tunnel computed from the elastoplastic analysis becomes smaller than the elastic analysis. This deviation comes from the yield of the soil during the earthquake.
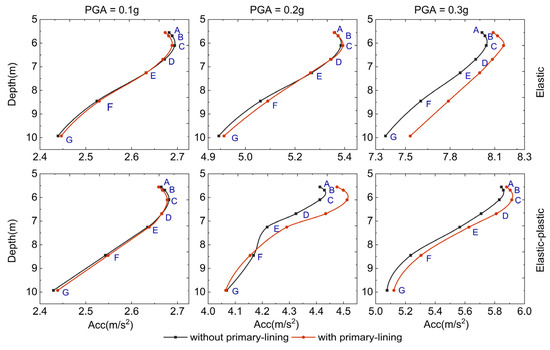
Figure 12.
Horizontal acceleration amplification along the tunnel.
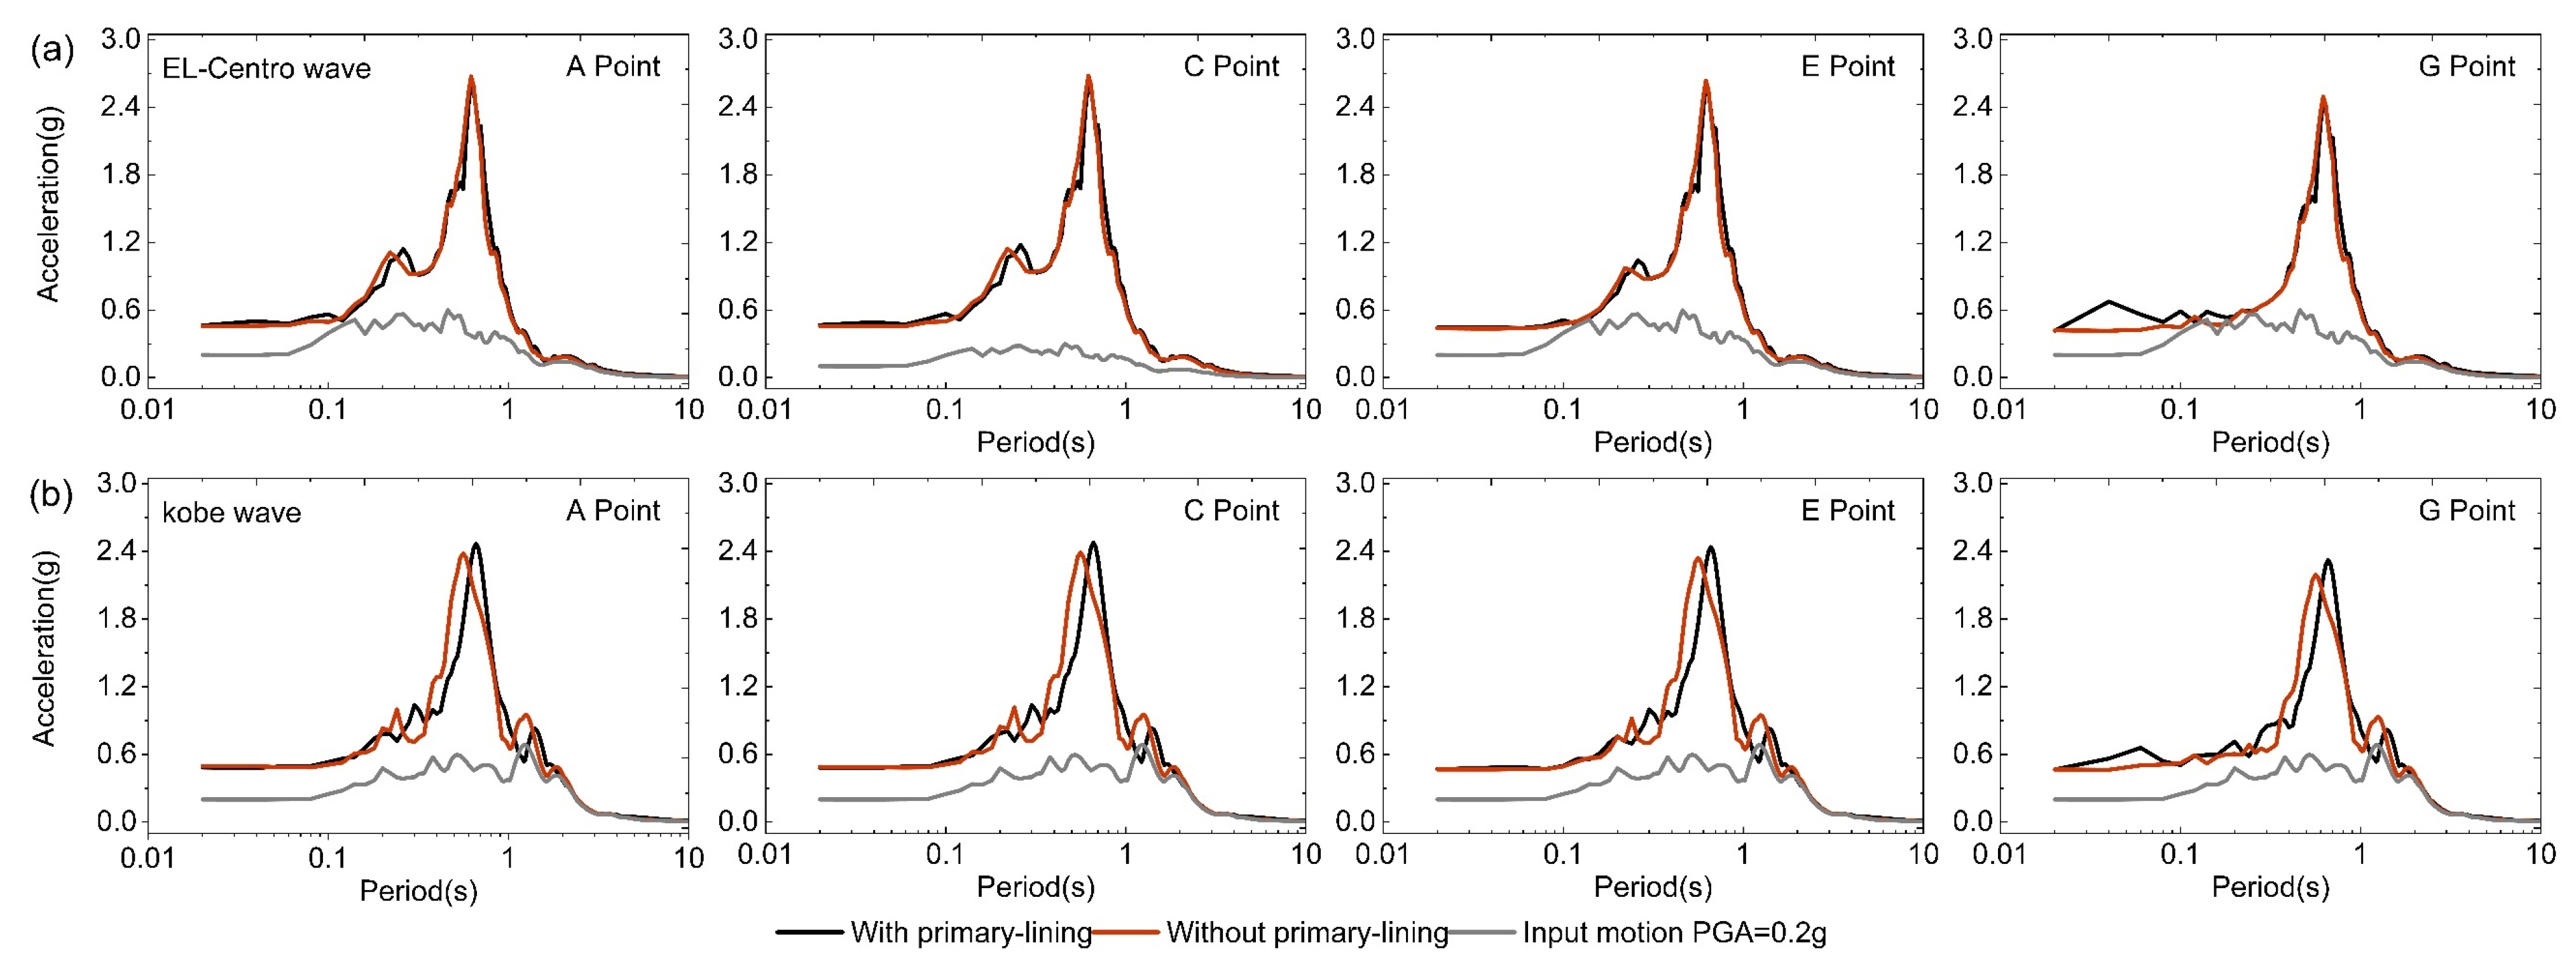
The representative values of the acceleration response spectrum at different positions of the tunnel are depicted in Figure 13. The analysis results mainly come from the elasto-plastic analysis of the soil. The calculation results refer to EQ1 and EQ2, which input motion PGA = 0.2 g. For EQ1, when the frequency is higher than 1.47 HZ, the presence of the primary lining can slightly reduce the acceleration response of the tunnel. When the frequency is lower than 1.47 HZ, the primary lining can amplify the horizontal acceleration of the tunnel. For EQ2, there are similar conclusions, and the difference is that the frequency is 1.61 HZ. Generally speaking, the influence of the primary lining on the acceleration response of the tunnel becomes insignificant as the input PGA increases.
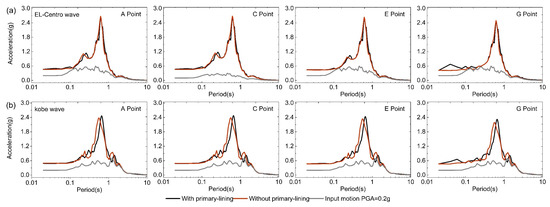
Figure 13.
Acceleration response spectra at the important section of tunnel.
3.3. Dynamic Internal Forces
The internal force of the tunnel section during the earthquake is the main parameter of its seismic design. In order to further clarify the influence of the primary lining on the seismic response of the tunnel, this section will discuss the seismic response of the axial force and bending moment of the tunnel. The typical values of the time history of the internal force of the tunnel section and the distribution of the internal force along the periphery of the tunnel are presented, mainly including the envelope value (maximum positive or negative maximum in time history) and the simultaneous value. The simultaneous value of internal force distribution mainly refers to the calculation result at the maximum shear deformation. The sign convention for the internal force is given in Figure 14a. Finally, the effect of the primary lining on the dynamic response of the tunnel is quantitatively analyzed by calculating the ratio of the internal force of the tunnel with and without the primary lining.

Figure 14.
(a) sign convention of internal forces (b) time histories monitoring positions of the tunnel (c) the angle of the tunnel position relative to the center of the tunnel.
3.3.1. Bending Moment
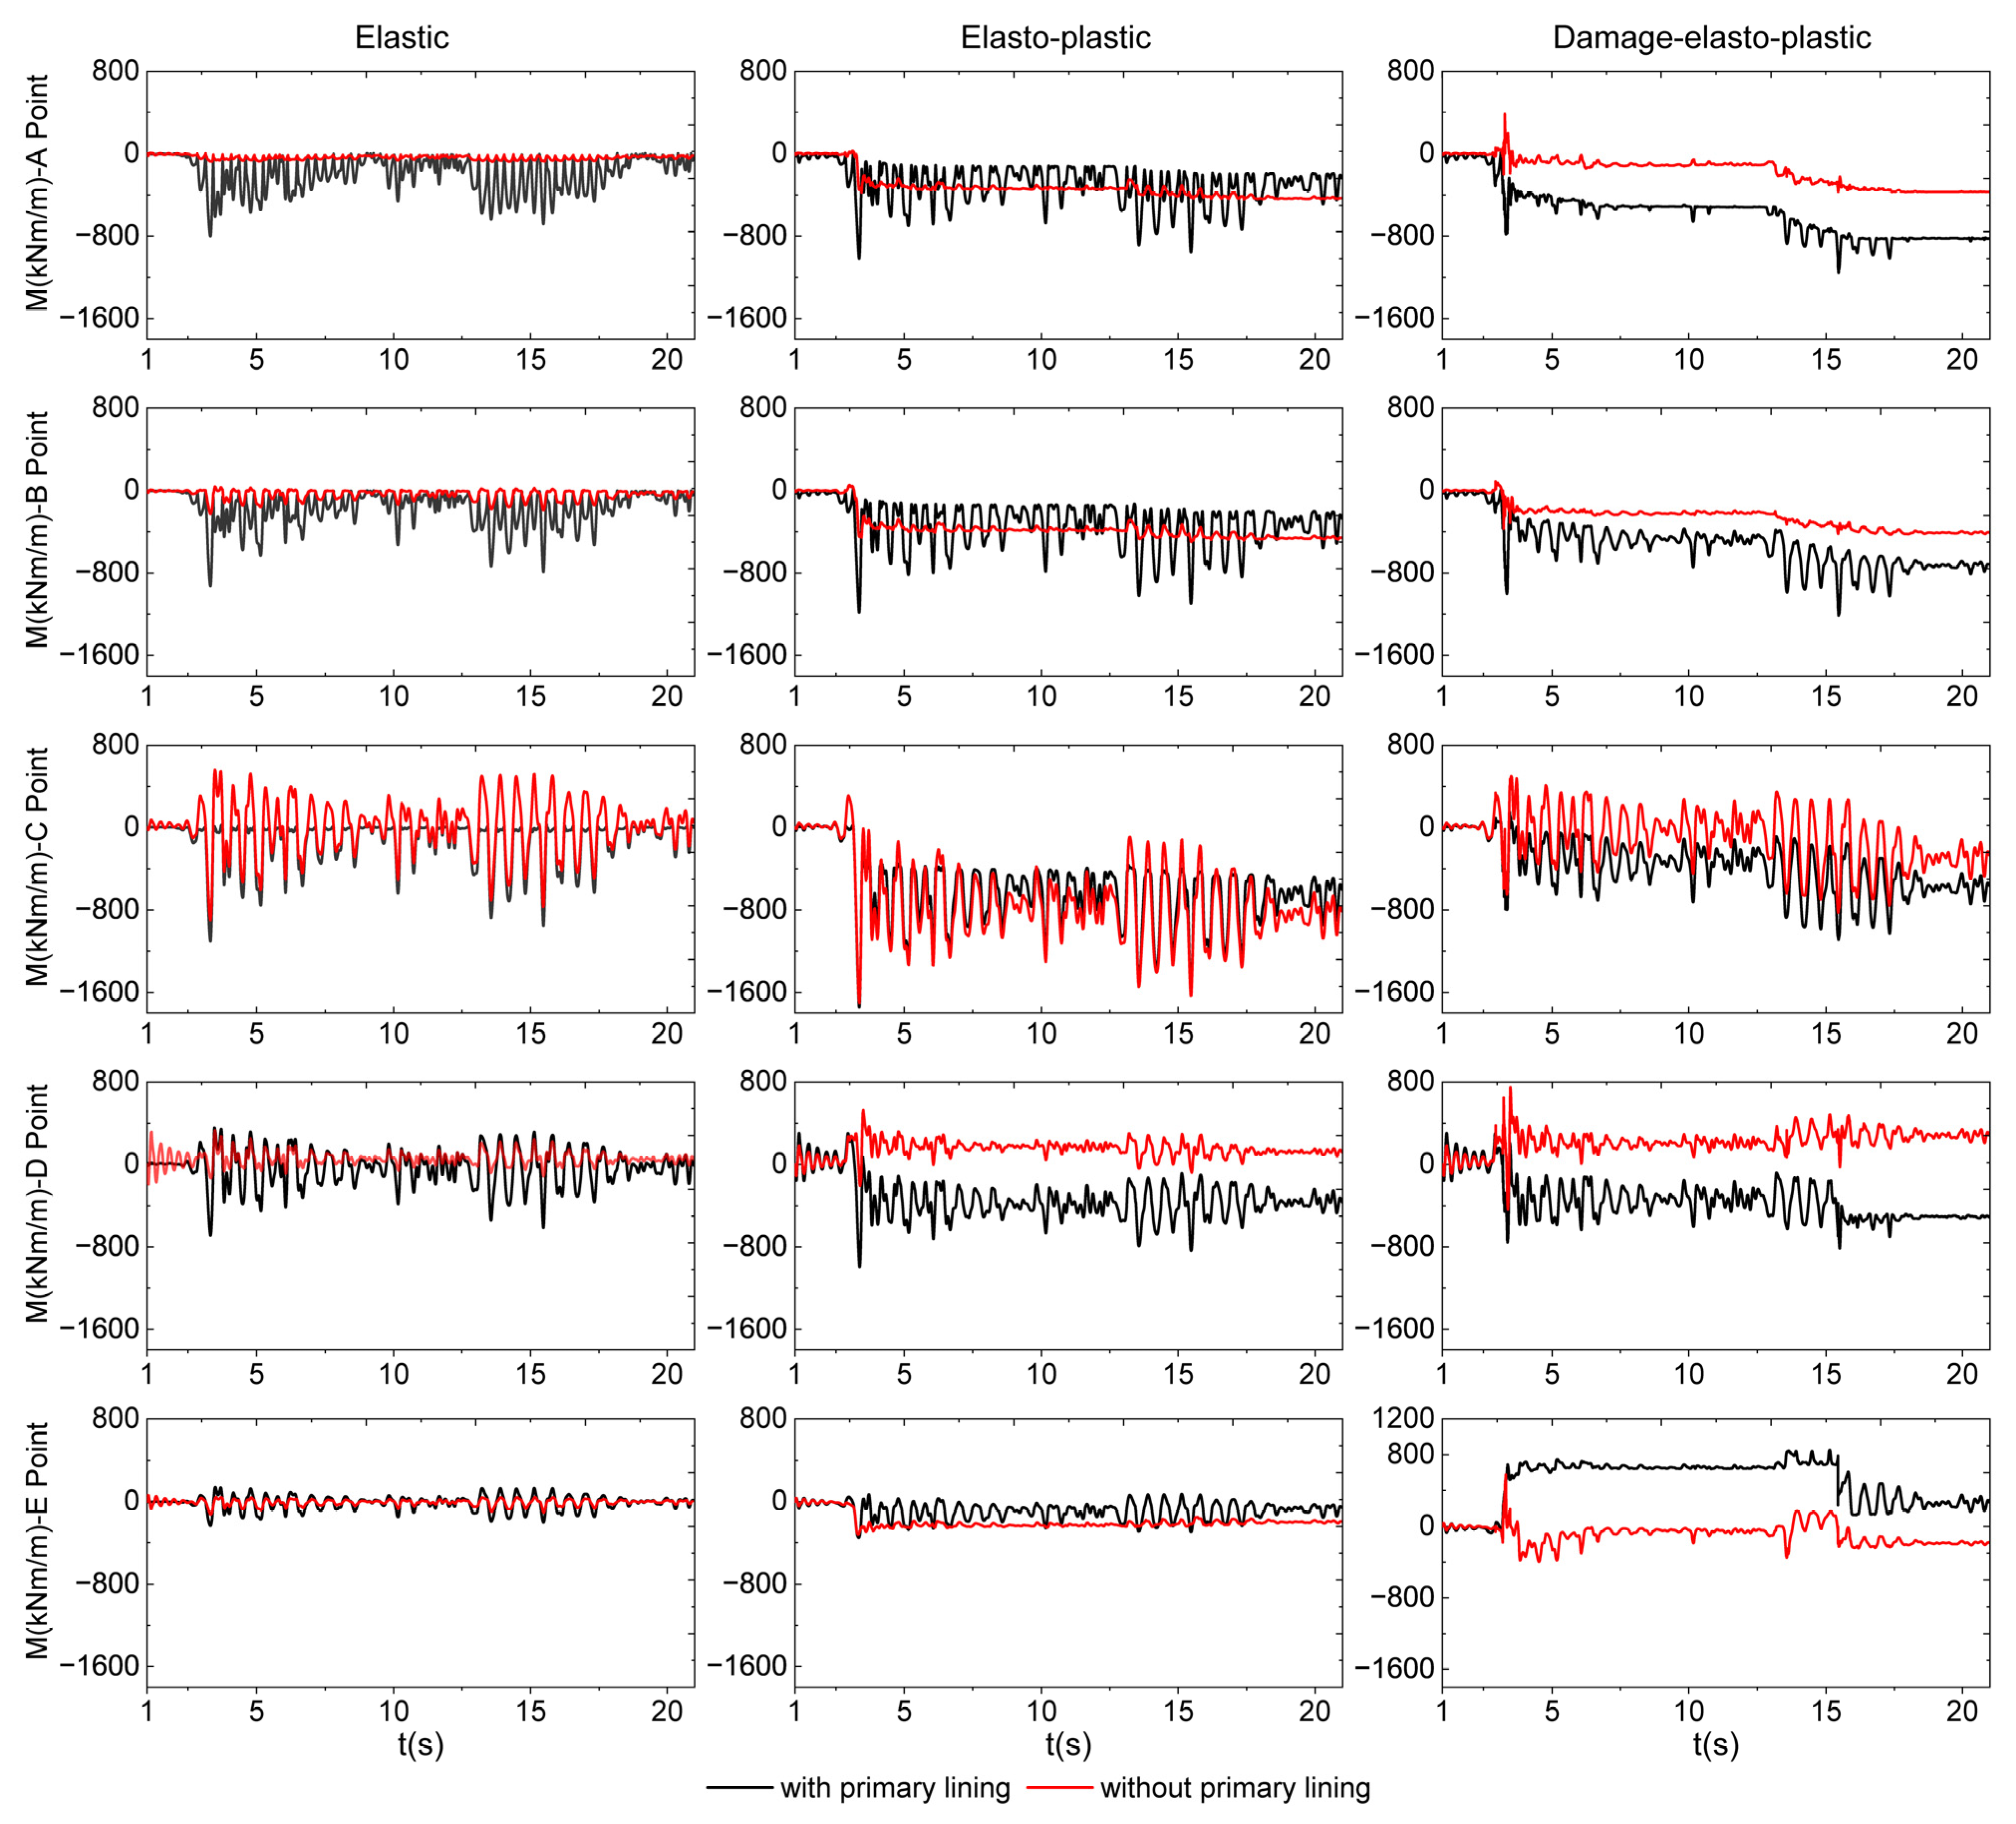
Figure 15 summarizes the time histories of the dynamic bending moment increment at the crucial positions of the tunnel (A, B, C, D, E in Figure 14b). The dynamic bending moment increment, computed for the input motion EQ1 with PGA scaled to 0.2 g, refers to the elastic, elasto-plastic, and damage elasto-plastic analysis of the tunnel. The figure shows that for the three analysis cases, although the primary lining increases the dynamic bending moment of the tunnel at the A, B, D, and E positions, it reduces the dynamic bending moment of the tunnel at the C position.
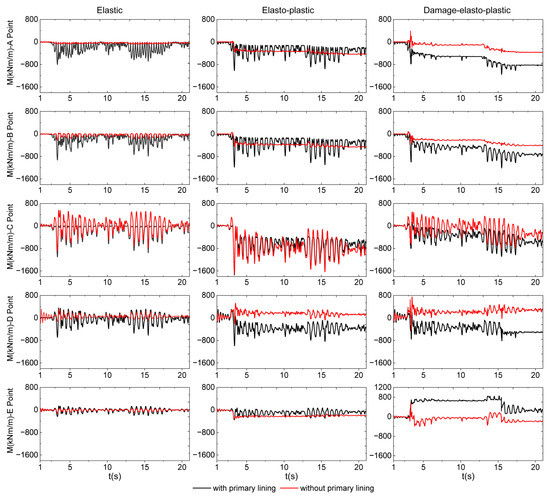
Figure 15.
Dynamic bending moment time histories at the crucial section of tunnel (A/B/C/D/E) computed for EQ1. First column: elastic analysis result. Second column: elasto-plastic analysis result. Third column: damage plastic analysis result.
For the elasto-plastic analysis, the dynamic bending moment can also be divided into three phases, namely the transient phase, the steady-state phase, and the post-earthquake phase (or residual static stage), which is consistent with the phenomenon observed by several researchers [16,17,49,50] in the study of circular and rectangular tunnels. The residual bending moment after the earthquake is observed in the tunnel, which may be caused by yielding of the plastic soil. In addition to the soil yield, the potential nonlinear behavior of the contact interfaces between the primary and secondary lining may also cause the above phenomenon. The primary lining reduces the residual bending moment of the tunnel, without the C position, at the residual static stage.
For the damage plastic analysis, the dynamic bending moment can be divided into five phases: the transient phase-I, the steady-state phase-I, the transient phase-II, the steady-state phase-II, and the post-earthquake phase (or residual static stage). This phenomenon is mainly attributed to the redistribution of stress caused by the soil yield and the tunnel plastic deformation during the earthquake. The existence of primary lining leads to an increase of the residual bending moment of tunnel at the residual static stage, which is more evident for positions A/B/C/E.
It is worth noting that in the steady-state stage of the bending moment, the bending moment at the roof of the tunnel (A/B) oscillates in one direction based on a particular value, and the span (C), side walls (D), and bottom plate (E) vibration based on the average value. In particular, this residual bending moment after the earthquake is more evident when considering the plastic deformation of the primary lining and tunnel damage (CDP).
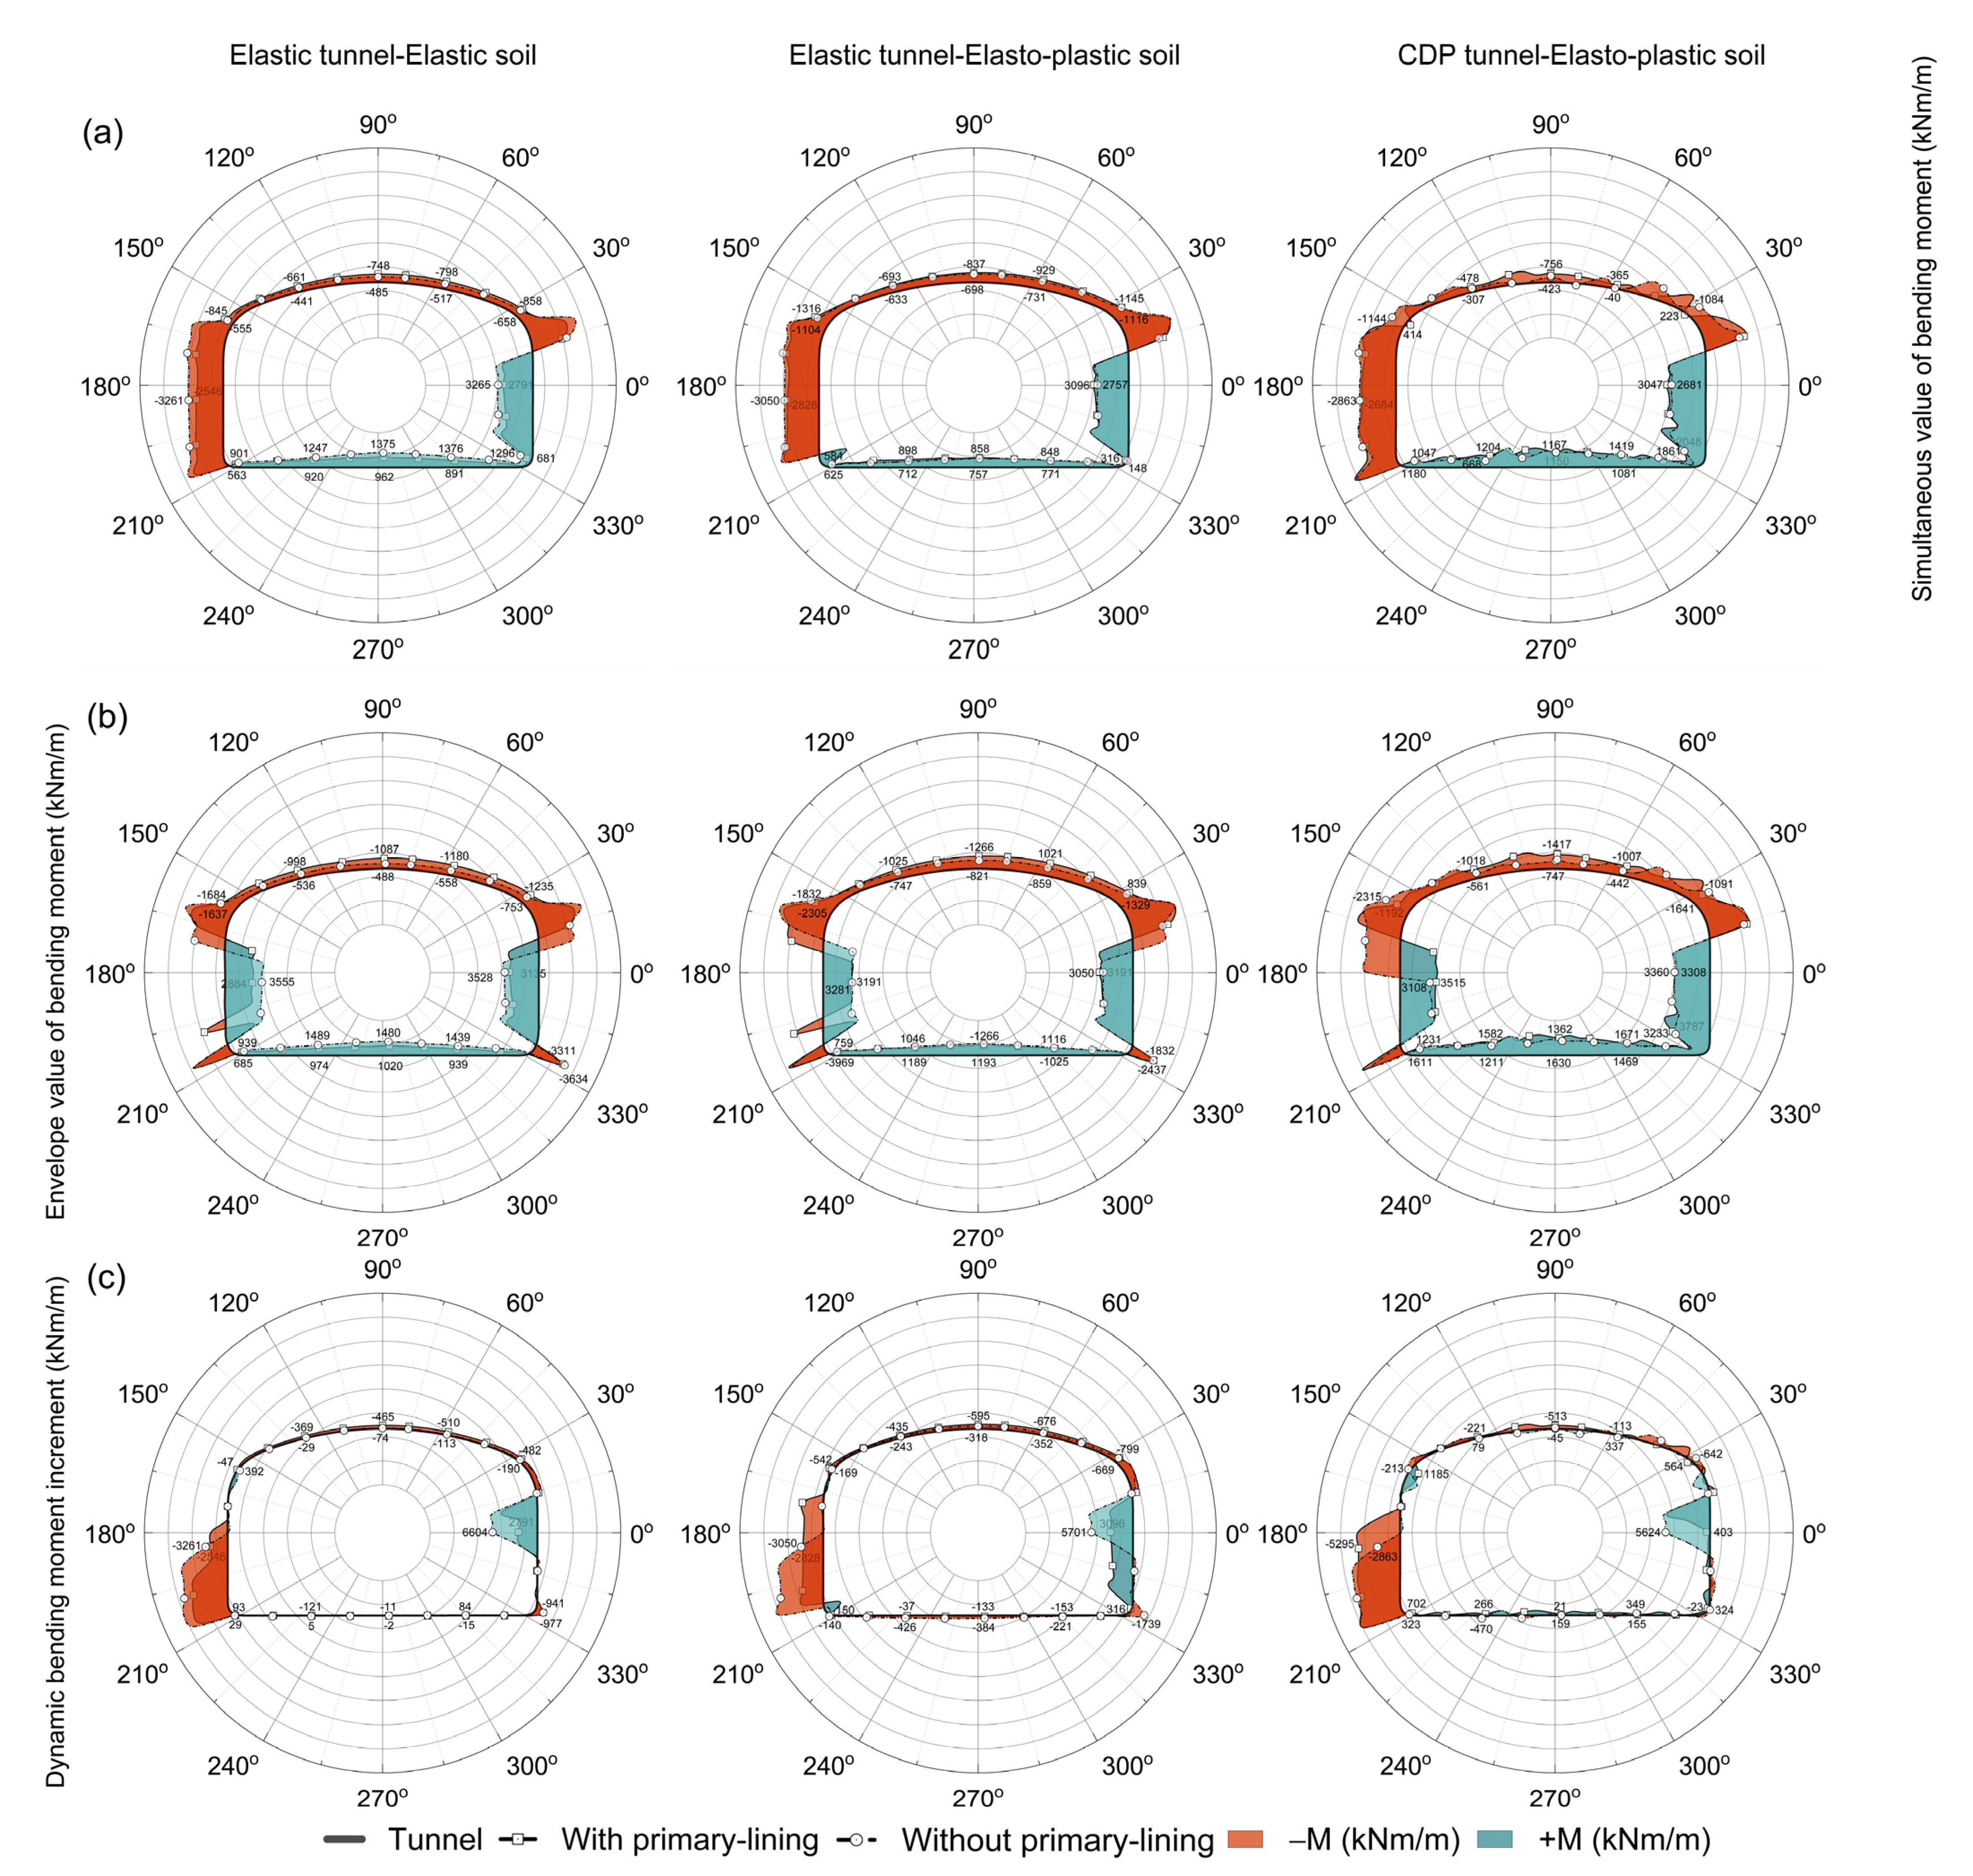
Figure 16 portrays a representative distribution of bending moments calculated along the perimeter of the tunnel, corresponding to EQ1, whose PGA is scaled to 0.2 g. This distribution includes the simultaneous value, the envelope value (the maximum value of the absolute value of the bending moment in the time history), and the dynamic bending moment increment of the maximum positive (+X) shear deformation. Figure 16a illustrates the simultaneous value of the bending moment along the perimeter of tunnel, which is computed for the elastic, elasto-plastic, and damage elasto-plastic analysis of the tunnel. The bending moment distribution is antisymmetric along the tunnel periphery, and the bending moment at the tunnel shoulder and side wall is larger than the roof and bottom slabs. The observed antisymmetric distribution of the bending moment indicates that, with approximately 22.5° counterclockwise as the dividing line, half of the tunnel section is in tension, while the other half is in compression. For the elastic analysis, the primary lining causes the bending moment on the side wall and bottom of the tunnel to decrease, but the bending moment increases on the roof slab. In the elasto-plastic analysis, the influence of the primary lining on the distribution of the simultaneous value of the bending moment of the tunnel is related to the direction of motion of the ground. Specifically, when the ground is deformed or moved in the positive direction (+X), the primary lining causes the bending moment to decrease on the left side wall. The bending moment on the right-side wall increases, but the primary lining causes the bending moment to increase for the roof slab and the left bottom slab. The influence of the primary lining on the bending moment of the tunnel weakens as the soil yields. When considering the damage and plastic deformation of the tunnel under the dynamic load, the influence of the primary lining on the bending moment distribution of the tunnel roof and the bottom is more complicated.
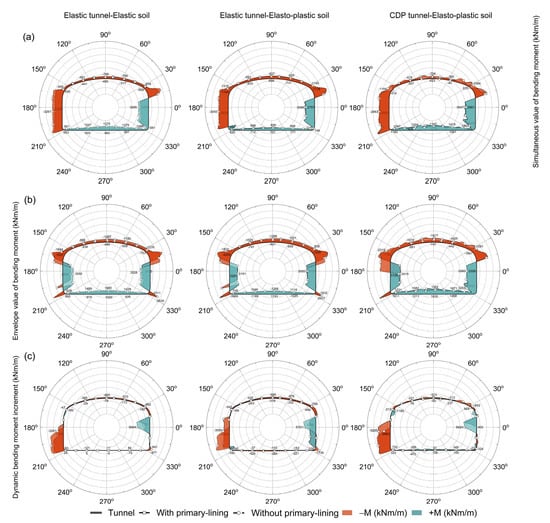
Figure 16.
Bending moment distributions computed along the perimeter of the tunnel for EQ1: (a) simultaneous value of bending moment, (b) envelope value of bending moment, (c) dynamic bending moment increment of the maximum positive (+X) shear deformation.
Figure 16b portrays the envelope value of the bending moment along the tunnel’s perimeter. The results indicate that the bending moment envelope values are distributed symmetrically along the tunnel periphery. The bending moment at the corner of the side wall undergoes abrupt changes. Elastic analysis shows that the primary lining causes the zero point of the bending moment of the side wall to drift upward. The elasto-plastic analysis shows that the offset direction of the zero point of the side wall bending moment caused by the primary lining is the opposite. The plastic damage of the tunnel and the primary lining during shaking is found to cause the zero point of the bending moment on the left side of the tunnel to shift downward. This may be caused by the plastic deformation of both the soil and the tunnel when the maximum shear deformation of tunnel occurs in the negative direction (−X).
Figure 16c portrays the dynamic bending moment increment along the tunnel’s perimeter. For ground shaking towards the right, the dynamic bending moment increment distribution is mainly concentrated on the lower part of the left wall and the upper part of the right wall.
For elastic analysis, the existence of primary lining results in a reduction of dynamic bending moment increment of the side wall and bottom slab, while it increases for the roof slab. A similar phenomenon is observed in the elasto-plastic analysis. The difference is the uniformity of the dynamic bending moment distribution of the side wall, compared with the elastic analysis. The consideration of the plastic damage of the tunnel and the primary lining during shaking causes the distribution of dynamic bending moment of the roof and bottom slab to be more complicated. The distribution of dynamic bending moment also verifies the tunnel’s racking deformation.
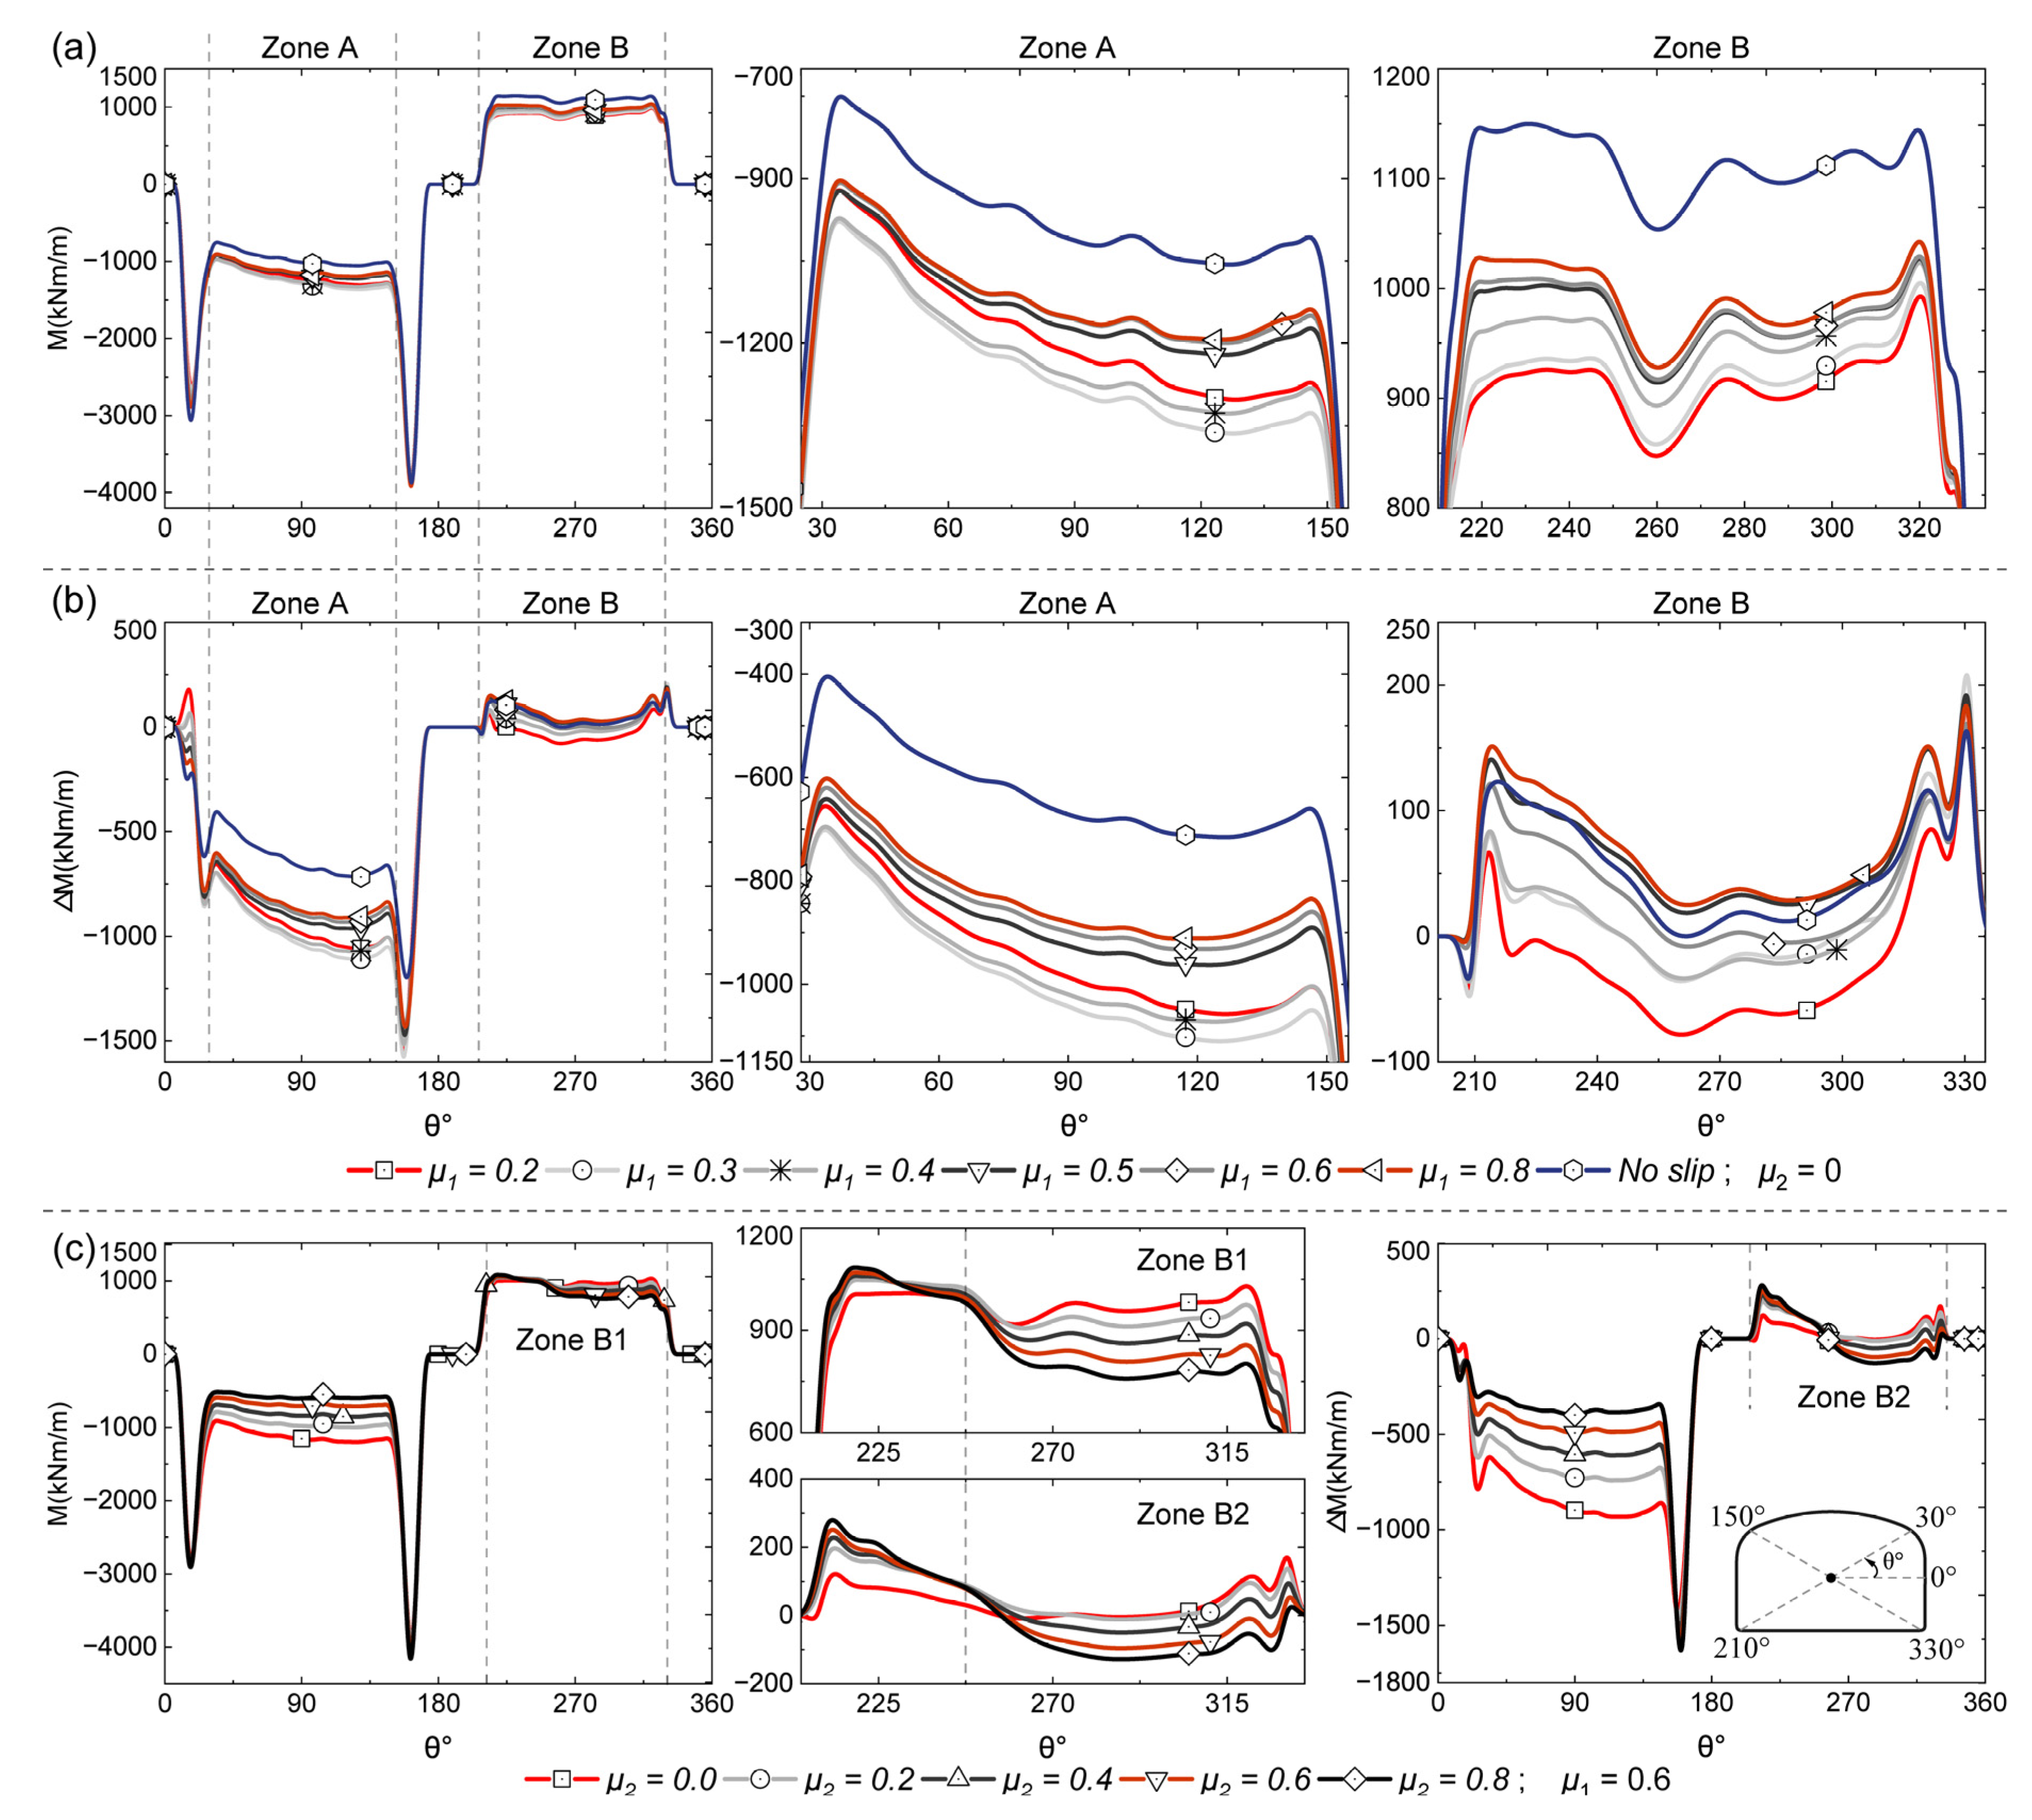
Figure 17 shows the effects of soil–primary lining interface conditions and primary–secondary lining interface conditions on the distribution of tunnel dynamic bending moments. These distributions are calculated at the time step of maximum shear deformation of the tunnel elasto-plastic analysis under EQ2 with PGA = 0.3 g (i.e., the ground is deformed or moved in the negative direction (−X)). For full-slip primary–secondary lining interface conditions, Figure 17a shows that the increase of the soil–primary lining interface friction causes the dynamic bending moment of the tunnel vaults to first increase (i.e., μ1 increases from 0.2 to 0.4) and then decrease (i.e., μ1 increases from 0.4 to 0.8), while leading the dynamic bending moment of the tunnel bottom to increase. The non-slip soil–primary lining interface conditions lead to lower bending moments at the top and higher bending moments at the bottom of the tunnel. A similar comparison was made for the dynamic bending moment increments for the tunnel. The dynamic bending moment increment at the top has the same trend as the dynamic bending moment, while the dynamic bending moment at the bottom of the tunnel has a more complex variation trend with the soil-primary lining interface friction. For the sliding soil–primary lining interface condition (μ1 = 0.6), Figure 17c shows that the increase (i.e., μ2 increases from 0.4 to 0.8) in the friction at the primary lining–secondary lining interface leads to a decrease in the total and dynamic bending moments at the top of the tunnel.
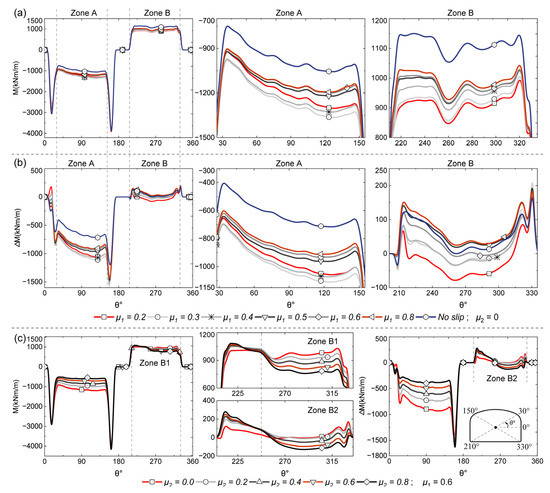
Figure 17.
Effect of interface characteristics on bending moment (a) tunnels without and with primary lining (b) tunnels with primary lining; μ1 = 0.2, 0.4, 0.6, 0.8 and no-slip; μ2 = 0 (c) tunnels with primary lining; μ1 = 0.6; μ2 = 0.2, 0.4, 0.6, 0.8.
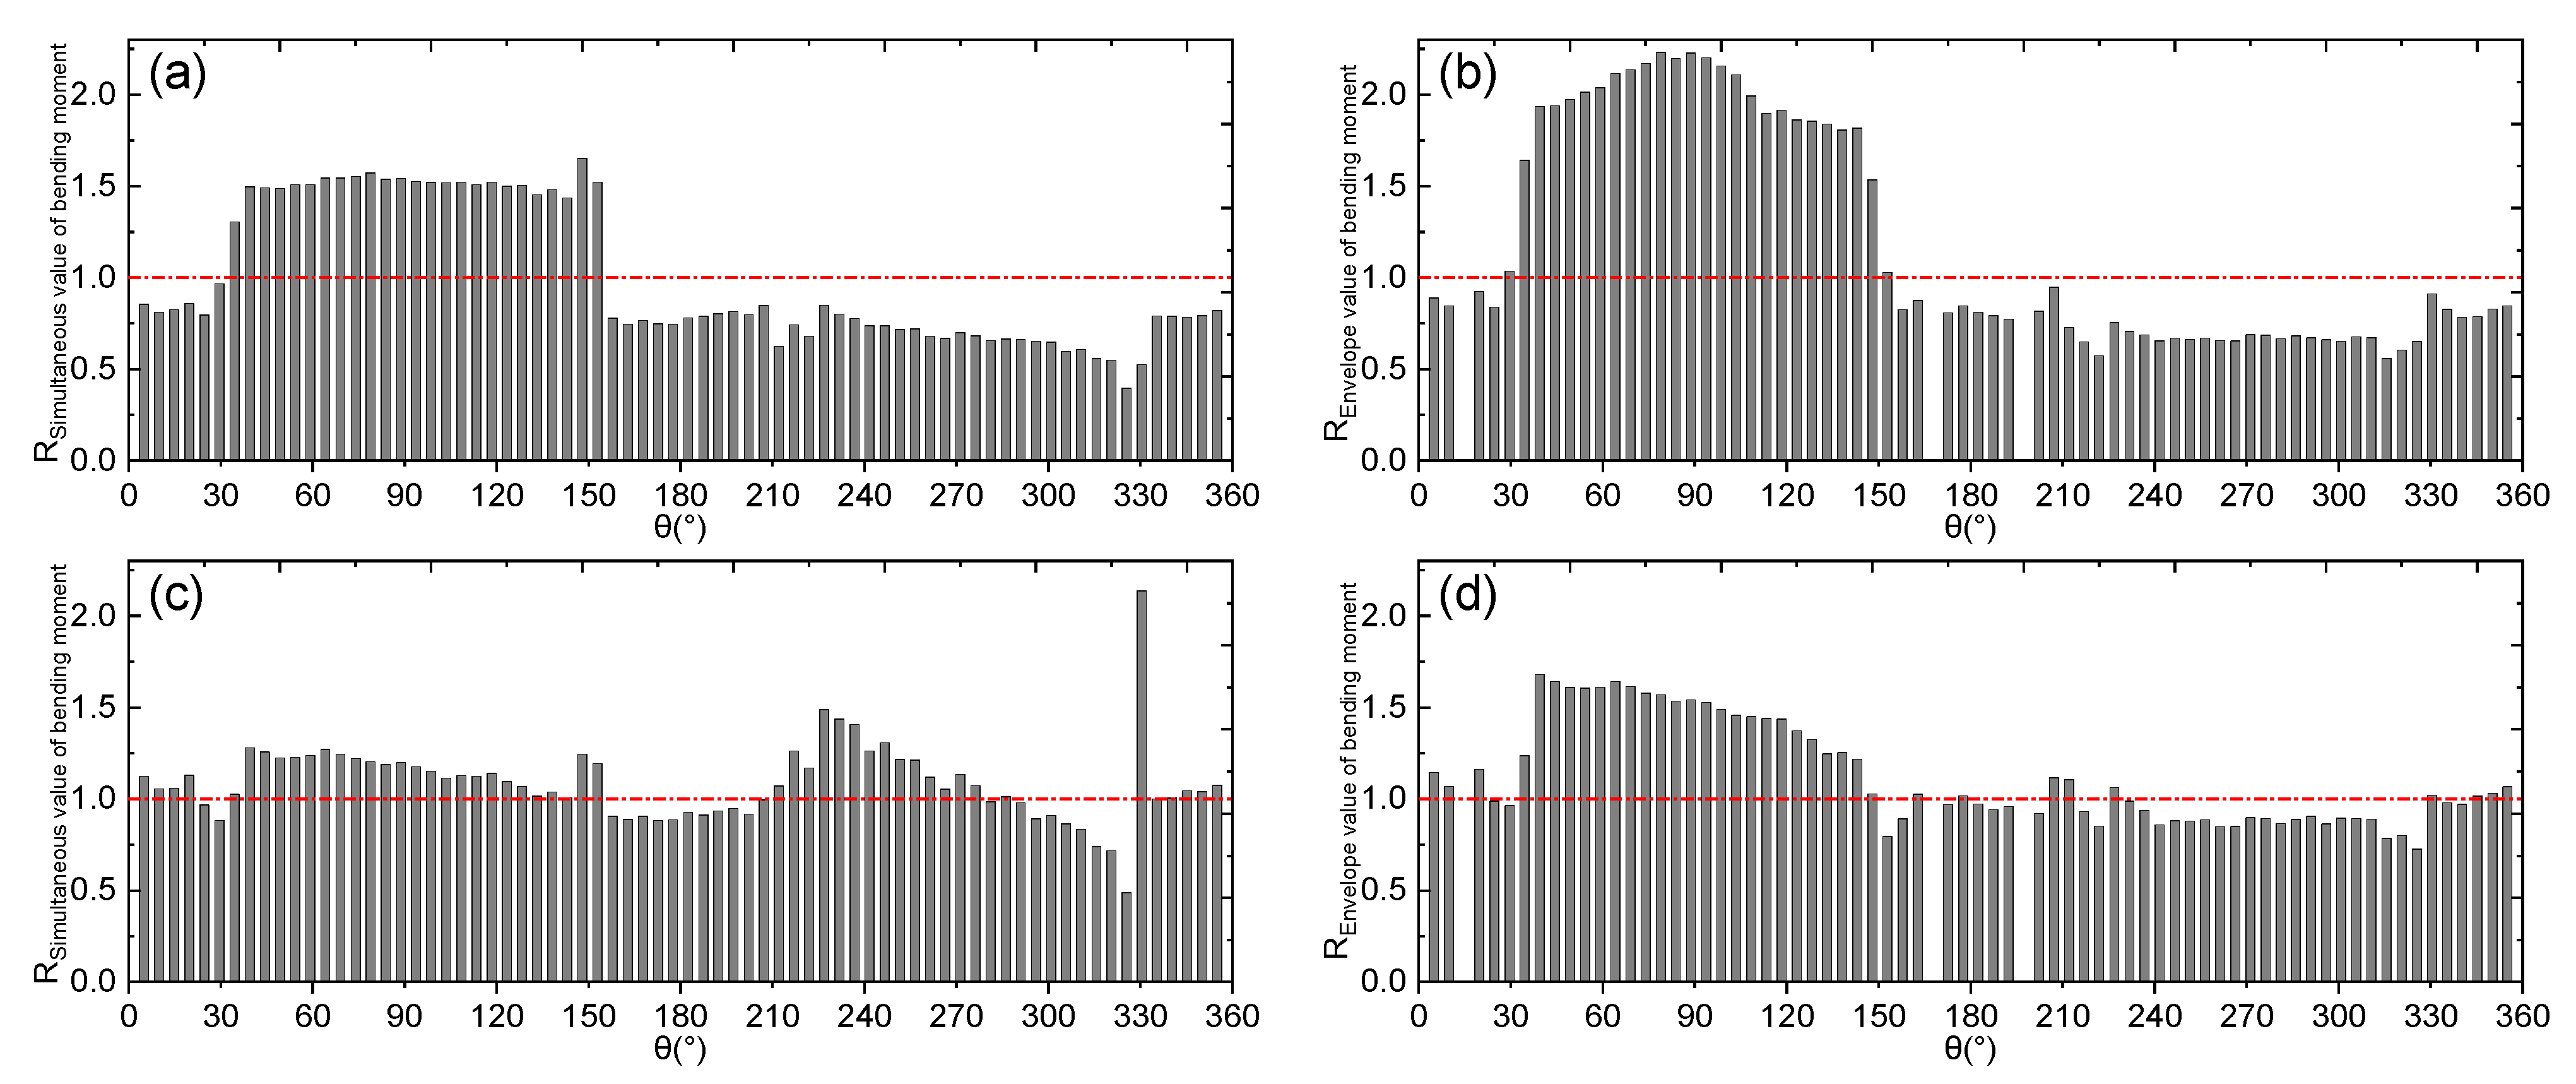
In most cases, the presence of the primary lining causes the bending moments of different parts of the tunnel to increase or decrease. In order to quantitatively analyze the magnitude of this increase or decrease, the bending moment response ratios under different conditions are calculated by Equation (6). The detailed configuration can be found in Figure 14c.
where is the bending moment of tunnel with primary lining and the bending moment of tunnel without primary lining is .
Figure 18 illustrates the response ratio of the tunnel bending moment, including the simultaneous and envelope values. The results mainly refer to the elastic, elasto-plastic, and damage elasto-plastic analysis of the tunnel, in which the PGA of the seismic wave is scaled to 0.2 g. Figure 18a,b illustrates the tunnel bending moment response ratio during the elastic analysis. The results show that in the elastic analysis, the primary lining makes the simultaneous value of the bending moment of the tunnel roof (23.5~157°) increase by 51% on average. At the same time, the bending moment in other parts of the tunnel is reduced by 14~46%, by 27% on average. The primary lining results in increase of the envelope value of the tunnel roof (23.2~157°) by 91% on average and reduction at other locations of the tunnel with an average of 25.4%. Figure 19c,d demonstrates the bending moment response ratio in the elasto-plastic analysis. The primary lining causes the simultaneous value of the tunnel roof (27.8~157°), the left bottom slab (210~283°), and the right wall (0~14.2°; 341~360°) to increase by 3~50%, while other locations of the tunnel decrease by 2~51%. The primary lining increases the envelope value of the tunnel roof (27.7~152°) and the right wall (0~15°; 345~360°) by 22~67%. The primary lining reduces the bending moment envelope value of other tunnel positions by about 11%. Figure 19e,f lists the tunnel bending moment response ratio during the damage elasto-plastic analysis. The simultaneous value of the bending moment can be enlarged by 31.6% on average for the position where the primary lining amplifies, while it is reduced by 20% on average for the position where the primary lining diminishes. The envelope value of the bending moment can be enlarged by 31% on average for the position where the primary lining amplifies, while reducing by 15% on average for the position where the primary lining diminishes.
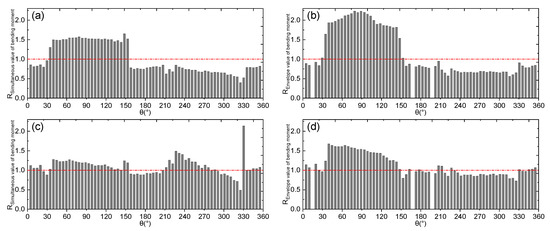

Figure 18.
Dynamic response ratio of the bending moment. First row (a,b): elastic analysis result. Second row (c,d): elasto-plastic analysis result. Third row (e,f): damage plastic analysis result.
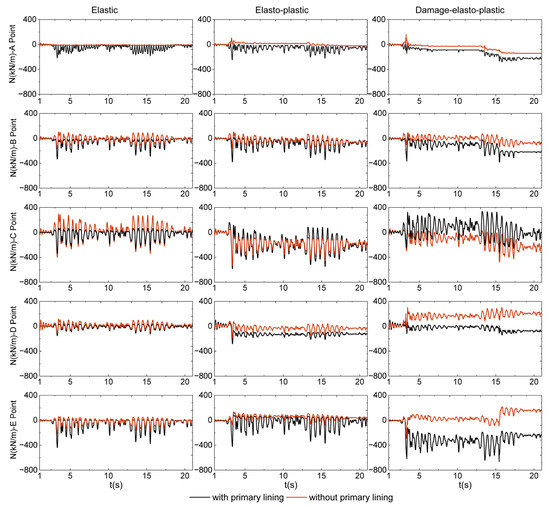
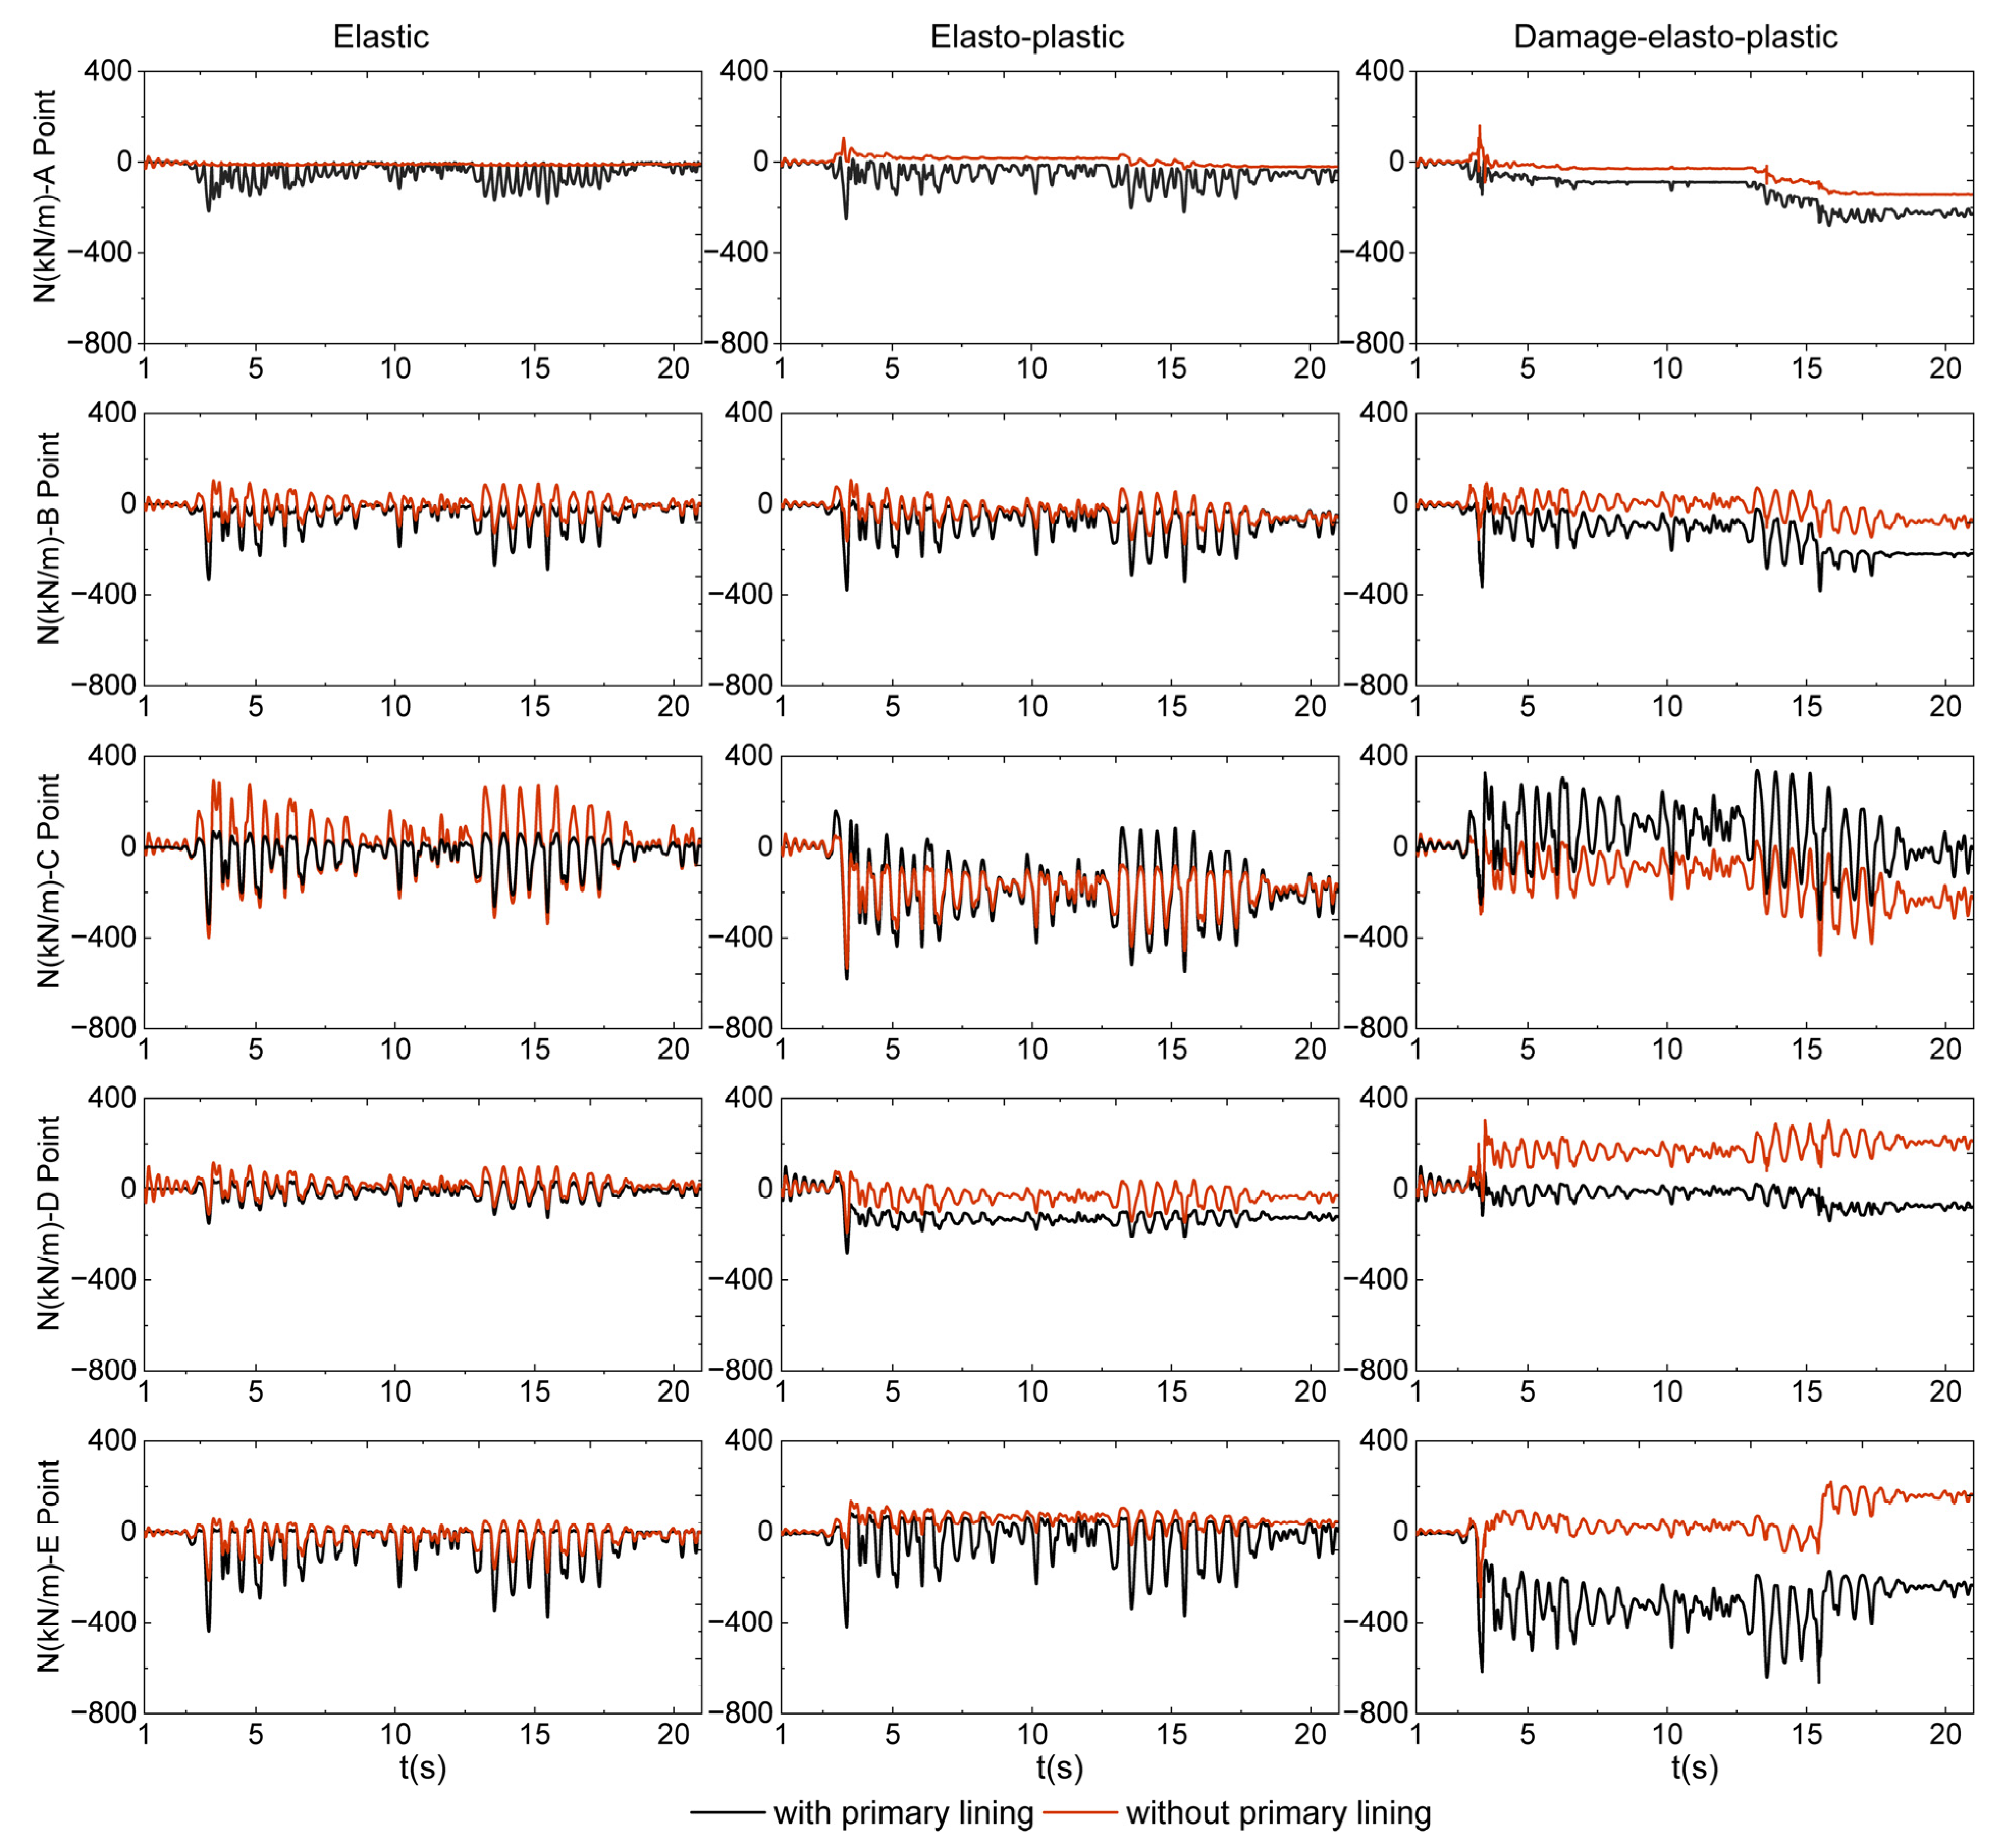
Figure 19.
Dynamic axial force time histories at crucial sections of tunnel (A/B/C/D/E) computed for EQ1. First column: elastic analysis result. Second column: elasto-plastic analysis result. Third column: damage plastic analysis result.
3.3.2. Axial Force
Figure 19 portrays the time histories of the dynamic axial force increment at the crucial positions of the tunnel (i.e., A, B, C, D, E in Figure 14b). The results refer to the elastic, elasto-plastic, and damage elasto-plastic analysis of the tunnel. The input motion is an EL wave, and its peak value is scaled to PGA = 0.2g. The figure shows that for the three analysis cases, the time history change of the dynamic axial force is consistent with the dynamic bending moment.
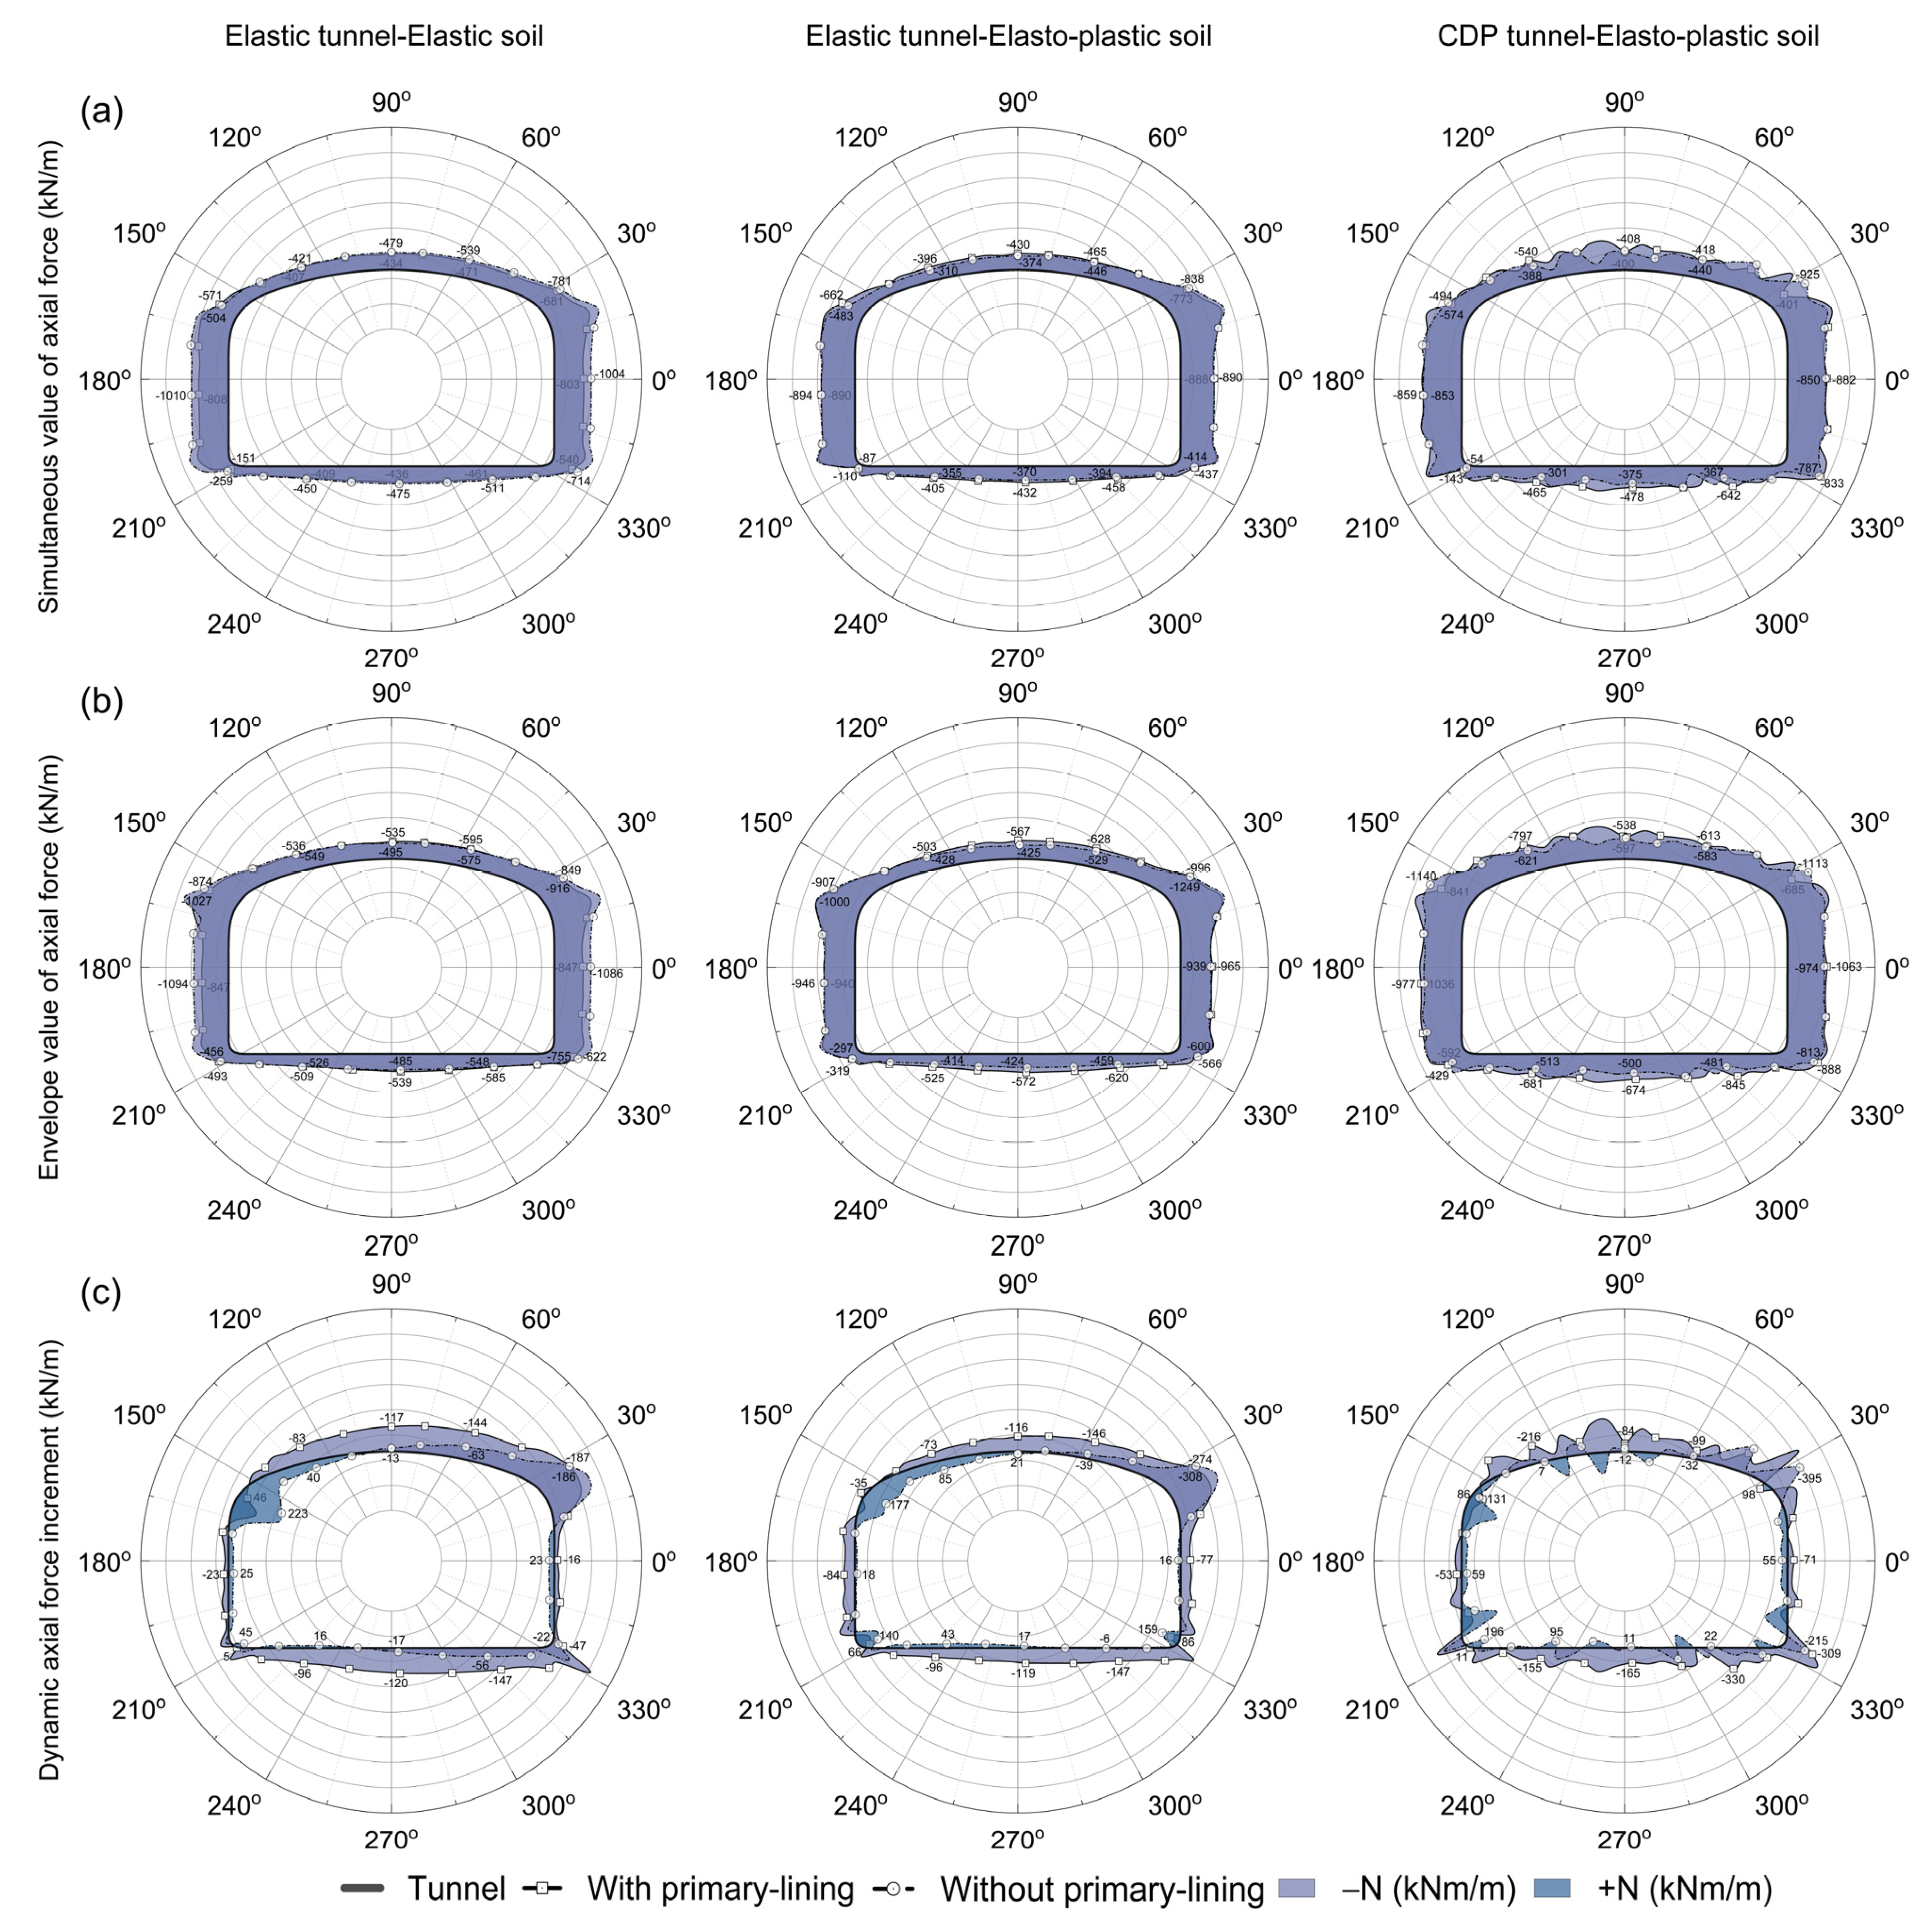
Figure 20 portrays a representative distribution of axial force calculated along the tunnel’s perimeter, corresponding to EQ1, whose PGA is scaled to 0.2 g. This distribution includes the simultaneous value, the envelope value (the maximum value of the absolute value of the axial force in the time history), and the dynamic axial force increment of the maximum positive (+X) shear deformation. Figure 20a illustrates the simultaneous value of the axial force along the tunnel’s perimeter, computed for the elastic, elasto-plastic, and damage elasto-plastic analysis of the tunnel. The axial force distribution is symmetric along the periphery of the tunnel, and the axial force at the tunnel shoulder and side wall is larger than the roof and bottom slab. For the elastic analysis, the primary lining causes the axial force on the side wall and bottom of the tunnel to decrease, but the axial force increases on the roof slab. In the elastoplastic analysis, the influence of the primary lining on the distribution of the simultaneous value of the axial force of the tunnel is related to the direction of soil motion. Specifically, when the soil layer is deformed in the positive direction (+X), the primary lining causes the axial force to decrease on the left side wall, and the axial force on the right side wall increases. However, for the roof slab bending moment and the bottom slab, the primary lining causes the axial force to decrease. The influence of the primary lining on the axial force of the tunnel weakens as the soil yields. When considering the damage and plastic deformation of the tunnel under the dynamic load, the influence of the primary lining on the axial force distribution of the tunnel roof and bottom is more complicated.
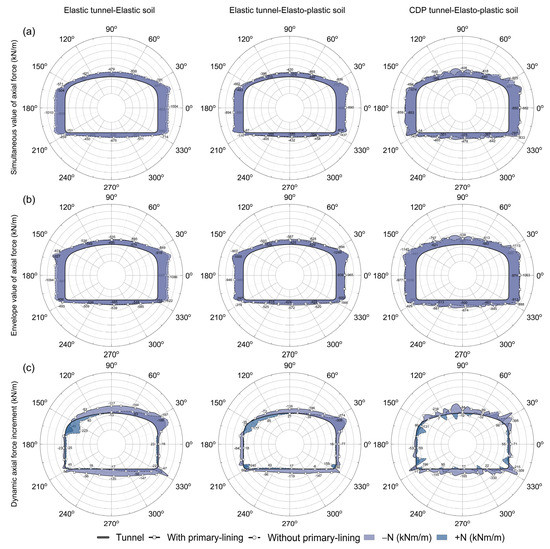
Figure 20.
Axial force distributions computed along the perimeter of the tunnel for EQ1: (a) simultaneous value of axial force, (b) envelope value of axial force, (c) dynamic axial force increment of the maximum positive (+X) shear deformation.
Figure 20b portrays the axial force’s envelope value along the tunnel’s perimeter. The results indicate that the axial force envelope values are distributed symmetrically along the tunnel periphery. For both the elastic and elasto-plastic analysis, the axial force envelope values follow a similar trend with simultaneous values. The consideration of the plastic damage of the tunnel and the primary lining during the shaking made the distribution of axial force more complicated. Figure 20c portrays the dynamic axial force increment along the perimeter of tunnel. For ground shaking towards the right, the dynamic axial force increment distribution is mainly concentrated on the roof and bottom slab. For elastic analysis, the existence of primary lining results in increases of dynamic axial force increment of the roof and bottom slab. Compared with the elastic analysis, a similar phenomenon is observed in the elasto-plastic analysis. The consideration of the plastic damage of the tunnel and the primary lining during shaking is found to cause the dynamic axial force distribution of the tunnel to be more complicated.
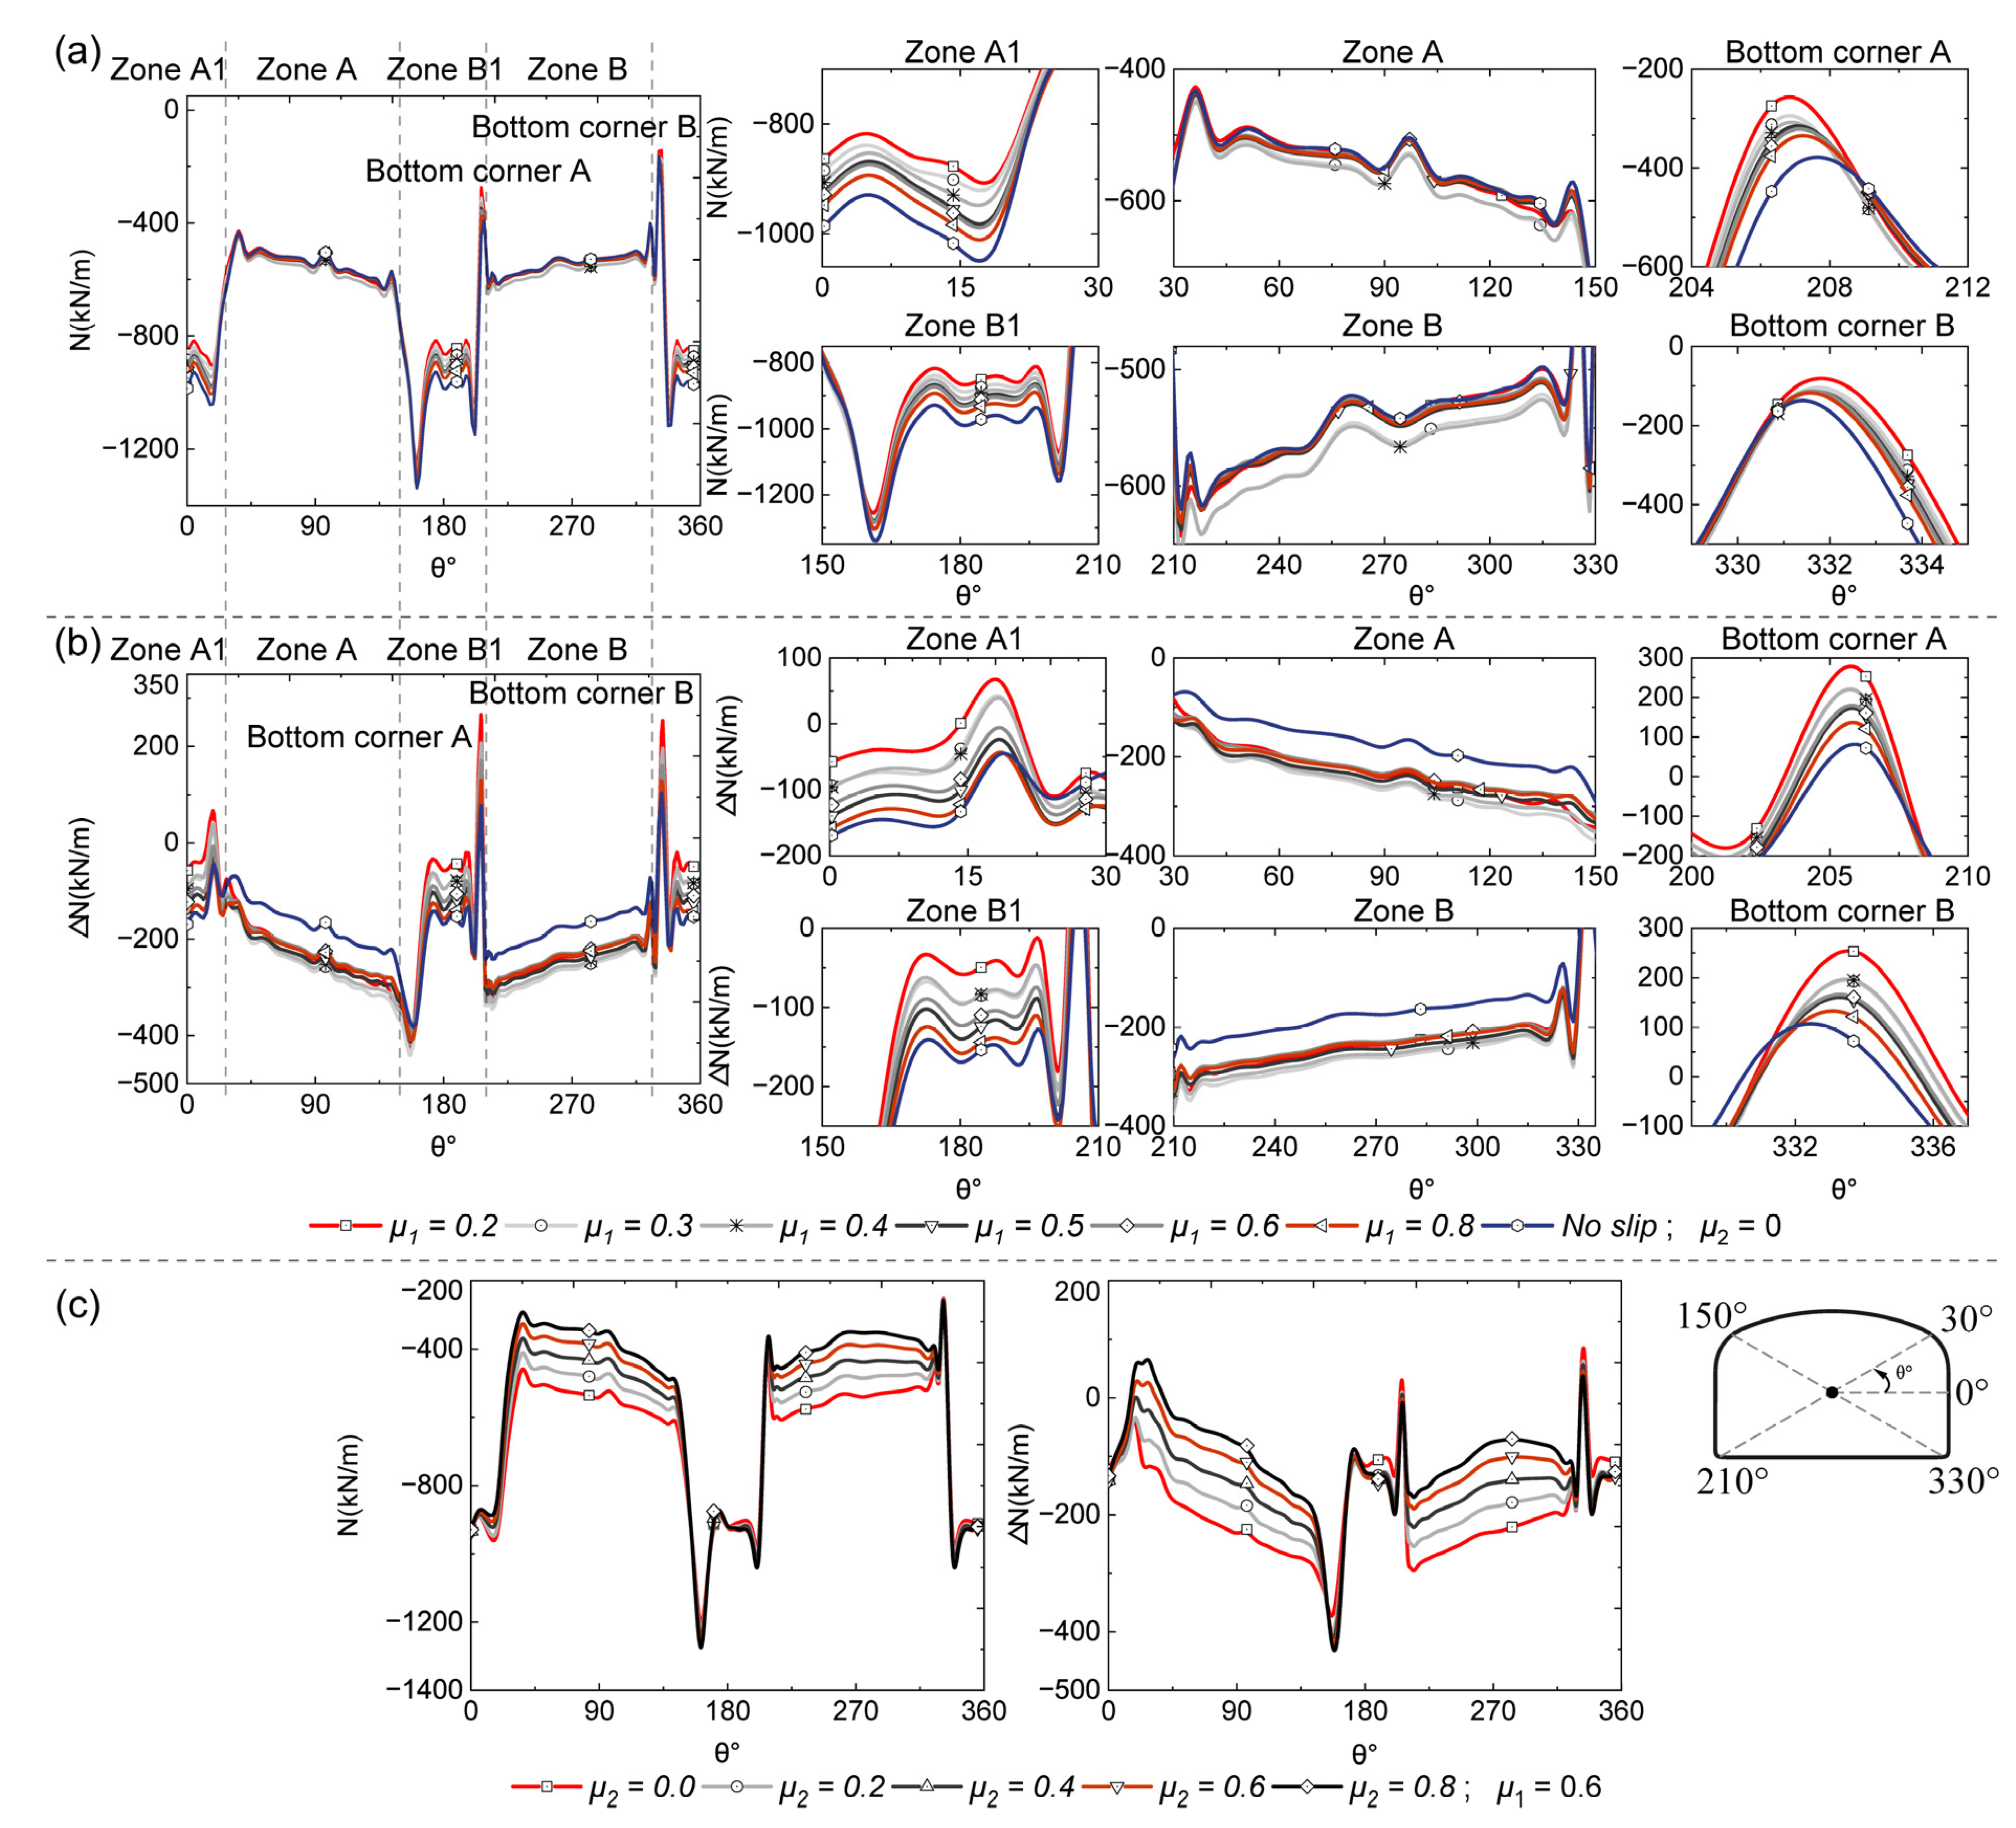
Figure 21 presents the effects of soil–primary lining interface conditions and primary–secondary lining interface conditions on the tunnel dynamic axial force. These results are calculated from the time step of maximum shear deformation of the tunnel elasto-plastic analysis for EQ2 with PGA = 0.3 g (i.e., the ground is deformed or moved in the negative direction (−X)). Figure 21 shows that the dynamic axial force is more sensitive to the change of interface conditions than the dynamic bending moment. Figure 21a shows that, for full-slip primary–secondary lining interface conditions (i.e., μ2 = 0), the increase of soil–primary lining interface friction will lead to the increase of dynamic axial force of tunnel bottom corners and side walls, while the change of the dynamic axial force of the bottom and top of the tunnel is relatively complicated. The no-slip soil–primary interface condition results in lower dynamic axial force at the top of the tunnel and higher dynamic axial force at the bottom. A similar comparison was made for the dynamic axial force increment of the tunnel (compare Figure 21a). For the sliding soil–primary lining interface condition (μ1 = 0.6), Figure 21c shows that the increase of the friction of the primary–secondary lining interface leads to a decrease in the dynamic axial force and dynamic axial force increment at the top of the tunnel.
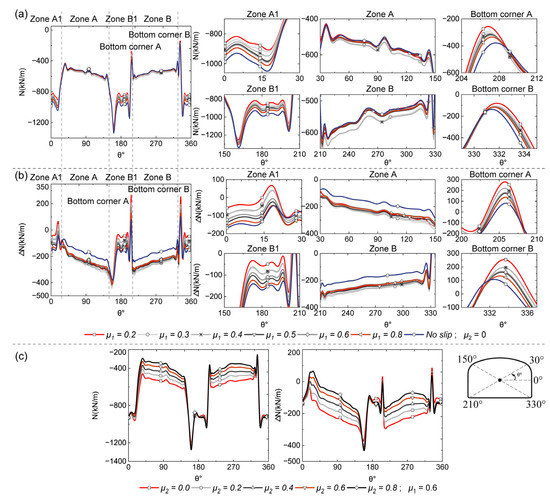
Figure 21.
Effect of interface characteristics on axial force (a) tunnels without and with primary lining (b) tunnels with primary lining; μ1 = 0.2, 0.4, 0.6, 0.8 and no-slip; μ2 = 0 (c) tunnels with primary lining; μ1 = 0.6; μ2 = 0.2, 0.4, 0.6, 0.8.
Similar to the bending moment, the axial force response ratio is used to quantitatively analyze the influence of the primary lining on the tunnel axial force. The axial force response ratio is calculated as follows (Equation (7)). The detailed configuration can be found in Figure 14c.
where is the axial force of tunnel with primary lining and the axial force of tunnel without primary lining is .
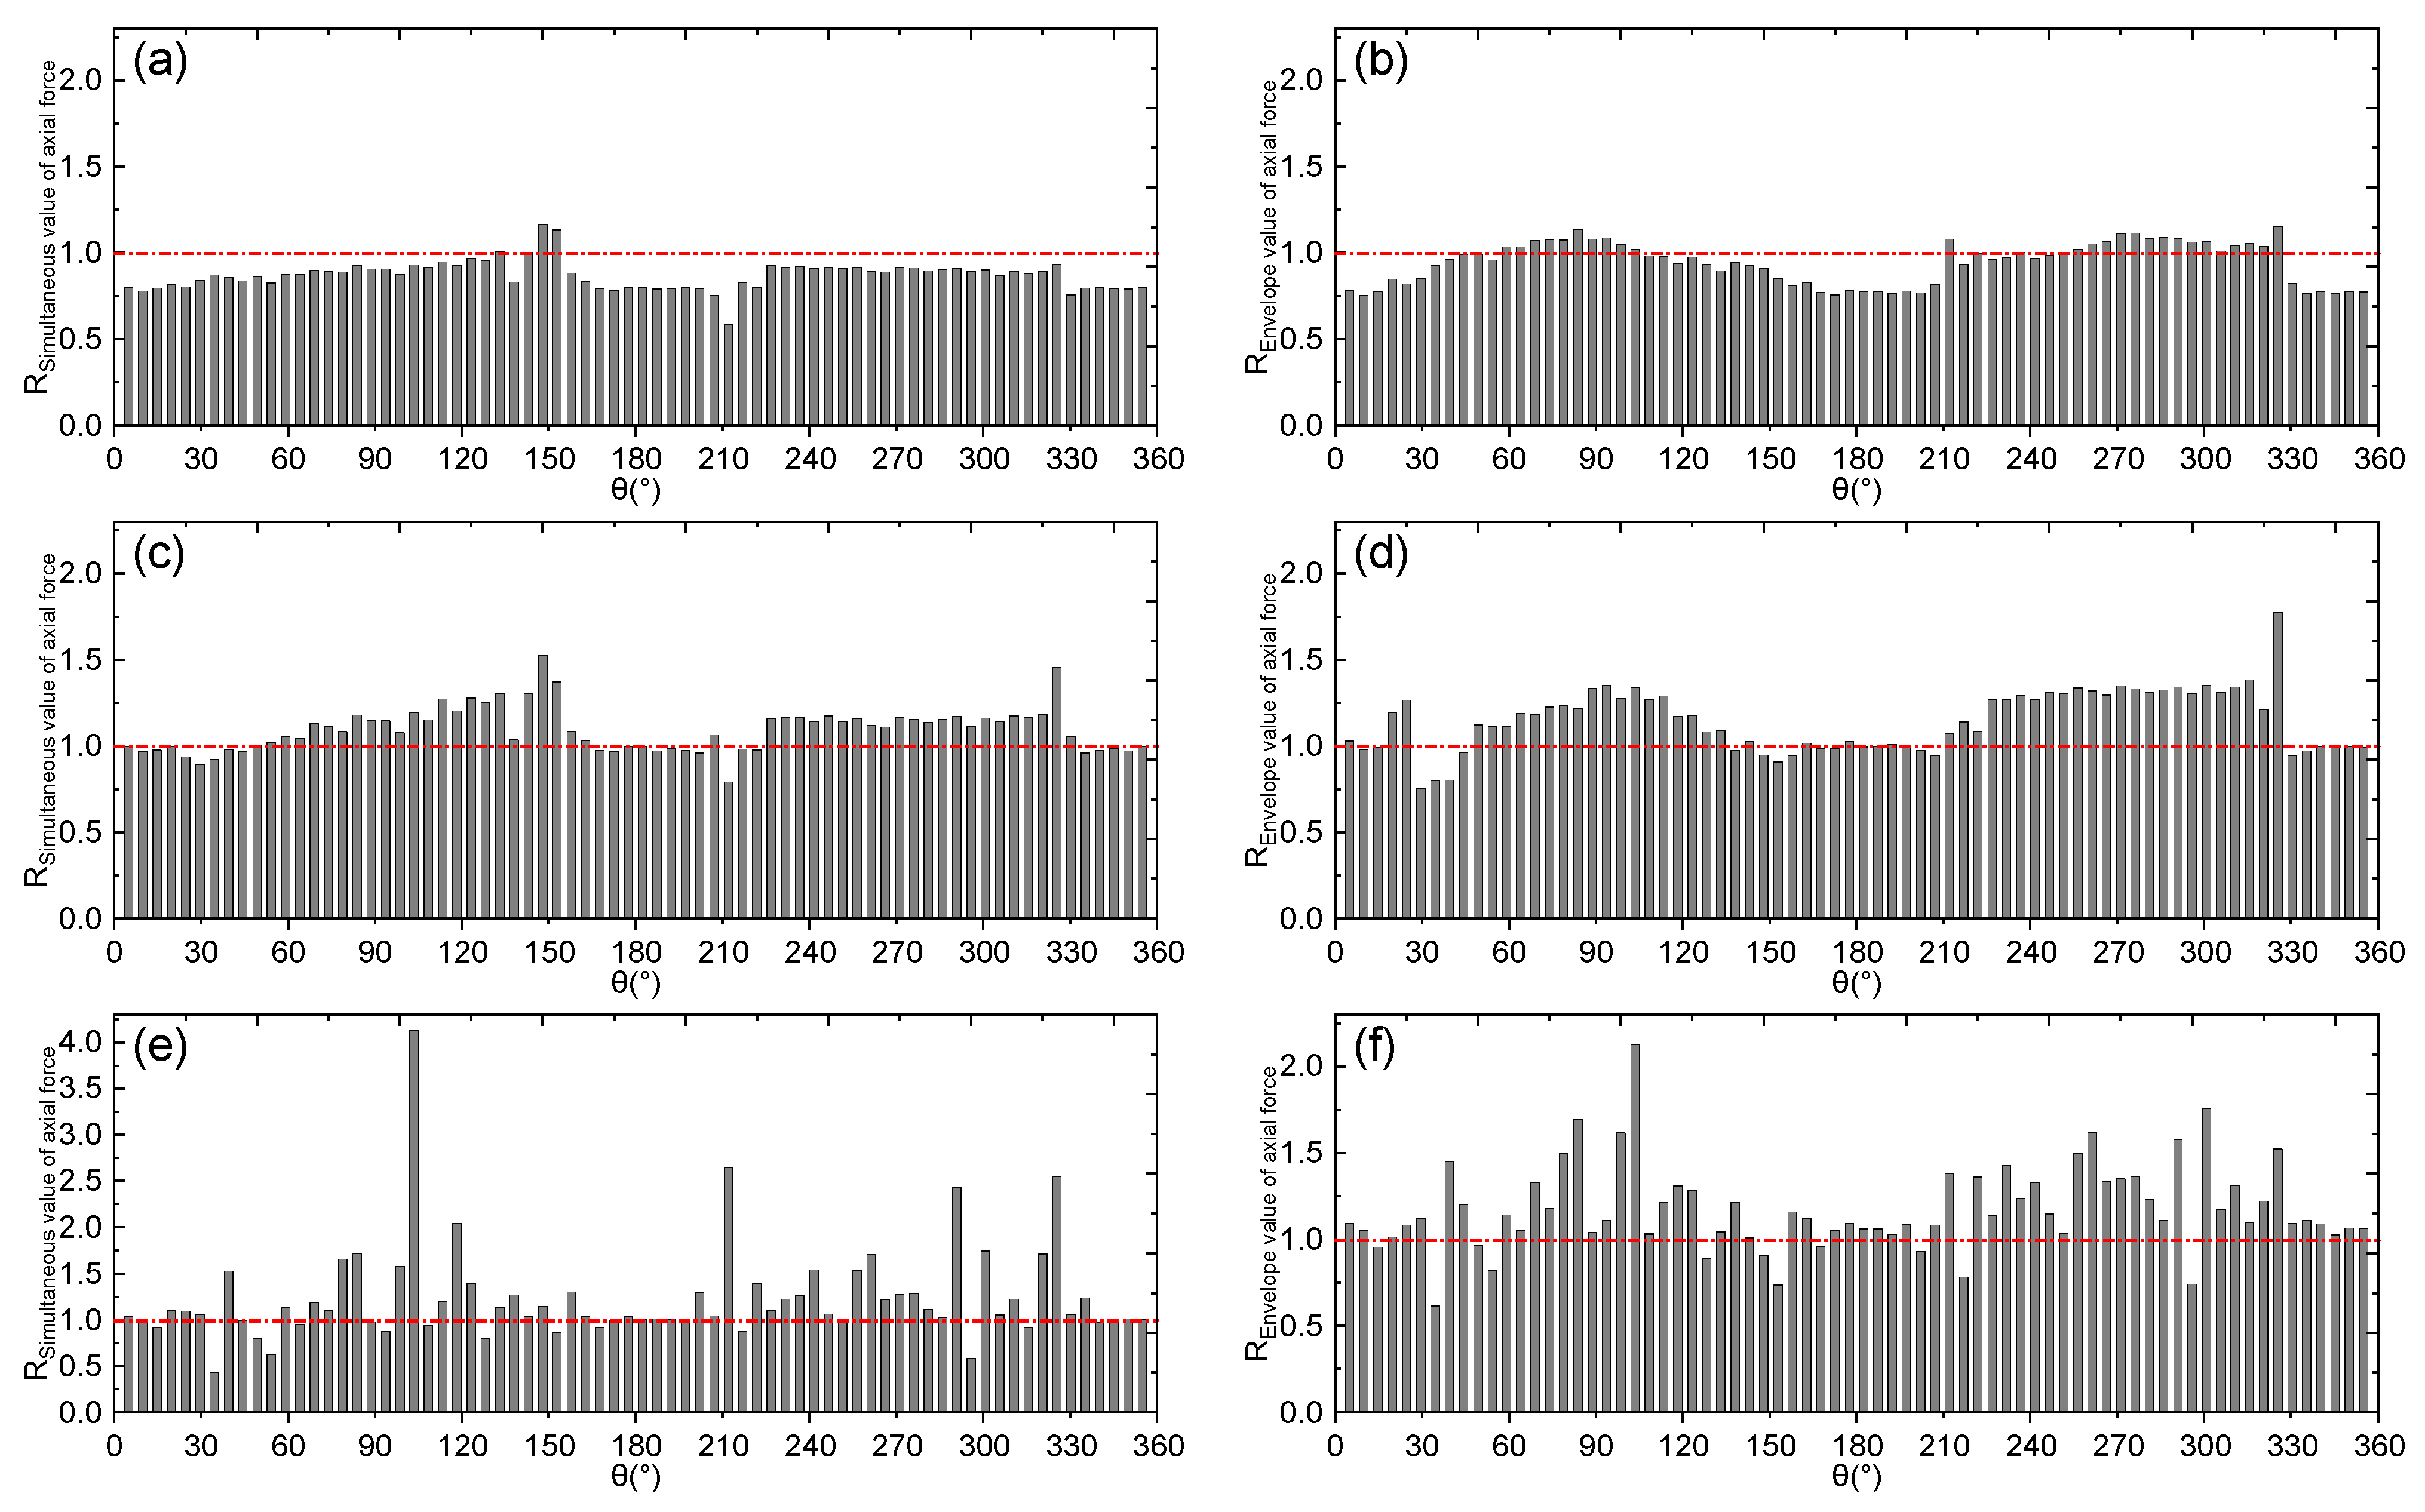
Figure 22 illustrates the response ratio of the tunnel axial force, including the simultaneous and envelope values. The results mainly refer to the elastic, elasto-plastic, and damage elasto-plastic analysis of the tunnel, in which the peak value of the seismic wave is scaled to 0.2 g. The results of elastic analysis (Figure 22a,b) show that the primary lining makes the simultaneous value of the axial force of the tunnel decrease by 14% on average. At the same time, the axial force of tunnel roof (148~157°) is increased by about 15.5% on average. Figure 22c,d portrays the tunnel axial force response ratio in the elasto-plastic analysis. The primary lining causes the simultaneous value of axial force of the tunnel roof (41~166°) to increase by 1~52.3%, with an average increase of 16.7%. The bottom slab (217~334°) also experiences an increase of 11~46%, with an average increase of 16.2%. The axial force of the left wall (170.4~214°) of the tunnel is reduced by 0.2~21%, with an average reduction of 3.9%, while the axial force of the right wall (0~36.3°, 338~360°) is reduced by 0.2~11%, with an average reduction of 3.4%. The primary lining increases the envelope value (Figure 22d) of the tunnel roof (41~139°) by 8.3~35.2%, with an average increase of 21%. The bottom slab (208~331°) also experiences an increase of 7.4~38.4%, with an average increase of 30.3%. The primary lining reduces the axial force envelope value of the side wall (152.4~206.3°, 333.7~356°) by 0.4~5.7%, with an average reduction of 2.7%. The same reduction on the tunnel roof (23.7~36.2°) is 0.4~5.7%, with an average reduction of 17%. Figure 22e,f portrays the axial force response ratio during the damage elastoplastic analysis. The simultaneous value of the axial force can be enlarged by 23% on average for the position where the primary lining amplifies, while being reduced by 13.7% on average for the position where the primary lining diminishes. The envelope value of the axial force can be enlarged by 21.9% on average for the position where the primary lining amplifies, while being reduced by 15.3% on average for the position where the primary lining diminishes.
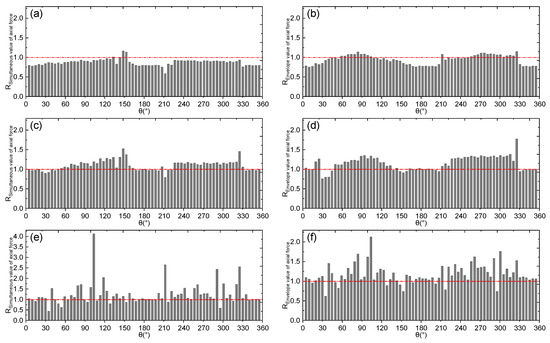
Figure 22.
Dynamic response ratio of the axial force. First row (a,b): elastic analysis result. Second row (c,d): elasto-plastic analysis result. Third row (e,f): damage plastic analysis result.
3.4. Damage of Tunnel
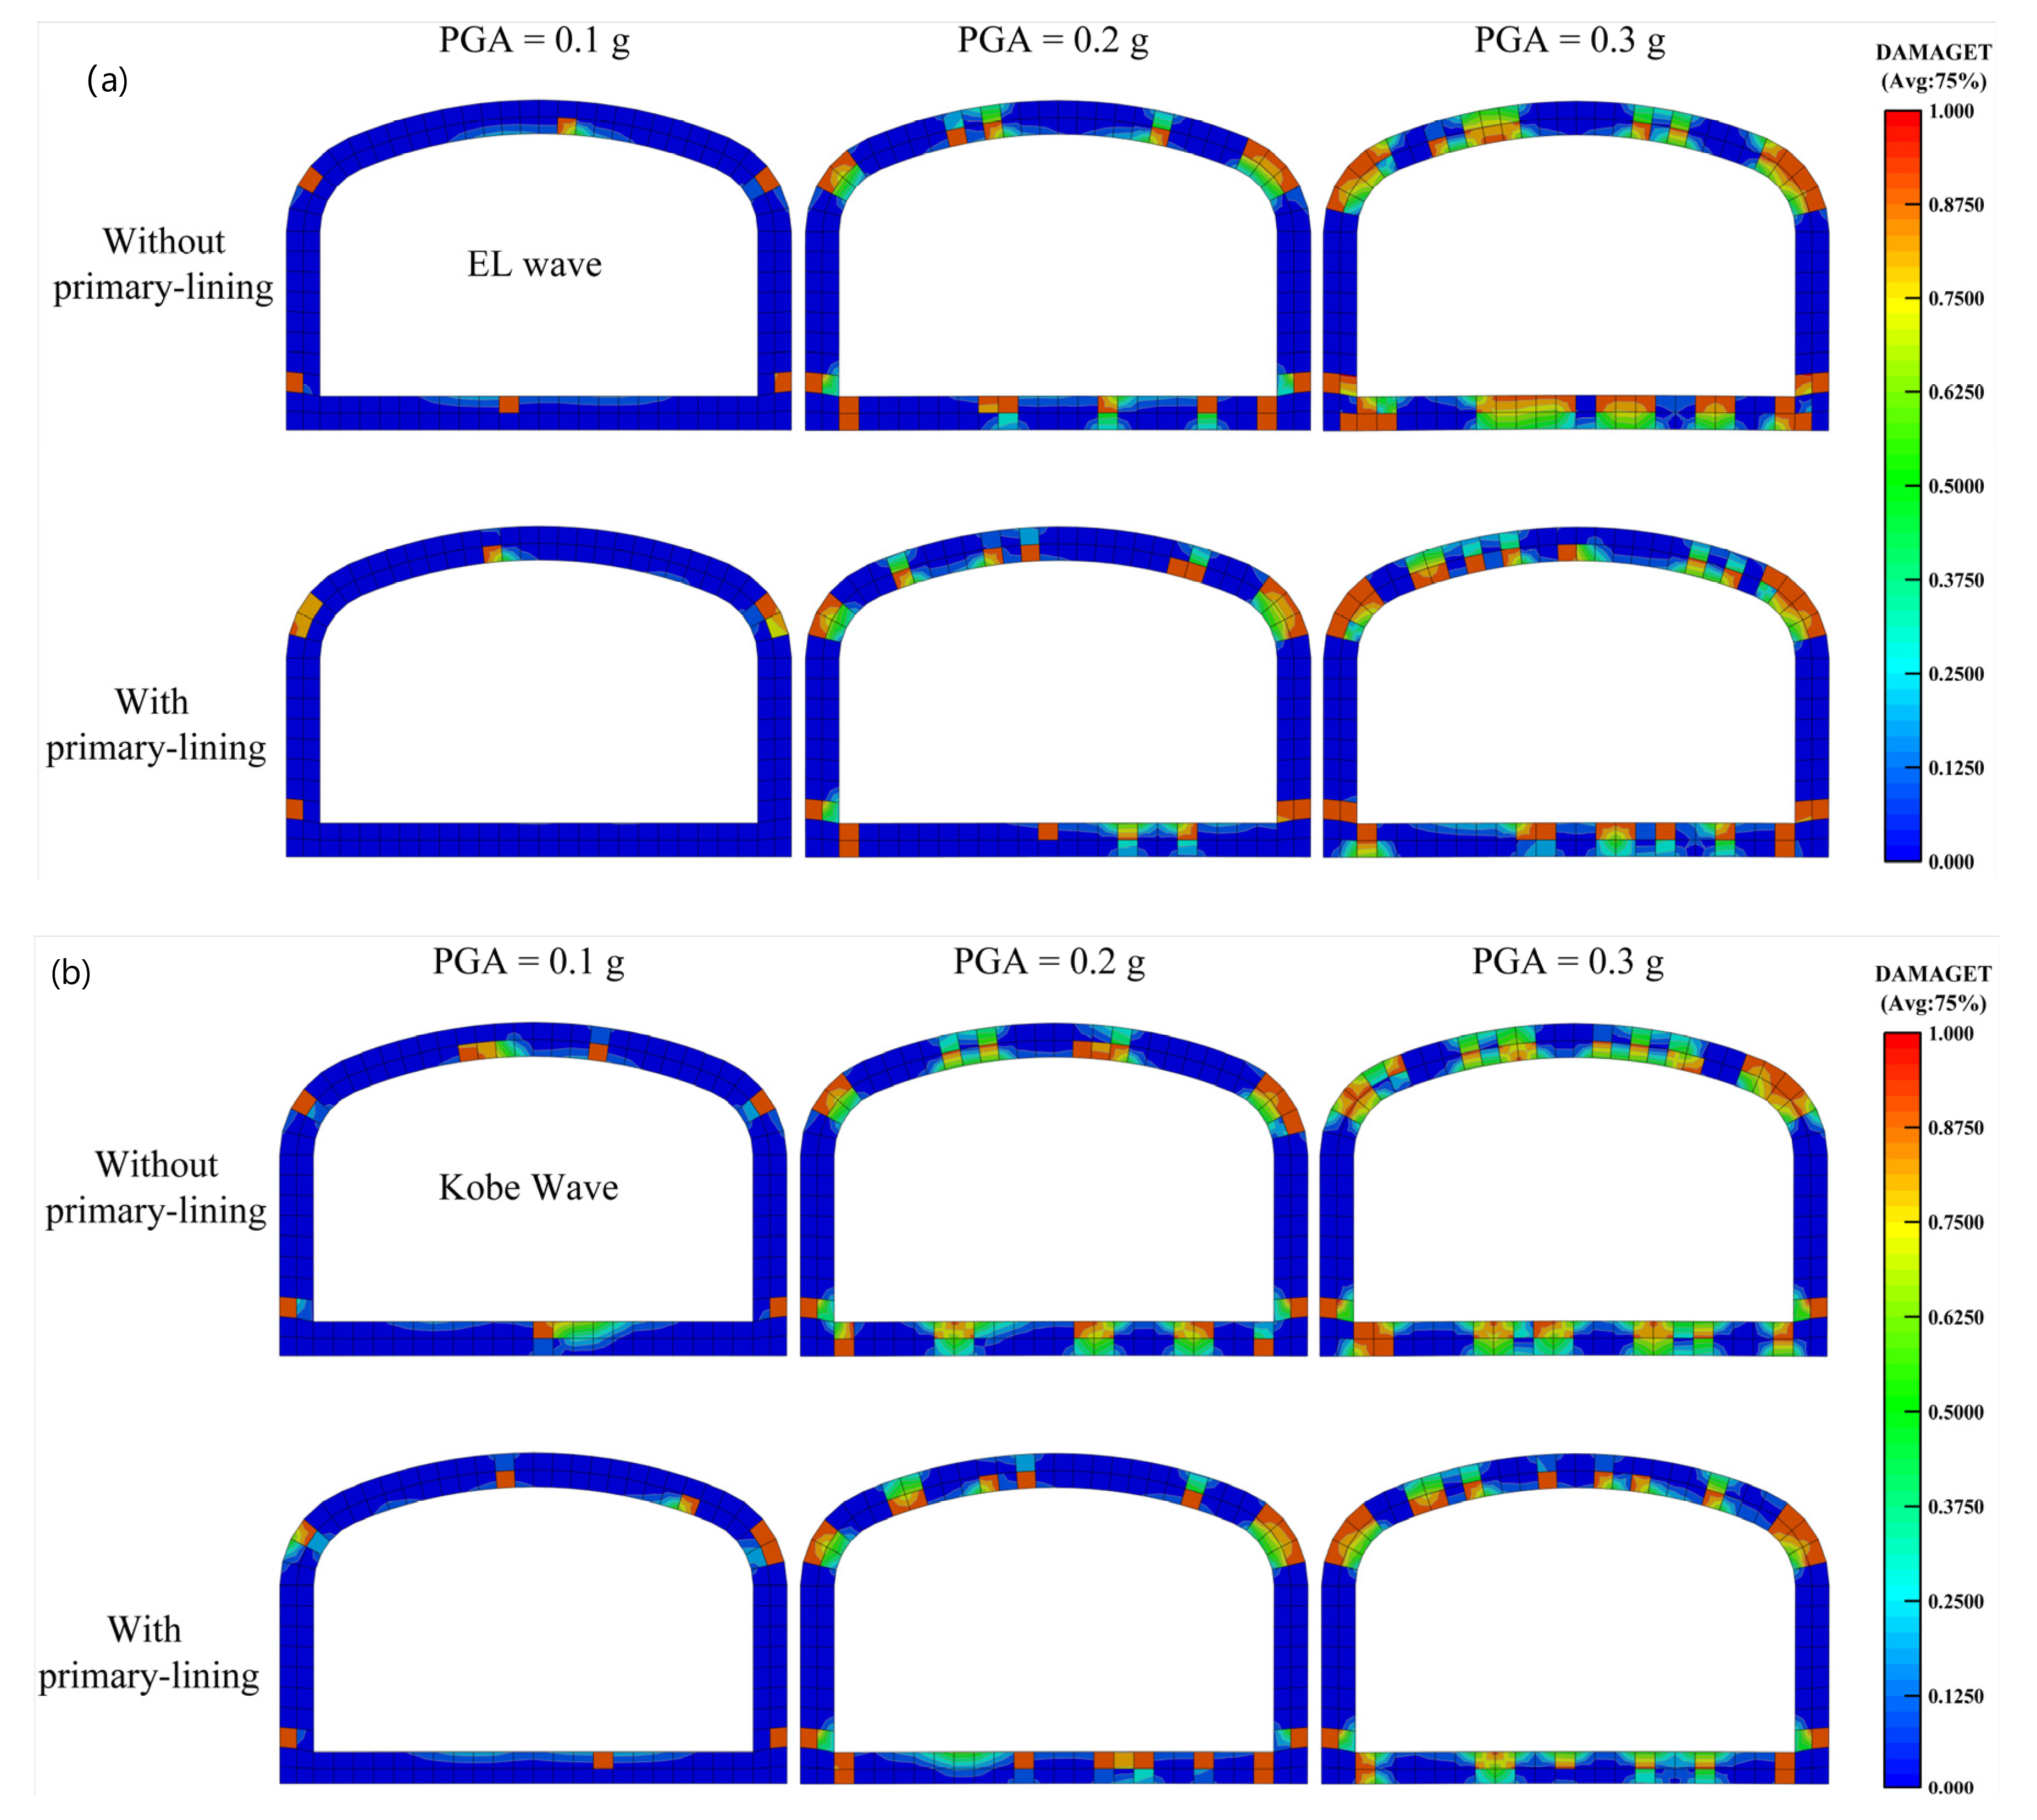
In order to analyze the influence of the primary lining on the seismic damage of the tunnel, the representative results of the tensile failure cloud map of the tunnel are shown in Figure 23. These results mainly refer to damage elasto-plastic, where PGA is scaled to 0.1 g, 0.2 g, and 0.3 g. Figure 23 shows that the tunnel crown, spandrels, corners, and the middle of the floor are all damaged during the earthquake. The damage of the tunnel increases with the increase of PGA. Under the same peak value, the damage of the Kobe wave to the tunnel is more significant than that of the EL-Centro wave.
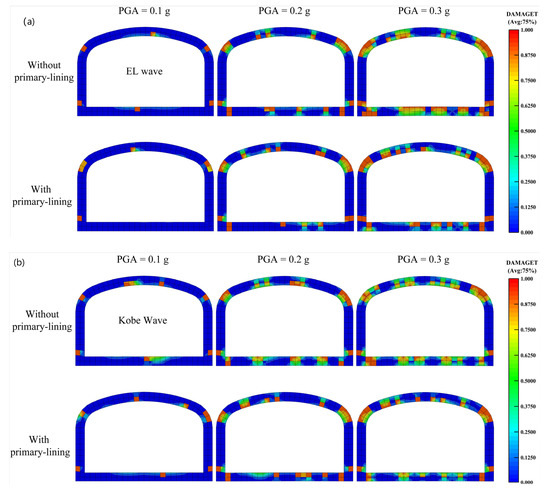
Figure 23.
Seismic tensile damage of tunnel with PGA = 0.1 g, 0.2 g, 0.3 g (a) EL-Centro Wave (b) Kobe wave.
Figure 23 results show that, when the seismic effect is small (e.g., PGA = 0.1 g), the existence of the primary lining causes the damage area at the same location on the outside of the tunnel to expand because the interaction between the tunnel and the primary lining is stronger than the tunnel and the soil. However, for the entire tunnel, the primary lining weakens the earthquake’s destructive effect on the tunnel, which is specifically manifested in the reduction in the number and area of damaged areas. With the gradual strengthening of PGA, the weakening effect of primary lining on earthquake damage has become more prominent.
4. Conclusions
This article presents and discusses a series of numerical experiments, mainly to investigate the transverse seismic response of the tunnel. Taking into account the influence of the interaction between the primary lining and the secondary lining structure, the content of the analysis mainly focuses on the transverse response of the tunnel. In the whole analysis process, the influence of the primary lining on the tunnel deformation, horizontal acceleration and response spectrum, internal force, and damage are considered. The main conclusions are as follows:
- The existence of the primary lining slightly reduces the deformation increment of the tunnel diagonal while having no evident influence on the rotation of the tunnel. The decrease of the tunnel diagonal increment caused by the primary lining is within 10% for the elastic and elasto-plastic analysis. The presence of the primary lining changes the tunnel’s deformation mode when considering the plastic behavior of the lining.
- The distributions and amplitude of bending moment along the tunnel’s perimeter are significantly affected by the primary lining and shaking direction of the ground. Generally, in terms of the simultaneous value of bending moment, the primary lining leads to an increase in the tunnel roof, but a decrease in the bottom plate and side walls. When considering the plastic behavior of the soil and the tunnel, the bending moment of the side wall in the movement direction is amplified by the primary lining, while side walls in the opposite direction are reduced. In terms of the envelope value of bending moment, the primary lining causes the compression area on the inside of the tunnel roof to shrink for elastic analysis, while the compression area on the inside of tunnel to rotate counterclockwise along the tunnel’s perimeter for elasto-plastic analysis.
- The primary lining reduces the residual bending moment of tunnel without the D position, considering the yield of the soil. However, the primary lining increases the residual bending moment of tunnel, considering the soil yield and the plastic damage deformation of the lining.
- The soil–primary lining interface conditions significantly affected the magnitude and distribution of dynamic internal forces of the lining, while the primary–secondary lining was more important for the magnitude of dynamic internal forces. The stronger friction behavior of soil–primary lining interface reduces the dynamic bending moment of the tunnel vaults while increasing the dynamic bending moment of the tunnel bottom. The stronger friction behavior of soil–primary lining interface increases the dynamic axial force of tunnel bottom corners and side walls. In addition, the soil–primary lining interface properties were verified to affect soil yield around the tunnel, while the primary–secondary lining interface conditions did not have a significant effect on soil yielding.
- The existence of the primary lining reduces the earthquake damage to the tunnel as a whole, but the primary lining also increases the risk of damage to the area on the side where the tunnel meets the primary lining.
- As a general conclusion, with most of the working conditions considered in the numerical experiments under the influence of the primary lining, in terms of the internal force of the tunnel, the primary lining can significantly affect the seismic response of the tunnel. For engineering practice, it is vital to quantify the effect of the primary lining structure on the seismic response of the tunnel. However, considering the many influencing factors and uncertainties, such as auxiliary techniques adopted in STM tunnel construction, it is difficult to strictly quantify the impact of the primary lining on the seismic response of the tunnel. Taking into account the results of this study, the effect of primary lining on the internal force is about 5–35%.
Further research is considered necessary to further understand the impact of rigorously quantified primary lining on the seismic response of the tunnel. Problems such as (i) the structure and geometric characteristics of the primary lining (for example, the thickness of the primary lining, the stiffness characteristics of the primary lining, and the non-linear response) and (ii) changes in the dynamic characteristics of the surrounding soil during the construction of the primary lining (such as grouting) may significantly affect the soil–primary lining-tunnel interaction effect. This research should be seen as the first step in acknowledging the problem and quantifying it in a simple but meaningful engineering way.
Author Contributions
Conceptualization, S.L. (Shaodong Liu) and S.L. (Shuxian Liu); methodology, S.L. (Shaodong Liu); software, S.L. (Shaodong Liu); validation, S.L. (Shaodong Liu), S.L. (Shuxian Liu) and S.L. (Shasha Lu); formal analysis, S.L. (Shaodong Liu); investigation, S.L. (Shaodong Liu) and S.L. (Shasha Lu); resources, S.L. (Shuxian Liu) and S.L. (Shasha Lu); data curation, S.L. (Shaodong Liu); writing—original draft preparation, S.L. (Shaodong Liu); writing—review and editing, S.L. (Shaodong Liu), S.L. (Shuxian Liu) and S.L. (Shasha Lu); visualization, S.L. (Shaodong Liu) and G.P.; supervision, S.L. (Shuxian Liu) and F.M.; project administration, S.L. (Shuxian Liu) and F.M.; funding acquisition, S.L. (Shasha Lu). All authors have read and agreed to the published version of the manuscript.
Funding
This research was funded by Project of the Liaoning Provincial Education Department (Study on seismic method and failure mode of subway station considering SSI effect), grant number LJKZ0336.
Data Availability Statement
Not applicable.
Conflicts of Interest
The authors declare no conflict of interest.
References
- Amorosi, A.; Boldini, D. Numerical modelling of the transverse dynamic behaviour of circular tunnels in clayey soils. Soil Dyn. Earthq. Eng. 2009, 29, 1059–1072. [Google Scholar] [CrossRef]
- Dowding, C.H.; Rozan, A. Damage to rock tunnels from earthquake shaking. J. Geotech. Eng. Div. 1978, 104, 175–191. [Google Scholar] [CrossRef]
- Owen, G.N.; Scholl, R.E. Earthquake Engineering of Large Underground Structures; Federal Highway Administration and National Science Foundation: Washington, DC, USA, 1981. [Google Scholar]
- Yoshikawa, K.; Fukuchi, G. Earthquake damage to railway tunnels in japan. Adv. Tunn. Technol. Subsurf. Use 1984, 4, 75–83. [Google Scholar]
- Yoshida, N. Damage to subway station during the 1995 hyogokennambu (kobe) earthquake. In Earthquake Geotechnical Case Histories for Performance-Based Design; CRC Press: Boca Raton, FL, USA, 2009; pp. 373–389. [Google Scholar]
- Sharma, S.; Judd, W.R. Underground opening damage from earthquakes. Eng. Geol. 1991, 30, 263–276. [Google Scholar] [CrossRef]
- Wang, W.L.; Wang, T.T.; Su, J.J.; Lin, C.H.; Seng, C.R.; Huang, T.H. Assessment of damage in mountain tunnels due to the taiwan chichi earthquake. Tunn. Undergr. Space Technol. 2001, 16, 133–150. [Google Scholar] [CrossRef]
- Jing-Ming, W.; Litehiser, J.J., Jr. The distribution of earthquake damage to underground facilities during the 1976 tang-shan earthquake. Earthq. Spectra 1985, 1, 741–757. [Google Scholar] [CrossRef]
- Hashash, Y.M.A.; Hook, J.J.; Schmidt, B.; John, I.; Yao, C. Seismic design and analysis of underground structures. Tunn. Undergr. Space Technol. 2001, 16, 247–293. [Google Scholar] [CrossRef]
- Wang, Z.; Gao, B.; Jiang, Y.; Yuan, S. Investigation and assessment on mountain tunnels and geotechnical damage after the wenchuan earthquake. Sci. China Ser. E: Technol. Sci. 2009, 52, 546–558. [Google Scholar] [CrossRef]
- Iida, H.; Hiroto, T.; Yoshida, N.; Iwafuji, M. Damage to daikai subway station. Soils Found. 1996, 36, 283–300. [Google Scholar] [CrossRef]
- Yu, H.; Chen, J.; Bobet, A.; Yuan, Y. Damage observation and assessment of the longxi tunnel during the Wenchuan earthquake. Tunn. Undergr. Space Technol. 2016, 54, 102–116. [Google Scholar] [CrossRef]
- Bilotta, E.; Lanzano, G.; Madabhushi, S.P.G.; Silvestri, F. Anumerical round robin on tunnels under seismic actions. Acta Geotech. 2014, 9, 563–579. [Google Scholar] [CrossRef]
- Chen, G.; Wang, Z.; Zuo, X.; Du, X.; Gao, H. Shaking table test on the seismic failure characteristics of a subway station structure on liquefiable ground. Earthq. Eng. Struct. Dyn. 2013, 42, 1489–1507. [Google Scholar] [CrossRef]
- Chou, J.C.; Kutter, B.L.; Travasarou, T.; Chacko, J.M. Centrifuge modeling of seismically induced uplift for the bart transbay tube. J. Geotech. Geoenviron. Eng. 2011, 137, 754–765. [Google Scholar] [CrossRef]
- Cilingir, U.; Madabhushi, S.P.G. Effect of depth on seismic response of circular tunnels. Can. Geotech. J. 2011, 48, 117–127. [Google Scholar] [CrossRef]
- Cilingir, U.; Madabhushi, S.P.G. Effect of depth on the seismic response of square tunnels. Soils Found. 2011, 51, 449–457. [Google Scholar] [CrossRef]
- Lanzano, G.; Bilotta, E.; Russo, G.; Silvestri, F.; Madabhushi, S.P.G. Centrifuge modeling of seismic loading on tunnels in sand. Geotech. Test. J. 2012, 35, 854–869. [Google Scholar] [CrossRef]
- Tsinidis, G.; Pitilakis, K.; Trikalioti, A.D. Numerical simulation of round robin numerical test on tunnels using a simplified kinematic hardening model. Acta Geotech. 2014, 9, 641–659. [Google Scholar] [CrossRef]
- Huo, H.; Bobet, A.; Fernández, G.; Ramirez, J. Load transfer mechanisms between underground structure and surrounding ground: Evaluation of the failure of the daikai station. J. Geotech. Geoenviron. Eng. 2005, 131, 1522–1533. [Google Scholar] [CrossRef]
- Anastasopoulos, I.; Gerolymos, N.; Drosos, V.; Georgarakos, T.; Kourkoulis, R.; Gazetas, G. Behaviour of deep immersed tunnel under combined normal fault rupture deformation and subsequent seismic shaking. Bull. Earthq. Eng. 2008, 6, 213–239. [Google Scholar] [CrossRef]
- Anastasopoulos, I.; Gerolymos, N.; Drosos, V.; Kourkoulis, R.; Georgarakos, T.; Gazetas, G. Nonlinear response of deep immersed tunnel to strong seismic shaking. J. Geotech. Geoenviron. Eng. 2007, 133, 1067–1090. [Google Scholar] [CrossRef]
- Kontoe, S.; Avgerinos, V.; Potts, D.M. Numerical validation of analytical solutions and their use for equivalent-linear seismic analysis of circular tunnels. Soil Dyn. Earthq. Eng. 2014, 66, 206–219. [Google Scholar] [CrossRef]
- Kontoe, S.; Zdravkovic, L.; Potts, D.M.; Menkiti, C.O. On the relative merits of simple and advanced constitutive models in dynamic analysis of tunnels. Géotechnique 2011, 61, 815–829. [Google Scholar] [CrossRef]
- Hashash, Y.M.A.; Park, D.; John, I.; Yao, C. Ovaling deformations of circular tunnels under seismic loading, an update on seismic design and analysis of underground structures. Tunn. Undergr. Space Technol. 2005, 20, 435–441. [Google Scholar] [CrossRef]
- John, C.M.S.; Zahrah, T.F. A seismic design of underground structures. Tunn. Undergr. Space Technol. 1987, 2, 165–197. [Google Scholar] [CrossRef]
- Huo, H.; Bobet, A.; Fernández, G.; Ramírez, J. Analytical solution for deep rectangular structures subjected to far-field shear stresses. Tunn. Undergr. Space Technol. 2006, 21, 613–625. [Google Scholar] [CrossRef]
- Wang, J.-N. Seismic Design of Tunnels, a Simple State-of-the-Art Design Approach Parsons Brinckerhoff Quade & Douglas; WIT Press: Southampton, UK, 1993. [Google Scholar]
- Penzien, J. Seismically induced racking of tunnel linings. Earthq. Eng. Struct. Dyn. 2000, 29, 683–691. [Google Scholar] [CrossRef]
- Stamos, A.A.; Beskos, D.E. 3-d seismic response analysis of long lined tunnels in half-space. Soil Dyn. Earthq. Eng. 1996, 15, 111–118. [Google Scholar] [CrossRef]
- Pitilakis, K.; Tsinidis, G. Performance and seismic design of underground structures. In Earthquake Geotechnical Engineering Design; Springer: Cham, Switzerland, 2014; pp. 279–340. [Google Scholar]
- Gil, L.M.; Hernandez, E.; de la Fuente, P. Simplified transverse seismic analysis of buried structures. Soil Dyn. Earthq. Eng. 2001, 21, 735–740. [Google Scholar] [CrossRef]
- Fang, Q.; Zhang, D.; Wong, L.N.Y. Shallow tunnelling method (stm) for subway station construction in soft ground. Tunn. Undergr. Space Technol. 2012, 29, 10–30. [Google Scholar] [CrossRef]
- Hibbitt, Karlsson, Sorensen, ABAQUS/Standard: User’s Manual. Hibbitt, Karlsson and Sorenson Incorporated. 1998. Available online: https://books.google.co.kr/books/about/ABAQUS_Explicit.html?id=G30YAQAAMAAJhl=enoutput=html_textredir_esc=y (accessed on 14 November 2022).
- GB50011-2010; Code for Seismic Design of Buildings. China Architecture and Building Press: Beijing, China, 2010. (In Chinese)
- Seed, H.B.; Wong, R.T.; Idriss, I.M.; Tokimatsu, K. Moduli and damping factors for dynamic analyses of cohesionless soils. J. Geotech. Eng. 1986, 112, 1016–1032. [Google Scholar] [CrossRef]
- Tsinidis, G.; Pitilakis, K.; Madabhushi, G. On the dynamic response of square tunnels in sand. Eng. Struct. 2016, 125, 419–437. [Google Scholar] [CrossRef]
- Kuhlemeyer, R.L.; Lysmer, J. Finite element method accuracy for wave propagation problems. J. Soil Mech. Found. Div. 1973, 99, 421–427. [Google Scholar] [CrossRef]
- Hwang, J.; Lu, C. Seismic capacity assessment of old sanyi railway tunnels. Tunn. Undergr. Space Technol. 2007, 22, 433–449. [Google Scholar] [CrossRef]
- Pakbaz, M.C.; Yareevand, A. 2-d analysis of circular tunnel against earthquake loading. Tunn. Undergr. Space Technol. 2005, 20, 411–417. [Google Scholar] [CrossRef]
- Hardin, B.O.; Drnevich, V.P. Shear modulus and damping in soils: Design equations and curves. J. Soil Mech. Found. Div. 1972, 98, 667–692. [Google Scholar] [CrossRef]
- Conti, R.; Viggiani, G.M.B. Evaluation of soil dynamic properties in centrifuge tests. J. Geotech. Geoenviron. Eng. 2012, 138, 850–859. [Google Scholar] [CrossRef]
- Schanz, T.; Vermeer, P.A. Angles of friction and dilatancy of sand. Géotechnique 1996, 46, 145–151. [Google Scholar] [CrossRef]
- Lee, J.; Fenves, G.L. Plastic-damage model for cyclic loading of concrete structures. J. Eng. Mech. 1998, 124, 892–900. [Google Scholar] [CrossRef]
- Lubliner, J.; Oliver, J.; Oller, S.; Onate, E. A plasticdamage model for concrete. Int. J. Solids Struct. 1989, 25, 299–326. [Google Scholar] [CrossRef]
- Shibayama, S.; Izawa, J.; Takahashi, A.; Takemura, J.; Kusakabe, O. Observed behaviour of a tunnel in sand subjected to shear deformation in a centrifuge. Soils Found. 2010, 50, 281–294. [Google Scholar] [CrossRef]
- Abuhajar, O.; El Naggar, H.; Newson, T. Seismic soil–culvert interaction. Can. Geotech. J. 2015, 52, 1649–1667. [Google Scholar] [CrossRef]
- Ulgen, D.; Saglam, S.; Ozkan, M.Y. Dynamic response of a flexible rectangular underground structure in sand: Centrifuge modeling. Bull. Earthq. Eng. 2015, 13, 2547–2566. [Google Scholar] [CrossRef]
- Tsinidis, G.; Rovithis, E.; Pitilakis, K.; Chazelas, J.L. Seismic response of box-type tunnels in soft soil: Experimental and numerical investigation. Tunn. Undergr. Space Technol. 2016, 59, 199–214. [Google Scholar] [CrossRef]
- Cilingir, U.; Madabhushi, S.P.G. A model study on the effects of input motion on the seismic behaviour of tunnels. Soil Dyn. Earthq. Eng. 2011, 31, 452–462. [Google Scholar] [CrossRef]
Disclaimer/Publisher’s Note: The statements, opinions and data contained in all publications are solely those of the individual author(s) and contributor(s) and not of MDPI and/or the editor(s). MDPI and/or the editor(s) disclaim responsibility for any injury to people or property resulting from any ideas, methods, instructions or products referred to in the content. |
© 2022 by the authors. Licensee MDPI, Basel, Switzerland. This article is an open access article distributed under the terms and conditions of the Creative Commons Attribution (CC BY) license (https://creativecommons.org/licenses/by/4.0/).

