Article

The Influence Innovation Has on the Visual Appearance and Aesthetic Preference of Architectural Products

1
School of Design and Architecture, Swinburne University of Technology, Melbourne, VIC 3122, Australia
2
PDR-International Centre for Design and Research, Cardiff Metropolitan University, Cardiff CF14 3AT, UK
*
Author to whom correspondence should be addressed.
Buildings 2023, 13(1), 19; https://doi.org/10.3390/buildings13010019
Submission received: 28 October 2022 / Revised: 16 December 2022 / Accepted: 19 December 2022 / Published: 22 December 2022
(This article belongs to the Special Issue Tradition and Innovation in Construction Project Management)

Abstract

:
The importance of innovation for architectural products in the building industry increases due to global competitive markets and users’ increased value given to the visual aesthetics of products. Visual appearance is crucial in architecture and product design and influences users’ product choices in many ways. Substantial research on innovation exists concerning users’ purchasing, adopting, and recommending it to others, but little research investigates the link between product innovation and aesthetic preference. This gap in knowledge prompted our investigation. Quantitative analysis of a survey of 114 respondents from Australia was conducted in this study to examine whether innovation plays a significant role in perceiving the aesthetic preference of an architectural product more than other visual appearances. Standard multiple regression using SPSS V28 was applied for statistical data analysis. Results uncovered that innovation explained the highest percentage of variance in overall aesthetic preference, and the innovativeness of a product strongly influences the visual appearance and aesthetic preference. The findings of this study offer new insight into the level of innovation for new product development where visual appearance is of high importance.

1. Introduction

Vision is considered the central of the senses [1]. Therefore, product preference is significantly governed by the visual properties or appearance of the product [2]. It can persuade product evaluations and choices by the users in quite a few ways [3,4,5]. Users’ first impressions of a product can be determined by the product’s design as the “look” of a product is very important, which elevates the product’s value and looking at something beautiful is gratifying [6]. The aesthetic responses are very personal as they are mainly emotional or feelings [7] and may derive from seeing the product without considering utility [8]. It is recognised that response to design involves a full array of human responses as the design’s sensory aspect is congruent with a product’s visual appearance [9].
The aesthetic preference is fundamentally an aesthetic judgment made by an individual based on recognising the structure of the product, coherence, or order [10], including the individual’s prior experience generated from inherent memory integration [11]. Reference [12] pointed out that aesthetic pleasure and aesthetic interest are basically two different responses to aesthetics in a positive way. The aesthetic response can also be generated from a comprehensive aesthetic preference judgement, evidenced by considerable empirical research on aesthetic preference [13]. These findings illustrate some fundamental inconsistencies in the literature. For example, several studies mentioned that ‘fluency’ prompts aesthetic preference, through which an observer can process an object [14]. In contrast, other researchers challenge this finding [15]. They found that a complex design can positively trigger aesthetic liking, which is difficult to process. Novelty also makes the processing less fluent but is associated with aesthetic preference [16].
Aesthetics are also proposed to be the ‘soul’ of innovation [17], including innovative product designs, and its importance can be further highlighted in its ability to influence users’ acceptance of innovation. Previous studies have argued that there is a link between an individual’s aesthetic expertise and their evaluation of innovative designs [18]. Individuals with expertise in aesthetics or art and design have a higher tendency to prefer innovative designs, as they are particularly “more sensitive to the changes of innovativeness, which presumably was due to higher cognitive design concepts” [18] (p. 617). As an extension of these studies, exploration has also been carried out to understand specific individuals’ aesthetic preferences based on their background and expertise level. By classifying participants into categories of expertise level, it is suggested that there is a distinct difference in preference and evaluation of aesthetic appeal between experts in the design field compared to design novices [19]. This aligns with a previous study [18] that shows that individuals who are inclined and interested in aesthetics tend to respond more positively to innovative designs, while those without any interest are more inclined to choose more conventional designs.
This is contested by another study [20], arguing that the study [18] did not provide any empirical evidence to support their findings. In reference [20], researchers propose that “visual typicality in design is a more important criterion for design novices who are less sensitive to the aesthetic quality of design” (p. 528). Typicality is important for this group simply because their judgement is influenced by the ease of processing [20]. They prefer designs or stimuli that are easier to relate to based on their previous knowledge or memory than a more unusual, novel design that they cannot relate to or easily understand.
Considerable research is available on innovation concerning customers’ purchasing, adopting, and recommending it to others, but little research investigated the link between product innovation and aesthetic preference. Therefore, to address the gap, if aesthetics is proposed to be the ‘soul’ of innovation as described by reference [17], this study aims to investigate whether innovation plays a significant role in perceiving the aesthetic preference of a product more than other visual appearances. Furthermore, this study views this issue from a psychological perspective rather than market and user research, which most other studies have done. Thus, the research questions were raised as follows:
  • How do respondents evaluate the innovativeness of a product?
  • Does the aesthetic preference of a product depend on its innovative appearance?
Visual stimuli that have received scholarly attention include but are not limited to sculptures, textures, faces, and geometrical shapes [21]. We used timber joints of the pagoda-style structure to represent an architectural product as visual stimuli to conduct the study. There were certain considerations for this choice. Firstly, we were concerned about the complexity of visual stimuli. By complexity, we mean the respondent’s perception of the stimulus complexity in question. The study [12] shows that moderately complex stimuli is preferred over high or low level of complexity, which is supported by many other studies [22]. Reference [12] hypothesised the relationship between complexity and aesthetic preference as an inverted U shape, where stimuli with an intermediate level of complexity attain the highest preference. Timber joints used in the study are moderately complex. Secondly, we were concerned about visual working memory (VWM). Reference [23] identified that VWM lets people hold visual information in mind for a few seconds. A study [24] on the VWM capacity of simple and complex stimuli revealed that VWM is sensitive to the surface complexity of the stimuli, suggesting the heavier the information load, the lower the VWM capacity [25]. Therefore, we can anticipate that the perceptual limitation of complex stimuli can be compensated by viewing the stimuli for a longer time and thus allowing participants to view the stimuli as long as required. Finally, the present study uses timber joints as visual stimuli, as they combine both aesthetics and functionality. Unlike artwork that predominantly fulfils a hedonic need, timber joints provide practical motives that induce cognitive and affective aesthetic judgment. Therefore, a combination of the neural processing of aesthetic experience and emotional responses to visual stimuli can address the research gap identified in the present study.

2. Theoretical Background

2.1. Overview of Aesthetic Experience

According to reference [26], an aesthetic experience occurs in response to a visual encounter with any type of object, scene, or event. This encounter is not bound to the experience of encountering visual artworks. It can occur daily, for instance, when one appreciates the beauty of one’s newly purchased decorative vase or a building product. Aesthetic experience can be further defined as a cognitive process influenced by a person’s affective state that will lead to an aesthetic emotion [27]. Each aesthetic experience may be different depending on the state of visual processing. Because of this, aesthetic experiences are considered complex phenomena, and any gradual development or change must be considered when assessing the experience [28].
An aesthetic experience involves different stages of classifying, understanding, and cognitively mastering an artwork, or in this case, a stimulus [27]. This multi-stage process can also be referred to as aesthetic information processing [29]. At the first stage of aesthetic processing, a person generates a perceptual analysis of the stimulus, thus, creating the first impression of that stimulus. Reference [30] suggests that, in general, a person would spontaneously generate a global impression or the gist of the stimulus at first glance of a stimulus. This occurrence is an immediate awareness of the visual appearance; the gist is pre-cognitive in nature [30]. Reference [31] summarises the aesthetic-processing stages and states that the whole process starts with the participant’s perceptual analysis of the stimulus, which is then compared with their previous personal encounters and experience. The stimulus will then be classified into a meaningful category that is later interpreted and assessed. This results in the final stage of aesthetic processing, namely, aesthetic judgement and aesthetic emotion.

2.2. Overview of Aesthetic Preference

To understand the aesthetic preference of individuals for a particular product, it is important to note that there are factors and principles that can be used to measure an aesthetic preference. The study [14] highlights possible factors that can “influence aesthetic judgments such as figural goodness, figure-ground contrast, stimulus repetition, symmetry and prototypicality” (p. 364). Reference [1] proposes that despite the differences in social settings, such as culture and time among individuals, it is possible to form a universal agreement on aesthetic pleasure. The properties of a designed product, such as having a balanced proportion or a familiar property that stimulates preference, have been studied and measured to produce a universal agreement that can represent the aesthetic preference of the majority of individuals for a particular product.
Studies have experimented with using product elements and properties to measure aesthetic preference. One such study [32] measures a product’s aesthetic preference by testing product angularity as a specific element. Their experiment shows a preference for arrays of circles and hexagons when it comes to angularity. Another similar study examining the difference in preference rate between curved and sharp objects suggests that sharp objects or sharp-angled contours induced lower preference in participants [33]. Some studies look into an individual’s preference for physical elements of products, such as its physical form and shape (for example, [34]). The evaluation of other product elements and the global perception of a product itself also differs between design beginners and design experts. According to reference [35], beginners have a higher probability of using the level of novelty to indicate a product’s apparent usability compared with design professionals. This means they perceive a novel-designed product as more usable than a designed product with typical features.

2.3. Aesthetics and Innovation

Linking aesthetics and innovation focuses mostly on ‘soft’ innovations, which are products that have a strong aesthetic component [36]. The author, in reference [36], also argues that most soft innovations are regarded best as new differentiated products. Because products that are primarily the same can be ascertained individually based on performance and aesthetic appeal, they are preferred by users differently due to different tastes or preferences.
A report from the Organization for Economic Co-operation and Development (OECD) [37] defines product innovation as “the introduction of a good or service that is new or significantly improved with respect to its characteristics or intended uses. This includes significant improvements in technical specifications, components and materials, incorporated software, user-friendliness or other functional characteristics” [37] (p. 48). We claim that aesthetic innovation plays a vital role in product characteristics and intended uses because nowadays, people are more concerned about the look, feel, and functionality of a product due to aesthetics being an essential element in our society [38]. As a result, practitioners comprehend the significance of aesthetic design in user choice [39], and many industries experience aesthetic innovation when the visual attributes of a product ascertain novelty [40].
Supporting this, we refer to another form of innovation listed in the OECD report [37] (p. 49), known as marketing innovation. “A marketing innovation is implementing a new marketing method involving significant changes in product design or packaging, product placement, product promotion or pricing” (p. 49). Despite the fact that the OECD’s introduction of the marketing innovation concept has made it accepted that innovation no longer necessitates a change in product performance or functionality, and that innovation can exhibit just an aesthetic transformation as opposed to a functional change, none of the previously defined types of innovation encompasses soft innovation as defined above [37].

3. Methods

3.1. Participants

Australians 18 years of age and above were eligible to participate in the survey. Participants under 18 years of age and participants with limited or no capacity or authority to give voluntary and informed consent were excluded from the survey. An experience management company, Qualtrics©, recruited a total of 114 participants. Qualtrics© organised financial rewards for the participants for their contribution to the survey.

3.2. Procedures

An online survey was conducted in line with the National Statement on Ethical Conduct in Human Research, outlining the ethics protocol and approvals. All participants’ data were anonymous, and they were informed about the intention of this study and gave implied consent. Participants were presented with five images of timber joints of the pagoda-style structure (Figure 1), one after another. Each image carried several visual appearance questions, and participants were asked to rate their agreement with the statements on a 7-point Likert scale (from ‘Disagree’ to ‘Agree’). The online survey was prepared in English.

3.3. Stimuli

The experimental stimuli were computer-generated visual images of a post and roof beam detail of five timber joints for a pagoda-style structure (Figure 1). The experimental stimuli were created to understand better visual appearance’s contribution to determining aesthetic preference. Therefore, stimuli ranged from simple and straightforward (Joint 1) to intricate and highly decorative (Joint 5). All timber joints’ images were taken from the same viewpoint and in a similar setting for consistency. Although the setting and the viewpoint for all stimuli were controlled, other visual features which might affect participants’ responses were outside the experimental control. Furthermore, participants were not given any indication of performance or other product specifications.

3.4. Variables

Previous research confirms that visual appearance is a key component in product design and influences users’ product preference or choice in many ways [1,3,4,5]. Since the aim of this study is to examine if innovation plays a significant role in perceiving the aesthetic preference of a product more than other visual appearances, the overall aesthetic preference of the timber joints has been considered as the dependent variable, while ‘Joint appears innovative’ is the independent variable in this study. We incorporated several controls in our study to account for other factors that are likely to influence the result. Therefore, we added three visual properties of the timber joint (i.e., long-lasting, functional, and strong) as a controlled variable (Table 1).

3.5. Statistical Analysis

The major objective of data analysis in this study was to investigate whether innovation plays a significant role in perceiving the aesthetic preference of a product more than other visual appearances. The SPSS (Statistical Package for the Social Sciences) version 28 program was used for data analysis. Before commencing data analysis, data were checked for possible errors. Furthermore, all assumptions of the statistical method applied for this study were validated and met before any analysis. Due to the nature of the investigation, ‘standard multiple regression’ analysis was employed for this purpose, which can identify the most important explanatory variables and determine the relative importance of these variables.

4. Results

4.1. Description of the Sample

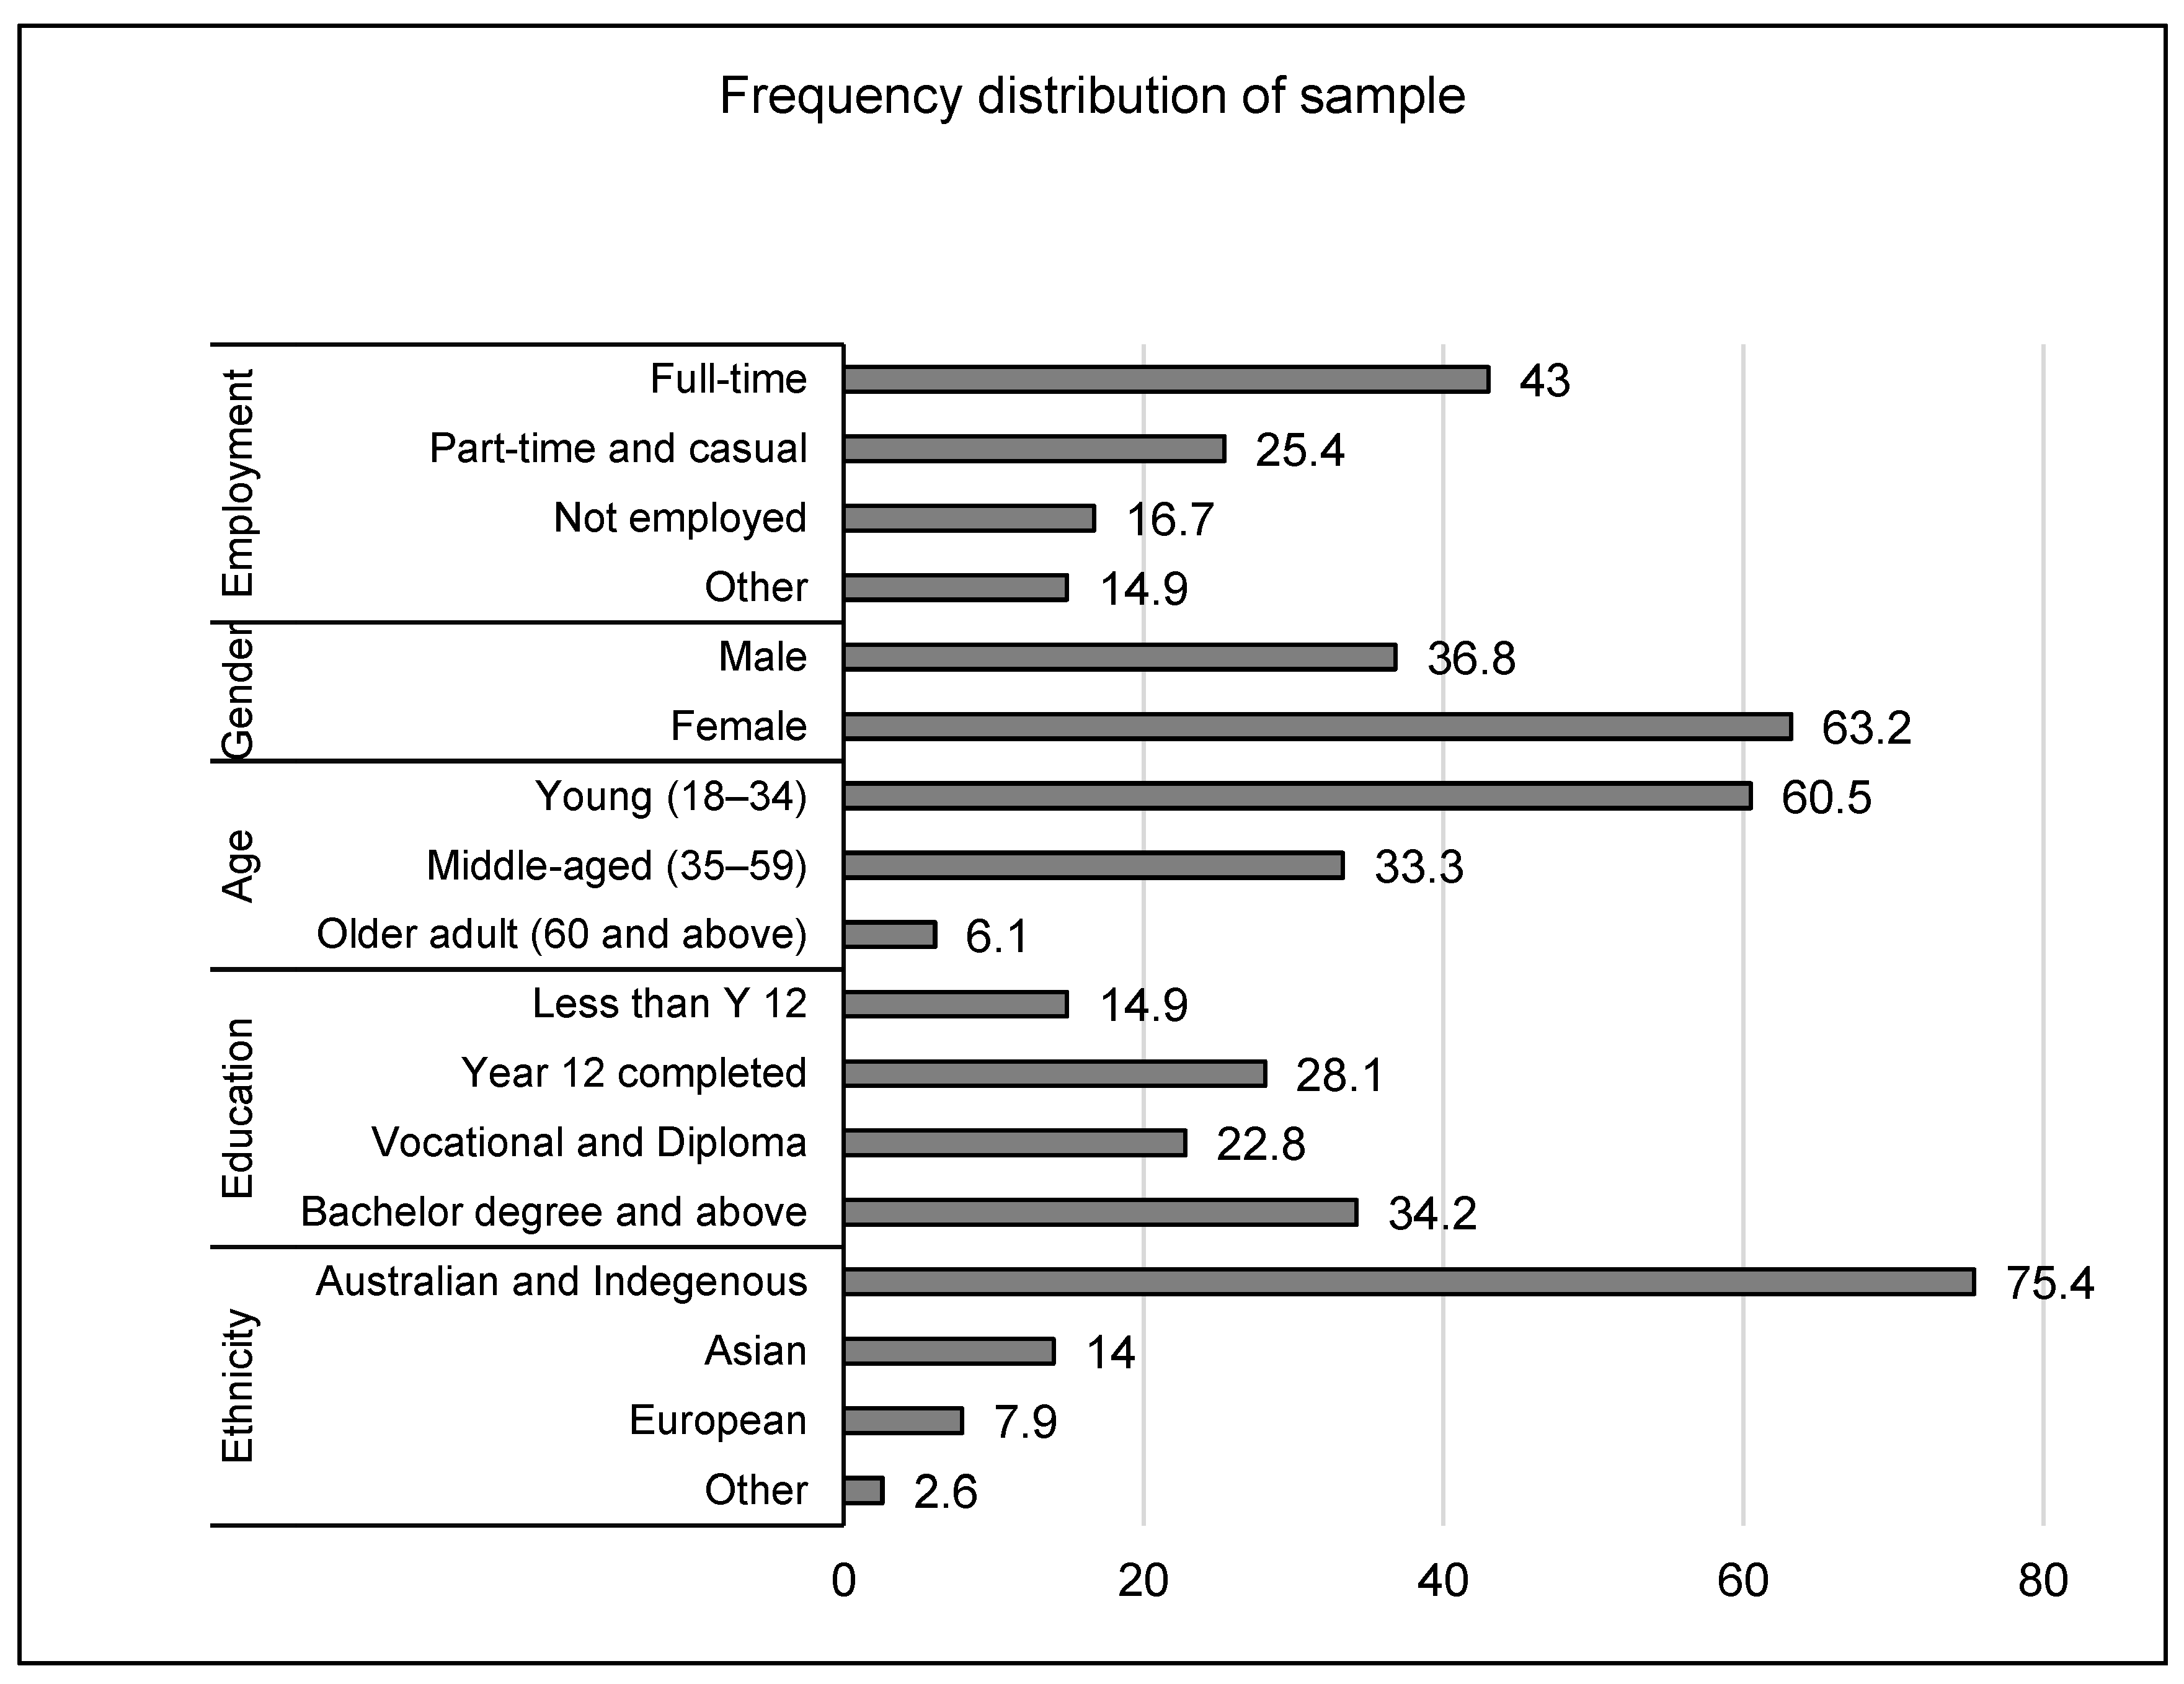
The sample’s most significant proportion was young females from Australian and indigenous backgrounds in full-time employment with a bachelor’s degree and above. The sample population does not indicate any dominant occupation category. This study provides a non-biased analysis of the general public, as this group will interact with the final product outcome. The following figure (Figure 2) shows the frequency distribution of the sample population in percentage.

4.2. Checking the Assumptions of Multiple Regression

Before analysis, the data were verified, assessing whether they were suitable for analysis concerning multicollinearity outliers, normality, linearity, and homoscedasticity.

4.2.1. Multicollinearity

The correlation between independent variables (i.e., the visual appearance of timber joints) with the dependent variable (i.e., overall aesthetic preference) was checked. The preferred bivariate correlation value between the independent and dependent variable is above 0.3 [41]. Collinearity diagnostics were also performed to check further multicollinearity that might not be evident in the correlation matrix. Two values were scrutinised at Tolerance and VIF (Variance inflation factor). The tolerance values for independent variables were above 0.10; the multicollinearity assumption was not violated. These were also supported by the VIF values, as all values are well below the cut-off of 10.

4.2.2. Outliers, Normality, Linearity, Homoscedasticity, Independent of Residuals

Assumptions about outliers, normality, linearity, homoscedasticity, and independent of residuals were verified by inspecting the normal P-P plot of the regression standardised residual and the scatter plot of standardised residuals. In the normal P-P plot, all points are laid in a reasonably straight diagonal line from bottom left to top right, suggesting that there is no major deviation from normality. Additionally, residuals are roughly rectangularly distributed in the scatter plot, with most of the scores concentrated along with the 0 points. The presence of an outlier was checked from the scatter plot (i.e., cases that had standardised residual of more than 3.3 or less than −3.3) and none were found. The presence of outliers was also checked by inspecting the Mahalanobis distance. According to reference [41], the critical value is 18.47 for four independent variables. Three cases above that value were observed, which were slightly above the critical value and hence retained. The maximum value for Cook’s distance was also verified to check whether these cases had an undue influence on the result of the model. The maximum value for the Cook’s distance was 0.084, suggesting that there was no major problem in the data as reference [42] recommended that a value above 1 would be a potential problem.

4.3. Model Evaluation

In this section, the evaluation of the regression model is discussed. There are five models developed from five stimuli (see Figure 1). Table 2 represents the model summary and statistical significance of all five models. The R square value of the models in Table 2 varies between 0.461 and 0.550. This implied that the models explained a minimum of 46% (Joint 1) and a maximum of 55% (Joint 2) of the variance in overall aesthetic preference. This is quite a respectable result. The statistical significance of the result was also assessed in Table 2. The F-ratio in the ANOVA tests whether the overall regression model is a good fit for the data. The table shows that the independent variables statistically significantly predict the dependent variable, F (4, 109) p = (0.001) < 0.05 (i.e., the regression model is a good fit for the data).

4.4. Variable Evaluation

The models were developed according to the types of timber joints (five in total), and each model was composed of four visual appearance components. Each component was evaluated to ascertain which of the variables contributed to the prediction of overall aesthetic preference. Table 3 illustrates information about the independent variable and how it affects the dependent variable.

4.5. Significance

The following independent variables have a statistically significant impact on the outcome variable (overall aesthetic preference) according to joint type:
Joint 1: The joint appears innovative
Joint 2: The joint appears innovative; the joint appears to be long-lasting
Joint 3: The joint appears innovative
Joint 4: The joint appears innovative; the joint appears functional
Joint 5: The joint appears innovative; the joint appears strong
It is evident from the above that “The joint appears innovative” has a statistically significant impact (p < 0.001) on overall aesthetic preference for all joint types.

4.6. Unstandardised Coefficients

Unstandardised coefficients (B) indicate how much the dependent variable varies with an independent variable when all other independent variables are held constant. Since ‘The joint appears innovative’ is statistically significant across all joint types, we look at its influence on overall aesthetic preference. Table 3 also indicates that if ‘The joint appears innovative’ index increases by a value of 1, we observe 0.347, 0.408, 0.347, 0.330, and 0.483 units increase on the dependent variable for Joint 1 to 5, respectively. So, the more a respondent perceives the timber joint to look innovative, the joint becomes more aesthetically pleasing and is hence preferred. Clearly, the effect of this independent variable is more pronounced on Joint 5. However, the ‘confidence interval’ for Joint 5 indicates that there is a 95 percent chance that the actual value of the unstandardised coefficient is between 0.291 and 0.675.

4.7. Standardised Coefficients

Table 3 illustrates the contribution of each independent variable included in the model contributed to the prediction of the dependent variable. The beta value in this table is the standardised coefficient. These values for each of the different variables have been converted to the same scale for comparison. Therefore, the higher the beta value, the stronger the unique contribution to explaining the dependent variable. For Joint 1, as seen in Table 3, ‘The joint appears innovative’ had the largest beta coefficient of 0.39. Therefore, ‘The joint appears innovative’ caused the strongest unique contribution to explaining ‘Overall aesthetic preference’ when all other variables in the model were controlled. This was followed by ‘The joint appears strong’ (0.21), ‘The joint appears long lasting’ (0.13), and ‘The joint appears functional’ (0.07) and made the least contribution to predicting overall aesthetic preference. From Table 3, Joints 2, 3, and 5 can be explained in the same fashion where ‘The joint appears innovative’ had the largest beta coefficient. However, for Joint 4, we see that ‘The joint appears functional’ had the largest beta coefficient (0.39), followed by ‘The joint appears innovative’ (0.31).
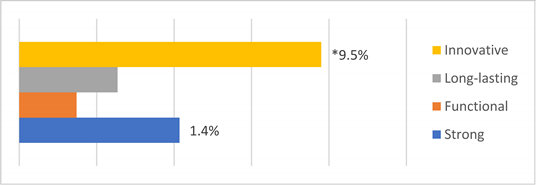
Further potential information generated from Table 3 is the part correlation coefficient. It shows how much of the total variance in the independent variable is uniquely explained by that variable, and how much R square would drop if it was not included in the model. For Joint 1, ‘The joint appears innovative’ had a part correlation value of 0.308. This value was squared and multiplied by 100 to ascertain the percentage of variance [41]. The new value came out as 9.48. This represented that the component uniquely explained 9.5% of the variance in overall aesthetic preference (Table 4). Table 4 also explains which of the variables included in the models contribute more to the prediction of overall aesthetic preference for other joints. For example, ‘The joint appears innovative’ makes the strongest unique contribution to explain the overall aesthetic preference for Joints 2, 3, and 5. It explains 6.4%, 9.5%, and 11.1% of the variance in overall aesthetic preference for Joints 2, 3, and 5, respectively. Joint 4 illustrates a slightly different scenario. ‘The joint appears functional’ makes the strongest unique contribution to explaining 5.6% of the variance in overall aesthetic preference. However, ‘The joint appears innovative’ trailed by just 1%. ‘The joint appears strong’ explained variance in overall aesthetic preference for Joints 1, 3, and 5. However, Joint 5 (2.1%) was only statistically significant. The only other statistically significant variable is ‘The joint appears to be long lasting’, which explained a 4.12% variance in overall aesthetic preference for Joint 2.
Table 3 also shows two exceptional cases where for Joint 2, a 1 unit increase in ‘The joint appears strong’ is associated with a 0.078 unit decrease in ‘overall aesthetic preference’ and Joint 5, a 1 unit increase in ‘The joint appear long-lasting’ is associated with a 0.031 unit decrease in ‘overall aesthetic preference’. However, both cases were statistically insignificant and omitted from further investigation.

5. Discussion

In this study, we examined whether innovation plays a significant role in perceiving the aesthetic preference of a product more than other visual appearances. Our findings suggest several theoretical and practical implications.

5.1. Theoretical Implications

5.1.1. Innovation and Aesthetic Preference

The results section shows that the independent variable significantly predicts the dependent variable (overall aesthetic preference). To further investigate whether a product’s aesthetic preference depends on its innovative appearance, we look at Table 4, which shows which of the variables incorporated in the models contributes more to predicting overall aesthetic preference. Except for Joint 4, innovation uniquely explained the highest percentage of the variance in overall aesthetic preference. Although Joint 4 was a bit exceptional, where ‘Functional’ took the lead, the difference was only by 1%.
We mentioned earlier reference [1] findings that a product’s visual properties are vital in determining product preference. In an innovation, the first thing users notice is the product’s visual appearance, i.e., aesthetics [43]. The effect of visual complexity was examined in several early studies [44,45]. A medium level of complexity (which all stimuli in this study fall into) was often preferable [27] due to the arousal potential resulting from visual stimulation. Since innovative appearance is a visual property, we contend that aesthetic preference depends on the innovative appearance of a product.

5.1.2. Innovation and Aesthetic Experience

The results section finds that ‘Joint appears innovative’ statistically impacts overall aesthetic preference for all joint types. Let us explore respondents’ aesthetic experiences when viewing the stimuli to record aesthetic preferences. Stimuli were shown chronologically. Therefore, respondents observe Joint 1 first and Joint 5 last. From the literature, we know that aesthetic experience occurs in response to a visual encounter with any type of object, scene, or event [26]. Reference [46] pointed out that when a user sees a product, one of the first responses is aesthetic perception, which is closely related to visual information. Hence, reference [47] argues that overall, it significantly impacts the perception of a product. During the observation, stimuli 1 appeared as something new for many respondents, and they rated Joint 1 as significantly innovative. Having this experience when they observed stimuli 2, which is almost similar to stimuli 1 except for the introduction of a small protrusion of timber beam, they scored a little low on innovation. The introduction of capital and elaborate rounded protrusion of stimuli 3 was a substantial departure from stimuli 2. As a result, respondents rated it as significantly innovative (even higher than stimuli 1). Respondents rated stimuli 4 low in terms of innovation due to the exact reason for stimuli 2. Stimuli 5 was significantly different from previous stimuli. The timber column took the shape of the Greek Corinthian order. As rated by the respondents, the flute on the shaft, volute, and acanthus leaf on the capital made it the most innovative (Table 3 and Table 4). According to reference [48], a product’s outer form can affect customer perceptions in quite a few ways, (i) by accentuating or concealing different factors of technology that are introduced by innovation, (ii) by providing visual cues for product interpretation, and (iii) by triggering sensory experiences, which influence cognition and emotion. Therefore, we argue that products perceived as innovative provide observers with initial cues that trigger various cognitive and emotional responses that underlie their assessment of aesthetic preference.

5.1.3. Aesthetics and functionality

Reference [8] pointed out that a product’s aesthetic value may relate to the pleasure of seeing the product without considering utility. The finding is in accordance with reference [6], who mentioned that a user might prefer a product entirely based on its ‘look’ as looking at something beautiful is satisfying. The functionality of Joint 4 uniquely explains the highest percent of the variance. The result is different from other joints. Although functionality reflects the users’ perceptions of a product’s ability to fulfil its purpose [49]. However, according to reference [50], aesthetics are significantly more important than functionality for product appreciation and observation, which is also supported by reference [51], which argues that visual appeal is more important than functionality. Since the variance difference between ‘innovation’ and ‘functional’ is only 1%, this deviation can be ignored and will not impact the overall empirical premise of the study.

5.2. Practical Implications

In practice, this can be used for designing and developing a new product that includes products from the architectural and building industry, where innovativeness is considered a condition for generating public preference that promotes product success. Notably, the study consents to new thoughts and debates on how innovation should be defined, evaluated, and construed, including product innovation’s role in professional practice and design-related research areas.

6. Conclusions

The research presented throughout this paper revealed that a product’s innovativeness strongly influences the visual appearance and aesthetic preference. The study also has some strengths. First, our samples were randomly selected across all of Australia, ensuring variability in the population. Second, our study investigated product innovation and aesthetic preference from a psychological perspective rather than market and user research. Third, our findings uniquely contribute to design research and design practice.
Reference [52] identified that there is a disconnect of belief on what is new and innovative between marketers and users. There may be a number of factors for this disengagement but what attracts a user to a new product is the visual aesthetic design [43]. Users increasingly value the visual aesthetics of product design [53,54]; however, there have been small attempts to ascertain how innovative visual aesthetics influence the perceptions of novelty and product assessments [43]. The visual appearance is critical to the product’s user response and success [3]. As we pointed out in the introduction section, that response to design involves a full array of human responses as the design’s sensory aspect is congruent with a product’s visual appearance [9]. As a result, the product’s visual appearance as perceived by the users is characteristically based on users’ cognitive and affective responses. The aesthetic properties of objects can activate a multifaceted combination of secondary emotional and cognitive responses, which according to Csikszentmihalyi and Robinson [55] (p. 18), is “the aesthetic experience”. So, a user may positively evaluate a product if product innovation prompts a positive emotional response through its aesthetic properties.
The survey of 114 respondents revealed that the joints’ innovativeness explained the highest percentage of variance in overall aesthetic preference. This displays that the visual complexity and appeal (aesthetics) tend to be more important than a product’s performance (functionality) upon first observation. Furthermore, the study shows a link between cognitive and emotional responses in their assessment of aesthetic preference. Therefore, we expect this study’s findings to offer new insight into the design process of new product development, not only in the architectural and building industry, but in a holistic context for architectural and product design in general.

7. Limitations and Future Research

This study highlights innovation as an important aspect of visual appearance to determine aesthetic preference among respondents living in Australia; however, it has several limitations which suggest useful guidance for future research. First, our study design means causality cannot be concluded. There could be source bias as both exposure and outcome measures are self-reported. We encourage future research to go further with larger sample sizes and use control and experimental groups to reduce bias and further extend our understanding. Second, the respondents could only respond to the selected visual appearance questions. No open-ended questions were included to give respondents an opportunity to include other aspects of their lives that contribute to aesthetic preference. Thus, we invite studies examining whether other aspects of life (e.g., sociodemographic characteristics) may influence aesthetic preference. Third, it is difficult to claim that the study represented the complete breadth and all types of constructs and variables as a predictor of aesthetic preference. Therefore, it is difficult to assess the generalisability of the findings to projects other than those in the sample without the benefit of further research that includes a comprehensive range of predictors of aesthetic preference.

Author Contributions

Conceptualisation, M.M.; methodology, M.M.; validation, M.M. and B.K.; formal analysis, M.M.; investigation, M.M., B.K. and S.N.S.; resources, M.M., B.K. and S.N.S.; writing—original draft preparation, M.M.; writing—review and editing, M.M., B.K. and S.N.S.; visualisation, B.K.; supervision, M.M. and B.K.; project administration, B.K.; funding acquisition, B.K. All authors have read and agreed to the published version of the manuscript.

Funding

This research received no external funding.

Institutional Review Board Statement

The study was conducted in accordance with the Declaration of Helsinki, and approved by Swinburne University of Technology Human Ethics Committee (Ref: R/2019/209, 18/09/2019) for studies involving humans.

Informed Consent Statement

Informed consent was obtained from all subjects involved in the study.

Data Availability Statement

The data presented in this study are available on request from the corresponding author. The data are not publicly available due to approved ethical restrictions.

Acknowledgments

The authors would like to thank Australian manufacturer Timberfy, who worked with the research team to manufacture the pagoda for one of Melbourne’s largest cemeteries. The authors would also like to thank the research participants for their time in completing the survey.

Conflicts of Interest

The authors declare no conflict of interest.

References

  1. Hekkert, P.; Leder, H. Product Aesthetics. In Product Experience; Schifferstein, H.N.J., Hekkert, P., Eds.; Elsevier: San Diego, CA, USA, 2008; pp. 259–285. [Google Scholar]
  2. Ceballos, L.M.; Hodges, N.; Watchravesringkan, K. Consumer preference and apparel products: Investigating the role of the Centrality of Visual Product Aesthetics concept. Int. J. Fash. Des. Technol. Educ. 2021, 14, 325–337. [Google Scholar] [CrossRef]
  3. Bloch, P.H. Seeking the ideal form: Product design and consumer response. J. Mark. 1995, 59, 16–29. [Google Scholar] [CrossRef] [Green Version]
  4. Garber, L., Jr.; Burke, R.R.; Jones, J.M. The Role of Package Color in Consumer Purchase Consideration and Choice; Marketing Science Institute: Cambridge, MA, USA, 2000. [Google Scholar]
  5. Veryzer, R.W., Jr. The Place of Product Design and Aesthetics in Consumer Research. In Advances in Consumer Research; Kardes, F.R., Provo, M.S., Eds.; UT: Association for Consumer Research NA: Seattle, WA, USA, 1995; Volume 22, pp. 614–645. [Google Scholar]
  6. Creusen, M.E.H.; Schoormans, J.P.L. The Different Roles of Product Appearance in Consumer Choice. J. Prod. Innov. Manag. 2005, 22, 63–81. [Google Scholar] [CrossRef]
  7. Bamossy, G.; Scammon, D.L.; Johnston, M. A Preliminary Investigation of the Reliability and Validity of an Aesthetic Judgment Test. In Advances in Consumer Research; Bagozzi, R.P., Tybout, A.M., Eds.; Association for Consumer Research: Ann Arbor, MI, USA, 1983; pp. 685–690. [Google Scholar]
  8. Holbrook, M.B. Some Preliminary Notes on Research in Consumer Esthetics. In NA-Advances in Consumer Research; Olson, J.C., Ed.; Association for Consumer Research: Ann Arbor, MI, USA, 1980; Volume 7, pp. 104–108. [Google Scholar]
  9. Crilly, N. Product Aesthetics: Representing Designer Intent and Consumer Response. Ph.D. Thesis, University of Cambridge, London, UK, 2005. Available online: https://dl.icdst.org/pdfs/files/52725a8fcd239b24698050ed22a5f343.pdf (accessed on 9 August 2022).
  10. Desmet, P.M.A.; Hekkert, P. Framework of product experience. Int. J. Des. 2007, 1, 57–66. [Google Scholar]
  11. Leder, H.; Nadal, M. Ten years of a model of aesthetic appreciation and aesthetic judgments: The aesthetic episode—Developments and challenges in empirical aesthetics. Br. J. Psychol. 2014, 105, 443–464. [Google Scholar] [CrossRef]
  12. Berlyne, D.E. Aesthetics and Psychobiology; Appleton-Century-Crofts: New York, NY, USA, 1971. [Google Scholar]
  13. Graf, L.K.M.; Landwehr, J.R. Aesthetic pleasure versus aesthetic interest: The two routes to aesthetic liking. Front. Psychol. 2017, 8, 1–15. [Google Scholar] [CrossRef] [Green Version]
  14. Reber, R.; Schwarz, N.; Winkielman, P. Processing fluency and aesthetic pleasure: Is beauty in the perceiver’s processing experience? Personal. Soc. Psychol. Rev. 2004, 8, 364–382. [Google Scholar] [CrossRef] [Green Version]
  15. Landwehr, J.R.; Labroo, A.A.; Herrmann, A. Gut liking for the ordinary: Incorporating design fluency improves automobile sales forecasts. Mark. Sci. 2011, 30, 416–429. [Google Scholar] [CrossRef]
  16. Hekkert, P.; Snelders, D.; van Wieringen, P.C. Most advanced, yet acceptable: Typicality and novelty as joint predictors of aesthetic preference in industrial design. Br. J. Psychol. 2003, 9, 111–124. [Google Scholar] [CrossRef] [Green Version]
  17. Godoe, H. Innovation theory, aesthetics, and science of the artificial after Herbert Simon. J. Knowl. Econ. 2012, 3, 372–388. [Google Scholar] [CrossRef]
  18. Leder, H.; Carbon, C.C. Dimensions in Appreciation of Car Interior Design. Appl. Cogn. Psychol. 2005, 19, 603–618. [Google Scholar] [CrossRef]
  19. Person, O.; Snelders, D. Initial Findings on Design and Product Category Expertise in Aesthetic Evaluation. In Proceedings of the 4th Nordic Design Research Conference, Helsinki, Finland, 29–31 May 2011; pp. 1–5. [Google Scholar]
  20. Creusen, M.E.H.; Snelders, D. Visual typicality and novelty as joint predictors of aesthetic preference: The influence of design expertise and product category interest. In E-European Advances in Consumer Research; Bradshaw, A., Hackley, C., Maclaran, P., Eds.; Association for Consumer Research: Duluth, MN, USA, 2011; Volume 9, pp. 528–529. [Google Scholar]
  21. Cheung, M.C.; Law, D.; Yip, J.; Wong, C. Emotional Responses to Visual Art and Commercial Stimuli: Implications for Creativity and Aesthetics. Front. Psychol. 2019, 10, 1–10. [Google Scholar] [CrossRef] [PubMed] [Green Version]
  22. Van Geert, E.; Wagemans, J. Order, Complexity, and Aesthetic Appreciation. Psychol. Aesthet. Creat. Arts 2020, 14, 1–20. [Google Scholar] [CrossRef] [Green Version]
  23. Luck, S.J.; Vogel, E. The capacity of visual working memory for features and conjunctions. Nature 1997, 309, 279–281. [Google Scholar] [CrossRef] [PubMed]
  24. Alvarez, G.A.; Cavanagh, P. The capacity of visual short term memory is set both by visual information load and by number of objects. Psychol. Sci. 2004, 15, 106–111. [Google Scholar] [CrossRef] [PubMed]
  25. Eng, H.Y.; Chen, D.; Jiang, Y. Visual working memory for simple and complex visual stimuli. Psychon. Bull. Rev. 2005, 12, 1127–1133. [Google Scholar] [CrossRef] [PubMed] [Green Version]
  26. Palmer, S.E.; Schloss, K.B.; Sammartino, J. Visual aesthetics and human preference. Annu. Rev. Psychol. 2013, 64, 77–107. [Google Scholar] [CrossRef] [Green Version]
  27. Leder, H.; Belke, B.; Oeberst, A.; Augustin, D. A model of aesthetic appreciation and aesthetic judgments. Br. J. Psychol. 2004, 95, 489–508. [Google Scholar] [CrossRef] [Green Version]
  28. Verhavert, S.; Wagemans, J.; Augustin, M.D. Beauty in the blink of an eye: The time course of aesthetic experiences. Br. J. Psychol. 2018, 109, 63–84. [Google Scholar] [CrossRef] [PubMed] [Green Version]
  29. Markovic, S. Components of aesthetic experience: Aesthetic fascination, aesthetic appraisal, and aesthetic emotion. I-Perception 2012, 3, 1–17. [Google Scholar] [CrossRef]
  30. Locher, P.J. The Aesthetic Experience with Visual Art at First Glance. In Investigations into the Phenomenology and the Ontology of the Work of Art; Springer: Cham, Switzerland, 2015; pp. 75–88. [Google Scholar] [CrossRef]
  31. Hekkert, P. Design aesthetics: Principles of pleasure in design. Psychol. Sci. 2006, 48, 157–172. [Google Scholar]
  32. Silvia, P.J.; Barona, C.M. Do People Prefer Curved Objects? Angularity, Expertise, and Aesthetic Preference. Empir. Stud. Arts 2009, 27, 25–42. [Google Scholar] [CrossRef]
  33. Bar, M.; Neta, M. Humans prefer curved visual objects. Psychol. Sci. 2006, 17, 645–648. [Google Scholar] [CrossRef]
  34. Silvera, D.H.; Josephs, R.A.; Giesler, R.B. Bigger Is Better: The Influence of Physical Size on Aesthetic Preference Judgments. J. Behav. Decis. Mak. 2002, 15, 189–202. [Google Scholar] [CrossRef]
  35. Mugge, R.; Schoormans, J.P.L. Product design and apparent usability. The influence of novelty in product appearance. Appl. Ergon. 2012, 43, 1081–1088. [Google Scholar] [CrossRef]
  36. Stoneman, P. Soft innovation: Changes in product aesthetics and aesthetic products. In Proceedings of the Royal Economic Society Annual Conference, Coventry, UK, 17–19 March 2008. [Google Scholar]
  37. OECD. The Measurement of Scientific and Technological Activities: Proposed Guidelines for Collecting and Interpreting Technological Innovation Data, 3rd ed.; Commission Eurostat: Paris, France, 2006. [Google Scholar]
  38. Postrel, V. The Substance of Style: How the Rise of Aesthetic Value Is Remaking Commerce, Culture, and Consciousness; HarperCollins: New York, NY, USA, 2004. [Google Scholar]
  39. Swan, K.S.; Kotabe, M.; Allred, B.B. Exploring Robust Design Capabilities: Their Role in Creating Global Products, and Their Relationship to Firm Performance. J. Prod. Innov. Manag. 2005, 22, 144–164. [Google Scholar] [CrossRef]
  40. Alcaide-Marzal, J.; Tortajada-Esparza, E. Innovation Assessment in Traditional Industries: A Proposal of Aesthetic Innovation Indicators. Scientometrics 2007, 72, 33–57. [Google Scholar] [CrossRef]
  41. Pallant, J. SPSS Survival Manual: A Step by Step Guide to Data Analysis Using SPSS, 3rd ed.; Allen & Unwin: Crows Nest, NSW, Australia, 2007. [Google Scholar]
  42. Tabachnick, B.G.; Fidell, L.S. Using Multivariate Statistics; Pearson Education: Boston, MA, USA, 2007. [Google Scholar]
  43. Goode, M.R.; Dahl, D.W.; Moreau, C.P. Innovation aesthetics: The relationship between category cues, categorisation certainty, and newness perceptions. J. Prod. Innov. Manag. 2013, 30, 192–208. [Google Scholar] [CrossRef]
  44. Berlyne, D.E. Studies in the New Experimental Aesthetics; Wiley: New York, NY, USA, 1974. [Google Scholar]
  45. Frith, C.D.; Nias, D.K.B. What determines aesthetic preferences? J. Gen. Psychol. 1974, 91, 163–173. [Google Scholar]
  46. Ulrich, K.T. Design: Creation of Artifacts in Society. 2011. Available online: https://ssrn.com/abstract=1951106 (accessed on 2 August 2022).
  47. Mata, M.P.; Ahmed-Kristensen, S.; Shea, K. Implementation of design rules for perception into a tool for three-dimensional shape generation using a shape grammar and a parametric model. J. Mech. Des. 2018, 141, 011101. [Google Scholar] [CrossRef] [Green Version]
  48. Rindova, V.; Petkova, A. When Is a New Thing a Good Thing? Technological Change, Product Form Design, and Perceptions of Value for Product Innovations. Organ. Sci. 2007, 18, 217–232. [Google Scholar] [CrossRef] [Green Version]
  49. Homburg, C.; Schwemmle, M.; Kuehnl, C. New product design: Concept, measurement, and consequences. J. Mark. 2015, 79, 41–56. [Google Scholar] [CrossRef]
  50. Haug, A. A framework for the experience of product aesthetics. Des. J. 2016, 19, 809–826. [Google Scholar] [CrossRef]
  51. Han, J.; Forbes, H.; Schaefer, D. An exploration of how creativity, functionality, and aesthetics are related in design. Res. Eng. Des. 2021, 32, 289–307. [Google Scholar] [CrossRef]
  52. Gourville, J.T. Eager sellers stony buyers: Understanding the psychology of new product adoption. Harv. Bus. Rev. 2006, 84, 98–106. [Google Scholar]
  53. Bloch, P.H.; Brunel, F.F.; Arnold, T.J. Individual differences in the centrality of visual product aesthetics: Concept and measurement. J. Consum. Res. 2003, 29, 551–565. [Google Scholar] [CrossRef] [Green Version]
  54. Page, C.; Herr, P.M. An investigation of the processes by which product design and brand strength interact to determine initial affect and quality judgments. J. Consum. Psychol. 2002, 12, 133–147. [Google Scholar] [CrossRef]
  55. Csikszentmihalyi, M.; Robinson, R.E. The Art of Seeing; J. Paul Getty Museum: Malibu, CA, USA, 1990. [Google Scholar]
Figure 1. Stimuli were shown to the respondents.
Buildings 13 00019 g001
Figure 2. Characteristics of the respondents: Gender, age, education, ethnicity, and employment.
Buildings 13 00019 g002
Table 1. Definition and description of all variables used in the study.
VariableDefinitionDescription
Overall aesthetic preference Dependent variableCognitive and affective response to timber joints
InnovativeIndependent variableThe joint appears novel and aesthetically preferred
Long-lastingControl variable
Visual properties of the stimuli (timber joints) in the study
Joint appears durable and will last for a long time
FunctionalJoint appears that it is designed to be practical and useful rather than purely attractive
StrongJoint appears that it is able to withstand force, pressure, and/or wear
Table 2. Summary (b) of the model predicting overall aesthetic preference and statistical significance of the models.
Model Summary bANOVA
JointVariance
Explained a
(R Square)
dfFSignificance
1 Buildings 13 00019 i00146.1%Regression423.31<0.001
Residual109
2 Buildings 13 00019 i00255.0%Regression433.35<0.001
Residual109
3 Buildings 13 00019 i00346.1%Regression423.31<0.001
Residual109
4 Buildings 13 00019 i00452.9%Regression430.57<0.001
Residual109
5 Buildings 13 00019 i00551.3%Regression428.68<0.001
Residual109
a Predictors: the joint appears appropriate for the overall structure, the joint looks difficult to manufacture, the joint appears to be long lasting, the joint appears innovative, the joint appears strong, the joint appears functional. b Dependent variable: overall aesthetic preference.
Table 3. Coefficients (a) of aesthetic preference of timber joints.
JointVisual AppearanceBBetaSigPart
1 Buildings 13 00019 i006Strong0.1870.2070.0950.118
Functional0.0710.0740.5470.042
Long-lasting0.1210.1270.2050.090
Innovative0.3470.390<0.0010.308
2 Buildings 13 00019 i007Strong−0.078-0.0700.588−0.035
Functional0.2870.2180.0710.117
Long-lasting0.4070.3250.0020.203
Innovative0.4080.363<0.0010.253
3 Buildings 13 00019 i008Strong0.1870.2070.0950.118
Functional0.0710.0740.5470.042
Long-lasting0.1210.1270.2050.090
Innovative0.3470.390<0.0010.308
4 Buildings 13 00019 i009Strong0.0000.0000.9980.000
Functional0.4330.392<0.0010.225
Long-lasting0.1190.1120.3720.059
Innovative0.3300.3050.0010.216
5 Buildings 13 00019 i010Strong0.2930.2630.0320.145
Functional0.1190.1040.3650.061
Long-lasting−0.031−0.0280.818−0.015
Innovative0.4830.469<0.0010.334
a Dependent variable: overall aesthetic preference.
Table 4. Percentage of variance explained by visual appearance components in overall aesthetic preference for the timber joints.
JointVisual Appearance (Standardised Beta Coefficients)
1 Buildings 13 00019 i011Buildings 13 00019 i012
2 Buildings 13 00019 i013Buildings 13 00019 i014
3 Buildings 13 00019 i015Buildings 13 00019 i016
4 Buildings 13 00019 i017Buildings 13 00019 i018
5 Buildings 13 00019 i019Buildings 13 00019 i020
* p < 0.001
Disclaimer/Publisher’s Note: The statements, opinions and data contained in all publications are solely those of the individual author(s) and contributor(s) and not of MDPI and/or the editor(s). MDPI and/or the editor(s) disclaim responsibility for any injury to people or property resulting from any ideas, methods, instructions or products referred to in the content.