Article

Analysis of Axial Compression Performance of Concrete Stub Column with CRB600H Stirrups

1
College of Water Conservancy Engineering, Tianjin Agricultural University, Tianjin 300384, China
2
School of Civil Engineering, Hebei University of Engineering, Handan 056038, China
3
School of Civil Engineering, Tianjin University, Tianjin 300072, China
4
School of Civil Engineering, Tianjin Chengjian University, Tianjin 300384, China
*
Author to whom correspondence should be addressed.
Buildings 2023, 13(1), 195; https://doi.org/10.3390/buildings13010195
Submission received: 5 December 2022 / Revised: 24 December 2022 / Accepted: 30 December 2022 / Published: 11 January 2023
(This article belongs to the Special Issue Advances in Steel Structures: Testing, Modelling and Design)

Abstract

:
The CRB600H reinforcement is a new type of cold-rolled ribbed steel bar, which has the advantages of green and low carbon, stable quality, saving precious metal resources and so on. In order to study the axial compression performance of short concrete columns with CRB600H stirrups, the finite element analysis model of high-strength reinforced concrete stub columns was established by using ABAQUS, and the accuracy of the finite element model was verified by literature experiments. The effects of stirrup construction (Type A, B and C), stirrup spacing and concrete strength on the axial compressive bearing capacity and ductility of concrete columns with CRB600H stirrups were analyzed and compared with HRB400 stirrups columns. The results showed that the peak bearing capacity of the specimens with CRB600H stirrups was similar to that with HRB400 stirrups, and the ductility of the specimens was improved with CRB600H stirrup. Compared with the type A stirrup and type C stirrup, the type B stirrup had the best concrete restraining effect, and the ductility and peak bearing capacity of the specimens were higher. With a decrease in the stirrup spacing, the ductility and peak bearing capacity of the specimens increased. With an increase in concrete strength, the peak bearing capacity increases, but the ductility decreases. Through parameter analysis, a formula for calculating the axial bearing capacity of 600 MPa high-strength stirrup concrete stub columns based on the effective confinement index (keλt) was proposed. It is suggested that the equivalent volume of a HRB400 stirrup can be replaced by a CRB600H stirrup in the actual project. At the same time, when the high-strength stirrup was used, the restraining effect of the stirrup on concrete should be considered in the calculation of the axial compression bearing capacity.

1. Introduction

The rational use of high-strength bars in buildings can reduce the concrete member size, increase the building’s usable area, make the structure design more flexible, and greatly reduce the steel congestion and construction costs [1]. In order to expand the scope of their application in high-strength reinforcement in practical projects, researchers have studied the mechanical properties of various high-strength reinforcement specimens.
In the early stage, many scholars carried out extensive research on high-strength stirrup-confined concrete (for example, Kent-Park [1], Sheikh-Uzumeri [2], Mander [3,4] and Madas [5]). Cusson-Paultre [6,7] and Razvi-Saatcioglu [8,9] have carried out a large number of axial compression tests on concrete columns confined by stirrups. Based on the analysis of the test data, the stress-strain curve model of concrete confined by high strength stirrups was proposed. In recent years, Shi et al. [10,11,12,13], through a large number of axial compression tests of high-strength concrete columns confined by high-strength spiral stirrups, systematically studied the effects of parameters such as yield strength and stirrup form on the axial compressive behavior of high-strength concrete columns confined by high-strength stirrups. Li et al. [14] studied the effects of the volume ratio of stirrups, yield strength of stirrups and concrete strength on the damage evolution of concrete confined by stirrups. The experimental results showed that the strength and ductility of concrete are improved by the appropriate arrangement of the stirrup confinement. Based on the experimental data, a plastic strain expression was obtained and a damage evolution equation for stirrup-confined concrete was proposed. Li et al. [15] carried out uniaxial compression tests of concrete specimens confined with circular stirrups, and studied the effects of the volume ratio of stirrups, yield strength of stirrups and concrete strength on the damage evolution of concrete confined by stirrups. A damage evolution equation for circular stirrup-confined concrete was proposed based on the experimental data. Li et al. [16,17,18] carried out axial compression tests on 10 RC columns with high-strength multiple-tied-spiral transverse reinforcements and 2 RC columns with conventional stirrups. Based on the test, a stress-strain model was proposed, which can better predict the experimental behavior of reinforced concrete columns confined by high-strength multiple-tied-spiral transverse reinforcement. A comparative experimental study was conducted on the axial compression behavior of 600 MPa reinforced concrete columns and 400 MPa reinforced concrete columns, and the axial compression behavior of reinforced concrete columns with different stirrup forms, stirrup ratio and reinforcement strength was analyzed. Sun et al. [19] tested the axial compression behavior of steel-reinforced concrete columns with welded stirrups (SRCC-WSs), and two traditional steel-reinforced concrete columns (SRCCs) were tested for comparison. The test results showed that the ultimate axial compression strength and ductility of a SRCC-WS was a little higher than that of a SRCC with the same overall steel ratio. A simplified design method for calculating the effective lateral confined pressure on the core concrete provided by the combined action of welded stirrups and steel reinforcement flanges was proposed. Hou et al. [20] tested the behavior of 32 high-strength concrete columns with high strength spirally confined under concentric compression. An analytical confinement model for high-strength concrete columns confined by high-strength spirals was proposed. Kamal Jaafar et al. [21] studied the axial compression test of reinforced concrete columns with a rectangular section and circular section, spiral stirrups or ordinary square stirrups. The test showed that the effect of concrete confined by spiral stirrups was superior, and the strain and strength of compression concrete were greatly improved. Liu et al. [22,23], in order to study the mechanical properties of concrete short columns with a five-spiral stirrup under axial compression, established a finite element model verified by tests. Through parameter analysis of the five-spiral stirrup, a calculation method for the axial compression bearing capacity of concrete short columns with a five-spiral stirrup was proposed. Chang et al. [24] designed 10 groups of ultra-high performance concrete short columns with different stirrup forms and stirrup spacing and 1 group of ultra-high performance concrete short columns without reinforcement to conduct axial compression bearing capacity tests, compared their failure processes and failure forms, and established a formula for calculating the axial compression bearing capacity of ultra-high-performance concrete confined by stirrups.
The HRB400 hot-rolled ribbed bar carries tension, compressive stress and an alternating load in the structure, and it is the most widely used steel in China’s construction industry. The CRB600H reinforcement is a kind of high-strength reinforcement developed in China in recent years which has high ductility after a cold rolling and heat treatment. The design value of the tensile strength of a CRB600H reinforcement is higher than that of a HRB400 reinforcement. At the same time, the production of CRB600H reinforcements can save alloy resources and energy, and the cost is low. It has broad application prospects for replacing the HRB400 reinforcement in the reinforcement of beams, column stirrups and shear walls [25]. At present, the research on the axial compression performance of CRB600H stirrup columns has not been carried out. Therefore, this paper uses ABAQUS software to establish a finite element analysis model on the basis of tests in the literature, and verifies the accuracy of the finite element analysis model through tests. At the same time, the axial compression performance of the CRB600H high-strength stirrup and HRB400 stirrup columns under different stirrup forms, concrete strengths and stirrup spacings were compared and analyzed. Based on the results of the parameter analysis, the bearing capacity formula of a 600 MPa high-strength stirrup concrete column was established, which provides reference for the application of the CRB600H reinforcement in engineering.

2. Finite Element Analysis Model of Stub Columns under Axial Compression

2.1. Constitutive Model of Concrete

The constitutive relation of concrete in this paper was selected as the plastic damage model of concrete in ABAQUS software, in which the user needs to manually input the uniaxial compression stress-strain relationship of concrete materials. The concrete stress-strain model in the finite element analysis model adopts the concrete stress-strain curve equation proposed by Mander [5], and the specific expression forms of the model are as follows:
σ = f ch x r r 1 + x r
x = ε ε ch
r = E c E c E sec
E sec = f ch ε ch
E c = 5000 f c
Due to the use of three-dimensional fine modeling method, the constraining effect of steel bar on concrete can be considered automatically, so, when defining materials, fch is the compressive strength of cylinder concrete, εch is the peak strain of concrete, taken as 0.002, Esec is the Secant modulus of concrete, and Ec is the elastic modulus of concrete.
The ABAQUS software can define the uniaxial tensile stress-strain relationship of concrete by inputting the stress-strain relationship. The tensile stress-strain model in Code for Design of Concrete Structures (GB50010-2010) [26] was adopted for the tensile constitutive curve of concrete in this paper. The formula is the following:
σ = 1 d t E c ε
d t = 1 ρ t 1.2 0.2 x 5 , x 1 1 ρ t α t x 1 1.7 + x , x > 1
ρ t = f t , r E c ε t , r
x = ε ε t , r
where αt is the parameter of the descending section of the curve; ft,r is the tensile strength; εt,r is the peak tensile strain; dt is the tensile damage coefficient. The values are calculated according to Code for Design of Concrete Structures (GB50010-2010).
In ABAQUS modeling, Poisson’s ratio of concrete μc = 0.2. The ABAQUS concrete plastic damage model also needs to set the values of such parameters as the dilation angle, eccentricity, fb0/fc0, K and visibility parameters, which are taken according to Table 1 below.

2.2. Constitutive Model of Steel

The stress-strain model of steel bar adopts elastic-plastic double diagonal model (Figure 1). The constitutive relationship of the model is calculated as shown in Formula (6):
σ s = E s ε s , ε s ε y f y + ε s ε y E s , ε y < ε s ε s , u
where εs is the strain of reinforcement in the whole process of tension and compression; εy, εs,u are the yield strain and ultimate strain of reinforcement when reaching the elastoplastic critical point; Es, Es are the elastic modulus of reinforcement and the elastic modulus of reinforcement at the stress strengthening stage, taking Es = 0.01Es; σs is the stress of reinforcement; fy is the yield stress of reinforcement. Poisson’s ratio of reinforcement in finite element analysis is taken as 0.3.

2.3. Verification of Finite Element Calculation Results

In this paper, the axial compression test of 9 reinforced concrete columns in the literature [18] were taken as reference. The nine square section concrete specimens are made in accordance with the Code for Design of concrete structures (GB50010-2010). The cross-section dimensions of the specimens are 350 mm × 350 mm, the height is 1000 mm, and the concrete protective layer is 25 mm. Considering the matching of concrete and steel bars, the concrete strength grade is C50 (fc = 30.7 MPa). The concrete material and steel bar of the designed specimens in the test were selected according to the actual engineering application. The experimental study on the mechanical properties of 600 MPa and 400 MPa reinforced members under axial compression under different stirrup forms and stirrup spacing, the specific parameters of the members and the experimental and finite element analysis results are shown in Table 2. Figure 2 shows the specimen size and cross-section reinforcement.
In this paper, ABAQUS/Standard was used as the general analysis module of post-processing, which can solve linear and nonlinear problems in a wide range of fields, including static analysis, dynamic analysis, and complex nonlinear coupled physical field analysis. Based on preliminary sensitivity studies, an extremely fine mesh of eight-node linear brick (C3D8R) 3D-stress solid elements was used for concrete, and the truss element was utilized for the longitudinal reinforcement and transverse reinforcement. The structured method was used to divide regular grids. Considering the calculation speed, result accuracy and component size of the finite element software, the element size was set to 50 mm in this paper, which ensures the accuracy of the model during finite element analysis, convergence and calculation speed. A reinforcement cage composed of longitudinal reinforcement and transverse reinforcement was embedded in the concrete, and the bond slip between steel and concrete was neglected. In order to consider the better convergence effect in model calculation, the reference point RP1 and RP2 were respectively established for the upper and lower ends of the model, and boundary conditions were set for the two reference points. The reinforced concrete column was loaded by applying vertical displacement to the top RP1 (Ux = Uz = URx = URy = URz = 0). The 10 mm displacement load was applied in 100 steps by defining the amplitude curve in the table. The amplitude of each step was 0.1 mm, which is close to the displacement loading process in the test. At the same time, the bottom reference point RP2 (Ux = Uy = Uz = URx = URy = URz = 0) was restricted to all displacements and rotations, so as to restrict it to a fixed form. The specific parameters of the specimens and the results of the test and finite element analysis are shown in Table 2. Figure 3 shows the finite element analysis model, and Figure 4 shows the comparison between the load-strain curve calculated by finite element simulation and the test.
It can be seen from Table 2 that the peak load ratio between test and finite element calculation is 0.94~1.03, and the average ratio is 0.99, indicating that the finite element simulation value is close to the test value, and the finite element simulation result has high reliability. In Figure 4, at the initial stage of loading, the finite element simulation curve basically coincides with the test curve, and the peak load is slightly different from the curve of the descending section. This is mainly because the finite element simulation conditions are more ideal than the test, ignoring the influence of factors such as bond slip between reinforcement and concrete. At the same time, the construction quality of the test specimen will also affect the bearing capacity curve of the specimen. Generally speaking, though, the finite element simulation results are in good agreement with the experimental results, which shows that the method of the 600 MPa grade high-strength reinforced concrete stub column model established in this paper was accurate.

3. Analysis of Axial Compression Performance of CRB600H Stirrup Concrete Stub Columns

The finite element analysis model verified by the test was used to further analyze the mechanical performance of concrete stub columns confined by CRB600H high-strength stirrups under axial compression. The material property parameters of the CRB600H reinforcement were detailed in the literature [27]. In the paper, 7 groups of 39 reinforced concrete stub columns with dimensions of 350 mm × 350 mm × 1000 mm were designed. The design parameters were concrete strength, stirrup strength, stirrup form and stirrup spacing. The concrete strength is 26.8~44.5 MPa; the diameter of the stirrups was 8 mm, and the types of stirrups were the HRB400 reinforcement and CRB600H reinforcement. The CRB600H reinforcement was used to replace the HRB400 steel bar with equal volume and equal strength; the stirrup volume ratio was 1.116%~4.466%; the stirrups were divided into three types, A, B and C, as shown in Figure 5. The detailed design parameters of the specimens are shown in Table 3.
Specimen groups 1, 2 and 3 mainly studied the influence of stirrup configuration (including stirrup form and stirrup strength) on the mechanical behavior of specimens. The differences of the axial compression properties of the CRB600H steel bars with equal volume and equal strength replacing the HRB400 bars under three kinds of stirrup forms were compared between group 1 and group 2 and group 3. Specimen groups 4, 5, 6 and 7 were used to analyze the influence of concrete strength (26.8~44.5 MPa) and stirrup spacing (30~120 mm).
The ductility coefficient μ was used to measure the deformation performance of the specimen, and the expression is shown in Equation (11). The calculation results of the ductility factor μ and peak bearing capacity of the members are shown in Table 2.
μ = Δ u / Δ y
where Δu is the limit displacement, and the corresponding displacement when the load drops to 85% of the peak value is taken; Δy is the yield displacement, which is determined by the energy method [28].

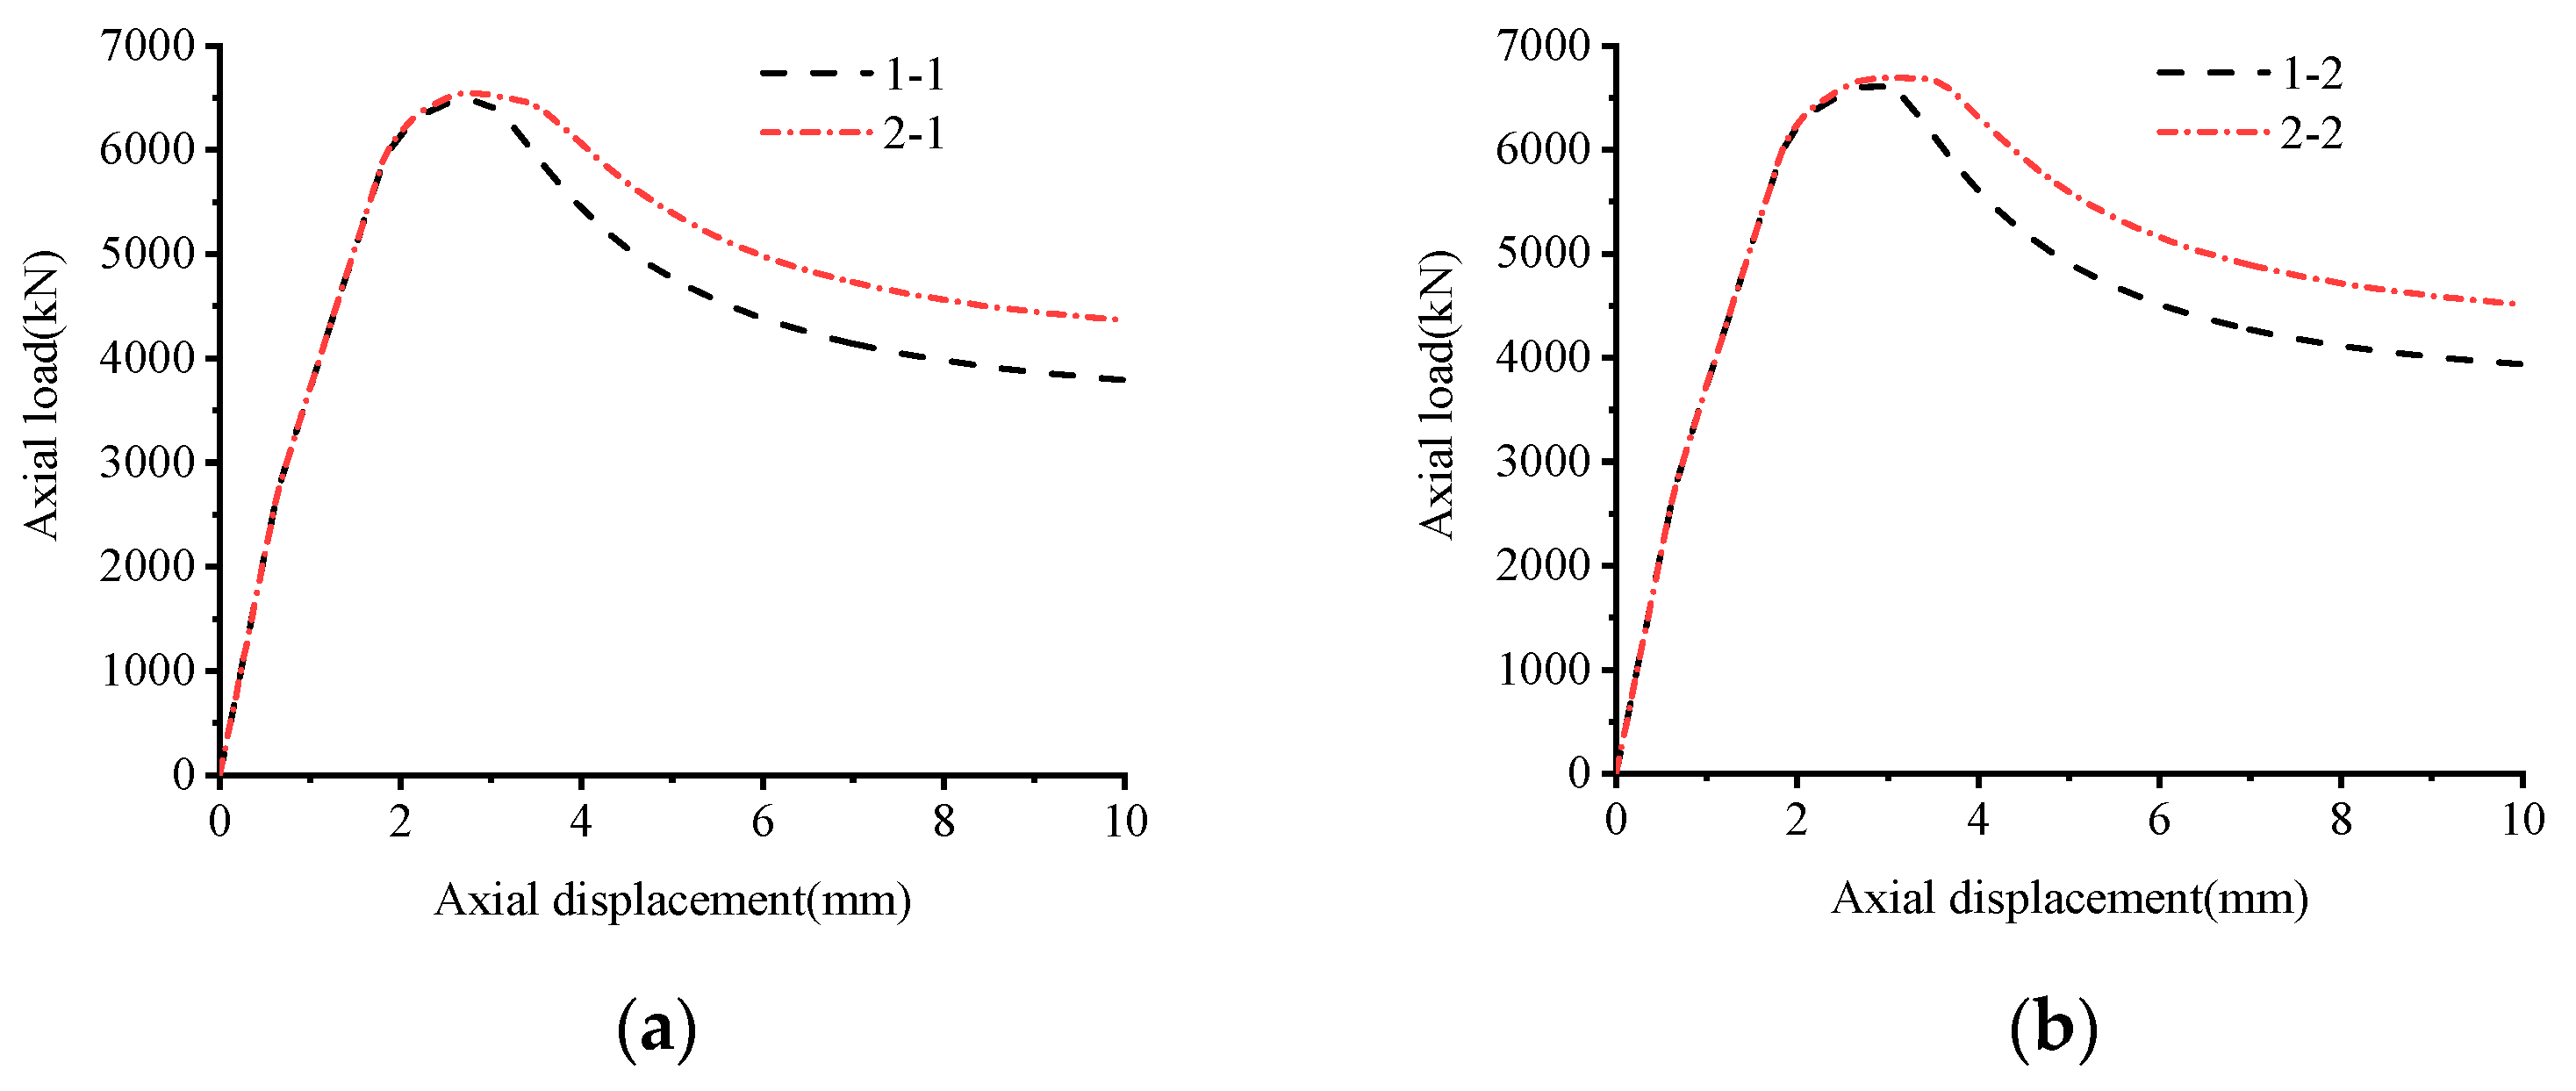
3.1. Effect of Stirrup Strength

3.1.1. Equal Volume Replacement of Stirrup

The influence of the volume substitution of the stirrups on the load-displacement curve of the specimens is shown in Figure 6a–c It can be seen from the diagram that there is little difference in the peak bearing capacity of concrete columns with CRB600H stirrups compared with those with HRB400 stirrups; this is due to the fact that the configured CRB600H stirrups fail to reach the yield strength when the specimen reaches the peak load. High-strength stirrups still have a certain amount of surplus, and cannot give full play to the restraining effect of high-strength stirrups, which can be used as a safety reserve to ensure good ductility of the confined concrete specimens before reaching the ultimate failure state. The effect of replacing the HRB400 reinforcement with the CRB600H reinforcement of equal volume on the ductility index of the specimen is shown in Figure 6d. The ductility of specimen 2-1 is 21.2% higher than that of specimen 1-1, the ductility of specimen 2-2 is 21.3% higher than that of specimen 1-2, and the ductility of specimen 2-3 is 10% higher than that of specimen 1-3. This shows that the configuration of CRB600H stirrups improves the constraint on the concrete in the core area compared with HRB400 stirrups, and improves the ductility of the specimen in the later period.

3.1.2. Equal Strength Replacement of Stirrup

Figure 7a–c compares the influence of the strength substitution of stirrups on the load-displacement curve. It can be seen from the figure that the peak load of a concrete column with CRB600H stirrups is slightly lower than that of one with HRB400 stirrups, and the peak load of specimen 3-2 with the largest difference is 3.1% lower than that of specimen 1-2. This is due to the strength substitution of stirrups, resulting in fewer stirrups for CRB600H reinforcement columns, and the restraining effect is reduced. The effect of replacing a HRB400 reinforcement with a CRB600H reinforcement of equal strength on the ductility index of the specimen is shown in Figure 7d. The ductility of specimen 3-1 is 15.9% higher than that of specimen 1-1, the ductility of specimen 3-2 is 17.6% higher than that of specimen 1-2, and the ductility of specimen 3-3 is 7.3% higher than that of specimen 1-3. This indicates that the strength of the CRB600H stirrup under peak load was fully exerted, and the deformation capacity of the specimen under peak load was improved.

3.2. Effect of Stirrup Construction

In order to study the influence of stirrup forms on the axial compression performance of the specimens, three stirrup constructions, including type A, type B and type C, were set as shown in Figure 5. The load-displacement curve of concrete restrained by stirrups is shown in Figure 8a,b. The peak load of specimen 2-2 is 2.1% and 7.8% higher than the peak load of specimen 2-1 and 2-3, and the peak load of specimen 3-2 is 1.5% and 6.1% higher than the peak load of specimens 3-2 and 3-3, indicating that stirrup type B with the same stirrup ratio has the best restraining effect on concrete, while stirrup type A takes second place, and stirrup type C has the worst restraining effect. The influence of the CRB600H reinforcement on the ductility index of the specimens under different stirrup forms is shown in Figure 8c, where the ductility index of specimen 2-2 is 1.3% and 14.6% higher than that of specimens 2-1 and 2-3, respectively. The ductility index of 3-2 is 2.7% and 13.9% higher than that of specimens 3-1 and 3-3, respectively.
It can be seen that stirrup type B has a better constraining effect on concrete and a better deformation capacity with the specimens than stirrup type A and stirrup type C. Therefore, the subsequent research of this paper mainly focuses on the axial compression performance analysis of stub columns with stirrup type B.

3.3. Effect of Stirrup Spacing

Under different stirrup spacings, the influence of the CRB600H stirrup on the load-displacement curve of the confined concrete column are shown in Figure 9a–d. It can be seen that the peak bearing capacity of the confined concrete column decreases significantly when the stirrup spacing increases from 30 mm to 120 mm. For example, when fc = 30.7 MPa, the stirrup spacing is 30~100 mm, compared with the stirrup spacing of 120mm, which increases the peak load by 1.52%, 5.52%, 8.93%, 11.39%, 17.86%, 28.15%, 45.93%, respectively. With the reduction in the stirrup spacing, the peak value of the confined concrete column still has a higher residual bearing capacity with the increase in displacement. Figure 9e,f compare the ductility index difference of different stirrup spacings configured with CRB600H stirrups when fc is 30.7 MPa and 38.5 MPa, respectively. It can be seen that, with the reduction in stirrup spacing, the ductility of the concrete columns restrained by stirrups continues to improve. Taking the CRB600H stirrup-restrained 38.5MPa concrete columns as an example, the ductility indexes of specimens 5-7, 5-6, 5-5, 5-4, 5-3, 5-2 and 5-1 are respectively increased by 52.52%, 40.75%, 26.10%, 18.01%, 12.97%, 9.12%, and 2.88%. This shows that reducing the stirrup spacing of CRB600H stirrups can significantly improve the peak load and deformation capacity of the specimens, and improve the deformation performance of the specimens.

3.4. Effect of Concrete Strength

The impact of CRB600H stirrups on the load-displacement curves of concrete specimens with different strengths are shown in Figure 10a–d. It can be seen that, with the increase in concrete strength, the peak load of the specimens continues to increase. For example, when the volume stirrup ratio is 2.679%, the peak load of specimens 4-3, 5-3, 6-3 is 7.0%, 17.2%, 26.5% higher than that of specimens 7-3, respectively. When the volume stirrup ratio is 1.34%, the peak loads of specimens 4-5, 5-7 and 6-7 are 12.1%, 30.2% and 45.2% higher than those of specimens 7-7, respectively. As shown in Figure 10e, the ductility index difference of specimens with different concrete strengths are compared under the volume stirrup ratios of 2.233% and 1.116%. When the volume stirrup ratio is 2.233%, the ductility indexes of members 7-4, 4-4 and 5-4 are 54.4%, 48.3% and 7.4% higher than those of specimens 6-4, respectively. When the volume stirrup ratio is 1.116%, the ductility indexes of specimens 7-8, 4-6 and 5-8 are 53.7%, 41.8% and 14.9% higher than those of members 6-8, respectively. This shows that, with the increase in concrete strength, the peak load of the concrete column confined by CRB600H stirrups can be increased, but the ductility of the specimen will decrease with the increase in concrete strength, reducing the deformation performance of the specimen.

4. Calculation Method of Bearing Capacity of Axial Compression Columns with High Strength Stirrups

4.1. Calculation of Bearing Capacity under Axial Compression

4.1.1. Code for Design of Concrete Structures (GB50010-2010) [26]

The formula for calculating the bearing capacity of axial compression is as follows:
N u , G = 0.9 φ f c A + f y A s
where φ is the stability coefficient of the reinforced concrete members, fc is the axial compressive strength of the concrete, A is the cross-sectional area of the columns, fy is the yield strength of longitudinal bars, and As is the cross-sectional area of all the longitudinal steel bars.

4.1.2. Code for Design of Concrete Structures in ACI [29]

The formula for calculating the bearing capacity of axial compression is as follows:
N u , A = 0.8 φ 0.85 f c A A s + f y A s
where φ is the strength reduction factor, f c is the compressive strength of the concrete cylinder, A is the cross-sectional area of the column, fy is the yield strength of the longitudinal reinforcement, and As is the cross-sectional area of all the longitudinal steel bars.

4.1.3. Theoretical Values of Axial Bearing Capacity

Considering that the axial bearing capacity of the reinforced concrete column is provided by the longitudinal reinforcement and concrete, the theoretical calculation formula of column axial compression bearing capacity is:
N u , c = f c A + f y A s
where fc is the axial compressive strength of the concrete, A is the cross-sectional area of the columns, f y is the yield strength of the longitudinal bars, and A s is the cross-sectional area of all the longitudinal reinforcements.

4.2. Improvement of Axial Compression Bearing Capacity Formula Considering Stirrup Effect

The theoretical calculation value of the bearing capacity of axial compression column Nu,c is shown in Table 4. From Table 4, it can be seen that the simulated value is larger than the theoretical value of axial compression column bearing capacity provided by concrete and longitudinal reinforcement, and the average value of the two is 1.36. The theoretical calculation of axial compression column bearing capacity is conservative, so it is necessary to consider the contribution of the stirrup restraining effect to the axial compression bearing capacity and modify the code formula.
When the column is under axial compression, the load it bears is mainly composed of three parts: longitudinal reinforcement, concrete cover and confined concrete. However, when bearing axial load, the concrete cover will peel off in advance, and the contribution to the bearing capacity of the member can be ignored. As the bearing capacity provided by concrete and longitudinal reinforcement is clear, this paper focuses on the contribution of stirrup restraint to the bearing capacity of the members. Subtracting the bearing capacity provided by the concrete and longitudinal reinforcement from the axial compression bearing capacity of each specimen is necessary to obtain the bearing capacity provided by the stirrups. In order to consider the influence of different parameters on the bearing capacity of each specimen, the bearing capacity lifting coefficient η is defined as follows:
η = N u N 0 N 0
N 0 = f c A cor + f y A s
where Nu is the peak bearing capacity of the specimen; N0 is the bearing capacity of concrete and longitudinal reinforcement; fc is the axial compressive strength of concrete; Acor is the sectional area of the core area of the column, taking the product of the clear distance inside the stirrups in both directions of the specimen; As is the sectional area of all longitudinal reinforcement; fy is the yield strength of longitudinal reinforcement.
From the analysis of the factors affecting the axial compression bearing capacity, it can be seen that the axial compression performance of concrete columns confined by stirrups is affected by the form of the stirrups, the strength of the materials, the spacing of the stirrups and other factors. In this paper, the characteristic value of stirrups (λt) and the effective constraint coefficient (ke) are introduced to evaluate the bearing capacity of CRB600H stirrups confined concrete columns, and this series of parameters are considered as the effective confinement index of stirrups (keλt). The expression of λt is shown in Equation (17), and the calculation method of ke adopts the constraint theory proposed by Mander [5], which is applicable to reinforced concrete columns with rectangular section, as shown in Equation (18).
λ t = ρ v f yv f c
where ρv is the volume ratio of stirrups, fyv is the yield strength of the stirrups, and fc is the axial compressive strength of the concrete.
k e = 1 i = 1 n w i 2 6 b c d c 1 s 2 b c 1 s 2 d c 1 ρ cc
where wi is the transverse clear distance between adjacent longitudinal bars; 𝑠′ is the clear distance between the stirrups; ρcc is the reinforcement ratio of the longitudinal reinforcement; bc and dc are the clear spacing of the stirrups in horizontal and vertical directions.
The lifting coefficient η of the bearing capacity is linearly fitted with the effective confinement index (keλt), and the results show that they have a linear distribution, as shown in Figure 11:
According to the relationship between the bearing capacity lifting coefficient η and the effective restraint coefficient of stirrups (keλt), the empirical reduction factor is introduced, according to (GB50010-2010). In this paper, the axial compression bearing capacity formula of 600 MPa high-strength stirrup concrete stub columns is proposed as follows:
N u = 0.9 f c A cor + f y A s 1.226 k e λ t + 1.477
The axial compression bearing capacity of the members calculated by the above formula is shown in Table 4. Among them, Nu,FE is the numerical simulation of the bearing capacity; Nu,c is the theoretical value of the bearing capacity of axial compression columns; Nu,G is based on the formula of GB50010-2010; Nu,A is based on the formula of American ACI code; Nu is the calculated value of the formula proposed in this paper.
It can be seen from Table 4 that the calculated value of GB50010-2010 is closer to the numerical simulation value than that of ACI code, but the overall calculation results of both are conservative and easy to cause material waste. This is because the formulas in GB50010-2010 and ACI code only consider the bearing capacity provided by longitudinal reinforcement and concrete, while ignoring the restraining effect of the stirrups on the concrete. The bearing capacity Nu, calculated by the formula proposed in this paper, is close to the simulated value, and the safety is taken into account. Not only the vertical compressive bearing capacity provided by concrete and longitudinal bars, but also the restraining effect of the stirrups on the concrete is considered, which is closer to the simulated value.
In order to further verify the formula in this paper, the formula proposed in this paper is compared with the test value of concrete column confined with 600 MPa stirrups in the literature [10]. The calculation results are shown in Table 5. From the calculation results of the formula, it can be concluded that the average value of the test value compared with the calculated value is 1.09, and the standard deviation is 0.04. Compared with the calculation results of the theoretical formula and the design code, the calculation results of the formula in this paper have a higher degree of agreement with the test values, and have a certain strength reserve and safety.

5. Results and Discussion

According to the research results of this paper, it is shown that, when CRB600H stirrups are used to replace HRB400 stirrups in equal volume, the peak bearing capacity of the members was similar, but the ductility of the specimens was improved by the CRB600H stirrups. When CRB600H stirrups replace HRB400 stirrups with equal strength, the peak bearing capacity of the member decreased slightly, but the ductility was higher. Compared with type A and type C stirrups, type B stirrups have a better restraining effect on concrete, and the bearing capacity and ductility of the specimens were better. The peak bearing capacity and ductility of the specimens with stirrup spacing increased from 30 mm to 120 mm decreased. With the increase in the strength of the CRB600H stirrup matched with concrete, the bearing capacity of the specimen was significantly improved, but the ductility of the specimen was reduced.
When HRB400 stirrups were replaced by CRB600H stirrups of equal volume, as the configured CRB600H stirrups fail to reach the yield strength when the specimens reach the peak load, the strength of the high-strength stirrups still has a certain margin, and the restraining effect of the high-strength stirrups was not fully exerted, which can be used as a safety reserve to ensure that the confined concrete specimens have good ductility before reaching the ultimate failure state. When HRB400 stirrups were replaced by CRB600H stirrups with equal strength, the number of CRB600h stirrups was less, and the high-strength stirrups fail to yield under peak load, which reduces the confinement effect of stirrups on concrete, so the peak bearing capacity of the specimen decreases slightly. Compared with type A and type C stirrups, type B stirrups divide the specimen section into smaller constraint areas, which is more efficient for concrete constraint, so its constraining effect was better and the mechanical performance of the specimen was better. The bearing capacity of reinforced concrete columns is provided by concrete and steel bar, so with the increase of concrete strength, the bearing capacity of specimens was improved, but the mechanical properties of high-strength concrete materials show obvious brittleness, less plasticity during compression and greater brittleness, resulting in a decrease in the ductility of the specimens.
According to the analysis of the factors influencing the axial compression bearing capacity, the axial compression performance of reinforced concrete columns is affected by the configuration of the stirrups and the concrete strength. This paper introduces the characteristic value of the stirrups (λt) and the effective restraint coefficient ke to quantitatively evaluate the bearing capacity of CRB600H stirrup-confined concrete columns. This series of parameters is uniformly considered as the effective restraining effect coefficient of the stirrups (keλt). Through parameter analysis, a formula for calculating the axial compressive bearing capacity of concrete columns with 600 MPa high-strength stirrups was proposed based on the effective restraining effect coefficient of stirrups (keλt).

6. Conclusions

In this paper, through the finite element simulation study of CRB600H high-strength stirrup concrete stub columns, using the finite element model verified by tests, the effects of stirrup form, concrete strength and stirrup spacing on the axial compression behavior of CRB600H stirrups columns were analyzed, and the following conclusions can be drawn:
(1)
With CRB600H stirrups and HRB400 stirrups, their peak bearing capacity is close to each other. The ductility of concrete columns with CRB600H stirrups is improved, and the deformation capacity is better after peak load.
(2)
Compared with A-type stirrups and C-type stirrups, B-type stirrups have the best restraining effect on concrete, the peak bearing capacity of the specimens is higher, the descending section of load-displacement curve is smoother, and they have better ductility.
(3)
With the decrease in stirrup spacing, the peak bearing capacity and ductility of specimens are higher; with the increase in concrete strength, the peak bearing capacity of the specimen is increased, but the ductility of the specimen is reduced.
(4)
Since the constraining effect of the stirrups on concrete in the core area is not considered in the existing code formula, based on the results of the parameter analysis, this paper proposes the effective confinement index (keλt). Compared with the numerical simulation and test results, the calculation formula proposed in this paper is more accurate than the existing code formula.

Author Contributions

Conceptualization, L.Z. and H.W.; software, Q.Z.; validation, L.Z., H.W. and Q.Z.; formal analysis, Q.Z.; investigation, L.Z. and Q.Z.; resources, L.Z. and H.W.; data curation, L.Z. and H.W.; writing—original draft preparation, Q.Z. and L.Z.; writing—review and editing, H.W. and L.Z.; visualization, Q.Z.; supervision, L.Z., J.L. and H.W.; project administration, L.Z. and J.L.; funding acquisition, L.Z. and H.W. All authors have read and agreed to the published version of the manuscript.

Funding

This research was funded by the National Natural Science Foundation of China (52178137); the Hebei Innovation Research Group Project (E2020402074), China; the Handan Science and Technology Special Plan Project (19422051008-29), China; and the Project of Tianjin Chengjian University (KHX2022-043), China.

Data Availability Statement

All data, models, and code generate or used during the study appear in the published article.

Acknowledgments

The authors appreciate for the supports by the National Natural Science Foundation of China; the National Natural Science Foundation of Hebei Province, China; the Handan Science and Technology Bureau, China: and the Tianjin Chengjian University, China.

Conflicts of Interest

The authors declare no conflict of interest.

References

  1. Wang, Y.; Tian, Q.; Lan, G.; Yao, S.; Zhang, J.; Liu, X. Experimental research on the mechanical properties of concrete column reinforced with 630MPa high-strength steel under large eccentric loading. J. Jilin Univ. Eng. Technol. Ed. 2022, 11, 2626–2635. [Google Scholar]
  2. Kent, D.C.; Park, R. Flexural members with confined concrete. J. Struct. Div. 1971, 97, 1969–1990. [Google Scholar] [CrossRef]
  3. Sheikh Shamim, A.; Uzumeri, S.M. Analytical model for concrete confinement in tied columns. J. Struct. Div. 1982, 108, 2703–2722. [Google Scholar] [CrossRef]
  4. Mander, J.B.; Priestley, M.J.N.; Park, R. Observed Stress-Strain Behavior of Confined Concrete. J. Struct. Eng. 1988, 114, 1827–1849. [Google Scholar] [CrossRef]
  5. Mander, J.B.; Priestley, M.J.N.; Park, R. Theoretical Stress-Strain Model for Confined Concrete. J. Struct. Eng. 1988, 114, 1804–1826. [Google Scholar] [CrossRef] [Green Version]
  6. Madas, P.; Elnashai, A.S. A new passive confinement model for the analysis of concrete structures subjected to cyclic and transient dynamic loading. Earthq. Eng. Struct. Dyn. 1992, 21, 409–431. [Google Scholar] [CrossRef]
  7. Cusson, D.; Paulter, P. High-strength concrete columns confined by rectangular ties. J. Struct. Eng. 1994, 120, 783–804. [Google Scholar] [CrossRef]
  8. Cusson, D.; Paulter, P. Stress-strain model for confined high-strength concrete. J. Struct. Eng. 1995, 121, 468–477. [Google Scholar] [CrossRef]
  9. Saatcioglu, M.; Razvi, S.R. High-Strength Concrete Columns with Square Sections under Concentric Compression. Eng. Struct. 1998, 124, 1438–1447. [Google Scholar] [CrossRef]
  10. Razvi, S.; Saatcioglu, M. Confinement Model for High-Strength Concrete. Eng. Struct. 1999, 125, 281–289. [Google Scholar] [CrossRef]
  11. Shi, Q.; Yang, K.; Liu, W.; Zhang, X.; Jiang, W. Experimental study on mechanical behavior of high strength concrete confined by high-strength stirrups under concentric loading. Eng. Mech. 2012, 29, 141–149. [Google Scholar]
  12. Shi, Q.; Wang, N.; Tian, Y.; Wang, P.; Li, K. Study on stress-strain relationship of high-strength concrete confined with high-strength stirrups under axial compression. J. Build. Struct. 2013, 34, 144–151. [Google Scholar]
  13. Yang, K.; Shi, Q.; Zhao, J. Study on the constitutive model of high-strength concrete confined by high-strength stirrups. China Civ. Eng. J. 2013, 46, 34–41. [Google Scholar]
  14. Li, H.; Teng, J.; Li, Z.; Wang, Y.; Zou, D. Experimental study of damage evolution in cuboid stirrup-confined concrete. Mater. Struct. 2015, 49, 2857–2870. [Google Scholar] [CrossRef]
  15. Li, Z.; Peng, Z.; Teng, J.; Wang, Y. Experimental Study of Damage Evolution in Circular Stirrup-Confined Concrete. Materials 2016, 9, 278. [Google Scholar] [CrossRef] [PubMed] [Green Version]
  16. Li, Y.; Cao, S.; Jing, D. Axial compressive behaviour of RC columns with high-strength MTS transverse reinforcement. Mag. Concr. Res. 2017, 69, 436–452. [Google Scholar] [CrossRef]
  17. Li, Y.; Cao, S.; Jing, D. Analytical compressive stress-strain model for concrete confined with high-strength multiple-tied-spiral transverse reinforcement. Struct. Des. Tall Spéc. Build. 2017, 27, e1416. [Google Scholar] [CrossRef]
  18. Li, Y. Experimental and Theoretical Research on Mechanical Behavior of RC Columns with 600MPa Reinforcing Bars. Ph.D. Thesis, Southeast University, Nanjing, China, 2019. [Google Scholar]
  19. Sun, L.; Ma, Q.; Han, F.; Liu, Z.; Li, J.; Wang, P.; Zhao, H.; Sun, J. Experimental investigation on axial compression behavior of steel reinforced concrete columns with welded stirrups. Eng. Struct. 2019, 208, 109924. [Google Scholar] [CrossRef]
  20. Hou, C.; Zheng, W.; Chang, W. Behaviour of high-strength concrete circular columns confined by high-strength spirals under concentric compression. J. Civ. Eng. Manag. 2020, 26, 564–578. [Google Scholar] [CrossRef]
  21. Jaafar, K.; Sikora, K. Analytical confinement model for square section confined with circular ties. Aust. J. Struct. Eng. 2020, 21, 218–233. [Google Scholar] [CrossRef]
  22. Liu, C.; Deng, Y.; Fang, D. Study on axial compression capacity of innovative five-spiral stirrup for rectangular short columns. J. Southwest Jiaotong Uni. 2022, 57, 1157–1164+1174. [Google Scholar]
  23. Liu, C.; Zhou, C. Research on the axial compression performances of five-spiral short circular columns. J. Railw. Eng. Soc. 2021, 38, 97–102. [Google Scholar]
  24. Chang, Y.; Shi, J.; Hou, Y.; Lu, T. Experimental study on the axial compression capacity of ultra-high performance concrete stub column confined with stirrups. Acta Mater. Compos. Sin. 2022, 39, 3451–3461. [Google Scholar]
  25. Liu, J.; Liu, L. Experimental study on influence of straightening and corrosion on CRB600H steel bars mechanical and anchorage performance. Build. Struct. 2021, 51, 56–62. [Google Scholar]
  26. Ministry of Housing and Urban-Rural Development of the People’s Republic of China. Code for Design of Concrete Structures GB 50010-2010; Ministry of Housing and Urban-Rural Development of the People’s Republic of China: Beijing, China, 2015. [Google Scholar]
  27. Liu, L. Experimental Research on Seismic Shear Behavior of Reinforced Concrete Columns with CRB600H High-Strength Stirrups. Ph.D. Thesis, Chongqing University, Chongqing, China, 2019. [Google Scholar]
  28. Bai, J.; Li, S.; Zhu, Y. Seismic performance of high strength concrete columns confined by welded hoop stirrups. J. Vib. Shock 2021, 40, 75–84. [Google Scholar]
  29. ACI (American Concrete Institute). Building Code Requirements for Structural Concrete ACI 318–319; ACI: Farmington Hills, MI, USA, 2019. [Google Scholar]
Figure 1. Constitutive analysis of steel bars.
Buildings 13 00195 g001
Figure 2. Specimen size and section reinforcement.
Buildings 13 00195 g002
Figure 3. Finite element analysis model.
Buildings 13 00195 g003
Figure 4. Comparison of test and simulation curves: (a) AC1; (b) AC2; (c) AC3; (d) AC4; (e) BC1; (f) BC2; (g) BC3; (h) BC4; (i) BC5.
Buildings 13 00195 g004aBuildings 13 00195 g004b
Figure 5. Cross-sectional details of specimen.
Buildings 13 00195 g005
Figure 6. Effect of equal volume replacement of stirrup: (a) stirrup type A; (b) stirrup type B; (c) stirrup type c; (d) ductility index.
Buildings 13 00195 g006aBuildings 13 00195 g006b
Figure 7. Effect of equal strength replacement of stirrup: (a) stirrup type A; (b) stirrup type B; (c) stirrup type c; (d) ductility index.
Buildings 13 00195 g007
Figure 8. Effect of stirrup constructions: (a) Group 2; (b) Group 3; (c) Ductility index.
Buildings 13 00195 g008
Figure 9. Effect of stirrup spacing: (a) fc = 26.8 MPa; (b) fc = 30.7 MPa; (c) fc = 38.5 MPa; (d) fc = 44.5 MPa; (e) ductility index (fc = 30.7 MPa); (f) ductility index (fc = 38.5 MPa).
Buildings 13 00195 g009
Figure 10. Effect of concrete strength: (a)ρv = 3.349%; (b) ρv = 2.679%; (c) ρv = 1.914%; (d) ρv = 1.340%; (e) ductility index.
Buildings 13 00195 g010
Figure 11. The relationship between the η and keλt.
Buildings 13 00195 g011
Table 1. Plastic damage model parameters of concrete.
Dilation AngleEccentricityfb0/fc0KVisibility Parameters
30°0.11.160.66670.005
Table 2. Specimen parameters and finite element analysis results.
ColumnsConcreteLongitudinal ReinforcementTransverse ReinforcementAxial Bearing Capacity
fc (MPa)fy (MPa)Diameter (mm)Typefyv (MPa)Diameter and SpacingNu,t (kN)Nu,FE (kN)Nu,t/Nu,FE
AC130.747920A4378@6066606474.481.03
BC130.747116B4378@7062286611.230.94
AC230.747920A6298@6063936497.950.98
BC230.747116B6298@7063896635.170.96
AC330.747920A6298@9062856182.261.02
BC330.747116B6298@10562836103.851.03
AC430.761516A6298@6060056224.460.96
BC430.761516B6298@10563356282.201.01
BC530.761516B6298@7067726926.310.98
Average value\0.99
Table 3. Specimen design parameters.
Specimen IDfc (MPa)Longitudinal ReinforcementTransverse ReinforcementPeak Bearing Capacity (kN)Ductility Index
fy (MPa)Diameter (mm)Typefyv (MPa)Diameter and SpacingStirrup Ratio (%)
1-130.747920A437Φ8@601.9066474.482.115
1-230.747116B437Φ8@701.9146611.232.140
1-330.747116C437Φ8@351.9146131.72.060
2-130.747920A590.67ΦRH8@601.9066473.982.563
2-230.747116B590.67ΦRH8@701.9146612.312.596
2-330.747116C590.67ΦRH8@351.9146132.172.266
3-130.747920A590.67ΦRH8@701.6346310.312.451
3-230.747116B590.67ΦRH8@801.6756404.922.517
3-330.747116C590.67ΦRH8@401.6756038.822.210
4-130.747116B590.67ΦRH8@304.4668858.093.295
4-230.747116B590.67ΦRH8@403.3497779.062.894
4-330.747116B590.67ΦRH8@502.6797154.012.820
4-430.747116B590.67ΦRH8@602.2336761.432.778
4-530.747116B590.67ΦRH8@1001.3406162.052.367
4-630.747116B590.67ΦRH8@1201.1166070.072.274
5-138.547116B590.67ΦRH8@304.4669071.362.811
5-238.547116B590.67ΦRH8@403.3498177.482.594
5-338.547116B590.67ΦRH8@502.6797835.482.324
5-438.547116B590.67ΦRH8@602.2337621.12.175
5-538.547116B590.67ΦRH8@701.9147466.682.082
5-638.547116B590.67ΦRH8@801.6757345.342.011
5-738.547116B590.67ΦRH8@1001.3407160.111.896
5-838.547116B590.67ΦRH8@1201.1167085.071.843
6-144.547116B590.67ΦRH8@304.4669273.212.568
6-244.547116B590.67ΦRH8@403.3498759.182.144
6-344.547116B590.67ΦRH8@502.6798462.21.979
6-444.547116B590.67ΦRH8@602.2338302.291.873
6-544.547116B590.67ΦRH8@701.9148200.821.784
6-644.547116B590.67ΦRH8@801.6758119.831.721
6-744.547116B590.67ΦRH8@1001.3407981.821.634
6-844.547116B590.67ΦRH8@1201.1167914.691.604
7-126.847116B590.67ΦRH8@304.4668438.373.535
7-226.847116B590.67ΦRH8@403.3497338.393.214
7-326.847116B590.67ΦRH8@502.6796688.032.987
7-426.847116B590.67ΦRH8@602.2336274.112.892
7-526.847116B590.67ΦRH8@701.9145980.362.861
7-626.847116B590.67ΦRH8@801.6755765.342.832
7-726.847116B590.67ΦRH8@1001.3405497.302.618
7-826.847116B590.67ΦRH8@1201.1165410.482.466
ΦRH represents CRB600H reinforcement, Φ represents HRB400 reinforcement.
Table 4. Comparison of axial compression capacity.
SpecimenNu,FE (kN)Nu,c (kN)Nu,G (kN)Nu,A (kN)Nu (kN)Nu,FE/Nu,cNu,FE/Nu,GNu,FE/Nu,ANu,FE/Nu
2-16473.984964.004467.604017.895905.221.301.451.611.10
2-26612.314896.584406.923966.515847.051.351.501.671.13
2-36132.174896.584406.923966.515991.931.251.391.551.02
3-16310.314964.004467.604017.895728.151.271.411.571.10
3-26404.924896.584406.923966.515681.791.311.451.611.13
3-36038.824896.584406.923966.515824.681.231.371.521.04
4-18858.094896.584406.923966.517629.071.812.012.231.16
4-27779.064896.584406.923966.516847.321.591.771.961.14
4-37154.014896.584406.923966.516379.151.461.621.801.12
4-46761.434896.584406.923966.516068.391.381.531.701.11
4-56162.054896.584406.923966.515451.831.261.401.551.13
4-66070.074896.584406.923966.515300.011.241.381.531.15
5-19071.365852.085266.874779.358285.271.551.721.901.09
5-28177.485852.085266.874779.357553.321.401.551.711.08
5-37835.485852.085266.874779.357114.981.341.491.641.10
5-47621.15852.085266.874779.356824.021.301.451.591.12
5-57466.685852.085266.874779.356616.771.281.421.561.13
5-67345.345852.085266.874779.356462.051.261.391.541.14
5-77160.115852.085266.874779.356246.731.221.361.501.15
5-87085.075852.085266.874779.356104.59 1.211.351.481.16
6-19273.216587.085928.375424.478833.001.411.561.711.05
6-28759.186587.085928.375424.478127.491.331.481.611.08
6-38462.26587.085928.375424.477704.981.281.431.561.10
6-48302.296587.085928.375424.477424.521.261.401.531.12
6-58200.826587.085928.375424.477224.761.241.381.511.14
6-68119.836587.085928.375424.477075.621.231.371.501.15
6-77981.826587.085928.375424.476868.081.211.351.471.16
6-87914.696587.085928.375424.476731.071.201.341.461.18
7-18438.374418.833976.943489.127340.291.912.122.421.15
7-27338.394418.833976.943489.126522.761.661.852.101.13
7-36688.034418.833976.943489.126033.461.511.681.921.11
7-46274.114418.833976.943489.125708.201.421.581.801.10
7-55980.364418.833976.943489.125476.721.351.501.711.09
7-65765.344418.833976.943489.125303.901.301.451.651.09
7-75497.304418.833976.943489.125063.411.241.381.581.09
7-85410.484418.833976.943489.124904.651.221.361.551.10
Mean value\\\\\1.361.511.681.11
SD\\\\\0.170.190.220.03
SD represents standard deviation.
Table 5. Comparison of axial compression capacity.
SpecimenNu,t (kN)Nu,c (kN)Nu,G (kN)Nu,A (kN)Nu (kN)Nu,t/Nu,cNu,t/Nu,GNu,t/Nu,ANu,t/Nu
AC263934964.004467.604017.895971.021.291.431.591.07
BC263894896.584406.923966.515914.881.301.451.611.08
AC362854964.004467.604017.895532.171.271.411.561.14
BC362834896.584406.923966.515447.591.281.431.581.15
AC460054749.474274.533869.295588.181.261.401.551.07
BC463355243.834719.454244.315971.321.211.341.491.06
BC567725243.834719.454244.316483.551.291.431.601.04
Average value\\\\\1.271.411.571.09
Standard deviation\\\\\0.030.030.040.04
Nu,t is the test value.
Disclaimer/Publisher’s Note: The statements, opinions and data contained in all publications are solely those of the individual author(s) and contributor(s) and not of MDPI and/or the editor(s). MDPI and/or the editor(s) disclaim responsibility for any injury to people or property resulting from any ideas, methods, instructions or products referred to in the content.

