Article

Influence of the Vertical Component of Yangbi Ground Motion on the Dynamic Response of RC Frame and Brick-Concrete Structure

1
College of Environmental Science and Engineering, Donghua University, Shanghai 201620, China
2
School of Civil Engineering, Guangzhou University, Guangzhou 510006, China
3
School of Civil Engineering, Harbin Institute of Technology, Harbin 150090, China
4
Institute of Geophysics, China Earthquake Administration, Beijing 100094, China
*
Authors to whom correspondence should be addressed.
Buildings 2023, 13(1), 147; https://doi.org/10.3390/buildings13010147
Submission received: 7 December 2022 / Revised: 30 December 2022 / Accepted: 3 January 2023 / Published: 6 January 2023
(This article belongs to the Special Issue Advanced Studies of Risk Resistant Building Structures)

Abstract

:
An earthquake of magnitude 6.4 occurred in Yangbi County, Yunnan Province on 21 May 2021, with a focal depth of 8 km, and strong ground motion with vertical components was monitored by Yangbi station (53YBX). A total of 14,122 houses were damaged in Yangbi in the earthquake, and 232 of them collapsed. Vertical components of ground motions have been gained more attention for its effect on structure’s seismic response in epicenter or near-fault regions at present. Taking the three earthquake ground motions of Yangbi, Chi-Chi, and Loma Prieta as inputs, and modeling based on Perform-3D, this research carried out the seismic dynamic time history analysis of an RC (reinforced concrete) frame structure and a brick-concrete structure under both horizontal and vertical working conditions. The results showed that vertical components of the three ground motions had no evident impact on the top horizontal displacement and acceleration of the two types of structures. Among the three ground motions, the vertical component of Yangbi ground motion has largely influenced the top vertical displacement, acceleration, and axial force of the frame column bottom (or masonry wall bottom). The vertical component had different amplification effects on the axial pressure and the bending moment of a single column at the bottom of the RC frame structure, thus causing resonance amplification effect of the brick-concrete structure floors and amplifying the vertical acceleration of the top floor. In addition, it considerably increase the maximum axial tensile strain of masonry walls and the possibility of faster tensile failure of the brick-concrete structure. Influence of vertical ground motion on the bearing capacity of RC frame structure’s columns and the brick-concrete structure’s masonry walls should not be ignored. The results of the research may provide a reference for the earthquake-resistant design of building structures, especially the earthquake-resistant design considering the vertical seismic effect.

1. Introduction

Earthquakes are multidimensional in nature [1,2]. Ground motion is mostly presented as a multidirectional complex of horizontal and vertical vibrations [3]. It would be incomplete and inaccurate to consider only the impact of horizontal ground motion on building structures [4]. The severe damage of many strong earthquakes in the past shows that the vertical seismic effect cannot be ignored. For example, in the 1994 Northridge earthquake [5], the 1995 Kobe earthquake [6], and the 1999 Chi-Chi earthquake [7] in Taiwan, China, many building structural damages were caused by strong vertical ground shock [8]. It has been found that vertical ground motion effect is apparent in high-intensity areas [9], especially in epicenter or near-fault regions [10]. The vertical ground motion affects the response of long-span spatial structures, bridge structures, and super-high-rise structures [11,12,13]. Additionally, it causes a significant reaction to general regular frame structures in the vertical direction [14]. The occurrence of horizontal seismic ground motion and its associated effects on structural systems have been extensively studied over the last few years [15,16]. In contrast, more research is thought to be needed on the vertical component of ground motion. Therefore, it is necessary to consider the influence of multidimensional ground motion, especially vertical ground motion, on the seismic response of structures [17]. Some research has been carried out in this area. Bas et al. [18] investigated the effects of the vertical component of ground motions on existing multi-storey RC buildings. The authors found that the building’s overturning moments and basement axial forces increased significantly under vertical seismic motions. Rinaldin et al. [19] measured the lateral resistance of masonry piers to investigate the effect of the vertical component in a seismic event. The authors experimentally observed a general increase in the demand/capacity ratio. This suggests that the vertical component of the earthquake has the fundamental importance. Wang et al. [20] Indicated that the vertical component of the ground motion has a non-negligible impact on the over-strength coefficient of masonry-infilled RC frame structures. This finding has important implications for the study of vertical ground shaking. Some scholars have found that vertical ground motions may even significantly exceed local horizontal ones [21].In the meantime, RC and brick structures are widely used throughout the world [22,23]. Besides, RC frameworks are widely used in structural systems in engineering practice [24].Therefore, we focus our study on the effect of vertical component of ground shaking on the dynamic response of RC frame and brick structures.
According to the measurement of the China Earthquake Networks Center, at 21:48:34 on 21 May 2021, an earthquake of magnitude 6.4 occurred in Yangbi County, Dali Prefecture, Yunnan Province (25.67° N, 99.87° E), with a focal depth of 8 km [25]. In this earthquake, 28 groups of three-direction acceleration waveforms were obtained by a Chinese digital network of observation of strong ground motion [26], of which the ground motion amplitude waveform by Yangbi station(53YBX) is the largest [27]. The Yangbi station is located at the in the epicenter area, and the ratio of the peak acceleration of the vertical component to the horizontal component in its strong motion waveforms is PGAV/PGAH = 0.62. Therefore, the strong motion waveforms of Yangbi station showed strong vertical ground motion effect. A total of 14,122 buildings were damaged in Yangbi in the earthquake, and 232 of them collapsed. Most of the houses in Yangbi are brick structures and masonry-timber structures, a small number of them are reinforced concrete structures, and most of the collapsed buildings are distributed in a radius of 5 km from the epicenter. Therefore, in view of the structural damage and collapse caused by this earthquake, it is urgent to carry out seismic response analysis to reveal the effect of vertical ground motion on the typical building structures. The analysis results can be used in the post-earthquake damage assessment of this area.
Based on the structural characteristics of the buildings in Yangbi area, this article uses a 5-storey reinforced concrete (RC) frame structure and a 2-storey brick-concrete structure for seismic dynamic time history analysis. Two working conditions are defined: horizontal two-component seismic action (expressed in H) and horizontal two-component plus vertical component seismic action (described in H + V). By comparing the structural dynamic response of three groups of ground motion under the two working conditions, our research explores the the influence of the vertical component of Yangbi ground motion on the seismic dynamic response of two types of structures. Apart from this, another two groups of different types of ground motion under the same site category are also taken for comparative analysis with Yangbi ground motion according to the velocity pulse and the distance from the epicenter.

2. Ground Motion Waveform Information

In the following analysis, different ground motions will be selected on two premises: the velocity pulse as well as the near-field and far-field ground motion. According to a simplified identification method, the epicentral distance D < 20 km and PGV (peak ground velocity)/PGA (peak ground acceleration) < 0.2, the ground motion of Yangbi could be identified as non-pulse near-field motion [28]. Meanwhile, according to D < 20 km and PGV/PGA > 0.2, a near-field motion waveform containing the velocity pulse of the Chi-Chi earthquake in Taiwan of China is selected from the PEER NGA seismic database [29], while another ordinary far-field motion waveform of the Loma Ptieta earthquake [30] in the United States is chosen according to D > 20 km and PGV/PGA < 0.2. These three groups of different types of ground motion are analyzed as follows.

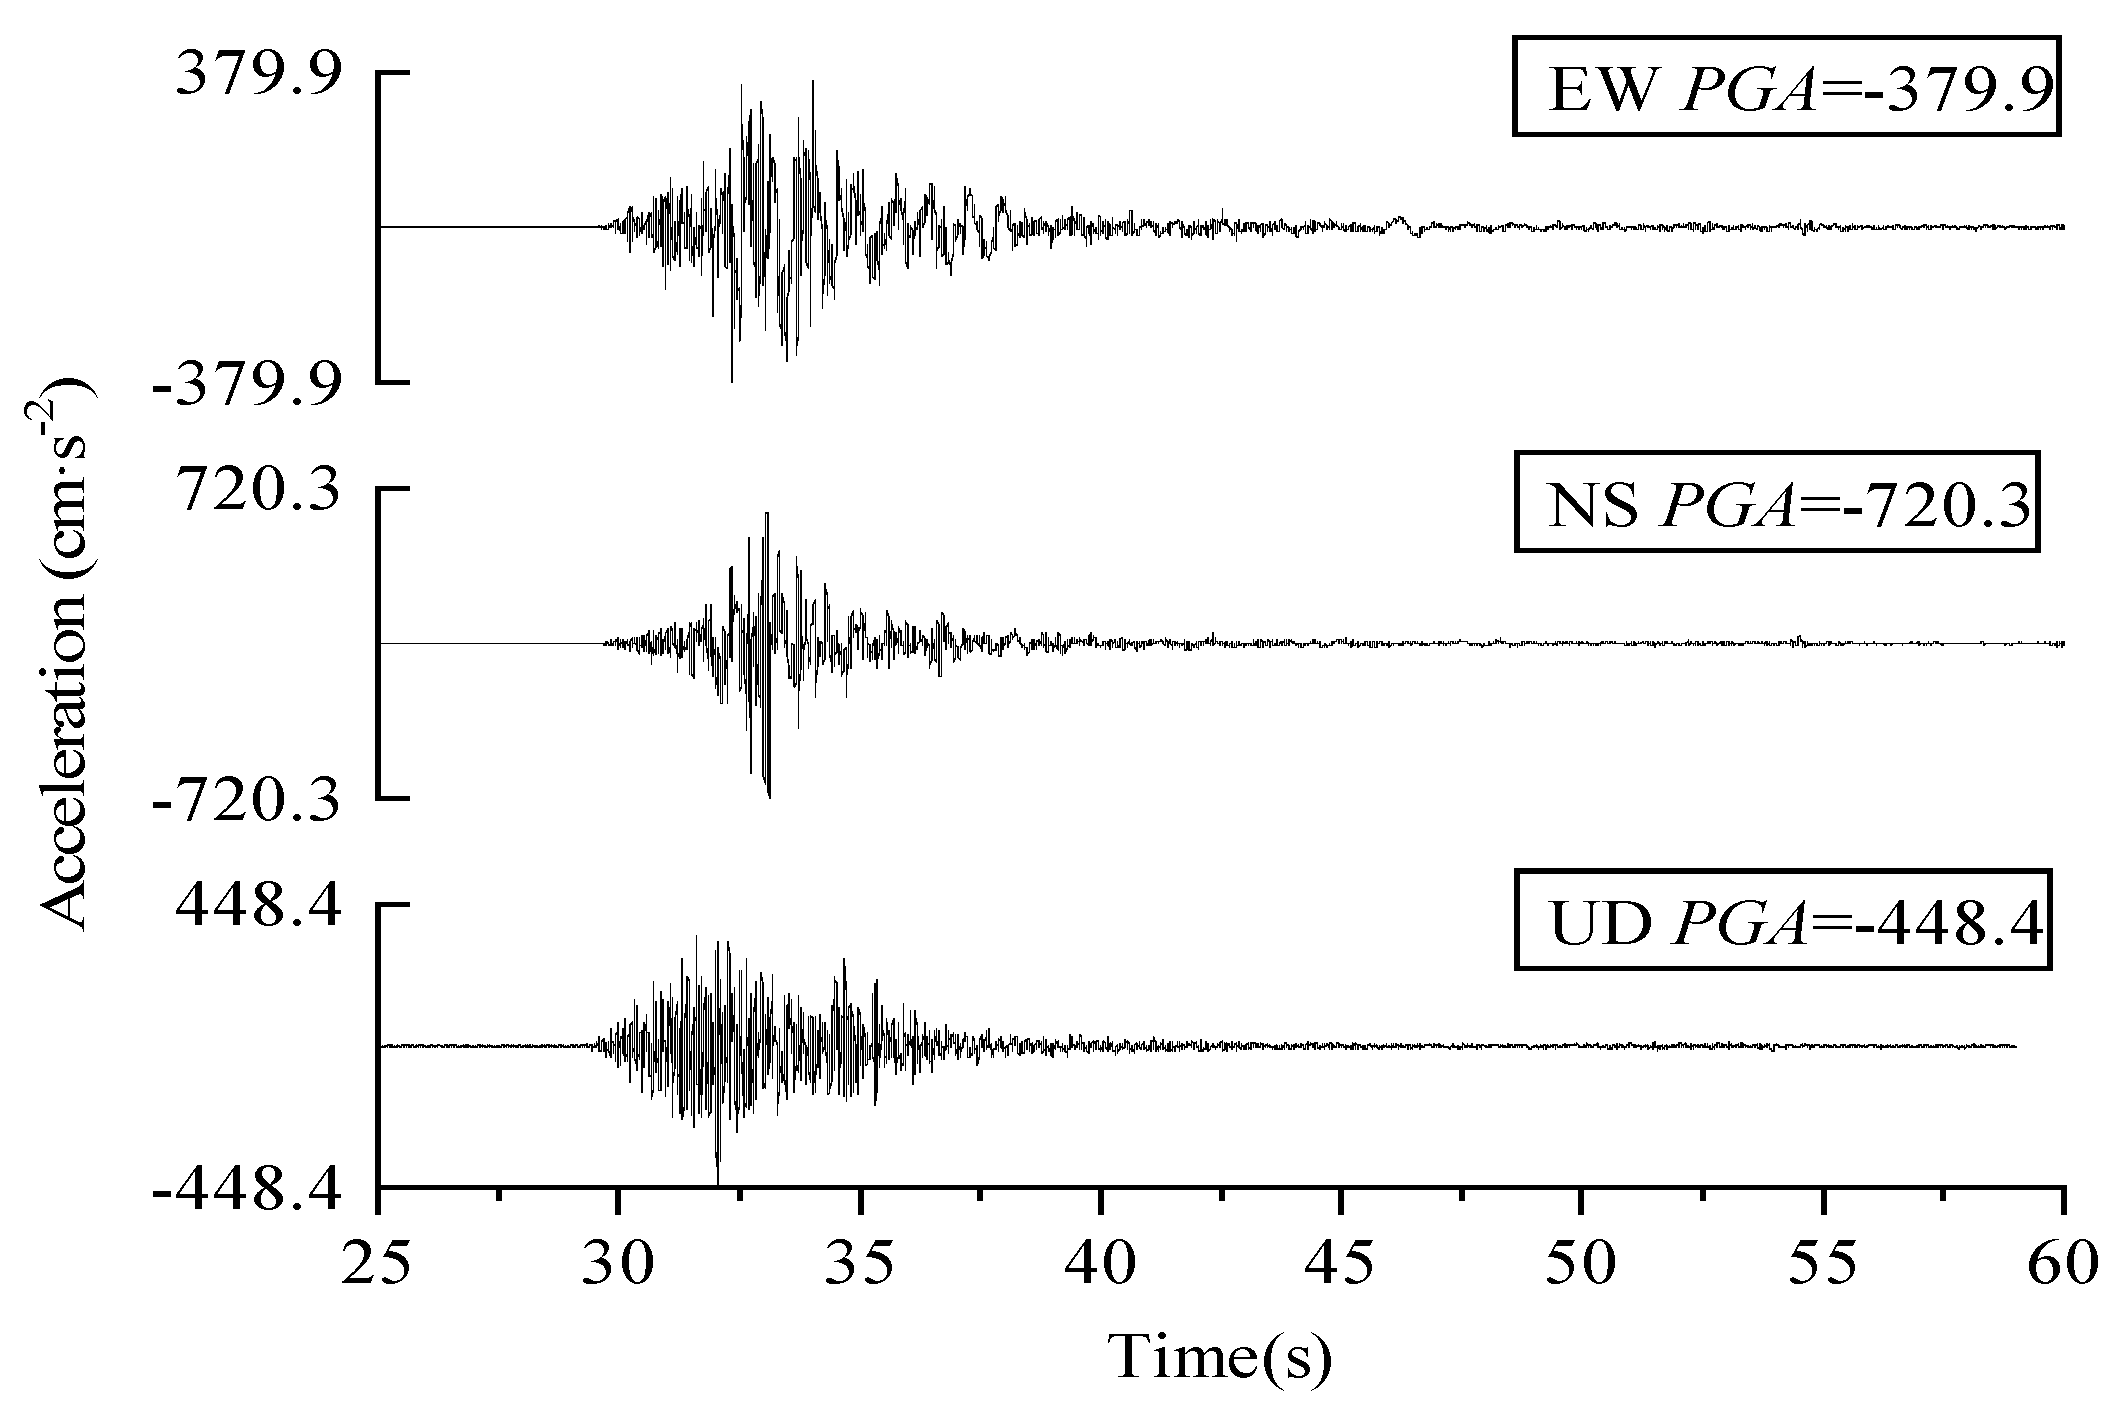
2.1. Yangbi Ground Motion

Located at 25.7° N and 99.9° E, and with the epicentral distance of 7.9 km and the seismic intensity of 8.3 by calculation instrument, Yangbi station(53YBX) is built on medium hard soil and is categorized as classII site. The peak acceleration (PGA) in EW (East–West), NS (North–South), and UD (Vertical) directions are −379.9 cm/s2, −720.3 cm/s2 and −448.4 cm/s2, and the peak velocity (PGV) 30.4 cm/s, −29.8 cm/s, −7.2 cm/s, respectively. The acceleration time history of Yangbi ground motion of the three-dimensional components is shown in Figure 1.

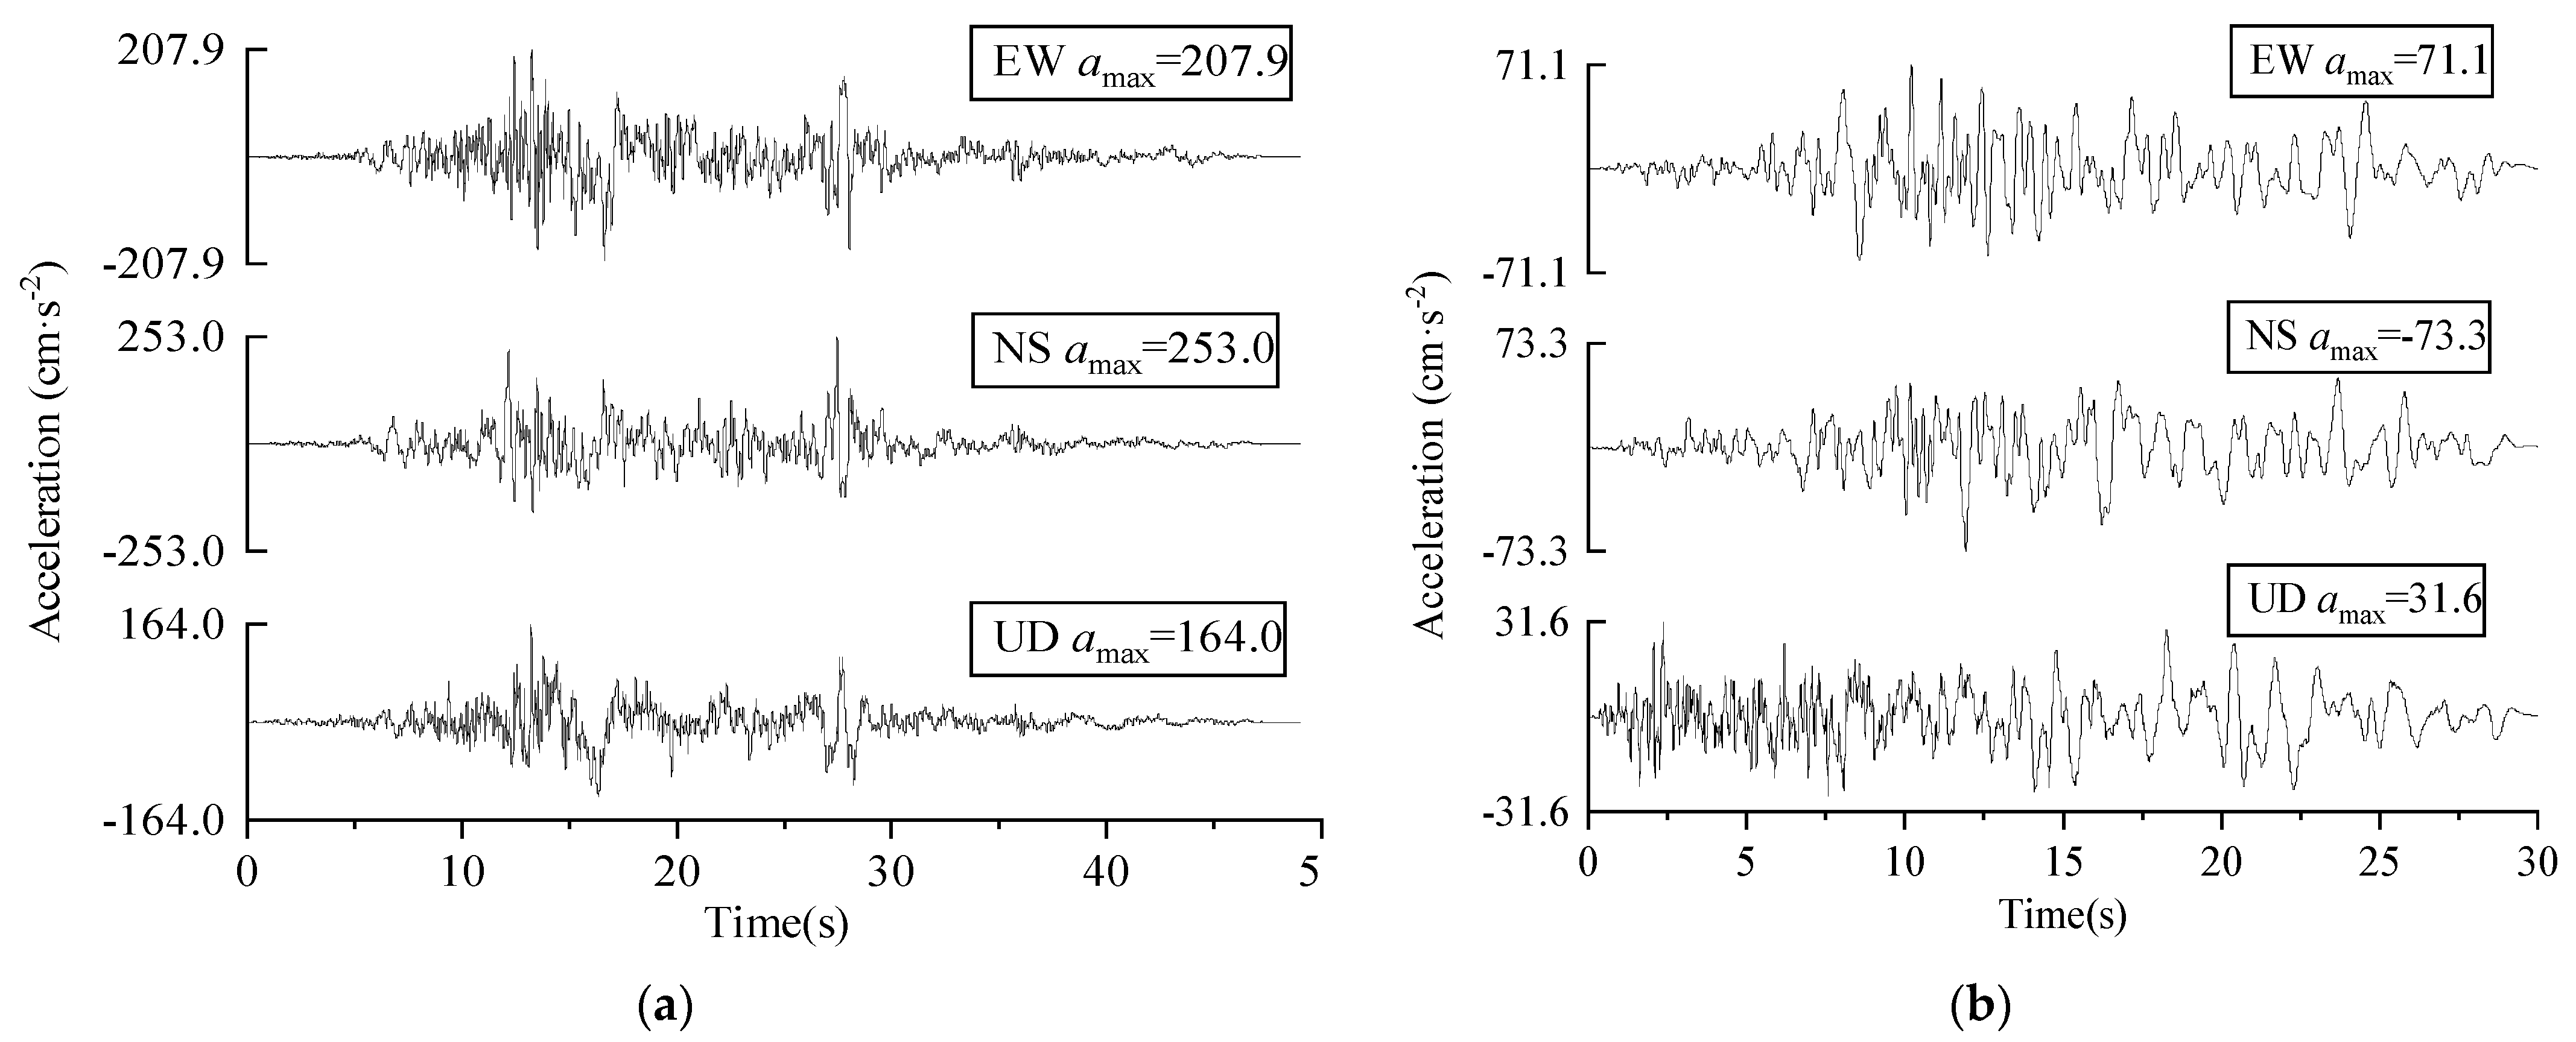
2.2. Chi-Chi and Loma Prieta Ground Motion

The Chi-Chi ground motion and Loma Prieta ground motion waveform information are shown in Table 1. The former is a near-field pulse ground motion with PGAV/PGAH = 0.65, while the latter a non-pulse ordinary far-field motion with PGAV/PGAH = 0.43. The acceleration time history of Chi-Chi and Loma Prieta ground motion of the three-dimensional components is shown in Figure 2.

3. Dynamic Time History Analysis of RC Frame Structure

Taking the above three ground motions as input and under two working conditions defined, this article conducts time history analysis on an elastoplastic finite element model of a 5-story RC frame structure, and obtains the seismic dynamic response parameters of the structure and comparative analysis.

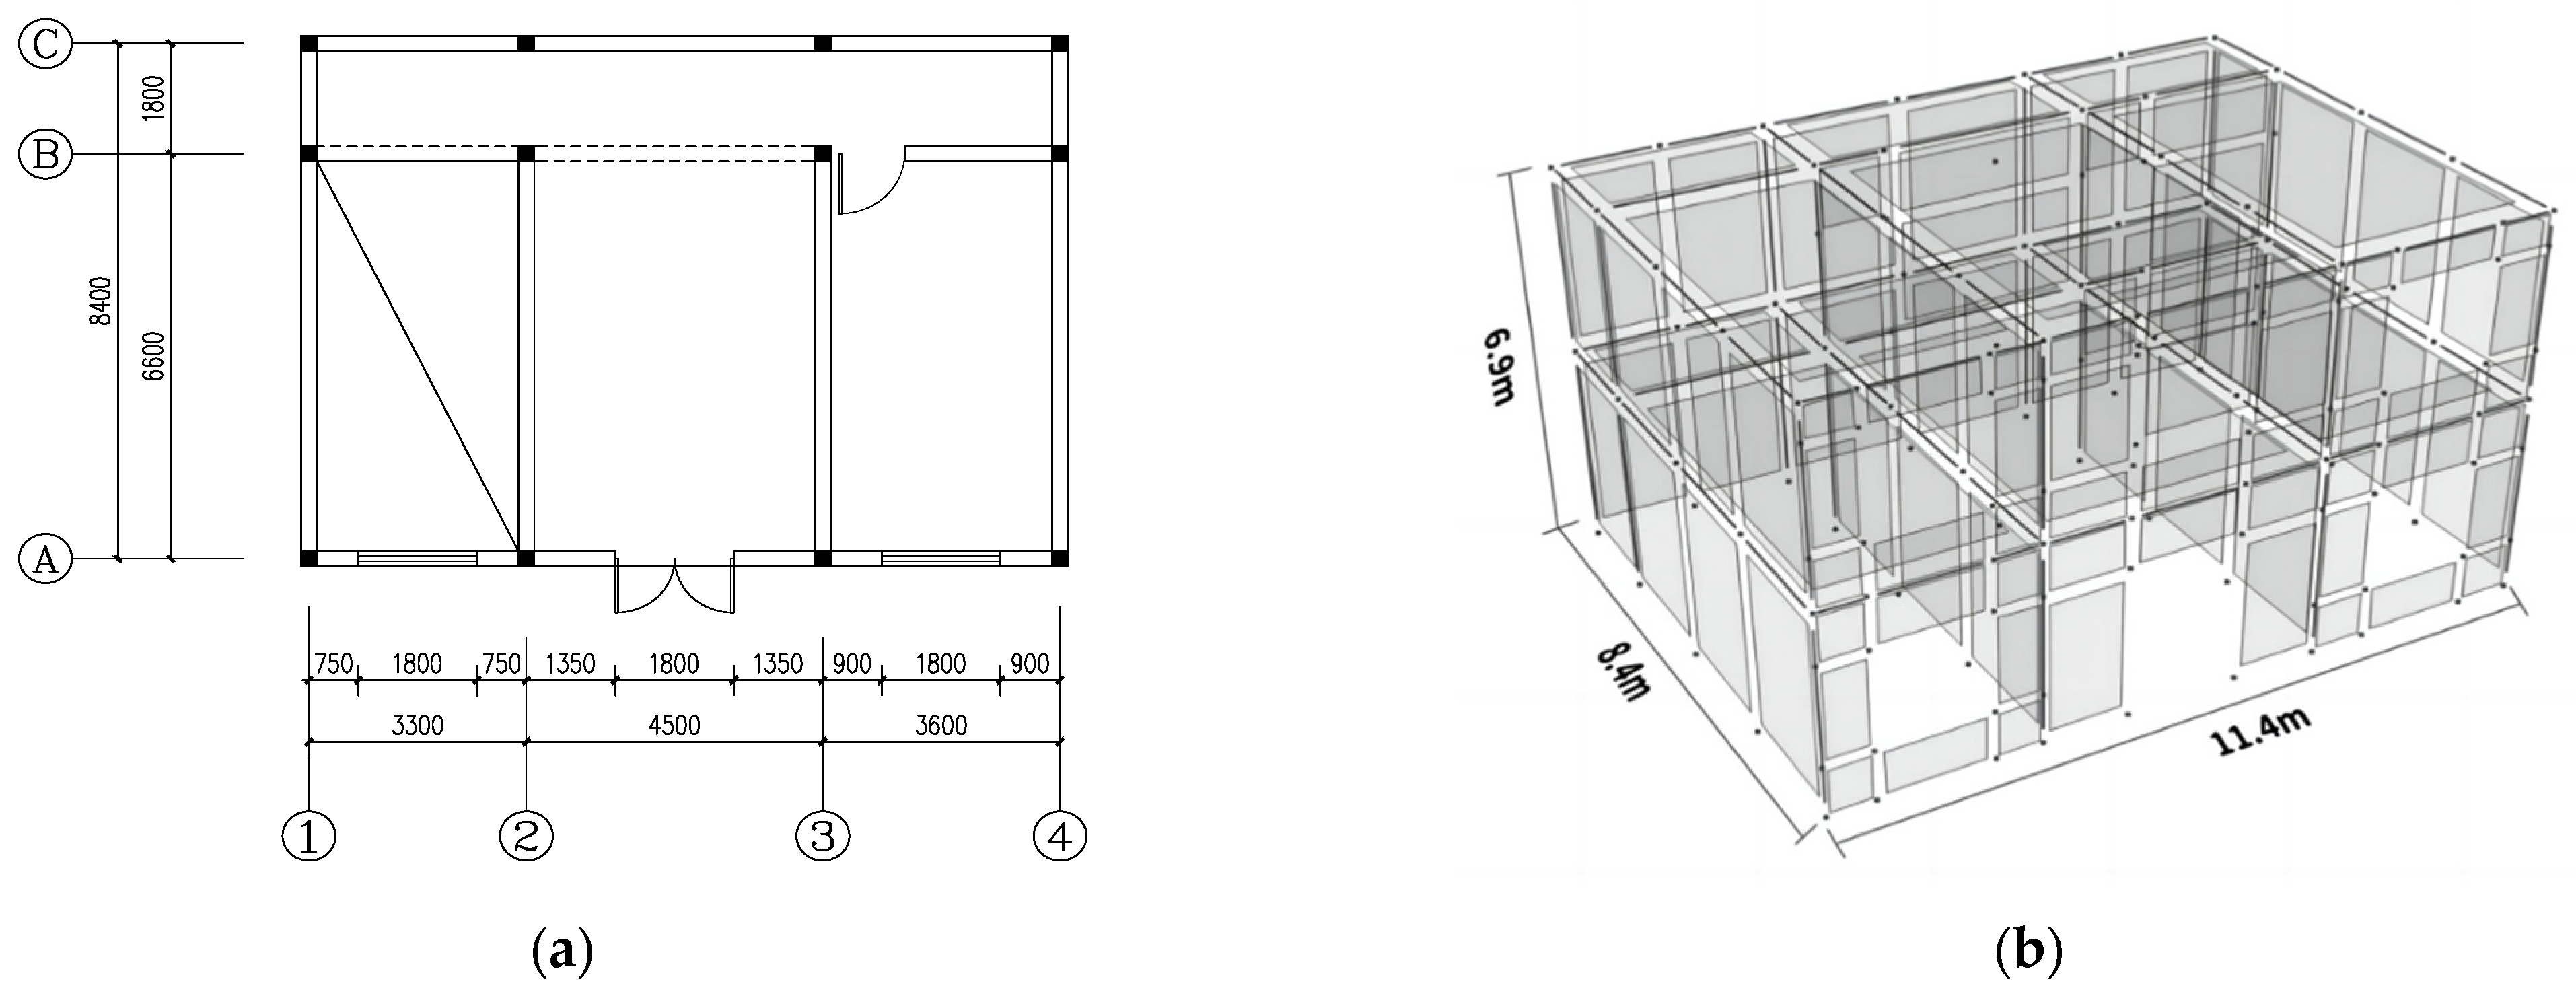
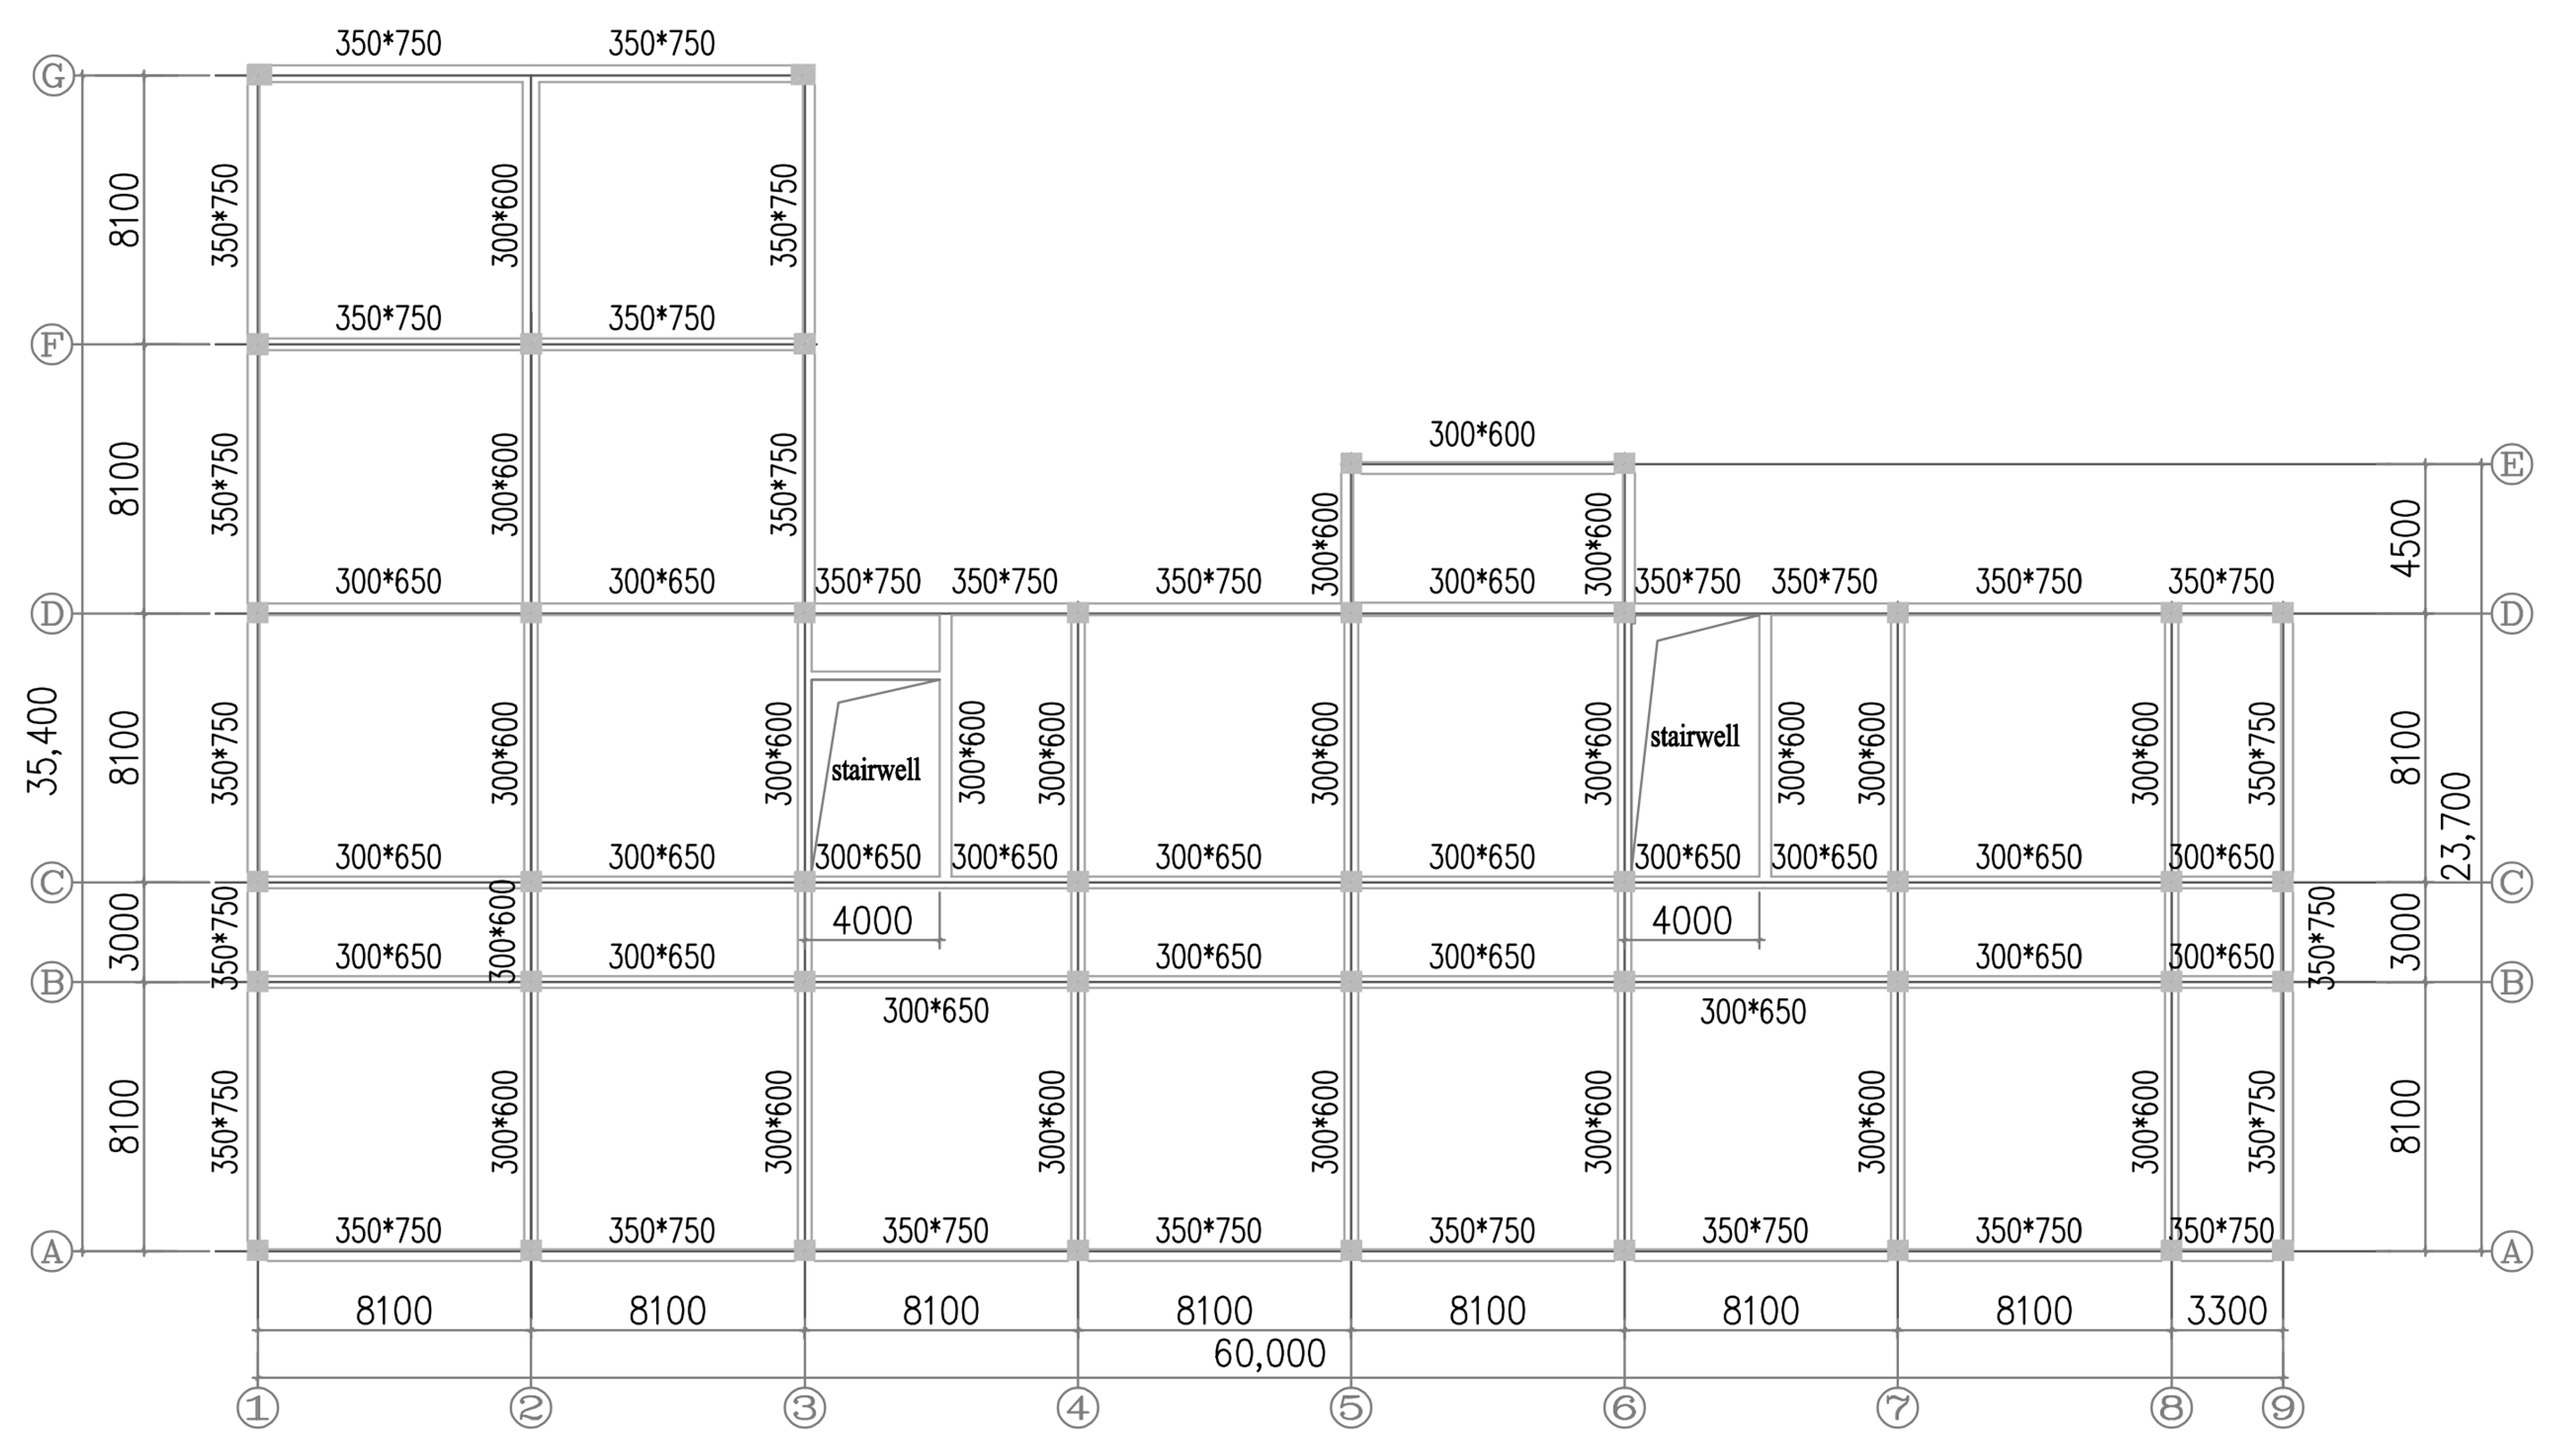
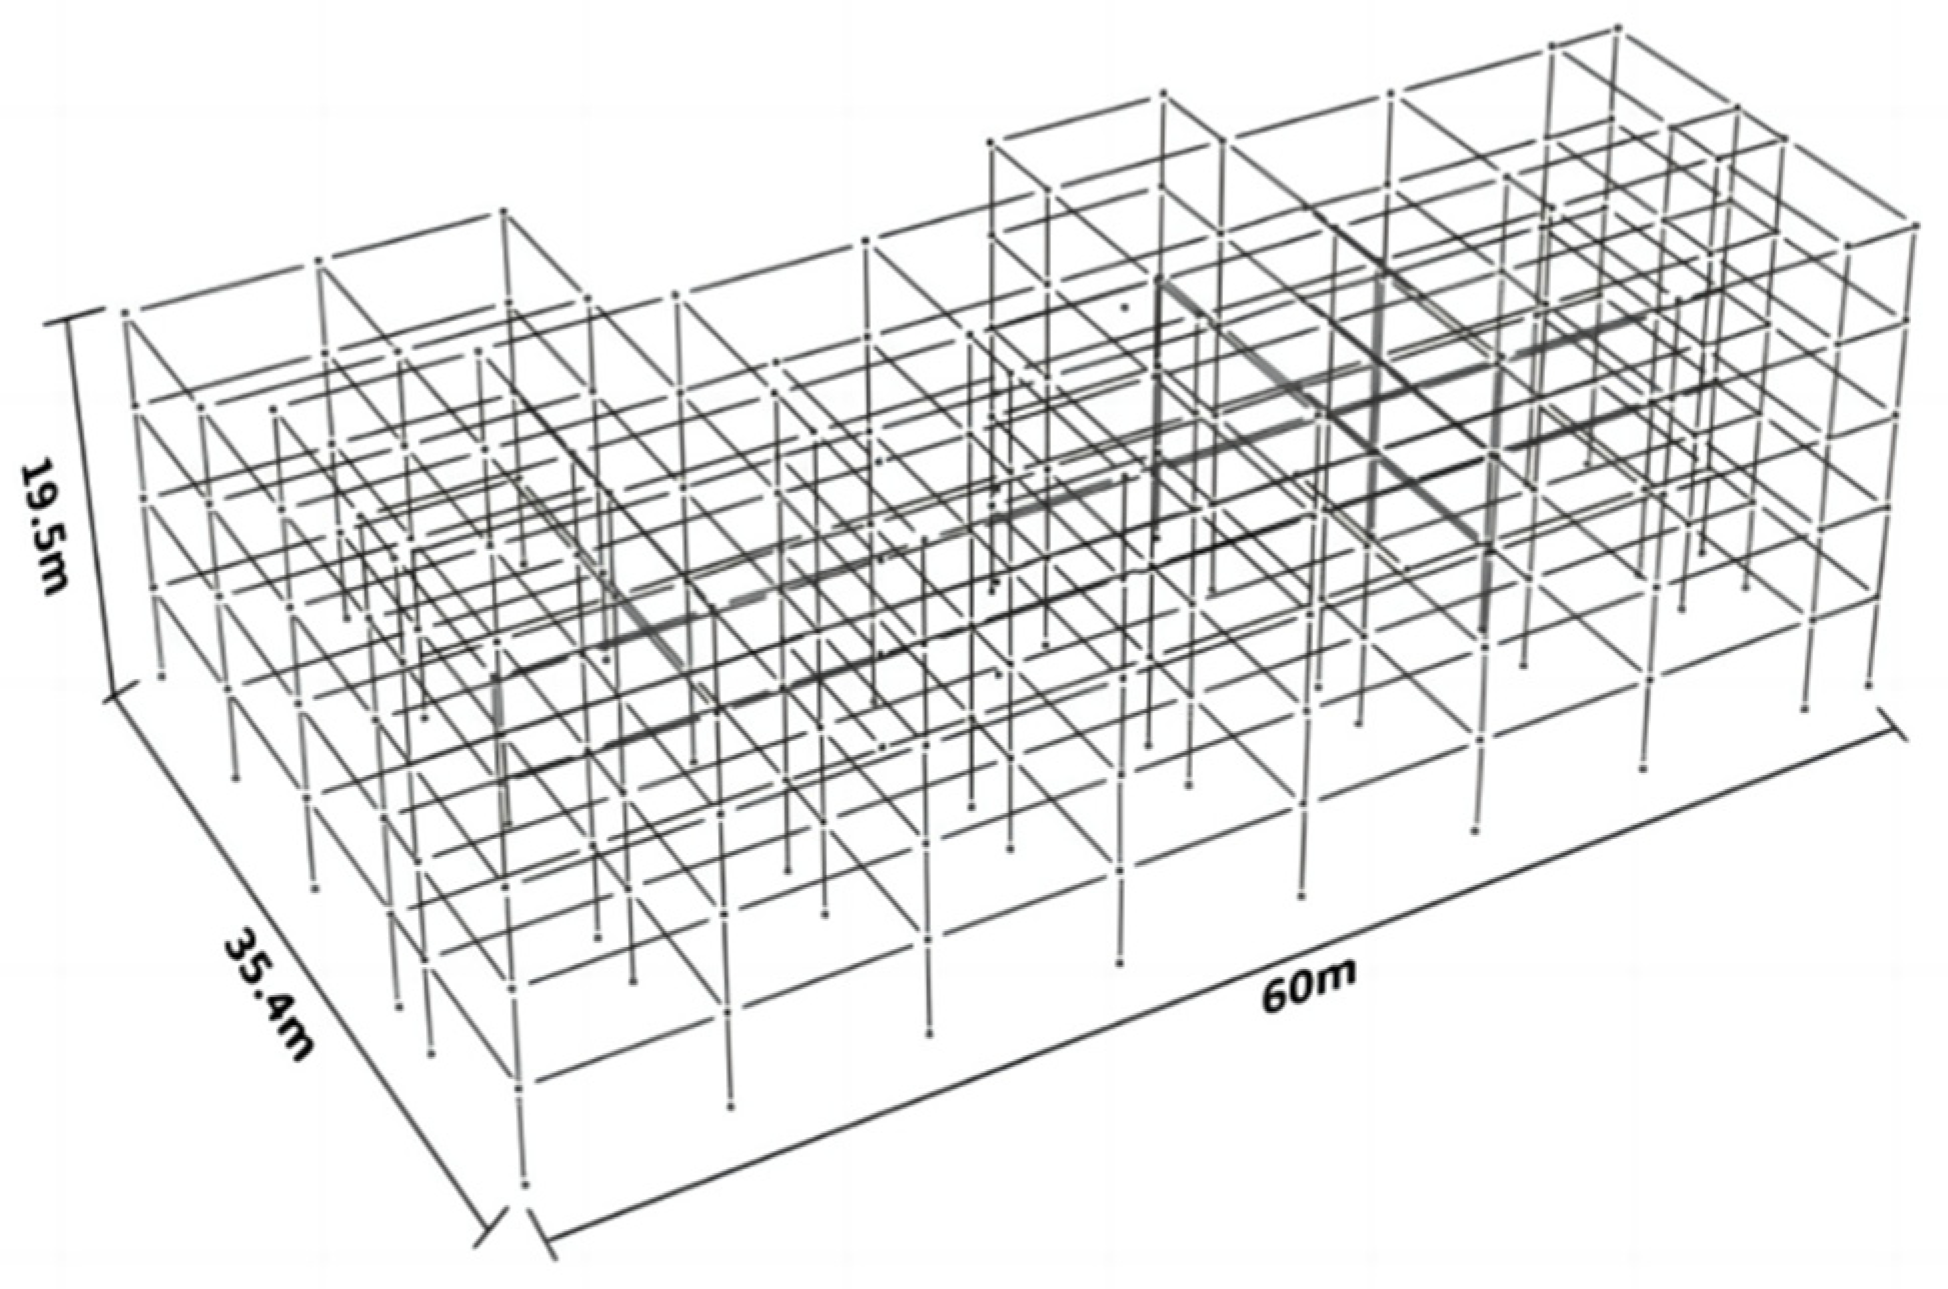
3.1. The Information on the RC Frame Structure

Referring to the structural characteristics of typical reinforced concrete frame buildings such as engineering examples of school and office buildings, the elastoplastic model of a 5-storey RC frame structure is established based on Perform-3D (Version 7.0) [31] (the nonlinear three-dimensional structural analysis software) by the specification. In the elastoplastic numerical model, the beam and column members are simulated by fiber section model. The definition of fiber cross section needs to be associated with the material, so the appropriate material constitutive model needs to be selected. The material constitutive models used in the numerical model include the uniaxial constitutive models of concrete and reinforced materials. The uniaxial stress–strain model for concrete used in this numerical model is the modified Kent-Park model. This model was proposed by Kent and Park [32] in 1971 and modified by Scott, Park and Priestley [33] in 1982. In addition, the uniaxial principal structure of the reinforcement in this numerical model is based on a bilinear elastoplastic principal structure model that takes into account the follow-on strengthening.
The layout of the frame structure was shown in Figure 3 (The black shaded area in the figure is the column), and the Perform-3D model was shown in Figure 4. The basic information of the structure is as follows:
The floor height of the frame structure is 3.9 m, and its total height is 19.5 m. The dimension of the first floor of the frame column is 700 × 700, and that of other floors is 600 × 600. The dimensions of each frame beam are marked in Figure 3, and the prudent seismic intensity of the structure is 8 degrees. The basic seismic acceleration of the design is 0.20 g. For the first group of earthquakes, the site category is class II. The aseismic grade of the structure is grade II. Basic wind pressure in 50 years is w0 = 0.65 kN/m2. Ground roughness is class B. The concrete intensity grade of columns on all floors in the structure is C35, and that of frame beams and floors is C30. HRB400 reinforcement is used for structural members. The beam and column elements in the model refer to the fiber model design [34], and the section reinforcement parameters refer to the calculation results of the small earthquake elastic design. The model adopts the assumption of a rigid horizontal rigid floor without simulating the actual floor. The impact of the infilled wall on the stiffness of the frame structure was analyzed by defining the periodic reduction coefficient. This article defines the periodic reduction coefficient as 0.8.
Through modal analysis, the three orders of self-motion periods of the frame structure are 0.77 s, 0.74 s, and 0.67 s, respectively.

3.2. Comparison of Top-Floor Displacement

This research selected node 1 and node 2 on the top floor of the frame structure to compare and analyze the displacement time history and time history peak values in EW, NS, and UD under H and H + V working conditions. Node 1 and node 2 are, respectively located on the top floor of axis ①/ⓑ and ④/ⓑ in the structural layout (Figure 3). Node 1 represents the edge node of the frame structure, and node 2 the middle node of the structure. Under the two working conditions of three groups of ground motion, Table 2 shows the maximum displacement time history of node 1 and node 2 in the horizontal direction. In contrast, Table 3 indicates the peak value of displacement time history of node 1 and node 2 in the vertical direction.
It can be seen from Table 2 that there is little difference between the maximum displacement time history of node 1 and node 2 in EW and NS under the two working conditions (the maximum is 1.1%, which occurs in node 1 under Yangbi ground motion). However, as shown in Table 3, in the UD direction, the change rate of vertical displacement amplitude of node 1 and node 2 under two working conditions of Yangbi ground motion are 113.36% and 213.60%. Under the effect of Chi-Chi ground motion, they are 14.35% and 29.80%. Under the impact of Loma Prieta ground motion, they are −0.93% and 1.43%, respectively. The results show that the vertical component of Yangbi ground motion can cause strong fluctuation of the vertical displacement of the top floor of the RC frame structure, and have a more significant impact on the middle node than the edge node. The near-field motion Chi-Chi with velocity pulse has a slight effect on the vertical displacement response of the top layer of the structure, while the far-field motion Loma Prieta has little impact on it.

3.3. Comparison of Top-Floor Acceleration

The top floor acceleration of the RC frame structure under two working conditions are compared and analyzed. Table 4 shows peak values of the three-direction acceleration time history of node 1 and node 2 under two working conditions of the three groups of ground motion.
Under the effect of the three groups of ground motion, there is little difference between the peak values of acceleration time history in EW and NS directions. However, under Yangbi ground motion, the ratio of the time history peak value of the vertical acceleration of node 1 and node 2 under condition H + V to the peak under condition H are 34.22 and 19.71. It indicates that the influence of the vertical component of Yangbi ground motion on the vertical acceleration of the top floor edge node of the frame structure is more significant than that of the middle node. On the contrary, the influence of the vertical component of Loma Prieta ground motion on the vertical acceleration of the edge node on the top floor of the structure is less than that of the middle node. However, there is no big impact on the structure because of the small vertical acceleration peak. The vertical component of Chi-Chi ground motion has less influence on both nodes than the other two ground motions. It can be shown that for ground motions such as Yangbi ground motion, the effect of a vertical component on the floor acceleration of RC frame structure should not be ignored.

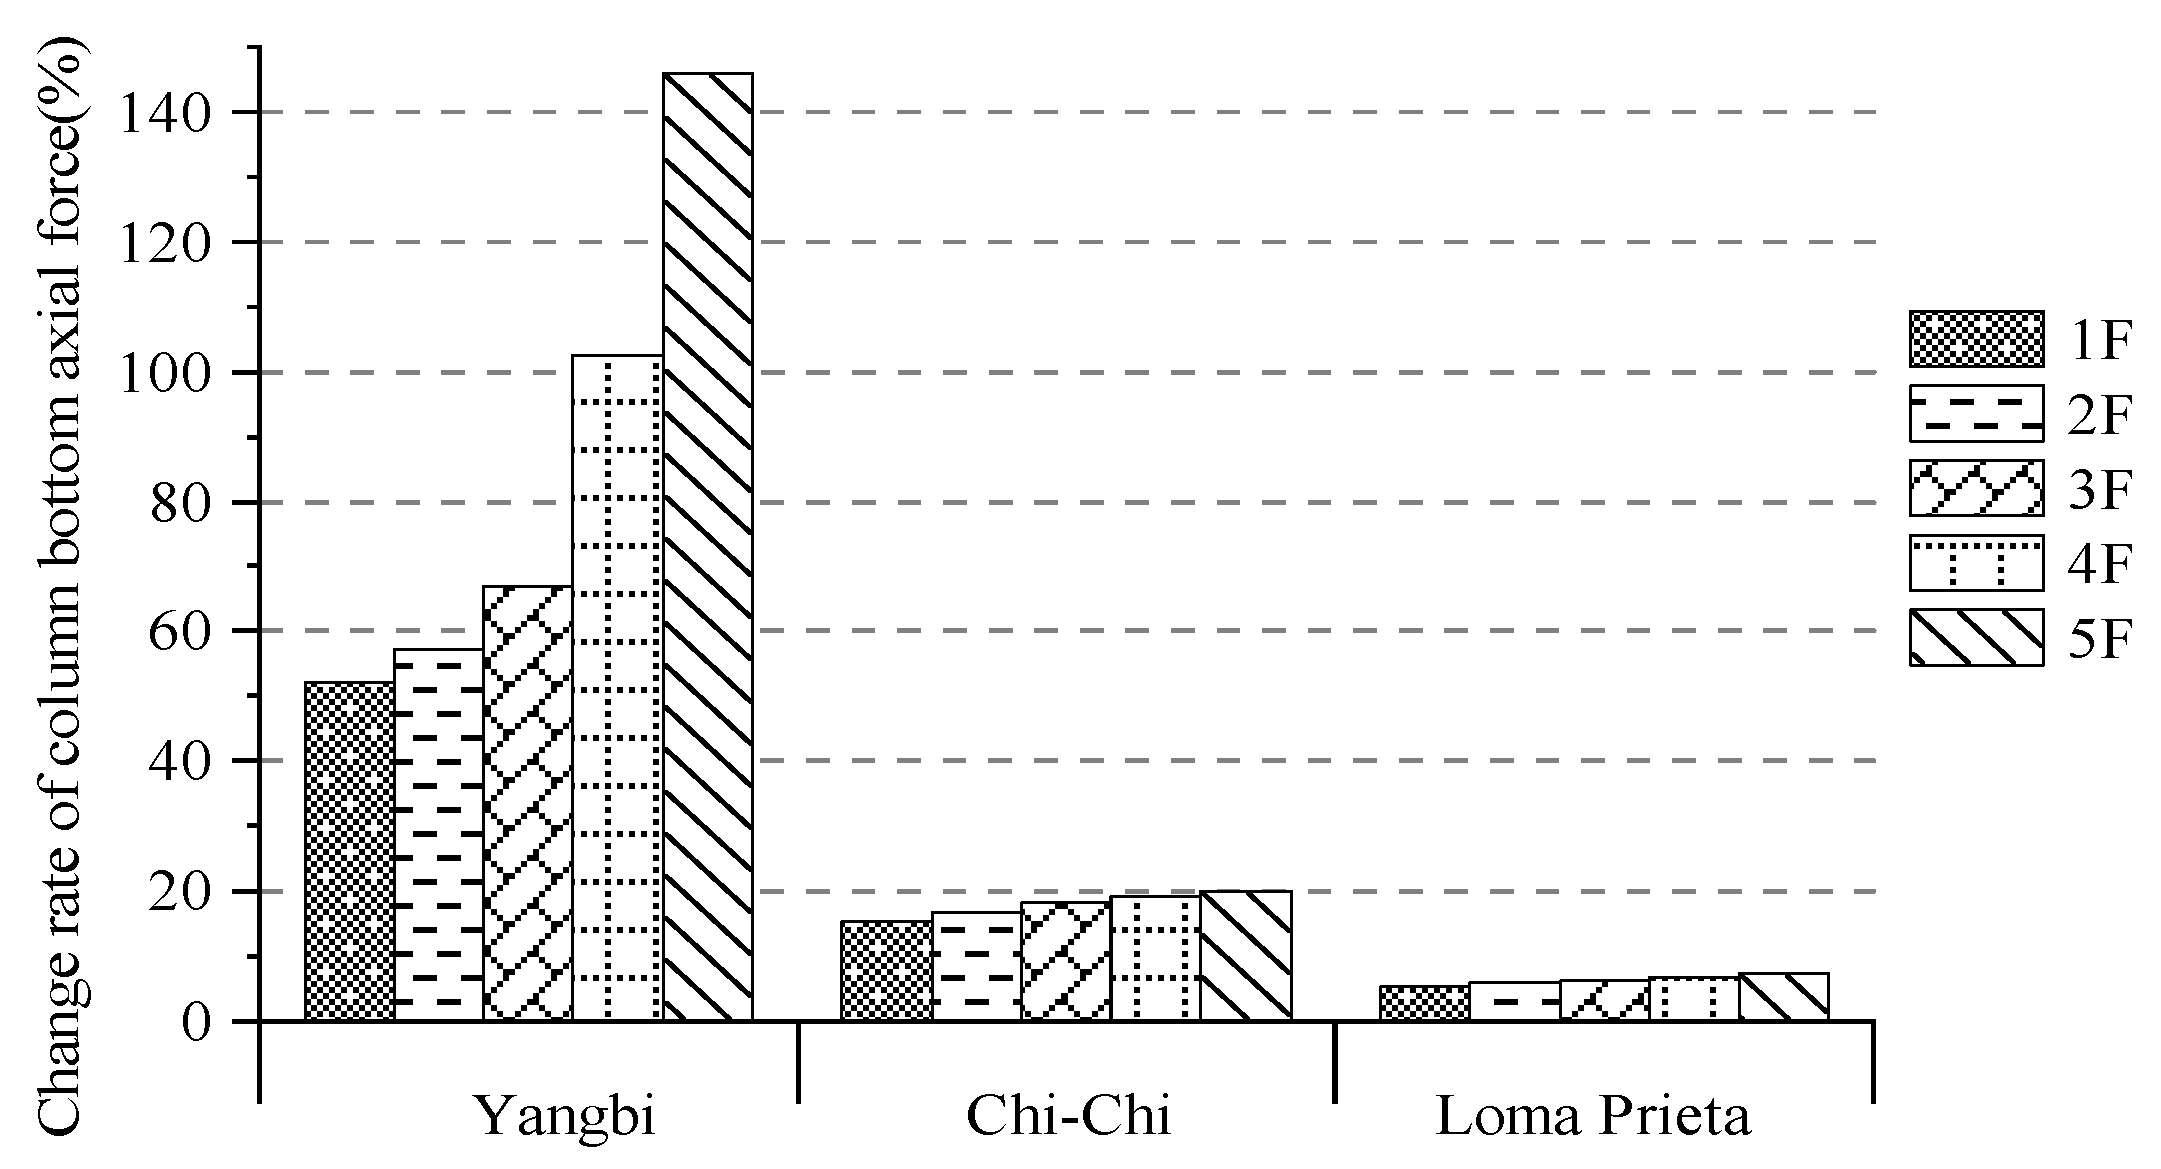
3.4. Comparison of Axial Force at Column Bottom of Each Floor

The maximum and minimum axial forces at the bottom of all frame columns on each floor under two working conditions are compared and analyzed. Table 5 shows the maximum and minimum axial force at the columns bottom of each layer under two working conditions of three groups of ground motion (positive value represents compression).
Table 5 shows that compared with the structural columns’ bottom axial force only under gravity load, the columns’ bottom axial force under H and H + V conditions under Yangbi ground motion displays more substantial fluctuation than that under the other two groups of ground motion. Comparing the performance of the columns’ bottom axial force under H + V and H conditions, it is found that the vertical component of Yangbi ground motion has an obvious amplification effect on the columns’ bottom axial force of each layer of the structure. The fluctuation of axial force at the columns’ bottom under Chi-Chi ground motion is weak. The response of axial force at the columns’ bottom under Loma Prieta ground motion is the smallest, which means the vertical component does not affect the structural columns’ bottom axial force. Since it is of little relevance to study the minimum value of the axial force of the columns’ bottom, the maximum value of axial force was selected for analysis. To illustrate more visually the variation law of columns’ bottom axial force, the change rate of the maximum value of columns’ bottom axial force of each layer under two working conditions of three groups of ground motion was drawn in Figure 5. It clearly shows that the change rate of axial force at the columns’ bottom increases gradually with the rise of the floor, and the change is the most striking one under the Yangbi ground motion. The change rate reaches the maximum at the structure’s top floor under the Yangbi ground motion, 145.7%. Instead, the influence of normal far-field ground motion Loma Prieta on the columns’ bottom axial force response of each layer of the structure is the smallest among the three groups of ground motion. Even if there is the influence of vertical ground motion, the change rate of the columns’ bottom axial force does not exceed 10%.

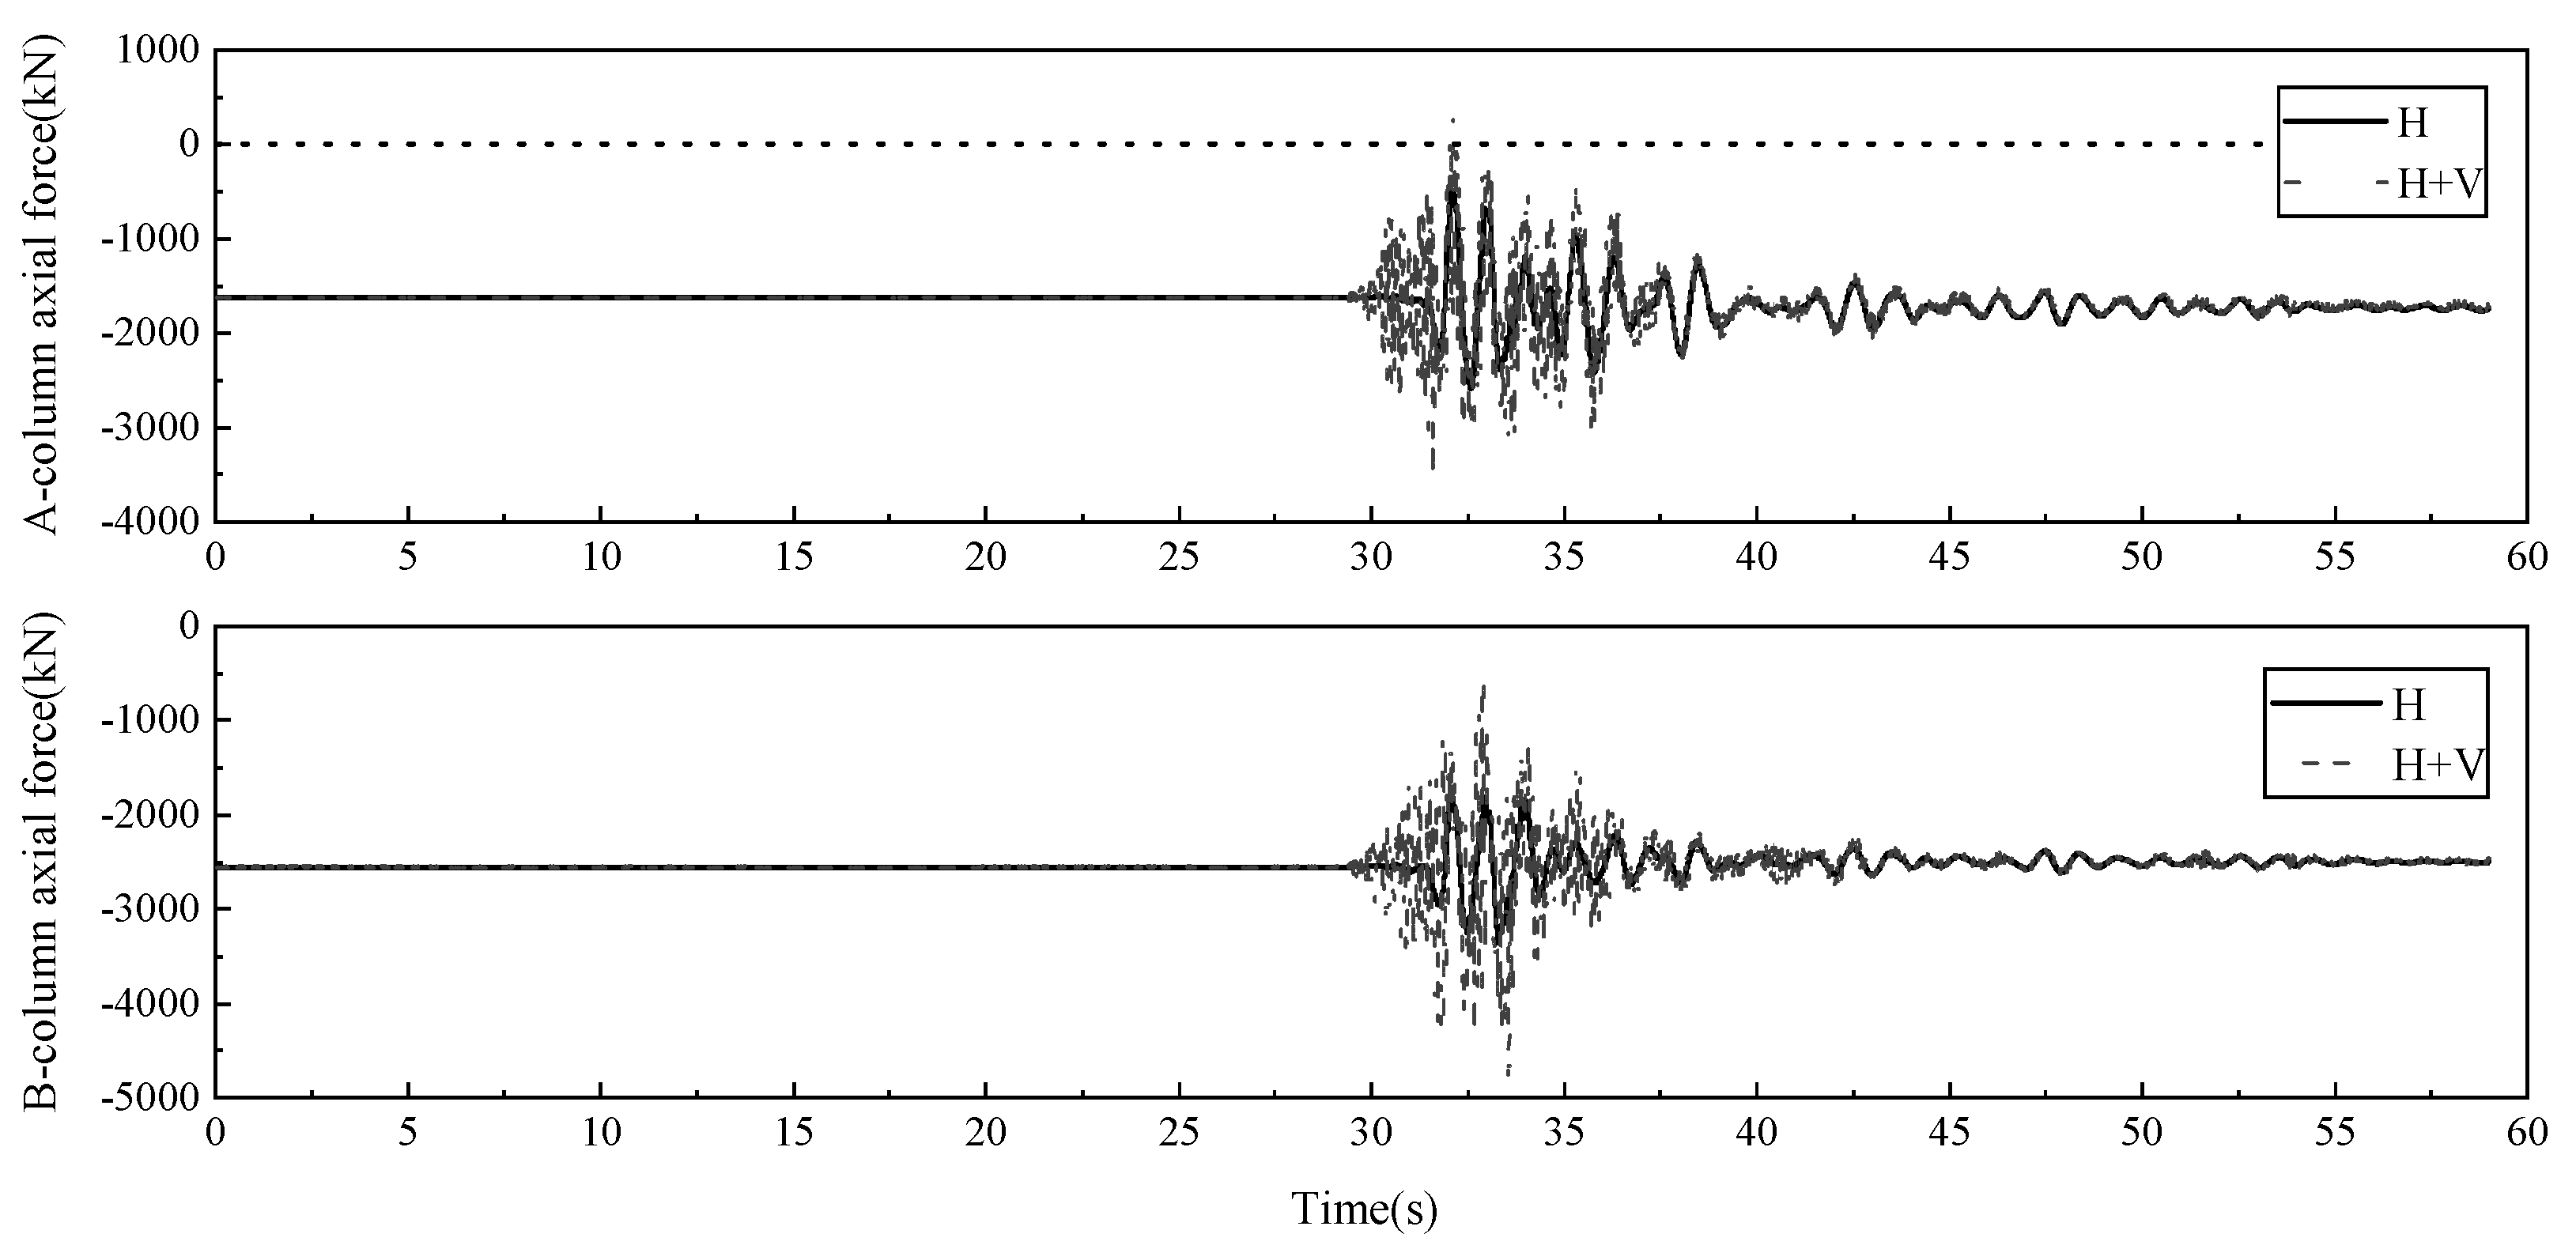
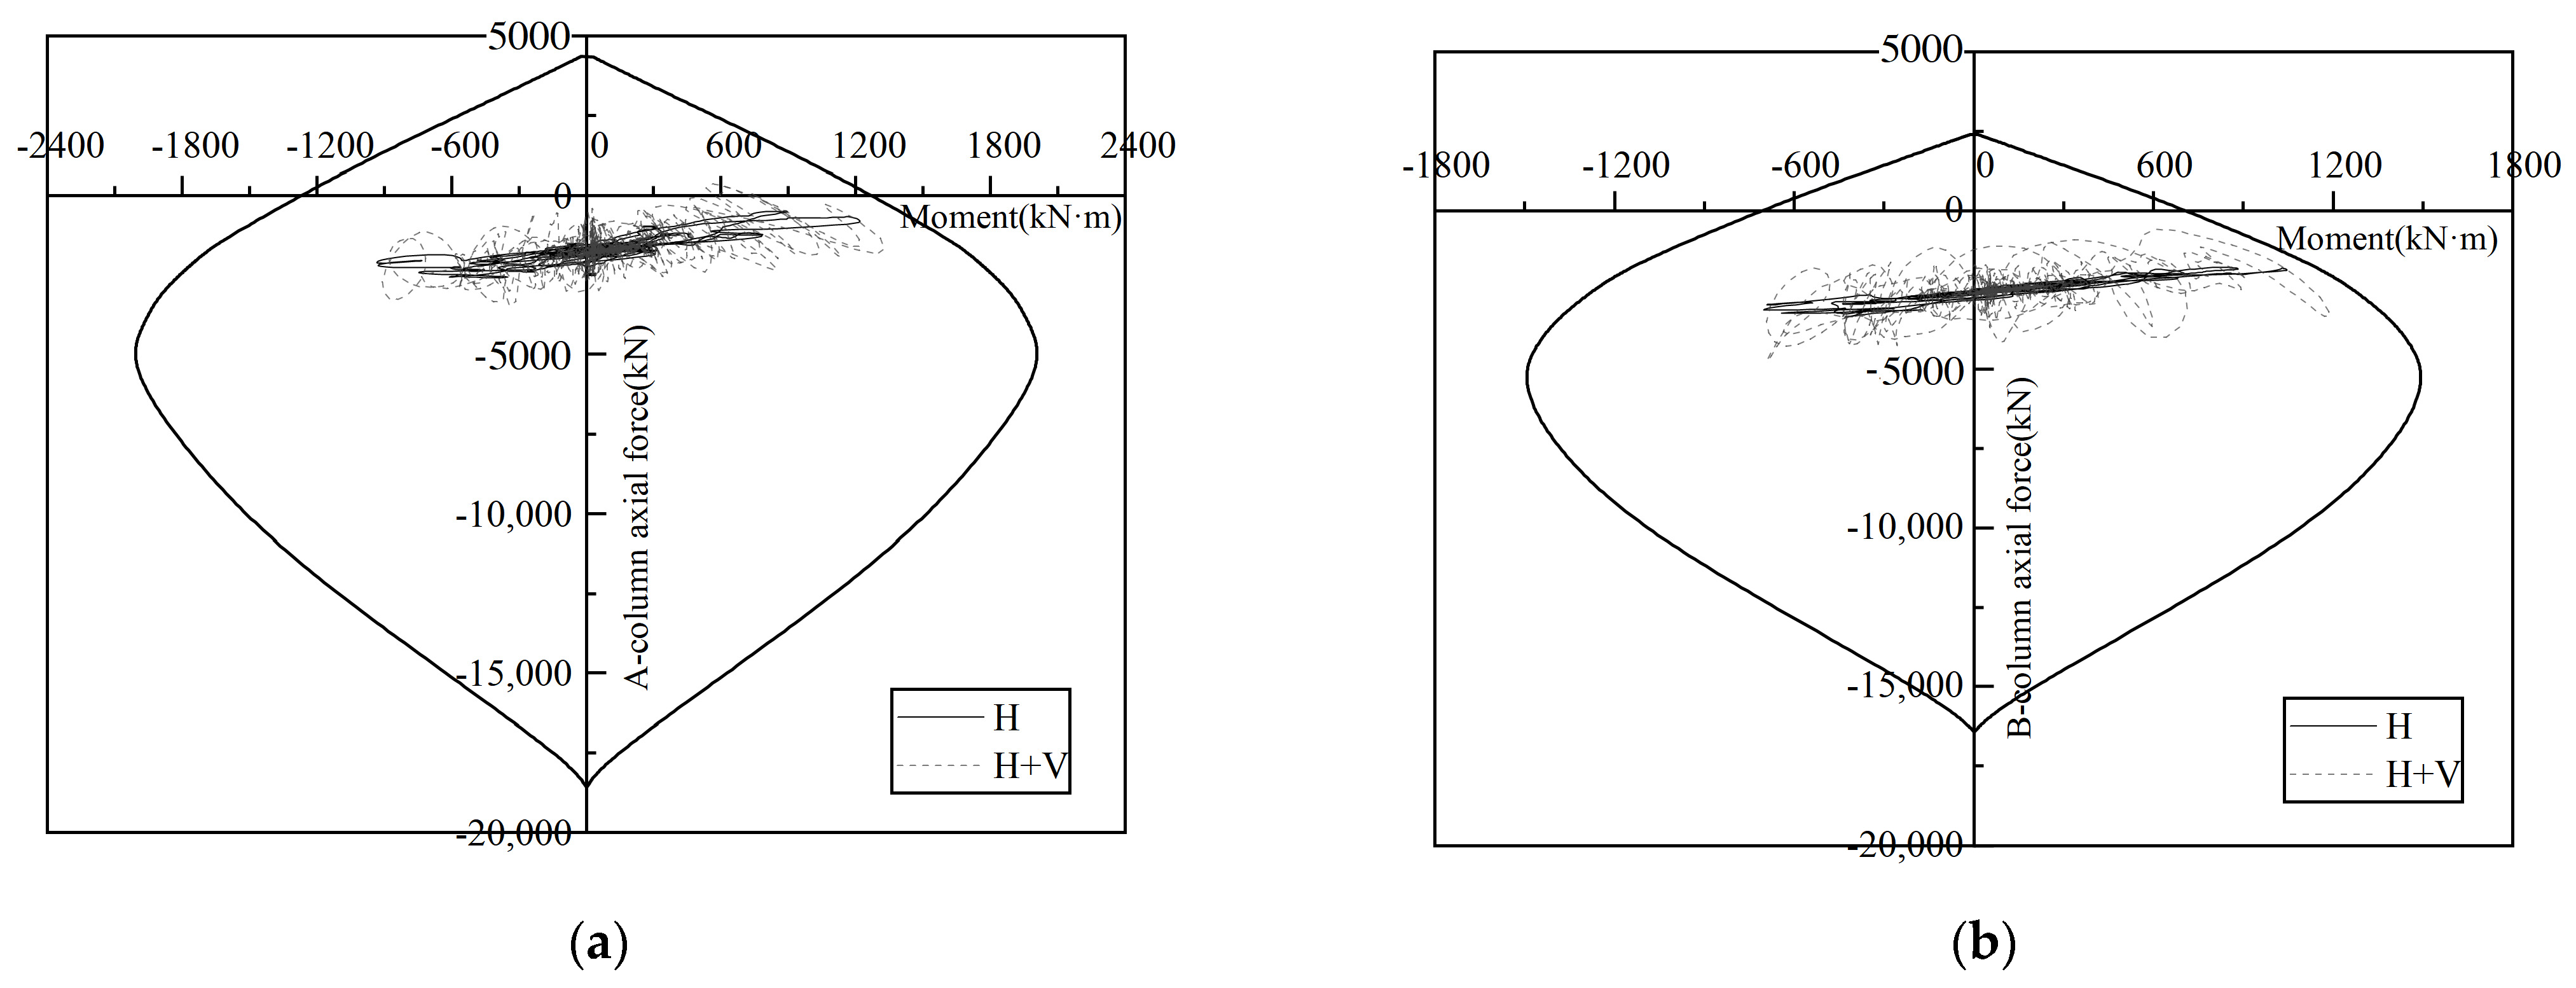
3.5. Analysis of the Axial Force and Moment of a Single Column under Yangbi Ground Motion

Based on the analysis above, it can be found that the vertical component of Yangbi ground motion has an obvious amplification effect on the column bottom axial force of each layer of the RC frame structure. A. J. Papazoglou and A. S. Elnashai [35] confirmed that under strong vertical ground motion, the damage of RC frame structure may be caused by direct tension or compression of concrete columns (the damage of RC frame structure is manifested by brittle fracture of frame columns, concrete crushing, and reinforcement buckling). At the same time, under high tension and compression load, the shear and bending capacity of concrete columns will be weak, their ductility will be reduced, and brittle failure will occur, resulting in the collapse of the structural story. Wang Xunliu et al. [36] proved that the change of axial force greatly impacts a RC column’s bearing capacity, stiffness, and hysteretic performance through the numerical analysis of hysteretic performance under different axial force modes. In the following, the influence of the vertical component of Yangbi ground motion on the axial force time history response of the edge and middle frame column at the structure’s bottom layer will be further analyzed.
A and B-columns of the structure’s first layer are selected for axial force analysis. A-column and B-column are located on the central axes ①/ⓑ and ④/ⓑ of the structural floor plan in Figure 3. A-column represents the edge column of the first floor of the frame structure, and B-column the middle column of the first floor of the frame structure. Figure 6 shows the axial force time history curve of A-column and B-column under two working conditions of Yangbi ground motion (negative value represents compression). Figure 6 shows that the axial force fluctuation of A-column is more evident than that of B-column and changes more frequently. Especially in times of vertical ground motion, A-column is under tension, which may lead to tensile cracking of concrete.
The following part analyzes the interaction between axial force and a bending moment of the A-column and B-column is analyzed. The variation curves of the axial force bending moment (column bottom bending moment) of A-column and B-column under two working conditions of Yangbi ground motion are shown in Figure 7a,b. Meanwhile, to reflect the bearing capacity of the columns, the cross-section N m envelope diagrams of A-column and B-column are established by the XTRACT program [37] based on the actual situation, which are drawn in Figure 7a,b.
As can be seen in Figure 7a,b, the variation curves of axial force and bending moment of A-column and B-column under two working conditions are all included in the cross-section N m envelope diagram. In other words, even if there is no bearing capacity damage, the axial pressure and column bottom bending moment of the two columns under the H + V condition are greater than those under the H condition. It also shows that the influence of vertical ground motion on the loading state of frame columns can not be ignored. In the earthquake process, both columns are in a form of large eccentric compression, which may reflect that the columns of the RC frame structure have good ductility and energy dissipation in the earthquake. From the variation trend of axial force with bending moment, the axial force of the two columns changes linearly with the bending moment under the effect of ground motion. From the above analysis, it can be concluded that the axial force of RC frame columns fluctuates violently under vertical ground motion. Therefore, the influence of vertical seismic action on the bearing capacity of columns should be taken into account in the earthquake-resistant design of RC frame structures in high seismic intensity areas.

4. Dynamic Time History Analysis of Brick-Concrete Structure

Many studies on the effect of vertical ground motion mainly focus on reinforced concrete structures such as large-span structures, long cantilever structures, and super high-rise structures, with few studies of brick-concrete structures. It is found that among the damage of buildings in high-intensity earthquake-stricken areas, such as 2008 Wenchuan catastrophe, the number of severe damage and collapse of brick-concrete structures accounts for a large proportion [38]. At present, brick-concrete structures are still built in villages and towns on a large scale. Therefore, the research on the response of brick-concrete structures to the effect of vertical ground motion is conducive to improving the public’s understanding of the impact of vertical seismic action on brick-concrete structures in high-intensity areas. Taking three groups of ground motion as inputs, the researchers conduct dynamic time history analysis on an elastoplastic finite element model of a 2-storey brick-concrete structure to obtain the seismic dynamic response parameters of the structure and comparative analysis.

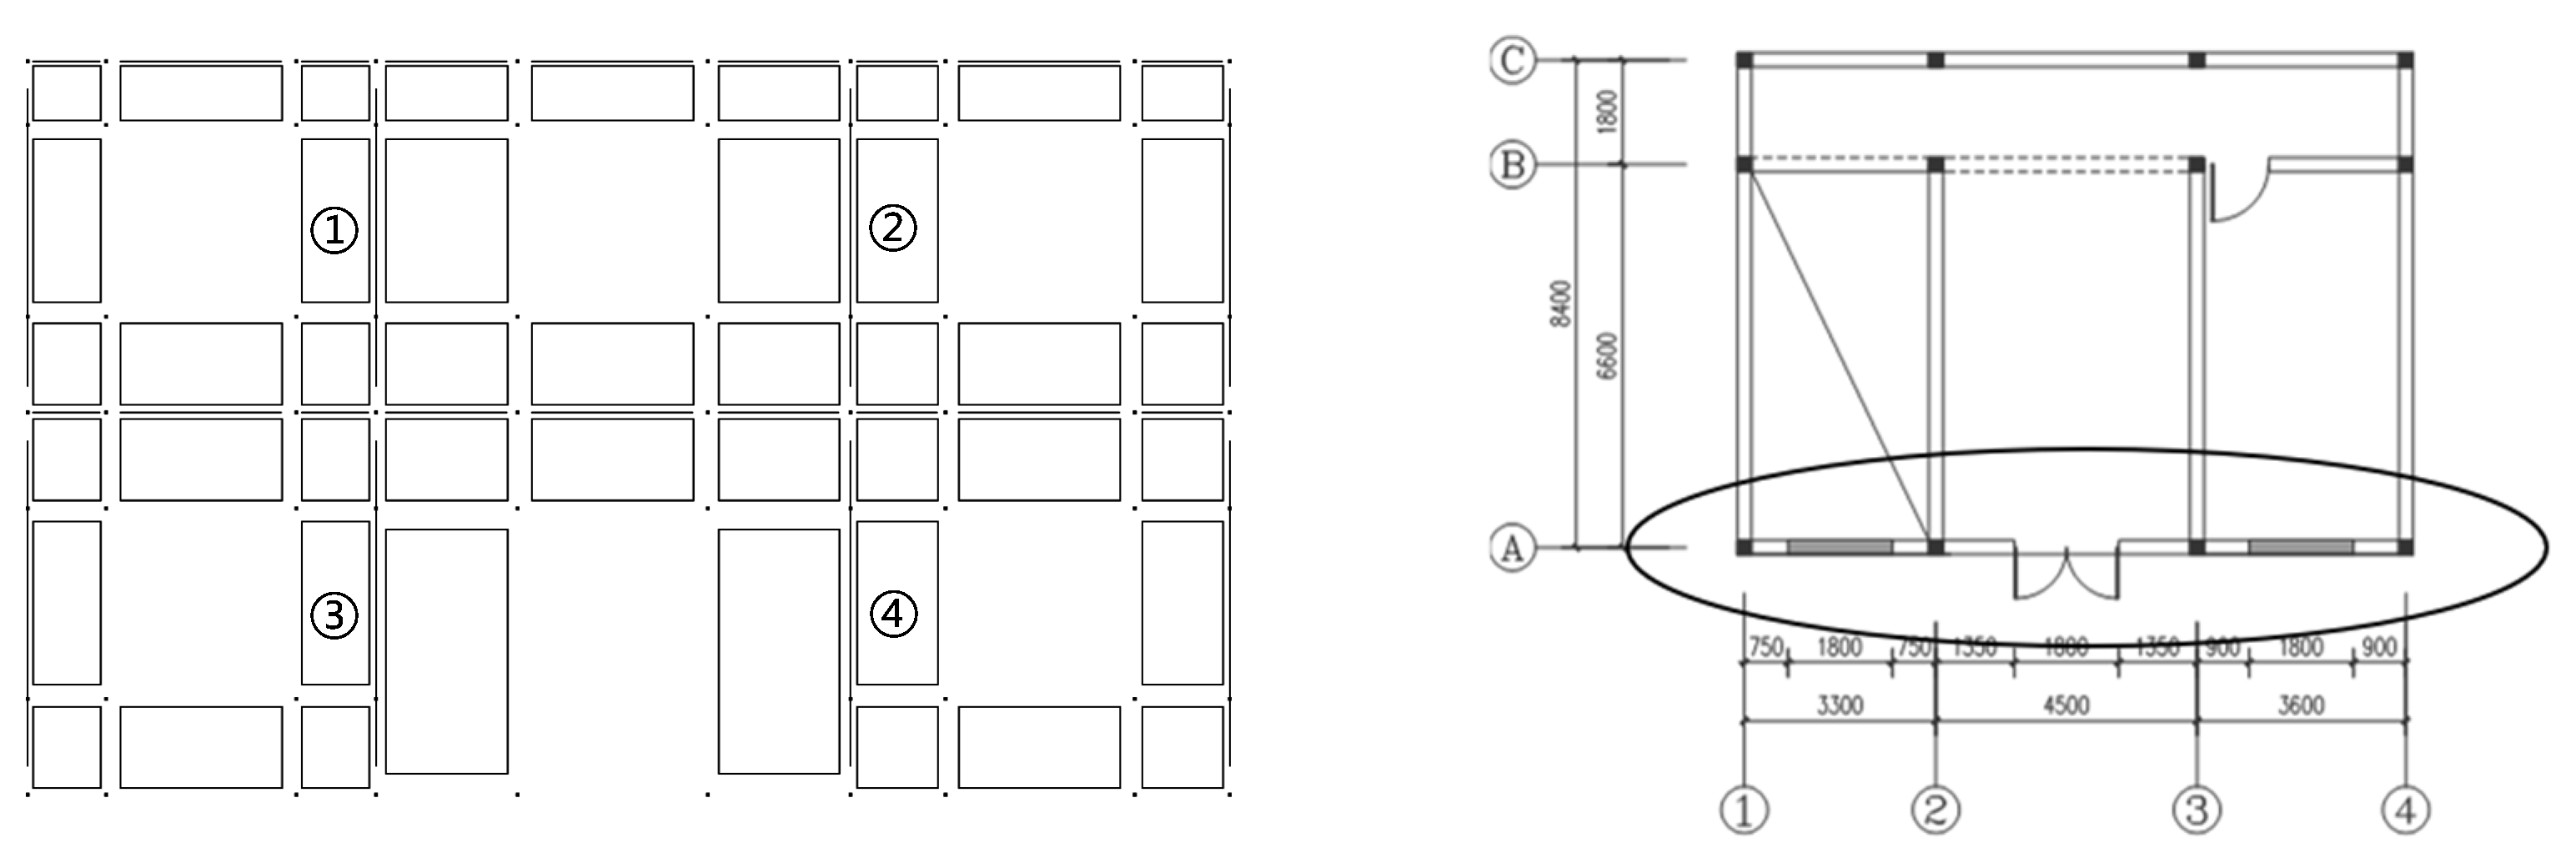
4.1. The Information on the Brick-Concrete Structure

Considering the typical brick-concrete buildings in villages and towns in Sichuan-Yunnan Region, combined with the actual project, a two-storey brick-concrete structure elastic-plastic model is established based on PERFORM-3D. Figure 8a shows the structural floor plan and Figure 8b the PERFORM-3D model. The first floor of the brick-concrete structure is 3.6 m high, and the second floor is 3.3 m high. The masonry wall is made of 240-thick sintered ordinary brick with a brick strength grade of MU10 and a mortar strength grade of M7.5. The seismic structure is fortified at 7 degrees. The main beam, structural column, ring beam, and floor slab are made of C30 concrete and HRB400 reinforcement. The cross-section size of the ring beam is 240 mm × 200 mm, the cross-section size of the structural column is 240 mm × 240 mm, and the floor thickness is 110 mm.
Considering mortar and block as a whole, Liu Guiqiu [39] proposed the constitutive compression model of brick masonry material by using the unidirectional compression stress–strain relationship of masonry. To take into account the strength loss equivalent to the brick masonry material, the research uses the Trilinear concrete material constitutive model based on Perform-3D. The uniaxial compressive strength of the brick masonry is 3.76 MPa, the elastic modulus is 2456.3 MPa, and the Poisson’s ratio is 0.15. The peak compressive strain of brick masonry is 0.003, and the corresponding strain of residual stress is 0.012. According to the Masonry Structure Design Specification (GB50003-2011) [40], the shear modulus of brick masonry is 0.4 times the elastic modulus, and the uniaxial tensile strength is 0.386 MPa. According to Zheng Nina’s theory of the tensile stress–strain relationship of masonry and compressive elastic modulus, the tensile peak strain of brick masonry is 0.000157, and its ultimate tensile strain is 10 times the peak strain. Through modal analysis, the first three self-motion periods of the structure are 0.13 s, 0.10 s, and 0.09 s, respectively.

4.2. Comparison of Top-Floor Displacement

Node 3 and node 4 on the top floor of the brick-concrete structure are selected to compare and analyze the displacement time history and peak values in EW, NS, and UD under H and H + V working conditions. Node 3 and node 4 are located on the top floor of axis ②/ⓐ and ②/ⓑ in the structural layout (Figure 8a). Node 3 represents the top edge node of the brick-concrete structure, and node 4 represents the middle node of the top level of the brick-concrete structure. Table 6 shows the maximum displacement time history of node 3 and node 4 in the horizontal direction under the two working conditions of three groups of ground motion. Table 7 shows the peak displacement time history of node 3 and node 4 in the vertical direction.
It can be seen from Table 6 that among the three groups of ground motion, the displacement change rate of the two nodes in the NS direction is the largest under the two working conditions of Yangbi ground motion. In contrast, the two sets of displacements in horizontal directions under the two working conditions of Loma Prieta ground motion have hardly changed. It can be indicated from Table 7 that the vertical component of Yangbi ground motion can cause strong fluctuations in the vertical displacement of the top floor of the brick-concrete structure. However, the overall response of the brick-concrete structure is not as strong as the RC frame structure. The near-field ground motion Chi-Chi with velocity pulse has little effect on the vertical displacement of the top layer of the structure. The vertical component of Yangbi ground motion and Chi-Chi ground motion has a greater impact on the edge nodes than the middle nodes, while the opposite is for Loma Prieta ground motion.

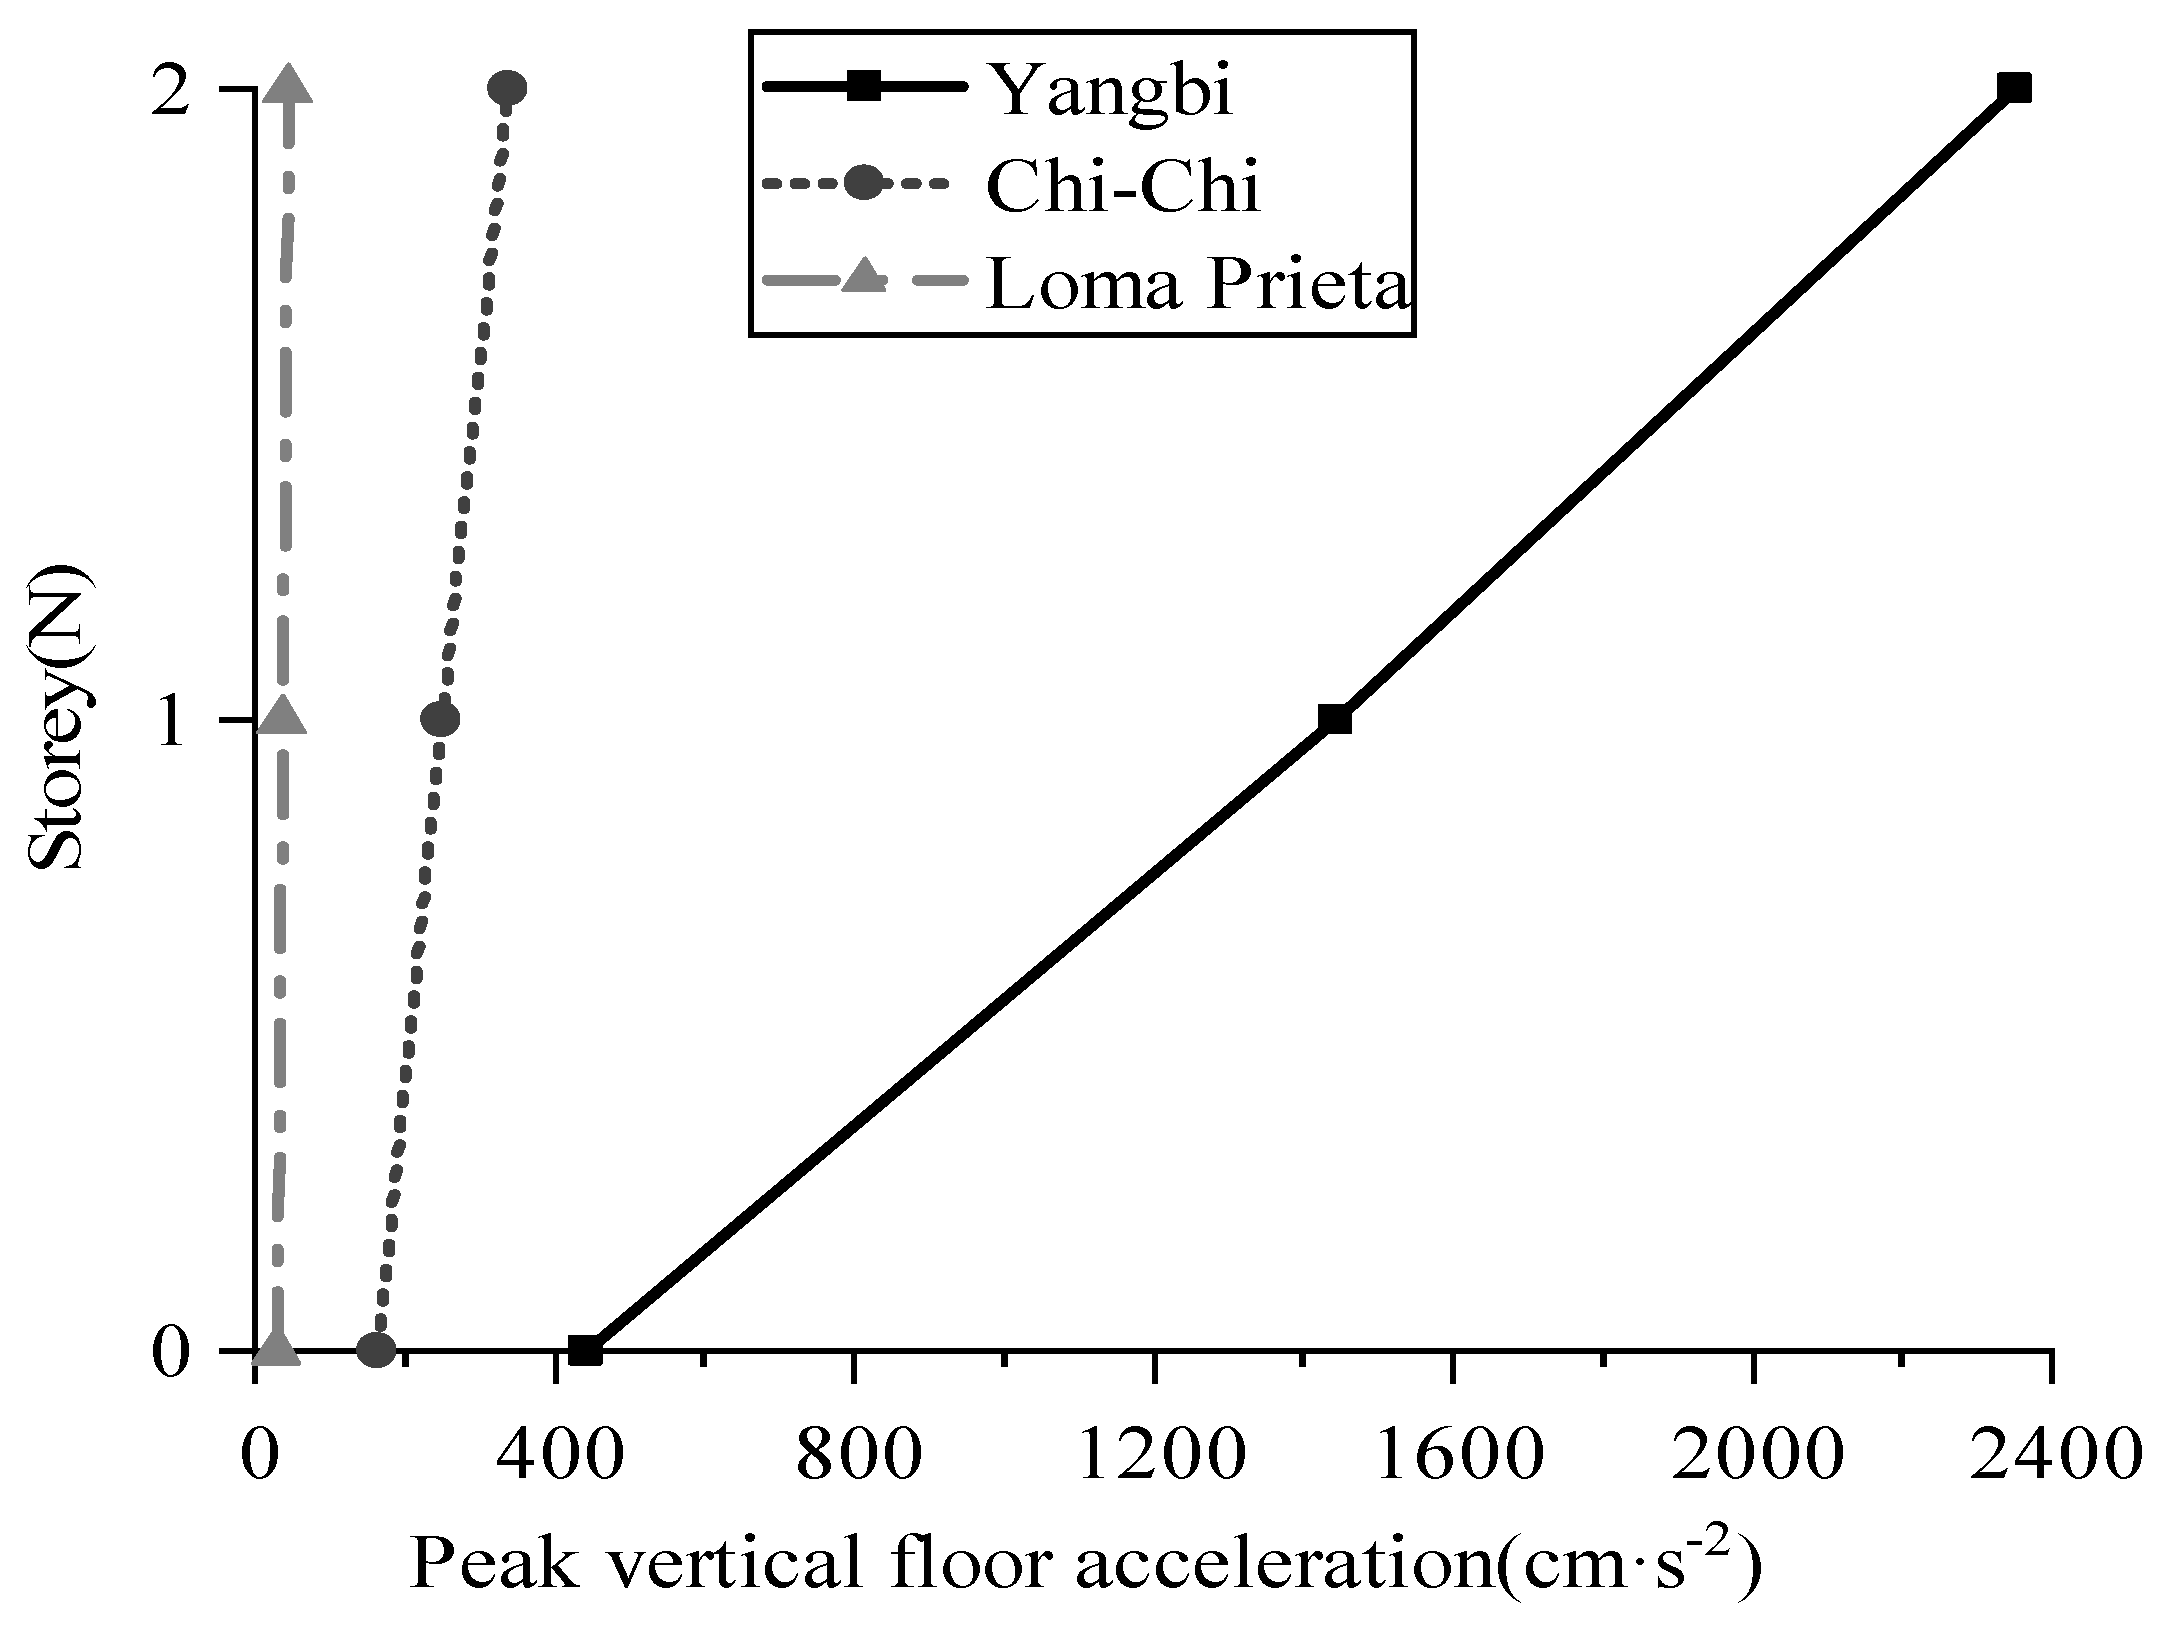
4.3. Comparison of Top-Floor Acceleration

The top acceleration of brick-concrete structure under two working conditions is compared and analyzed. Table 8 shows peaks of the acceleration time history of node 3 and node 4 in three directions for three groups of ground motion.
In Table 8, little difference is observed between EW direction and NS direction in terms of the peak of top floor acceleration under the two working conditions. However, the peak of top floor acceleration in UD direction under H + V is enlarged to varying degrees. At the same time, it is different from the acceleration response of the RC frame structure that the brick-concrete structure shows a strong vertical acceleration response in Yangbi ground motion even under H working conditions, especially in the middle node 4 on the top floor of the structure, and the peak value of vertical acceleration reaches 812 cm/s2, which indicates that the Yangbi horizontal seismic wave has a large impact on the vertical acceleration response of the brick-concrete structure.
To graphically dispaly the amplification effect of three groups of ground motion on the floor acceleration of brick-concrete structure under the H + V working condition, the vertical peak floor acceleration of time history of the ground, floor 1 and floor 2 are selected for comparative analysis with node 4. The Variation of vertical peak floor acceleration of structure under three groups of ground motion was shown in Figure 9.
As can be seen in Figure 9, the vertical peak floor acceleration of the structure under three groups of ground motion changes linearly with the rise of the floor. Yangbi ground motion has an obvious amplification effect on the vertical acceleration of the brick-concrete structure, and the peak of acceleration undergoes a striking change as the floor goes up in higher levels. Besides, the vertical acceleration amplification factor of the top floor (the ratio of peak floor acceleration to peak ground acceleration) is close to 6. While Loma Prieta’s ground motion has no amplification effect on the vertical floor acceleration of the structure.
The reason of Yangbi ground motion’s significant amplification effect on the floor vertical acceleration of the brick-concrete structure was further discussed from the floor acceleration response spectrum. The vertical acceleration response spectrum of the first and second floors of the brick-concrete structure (with node 4 as the reference point) and that of the vertical component of Yangbi ground motion under the H + V working condition are shown in Figure 10. X = 0.041 s in Figure 10 corresponds to the first-order vertical natural motion period of the brick-concrete structure, which is close to the predominant period in the response spectrum of the vertical component of Yangbi ground motion. The vertical acceleration response of the structure increases sharply with the rise of floor level, and reaches the maximum at the top floor of the structure. As the floor level goes up, the acceleration response spectrum value gradually increases at the first-order vertical natural motion period. In the process of spreading up to the upper part of the brick-concrete structure, the Yangbi vertical ground motion almost causes the resonance amplification effect.

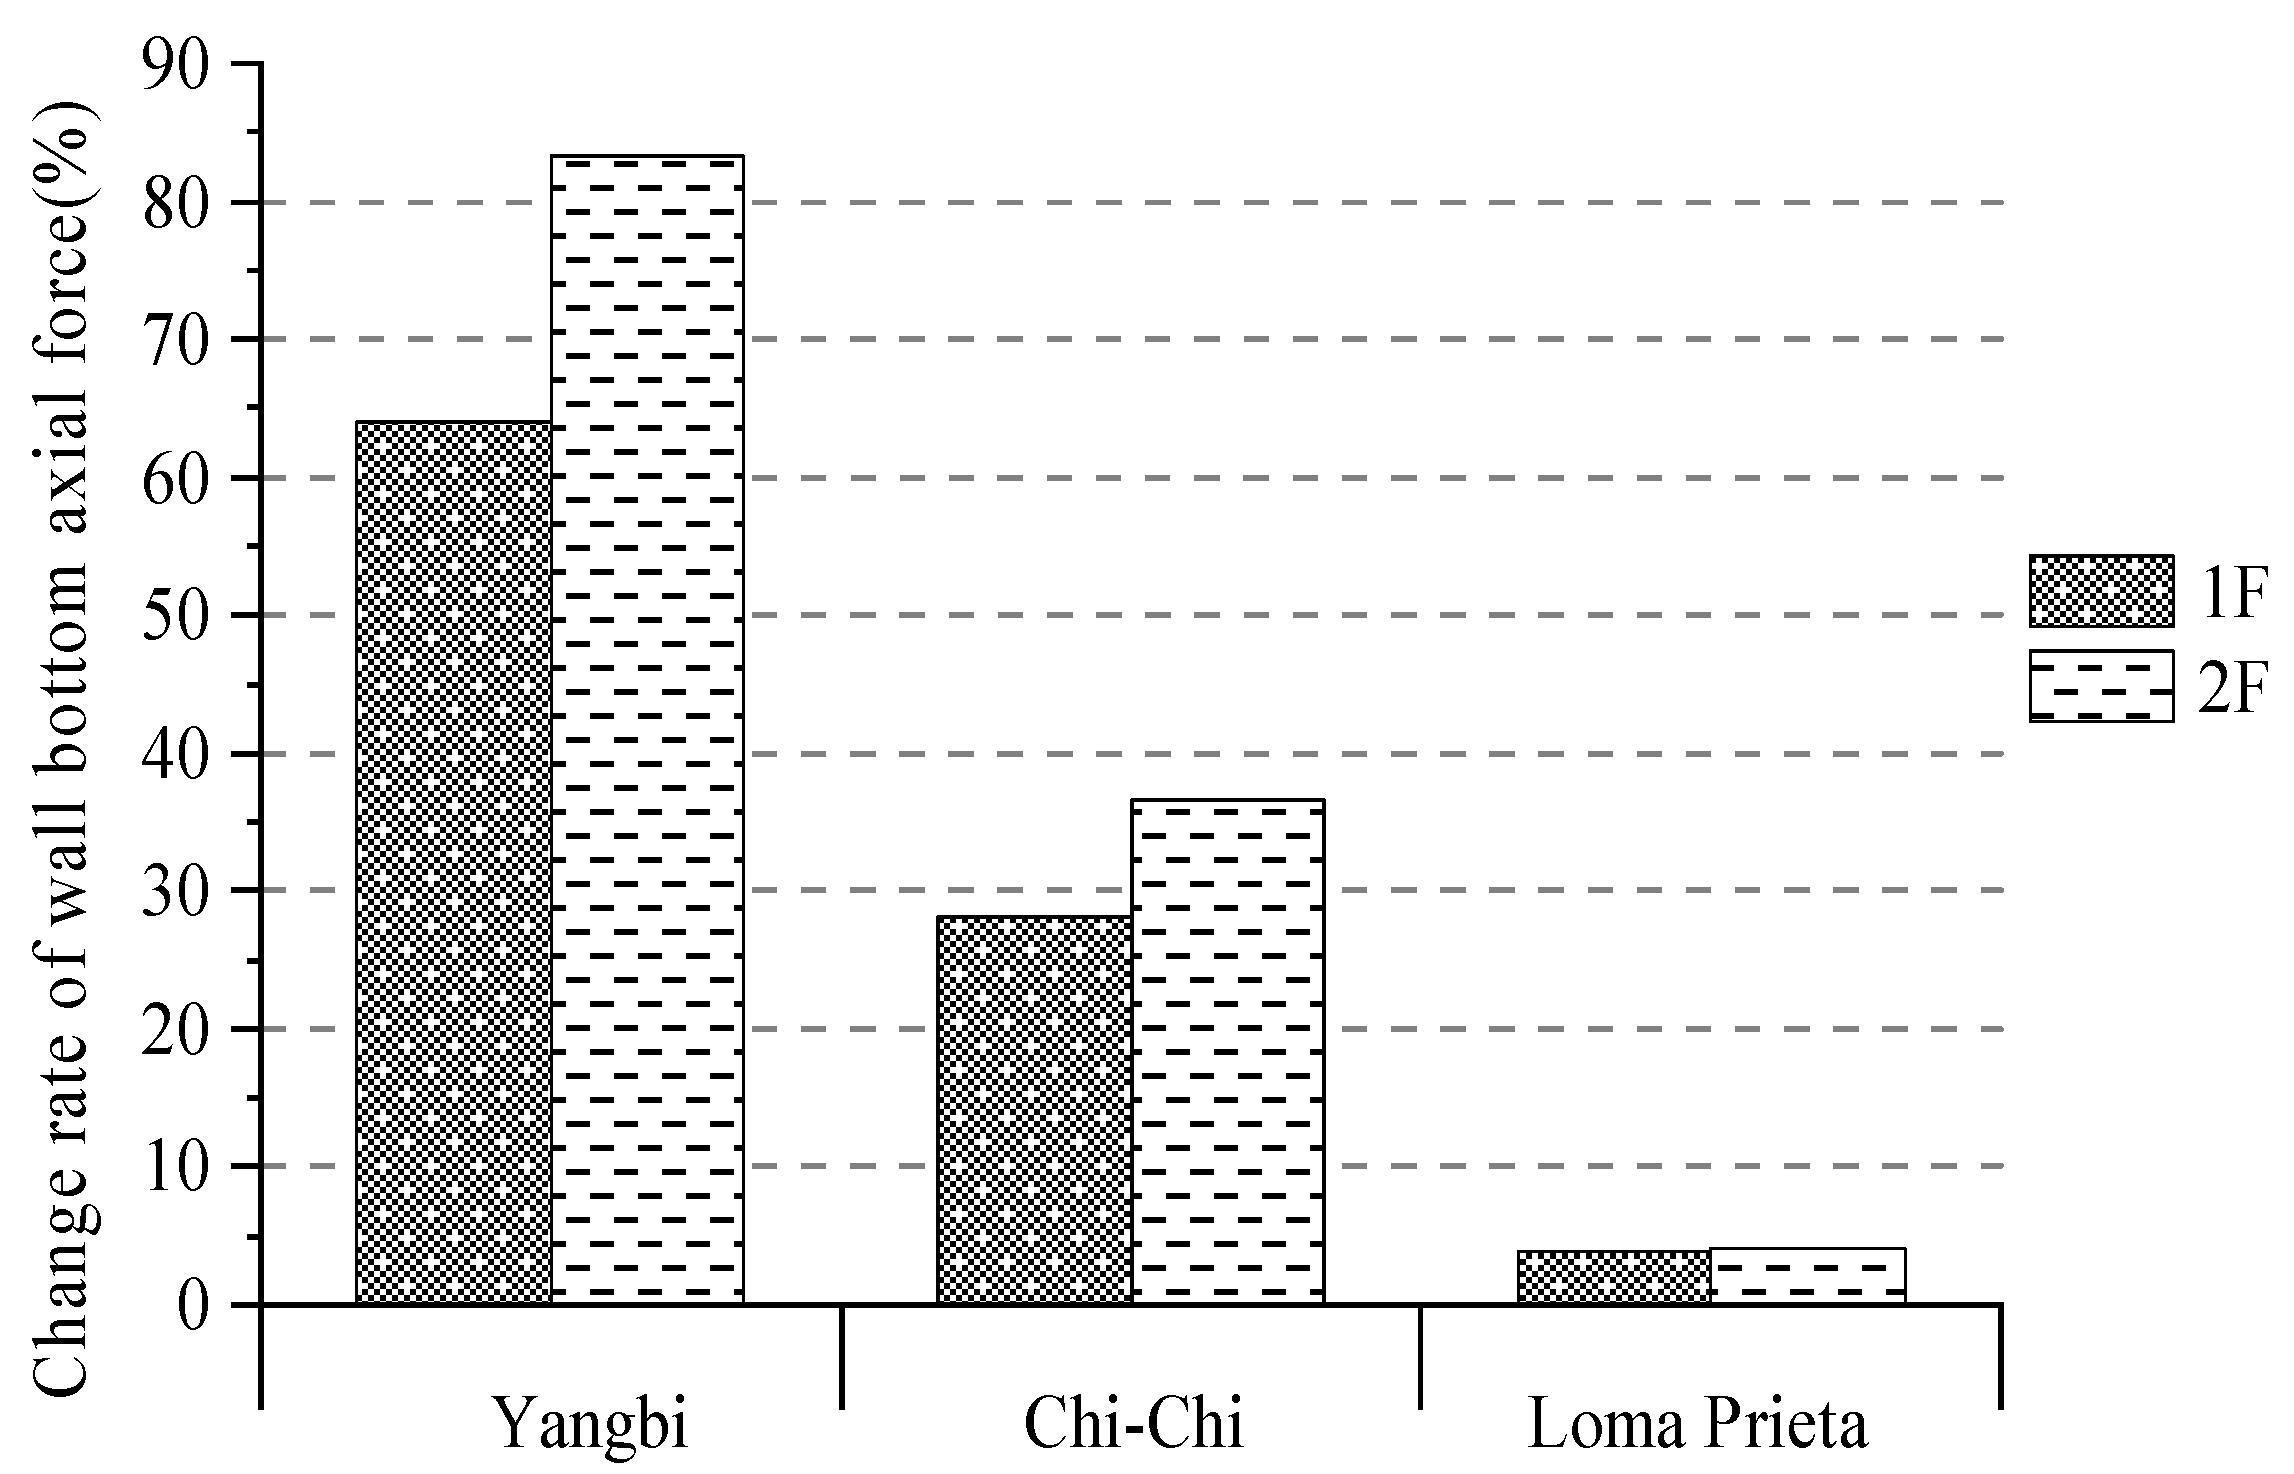
4.4. Comparison of Axial Force at the Bottom of Brick Masonry Walls of Each Floor

The maximum and minimum axial forces at each floor’s bottom of all brick masonry walls under two working conditions are compared and analyzed. Table 9 shows the maximum and minimum axial forces at the bottom of the walls of each floor under two working conditions of three groups of ground motion (positive values represent compression). In Table 9, negative axial force occurs under the H + V condition of Yangbi ground motion, indicating that the walls have been pulled.
Maximum value of axial force is selected to analyze the variation law of axial force at the bottom of structural brick masonry walls, and the variation rate of the maximum value of axial force under H + V as well as under H of three groups of ground motion, as shown in Figure 11. It can be seen from Figure 11 that the change rate of axial force at the bottom of brick masonry walls gradually increases with the rise of floor. Compared with other ground motions, the maximum axial force of brick masonry walls significantly increases because of the vertical component of Yangbi ground motion. Additionally, the change rate reaches the maximum at the structure’s top layer, 83.3%. The influence of normal far-field motion Loma Prieta on the axial force response of the bottom of brick masonry walls of each layer of the structure is the smallest among the three groups of ground motion. Even if there is the influence of vertical ground motion, the change rate of axial force is no more than 5%.

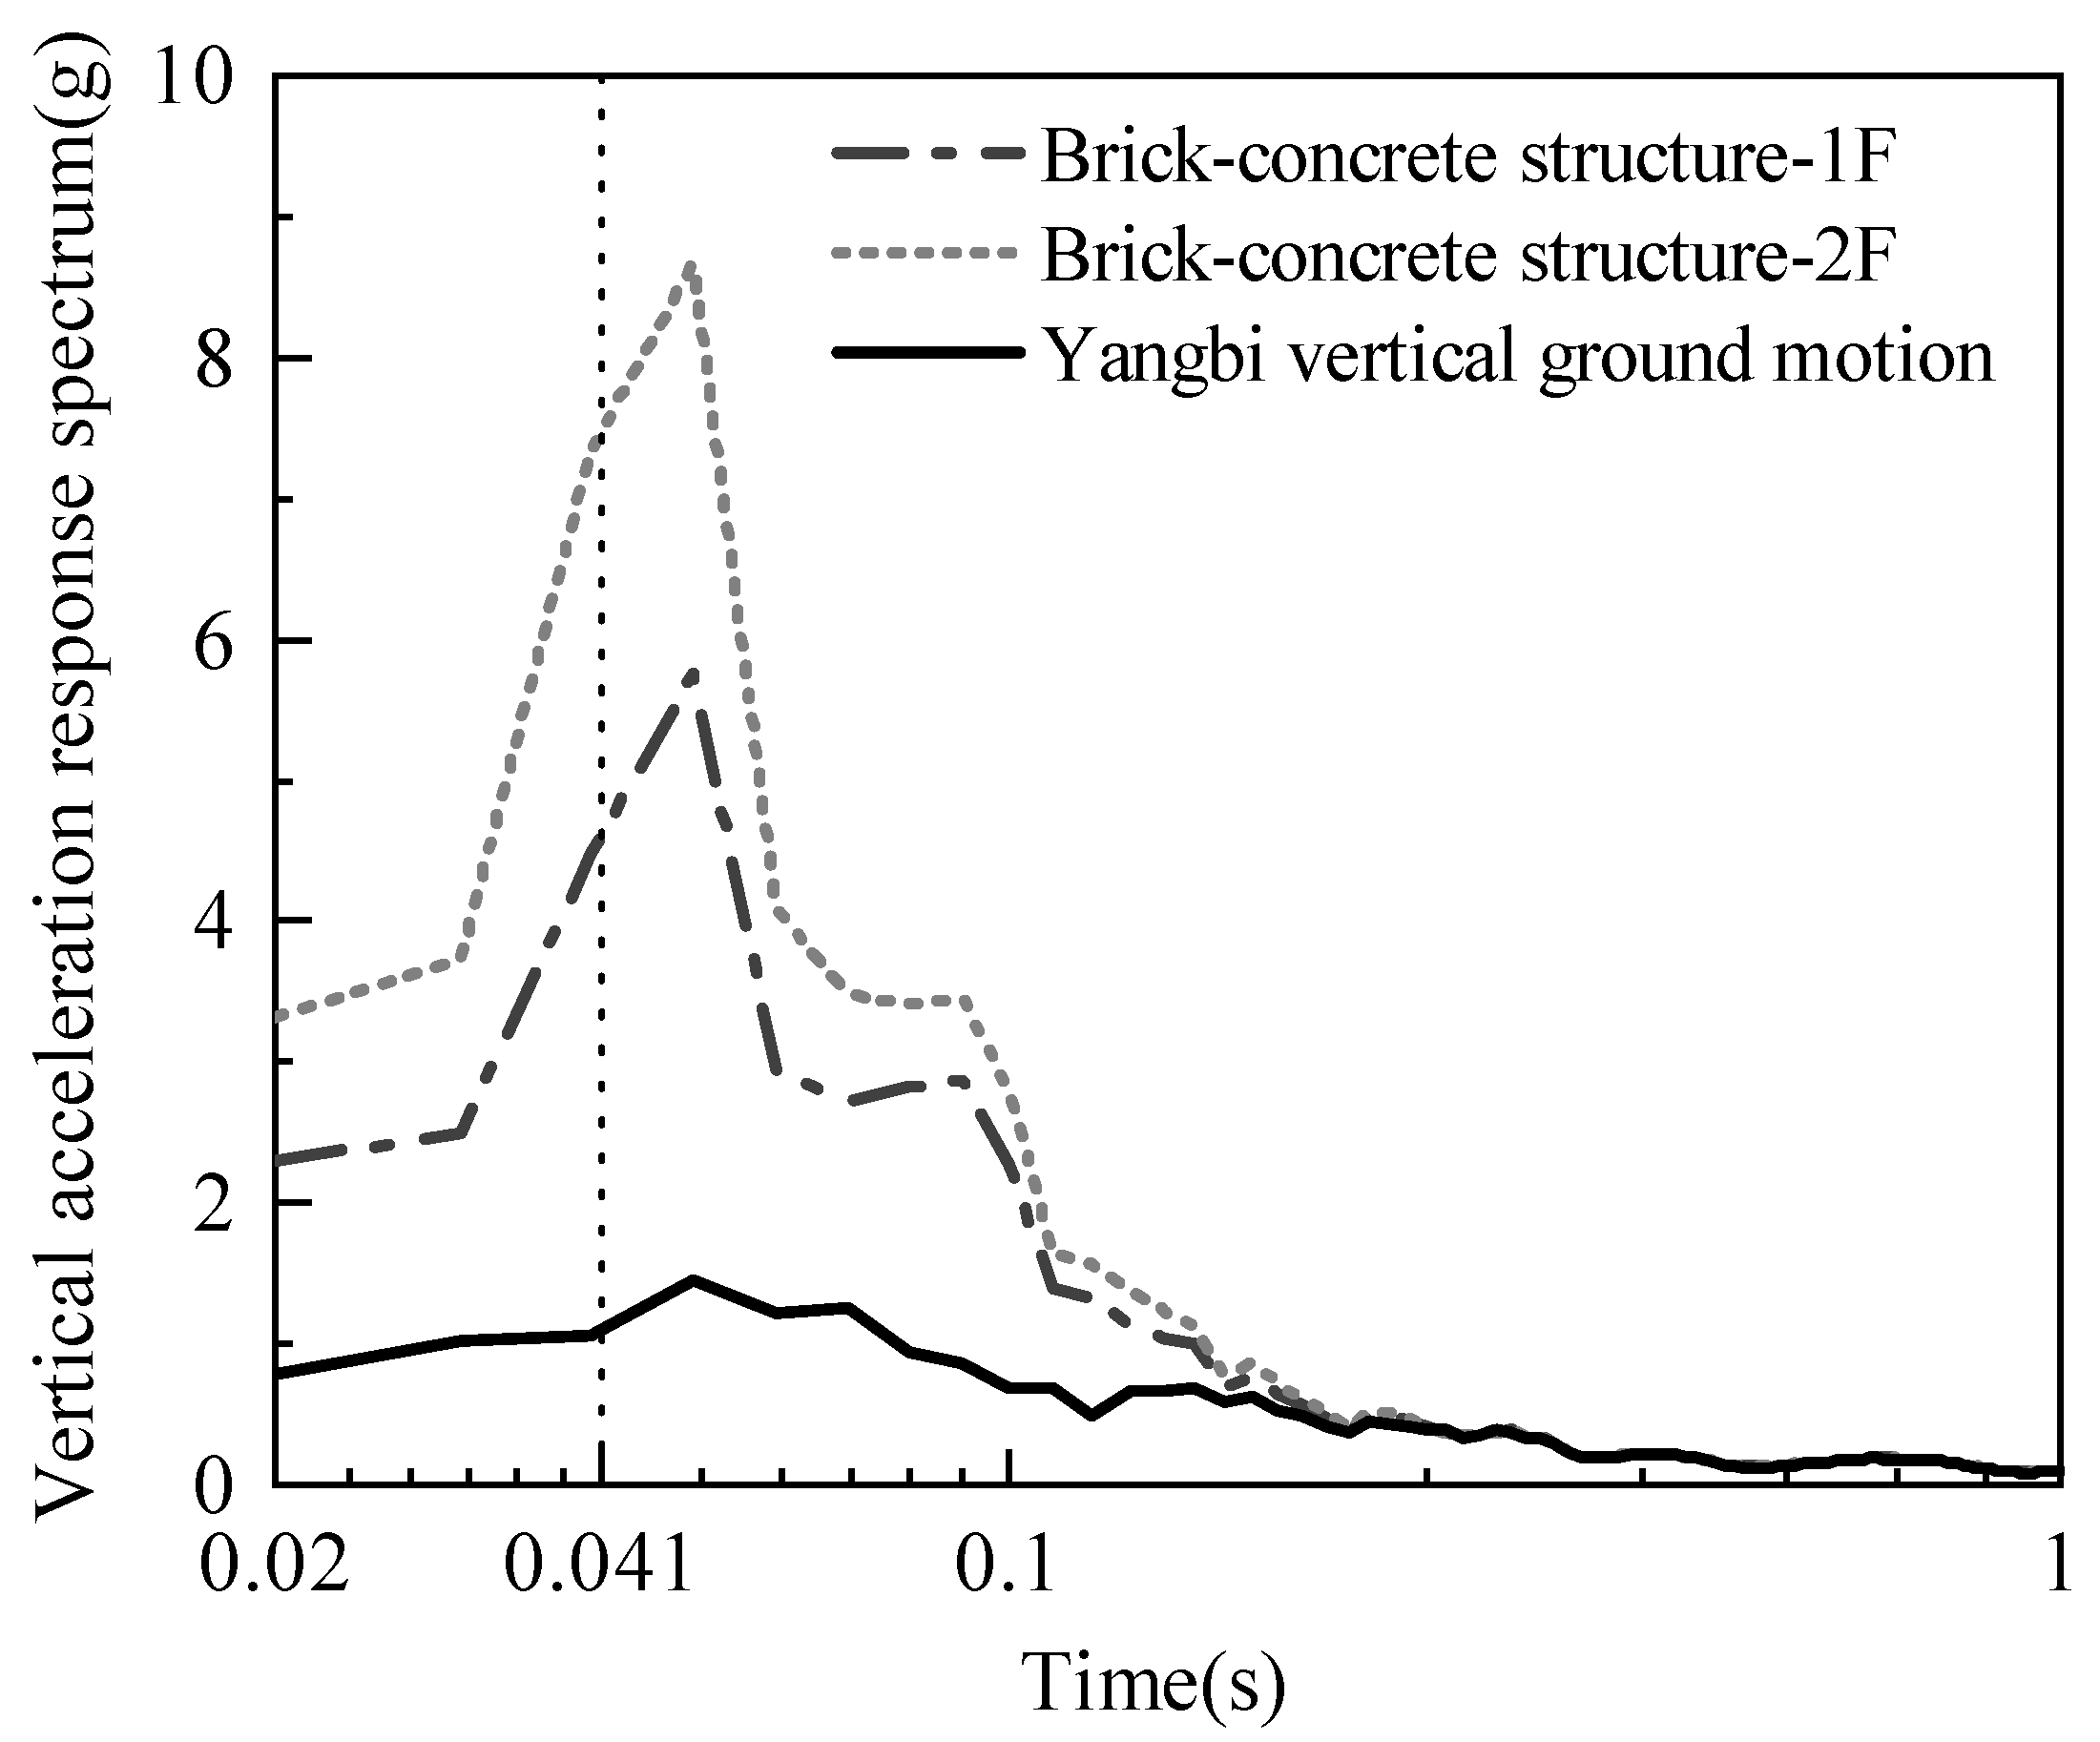
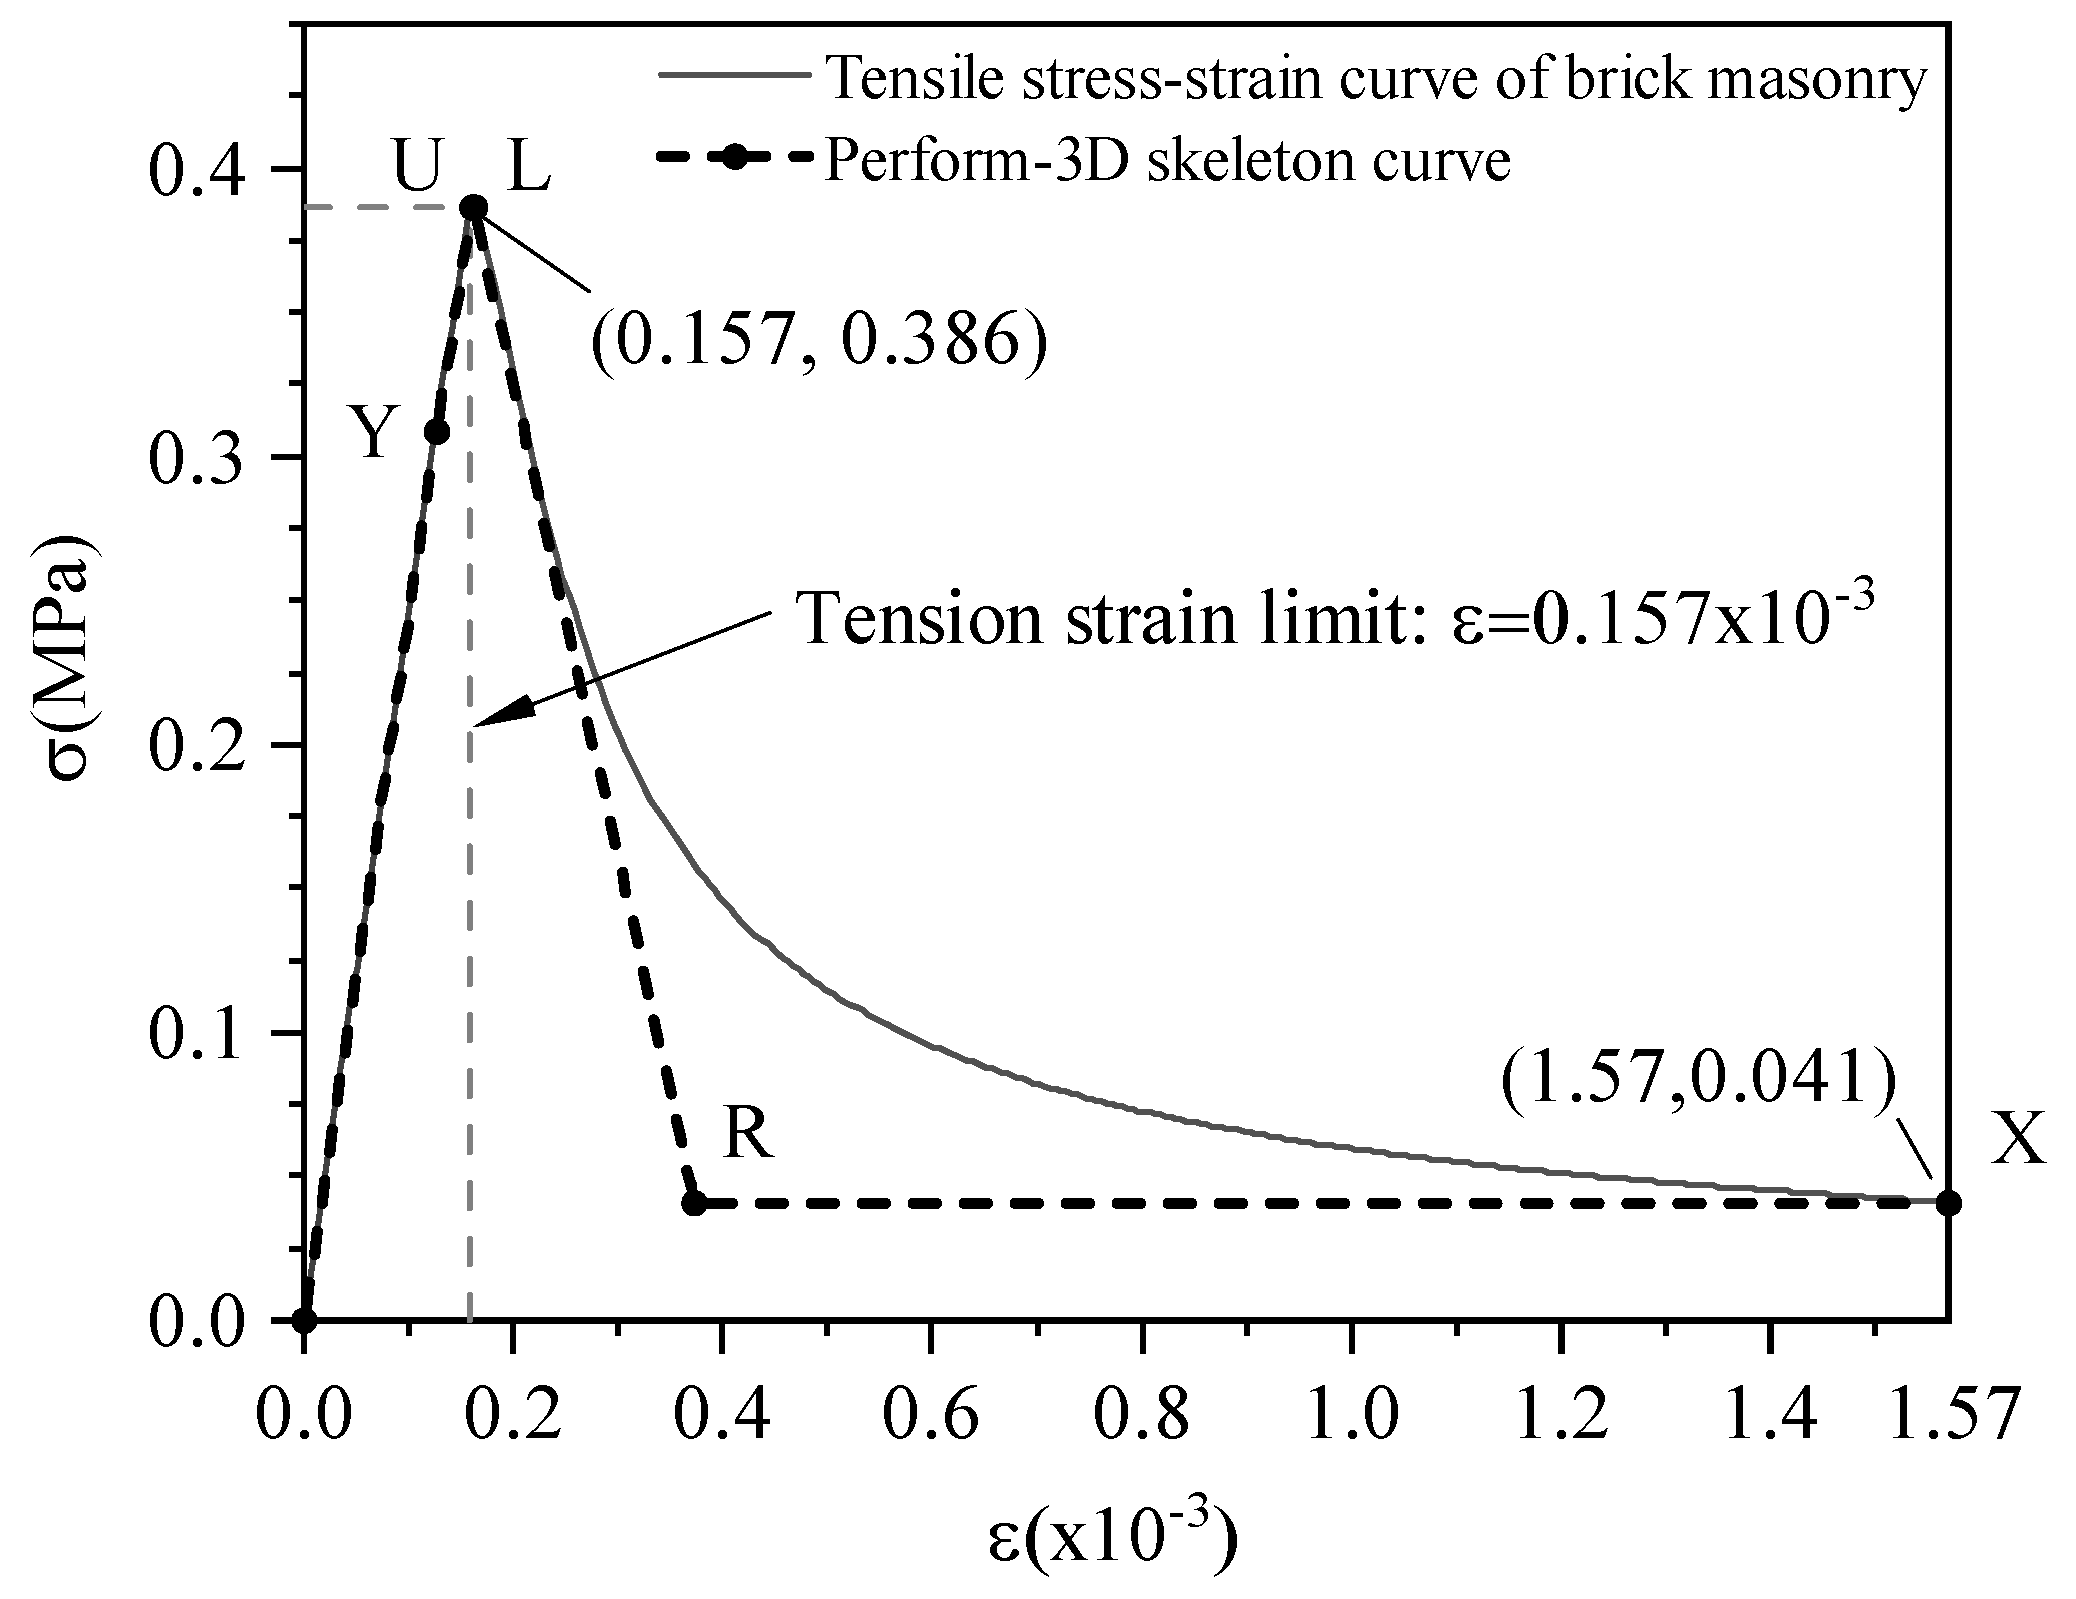
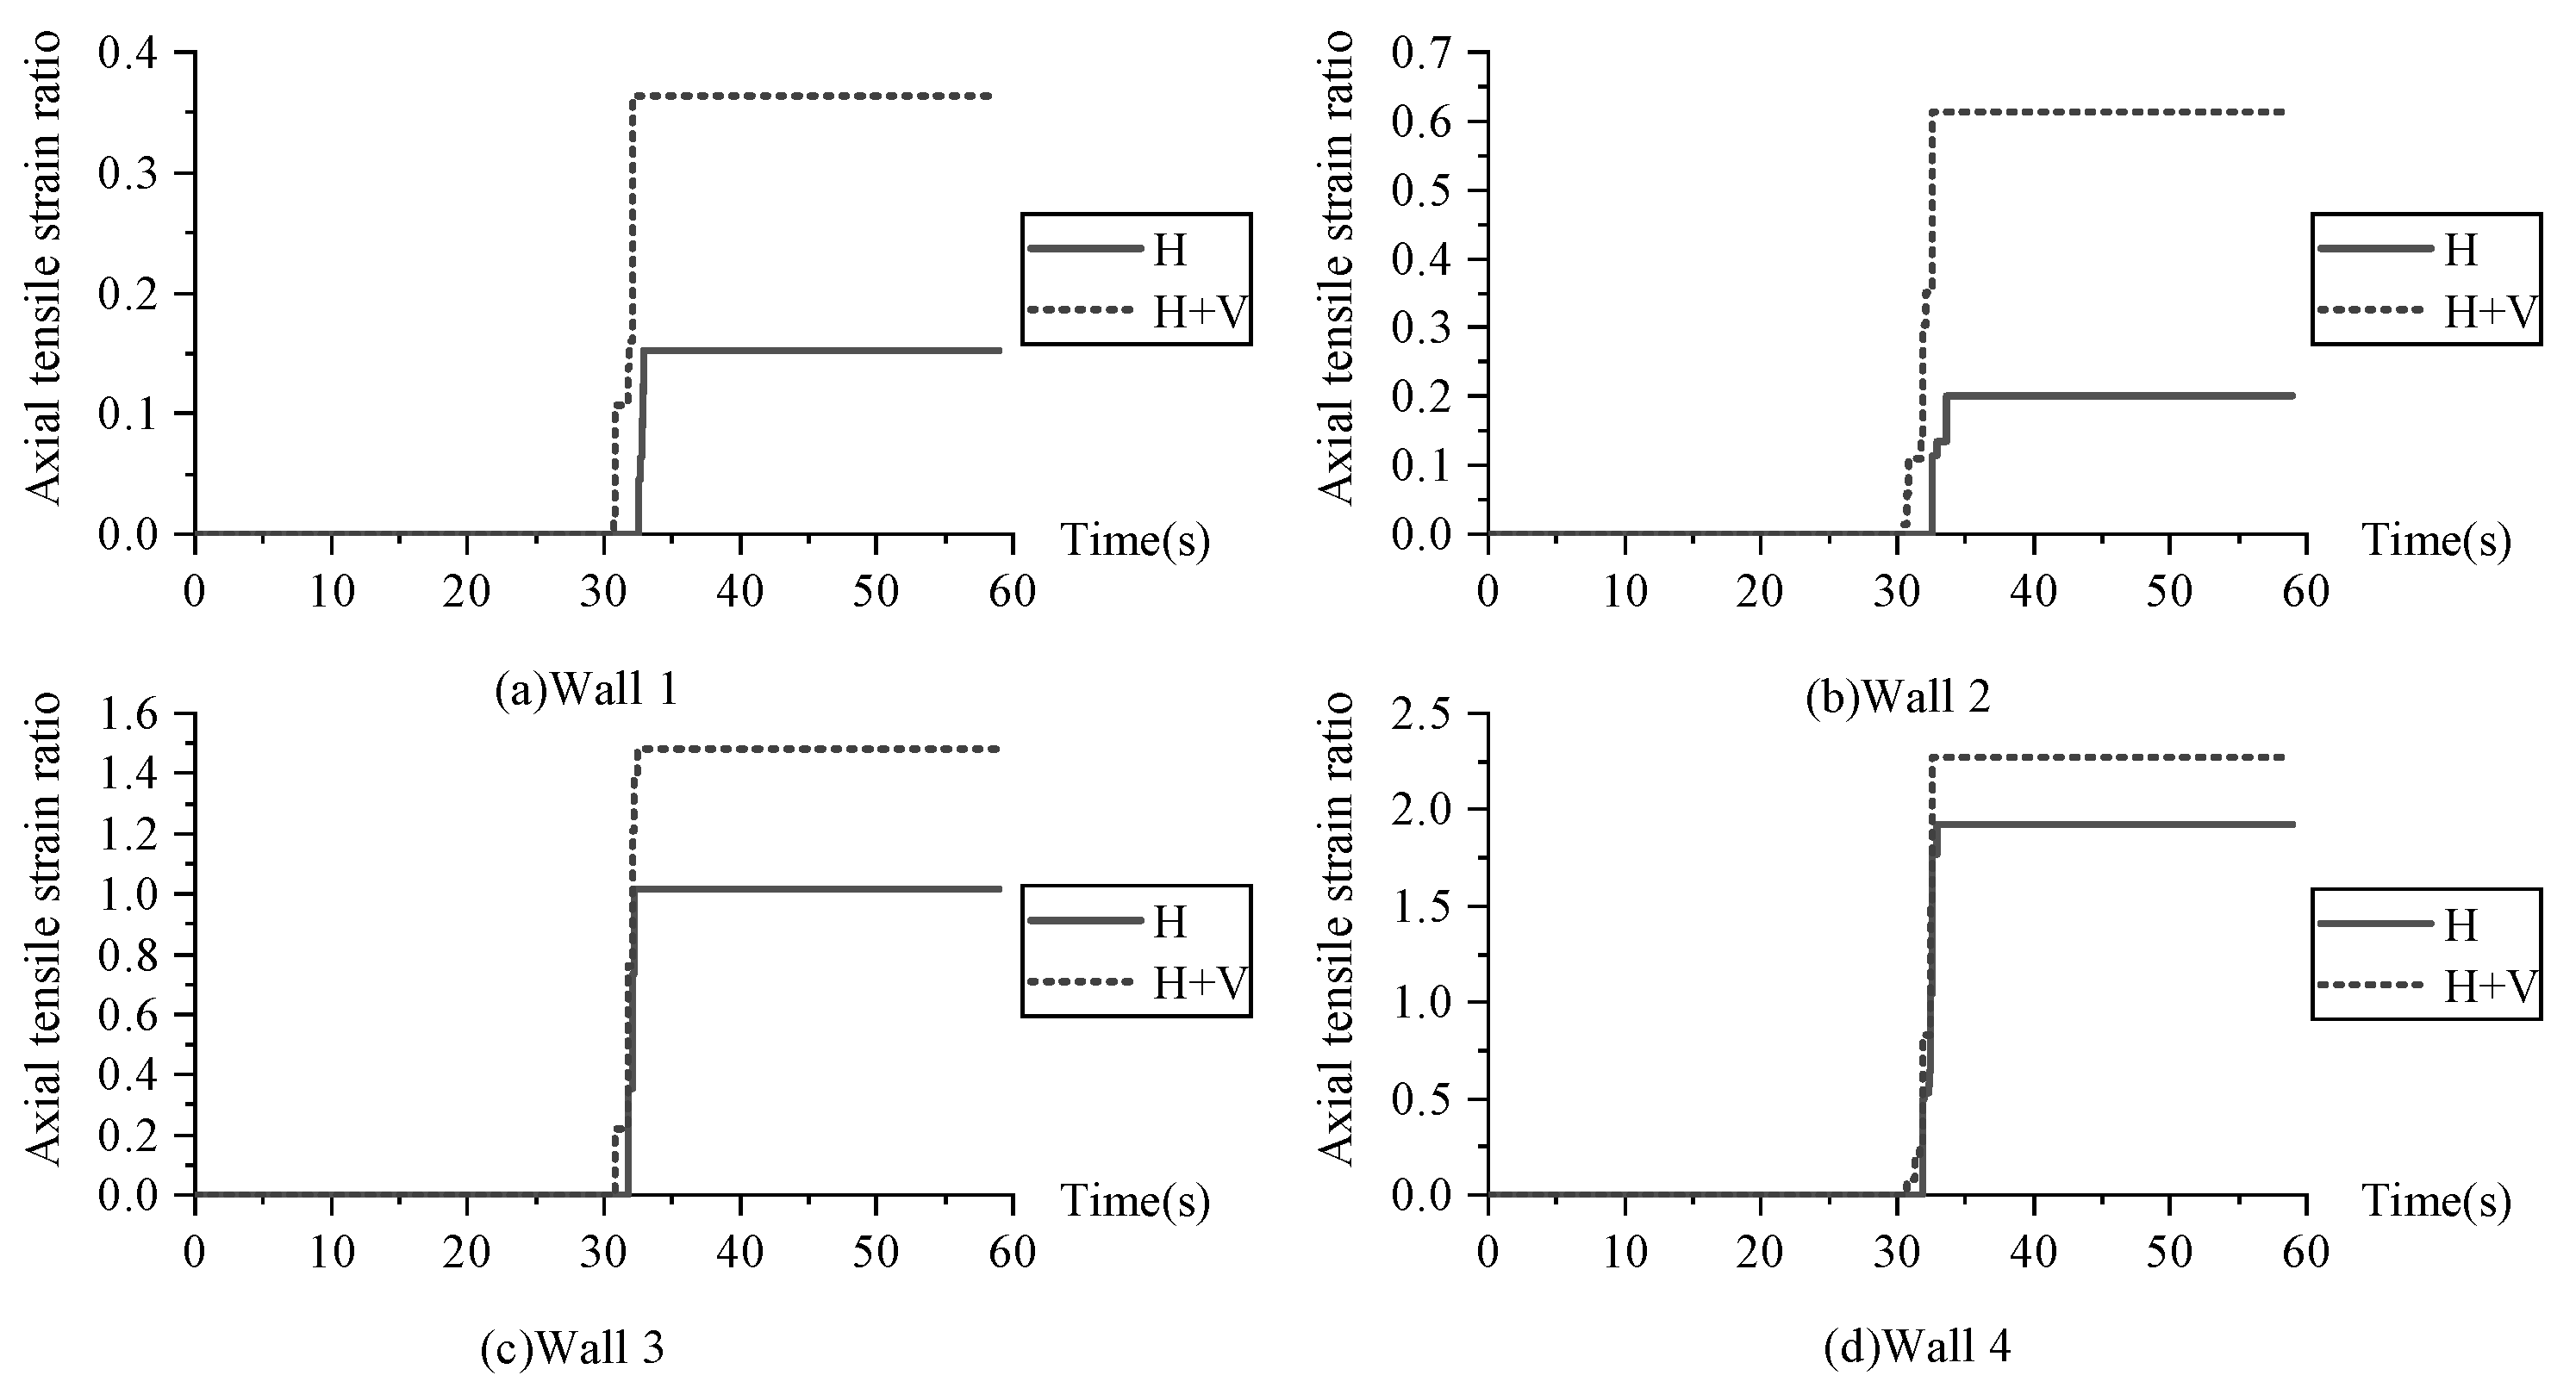
4.5. Analysis of the Tensile State of Brick Masonry Wall under Yangbi Ground Motion

The above analysis shows that the brick masonry wall has vertically tensioned under the H + V condition of Yangbi ground motion. Given the masonry structure’s characteristics, the masonry walls’ compressive properties are good, but the tensile properties are poor. Therefore, the masonry wall is prone to brittle failure under tension. The following is an in-depth analysis of the tensile state of the brick masonry wall under Yangbi ground motion.The tensile stress–strain relationship of masonry is as follows [41]:
{ σ ƒ tm = ( ε ε t ) ε ε t 1 σ ƒ tm = ε / ε t 2 ( ε / ε t 1 ) 1.7 + ε / ε t ε ε t > 1
The ultimate tensile strain of masonry in the tensile constitutive model is 10 times the strain corresponding to the average tensile strength. According to the brick masonry’s uniaxial tensile strength (ftm = 0.386 MPa) and tensile peak strain (εt = 0.000157), the tensile stress–strain curve of brick masonry is recorded in Figure 12. Based on Perform-3D, the tensile uniaxial constitutive model is defined by “YULRX” five-fold linear skeleton curve. The corresponding positions of the five key points are marked in Figure 12. In Perform-3D, the Limit States function is used to define the limit state value of tensile deformation of masonry (tension strain limit: ε = 0.000157), which means that the wall will be subject to tensile failure when the strain of masonry material exceeds this limit.
Under the effect of an earthquake, the failure of the wall between windows in a masonry structure greatly impacts the performance of earthquake resistance of the whole structure [42]. So this article mainly analyzes the axial tension of the wall between windows of the brick-concrete structure. Four masonry wall elements between windows on the first and second floors of the outer longitudinal wall corresponding to axis A in Figure 8a are selected for maximum axial strain analysis. The specific location of the four shear wall elements is illustrated in Figure 13. Wall 1 and wall 2 are on the second floor of the structure, and wall 3 and wall 4 are on the first floor.
The time history data of the maximum axial tensile fiber strain in four wall elements are selected. The ratio of the maximum axial tensile strain of wall element to the ultimate tensile strain of brick masonry ε = 0.000157 is defined as the axial tensile strain ratio. The variation of the axial tensile strain ratio of four wall elements with seismic time under two working conditions of Yangbi ground motion is shown in Figure 14.
As can be seen from Figure 14, the axial tensile strain of wall 3 and wall 4 on the first floor is apparently more intensive than that of wall 1 and wall 2 on the second floor, indicating that the masonry wall on the bottom floor of the structure is more vulnerable to tensile failure. For wall 3, the maximum axial tensile strain exceeds masonry’s ultimate tensile strain value. However, it has not reached the significant degradation point L, which suggests that the wall can also bear a specific history of vertical tension. However, the axial tensile strain ratio of wall 3 increases to 1.48 because of the effect of vertical ground motion, which intensifies the tensile failure of the masonry window wall. For wall 1 and wall 2, although there is no axial tensile failure, it can be seen that the maximum axial tensile strain of the wall significantly increases under the effect of vertical ground motion. In addition, the tensile time of the wall under H + V condition is earlier than that under H condition, which indicates that the possible faster tensile failure of the structure wall can be increased as a result of vertical ground motion.
The analysis results of the vertical ground motion on the typical RC frame and brick masonry structures in Yangbi region can be used for post-seismic damage prediction and performance assessment. It also indicates that the effect of vertical ground motion on the seismic response of these two structures cannot be ignored. There are still many low masonry-timber structures in Yangbi region, the effects of vertical ground motion components on these structures under strong earthquakes need further study. In addition, site conditions are very complex, which also leads to the complexity of the earthquake environment. It is necessary to further study the influence of the refinement of site conditions on the ground motion characteristics and the seismic performance of the building structure.

5. Conclusions

Taking the three ground motions of Yangbi, Chi-Chi, and Loma Prieta as inputs, this essay analyzes the seismic dynamic time history of an RC frame structure and a brick-concrete structure under H and H + V conditions, and studies the influence of vertical component of the ground motions on the both structures’ dynamic response. The main results are as follows:
(1) For the RC frame structure, the vertical component of Yangbi ground motion significantly influences the response of the top floor’s vertical displacement acceleration as well as column bottom axial force of each floor. The results show that the maximum change rate of vertical displacement amplitude of the structure’s top floor is 213.6%. The maximum ratio of the peak vertical acceleration of the top floor under H + V to H is 34.22.
(2) Compared with under the H condition, the maximum axial force at each floor’s bottom of frame columns under the H + V condition increases by 145.7%.However, the vertical component has different amplification effects on its axial pressure and column bottom bending moment. Therefore, it is suggested that the influence of vertical ground motion on the bearing capacity of columns should be considered in the earthquake-resistant design of RC frame structures in high-intensity areas.
(3) For the brick-concrete structure, among the three groups of ground motion, the vertical component of Yangbi ground motion has the most significant influence on the response of the vertical displacement of the top floor, the vertical acceleration of the top floor, and the axial force at the bottom of the masonry wall of each floor. The maximum change rate of vertical displacement amplitude of the structure’s top floor is 66.9%. The vertical component of ground motion has a more obvious influence on the vertical displacement of top-level edge nodes. Due to the resonance amplification effect caused by the vertical component of Yangbi ground motion spreading up to the upper part of the brick-concrete structure, the vertical acceleration response of the structure increases sharply with the rise of the floor and reaches the maximum on the top floor of the structure. Compared with under the H condition, the maximum axial force at the bottom of the masonry walls of each floor raise by 83.3% under the H + V condition.
(4) Under the Yangbi ground motion, bottom masonry wall of the brick-concrete structure is more vulnerable to tensile damage, vertical component of the ground motions can significantly increase maximum axial tensile strain of the wall and increase the possibility of fast tensile failure.
For ordinary RC frames and brick-concrete structures, the influence of the ground motion’s vertical component on structural dynamic response is rarely considered by the design codes. It can be concluded that the effect of Yangbi ground motion’s vertical component in the structures’ epicenter area can not be neglected, and can be helpful in the seismic damage investigation near Yangbi station.

Author Contributions

Conceptualization, H.W.; methodology, M.J.; software, Z.Z.; formal analysis, H.W. and M.J.; investigation, H.W.; resources, H.W. and X.C.; writing—original draft preparation, H.W. and Z.Z.; writing—review and editing, H.W. and Y.Y.; visualization, Z.Z. and Y.Y.; supervision, X.C.; project administration, H.W.; funding acquisition, X.C. All authors have read and agreed to the published version of the manuscript.

Funding

This work was supported by a grant from the Chinese National key research and development program (the funding number:2019YFC1509403).

Data Availability Statement

Thanks to the Institute of Engineering Mechanics, China Earthquake Administration for providing the data.

Conflicts of Interest

The authors declare no conflict of interest.

References

  1. Zucconi, M.; Bovo, M.; Ferracuti, B. Fragility Curves of Existing RC Buildings Accounting for Bidirectional Ground Motion. Buildings 2022, 12, 872. [Google Scholar] [CrossRef]
  2. Yi, W.; Wang, W. Effect of vertical ground motion on seismic behavior of RC frame in near-fault region. Tumu Gongcheng Xuebao China Civ. Eng. J. 2012, 45, 81–88. [Google Scholar]
  3. Huang, L.; Han, J.; Wen, H.; Li, C.; He, H.; Luo, Y.; Qian, Z. The Seismic Performance and Global Collapse Resistance Capacity of Infilled Reinforced Concrete Frames Considering the Axial-Shear-Bending Interaction of Columns. Buildings 2022, 12, 2030. [Google Scholar] [CrossRef]
  4. Gallardo, J.A.; de la Llera, J.C.; Santa María, H.; Chacón, M.F. Damage and sensitivity analysis of a reinforced concrete wall building during the 2010, Chile earthquake. Eng. Struct. 2021, 240, 112093. [Google Scholar] [CrossRef]
  5. Trifunac, M.D.; Todorovska, M.I. A note on energy of strong ground motion during Northridge, California, earthquake of January 17, 1994. Soil Dyn. Earthq. Eng. 2013, 47, 175–184. [Google Scholar] [CrossRef]
  6. Nguyen, V.Q.; Nizamani, Z.A.; Park, D.; Kwon, O.-S. Numerical simulation of damage evolution of Daikai station during the 1995 Kobe earthquake. Eng. Struct. 2020, 206, 110180. [Google Scholar] [CrossRef]
  7. Lin, M.L.; Lin, C.H.; Li, C.H.; Liu, C.Y.; Hung, C.-H. 3D modeling of the ground deformation along the fault rupture and its impact on engineering structures: Insights from the 1999 Chi-Chi earthquake, Shigang District, Taiwan. Eng. Geol. 2021, 281, 105993. [Google Scholar] [CrossRef]
  8. Jia, J.F.; Ou, J.P. Vertical-to-horizontal acceleration response spectrum ratio of near-fault ground motion. Acta Seismol. Sin. 2010, 32, 41–50. (In Chinese) [Google Scholar]
  9. Chen, L.K.; Zhang, N.; He, X. Effects of directivity pulse and vertical earthquake on seismic response of high-speed railway bridge. J. Vib. Eng. 2016, 29, 704–713. [Google Scholar] [CrossRef]
  10. Quaranta, G.; Angelucci, G.; Mollaioli, F. Near-fault earthquakes with pulse-like horizontal and vertical seismic ground motion components: Analysis and effects on elastomeric bearings. Soil Dyn. Earthq. Eng. 2022, 160, 107361. [Google Scholar] [CrossRef]
  11. Kim, S.J. Seismic Assessment of RC Structures Considering Vertical Ground Motion; Mid-America Earthquake Center: Champaign, IL, USA, 2008. [Google Scholar]
  12. He, Z.; Zhang, H. Spectrum elements for simulating responses of ultra high-rise building structures excited by vertical component of impulse-type strong earthquakes. Harbin Gongye Daxue Xuebao J. Harbin Inst. Technol. 2014, 46, 72–77. [Google Scholar]
  13. Li, C.; Ji, D.; Zhai, C.; Ma, Y.; Xie, L. Vertical ground motion model for the NGA-West2 database using deep learning method. Soil Dyn. Earthq. Eng. 2023, 165, 107713. [Google Scholar] [CrossRef]
  14. Diotallevi, P.; Landi, L. Effect of the axial force and of the vertical ground motion component on the seismic response of R/C frames. In Proceedings of the 12th World Conference on Earthquake Engineering, Auckland, New Zealand, 30 January–4 February 2000. [Google Scholar]
  15. Jara, J.M.; Hernández, E.J.; Olmos, B.A. Effect of epicentral distance on the applicability of base isolation and energy dissipation systems to improve seismic behavior of RC buildings. Eng. Struct. 2021, 230, 111727. [Google Scholar] [CrossRef]
  16. Poreddy, L.; Pathapadu, M.; Navyatha, C.; Vemuri, J.; Chenna, R. Correlation analysis between ground motion parameters and seismic damage of buildings for near-field ground motions. Nat. Hazards Res. 2022, 2, 202–209. [Google Scholar] [CrossRef]
  17. Işık, E.; Peker, F.; Buyuksarac, A. The Effect of Vertical Earthquake Motion on Structural Behaviour in Steel Structures in Different Seismic Zones. J. Adv. Res. Nat. Appl. Sci. 2022, 8, 527–542. [Google Scholar] [CrossRef]
  18. Bas, S.; Kalkan, I.; Lee, J.H. Structural behavior of a high-rise RC structure under vertical earthquake motion. In Proceedings of the 2016 Structures Congress (Structures16), Jeju Island, Republic of Korea, 28 August–1 September 2016. [Google Scholar]
  19. Rinaldin, G.; Fasan, M.; Noé, S.; Amadio, C. The influence of earthquake vertical component on the seismic response of masonry structures. Eng. Struct. 2019, 185, 184–1937. [Google Scholar] [CrossRef]
  20. Wang, X.; Su, Y.; Kong, J.; Gong, M.; Liu, C. The Over-Strength Coefficient of Masonry-Infilled RC Frame Structures under Bidirectional Ground Motions. Buildings 2022, 12, 1290. [Google Scholar] [CrossRef]
  21. Li, X.; Dou, H.; Zhu, X. Engineering characteristics of near-fault vertical ground motions and their effect on the seismic response of bridges. Earthq. Eng. Eng. Vib. 2007, 6, 345–350. [Google Scholar] [CrossRef]
  22. Khan, M.; Ali, M. Optimization of concrete stiffeners for confined brick masonry structures. J. Build. Eng. 2020, 32, 101689. [Google Scholar] [CrossRef]
  23. Cao, M.; Khan, M. Effectiveness of multiscale hybrid fiber reinforced cementitious composites under single degree of freedom hydraulic shaking table. Struct. Concr. 2021, 22, 535–549. [Google Scholar] [CrossRef]
  24. Chen, Z.; Zhu, Y.; Lu, X.; Lin, K. A simplified method for quantifying the progressive collapse fragility of multi-story RC frames in China. Eng. Fail. Anal. 2023, 143, 106924. [Google Scholar] [CrossRef]
  25. Yong, M.; Hai-Jiang, Z.; Lei, G.; Jin-Meng, B. Three-dimensional high-resolution velocity structure imaging and seismicity study of Yangbi Ms6.4 earthquake. Appl. Geophys. 2021, 18, 579–591. [Google Scholar] [CrossRef]
  26. Lu, D.W.; Yang, Z.B. Strong Motion Observation from Recent Destructive Earthquakes in China Mainland. Appl. Mech. Mater. 2015, 724, 358–361. (In Chinese) [Google Scholar] [CrossRef]
  27. Tian, W.T.; Dong, J.H.; Yang, B.; Zhao, L.H. Basic characteristics of the three elements of strong ground motion of the Yangbi M6.4 earthquake in Yunnan Province. China Earthq. Eng. J. 2021, 43, 760–766. (In Chinese) [Google Scholar]
  28. Wang, H.D.; Liu, B.C.; Chang, F. The selection principle of near-field horizontal ground motions and characteristics of elastic response spectra for pulse-type horizontal ground motion. Earthq. Eng. Eng. Dyn. 2019, 39, 222–230. (In Chinese) [Google Scholar]
  29. Sriwastav, R.K.; Basu, D. Vertical spectra consistent with horizontal seismic hazard. Soil Dyn. Earthq. Eng. 2022, 157, 107242. [Google Scholar] [CrossRef]
  30. Kasai, K.; Maison, B.F. Building pounding damage during the 1989 Loma Prieta earthquake. Eng. Struct. 1997, 19, 195–207. [Google Scholar] [CrossRef]
  31. Computers and Structures, Inc. Nonlinear Analysis and Performance Assessment for 3d Structures User Guide; Computers and Structures, Inc.: Berkeley, CA, USA, 2006. [Google Scholar]
  32. Kent, D.C.; Park, R. Flexural Members with Confined Concrete. J. Struct. Div. 1971, 97, 1969–1990. [Google Scholar] [CrossRef]
  33. Scott, B.; Park, R.; Priestley, M.J.N. Stress-Strain Behavior of Concrete Confined by Overlapping Hoops at Low and High Strain Rates. ACI J. 1982, 79, 13–27. [Google Scholar]
  34. Guo, Z.M.; Fang, Y.P.; Yu, L.G.; Li, Y.C.; Guo, M. Dynamic elastic-plastic comparative analysis of high-rise structure based on PERFORM-3D and STRAT. Build. Struct. 2020, 50, 257–265. (In Chinese) [Google Scholar]
  35. Papazoglou, A.J.; Elnashai, A.S. Analytical and field evidence of the damaging effect of vertical earthquake ground motion. Earthq. Eng. Struct. Dyn. 1996, 25, 1109–1137. [Google Scholar] [CrossRef]
  36. Wang, X.L.; Lu, X.Z.; Ye, L.P. Analysis of earthquake-resistant behaviors of RC columns under variable axial loads. Ind. Constr. 2007, 71–75. (In Chinese) [Google Scholar]
  37. Cheng, X.; Ji, X.; Henry, R.S.; Xu, M. Coupled axial tension-flexure behavior of slender reinforced concrete walls. Eng. Struct. 2019, 188, 261–276. [Google Scholar] [CrossRef]
  38. Wu, Z.B.; Zhou, X.X.; Xie, W.; An, X.J. Statistics of wenchuan earthquake investigation and some ideas on seismic design of buildings. Build. Struct. 2010, 40 (Suppl. S2), 144–148. (In Chinese) [Google Scholar]
  39. Liu, G.Q. The Research on the Basic Mechanical Behavior of Masonry Structure. PhD Thesis, Hunan University, Hunan, China, 2005. (In Chinese). [Google Scholar]
  40. GB 50003-2011; Code for Design of Masonry Structure. Standards Press of China: Beijing, China, 2011.
  41. Zheng, N. Research on Seismic Behavior of Masonry Structures with Fabricated Tie-Columns. PhD Thesis, Chongqing University, Chongqing, China, 2010. (In Chinese). [Google Scholar]
  42. Liu, L. Study on Failure Mode of Masonry Structures under Strong Ground Motion. Master’s Thesis, Chongqing University, Chongqing, China, 2012. (In Chinese). [Google Scholar]
Figure 1. Acceleration time−history of Yangbi ground motion.
Buildings 13 00147 g001
Figure 2. Acceleration time−history of Chi−Chi and Loma Prieta ground motion. (a) Chi-Chi; (b) Loma Prieta.
Buildings 13 00147 g002
Figure 3. Layout of RC frame structure (unit: mm).
Buildings 13 00147 g003
Figure 4. Perform-3D model of a five-story frame.
Buildings 13 00147 g004
Figure 5. The change rate of the maximum axial force of columns bottom of each layer.
Buildings 13 00147 g005
Figure 6. Time−history curve of A and B−column axial force under two conditions of Yangbi ground motion.
Buildings 13 00147 g006
Figure 7. A−column and B−column axial force-bending moment curve under two conditions of Yangbi ground motion. (a) A-column; (b) B-column.
Buildings 13 00147 g007
Figure 8. Layout and perform-3D model of a two-story brick-concrete structure. (a) Layout (unit: mm); (b) Perform-3D model.
Buildings 13 00147 g008
Figure 9. Variation of vertical peak floor acceleration of structure under three ground motions.
Buildings 13 00147 g009
Figure 10. The vertical acceleration response spectrum of the Yangbi vertical ground motion and the floors of the structure.
Buildings 13 00147 g010
Figure 11. The change rates of maximum axial force of brick masonry walls bottom of each layer.
Buildings 13 00147 g011
Figure 12. Brick masonry tensile stress−strain curve and Perform−3D skeleton curve.
Buildings 13 00147 g012
Figure 13. Elevation of masonry wall elements at the A-axis.
Buildings 13 00147 g013
Figure 14. Time history of axial tensile strain ratio of four wall elements under two conditions of Yangbi ground motion.
Buildings 13 00147 g014
Table 1. Chi-Chi and Loma Prieta ground motion waveform information.
Earthquake NameTime of OccurrenceMagnitudeStationMechanismRrup (km)Site CategoryPGA (cm·s−2)PGV (cm·s−1)
EWNSUDEWNSUD
Chi-Chi19997.62TCU101Reverse Oblique2.11II207.9253.0164.0−76.8−50.946.7
Loma Prieta19896.93Dublin-Fire58.8II71.1−73.331.6−12.4−15.27.9
Table 2. Maximum displacement of the top layer in the EW and NS directions/mm.
Working ConditionYangbiChi-ChiLoma Prieta
Node 1Node 2Node 1Node 2Node 1Node 2
EWNSEWNSEWNSEWNSEWNSEWNS
H101.0572.02101.0569.1093.5781.8393.5779.9430.8332.6930.8333.85
H + V101.0372.81101.0369.8093.6981.8693.6979.9630.8232.6830.8233.83
The change rate of displacement (%)−0.021.10−0.021.010.130.040.130.03−0.03−0.03−0.03−0.06
Table 3. Peak displacement of the top layer in the UD direction/mm.
Working ConditionYangbiChi-ChiLoma Prieta
Node 1Node 2Node 1Node 2Node 1Node 2
MaxMinMaxMinMaxMinMaxMinMaxMinMaxMin
H0.53−1.64−1.02−2.270.95−1.42−0.40−2.38−0.36−1.44−1.54−2.24
H + V2.24−2.390.41−3.511.14−1.57−0.01−2.58−0.37−1.44−1.55−2.26
The change rate of vertical displacement amplitude (%)113.36213.6014.3529.80−0.931.43
Table 4. Peak acceleration of the top layer in EW, NS, and UD directions/(cm·s−2).
Working ConditionYangbiChi-ChiLoma Prieta
Node 1Node 2Node 1Node 2Node 1Node 2
EWNSUDEWNSUDEWNSUDEWNSUDEWNSUDEWNSUD
H248.8271.493.5248.8249.676.2191.3245.143.2191.3230.636.9133.1134.910.7133.1139.15.0
H + V258.2296.13199.5258.2260.81501.9190.3246.0258.9190.3232.3250.8133.7134.965.0133.7138.998.3
H + V/H1.041.0934.221.041.0419.710.991.005.990.991.016.801.001.006.071.001.0019.66
Table 5. Maximum and minimum axial force of columns bottom of each layer/kN.
Floor NumberInitial Value under the Gravity LoadYangbiChi-ChiLoma Prieta
HH + VHH + VHH + V
MaxMinMaxMinMaxMinMaxMinMaxMinMaxMin
187,98590,61485,050137,92045,36988,93986,886102,53075,11888,12087,80492,67383,699
269,38171,82166,743112,97030,82870,25968,44082,06157,86169,50569,23073,51365,588
351,31353,33749,16089,01818,29852,07550,55861,53641,70651,41551,18654,64048,210
433,24634,67331,73870,2166894.633,86332,63340,39426,32833,31833,15135,55331,041
515,17816,00114,39239,3192042.515,53214,86418,66511,55315,22215,12716,32414,076
Table 6. Maximum displacement of the top layer in the EW and NS directions/mm.
Working ConditionYangbiChi-ChiLoma Prieta
Node 3Node 4Node 3Node 4Node 3Node 4
EWNSEWNSEWNSEWNSEWNSEWNS
H5.136.993.586.991.990.951.460.950.590.240.450.24
H + V5.117.473.547.472.000.991.470.990.590.240.450.24
The change rate of displacement (%)−0.396.87−1.126.870.504.210.684.210000
Table 7. Peak displacement of the top layer in the UD direction/mm.
Working ConditionYangbiChi-ChiLoma Prieta
Node 3Node 4Node 3Node 4Node 3Node 4
MaxMinMaxMinMaxMinMaxMinMaxMinMaxMin
H0.34−1.110.28−1.74−0.38−0.62−0.34−0.80−0.43−0.50−0.51−0.62
H + V0.71−1.710.41−1.76−0.32−0.63−0.31−0.84−0.43−0.50−0.51−0.63
The change rate of displacement amplitude (%)66.907.4329.1715.2209.09
Table 8. Peak acceleration of the top layer in EW, NS, and UD directions/(cm·s−2).
Working ConditionYangbiChi-ChiLoma Prieta
Node 3Node 4Node 3Node 4Node 3Node 4
EWNSUDEWNSUDEWNSUDEWNSUDEWNSUDEWNSUD
H829.81341.1685.7818.81341.1815.0438.7322.6102.1328.3322.6102.9118.485.04.9100.585.09.6
H + V807.71389.52143.5753.91389.52352.1433.2481.4382.3332.6481.4339.6118.584.246.299.784.244.3
H + V/H0.971.043.130.921.042.890.991.493.741.011.493.301.000.999.430.990.994.61
Table 9. The maximum and minimum axial force at the bottom of brick masonry walls of each layer/kN.
Floor NumberInitial Value under the Gravity LoadYangbiChi-ChiLoma Prieta
HH + VHH + VHH + V
MaxMinMaxMinMaxMinMaxMinMaxMinMaxMin
13352.24082.52564.16696.2−635.03428.03274.24392.32328.03353.53350.93484.43224.1
21623.82047.91205.13753.5−566.91676.0−1571.42289.21010.41624.91622.71690.41555.5
Disclaimer/Publisher’s Note: The statements, opinions and data contained in all publications are solely those of the individual author(s) and contributor(s) and not of MDPI and/or the editor(s). MDPI and/or the editor(s) disclaim responsibility for any injury to people or property resulting from any ideas, methods, instructions or products referred to in the content.

