Article

A Calculation Model for Vibration Effect Induced by Resonance-Free Vibratory Hammer Method

1
State Key Laboratory of Mechanical Behavior and System Safety of Traffic Engineering Structures, Shijiazhuang Tiedao University, Shijiazhuang 050043, China
2
School of Civil and Architectural Engineering, East China University of Technology, Nanchang 330013, China
3
Key Laboratory of Earthquake Engineering and Engineering Vibration, Institute of Engineering Mechanics, China Earthquake Administration, Harbin 150080, China
4
School of Civil Engineering, Guangzhou University, Guangzhou 510006, China
*
Author to whom correspondence should be addressed.
Buildings 2022, 12(12), 2204; https://doi.org/10.3390/buildings12122204
Submission received: 17 November 2022 / Revised: 7 December 2022 / Accepted: 9 December 2022 / Published: 13 December 2022
(This article belongs to the Special Issue Advanced Studies of Risk Resistant Building Structures)

Abstract

:
Buildings close to the ground treated by the resonance- free vibratory hammer method are often vulnerable to excessive vibrations. An in situ test of an urban soft site was carried out to investigate the resonance-free vibratory hammer induced vibration effects during construction. Vibration pickups were set at the positions with distances of 15 m, 30 m, 50 m, and 100 m away from the vibration source. On the basis of the results obtained from this investigation, vibration effects of the resonance-free vibratory hammer and safe construction distances were systematically analyzed. The testing results indicate that the vibration in the vertical direction is stronger than that in the other two horizontal directions. The vertical vibration should be the main reference quantity for the foundation treatment by using the resonance-free vibratory hammer method. The predominant frequency of each measuring point in the same direction decreased with an increase of the distance from the vibration source (DFTVS). In terms of the measuring point with a DFTVS of 30 m, the peak values of velocity in all directions were within 5 mm/s, which meet the requirements of the allowable limit of building vibration. According to the in situ testing results, a model for calculating the acceleration exponent of the vibration caused by the resonance-free vibratory hammer technology was established by comprehensively considering the amplitude of acceleration, the attenuation coefficient of THE DFTVS, and the vibration correction factor. Finally, the reliability of the calculation model was verified through the comparison between the calculated results and field vibration experimental results, in which all the correlation coefficients of validation example were above 0.9.

1. Introduction

Shoddy geological conditions usually restrict the utilization of construction sites [1,2,3]. The dynamic compaction method is applicable to enhancing the soil strength [4,5,6,7,8]. The resonance-free vibratory hammer method [9] is a novel dynamic compaction technology that is effective in reinforcing soft foundations. Compressibility and uniformity of soil can be well-improved by using the resonance-free vibratory hammer technology, and then the capacity and stability of foundations can be efficiently enhanced. As the awareness of structural vibration, soil deformation, and construction noise issues derived from dynamic tamping construction grows among residents, storekeepers, tourists, office staffs, designers, and contractors, there is a corresponding requirement for an appropriate prediction model to verify the vibration effects [10].
A method for estimating the dynamic compaction effect on sand is necessary. Lee et al. [11] proposed a method for predicting the degree and depth of enhancement resulting from dynamic compaction on sandy soil. Cheng et al. [12] proposed a novel method for evaluating the effective range, including effective buried depth and effective zone of compaction degree by utilizing a string of microelectromechanical system accelerometers. Jia et al. [13] revealed the macro and micro mechanisms of granular soils during dynamic compaction by using the PFC/FLAC coupled method. They also emphasized that the dynamic compaction is composed of two stages: compaction caused by the transient impact and compaction due to the vibration of soil particles.
The dynamic compaction method is a widely used soil treatment technique. To measure the ground response to dynamic compaction, Scott et al. [14] conducted a full-scale field test, in which the acceleration response of rolling dynamic compaction was measured in three orthogonal directions. It was found that the vertical accelerations are dominant.
Pile driving is a complex dynamic process, which can cause ground vibrations. To investigate the effect of the position of the sheet pile toe on ground vibrations at buried depth, the study [15] introduced an instrumentation system and carried out a field test. The field test indicated that the toe contributed to more ground motions than the shaft. As vibration sources are often not pinpointed during the pile-driving construction process, Wang et al. [16] conducted a three-dimensional finite element modeling of vibratory sheet pile-driving in an infinite half-space soil domain to pinpoint the localization of vibration sources, which suggested that the field tests as well as empirical formulas should be noted. To enable estimation of ground vibrations, Deckner et al. [17] exhibited vibratory sheet pile-driving-induced wave patterns, which indicated that wave patterns tended to become more irregular with an increase in distance from the source. Through the combined utilization of a three-dimensional finite element and field test, Wang et al. [18] proposed a two-stage impact source localization method to estimate the ground vibrations induced by pile-driving. As ground-borne vibrations can limit the development of impact pile-driving, Colaco et al. [19] proposed an axisymmetric finite element method to predict the impact pile-driving-induced vibrations. Furthermore, the nearby sensitive people and buildings (i.e., hospitals and cultural relics) are usually vulnerable to excessive vibrations caused by pile-driving. Zhu et al. [20] evaluated the potential effect of pile-driving-induced ground vibrations on sensitive medical equipment by conducting a field test and numerical simulation. The potential risk to the sensitive medical equipment was illustrated. Following a comprehensive analysis of the research topic on man-made ground vibrations, Athanasopoulos and Pelekis reported the measurements of the vibratory sheet pile-driving-induced ground vibrations in recent soil deposits [21]. They suggested that the understanding of ground vibration effects on buildings during the reinforcement treatment of loose soil should be continuously studied.
Due to multifidus of infrastructure activities, the research about the vibration generated by construction activities has gained significance in recent years. According to [22], the foundation shape can significantly influence the characteristics of a vibrational system. The vibration attenuation law from a series of block vibration tests was investigated by Surapreddi et al. [23]. The dynamic response at diverse locations from the dynamic source was exhibited, and the results indicated that the damping features of the vibration waves can influence the attenuation laws of horizontal and vertical vibrations at the far-field measuring points. The transmission and development characteristics of vibration waves caused by vibratory rollers are crucial to the stability and safety of train operation. Yang et al. [24] analyzed the relationship between vibration acceleration peak and buried depth by conducting field prototypes tests, which can be helpful for optimizing the compaction quality control models. To propose a methodology for predicting the vibro-flotation-induced ground vibration, Das et al. [25] collected a large amount of recorded data and established relations between vibration parameters and source to receiver distance by using artificial neural network modeling and regression. Chen et al. [26] investigated vibration induced by a high-power vibratory roller. The influence of different soil conditions was considered. The study showed that the effective influence distance of the high-power vibratory roller varied from 10 m to14 m. Dong et al. [27] proposed that the evaluation of engineering-construction-induced vibration should be according to source characteristics. The ground vibration due to a full-stone foundation treatment project was studied by Wu. et al. [28]. It was found that increasing dynamic compaction times can effectively enlarge PGV and PGA. Wang et al. [29] put forward a model to evaluate the site deformation caused by dynamic compaction. Li et al. [30] studied the influence of particle breakage on the dynamic compaction for ground through 3D PFC. Wang et al. [31] analyzed the reinforcement effect of dynamic compaction by using a 3D simulation method. As for different particle sizes, the stress diffusion angle and the horizontal deformation caused by dynamic hammer are alike [32]. To further study the soil–hammer interaction mechanism, Wang et al. [33] made a simulation with a consideration of various hammer sizes, and finally they pointed out that the compaction mechanism of the convex-bottomed hammer, the flat-bottomed hammer, and the concave-bottomed hammer must be different. Gong et al. [34] carried out an indoor dynamic compaction model test at a loess slope site. Acceleration, velocity, and displacement at the point with a distance of 50 m away from the compaction point was obtained, which indicated that the amplitude of the vibration response magnified with the increasing slope gradient.
A model describing the rule of vibration propagation in soil is meaningful to the estimation of ground vibrations. The vibration propagation in soil was studied on the basis of the damping mechanism proposed by Rayleigh, and a linear-elastic model for describing the ground treated by pile-driving was introduced in [35]. Concentrating on the damping mechanism and illustration of the prominent variability of the deformation features for small strains, Lupiezowiec [36] built a finite-element model that can be used to describe the propagation mechanism of the vibration waves resulting from ground improvement.
The construction-activity-induced ground vibration can cause annoyance to residents living in nearby buildings, pose a threat to the structural stability, and interfere with instrumentation works in diverse industries. The use of trenches as a way to mitigate ground vibration caused by Rayleigh waves is worth studying. The key factors influencing the vibration isolation efficiency of two different trenches were identified by Bose et al. [37]; the findings also reveal that trench is an easy and effective means of reducing ground vibrations. To prevent the structural damage, the active isolation method was proposed for the pile-driving operation [38]. The efficiency of a circular open trench in shock absorption was verified by executing finite element simulations.
However, previous studies mainly focus on the traditional dynamic-compaction-induced ground vibrations. There is still lack of research into new technologies (i.e., the resonance-free vibratory hammer method), induced surface waves, and an effective calculation model based on field tests. The resonance-free vibratory hammer method (Figure 1) is a novel ground treatment way combining advantages and improving construction frequency of the ordinary dynamic compaction method and the column hammer impact pile method. The method is applicable for reinforcing soft foundations. The main advantages of this technology are high construction efficiency, low cost, and good economic benefit. Nevertheless, the problems such as site vibration caused by foundation reinforcement using the resonance-free vibratory hammer method and safe construction distance need to be studied. The vibration effects of the resonance-free vibratory hammer construction have been investigated. Subsequently, the safe construction distance of the novel ground treatment method has been put forward. Finally, a calculation model for predicting the ground vibrations has been proposed and verified. Dynamic characteristics such as acceleration, velocity, displacement, and Fourier spectrum of the surface ground positions with a different DFTVS during the in situ test have been systematically analyzed. Furthermore, the acceleration calculation model proposed in the study can provide a reference for engineering design, site construction, and technical promotion of the resonance-free vibratory hammer method in civil engineering construction.

2. In Situ Test Scheme

2.1. Site Situation and Evaluation Basis of Vibration Effect

A site in Nanchang (a city located in Jiangxi province, China) was selected for the dynamic compaction test. The stratum distribution parameters from the geological survey report are shown in Table 1.
Allowable vibration values of buildings and structures can refer to the Chinese standard for allowable vibration of building engineering [39]. The peak velocity values of dynamic-compaction-induced vibration of utility buildings, residential buildings, and vibration-sensitive buildings are 12 mm/s, 5 mm/s, and 3 mm/s, respectively. Those reference values can contribute to the evaluation of a safe and civilized construction scope of the resonance-free vibratory hammer method.

2.2. Monitoring Scheme

Technical parameters of the resonance-free vibratory hammer equipment used in the in situ test are shown in Table 2.
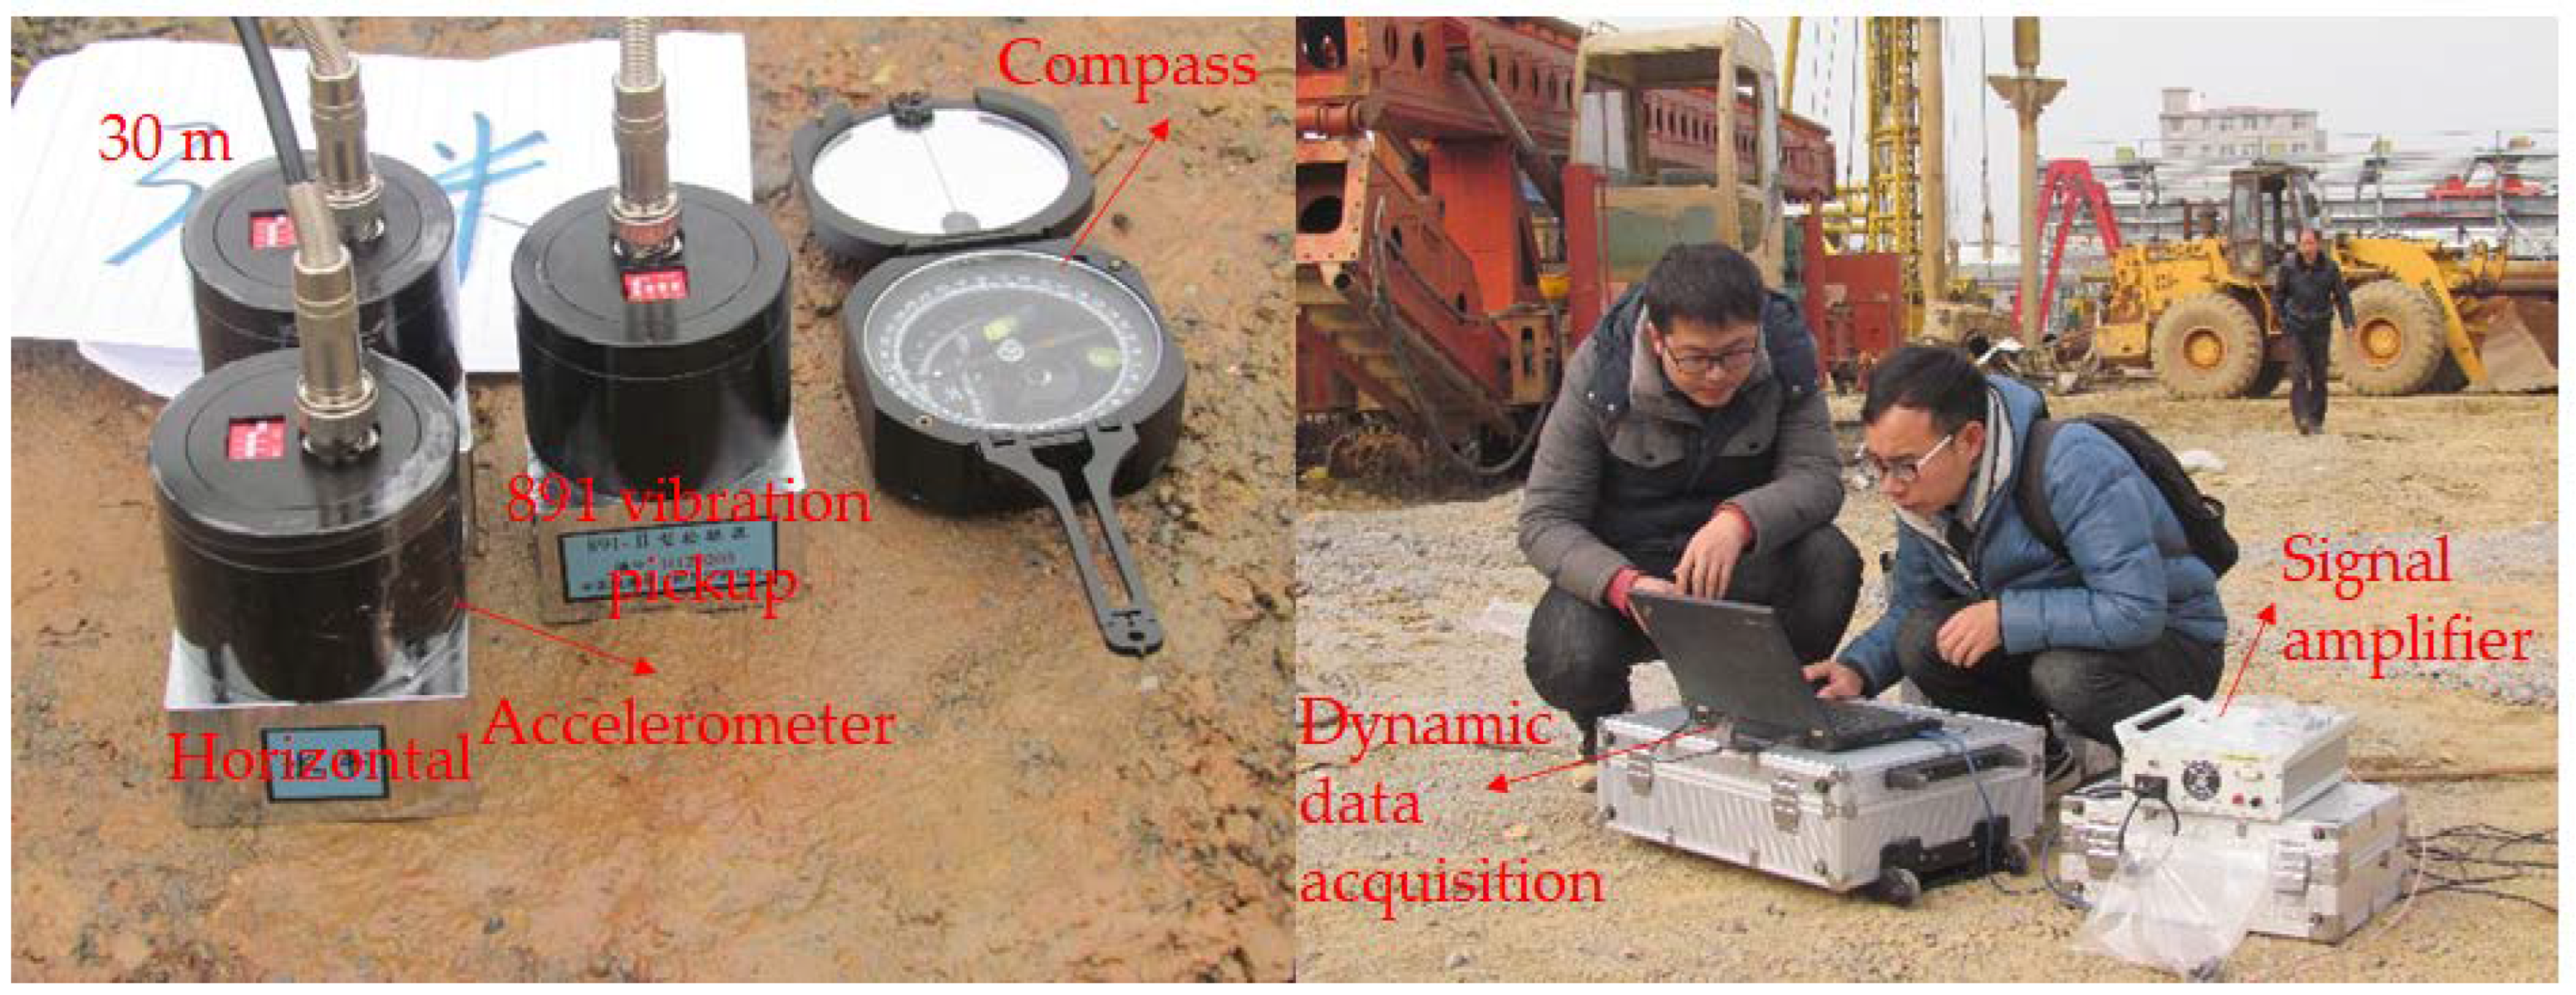
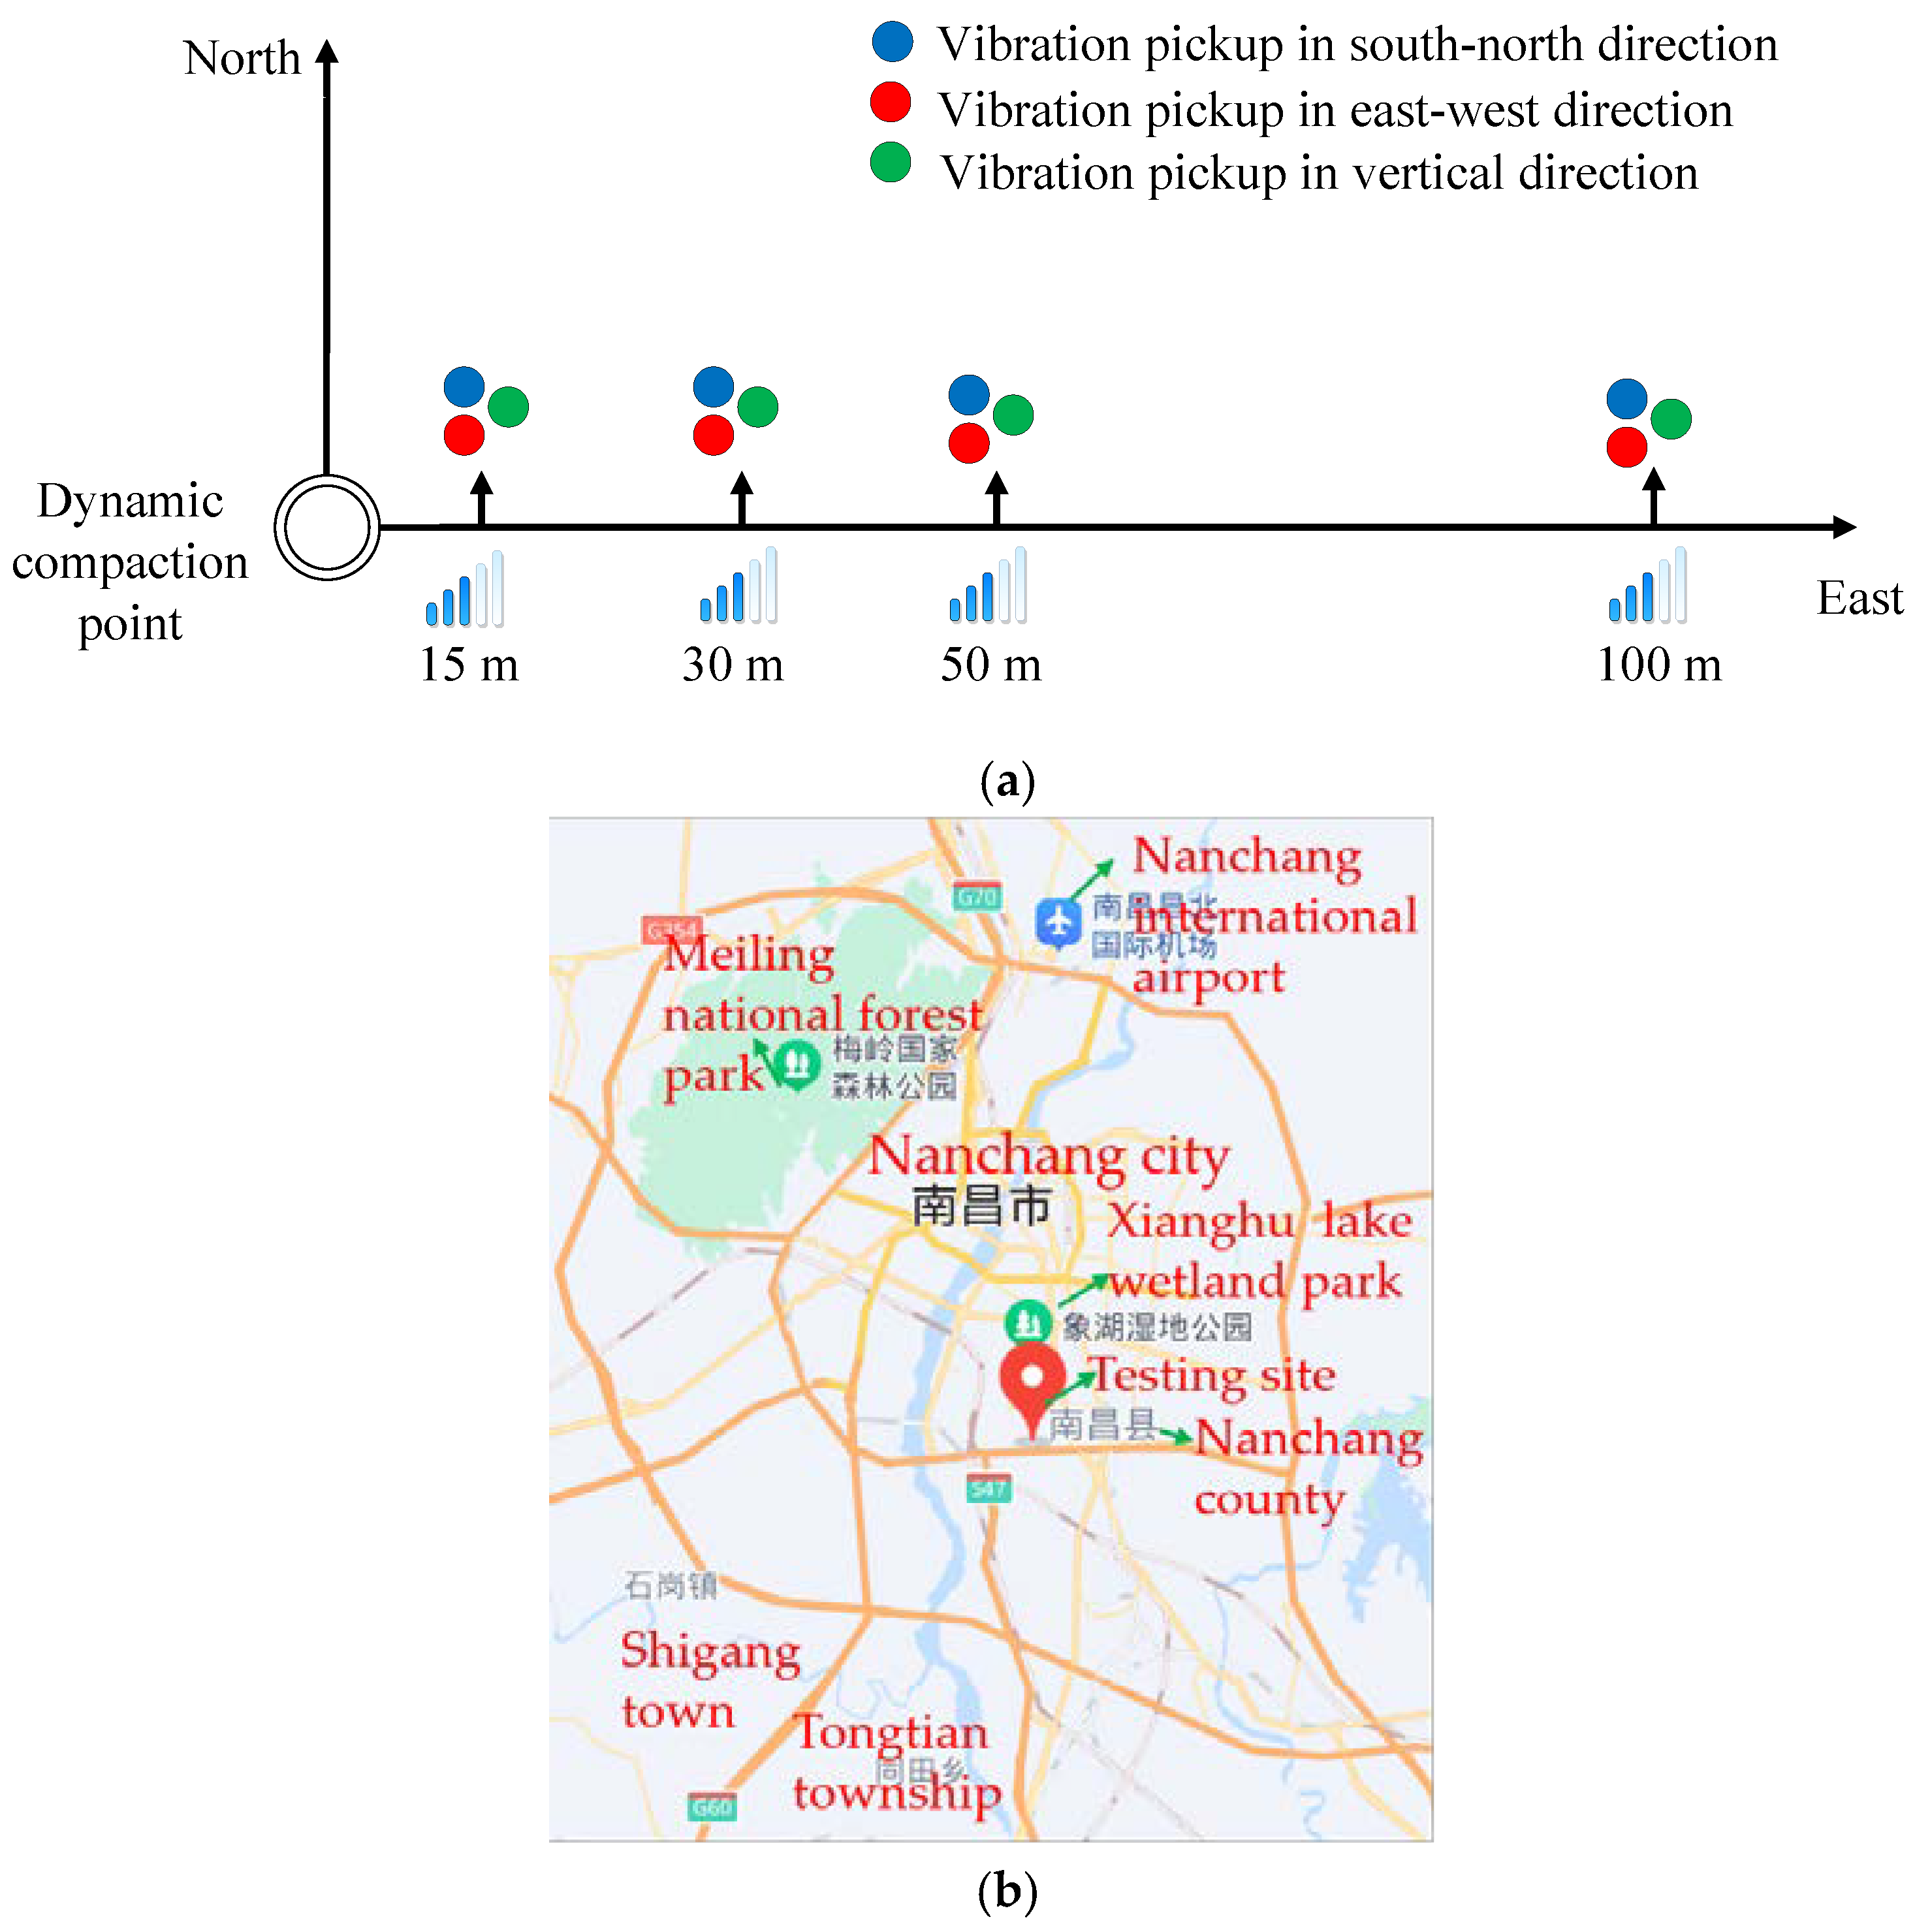
As shown in Figure 2 and Figure 3, 12 vibration pickups developed by the Institute of Engineering Mechanics, China Earthquake Administration, were arranged at the positions with DFTVSs of 15 m, 30 m, 50 m, and 100 m, respectively. The acceleration, velocity, and displacement time history curves of each monitoring point can be observed through these vibration pickups. Each monitoring point contained three vibration pickups corresponding to vertical direction, east–west direction, and south–north direction. Meanwhile, a signal amplifier and a dynamic data acquisition instrument was used to collect vibration data. The vibration pickups were concatenated to one side of the signal amplifier; meanwhile, the other side of the signal amplifier was connected to the dynamic data acquisition instrument. Finally, the dynamic data acquisition instrument should be linked to a computer to directly classify and analyze the experimental signals. The sensitivity coefficient of the vibration pickups ranged from 0.0902 to 0.0997 V·s2/m. The sampling frequency of the vibration pickups ranged from 0.5 Hz to 80 Hz. The service frequency of the signal amplifier ranged from 0.15 Hz to 100 Hz.

3. Results and Analysis

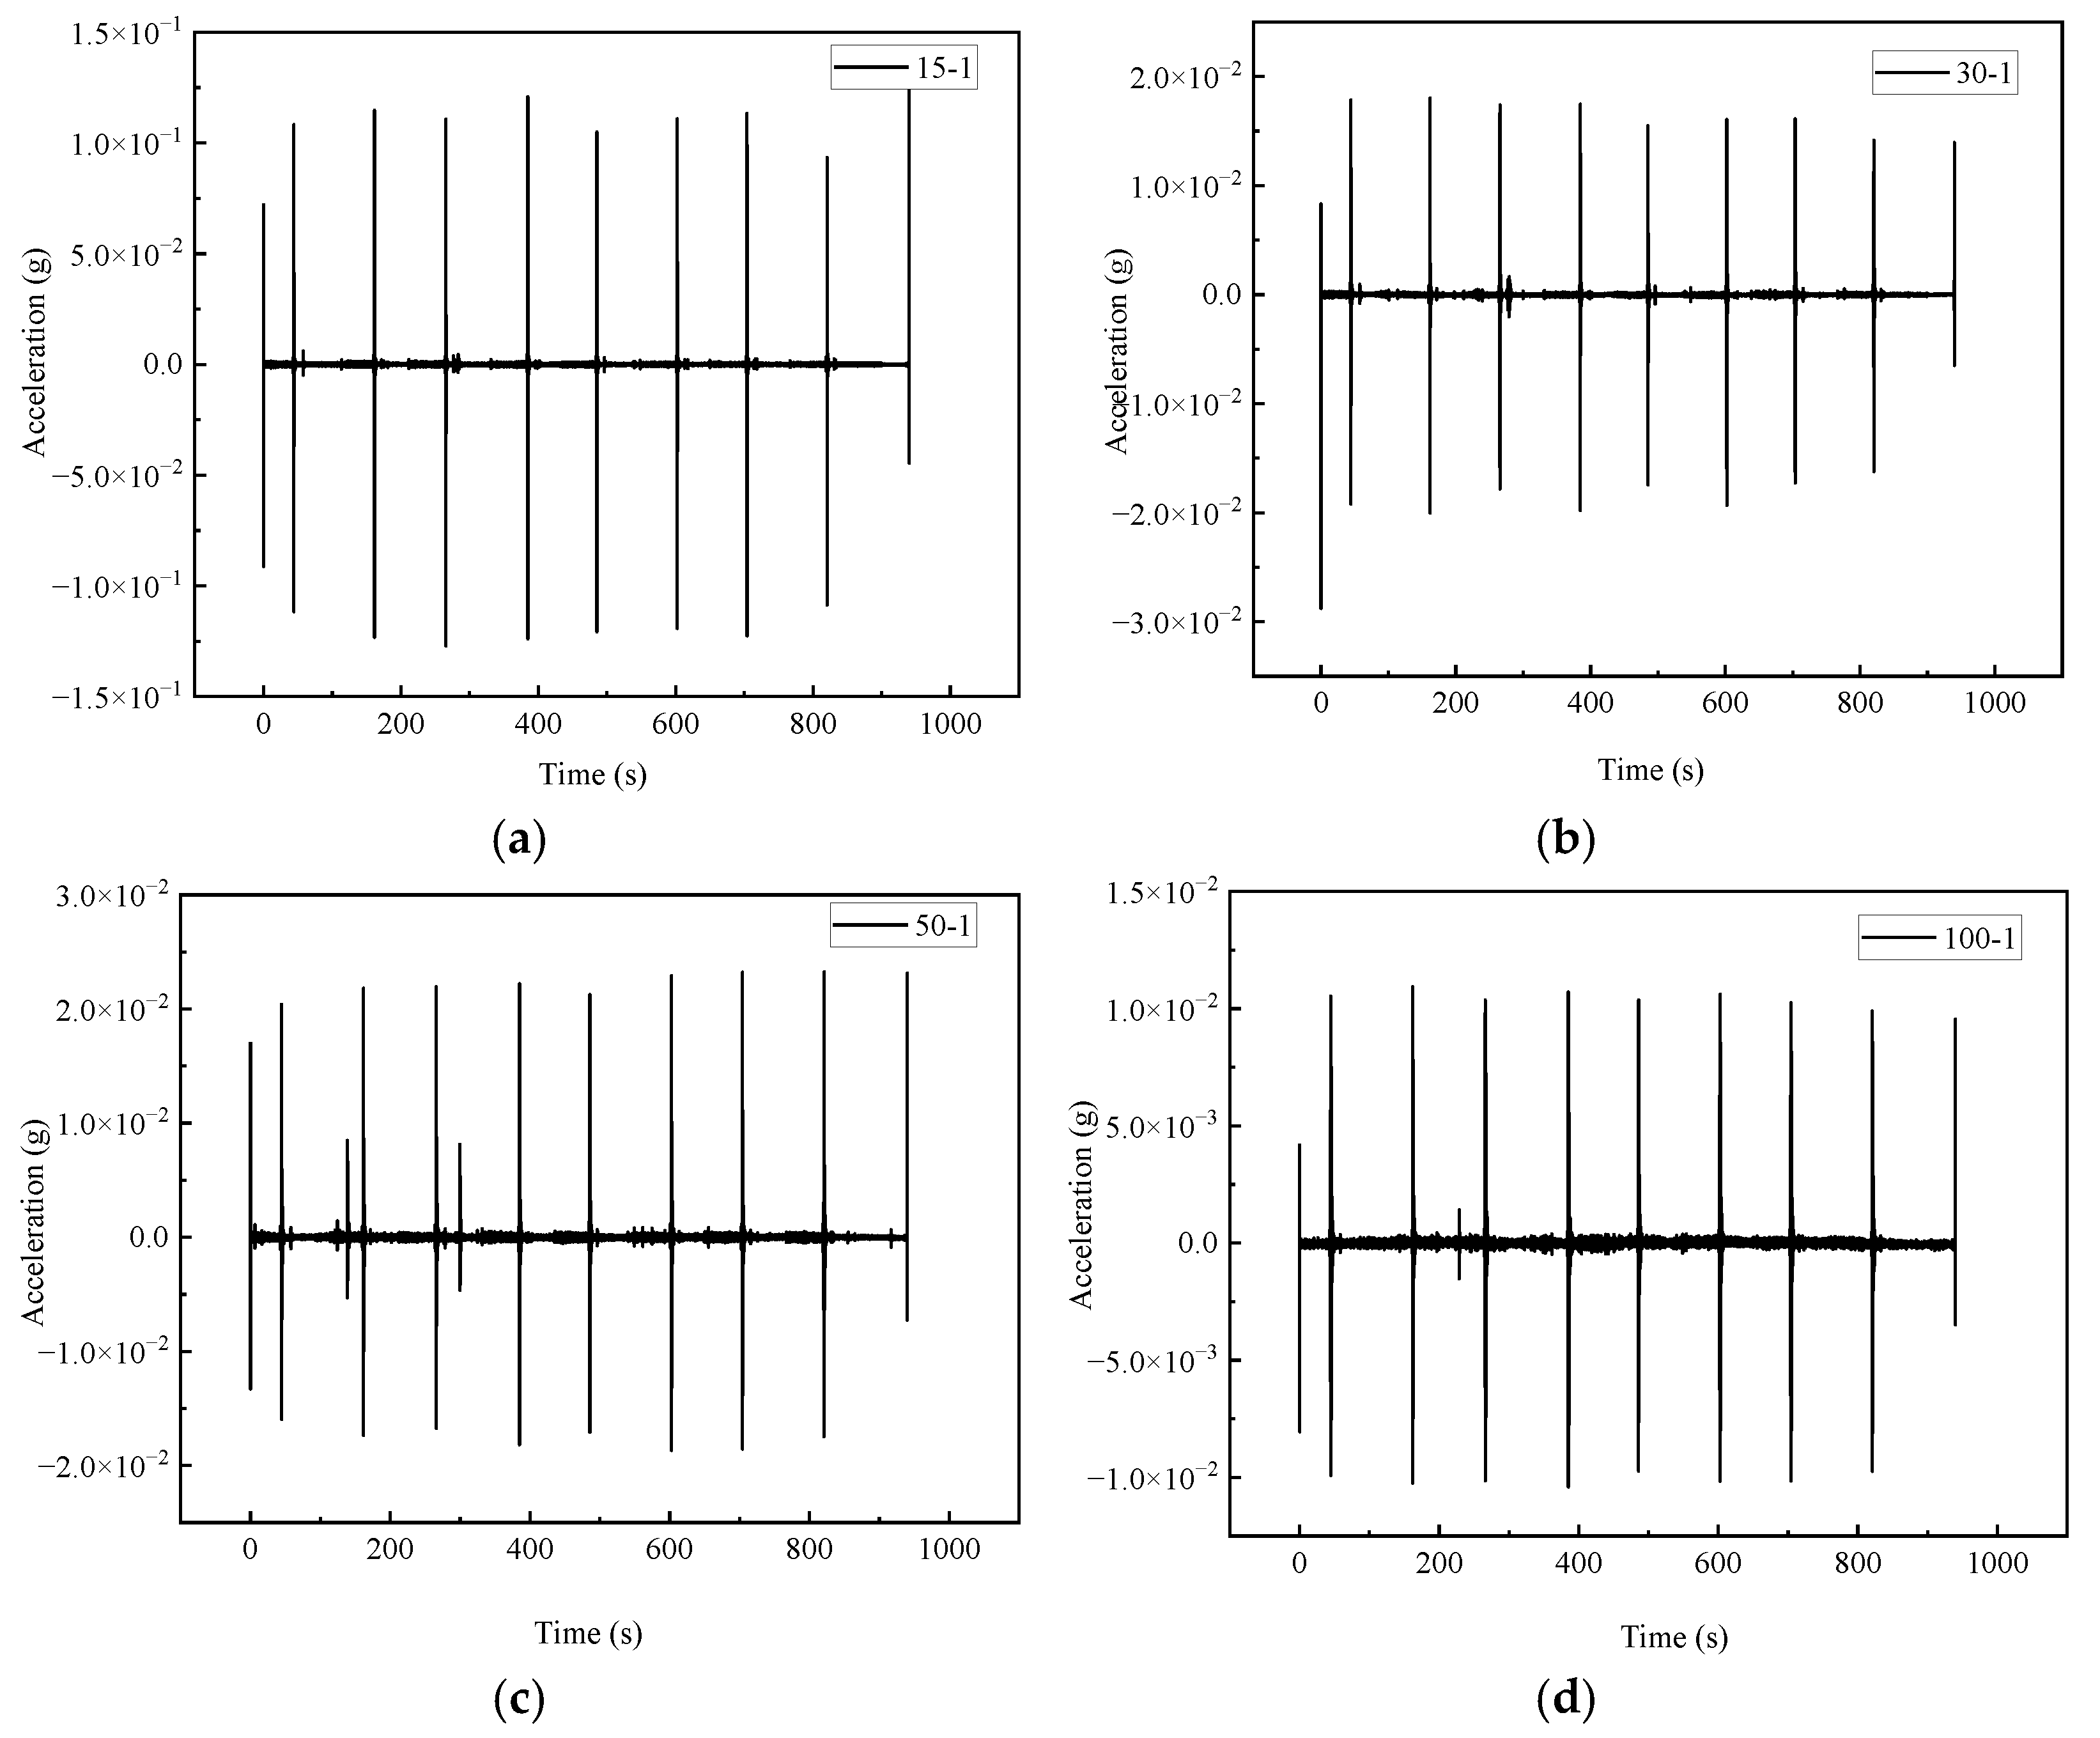
The resonance-free vibratory hammer used here was working without counterweight and with an eccentricity of 30 cm. In order to facilitate the analysis of the testing results, a symbolic convention rule of A–B was proposed, in which A denotes the distance between the motoring point and the vibration source (the dynamic compaction point), B denotes the vibration direction, i.e., 15-1, 15-2, and 15-3, can denote 15 m away from the vibration source in the vertical, east–west, and south–north direction, respectively.

3.1. Vibrational Signal Analysis

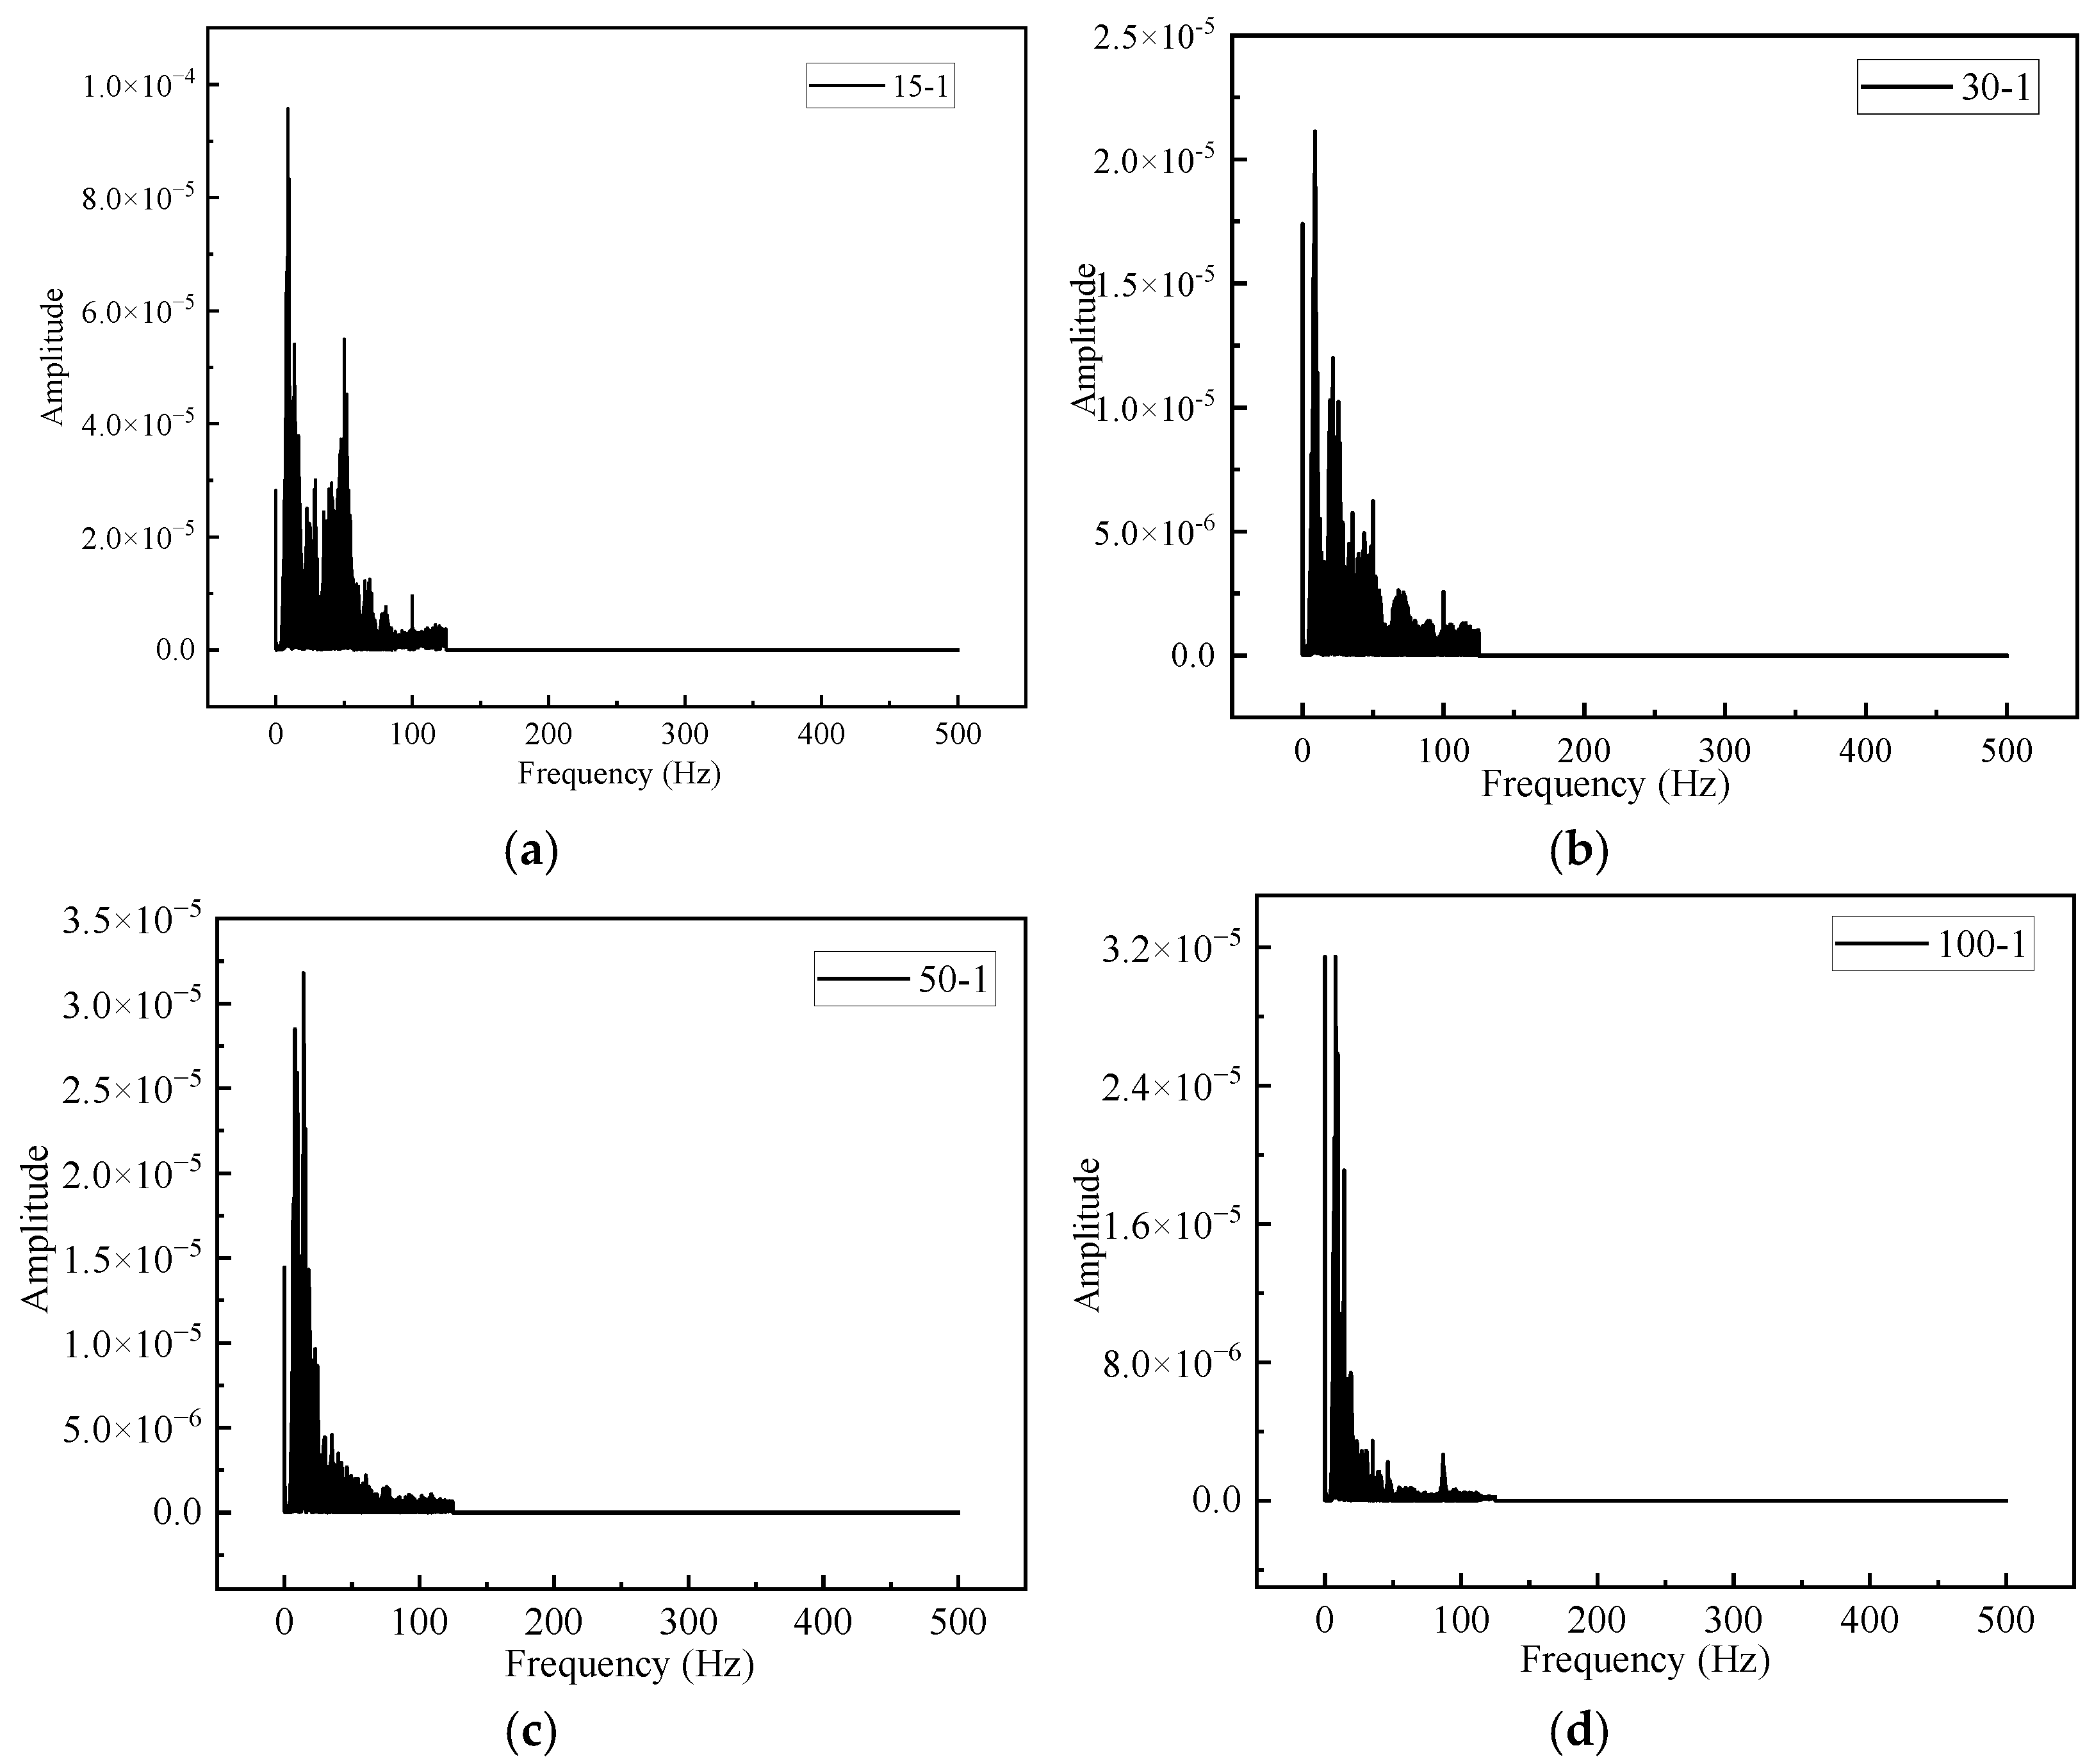
The acceleration time history curve in each direction can be monitored by vibration pickups, and the corresponding vibration spectrum can be obtained through Fourier transform. The spectral characteristics were measured through a 3 Hz high-pass filter and a 60-Hz low-pass filter, with 3 and 60 as the lower and upper cutoff frequencies. Meanwhile, peak values of velocity and acceleration of each monitoring point were obtained through acceleration signal processing. The detailed values are shown in Table 3.
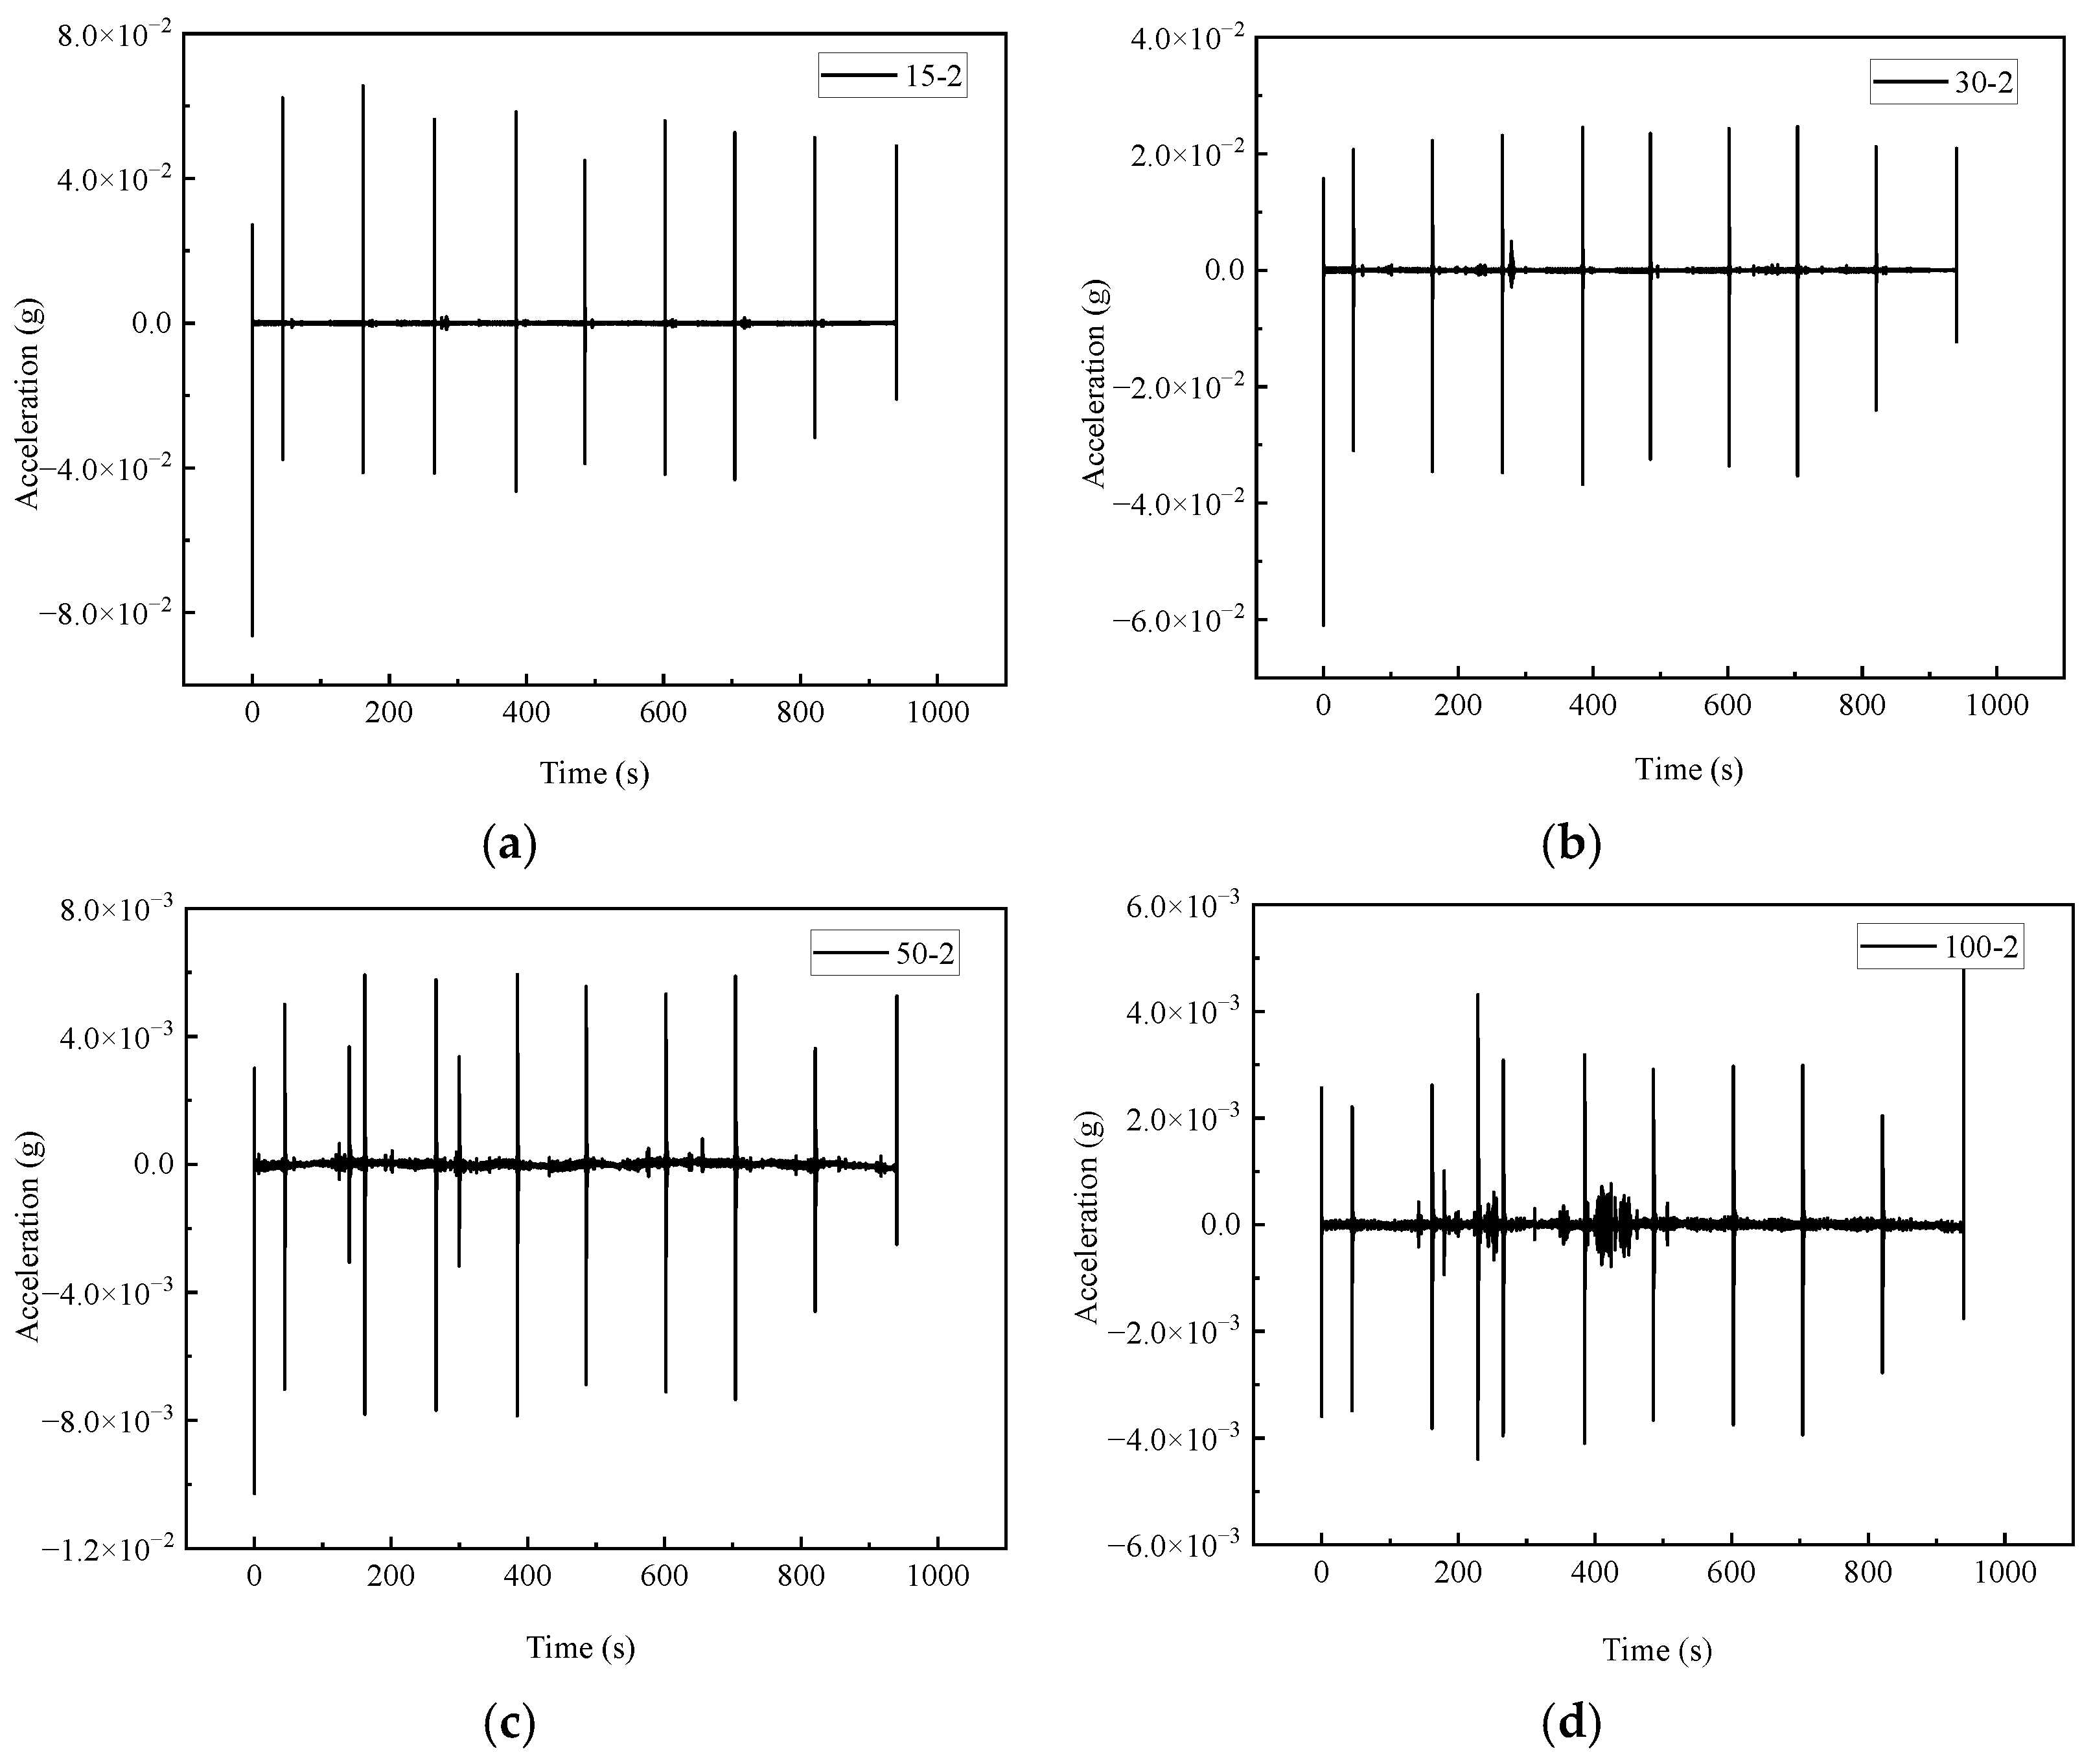
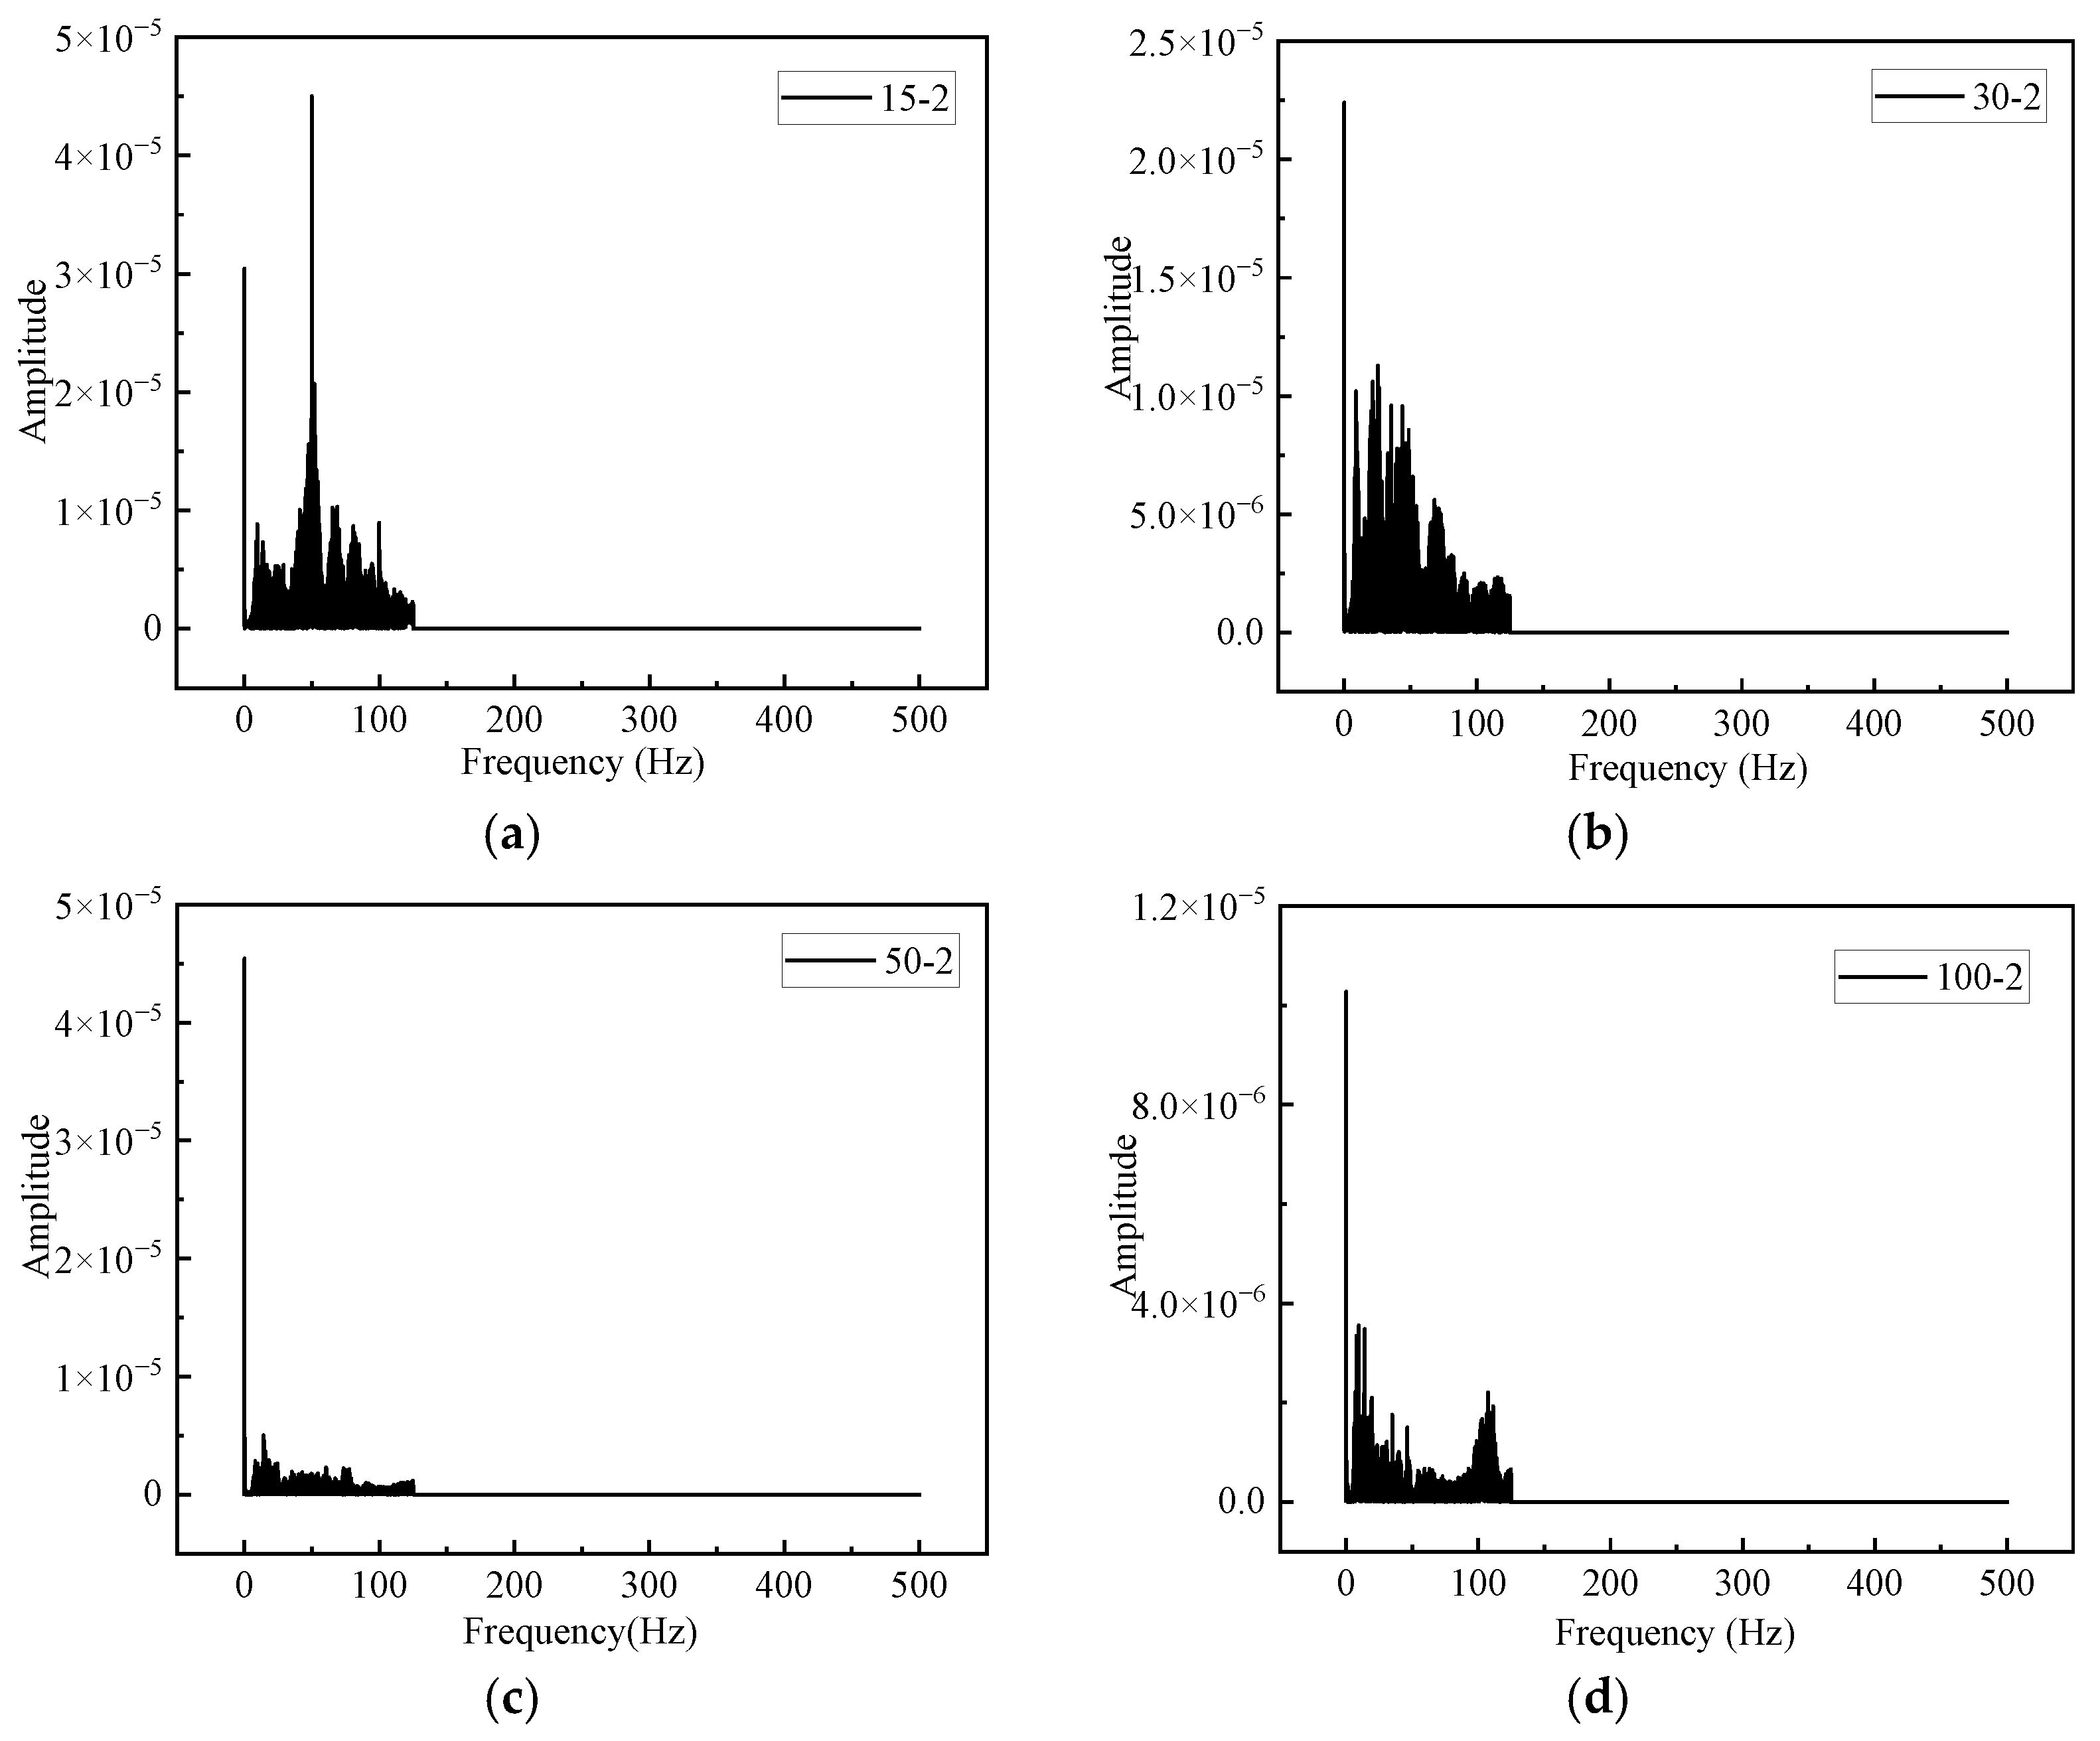
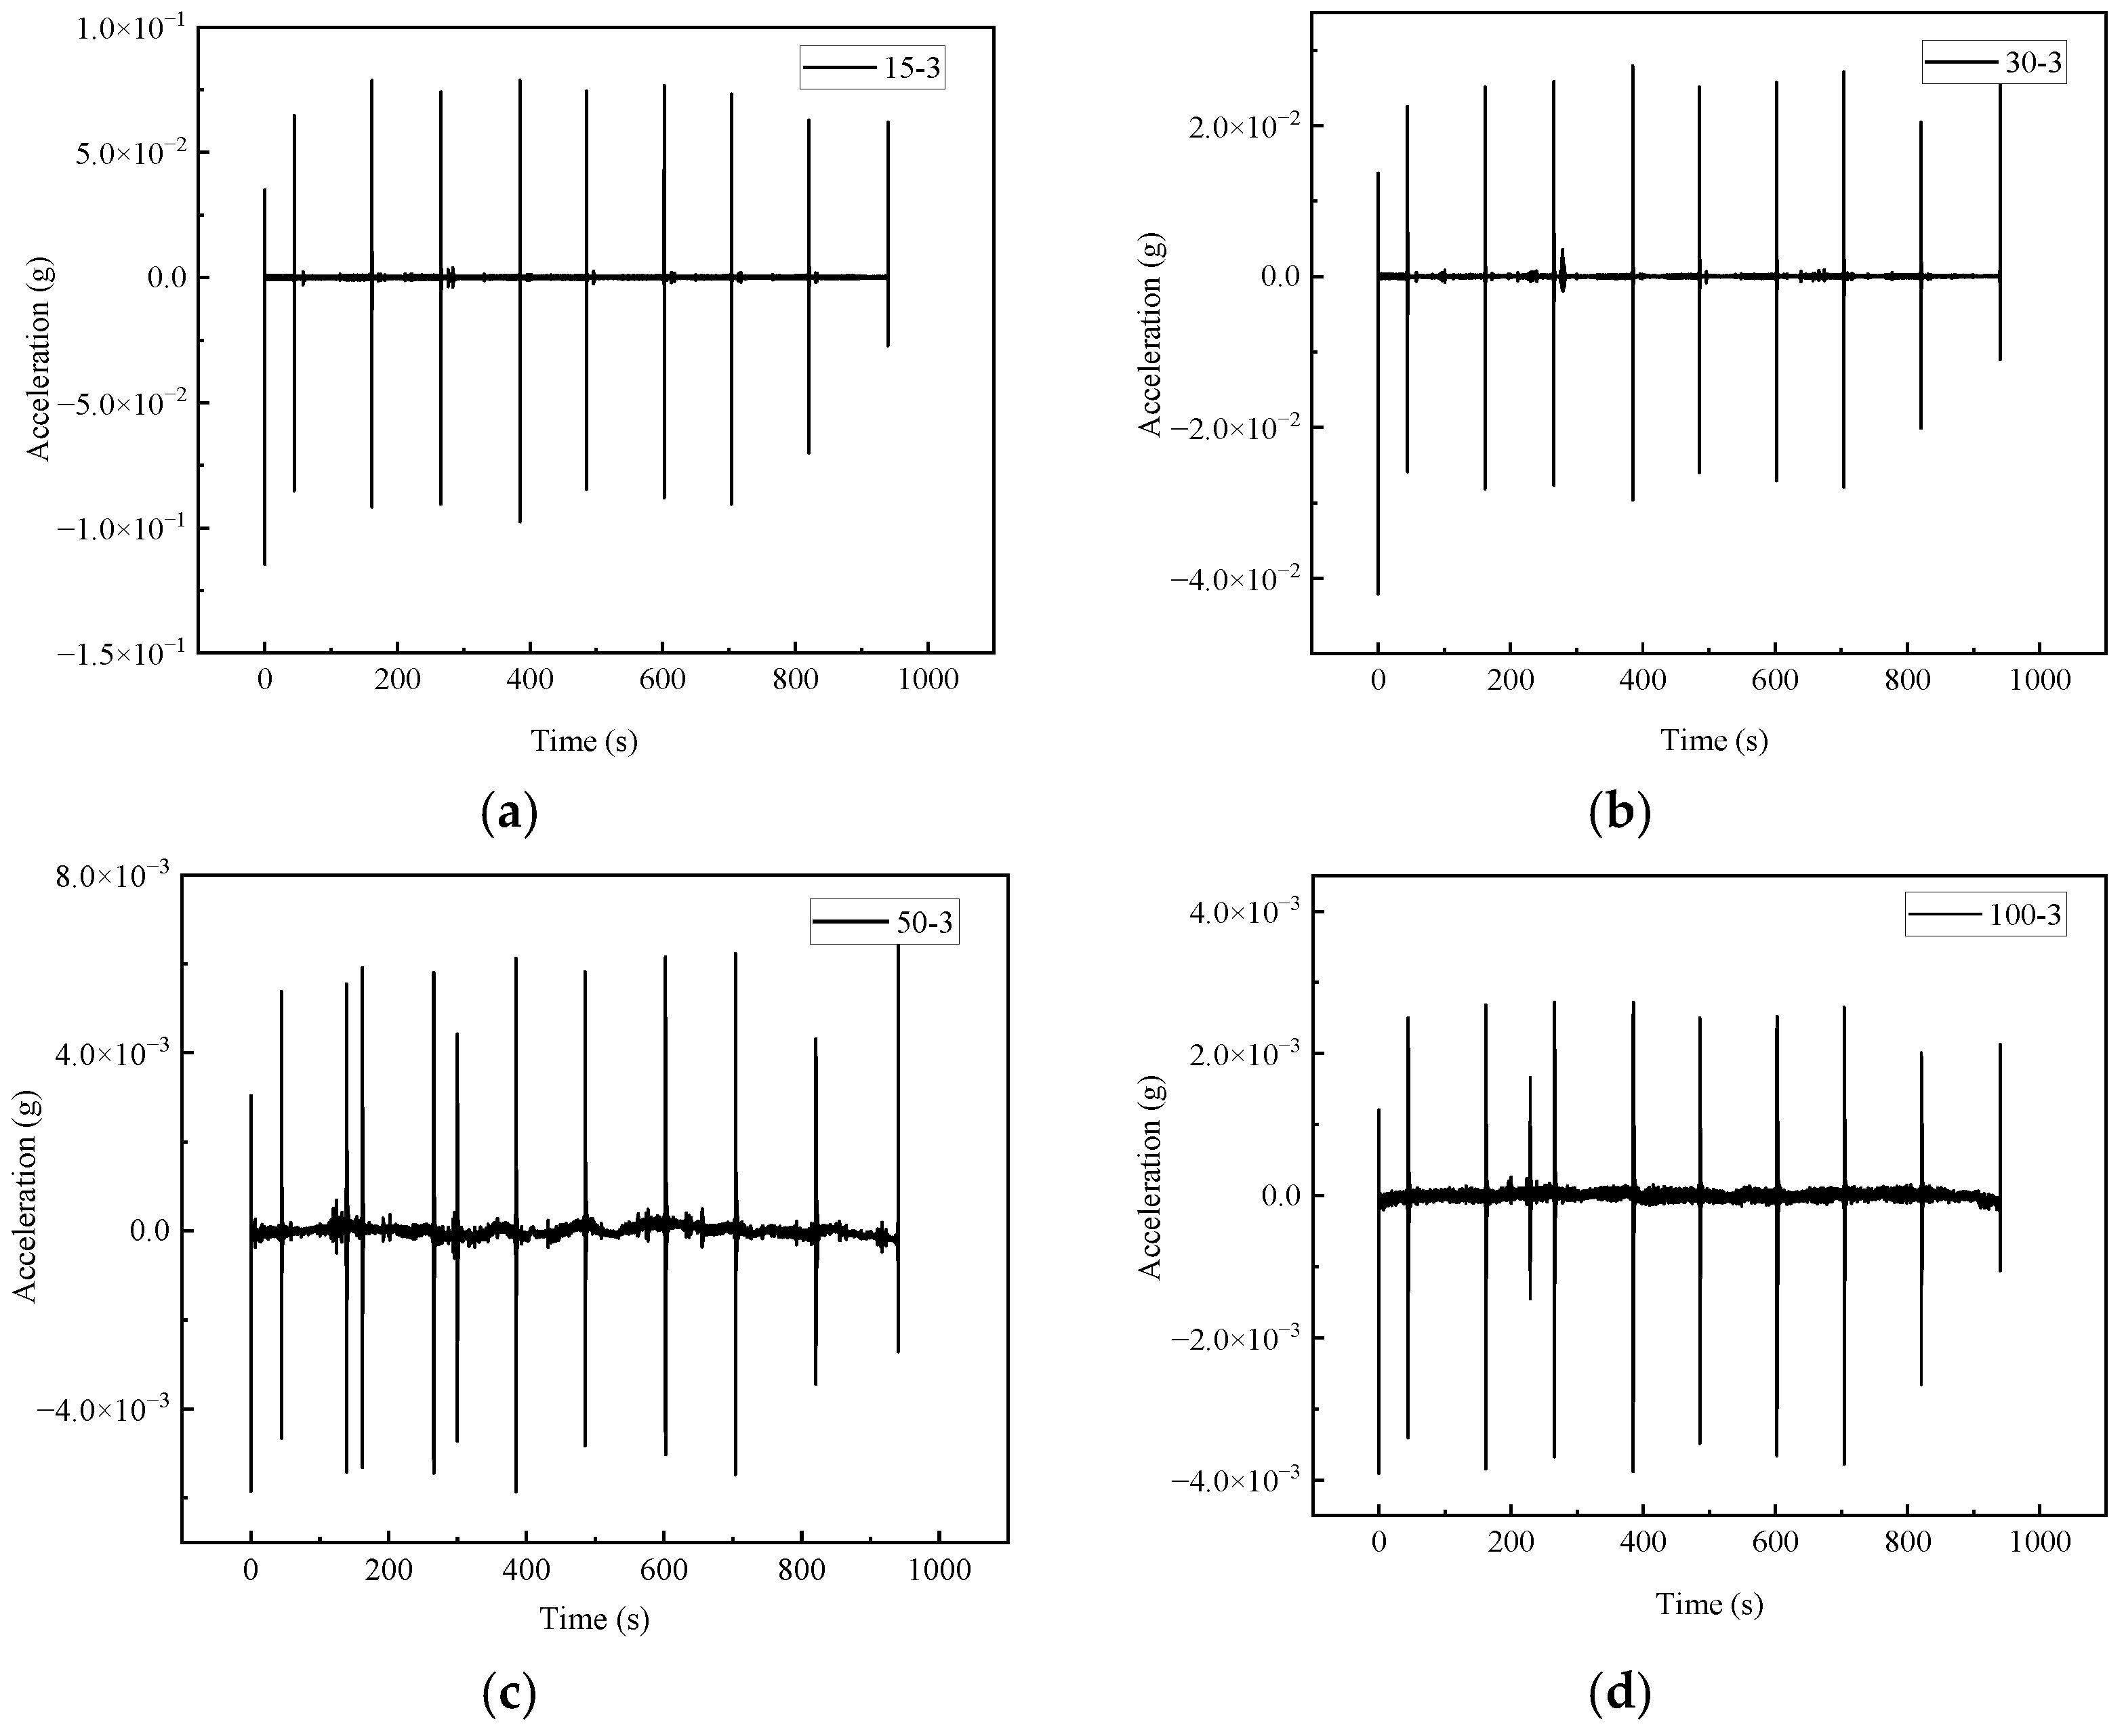
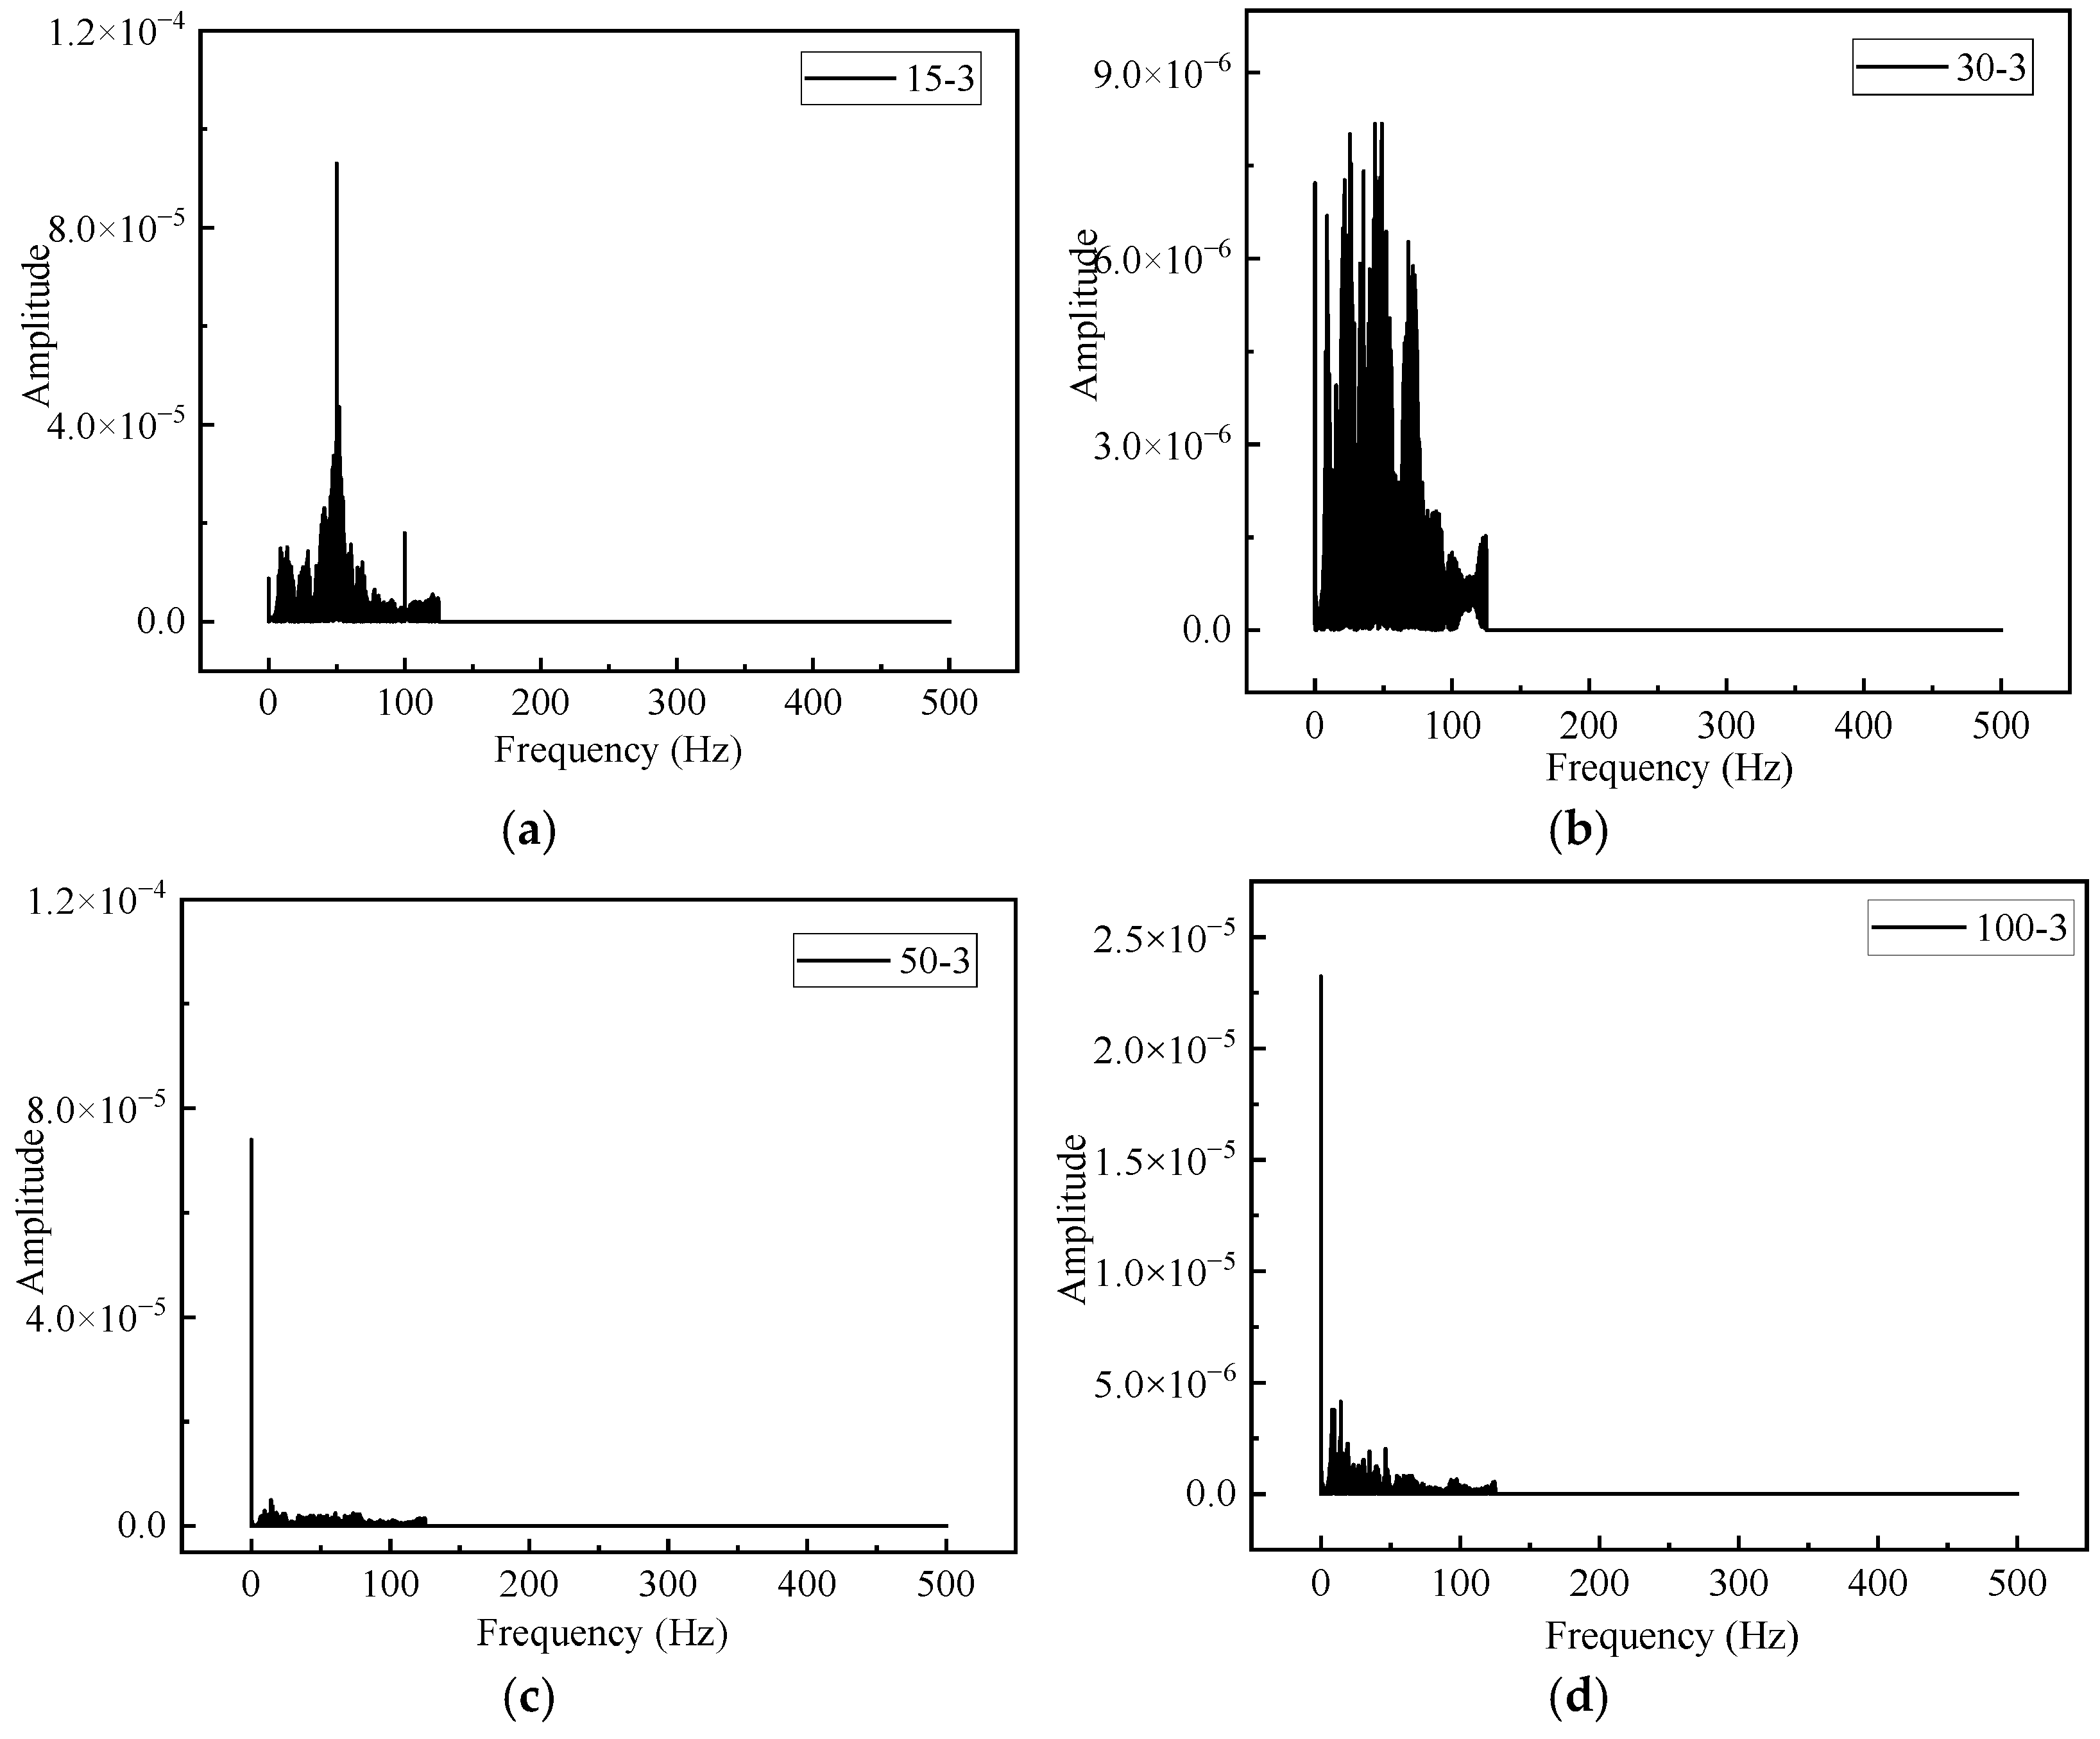
As shown in Figure 4, Figure 5, Figure 6, Figure 7, Figure 8 and Figure 9, there is a trend that the larger the DFTVS is, the smaller the vibrational magnitude is. The modes of vibration curves from all the measuring points are basically consistent. Given the same DFTVS, there is little difference between the east–west acceleration records and south–north acceleration records. According to the acceleration records, the peak acceleration values in the vertical direction are more significant than those in the other two horizontal directions. This kind of dynamic compaction construction leads to the compression wave propagating along soil depth, which is namely a longitudinal wave, as well as a transverse wave that is perpendicular to the forward direction of the particle. As in general, the vertical vibration of the soil layer is greater than the two horizontal vibrations.
It can be noted that the peak acceleration values of the vibration pickups 15-1, 15-2, and 15-3 are 0.129 m/s2, 0.086 m/s2, and 0.1145 m/s2, respectively. Meanwhile, the peak acceleration values of the vibration pickups 100-1, 100-2, and 100-3 are 0.011 m/s2, 0.005 m/s2, and 0.004 m/s2 respectively, which are only 8.5%, 5.8%, and 3.5% of those observed from the vibration pickups 15-1, 15-2, and 15-3, respectively. It reveals that the amplitude of the acceleration decreases greatly with an increase of the DFTVS, which is due to the fact that the propagation of the resonance-free vibratory hammer induced vibration wave can be affected by factors such as site soil damping and energy dissipation. The acceleration amplitude decreases greatly with the increase of the DFTVS. The vibration duration of each monitoring point approaches 960 s.
Given that Fourier spectrum, the predominant frequency of measuring points in the vertical direction is in the range of 9–15 Hz. The predominant frequencies of the vibration pickups 15-2, 30-2, 50-2, and 100-2, are 60 Hz, 35 Hz, 25 Hz, and 16 Hz, respectively. The predominant frequencies of the vibration pickups 15-3, 30-3, 50-3, and 100-3, are 52 Hz, 51 Hz, 19 Hz, and 18 Hz, respectively. Comparing with the predominant frequency of measuring points in the vertical direction, the predominant frequency of measuring points in the east–west and south–north direction is more susceptible to the resonance-free vibratory hammer construction. Therefore, the working frequency of the resonance-free vibratory hammer can be adjusted according to the site vibration characteristics to reduce surface ground vibration effects.
As shown in Table 3, the peak value of velocity attenuates with the increase in THE DFTVS. As for the peak values of velocity in the vertical, east–west, and south–north directions, results obtained from the vibration pickups 100-1, 100-2, and 100-3 are about 32.1%, 36.4%, and 18.4%, of those observed from the vibration pickups 15-1, 15-2, and 15-3.

3.2. Determination of the Safe Construction Distance

According to the Chinese standard for allowable vibration of building engineering, the peak value of velocity in each direction can be selected as evaluation index to estimate the surface ground vibration caused by the resonance-free vibratory hammer. The limit of peak value of velocity for residential buildings is 5 mm/s, and the limit of peak value of velocity for protective buildings (buildings those are more sensitive to vibration and historic buildings) is 3 mm/s. When using the EP240 resonance-free vibratory hammer for dynamic compaction construction, the peak values of velocity obtained from the vibration pickups 15-1, 15-2, and 15-3 all exceed 5mm/s. As for the vibration pickups 30-1, 30-2, and 30-3, the peak values of velocity are 4.3 mm/s, 4.7 mm/s and 3.1 mm/s, respectively, which meet the vibration allowable index of building engineering. Meanwhile, the peak values of velocity calculated from the vibration pickups 50-1, 50-2, and 50-3 are 3.6 mm/s, 4.6 mm/s, and 1.2 mm/s, respectively. Fortunately, the peak values of velocity obtained from the vibration pickups 100-1, 100-2, and 100-3 are within 2.3 mm/s. Comparing the data of the standard mentioned above and the supervised data from the in situ test, there should not exist buildings available for housing units and official purpose within 30 m away from the construction region by using the resonance-free vibratory hammer method. Furthermore, there also should not exist buildings that are more sensitive to vibration, historical and cultural relics, and various building structures with special requirements for environmental vibration within 50 m away from the construction region by using the resonance-free vibratory hammer technology.

3.3. Assessment of Structural Safety

According to the Chinese code for seismic design of buildings [40], the peak acceleration value of the ground motion time history curve selected for dynamic analysis of building structures should refer to the peak acceleration value corresponding to frequent earthquakes and rare earthquakes under the condition of seismic fortification intensity. The frequent earthquakes are used to check the elastic stress limit state of building structures, while the rare earthquakes are adopted to estimate the plastic stress limit state of building structures. Considering the safety of residential building structures, the peak acceleration value under frequent earthquakes should be selected as the main safety evaluation index of building structures located in dynamic compaction sites.
According the Chinese code for seismic design of buildings and the seismic ground motion parameter zoning map of China [41], the seismic fortification of the testing site is grade VI, and the basic seismic acceleration value is 0.05 g. It can be seen from Table 3 that the peak vertical acceleration value of the measuring point with A DFTVS of 15 m is 12.9 cm/s2, which does not exceed that under frequent earthquakes in the area of grade VI (the peak acceleration is 18 cm/s2). Therefore, the EP240 resonance-free vibratory hammer used in this paper can ensure the structural safety of the buildings near the consolidated site during the construction process.
It should be noted that there are residential and official buildings but no cultural relics around the testing site. Combining the experimental data in this study with civilized construction and people’s requirements for living environment and official conditions, the safe construction distance is 30 m when using the EP240 resonance-free vibratory hammer without counterweight to reinforce an urban soft site. Given that the safe construction distance is 50 m when using the common dynamic compaction method in the similar site [42], as a result of comparison, the safe DFTVS of the resonance-free vibratory hammer method have shown an obvious superiority.
In addition, instantaneous spectral entropy was recently proposed for detecting the sudden damage related structural changes (especially linear stiffness reductions and nonlinear breathing cracks), which provides a new idea for structural health monitoring [43]. The specific evaluation method should be selected according to the application scenarios.

4. Acceleration Attenuation Model and Verification

4.1. Establishment of Acceleration Attenuation Model

The physical state of soil, vibration source, tamping energy, and frequency can affect the propagation of dynamic-compaction-induced vibrations. Wang [44] combined the propagation of a vibration wave with the attenuation coefficient, DFTVS, the area of vibration source, and the soil attenuation coefficient, and then proposed a prediction model for the peak acceleration dominated by a point source wave caused by dynamic compaction, as shown in Equation (1).
a r = a 0 r 0 r [ 1 ξ 0 ( 1 r 0 r ) ] exp [ β ¯ ( r r 0 ) ]
where r denotes the DFTVS; a r denotes the amplitude of a vibration source from the surface; a 0 denotes the amplitude at the vibration source; ξ 0 denotes the attenuation coefficient related to vibration source region; r 0 denotes the radius of vibration source; β ¯ denotes energy absorption coefficient of soil layer.
Equation (1) is derived from the vibration time history caused by ground vibration. It can also be adopted as a reference for the estimation of the vibration induced by the resonance-free vibratory hammer method in the paper. The in situ testing acceleration result aforementioned can be adopted as the fitting condition. Furthermore, the vibration acceleration amplitude, THE DFTVS attenuation coefficient, and vibration correction factor were selected as the main control factors, and the empirical Equation (2) of vibration acceleration attenuation is then deduced.
a x y z = a + a x y e β r r 0 +
where a x y z denotes the ground vibration acceleration in each direction; a denotes the attenuation coefficient of distance; a xy denotes the vertical acceleration of vibration source; e β r r 0 denotes the attenuation term of surface vibration with THE DFTVS caused by the resonance-free vibratory hammer method; denotes the correction factor.
According to the in situ testing results, the radius of vibration source r 0 = 1 m, so Λ = 0. Here we assume that y = a x y z , A = a , B = a x y , x = r r 0 , β = C , Equation (2) then can be transformed to Equation (3):
y = A + B e C x
By nonlinear regression of the measuring data of the in situ test using the resonance-free vibratory hammer, the calculation models of the resonance-free vibratory hammer induced vibration accelerations can be obtained. The east–west, south–north, and vertical vibration acceleration calculation model can be seen as Equations (4)–(6), respectively:
a x = 0.00271 + 0.16306 e 0.03778 r r 0
a y = 0.00148 + 0.33342 e 0.07189 r r 0
a z = 0.01633 + 0.95282 e 0.14244 r r 0
According to nonlinear regression, the mean square deviations of the Equations (4)–(6) are 0.00368, 0.00497, and 0.00601, respectively; meanwhile, the correlation coefficients are 0.93876, 0.99702, and 0.99237, respectively, which exhibit high fitting accuracy.

4.2. Verification of the Acceleration Calculation Model

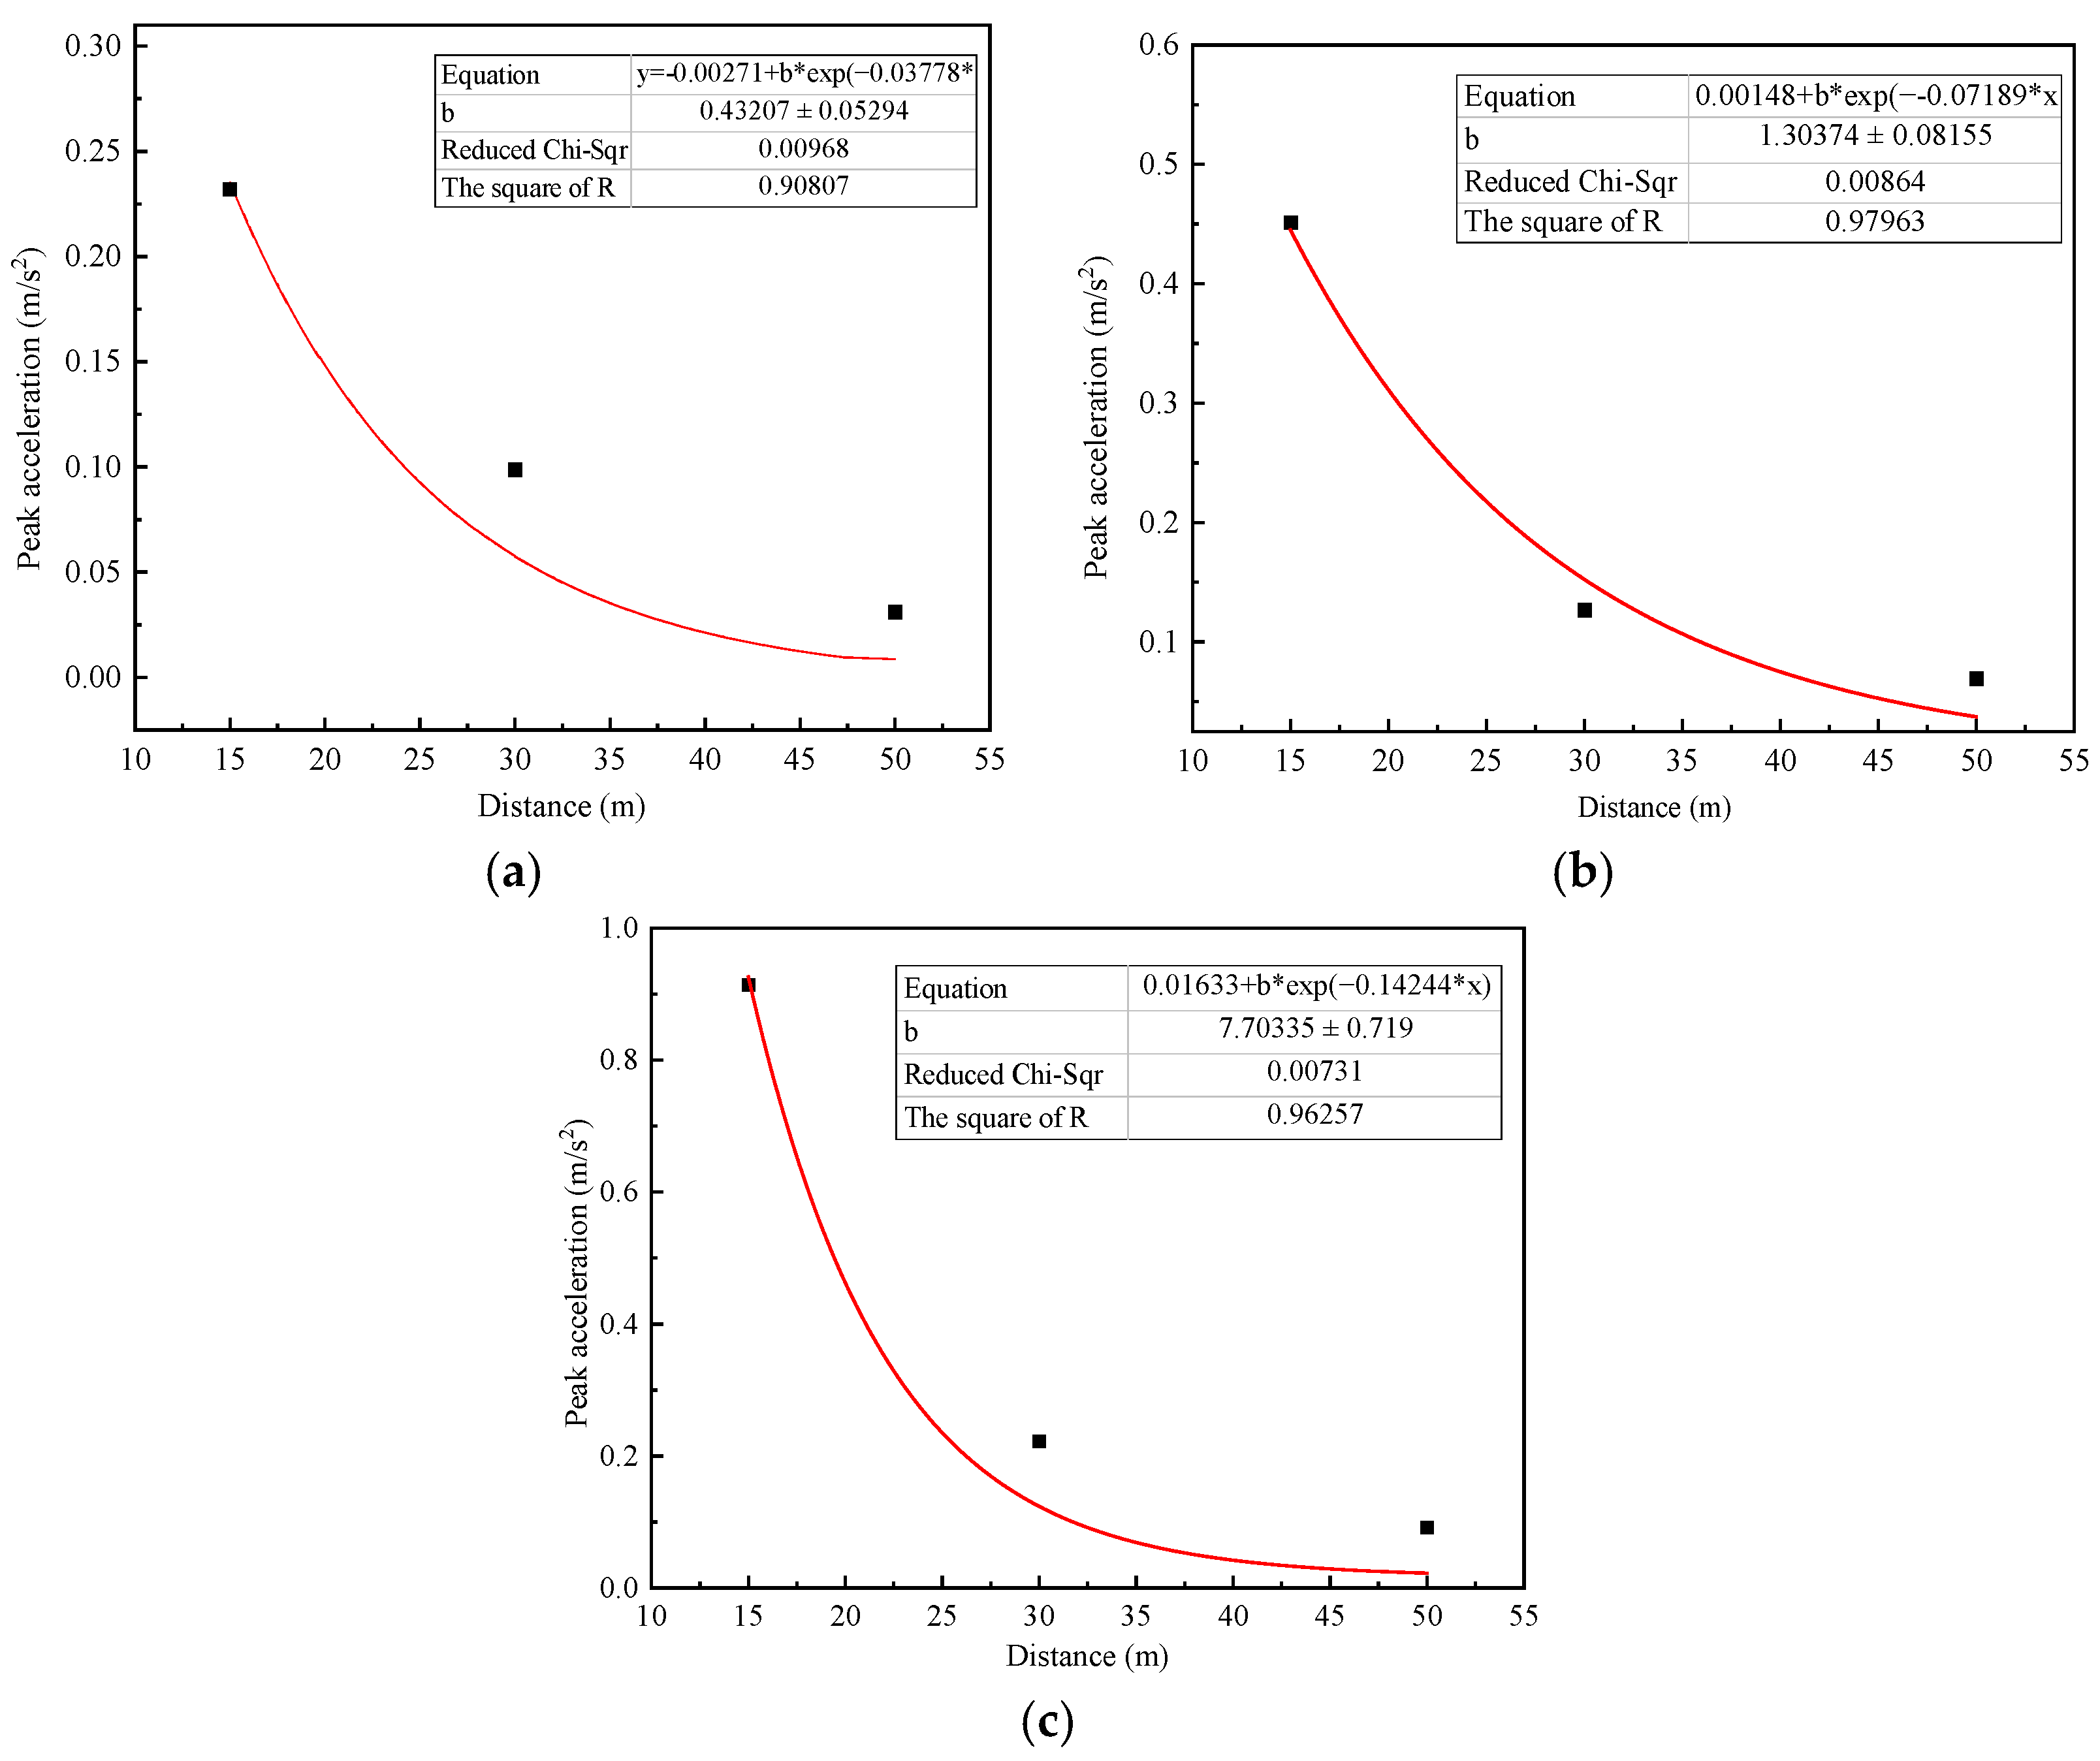
Given that the soil condition of the testing site was consistent with the foregoing site, a resonance-free vibratory hammer with a counterweight of 20 ton was used to verify the acceleration calculation model proposed above. Three measuring points were arranged at the places with DFTVSs of 15 m, 30 m, and 50 m, respectively. Given the peak values of accelerations obtained from test and calculation model, the comparison results are shown in Figure 10. It should be noted that the red line denotes predicted data, and the black dot denotes measured data. The measuring results are consistent with the predicting results. It can be observed that the correlation coefficients of the peak acceleration results in three directions are all above 0.9 (shown in Table 4), which indicates that the vibration calculation models (4)–(6) can be adopted to predict the vibration effects caused by the resonance-free vibratory hammer method in this kind of urban site. Owing to the counterweights, the tamping energy was improved, so the peak acceleration value observed from the same DFTVS of the field test here is larger than that from Table 3.

5. Conclusions and Prospects

5.1. Conclusions

As a novel construction technology contribution to urban soft-foundation reinforcement, the ground vibration effects of the resonance-free vibratory hammer method are worth investigating. Based on the in situ testing results, the attenuation law of vibration acceleration and velocity during the process of dynamic compaction construction from two aspects, i.e., a different DFTVS and diverse vibration directions were systematically analyzed. The minimum safe construction distance and structural safety of the surrounding buildings were taken into account to estimate the civilized construction distance of the resonance-free vibratory hammer method. On the basis of the calculation model of the resonance-free vibratory hammer induced surface ground acceleration proposed in the paper, the reliability of prediction results was verified by the field test. The main conclusions are as follows:
(1)
The resonance-free vibratory hammer induced vibrations in the vertical direction is larger than those in the other two horizontal directions, which should be selected as the primary monitoring value during the evaluation process of the resonance-free vibratory hammer induced vibration effect.
(2)
The ranges of spectrums of the east–west, south–north, and vertical acceleration caused by the resonance-free vibratory hammer method are basically identical. In the same vibration direction, the predominant frequency decreases with the increase of the DFTVS, and the attenuation trend of the east–west and vertical predominant frequency with the DFTVS is more obvious.
(3)
When the DFTVS exceeds 30 m, the peak velocity of each measuring point is within 5 mm/s, and the peak acceleration at each measuring point is lower than 18 cm/s2, which is less than the seismic acceleration limit adopted in the dynamic analysis of fortified building structure according to grade VI. It indicates that the resonance-free vibratory hammer construction in this scope does not affect the structural safety of buildings. If there are no cultural relics, historic buildings, and other buildings that need to consider special requirements of the environment nearby, the minimum safe construction distance can be determined at 30 m away from the vibration source.
(4)
It presents a nonlinear relationship between attenuation of the surficial acceleration caused by the resonance-free vibratory hammer method and the DFTVS. The calculation model of surface ground acceleration established in this paper can quickly and accurately predict surficial vibration effects during the construction process of the resonance-free vibratory hammer method, which is also instructive and meaningful to the formulation of governmental construction guidance and decision-making of the construction organizations and relevant departments.

5.2. Prospects

Through the in situ test and theoretical analysis, the resonance-free vibratory hammer induced site vibration effects and structural safety of the buildings in the construction region were investigated in this paper. The study is aiming at providing a reference for determination of the safe construction distance and the improvement of the applicability of the resonance-free vibratory hammer method. It also has important realistic meaning and reference value to related dynamic compaction research. However, there still exists room for improvement because of practical constraints. In the future, the following research related to the resonance-free vibratory hammer method needs to be carried out:
(1)
The effects of soil properties on the propagation of the resonance-free vibratory hammer induced stress wave should be further studied. Therefore, the application scope of this construction method can be further refined by referring to the classification of soil layers.
(2)
There are no unified and generally recognized standards to the evaluation program of the resonance-free vibratory hammer method induced vibration effects. The consult peak vibration velocity in this paper is recognized as 5 mm/s by referring to the existing specifications, which are based on the perspective of safety and conservatism. To put forward the evaluation threshold value that is suitable for the resonance-free vibratory hammer method, more in situ data and theoretical research are needed in the future.

Author Contributions

Conceptualization and design, X.C. and J.C.; methodology, X.C., Z.H. and J.C.; simulation and data collection, X.C. and X.X.; data curation, X.C. and H.L.; writing—review and editing, W.B.; funding acquisition, X.C. and J.C. All authors have read and agreed to the published version of the manuscript.

Funding

This research was funded by support from the Scientific Research Fund of State Key Laboratory of Mechanical Behavior and System Safety of Traffic Engineering Structures, Shijiazhuang Tiedao University (Grant No. KF2020-20), and the National Natural Science Foundation of China (NSFC) (grant no. 52008081, no. 52168045 and no. 52020105002).

Data Availability Statement

Not applicable.

Conflicts of Interest

The authors declare no conflict of interest.

References

  1. Li, Y.Q.; Fang, Y.; Yang, Z.Y. Two criteria for effective improvement depth of sand foundation under dynamic compaction using discrete element method. Comput. Part. Mech. 2022, 1–8. [Google Scholar] [CrossRef]
  2. Zhang, Y.C.; Yao, Y.G.; Ma, A.G.; Liu, C.L. In situ tests on improvement of collapsible loess with large thickness by down-hole dynamic compaction pile. Eur. J. Environ. Civ. Eng. 2020, 24, 156–170. [Google Scholar] [CrossRef]
  3. Tan, T.; Jiang, Y.J.; Yi, Y.; Fan, J.; Deng, C. Laboratory fatigue performance of the cement-stabilised loess fabricated using different compaction methods. Road Mater. Pavement Des. 2022, 1–19. [Google Scholar] [CrossRef]
  4. Zhang, R.; Sun, Y.; Song, E. Simulation of dynamic compaction and analysis of its efficiency with the material point method. Comput. Geotech. 2019, 116, 103218. [Google Scholar] [CrossRef]
  5. Pistrol, J.; Adam, D. Fundamentals of roller integrated compaction control for oscillatory rollers and comparison with conventional testing methods. Transp. Geotech. 2018, 17, 75–84. [Google Scholar] [CrossRef]
  6. Zheng, X.; Zhang, Q.Q.; Wang, S.J.; Wu, S.Q.; Wei, C. Performance evaluation of abandoned fly ash deposit improved by dynamic compaction for construction of highway embankment. J. Test. Eval. 2022, 50, 1537–1555. [Google Scholar] [CrossRef]
  7. Grigorev, I.; Burgonutdinov, A.; Makuev, V.; Tikhonov, E.; Shvetsova, V.; Timokhova, O.; Revyako, S.; Dmitrieva, N. The theoretical modeling of the dynamic compaction process of forest soil. Math. Biosci. Eng. 2022, 19, 2935–2949. [Google Scholar] [CrossRef]
  8. Shen, M.F.; Juang, C.H.; Ku, C.S.; Khoshnevisan, S. Assessing effect of dynamic compaction on liquefaction potential using statistical methods—A case study. Georisk Assess. Manag. Risk Eng. Syst. Geohazards 2019, 13, 341–348. [Google Scholar] [CrossRef]
  9. Wang, W.; Wei, J.B.; Wu, J.B.; Zhou, R.F. Field test and analysis on effects of pile driving with high -frequency and resonance-free technology on surrounding soil. J. Build. Struct. 2021, 42, 131–138. [Google Scholar]
  10. Goanta, A.M.; Bratu, P.; Dragan, N. Dynamic response of vibratory piling machines for ground foundations. Symmetry 2022, 14, 1238. [Google Scholar] [CrossRef]
  11. Lee, F.H.; Gu, Q. Method for estimating dynamic compaction effect on sand. J. Geotech. Geoenviron. Eng. 2004, 130, 139–152. [Google Scholar] [CrossRef]
  12. Cheng, S.H.; Chen, S.S.; Ge, L. Method of estimating the effective zone induced by rapid impact compaction. Sci. Rep. 2021, 11, 18336. [Google Scholar] [CrossRef] [PubMed]
  13. Jia, M.C.; Yang, Y.; Liu, B.; Wu, S.H. PFC/FLAC coupled simulation of dynamic compaction in granular soils. Granul. Matter 2018, 20, 76. [Google Scholar] [CrossRef]
  14. Scott, B.; Jaksa, M.; Mitchell, P. Ground response to dynamic compaction. Geo-Tech. Lett. 2019, 9, 99–105. [Google Scholar] [CrossRef]
  15. Deckner, F.; Viking, K.; Guillemet, C.; Hintze, S. Instrumentation system for ground vibration analysis during sheet pile driving. Geotech. Test. J. 2015, 38, 893–905. [Google Scholar] [CrossRef]
  16. Wang, S.G.; Zhu, S.Y. Global vibration intensity assessment based on vibration source localization on construction sites: Application to vibratory sheet piling. Appl. Sci. 2022, 12, 1946. [Google Scholar] [CrossRef]
  17. Deckner, F.; Viking, K.; Hintze, S. Wave patterns in the ground: Case studies related to vibratory sheet pile driving. Geotech. Geol. Eng. 2017, 35, 2863–2878. [Google Scholar] [CrossRef] [Green Version]
  18. Wang, S.G.; Zhu, S.Y. Impact source localization and vibration intensity prediction on construction sites. Measurement 2021, 175, 109148. [Google Scholar] [CrossRef]
  19. Colaco, A.; Costa, P.A.; Ferreira, C.; Cardoso, A.S. Prediction of ground-borne vibrations induced by impact pile driving: Experimental validation of an equivalent linear approach. Can. Geotech. J. 2022, 2022, 1–5. [Google Scholar] [CrossRef]
  20. Zhu, S.; Shi, X.; Leung, R.C.; Cheng, L.; Ng, S.; Zhang, X.; Wang, Y. Impact of construction-induced vibration on vibration-sensitive medical equipment: A case study. Adv. Struct. Eng 2014, 17, 907–920. [Google Scholar] [CrossRef]
  21. Athanasopoulos, G.A.; Pelekis, P.C. Ground vibrations from sheet pile driving in urban environment: Measurements, analysis and effects on buildings and occupants. Soil Dyn. Earthq. Eng. 2000, 19, 371–387. [Google Scholar] [CrossRef]
  22. Surapreddi, S.; Ghosh, P. Impact of footing shape on dynamic properties and vibration transmission characteristics of machine foundations. Int. J. Geosynth. Ground Eng. 2021, 8, 2. [Google Scholar] [CrossRef]
  23. Surapreddi, S.; Ghosh, P. Experimental and numerical investigations on attenuation response of machine foundations under vertical excitation. Geomech. Geoengin.—Int. J. 2022, 17, 1865–1886. [Google Scholar] [CrossRef]
  24. Yang, C.W.; Zhang, L.; Han, Y.X.; Cai, D.; Wei, S. Study on the transmission and evolution characteristics of vibration wave from vibratory roller to filling materials based on the field test. Appl. Sci. 2020, 10, 2008. [Google Scholar] [CrossRef] [Green Version]
  25. Das, A.; Chakrabortty, P. Artificial neural network and regression models for prediction of free-field ground vibration parameters induced from vibroflotation. Soil Dyn. Earthq. Eng. 2021, 148, 106823. [Google Scholar] [CrossRef]
  26. Chen, A.; Cheng, F.; Wu, D.; Tang, X. Ground vibration propagation and attenuation of vibrating compaction. J. Vibroeng. 2019, 21, 1342–1352. [Google Scholar] [CrossRef] [Green Version]
  27. Dong, S.K.; Lee, J.S. Propagation and attenuation characteristics of various ground vibrations. Soil Dyn. Earthq. Eng. 2000, 19, 115–126. [Google Scholar] [CrossRef]
  28. Wu, J.; Ma, L.; Shi, J.; Sun, Y.; Ke, J.; Wang, D. Investigation of ground vibration of full-stone foundation under dynamic compaction. Shock. Vib. 2019, 2019, 2631797. [Google Scholar] [CrossRef] [Green Version]
  29. Wang, W.; Chen, J.J.; Wang, J.H. Estimation method for ground deformation of granular soils caused by dynamic compaction. Soil Dyn. Earthq. Eng. 2017, 92, 266–278. [Google Scholar] [CrossRef]
  30. Li, X.; Li, J.; Ma, X.; Teng, J.; Zhang, S. Numerical study of the dynamic compaction process considering the phenomenon of particle breakage. Adv. Civ. Eng. 2018, 2018, 1838370. [Google Scholar] [CrossRef]
  31. Wang, J.; Li, Q. Coupled continuum-discrete modeling of rammed floating stone column installation. AIP Adv. 2019, 9, 015222. [Google Scholar] [CrossRef]
  32. Wang, J.; Jiang, Y.; Ouyang, H.; Jiang, T.; Song, M.; Zhang, X. 3D continuum-discrete coupling modeling of soil-hammer interaction under dynamic compaction. J. Vibroengineering 2019, 21, 348–359. [Google Scholar] [CrossRef] [Green Version]
  33. Wang, J.; Cui, Y.H.; Li, Q. Hybrid numerical investigation on soil-hammer interaction during dynamic compaction. Adv. Civ. Eng. 2019, 2019, 4563134. [Google Scholar] [CrossRef] [Green Version]
  34. Gong, C.M.; Cheng, Q.G.; Liu, Z.P. Model test study of dynamic responses of loess slope by dynamic compaction. Rock Soil Mech. 2011, 32, 2001–2006. (In Chinese) [Google Scholar]
  35. Lupiezowiec, M.; Pradelok, S.; Btkowski, P.; Poprawa, G. FEM model of vibration propagation in the soil caused by prefabricated driven piles. In Proceedings of the 14th SGEM GeoConference on Science and Technologies in Geology, Exploration and Mining, Albena, Bulgaria, 17–26 June 2014. [Google Scholar] [CrossRef]
  36. Lupiezowiec, M. Modeling the phenomenon of propagation of technological impulses in subsoil. Int. J. Geomech. 2022, 22, 04022175. [Google Scholar] [CrossRef]
  37. Bose, T.; Choudhury, D.; Sprengel, J.; Ziegler, M. Efficiency of open and infill trenches in mitigating ground-borne vibrations. J. Geotech. Geoenviron. Eng. 2018, 144, 04018048. [Google Scholar] [CrossRef] [Green Version]
  38. Hamidi, A.; Rooz, A.F.H. Efficiency analysis of open trench for impact pile driving through a single-variable method. Mar. Georesour. Geotechnol. 2021, 39, 82–102. [Google Scholar] [CrossRef]
  39. Ministry of Housing and Urban-Rural Development of the People’s Republic of China. Standard for Allowable Vibration of Building Engineering: GB 50868-2013; China Planning Press: Beijing, China, 2013. [Google Scholar]
  40. Ministry of Housing and Urban-Rural Development of the People’s Republic of China. Code for Seismic Design of Buildings: GB 50011-2018; China Construction Industry Press: Beijing, China, 2018. [Google Scholar]
  41. General Administration of Quality Supervision, Inspection and Quarantine of the People’s Republic of China. Seismic Ground Motion Parameter Zoning Map Of China: GB 18306-2015; China Standards Press: Beijing, China, 2015. [Google Scholar]
  42. Liu, C.; Liang, H.A.; Cheng, X.J. Study on vibration effect of combined heavy tamping on soft soil foundation in city. Technol. Earthq. Disaster Prev. 2021, 16, 381–390. (In Chinese) [Google Scholar]
  43. Civera, M.; Surace, C. Instantaneous spectral entropy: An application for the online monitoring of multi-story frame structures. Buildings 2022, 12, 310. [Google Scholar] [CrossRef]
  44. Wang, J.X. Dynamic Foundation and Foundation; Science Press: Beijing, China, 2001; pp. 227–242. [Google Scholar]
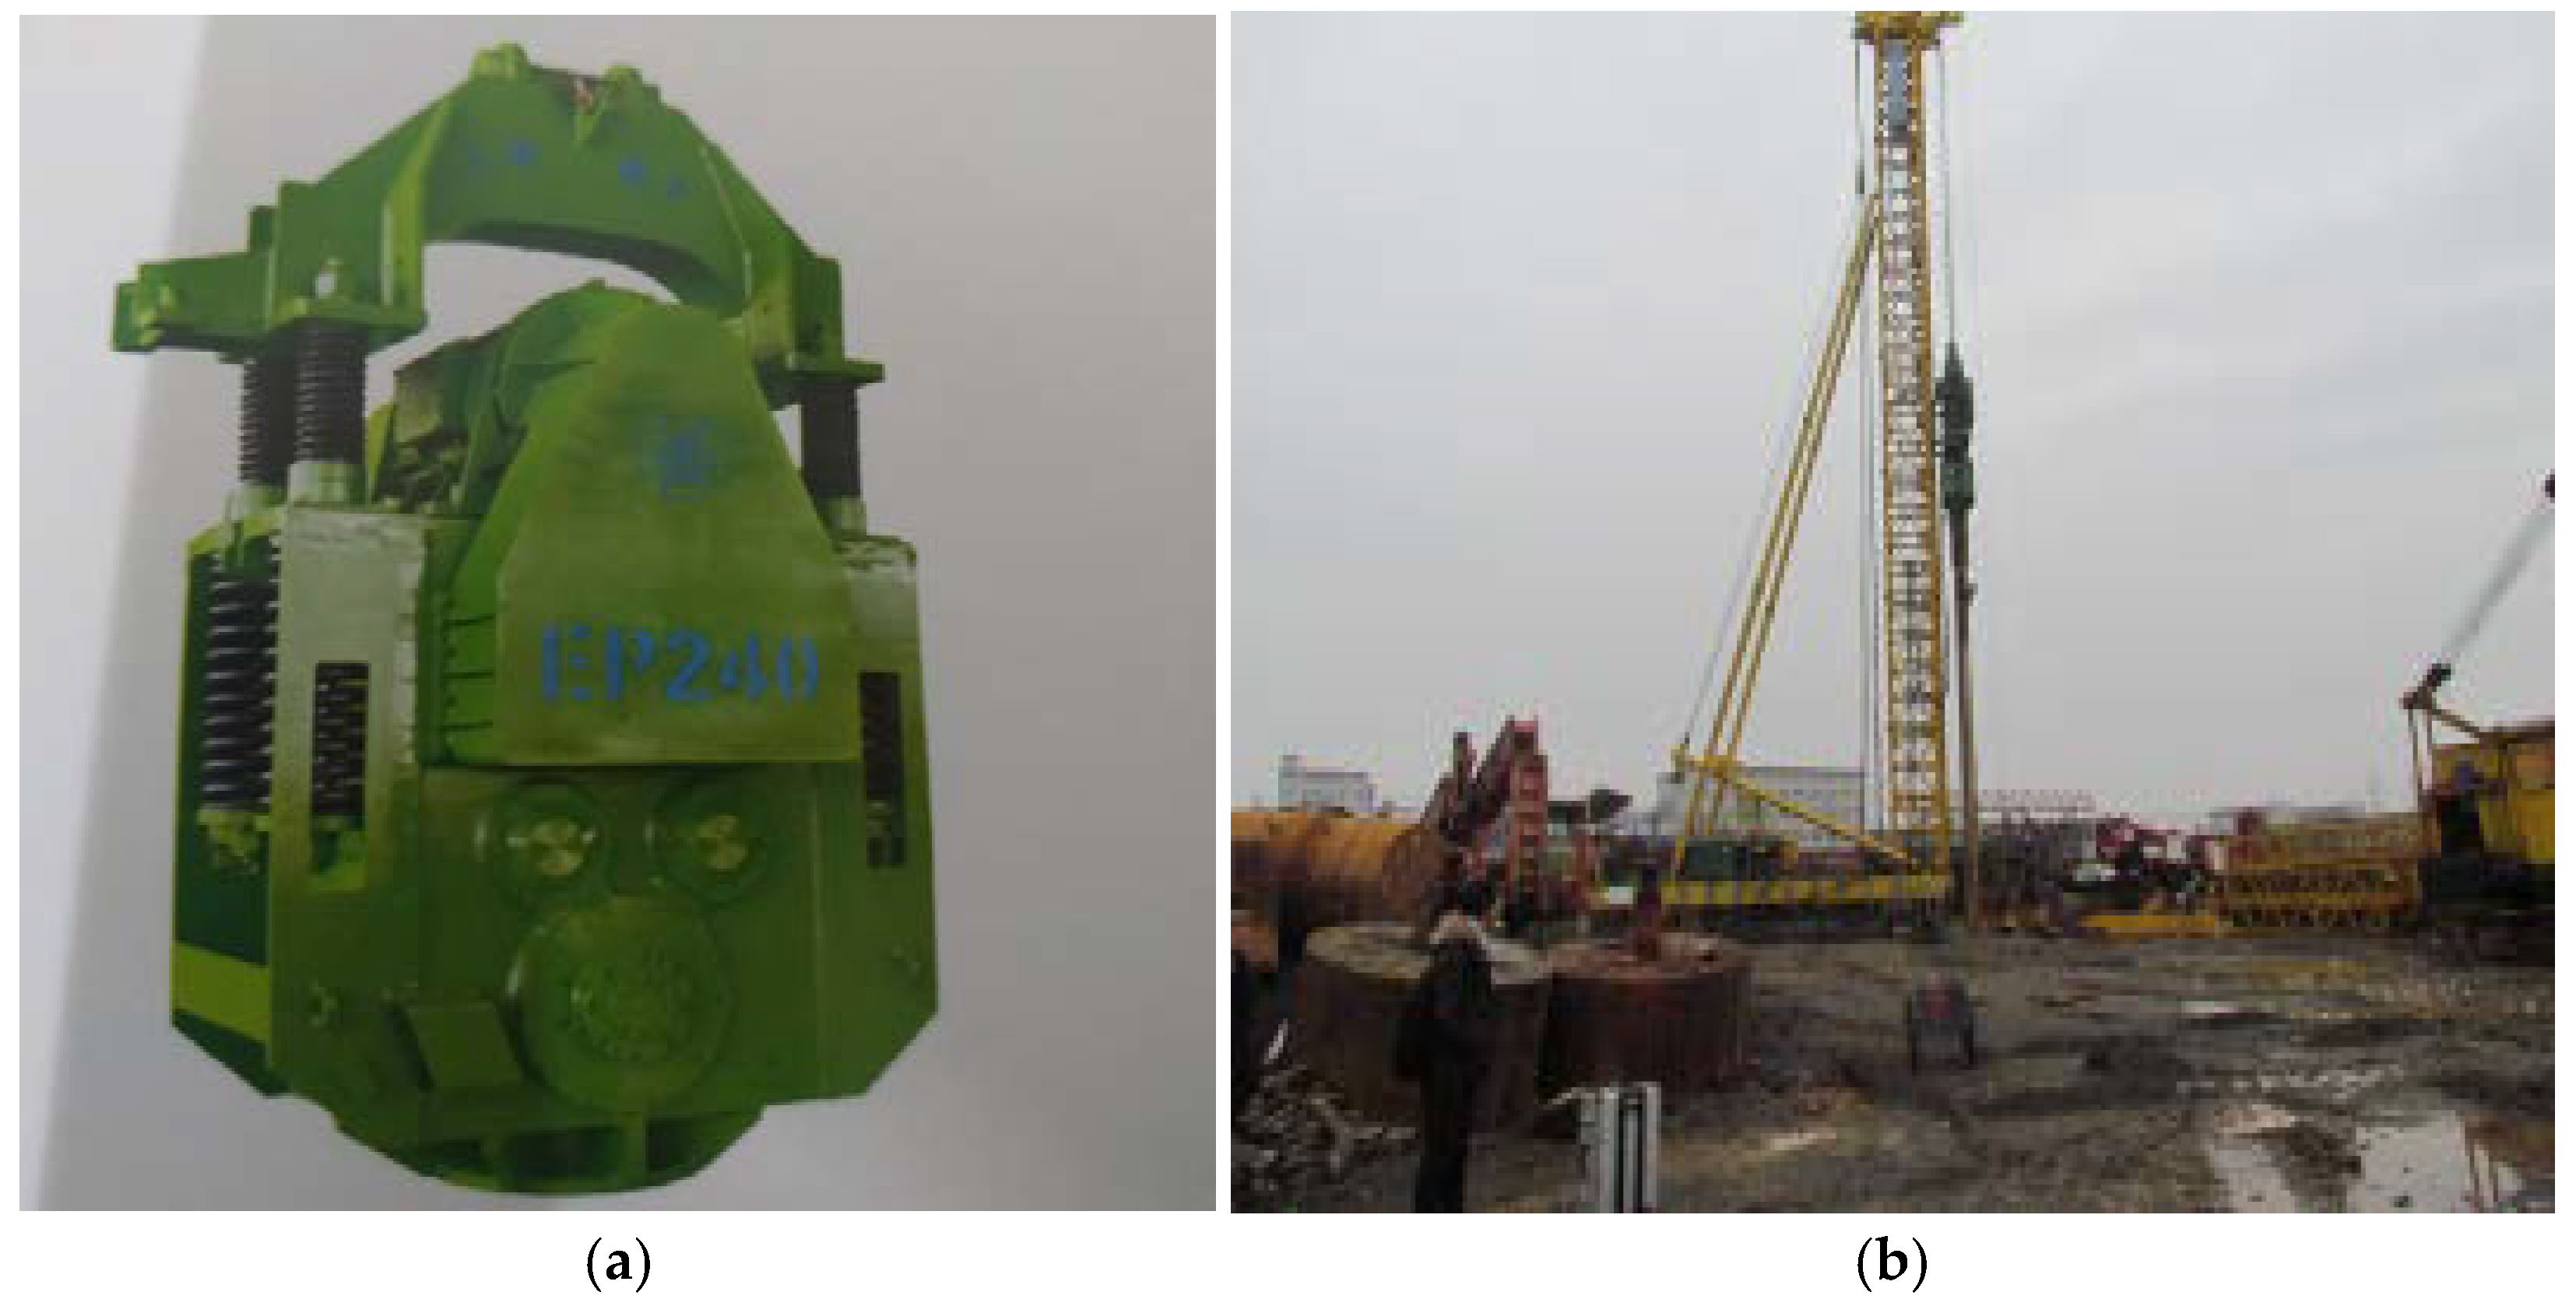
Figure 1. Resonance-free vibratory hammer and dynamic compaction construction: (a) Resonance-free vibratory hammer. (b) Testing site.
Buildings 12 02204 g001
Figure 2. Testing devices used in the test.
Buildings 12 02204 g002
Figure 3. Sketch of monitoring points in testing site: (a) Sensor arrangement. (b) Map of testing site.
Buildings 12 02204 g003
Figure 4. Acceleration time history curves in the vertical direction: (a) 15-1; (b) 30-1; (c) 50-1; (d) 100-1.
Buildings 12 02204 g004
Figure 5. Fourier spectrum curves of acceleration in the vertical direction: (a) 15-1; (b) 30-1; (c) 50-1; (d) 100-1.
Buildings 12 02204 g005
Figure 6. Acceleration time history curves in the east–west direction: (a) 15-2; (b) 30-2; (c) 50-2; (d) 100-2.
Buildings 12 02204 g006
Figure 7. Fourier spectrum curves of acceleration in the east–west direction: (a) 15-2; (b) 30-2; (c) 50-2; (d) 100-2.
Buildings 12 02204 g007
Figure 8. Acceleration time history curves in the south–north direction: (a) 15-3; (b) 30-3; (c) 50-3; (d) 100-3.
Buildings 12 02204 g008
Figure 9. Fourier spectrum curves of acceleration in the south–north direction: (a) 15-3; (b) 30-3; (c) 50-3; (d) 100-3.
Buildings 12 02204 g009
Figure 10. Comparison of predicted and measured results: (a) East–west direction; (b) south–north direction; (c) vertical direction.
Buildings 12 02204 g010
Table 1. Stratum distribution parameter.
Layer NumberSoil NameCategoryThickness
①-2Plain fillSoft soil1.70 m
③-1Silty clayMedium soft soil1.80 m
③-1-1Mucky soilMedium soft soil2.00 m
③-2Fine sandMedium soft soil4.10 m
③-3Medium sandMedium soft soil2.60 m
③-4Coarse sandMedium hard soil1.80 m
③-5Gravel sandMedium hard soil10.00 m
③-6Round gravelMedium hard soil9.40 m
⑤-1-3Moderately weathered argillaceous siltstoneSoft rock4.60 m
⑤-4-2Moderately weathered calcareous mudstoneSoft rock2.90 m
Table 2. Parameter of apparatus.
TypeElectric Shock PowerStatic Eccentric MomentMaximum Vibration FrequencyExciting ForceVibration Mass
EP240180 kW1500 N·m860 r/min124 ton13.320 kg
Table 3. Peak vibration values of monitoring points.
DFTVSVertical DirectionEast-West DirectionSouth-North Direction
Peak AccelerationPeak VelocityPeak AccelerationPeak VelocityPeak AccelerationPeak Velocity
(m/s2)(m/s)(m/s2)(m/s)(m/s2)(m/s)
15 m0.1288720.0069570.086390.0058530.11450.006109
30 m0.028780.004290.061010.004740.042090.003165
50 m0.023270.0035840.010290.0046340.0068080.001288
100 m0.0109350.0022380.0048630.0021330.003910.001125
Table 4. Analysis results of attenuation curve regression.
ItemRegression Formula VerificationCorrelation Coefficient
East-west acceleration y = 0.00271 + 0.43207 e 0.03718 r r 0 0.908
South-north acceleration y = 0.00148 + 1.30374 e 0.07189 r r 0 0.979
Vertical acceleration y = 0.01633 + 7.70335 e 0.14244 r r 0 0.962
Publisher’s Note: MDPI stays neutral with regard to jurisdictional claims in published maps and institutional affiliations.