Numerical Analysis of Mechanical Behavior of Self-Centering Joint between CFDST Column and RC Beam
Abstract
1. Introduction
2. Joint Configurations and Working Mechanism
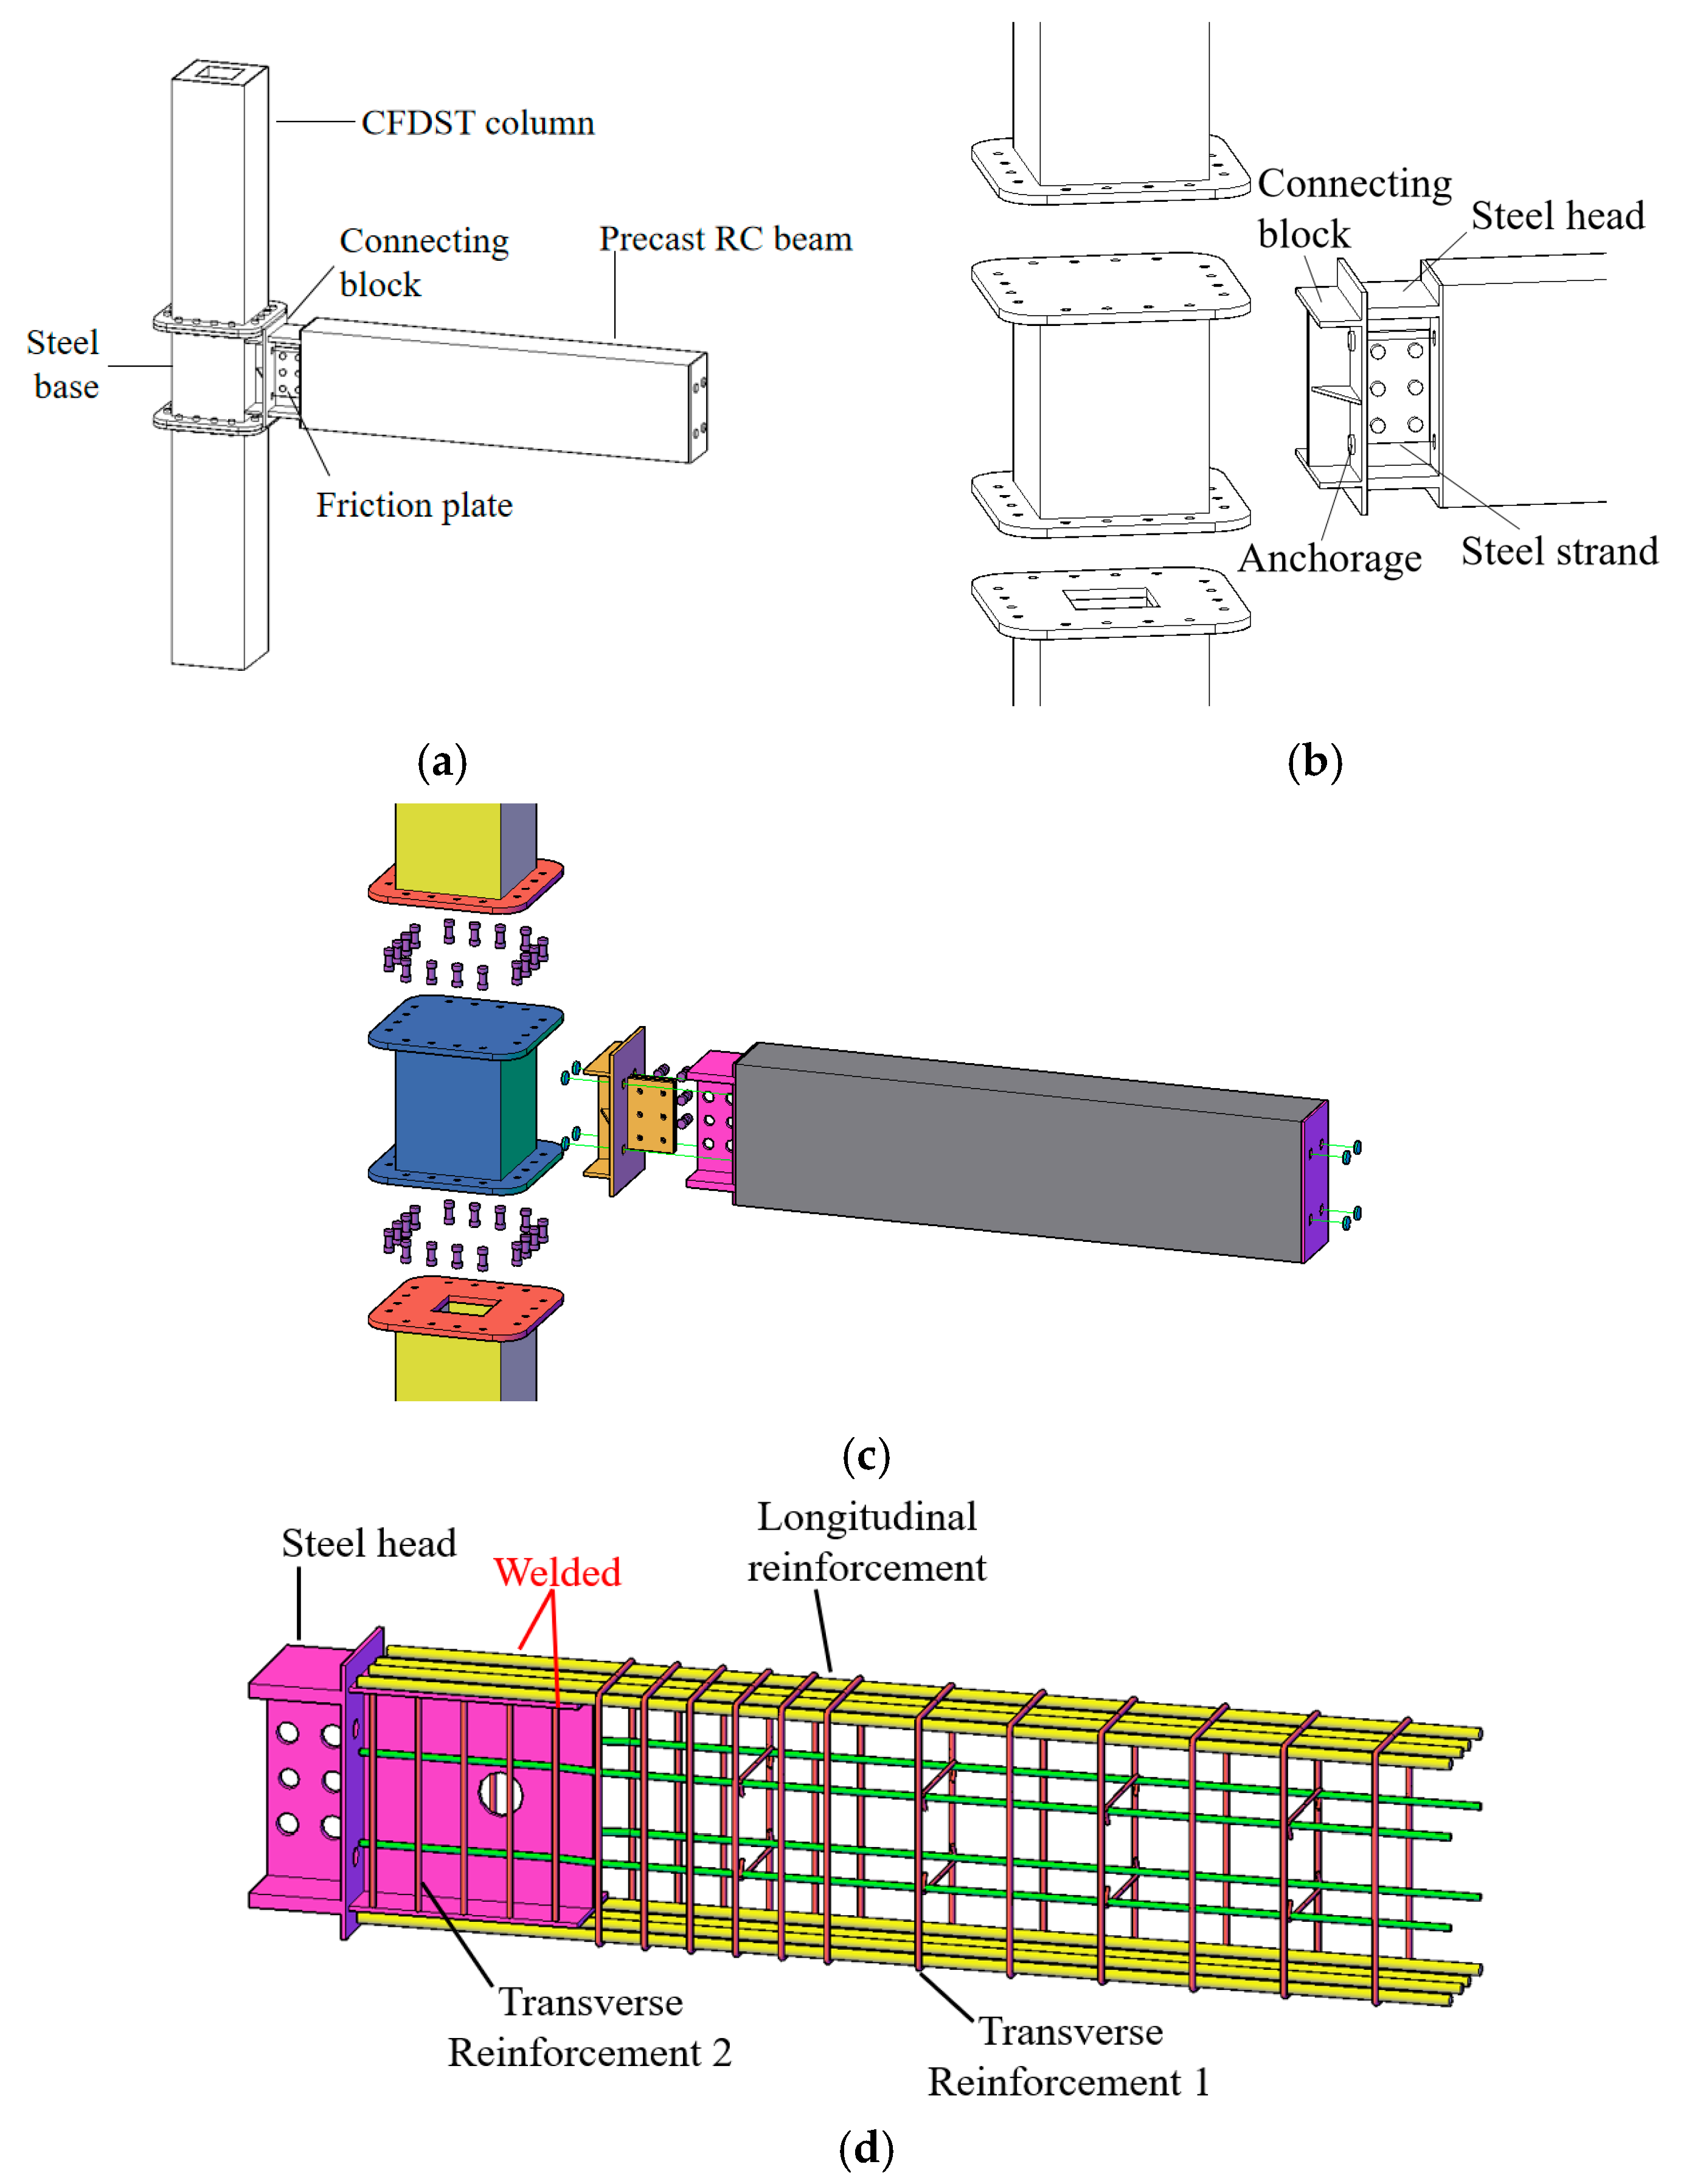
2.1. Joint Configurations
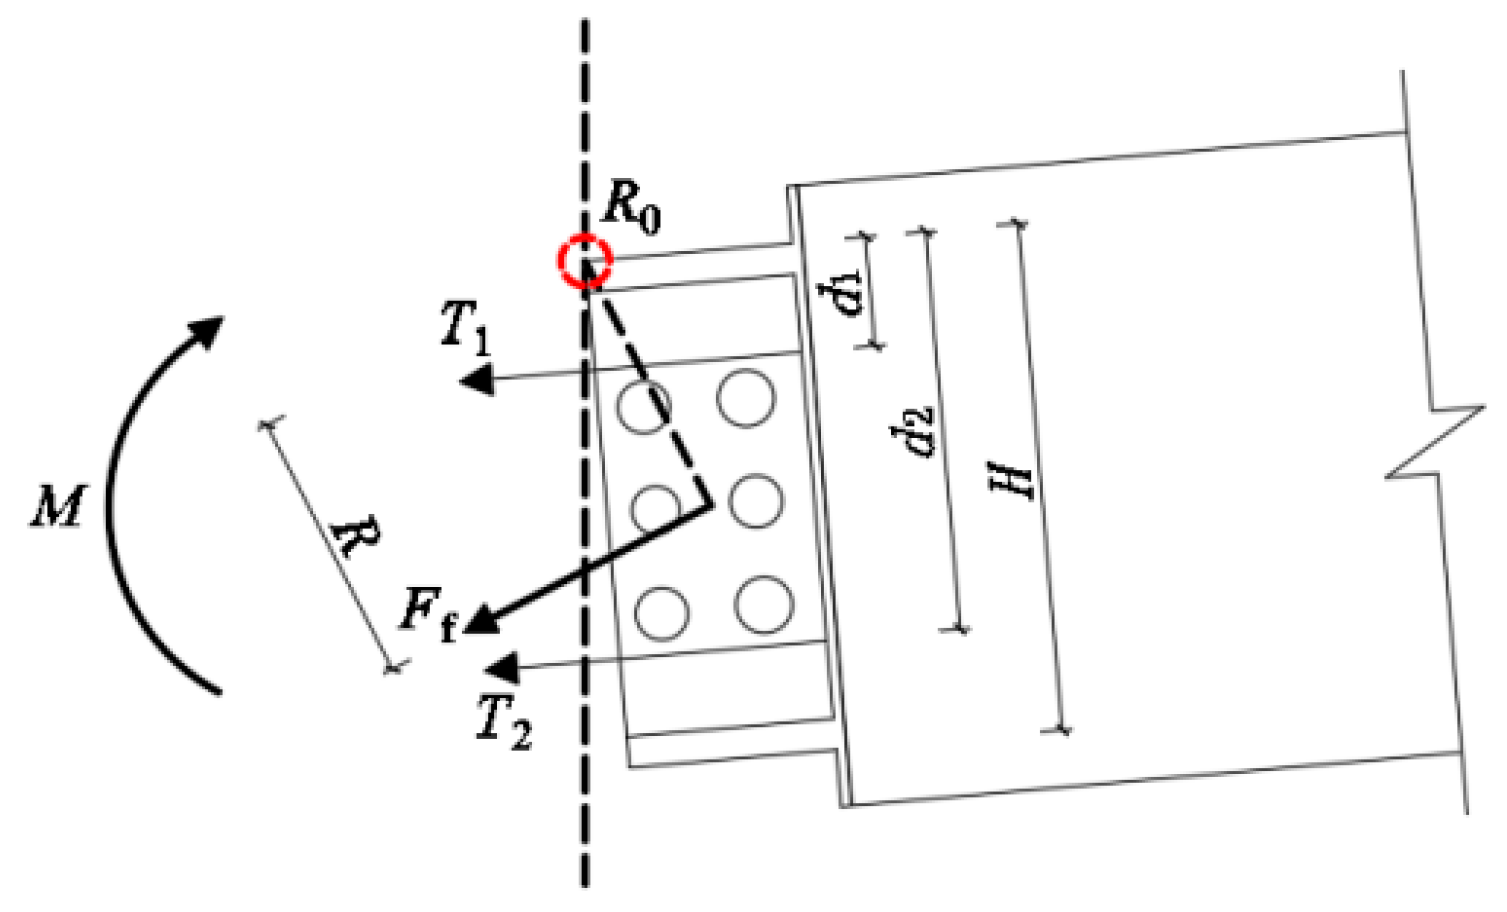
2.2. Working Mechanism
3. Finite Element Model Developing
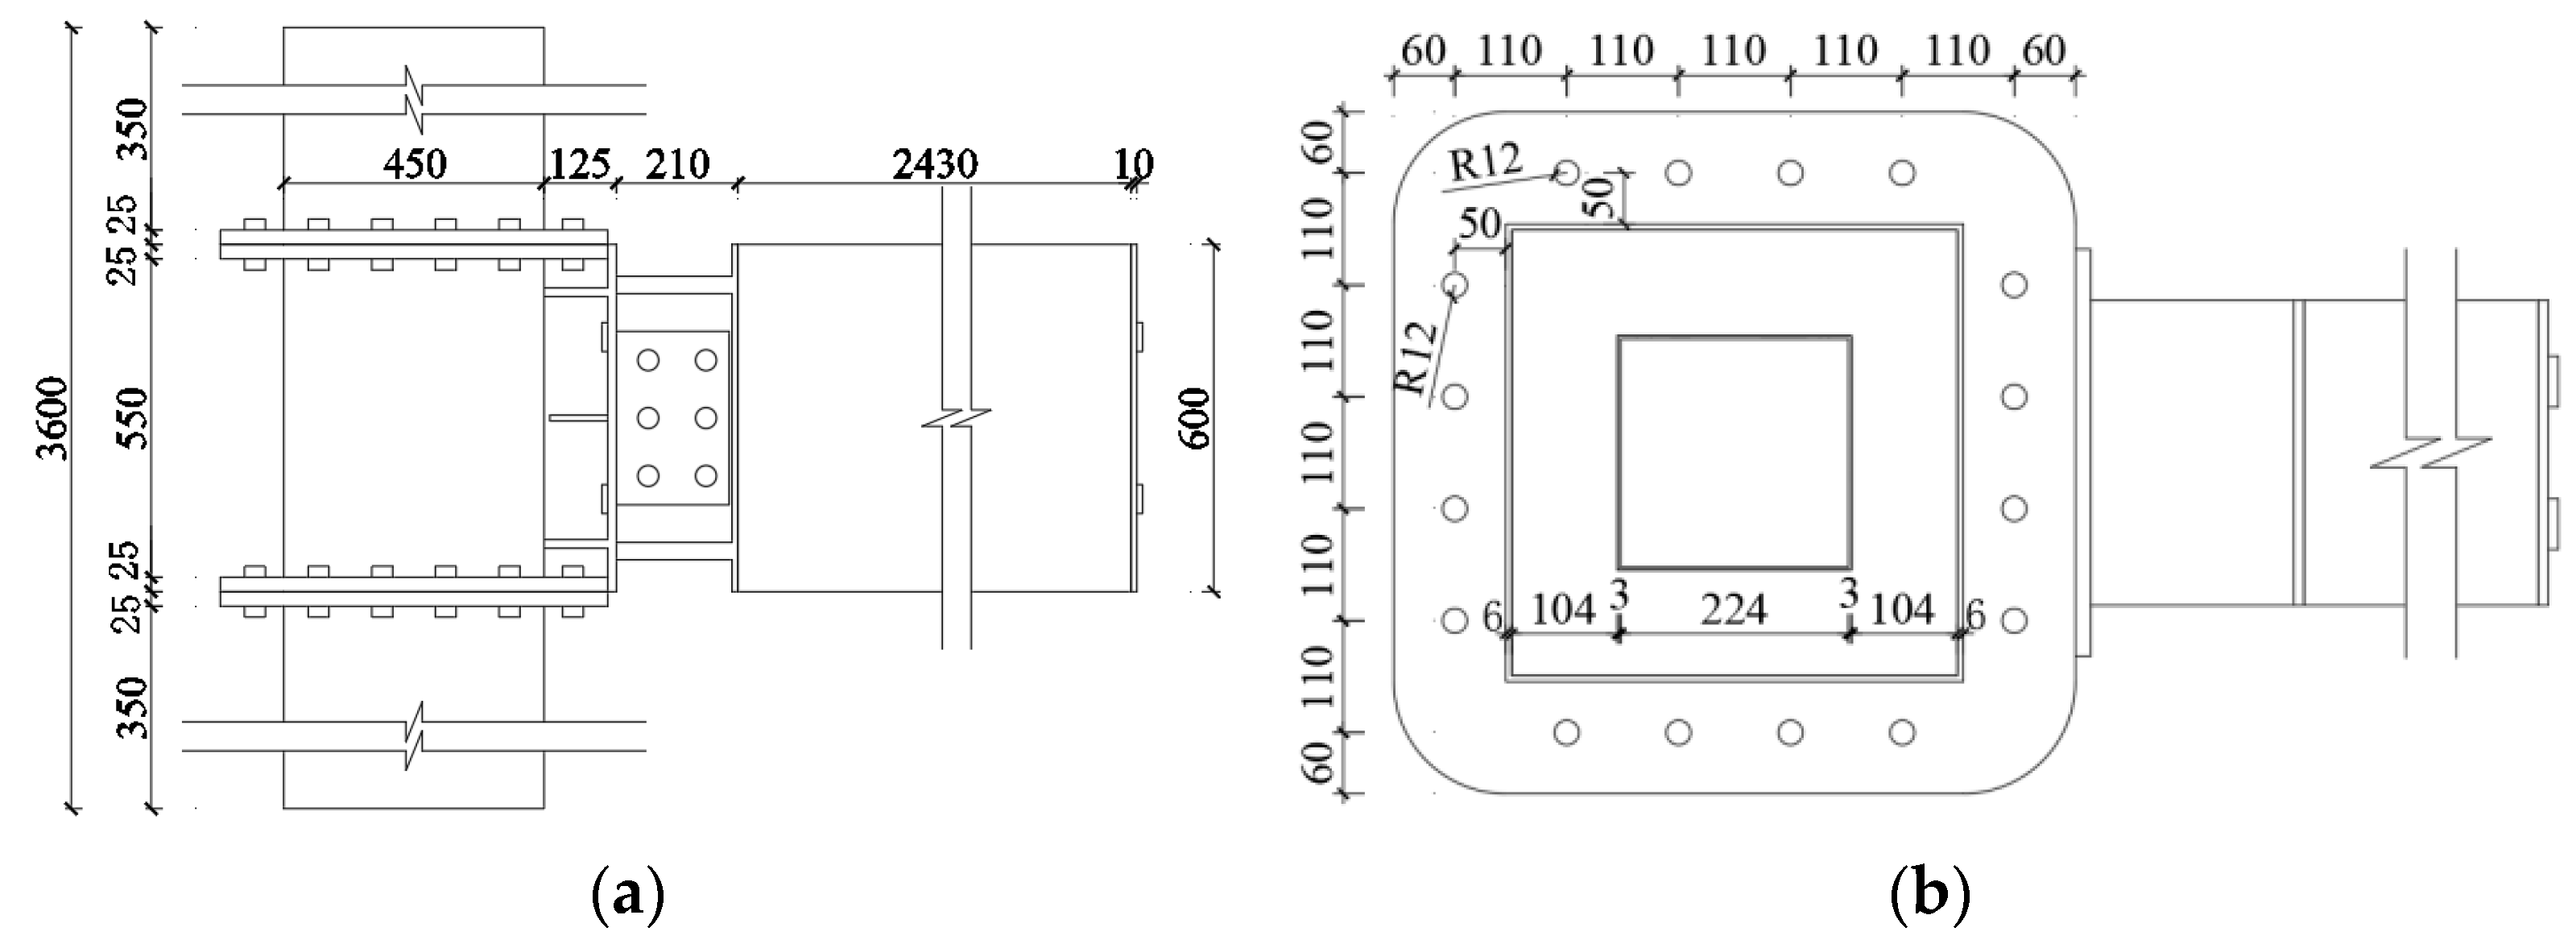
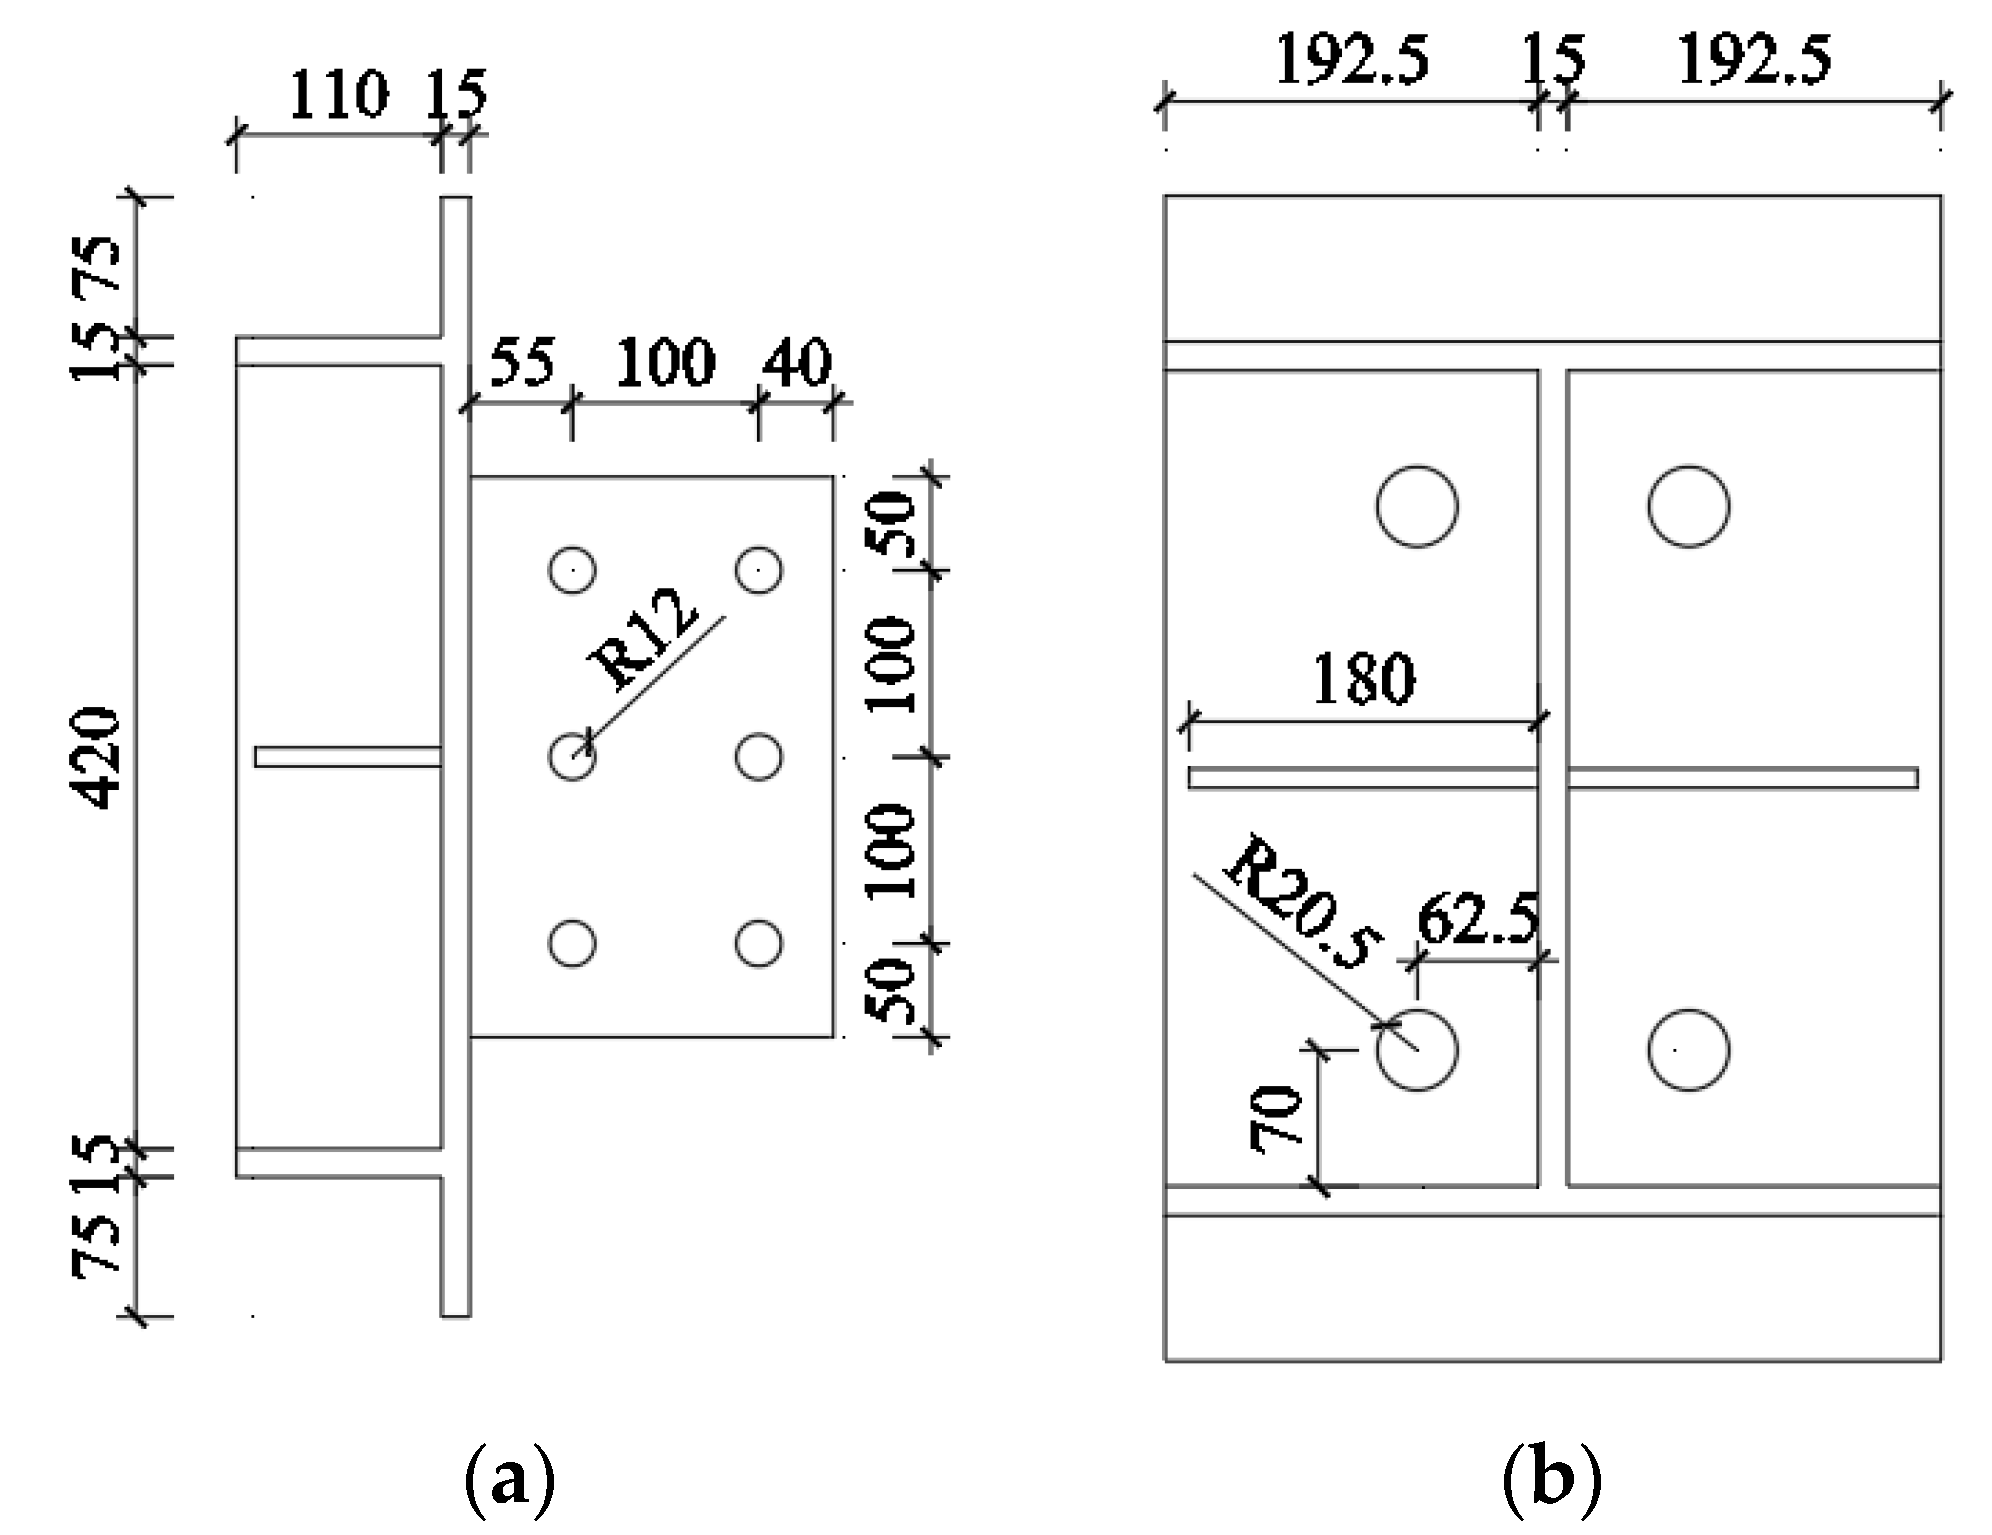
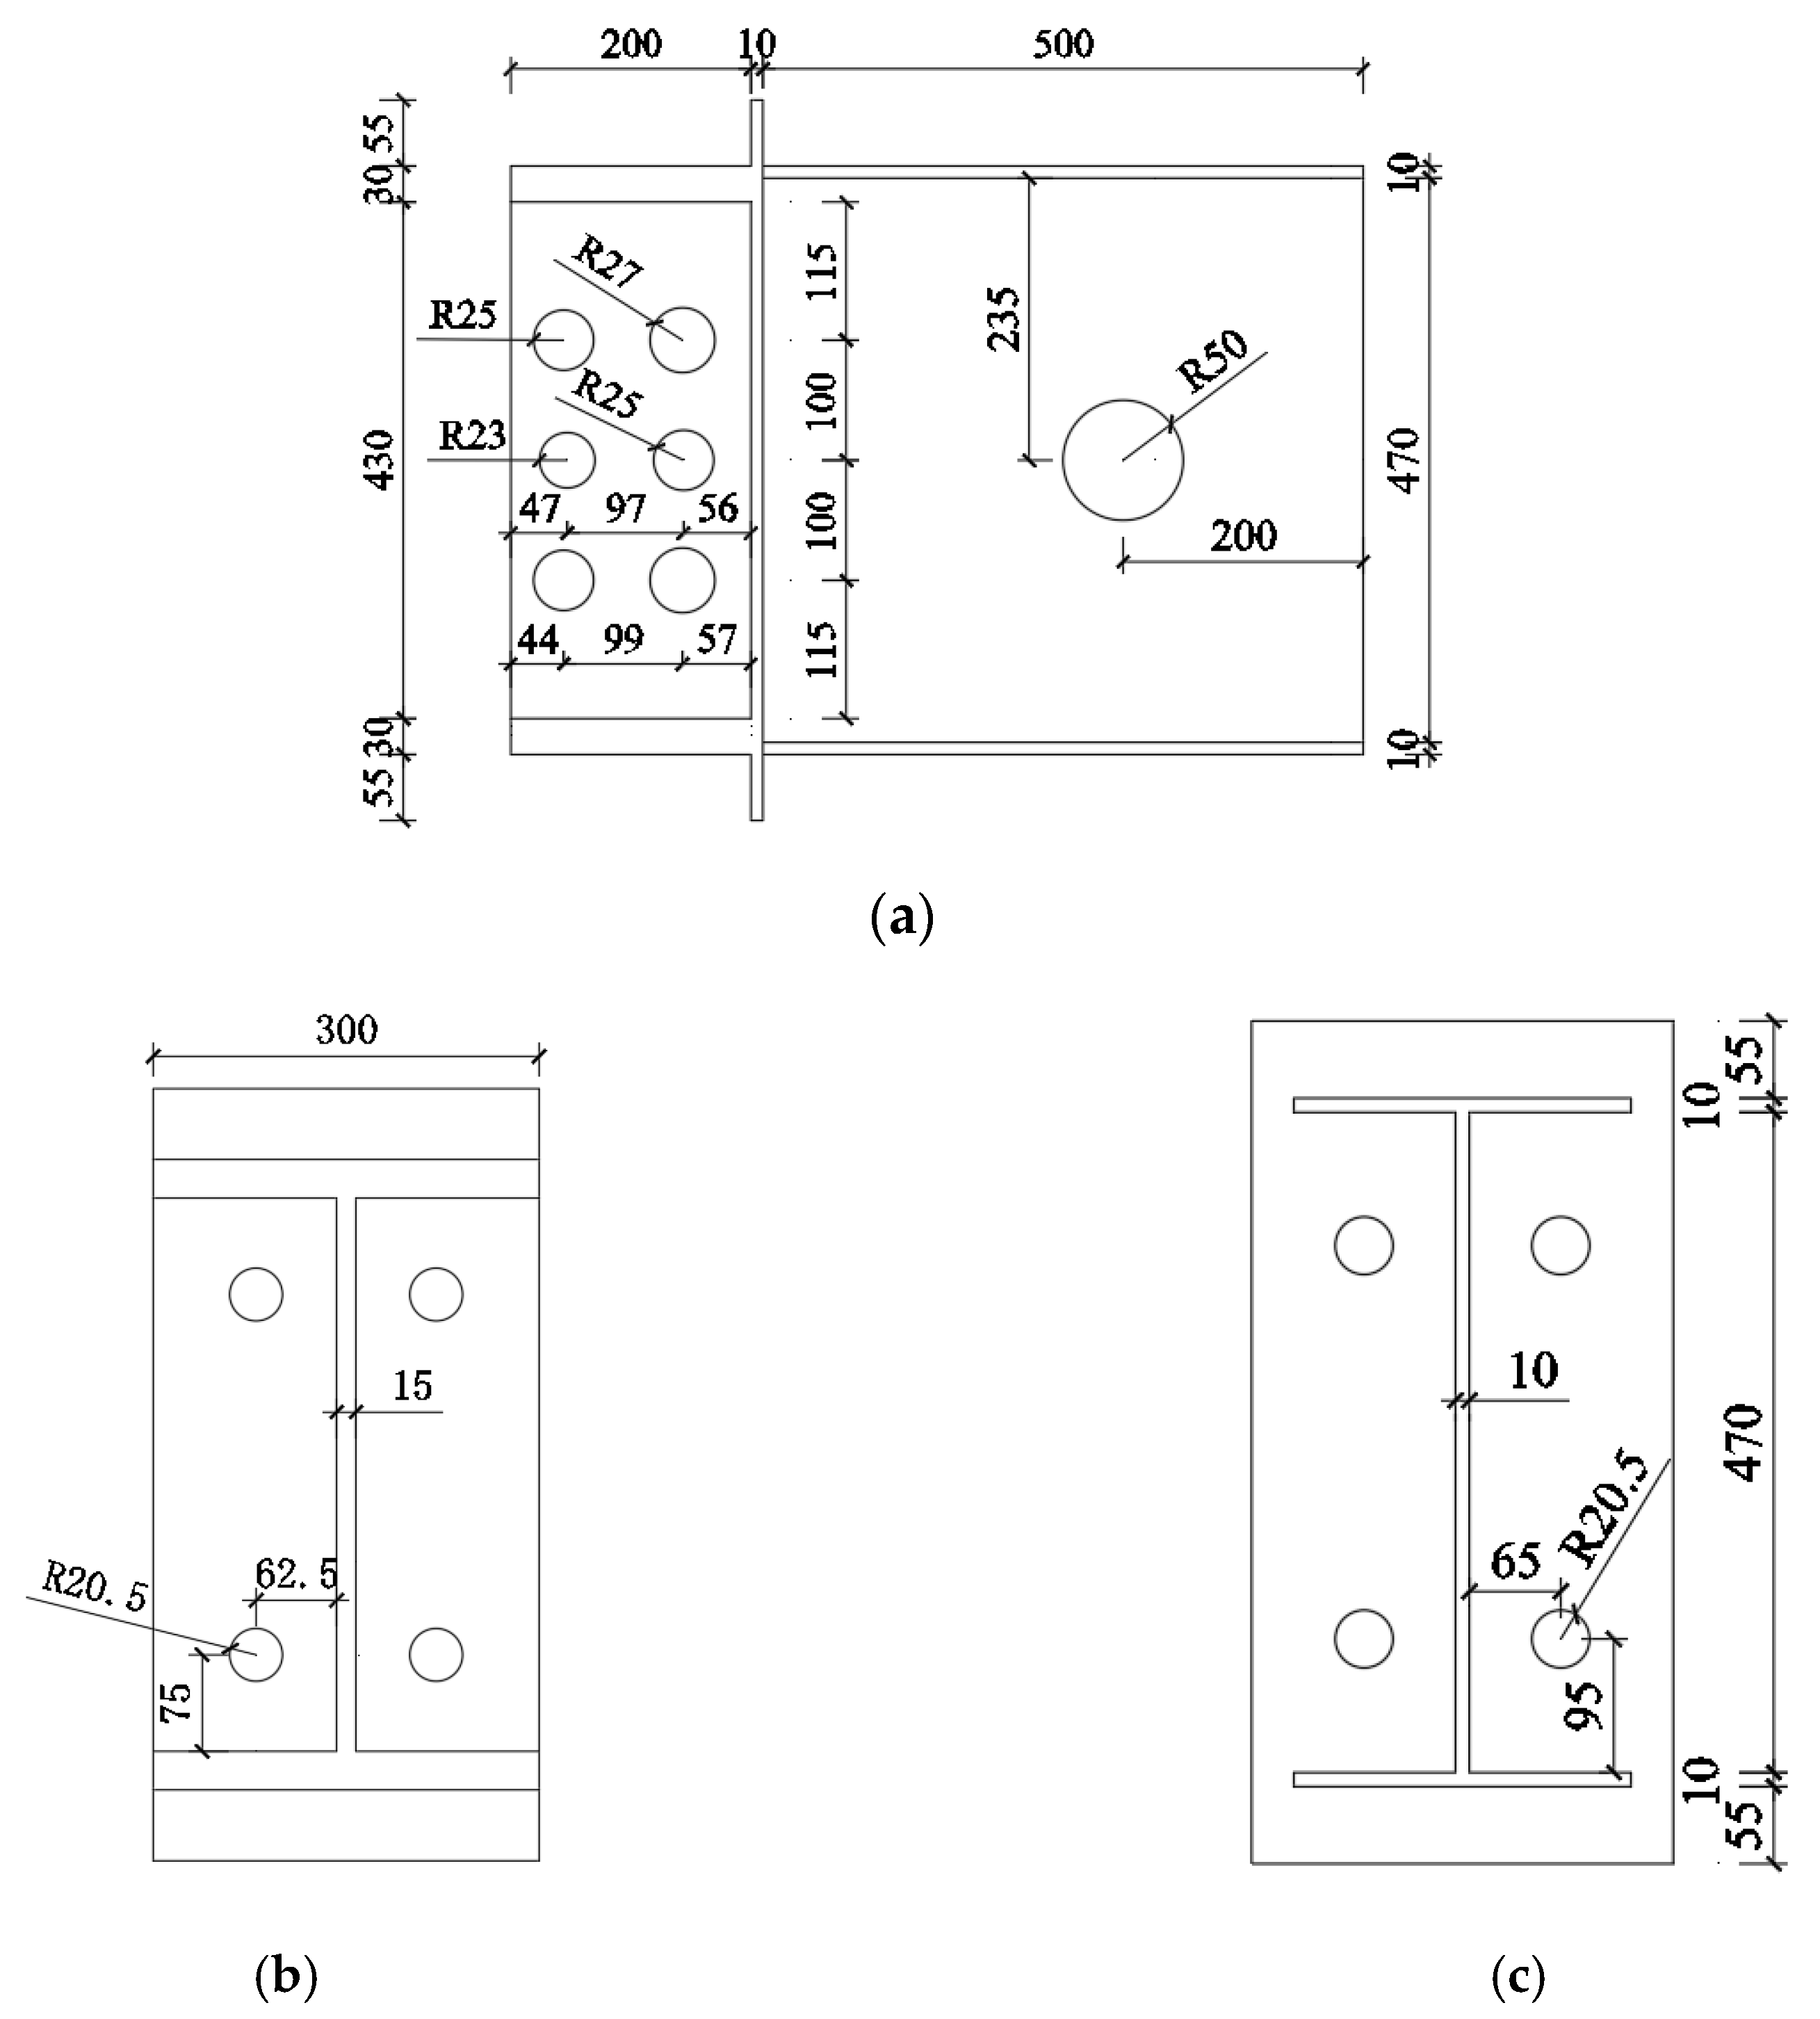
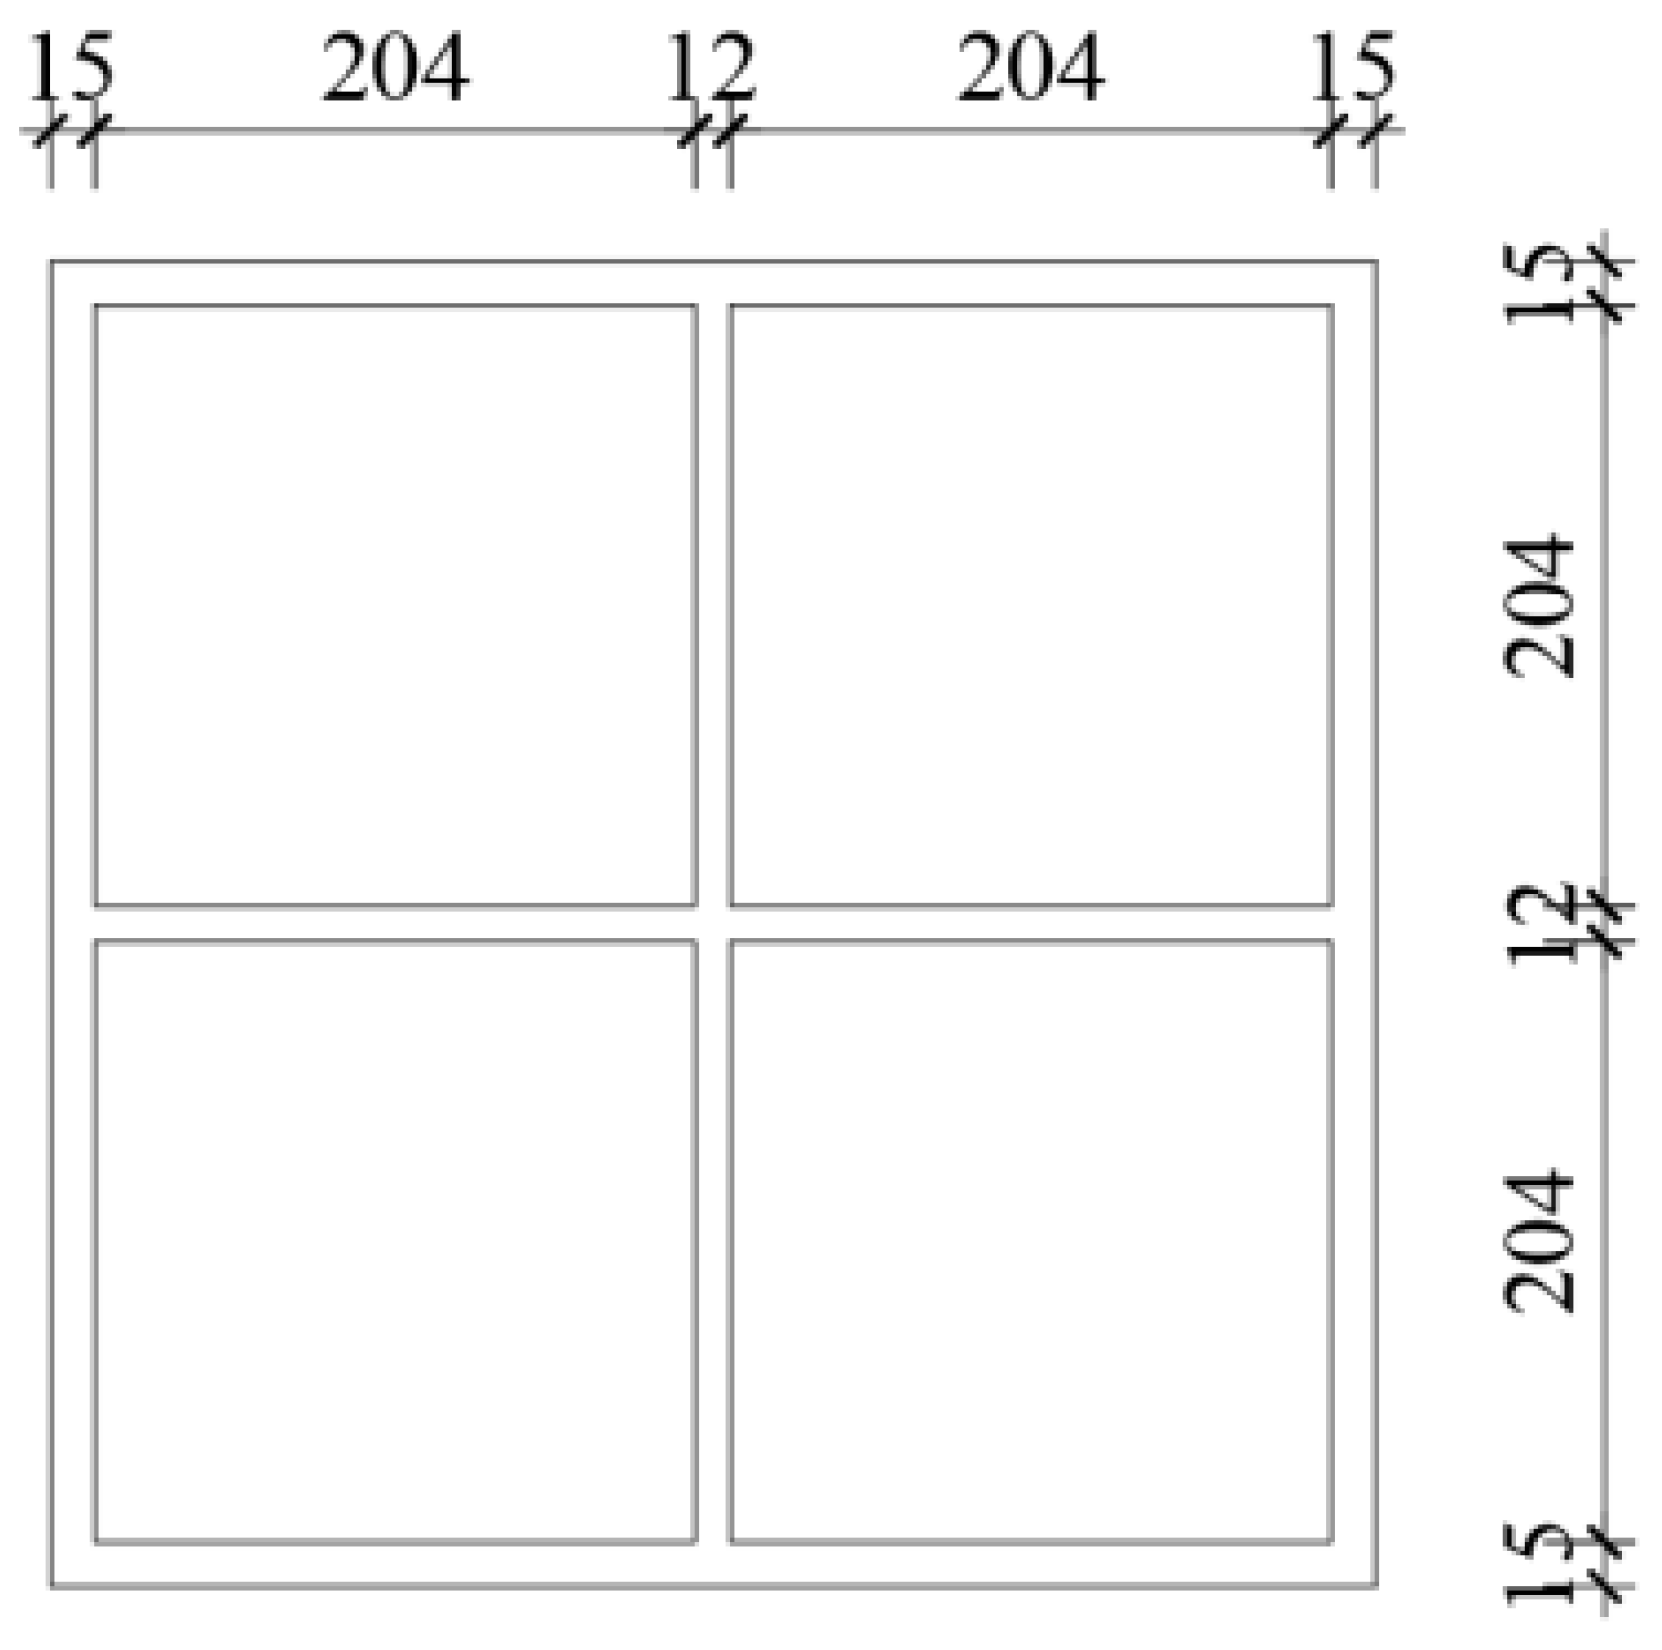
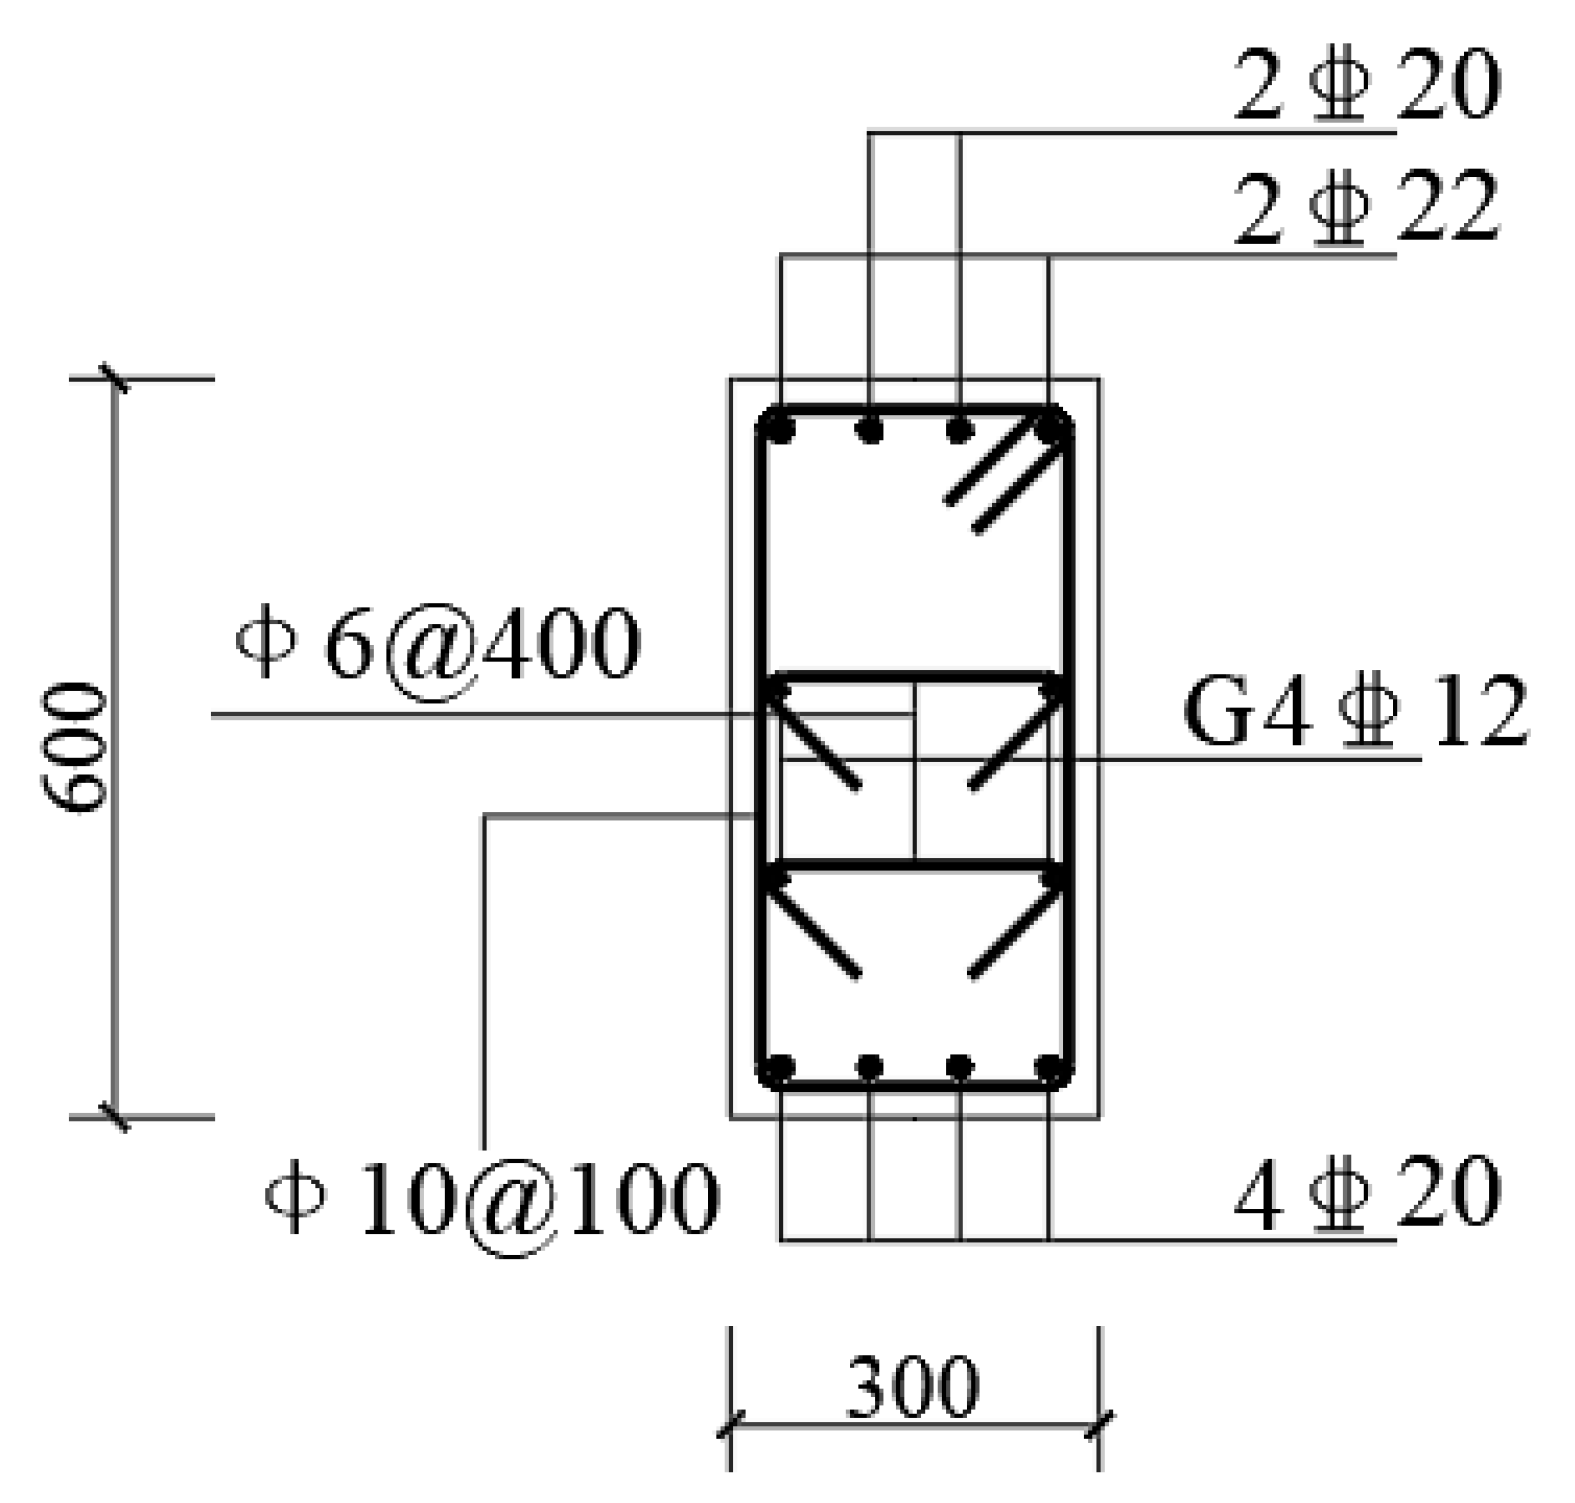
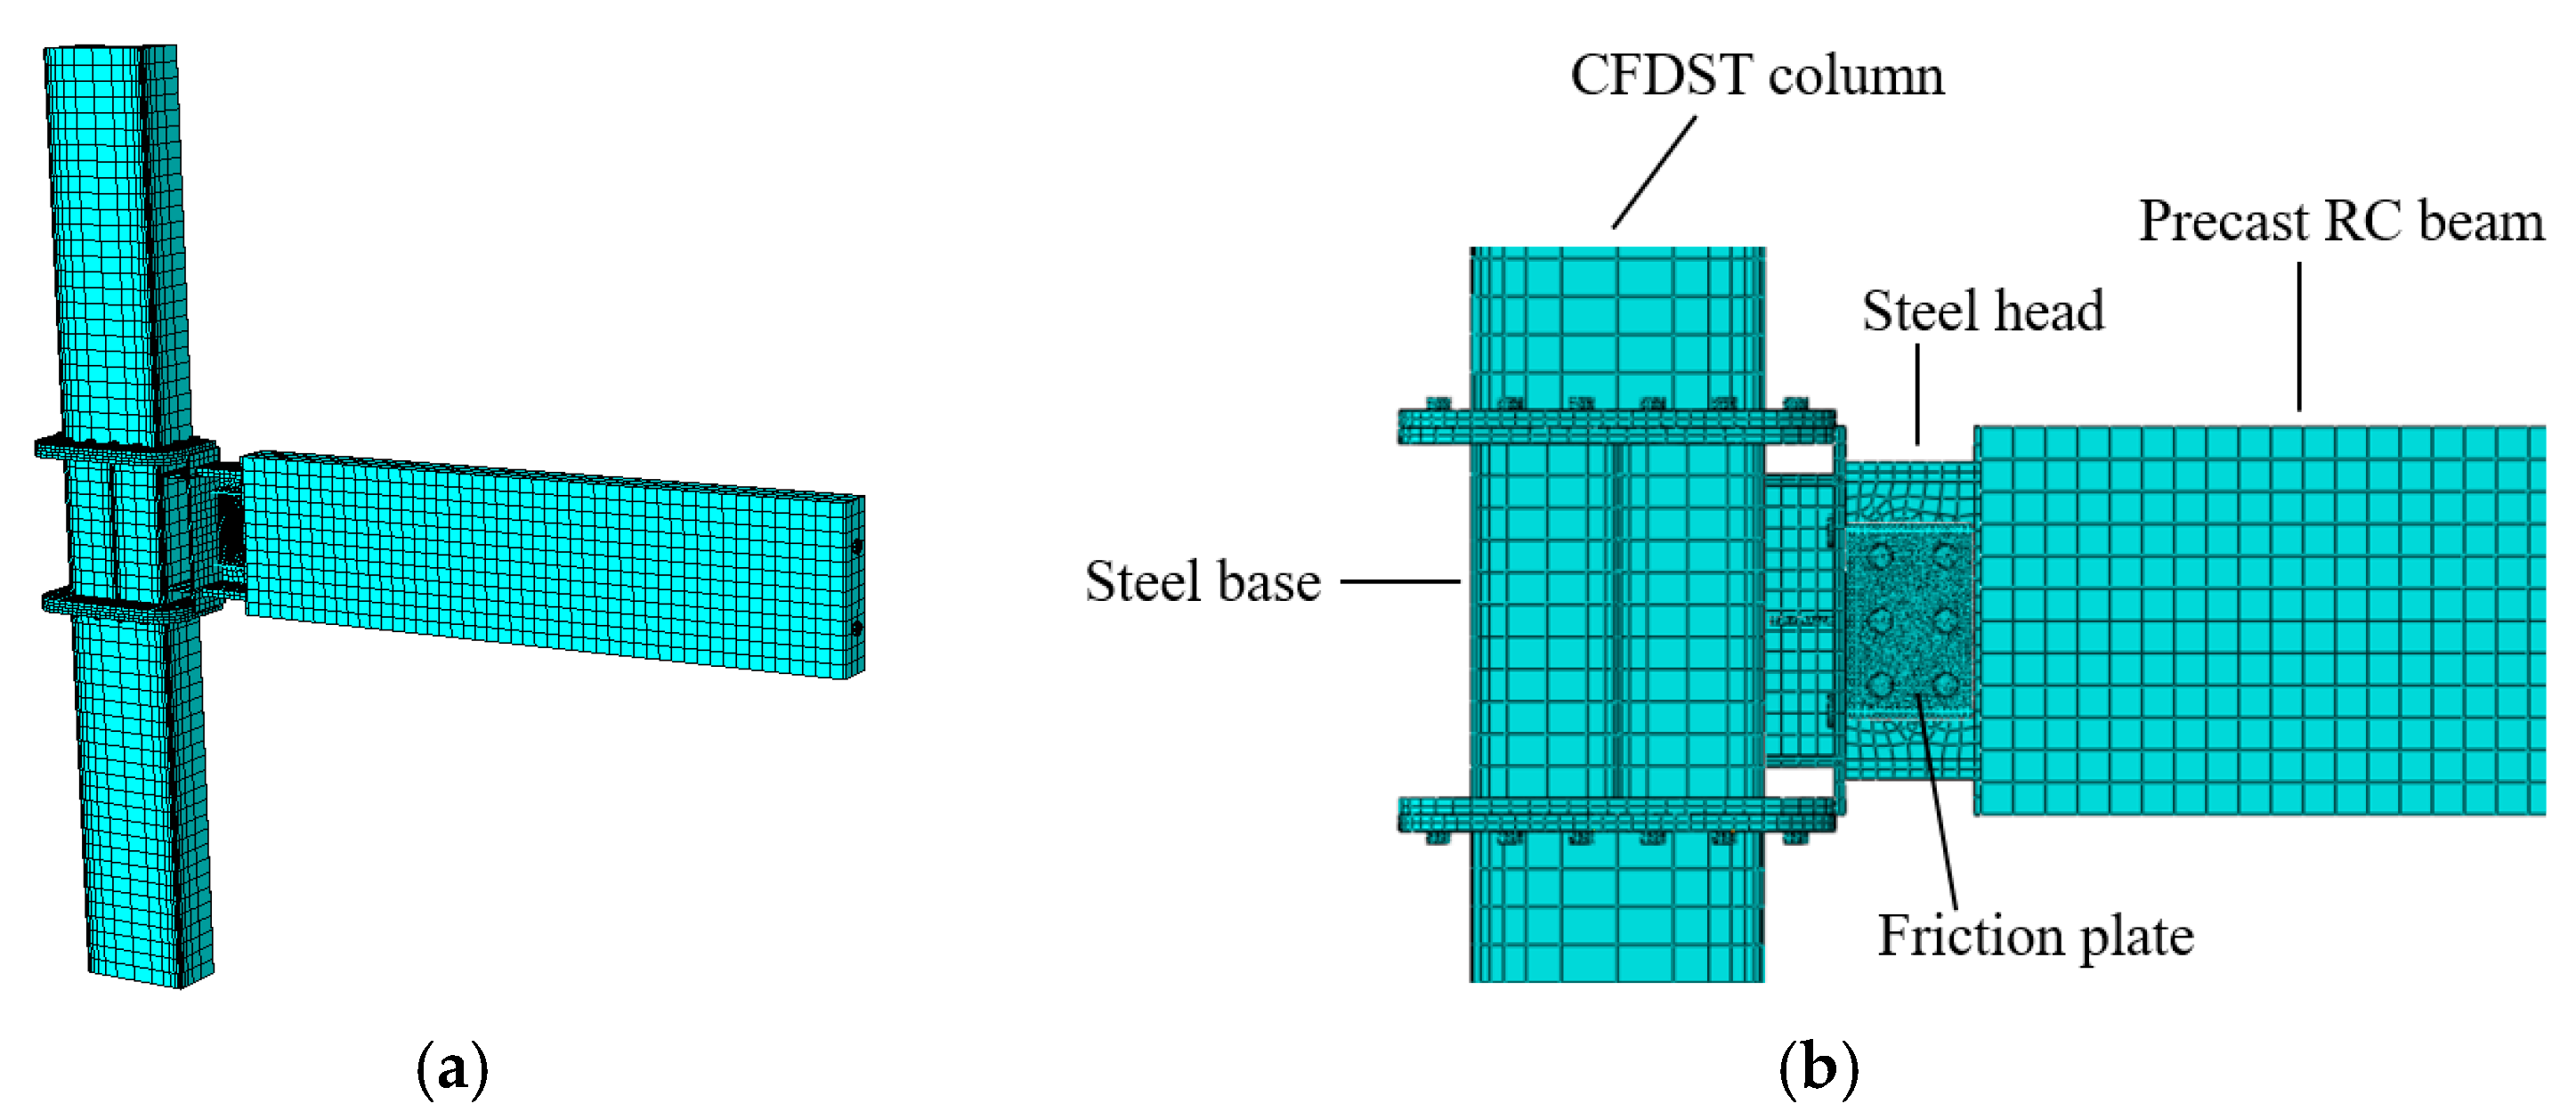
3.1. Modeling Parameters
3.2. Material Properties and Meshing
3.3. Interaction and Loading Protocol
4. Numerical Model Verification
4.1. Load–Displacement Curves
- (1)
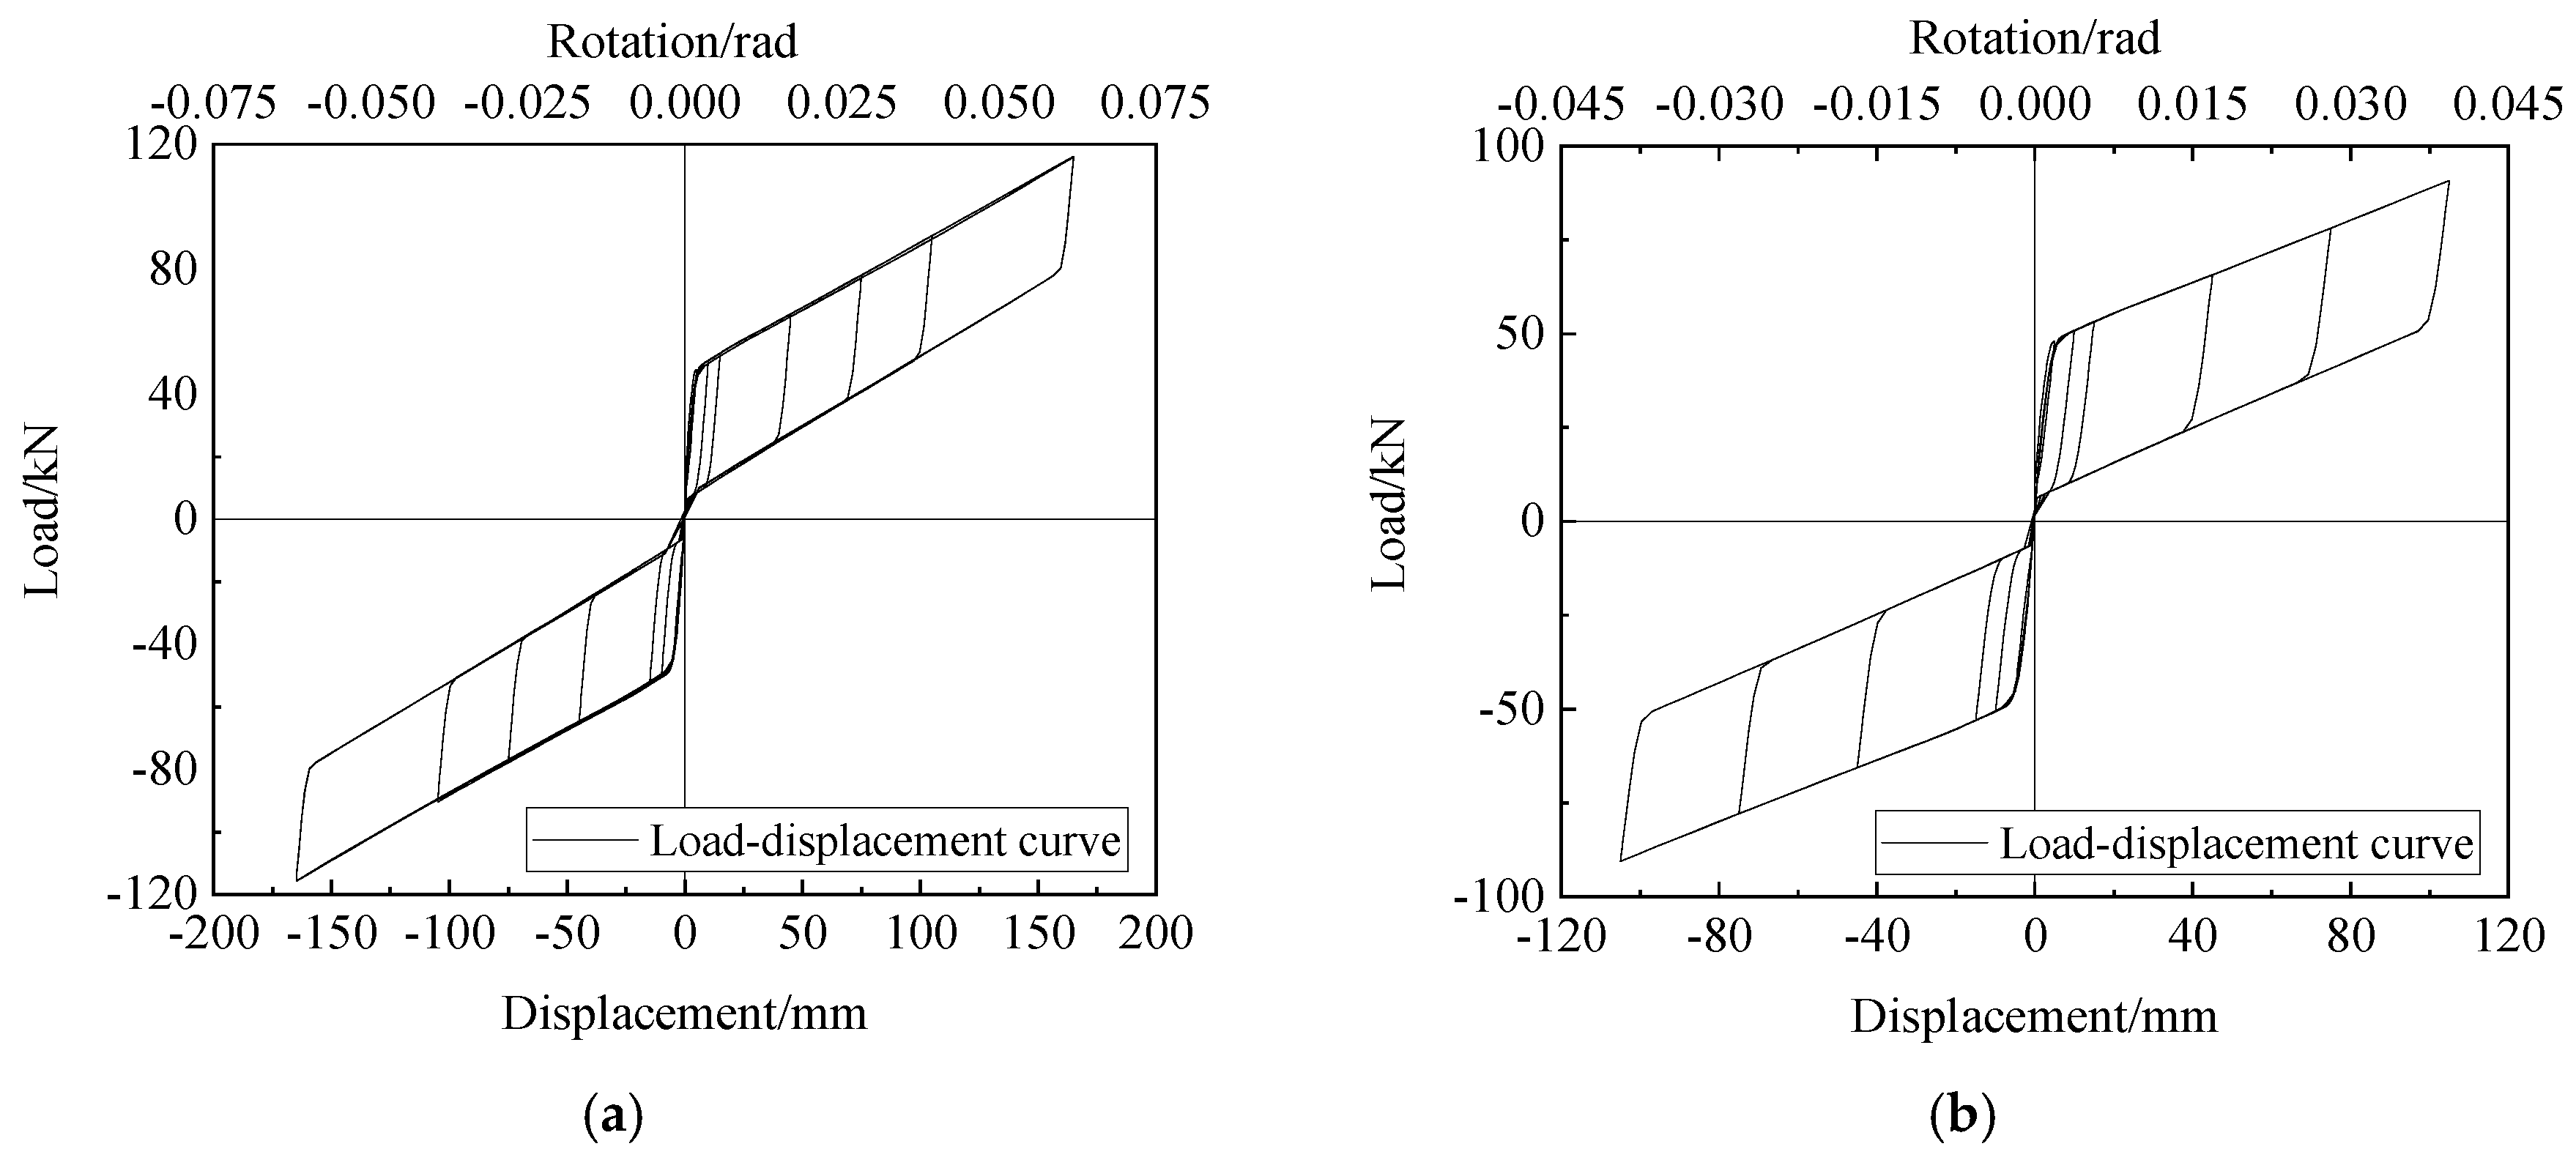
- The self-centering joint between the CFDST column and the RC beam had a considerable self-centering performance. Considering that the self-centering factor was η = 1 − │δ/Δmax│, where δ was the residual deformation and Δmax was the loading amplitude, the calculation showed that the self-centering factor of the joint was η = 1 − │(−0.31/−105)│ = 99.7%, and the ratio of the residual deformation was only 0.3%. It showed that the proportion of the tensile moment and the friction moment in the opening moment was reasonable.
- (2)
- During the cyclic loading, there was no obvious cumulative plastic deformation or obvious changes in the loading and unloading stiffness, indicating that the design of joint with energy dissipation by friction had been well realized, and the energy dissipation in the form of damage to the components had been reduced.
- (3)
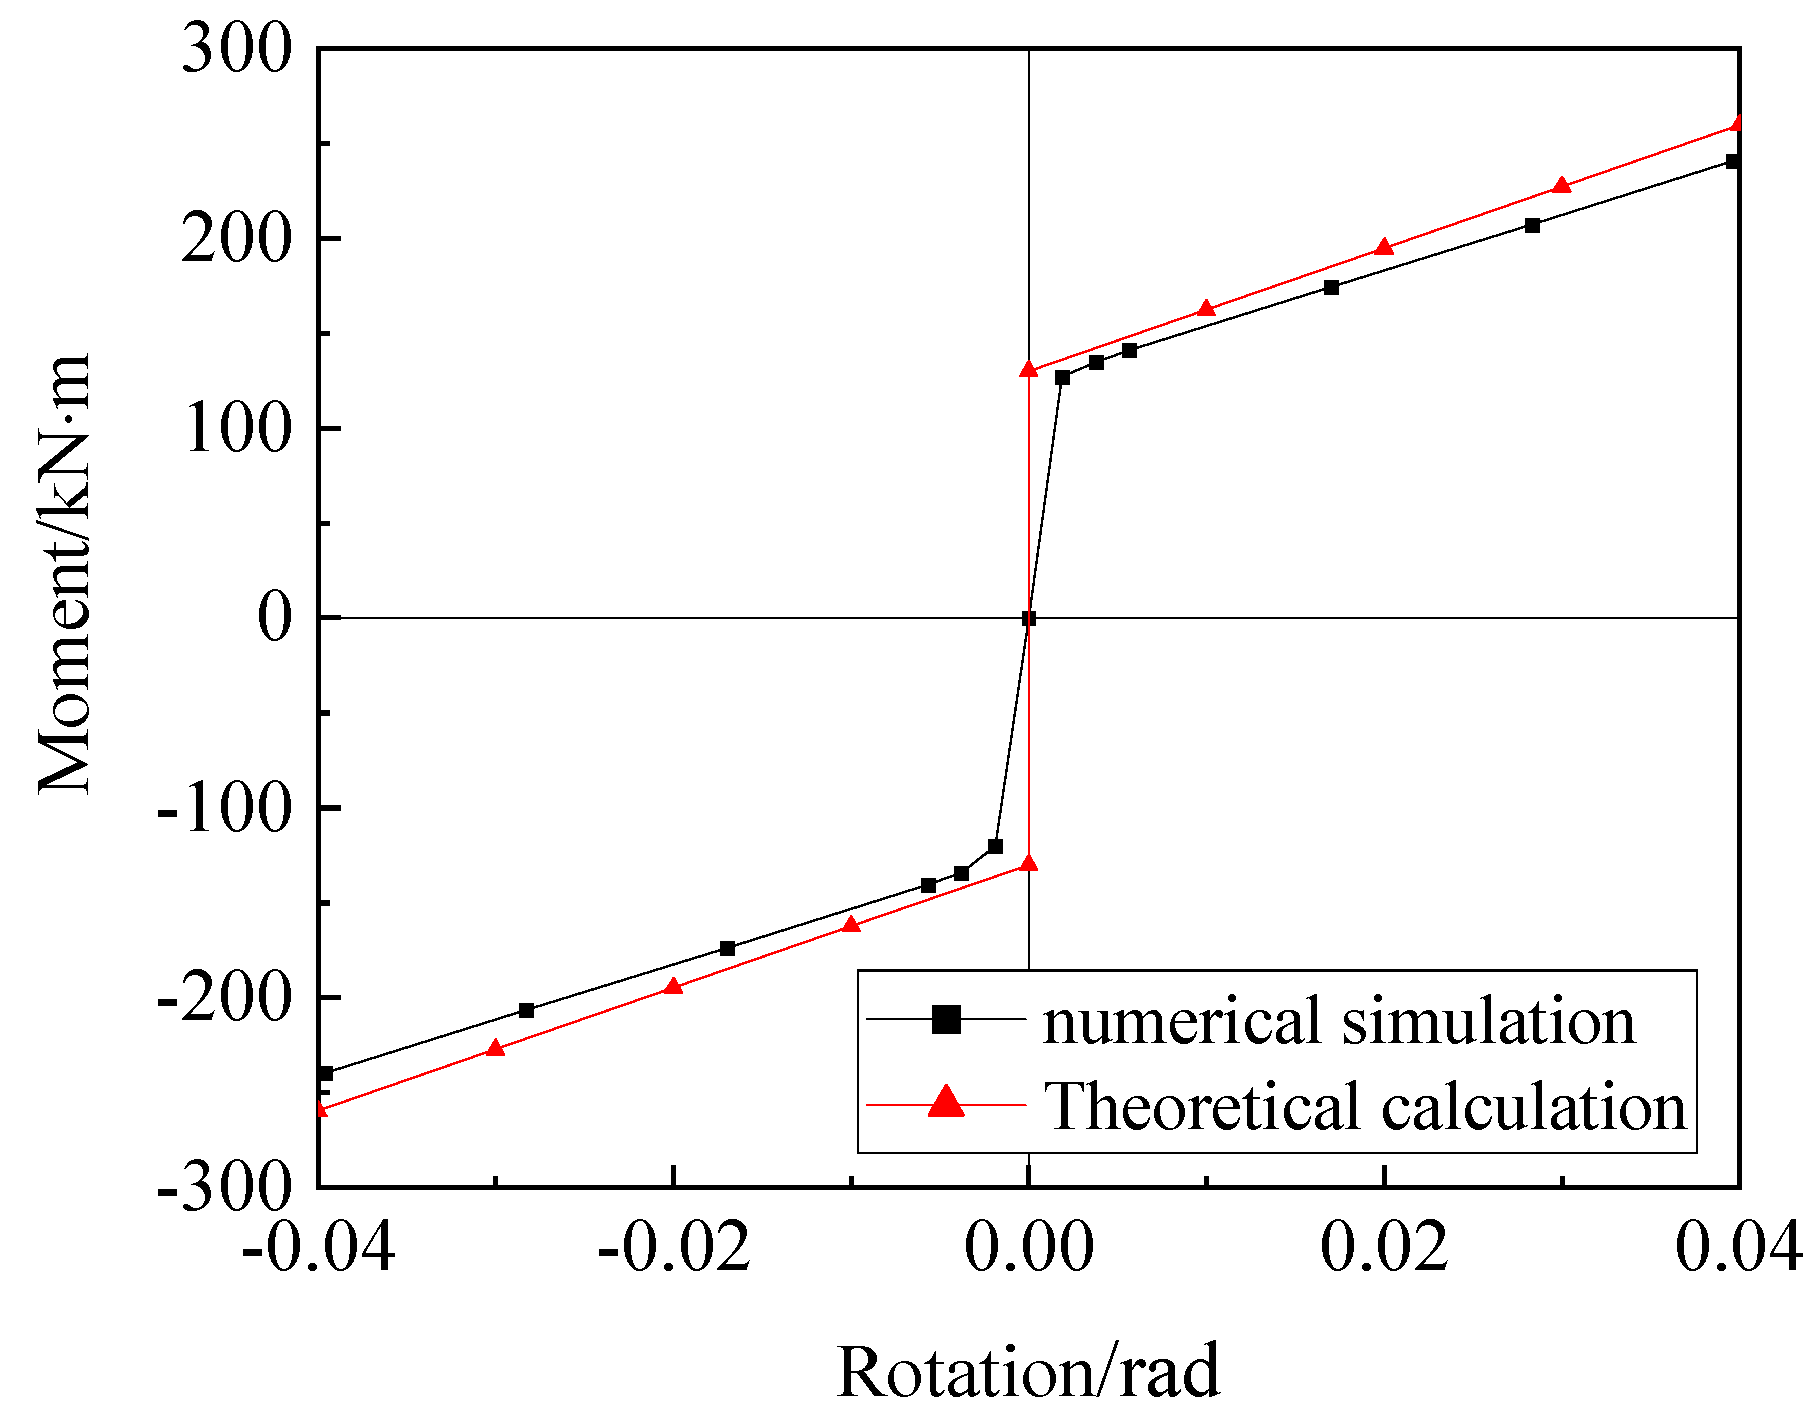
- When the maximum rotation angle of the joint reached 0.04 rad, the resisting bending moment provided by the joint was 240.5 kN∙m, which was not completely consistent with 259.7 kN∙m obtained in the previous joint design. The reasons are as follows: Firstly, the main equations for the joint design are shown in Equations (7)–(9). The value of each parameter obtained during the joint design was an approximation of the exact solution of each parameter. Secondly, the joint model was flexible due to the elastic-plastic materials used in the finite element model, while the assumption of rigidity of each member in the joint was adopted in the joint design.
4.2. Envelope Curves
4.3. Joint Restoring Force Model
5. Parametric Analysis
5.1. The Friction
5.1.1. Parametric Settings
5.1.2. Results and Analysis
- (1)
- Load–Displacement Curves
- (2)
- Envelope Curves
- (3)
- Stress Variation Curves of Steel Strands
- (4)
- Energy Dissipation
5.2. Prestress of Steel Strands
5.2.1. Parametric Settings
5.2.2. Results and Analysis
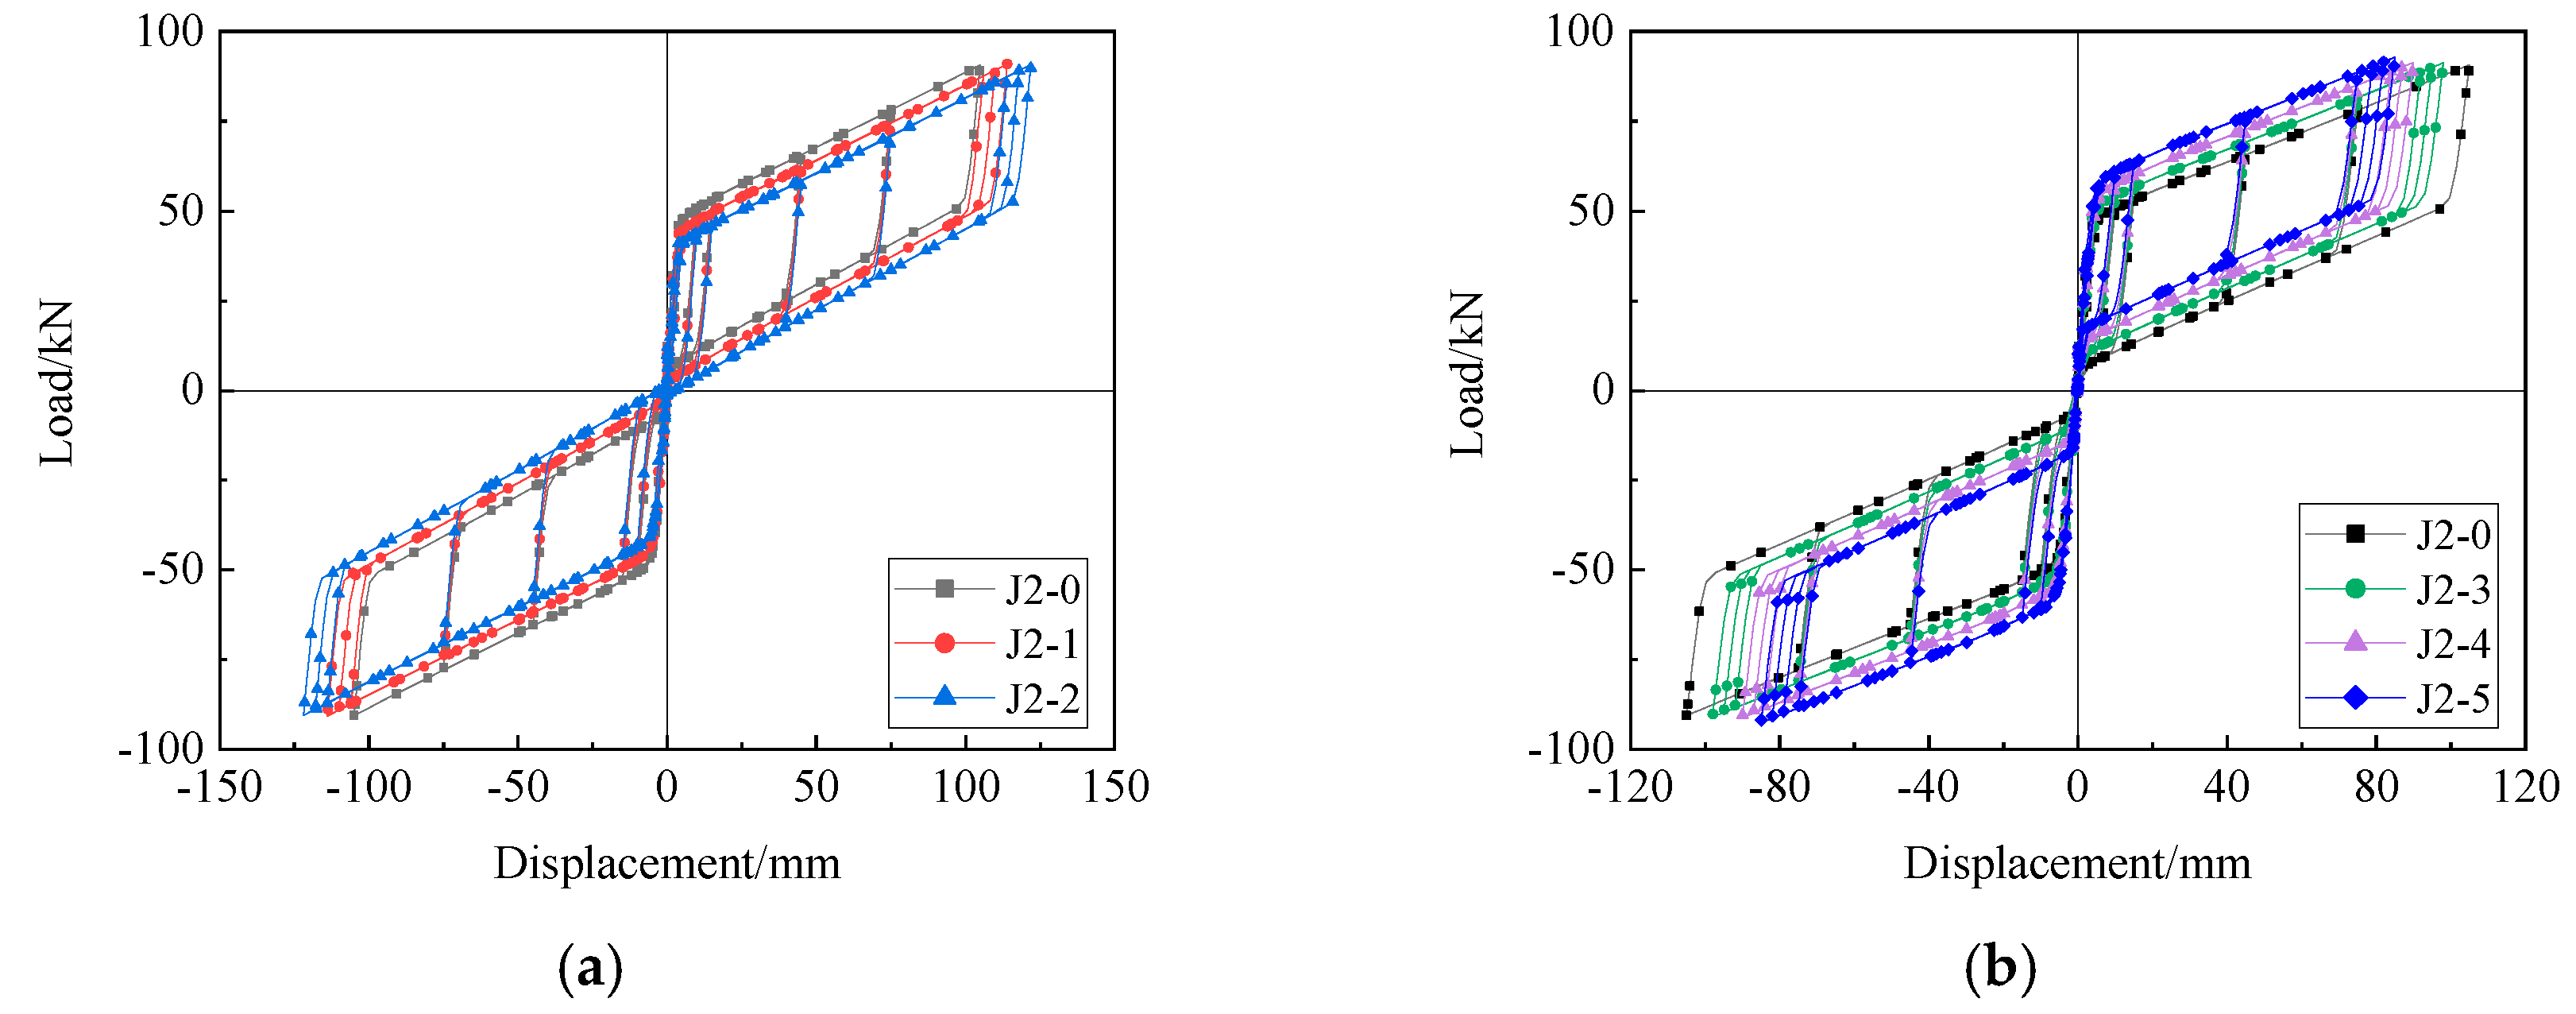
- (1)
- Load–Displacement Curves
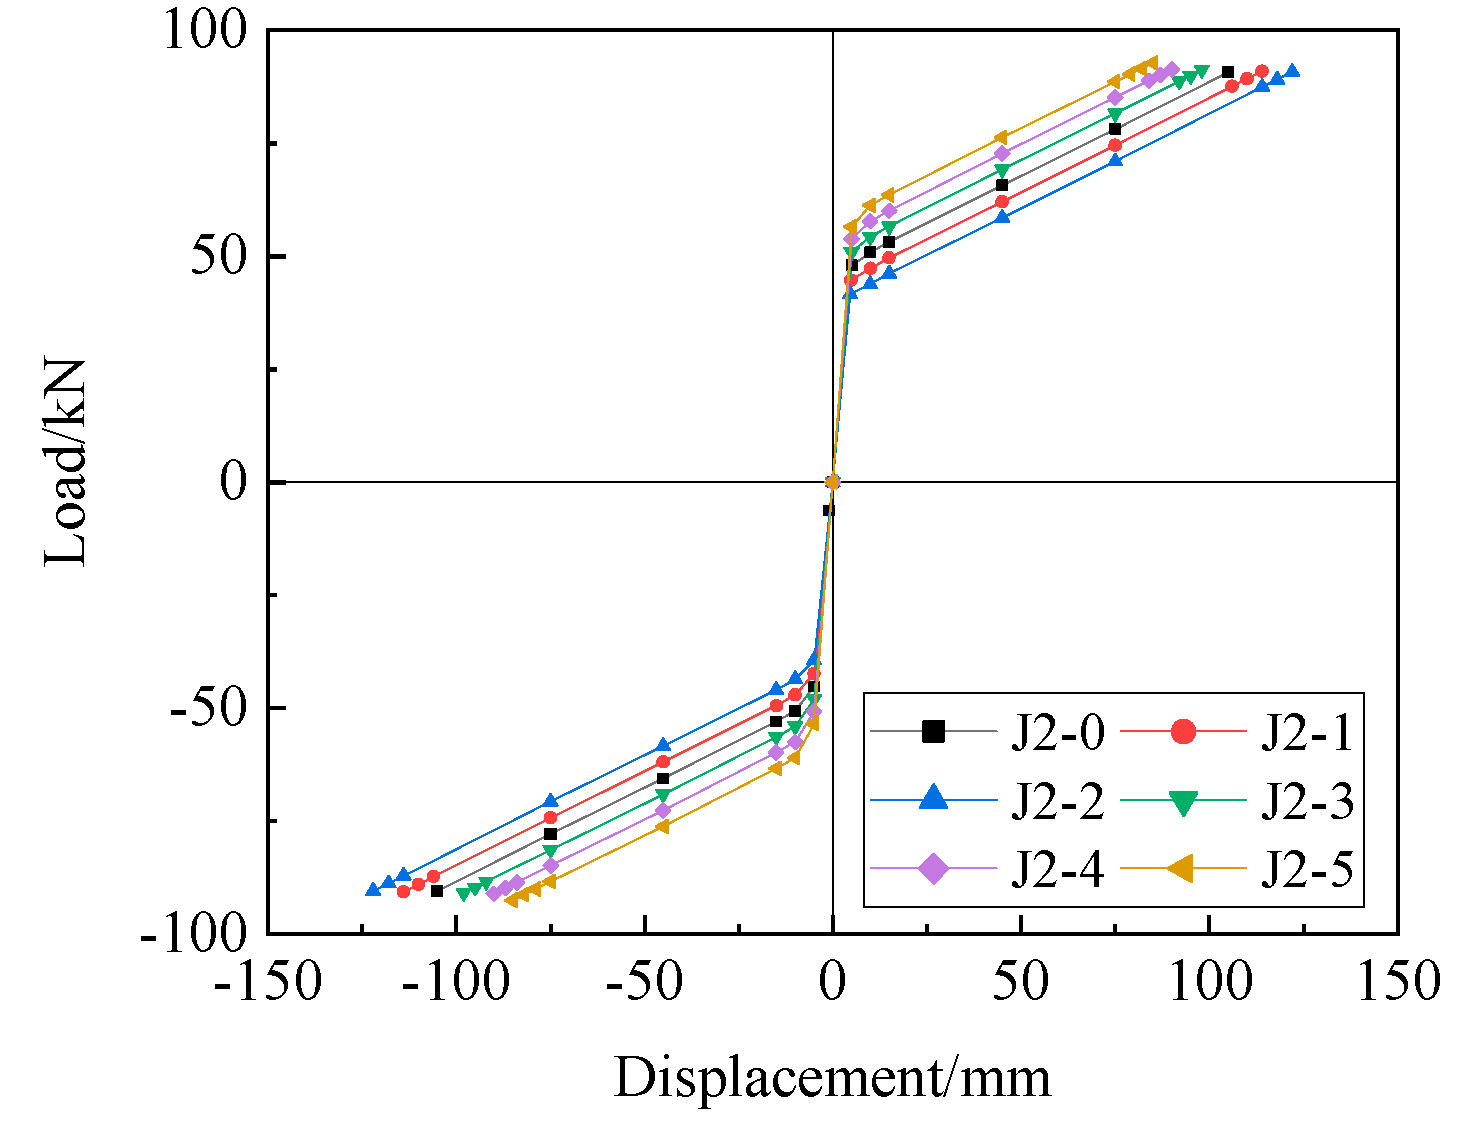
- (2)
- Envelope Curves
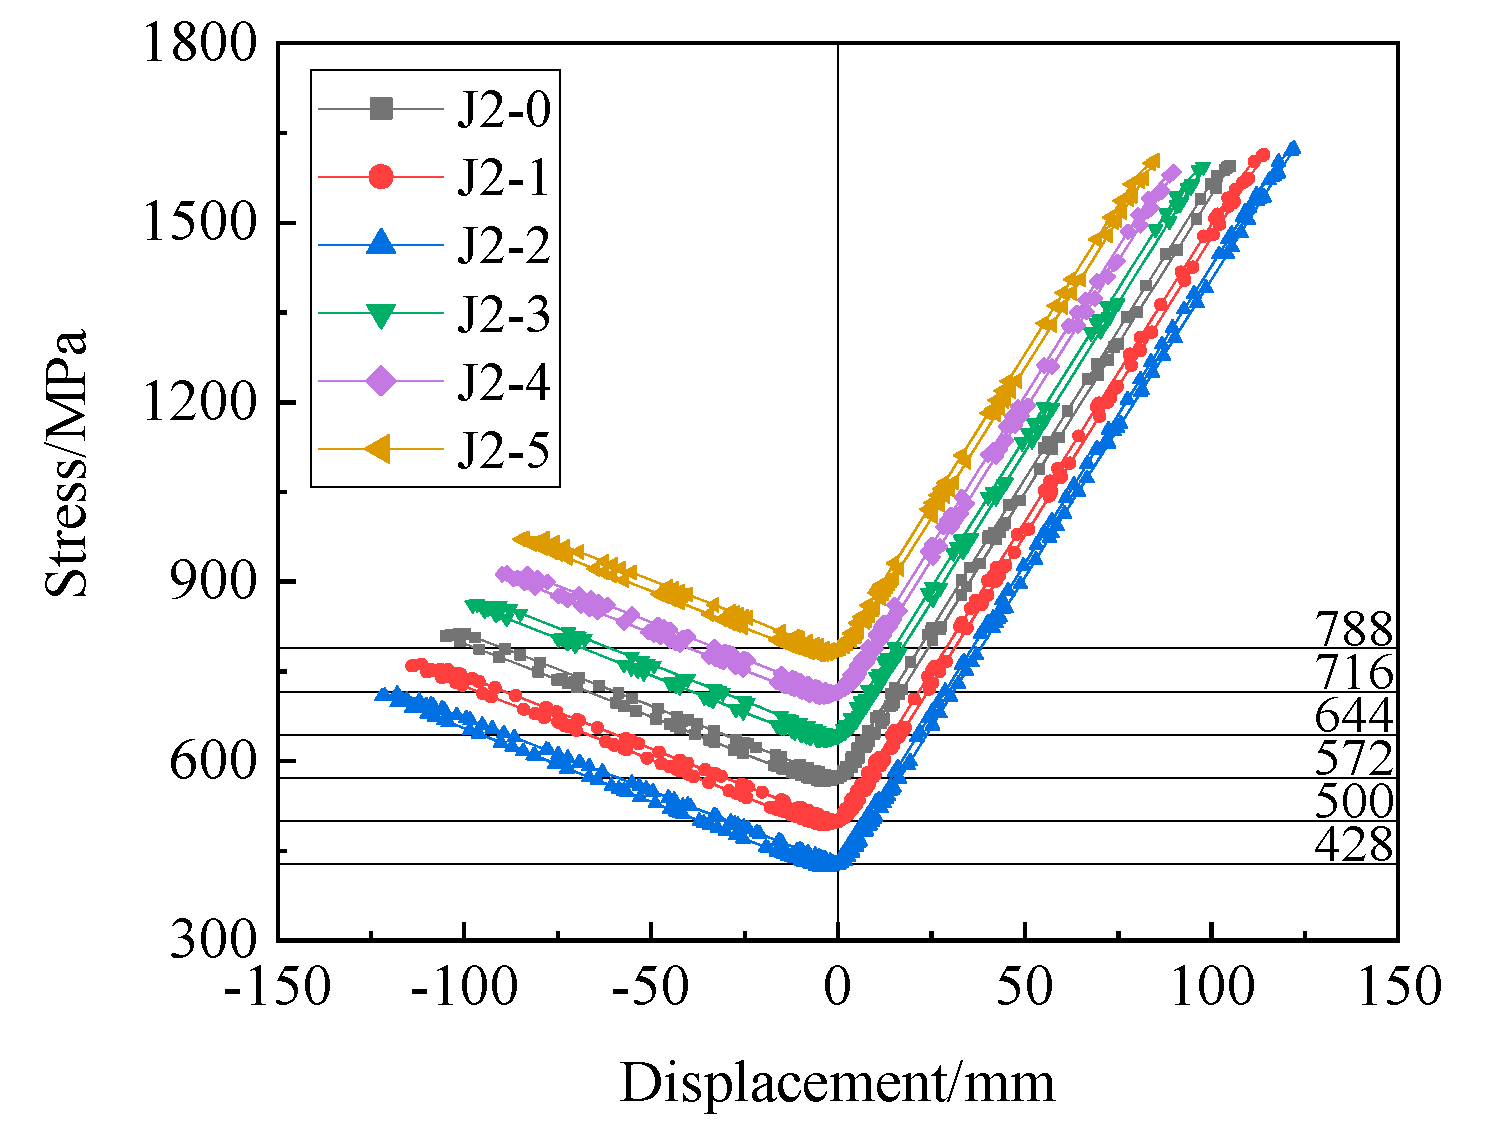
- (3)
- Stress Variation Curves of Steel Strands
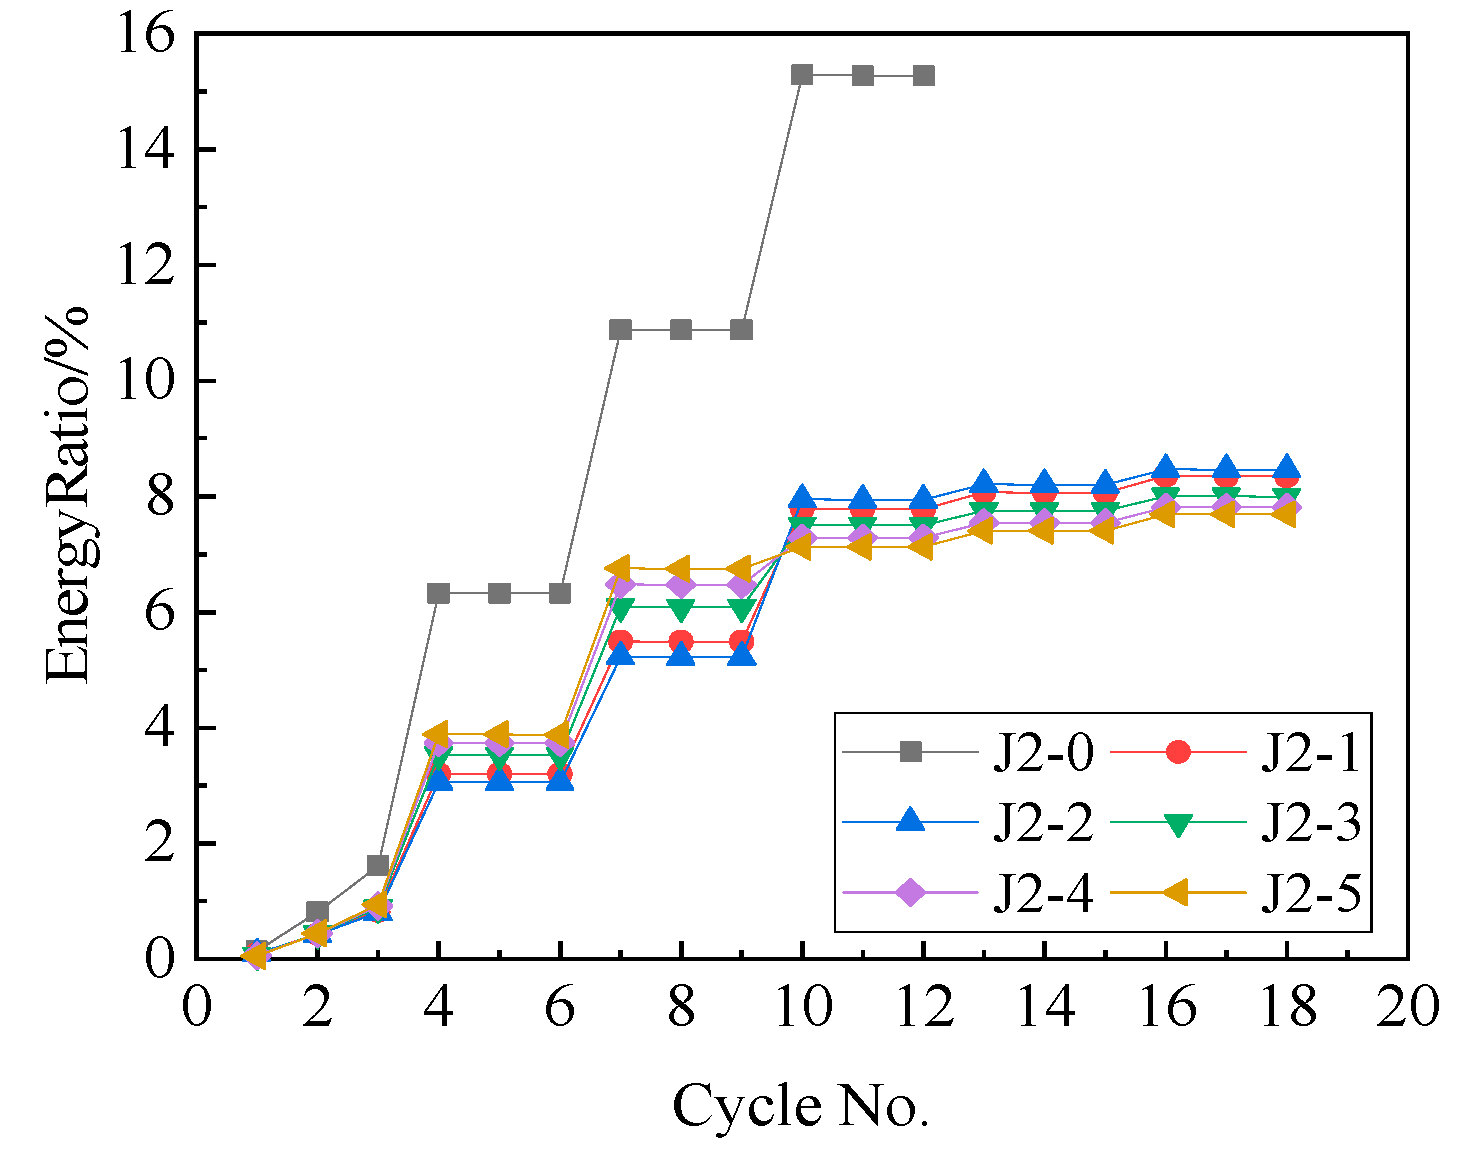
- (4)
- Energy Dissipation
5.3. Ratio of the Tensile Moment to the Friction Moment in the Opening Moment
5.3.1. Parametric Settings
5.3.2. Results and Analysis
- (1)
- Load–Displacement Curves
- (2)
- Envelope Curves
- (3)
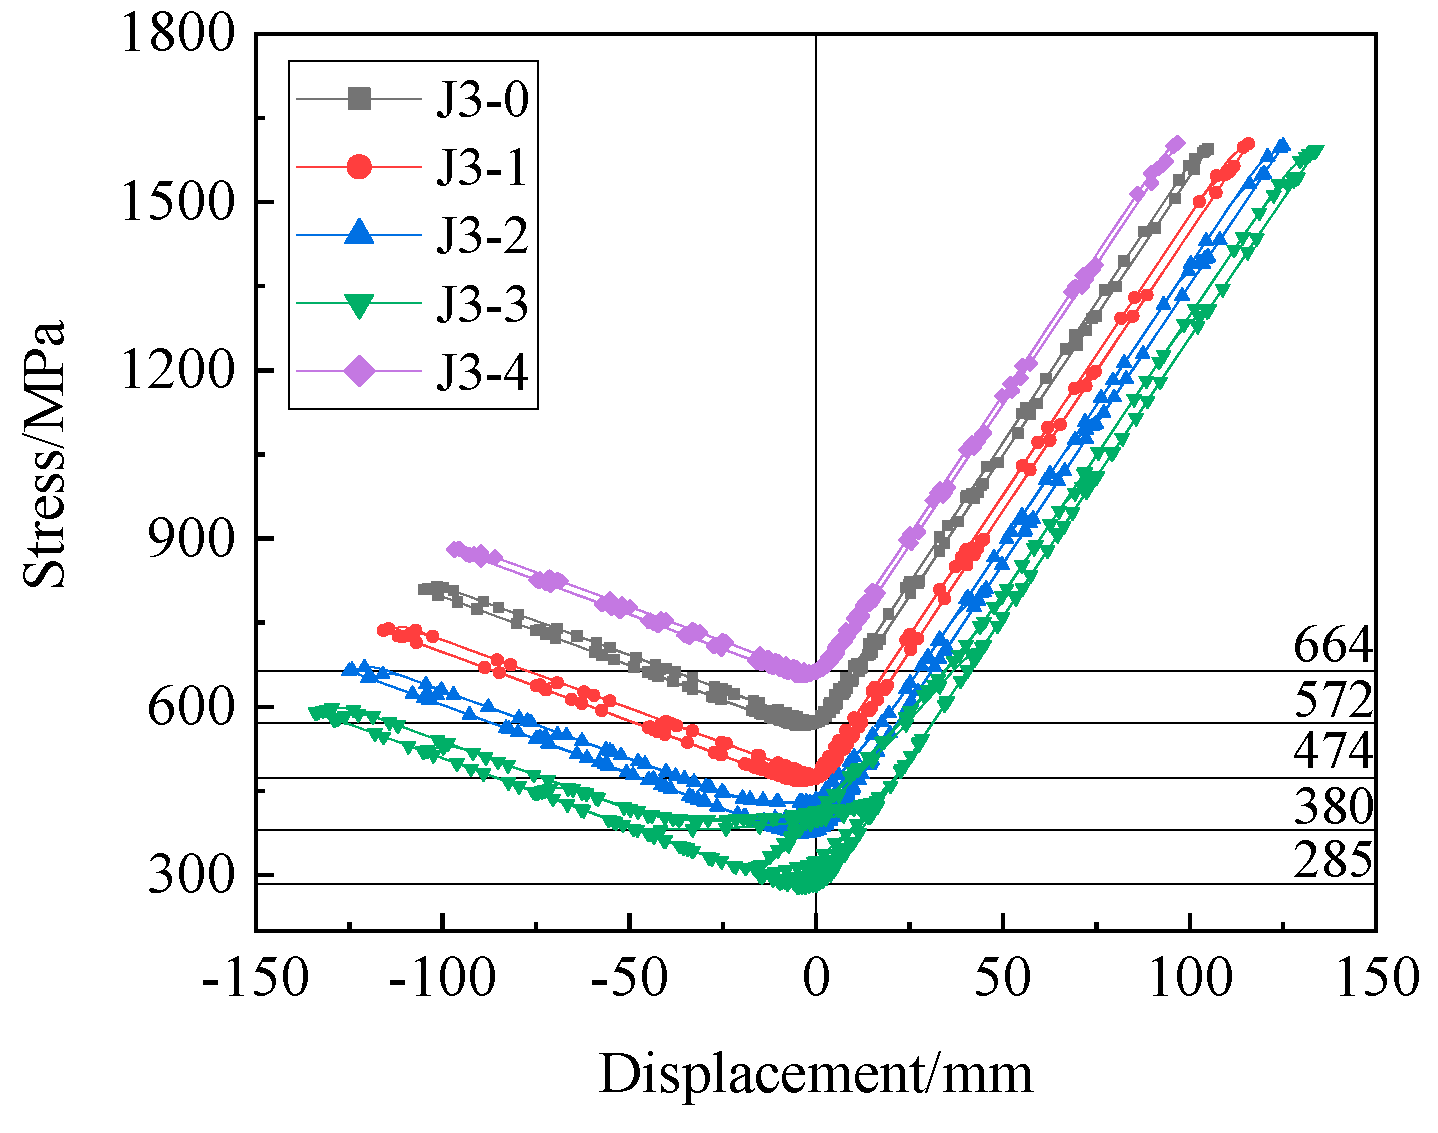
- Stress Variation Curves of Steel Strands
- (4)
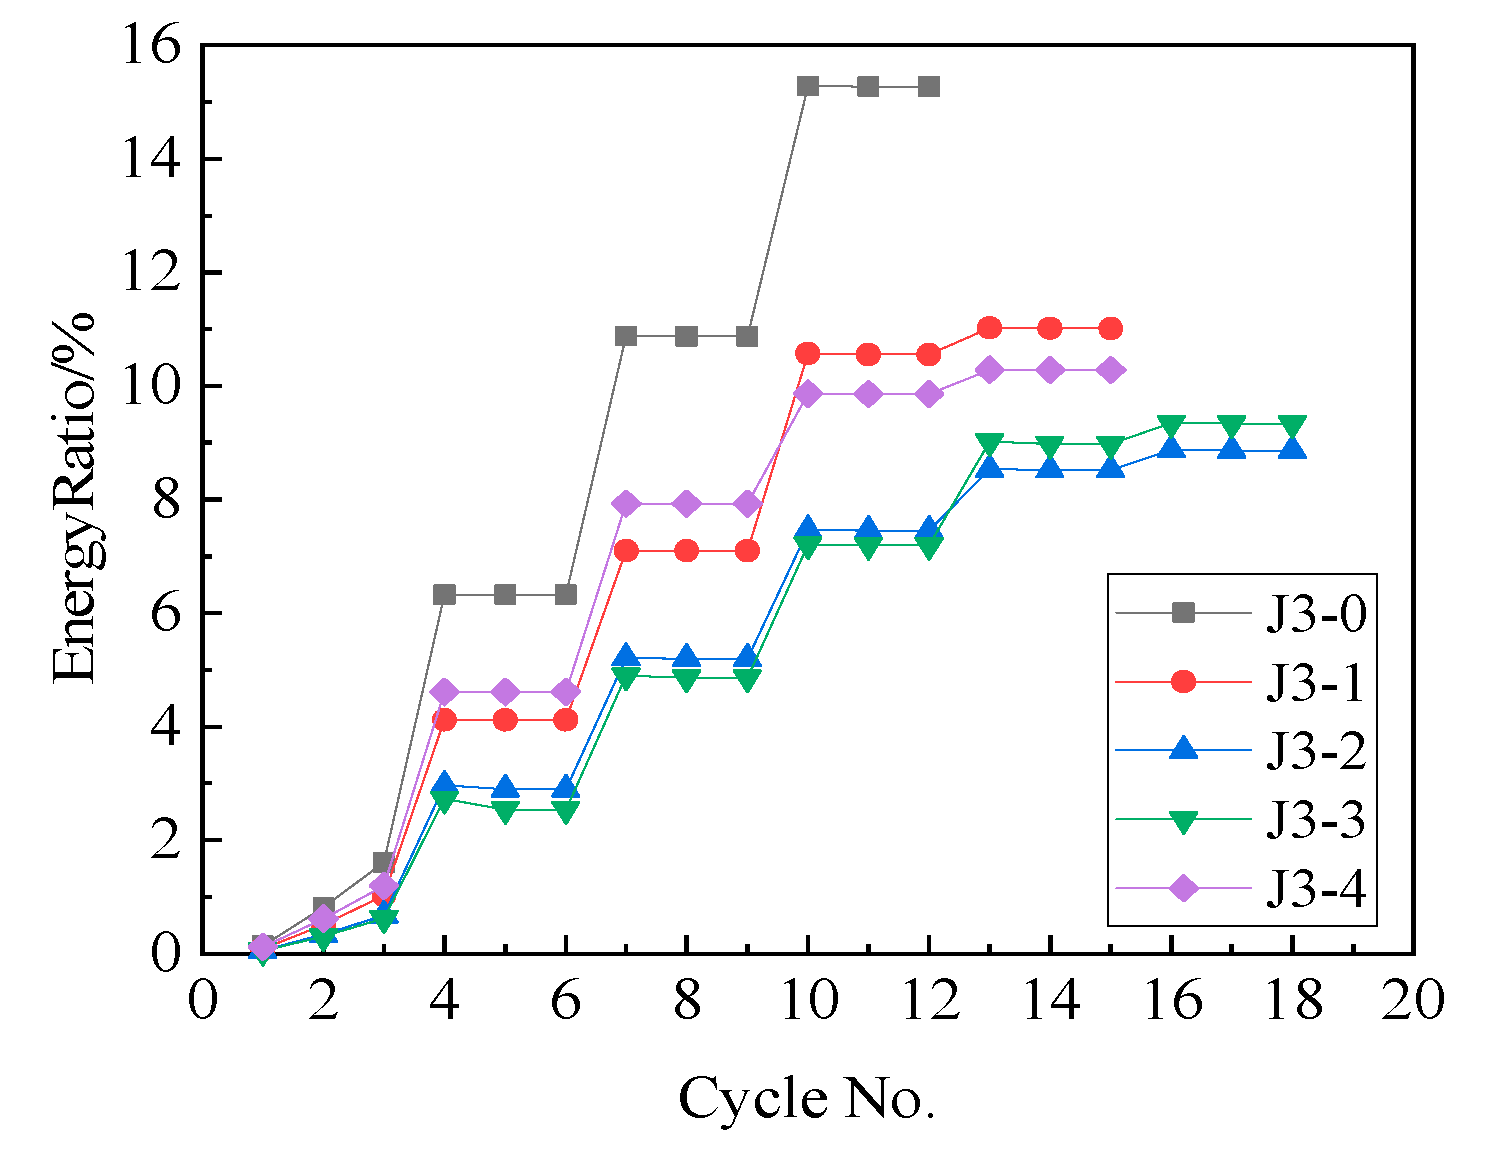
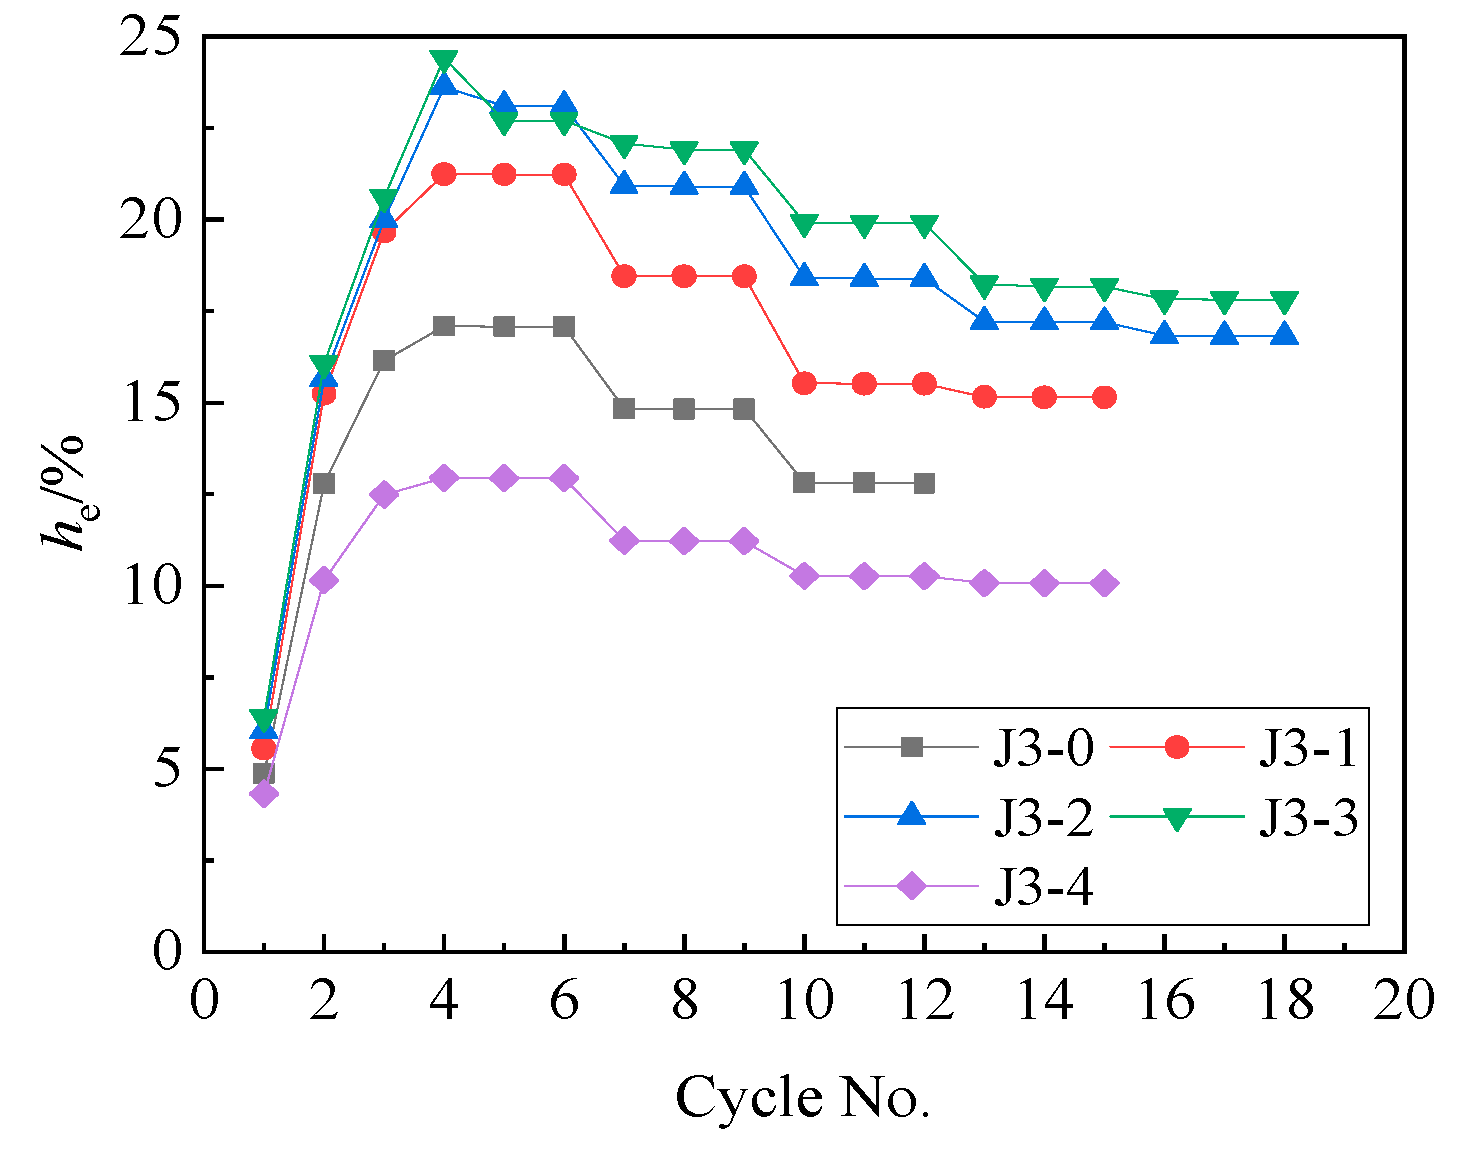
- Energy Dissipation
6. Conclusions
- (1)
- The self-centering joint between the CFDST column and the RC beam proposed in this paper achieves stable energy dissipation and good self-centering performance under cyclic loading.
- (2)
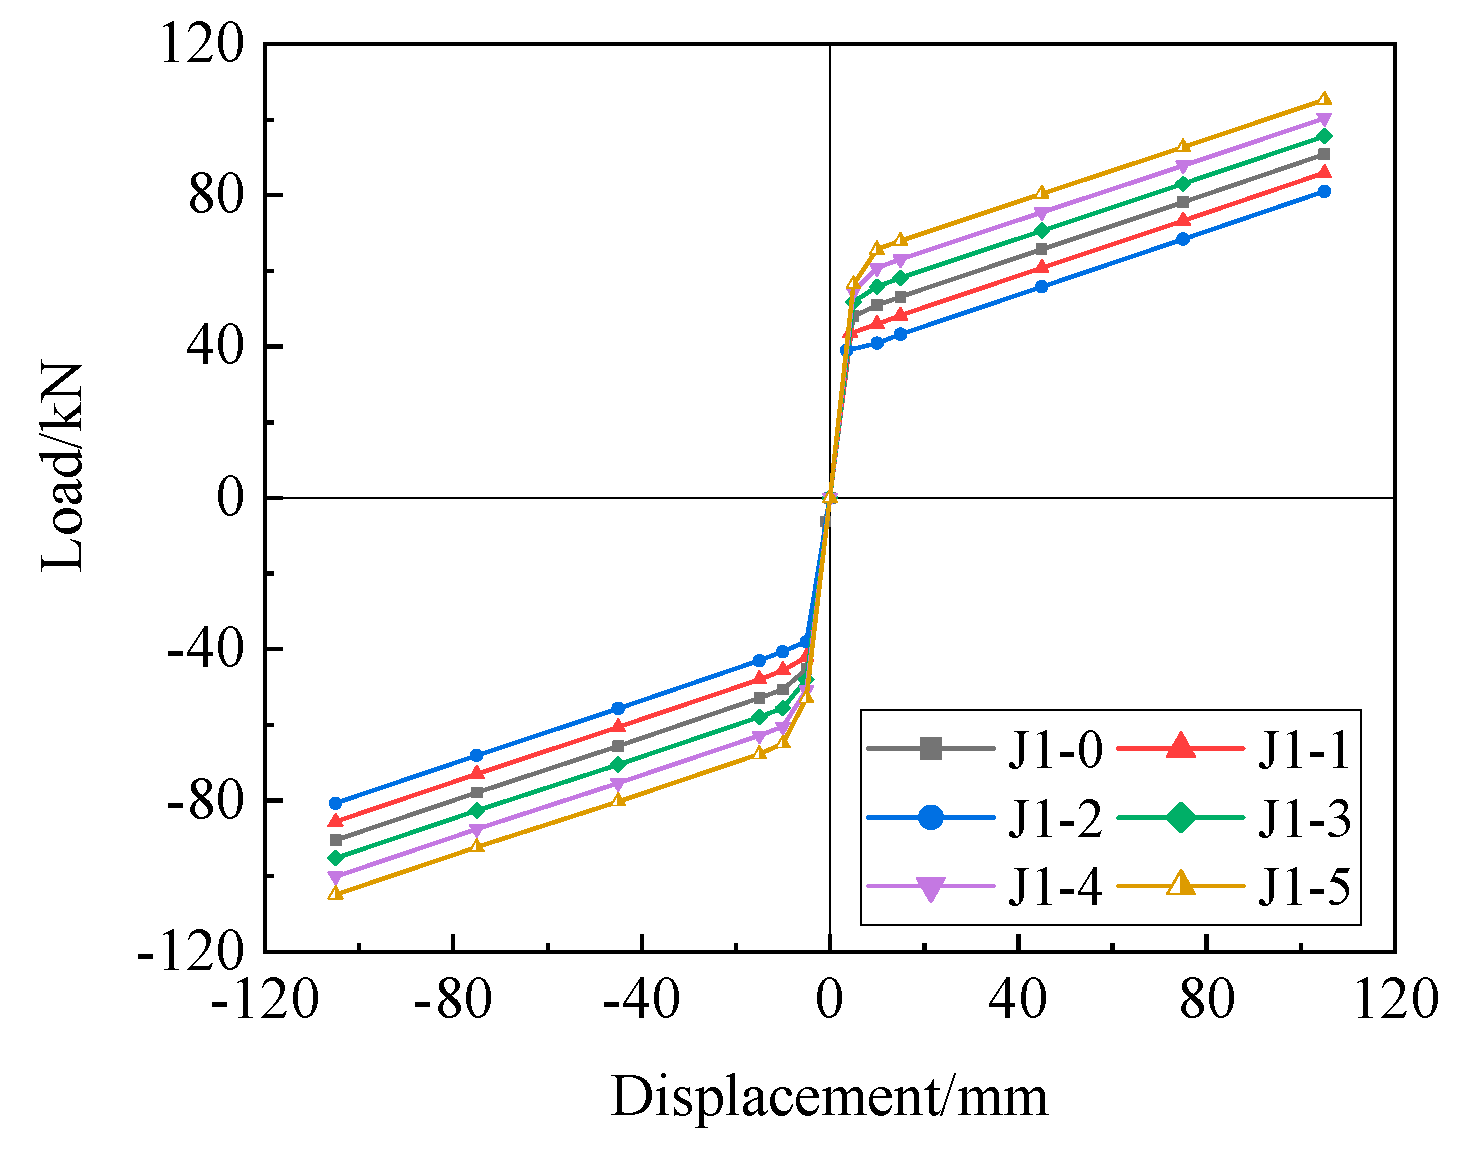
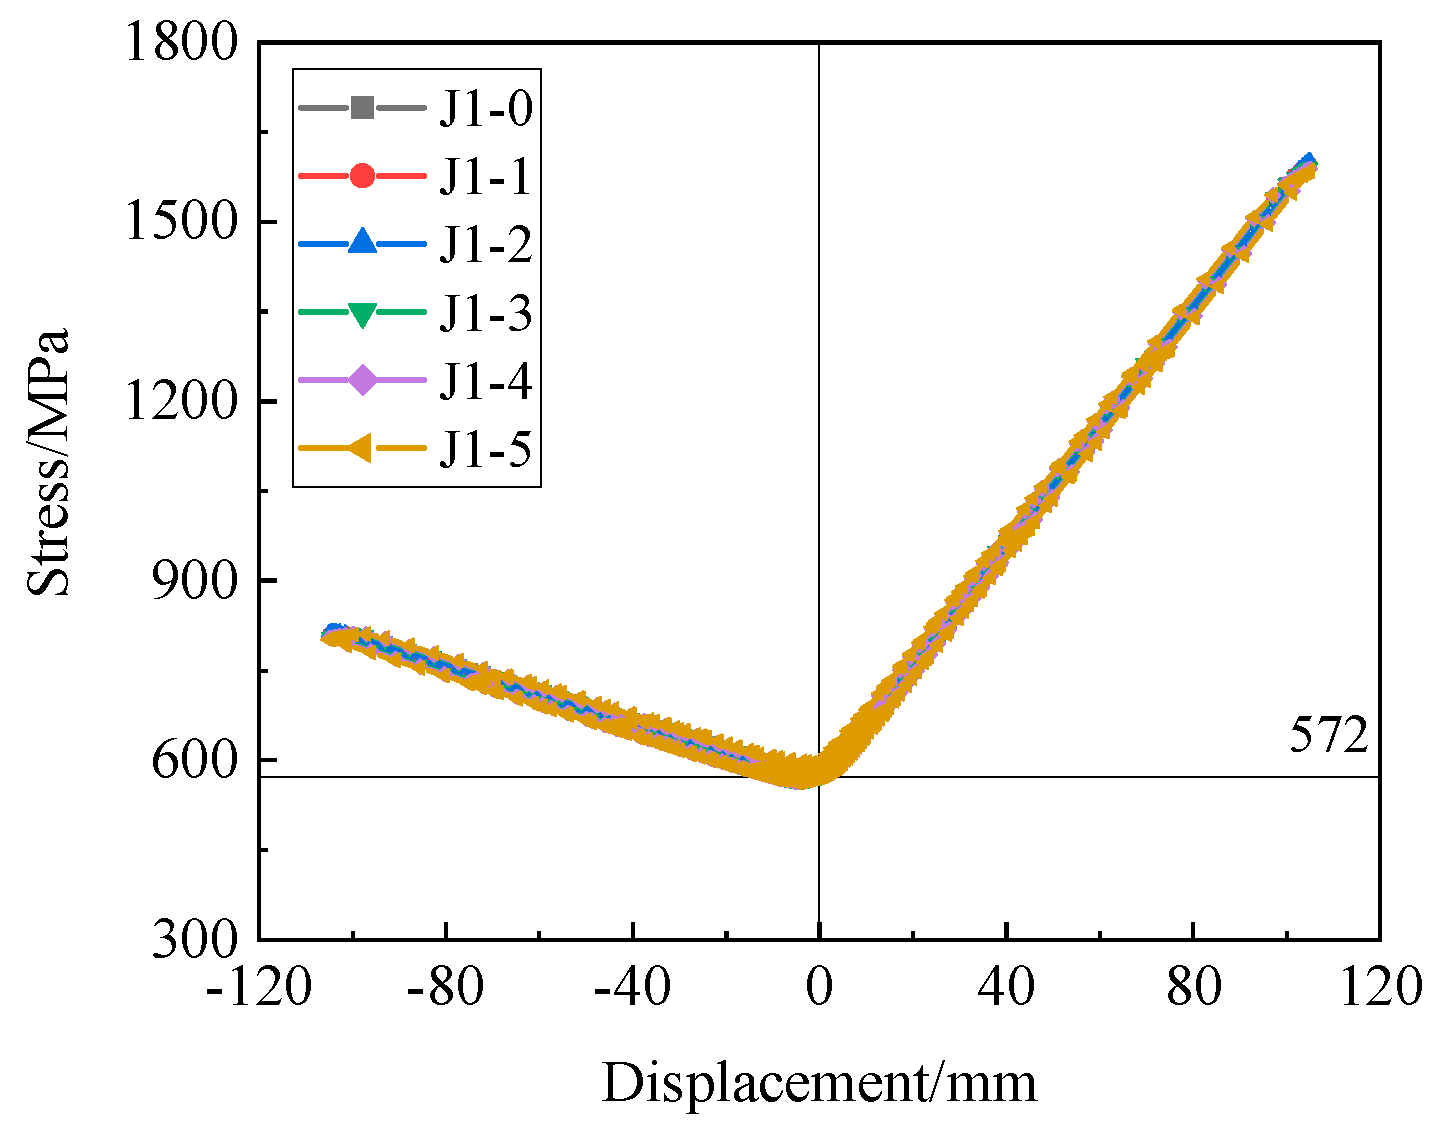
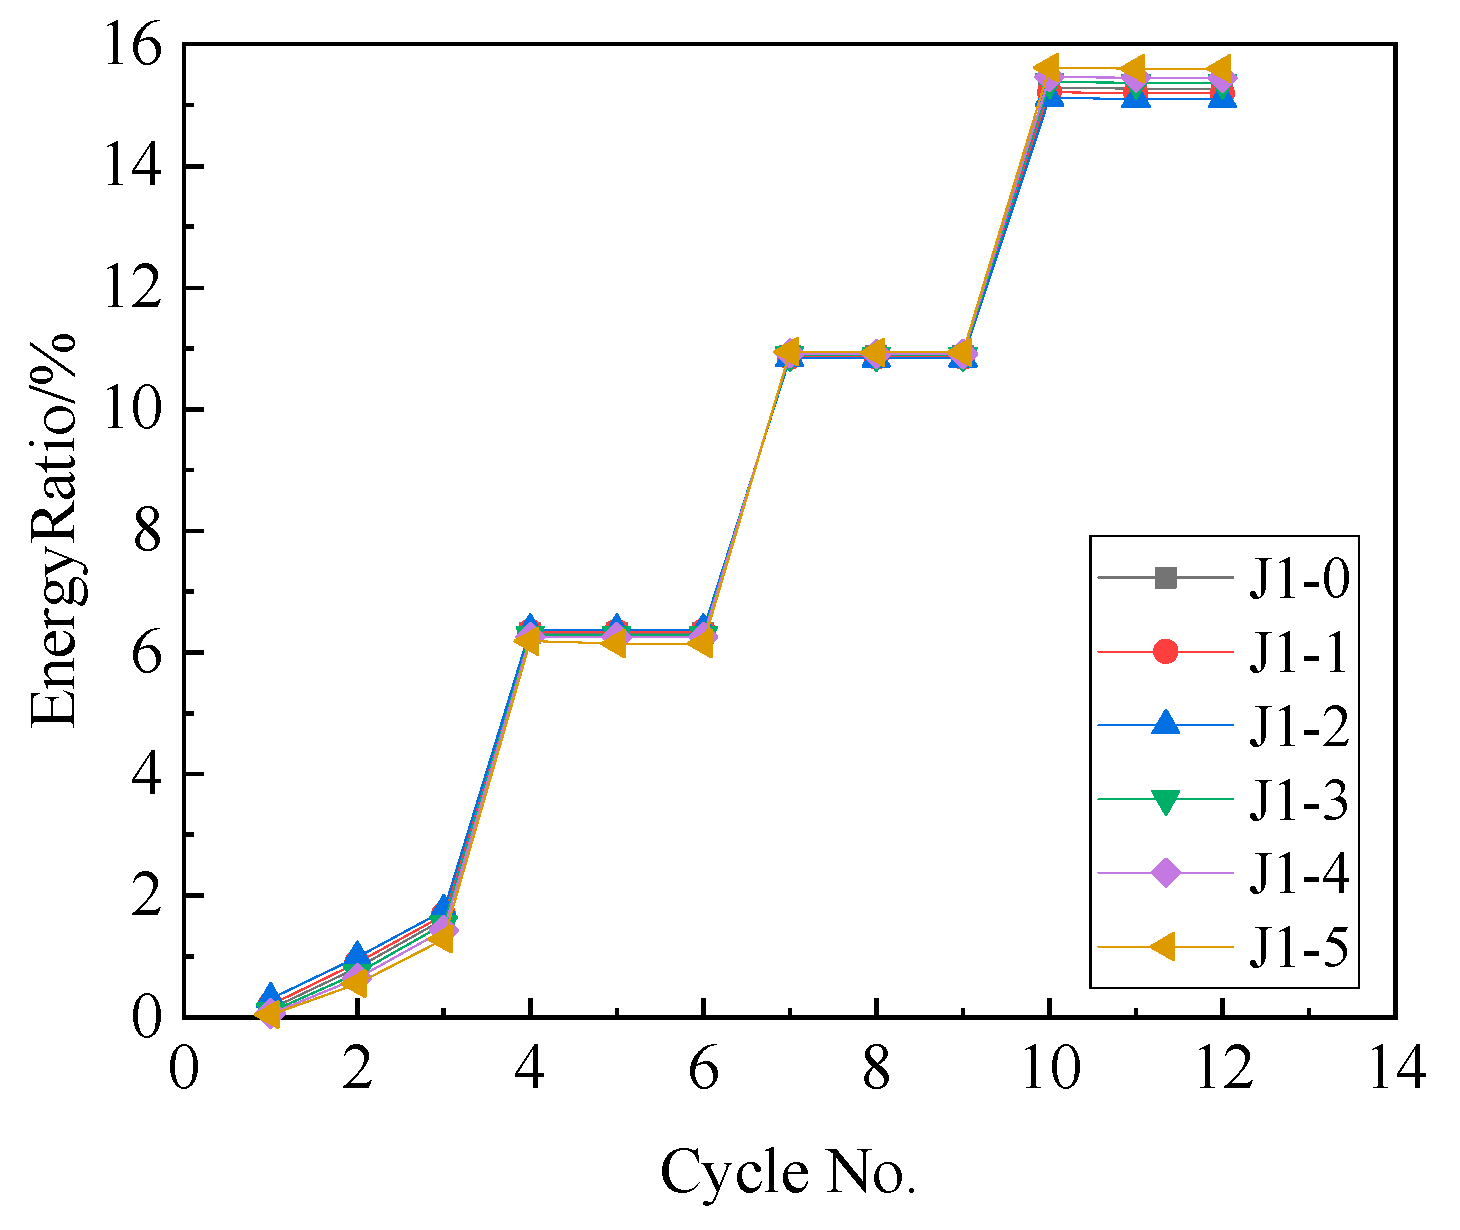
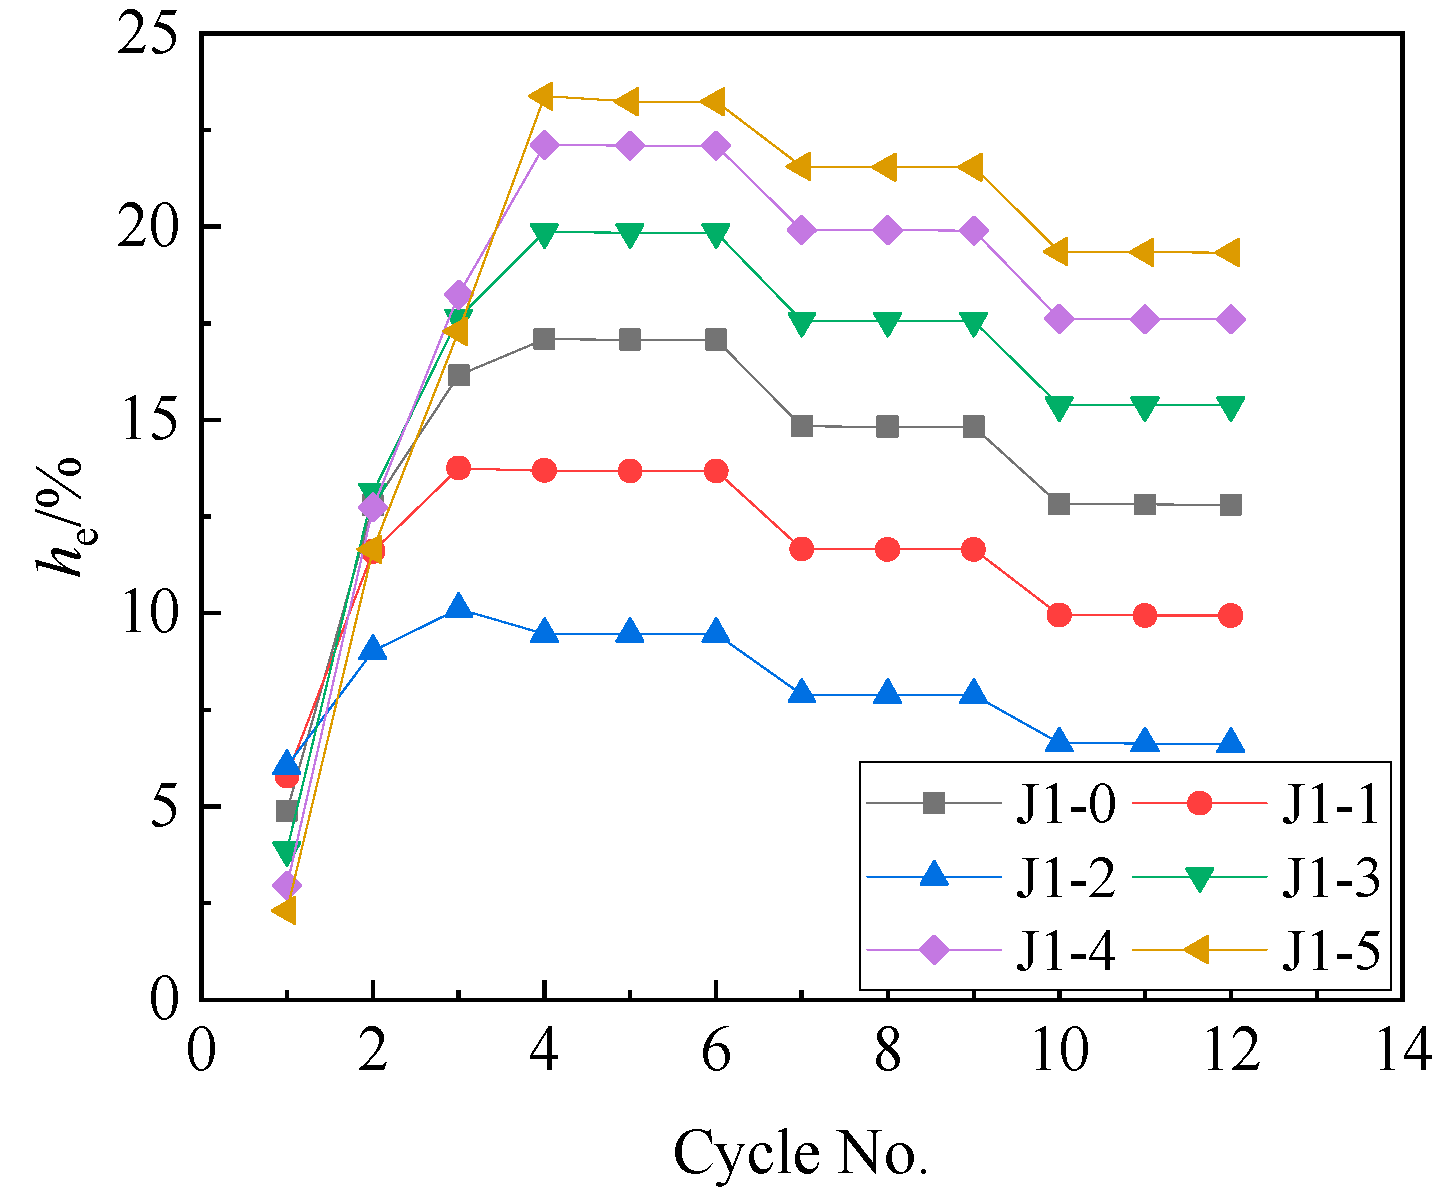
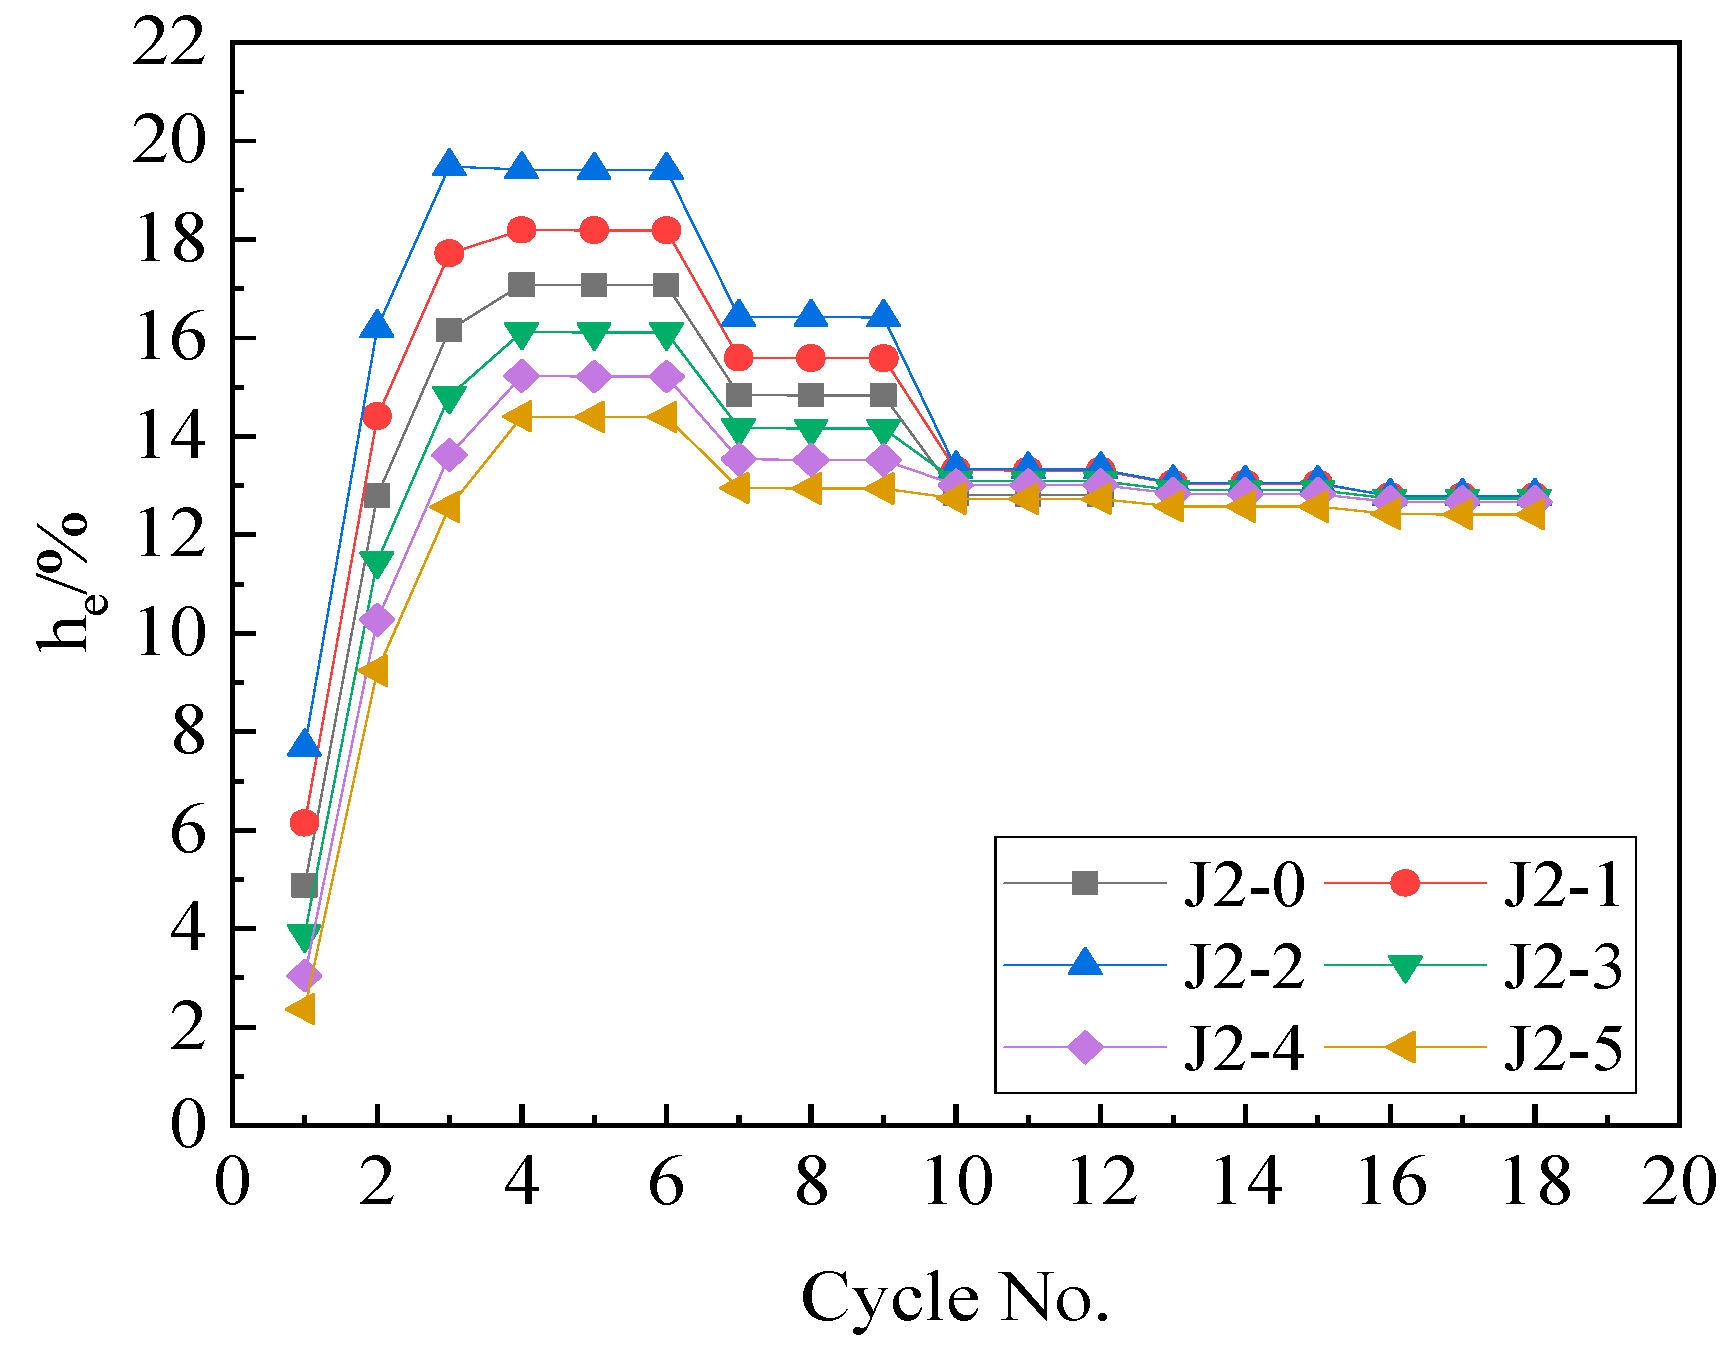
- Increasing friction can enhance the energy dissipation with hemax greater than 21% and increase the opening load and the maximum bearing capacity of the joint. However, when the friction is excessive, the residual deformation of the joint increases with the max residual deformation rate of 35.0%, and the self-centering performance of the joint decreases.
- (3)
- Increasing prestress of steel strands can increase the opening load of the joint, enhance the energy dissipation and the deformation capacity of the joint, and reduce the residual deformation of the joint with the minimum residual deformation rate of 0.3%, but the maximum bearing capacity of the joint cannot be improved by increasing the prestress of steel strands.
- (4)
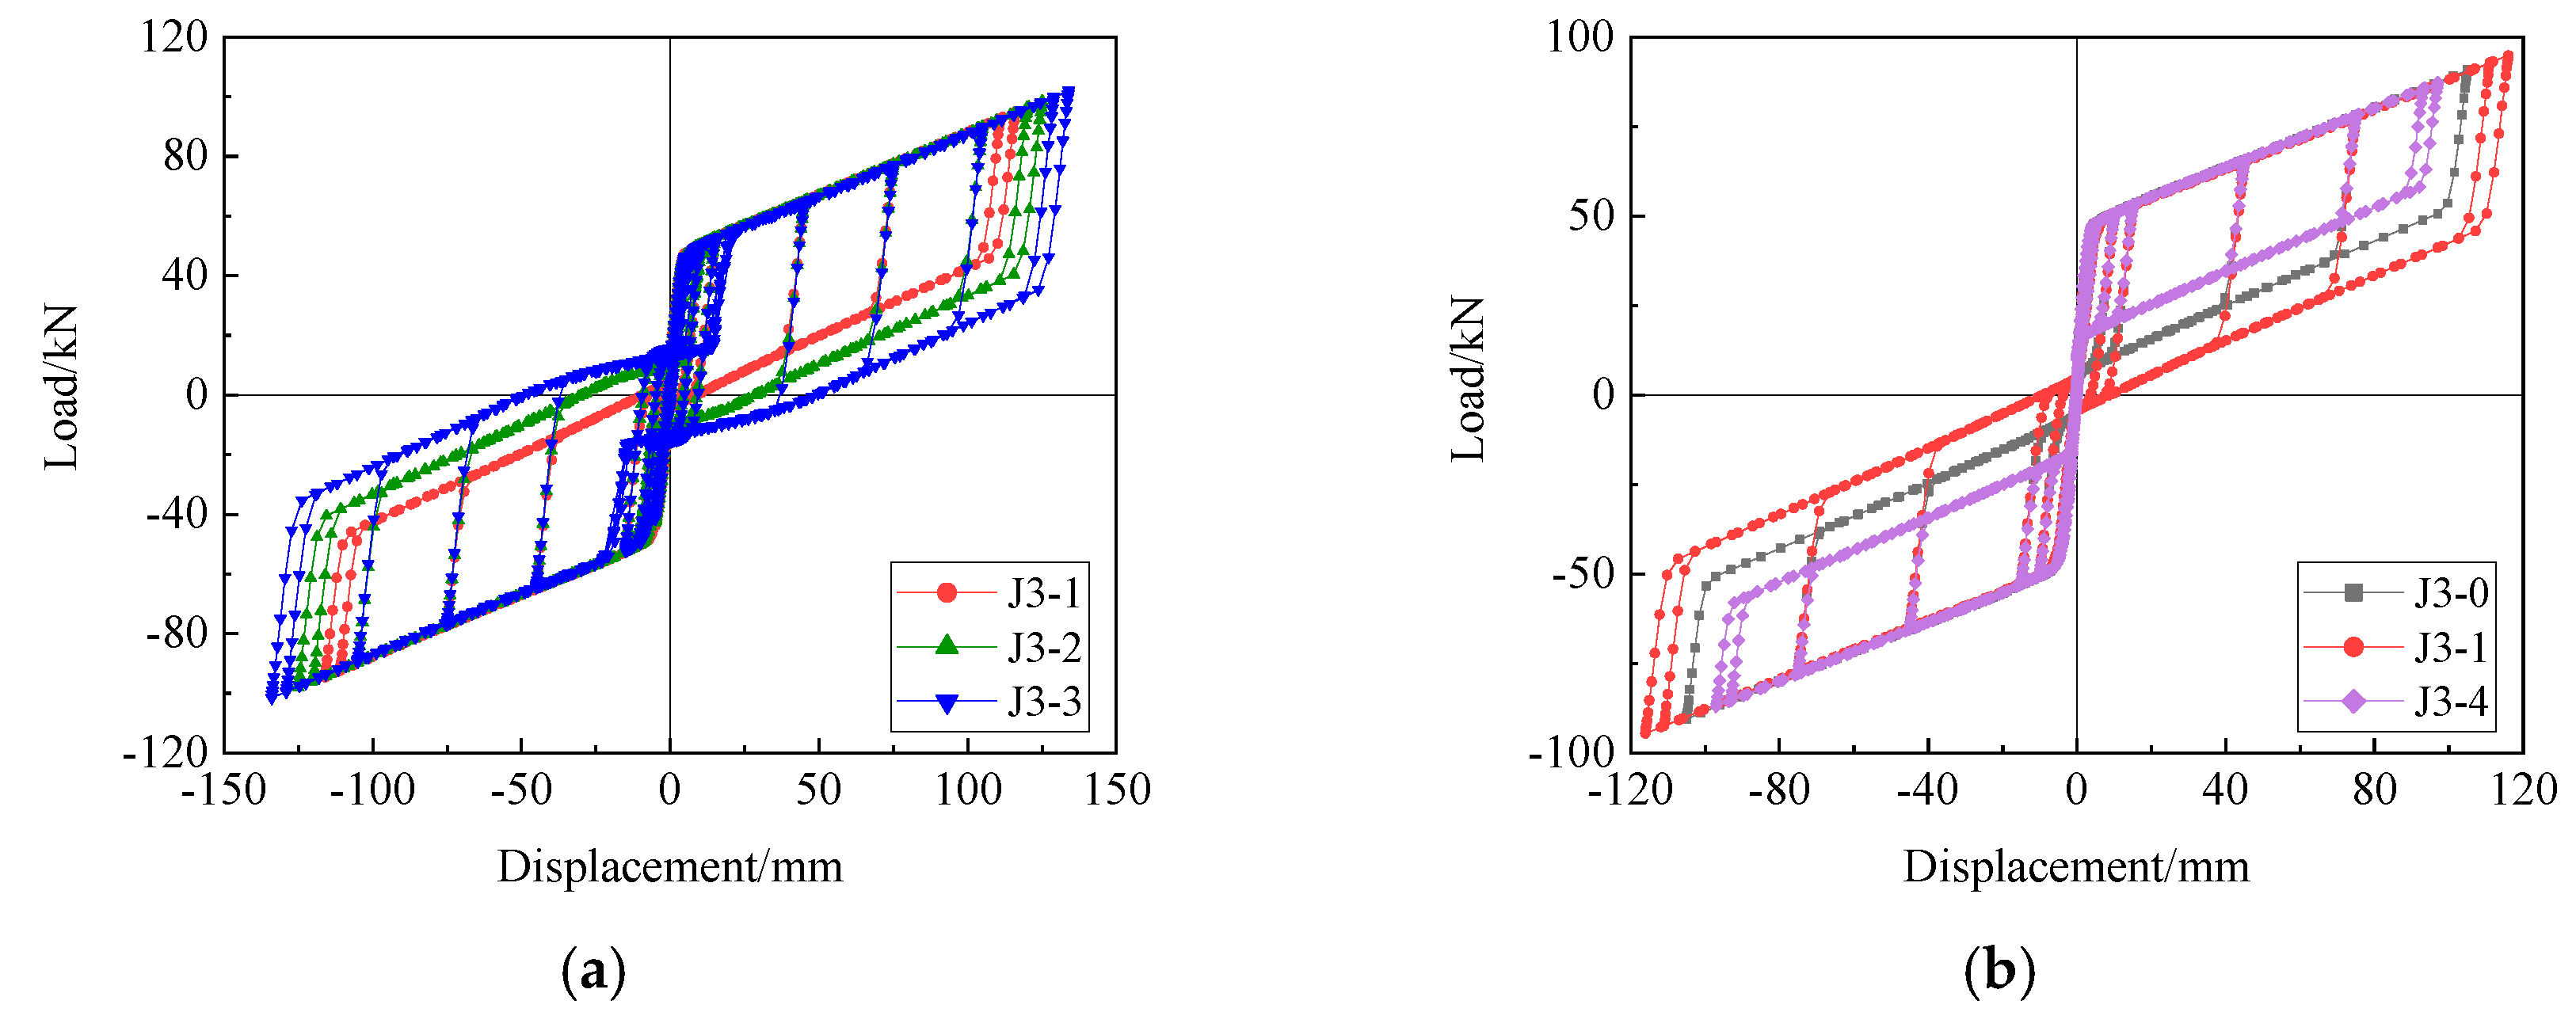
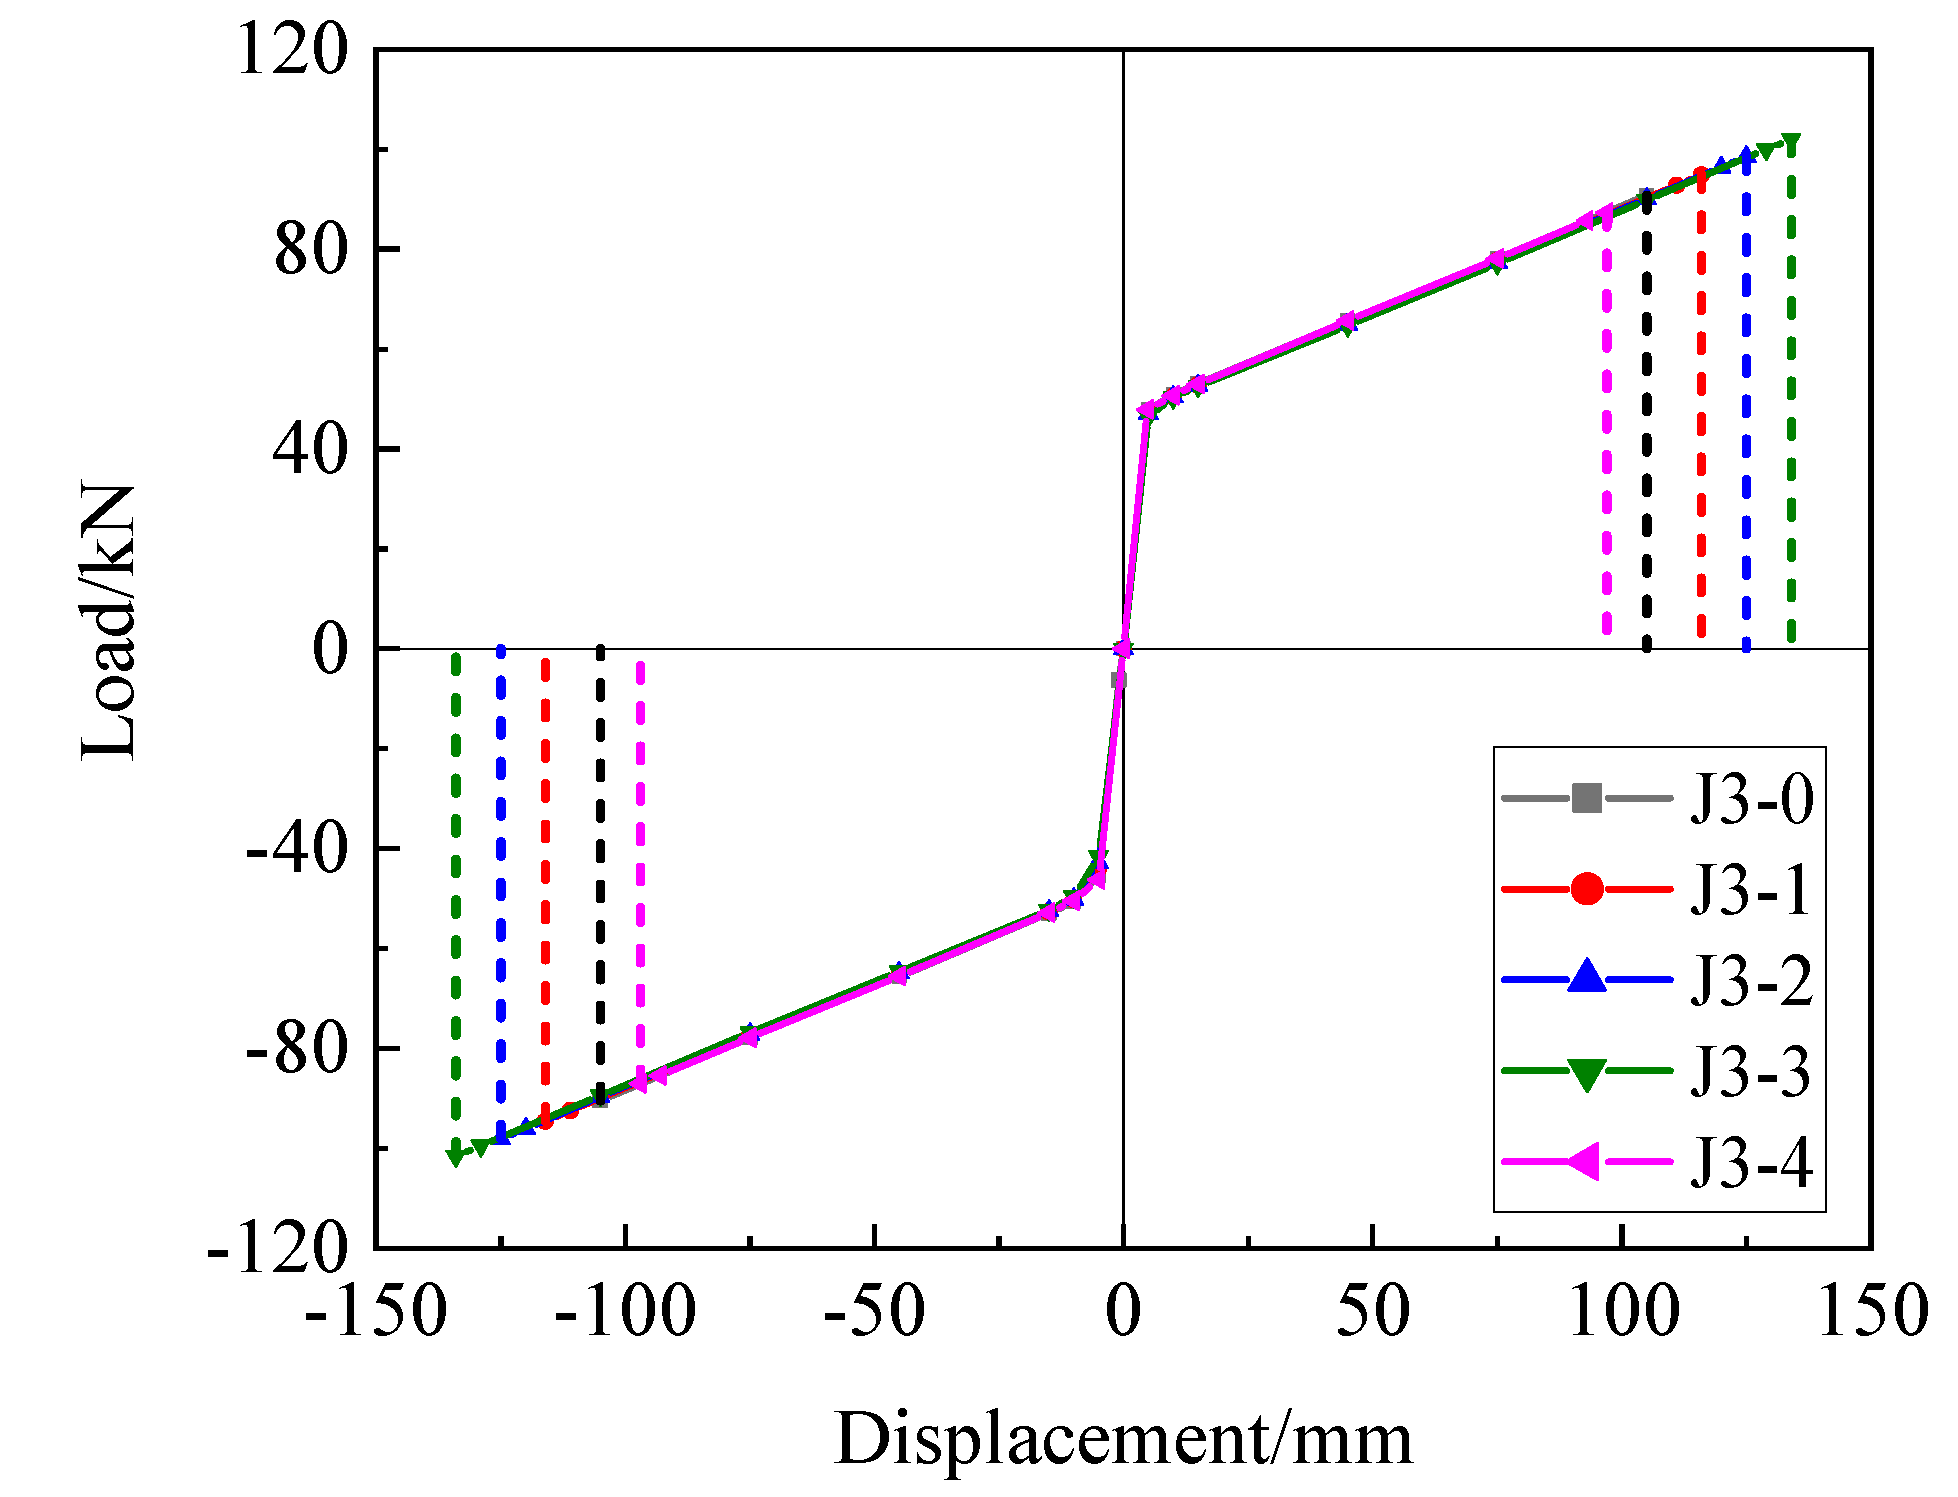
- Reducing the ratio of the tensile moment to the friction moment in the opening moment can enhance energy dissipation and maximum bearing capacity of the joint and improve the joint ductility. However, the residual deformation of the joint increases significantly, and the self-centering performance decreases.
- (5)
- When the structure is required to achieve good energy dissipation and good self-centering performance, the tensile moment in the opening moment of the joint shall be controlled to account for more than 50%, and the greater value shall be taken to avoid the decline of the self-centering performance in case of stress loss of steel strands caused by the structural deformation. Moreover, the joint should have the opening load as large as possible, even though the sufficient deformation capacity of the joint is needed. In addition, the resultant force of the initial tensile force of steel strands shall be greater than the friction so as to keep the steel head in contact with the connecting block during cyclic loading, which ensures the stability of the self-centering performance of the joint.
- (6)
- The joint restoring force model was in good agreement with the numerical model and could be used as references for the further theoretical research on the connection between CFDST columns and steel beams.
Author Contributions
Funding
Data Availability Statement
Conflicts of Interest
References
- Han, L.H.; Zhao, X.L. Investigation on concrete filled double skin steel tubes (CFDSTs) under pure torsion. J. Constr. Steel Res. 2013, 90, 221–234. [Google Scholar]
- Tao, Z.; Han, L.H.; Zhao, X.L. Behaviour of concrete-filled double skin (CHS inner and CHS outer) steel tubular stub columns and beam-columns. J. Constr. Steel Res. 2004, 60, 1129–1158. [Google Scholar] [CrossRef]
- Zhang, Y.; Guo, D. Structural Analysis of Concrete-Filled Double Steel Tubes; Springer: Singapore, 2021. [Google Scholar]
- Hu, Y.; Zhao, J.; Zhang, D.; Chen, C. Experimental seismic performance of CFDST-steel beam frames with different construction details. J. Constr. Steel Res. 2019, 162, 105736. [Google Scholar] [CrossRef]
- Zhang, Y.F.; Zhao, J.H.; Cai, C.S. Seismic behavior of ring beam joints between concrete-filled twin steel tubes columns and reinforced concrete beams. Eng. Struct. 2012, 39, 1–10. [Google Scholar] [CrossRef]
- Wang, J.; Guo, L.; Guo, X.; Ding, Z. Seismic response investigation on CFDST column to steel beam blind-bolted connections. J. Constr. Steel Res. 2019, 161, 137–153. [Google Scholar] [CrossRef]
- Wang, J.; Guo, L. Experimental and analytical behavior of square CFDST column blind bolted to steel beam connections. Int. J. Steel Struct. 2020, 20, 612–635. [Google Scholar] [CrossRef]
- Zhang, Y.; Gao, J.; Li, Y.; Demoha, K. Experimental analysis of hysteretic behavior and strain field of external diaphragm joints between steel beams and CFDST columns. Adv. Struct. Eng. 2020, 23, 1129–1141. [Google Scholar] [CrossRef]
- Zhang, Y.; Jia, H.; Li, Y.; Demoha, K. Experiments on cyclic performance of external diaphragm joints between CFDST columns and steel beams. B. Earthq. Eng. 2020, 18, 3843–3861. [Google Scholar] [CrossRef]
- Ahmed, A.D.; Güneyisi, E. Lateral response of double skin tubular column to steel beam composite frames. Turk. J. Eng. 2022, 6, 16–25. [Google Scholar] [CrossRef]
- Yin, Y.Z.; Zhang, Y. Research on the joint of concrete-filled steel tubular column and steel beam. Appl. Mech. Mater. 2013, 351–352, 174–178. [Google Scholar] [CrossRef]
- Nan, L.; Dong, N.Z. Numerical simulation of joint between concrete-filled square steel tubular column and steel beam on seismic behavior. Appl. Mech. Mater. 2015, 744–746, 207–210. [Google Scholar]
- Guo, L.; Wang, J.; Wang, W.; Duan, M. Seismic evaluation and calculation models of CFDST column blind bolted to composite beam joints with partial shear interaction. Eng. Struct. 2019, 196, 109269. [Google Scholar] [CrossRef]
- Guo, L.; Wang, J.; Wang, W. Theoretical model and structural performance of assembled joint between circular CFDST column and composite beam. Arch. Civ. Mech. Eng. 2020, 20, 75. [Google Scholar] [CrossRef]
- Zhang, D.; Zhao, J.; He, S. Cyclic testing of concrete-filled double-skin steel tubular column to steel beam joint with RC slab. Adv. Civ. Eng. 2018, 2018, 7126393. [Google Scholar] [CrossRef]
- Wolski, M.; Rides, J.M.; Sause, R. Experimental study of a self-centering beam-column connection with bottom flange friction device. J. Struct. Eng. 2009, 135, 479–488. [Google Scholar] [CrossRef]
- Huang, L.; Zhou, Z.; Huang, X.; Wang, Y. Variable friction damped self-centering precast concrete beam-column connections with hidden corbels: Experimental investigation and theoretical analysis. Eng. Struct. 2020, 206, 110150. [Google Scholar] [CrossRef]
- Morgen, B.G.; Kurama, Y.C. A Friction Damper for Post-Tensioned Precast Concrete Moment Frames. PCI J. 2004, 49, 112–133. [Google Scholar] [CrossRef]
- Zhang, A.; Zhang, Y.; Li, R.; Wang, Z. Cyclic behavior of a prefabricated self-centering beam-column connection with a bolted web friction device. Eng. Struct. 2016, 111, 185–198. [Google Scholar] [CrossRef]
- Koshikawa, T. Moment and energy dissipation capacities of post-tensioned precast concrete connections employing a friction device. Eng. Struct. 2017, 138, 170–180. [Google Scholar] [CrossRef]
- Huang, L.; Zhou, Z.; Clayton, P.M.; Zeng, B. Experimental investigation of friction-damped self-centering prestressed concrete beam-column connections with hidden corbels. J. Struct. Eng. 2020, 146, 04019228. [Google Scholar] [CrossRef]
- Guo, T.; Song, L.; Zhang, G. Numerical simulation of the seismic behavior of self-centering steel beam-column connections with bottom flange friction devices. Earthq. Eng. Eng. Vib. 2011, 10, 229–238. [Google Scholar] [CrossRef]
- Yun, C.; Chao, C.; Cong, C. Study on seismic performance of prefabricated self-centering beam to column rotation friction energy dissipation connection. Eng. Struct. 2021, 241, 112136. [Google Scholar] [CrossRef]
- Morgen, B.G.; Kurama, Y.C. Seismic design of friction-damped precast concrete frame structures. J. Struct. Eng. 2007, 133, 1501–1511. [Google Scholar] [CrossRef]
- Latour, M.; Piluso, V.; Rizzano, G. Free from damage beam-to-column joints: Testing and design of DST connections with friction pads. Eng. Struct. 2015, 85, 219–233. [Google Scholar] [CrossRef]
- Kim, H.J.; Christopoulos, C. Friction damped posttensioned self-centering steel moment-resisting frames. J. Struct. Eng. 2008, 134, 1768–1779. [Google Scholar] [CrossRef]
- Tsai, K.C.; Chou, C.C.; Lin, C.L.; Chen, P.C.; Jhang, S.J. Seismic self-centering steel beam-to-column moment connections using bolted friction devices. Earthq. Eng. Struct. D. 2008, 37, 627–645. [Google Scholar] [CrossRef]
- Hou, C.; Han, L.H.; Zhao, X.L. Behaviour of circular concrete filled double skin tubes subjected to local bearing force. Thin-Walled Struct. 2015, 93, 36–53. [Google Scholar] [CrossRef]
- Mander, J.B.; Priestley, M.J.N.; Park, R. Theoretical stress-strain model for confined concrete. J. Struct. Eng. 1988, 114, 1804–1826. [Google Scholar] [CrossRef]
- GB/T 5224-2014; Steel Strand for Prestressed Concrete. Chinese Standard Press: Beijing, China, 2014. (In Chinese)



| Material | Yield Strength | Ultimate Strength | Poisson’s Ratio | Elastic Modulus |
|---|---|---|---|---|
| (MPa) | (MPa) | (×105 MPa) | ||
| Q235b | 235 | 470 | 0.3 | 2.06 |
| Q345b | 345 | 560 | ||
| HPB300 | 300 | 420 | 2.10 | |
| HRB400 | 400 | 540 | 2.00 |
| Concrete Mark | Compressive Strength | Strain (at Compressive Strength) | Poisson’s Ratio | Elastic Modulus |
|---|---|---|---|---|
| (MPa) | (×105 MPa) | |||
| C30 | 23.7 | 0.002 | 0.2 | 23,027 |
| C35 | 27.6 | 24,872 |
| Joint Numbers | Bolt Preload | Pretension of Steel Strand |
|---|---|---|
| (kN) | (kN) | |
| J1-0 | 54.5 | 80 |
| J1-1 | 39.5 | |
| J1-2 | 24.5 | |
| J1-3 | 69.5 | |
| J1-4 | 84.5 | |
| J1-5 | 99.5 |
| Joint Numbers | Loading Directions | Joint Opening Loads | Ultimate Loads | Residual Deformation Rate |
|---|---|---|---|---|
| (kN) | (kN) | (%) | ||
| J1-0 | Positive | 48.56 | 90.77 | 0.3 |
| Negative | 48.45 | 90.47 | ||
| J1-1 | Positive | 43.53 | 85.88 | 0.6 |
| Negative | 43.35 | 86.61 | ||
| J1-2 | Positive | 39.08 | 81.00 | 0.4 |
| Negative | 38.00 | 80.75 | ||
| J1-3 | Positive | 53.61 | 95.60 | 2.5 |
| Negative | 53.53 | 95.27 | ||
| J1-4 | Positive | 58.66 | 100.46 | 11.9 |
| Negative | 58.46 | 100.10 | ||
| J1-5 | Positive | 63.71 | 105.28 | 23.0 |
| Negative | 62.79 | 104.87 |
| Joint Numbers | Prestress of Steel Strands | Bolt Preload |
|---|---|---|
| (MPa) | (kN) | |
| J2-0 | 572 | 54.5 |
| J2-1 | 500 | |
| J2-2 | 428 | |
| J2-3 | 644 | |
| J2-4 | 716 | |
| J2-5 | 788 |
| Joint Numbers | Loading Directions | Joint Opening Loads | Ultimate Loads | Residual Deformation Rate |
|---|---|---|---|---|
| (kN) | (kN) | (%) | ||
| J2-0 | Positive | 48.56 | 90.77 | 0.3 |
| Negative | 48.45 | 90.47 | ||
| J2-1 | Positive | 44.92 | 91.00 | 1.5 |
| Negative | 44.89 | 90.70 | ||
| J2-2 | Positive | 41.30 | 90.83 | 2.9 |
| Negative | 41.31 | 90.50 | ||
| J2-3 | Positive | 52.01 | 91.26 | 0.8 |
| Negative | 51.91 | 90.96 | ||
| J2-4 | Positive | 55.52 | 91.41 | 0.6 |
| Negative | 55.42 | 91.12 | ||
| J2-5 | Positive | 59.03 | 92.83 | 0.5 |
| Negative | 58.93 | 92.56 |
| Joint Numbers | β | Prestress of Steel Strands | Bolt Preload |
|---|---|---|---|
| (MPa) | (kN) | ||
| J3-0 | 6:4 | 572 | 54.5 |
| J3-1 | 5:5 | 474 | 67.9 |
| J3-2 | 4:6 | 380 | 81.5 |
| J3-3 | 3:7 | 285 | 95.1 |
| J3-4 | 7:3 | 664 | 40.8 |
| Joint Numbers | Loading Directions | Joint Opening Loads | Ultimate Loads | Residual Deformation Rate |
|---|---|---|---|---|
| (kN) | (kN) | (%) | ||
| J3-0 | Positive | 48.56 | 90.77 | 0.3 |
| Negative | 48.45 | 90.47 | ||
| J3-1 | Positive | 48.25 | 94.93 | 7.5 |
| Negative | 48.19 | 94.59 | ||
| J3-2 | Positive | 48.21 | 98.53 | 22.4 |
| Negative | 48.03 | 98.10 | ||
| J3-3 | Positive | 48.11 | 102.06 | 35.0 |
| Negative | 47.26 | 101.62 | ||
| J3-4 | Positive | 48.27 | 87.35 | 0.5 |
| Negative | 48.21 | 87.09 |
Disclaimer/Publisher’s Note: The statements, opinions and data contained in all publications are solely those of the individual author(s) and contributor(s) and not of MDPI and/or the editor(s). MDPI and/or the editor(s) disclaim responsibility for any injury to people or property resulting from any ideas, methods, instructions or products referred to in the content. |
© 2023 by the authors. Licensee MDPI, Basel, Switzerland. This article is an open access article distributed under the terms and conditions of the Creative Commons Attribution (CC BY) license (https://creativecommons.org/licenses/by/4.0/).
Share and Cite
Yan, X.; Shi, S.; Liu, X.; Mao, H. Numerical Analysis of Mechanical Behavior of Self-Centering Joint between CFDST Column and RC Beam. Buildings 2023, 13, 135. https://doi.org/10.3390/buildings13010135
Yan X, Shi S, Liu X, Mao H. Numerical Analysis of Mechanical Behavior of Self-Centering Joint between CFDST Column and RC Beam. Buildings. 2023; 13(1):135. https://doi.org/10.3390/buildings13010135
Chicago/Turabian StyleYan, Xueyuan, Shen Shi, Xuhong Liu, and Huimin Mao. 2023. "Numerical Analysis of Mechanical Behavior of Self-Centering Joint between CFDST Column and RC Beam" Buildings 13, no. 1: 135. https://doi.org/10.3390/buildings13010135
APA StyleYan, X., Shi, S., Liu, X., & Mao, H. (2023). Numerical Analysis of Mechanical Behavior of Self-Centering Joint between CFDST Column and RC Beam. Buildings, 13(1), 135. https://doi.org/10.3390/buildings13010135


