Article

Energy Upgrading of Basement Exterior Walls: The Good, the Bad and the Ugly

by
Christofer Skaar
*,
Jørn-Emil Gaarder
,
Nora Schjøth Bunkholt
and
Malin Sletnes
SINTEF Community, Høgskoleringen 7B, 7034 Trondheim, Norway
*
Author to whom correspondence should be addressed.
Buildings 2023, 13(1), 133; https://doi.org/10.3390/buildings13010133
Submission received: 29 October 2022 / Revised: 6 December 2022 / Accepted: 26 December 2022 / Published: 4 January 2023
(This article belongs to the Special Issue Thermal Insulation for Buildings in a Changing Climate)

Abstract

:
Most of today’s buildings will still be in use in 2050 and upgrades should therefore contribute to reducing energy consumption and carbon footprint. This paper addresses a challenge for upgrading of basement exterior walls of single-family dwellings, where ordinary retrofit insulation can lead to the basement wall protruding from the existing outer wall. For some, this will be an aesthetic barrier for an energy upgrade (an “ugly” solution). Superinsulation may solve this challenge without compromising the energy performance. This study analyses energy, cost and carbon footprint, to identify under which conditions upgrading with vacuum insulation panels (VIP) can be a preferred solution. Three alternatives are analysed in a parametric model: ordinary upgrade with XPS (the aesthetically “ugly”), upgrade with VIP above ground and XPS below ground (the aesthetically “good”), and iii) no upgrade (the “bad”, as it does not contribute to reducing energy consumption). Results show that using VIP and XPS to perform energy upgrade of a basement exterior wall may lead to an aesthetically more pleasing solution than with only XPS, but that it will lead to higher carbon footprint and higher costs. The least favourable option is to install a drainage system without doing an energy upgrade, which will have negative impact for energy use, carbon footprint and life cycle cost.

1. Introduction

In the Norwegian building stock, dwellings currently consume nearly 40 TWh per year [1]. As most of today’s buildings are expected to still be in use in 2050, reducing the energy consumption of existing buildings is needed to reach energy and carbon targets. This means that when existing buildings are upgraded, they should also contribute to reducing energy consumption and carbon emissions from energy and material use. Previous research has shown that there is a significant potential for reducing energy consumption and carbon footprint from Norwegian dwellings through energy upgrading [1,2,3]. However, there are also barriers that must be overcome, ranging from economy and psychology to technical solutions and regulatory barriers [4,5,6,7].
This paper addresses one specific barrier: the lack of energy and carbon ambitions when upgrading exterior basement walls. This is especially a challenge when the upgrade is performed stepwise, where there is a risk that aesthetic choices lead to solutions with little or no additional insulation and with little thought for the carbon footprint. The challenge is illustrated in Figure 1, with an upgrade that is limited to the basement wall. Here, the addition of ordinary retrofit insulation on the basement wall will lead to the basement protruding from the existing exterior wall. This is a solution that may be considered an aesthetically less pleasing solution (an “ugly” solution). If aesthetics is an important factor for the homeowner, this may lead to reduced energy ambitions when upgrading basement walls (a “bad” solution).
This paper addresses a solution to the specific challenge of upgrading a basement wall without compromising the aesthetic aspect of the building (a “good” solution), by using superinsulation. In this case, the superinsulation is vacuum insulation panels (VIP), which is a high-performance thermal insulation [8,9]. The purpose is to avoid suboptimal upgrades from an energy and carbon perspective, which may lead to building elements being “lost” for upgrades until the next time the building element is due to be maintained or replaced. For a basement, the window of opportunity for upgrading will be closed for 20–60 years after an upgrade (depending on the service life of the building element).
The goal of this study is to address two research questions: (i) How can superinsulation be used to perform energy upgrade of basement exterior walls? and (ii) What is the economic, energy, and carbon performance of the upgrade solutions? An integrated approach is developed to address these questions from the perspectives of energy, carbon, and cost. The integrated model is parametrised, to be able to identify under which conditions upgrading of basement exterior walls with VIP can be a preferred solution. The approach is based on previous work on terraces with superinsulation [10]. Furthermore, it addresses a gap in current research that few studies have addressed [11], where studies on VIP that address the carbon footprint are typically performed at the product level [12,13], whereas studies at the building level mainly focus on energy and cost performance [14,15,16]. Looking exclusively at energy performance in the use phase, VIP will perform well. However, there is a risk of higher costs and higher carbon footprint, and this risk must be addressed through an integrated approach that analyse VIP use at the building level for carbon, cost and energy.

2. Methods

2.1. A Parametric Tool for Calculating Energy, Carbon, and Cost Performance

An integrated approach is used to address the research questions from the perspectives of energy, carbon, and cost. The three analytical methods are combined in a generic and parametric tool for analysing basement upgrades. The tool is verified against case studies from the OPPTRE research project [3], which provide measured energy data before the upgrade and calculated results for two specific upgrading cases.
The generic tool is based on varying five parameters that have significant impact on the energy, carbon, or cost performance. These are (i) earth filling height on basement wall, (ii) existing U-value of the basement wall construction, (iii) heated floor area in the basement, (iv) energy performance of the upgraded basement (specified either as thickness of VIP or a specific U-value), and (v) time perspective. The development of the tool is an expanded version of a tool first developed for evaluating superinsulation in terraces [10].

2.2. Energy Demand and U-Values

For assessment of energy demand, SIMIEN [17], which is a simulation program for calculating energy consumption and power requirements in buildings, was used. The program can also be used for assessment of indoor climate, evaluation against building regulations and passive house standards, as well as energy labelling. SIMIEN calculates energy demand of buildings based on the Norwegian Standard NS 3031:2014 Calculation of energy performance of buildings—Method and data [18]. Specific calculations for U-values using VIP insulation are calculated based on the international standard NS-EN ISO 13370:2017 Thermal performance of buildings—Heat transfer via the ground—Calculation methods [19]. The energy model in SIMIEN calculates hourly values of energy consumption and power demand, based on building parameters and indoor/outdoor climate, and aggregates the values to a yearly consumption.

2.3. Carbon Footprint

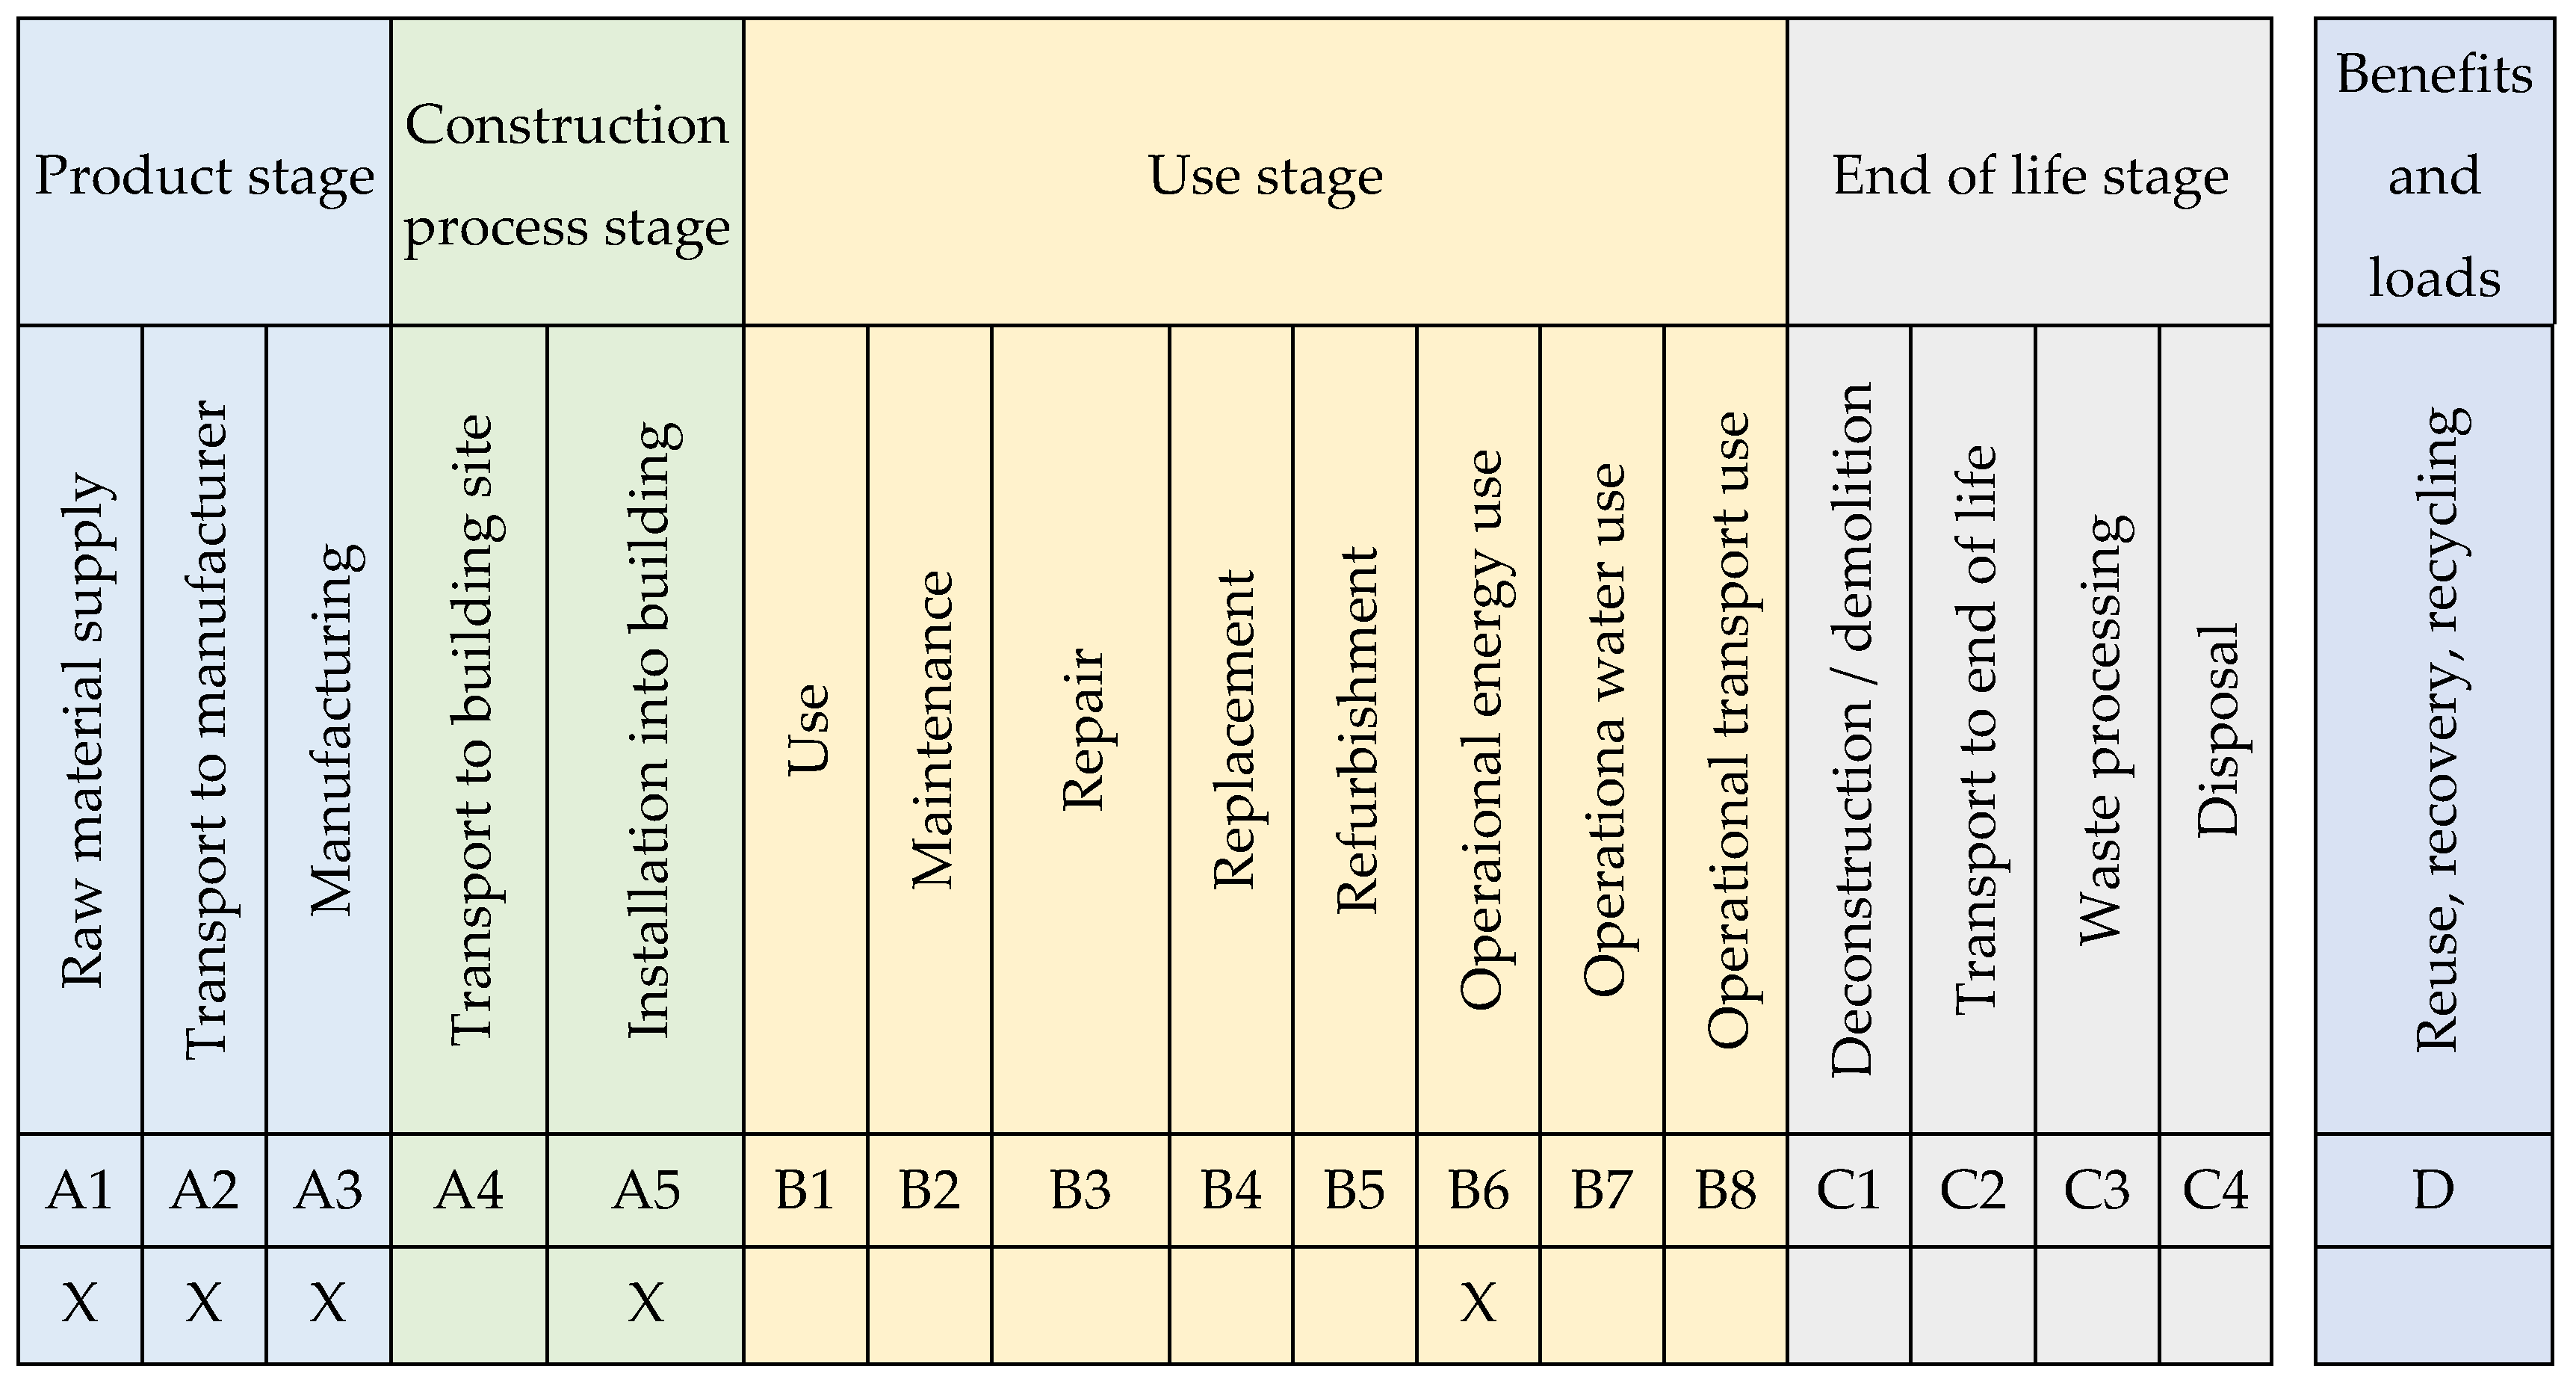
Carbon footprint calculations are based on the life cycle assessment (LCA) methodology, consisting of four stages: (i) goal and scope definition, (ii) life cycle inventory, (iii) life cycle impact assessment and (iv) interpretation. The carbon footprint calculations for the basement are based on the Norwegian standard NS3720 Method for greenhouse gas calculations for buildings [20], with life cycle modules A1–A3, A5 and B6 (as shown in Figure 2). Carbon footprint calculations for the materials are based on the European standard EN15804 Sustainability of construction works—Environmental product declarations—Core rules for the product category of construction products [21].
The focus of the carbon footprint study is to analyse the payback time of upgrades of basement exteriors walls, without taking into account the location of the building (therefore excluding A4 and B8). The scope is therefore limited to life cycle modules A1–A3 (material production), A5 (construction site) and B6 (operational energy use). Basement exterior walls are part of the superstructure and typically have a long lifetime with limited need for activities in the use stage, therefore life cycle modules B1–B5 and B7 are not included. Any activity in these modules will be related to exterior maintenance, and it is assumed that maintenance will be done in regular intervals with or without an upgrade. The end-of-life stage (C1–C4) is also not included. This is a simplification, as the focus here is on the carbon footprint. Furthermore, with wastes leaving the system at the end-of-waste for material and energy recovery, the carbon footprint of the end-of-life stage is typically low (estimated to be 2% of the carbon footprint for a wooden single-family house in Sweden [22]). Benchmark values for carbon footprint of buildings have been developed for Norwegian conditions [23], but these values are at a higher level of aggregation and are not available for basement exterior walls.
For the energy use, the model is based on delivered electricity and does not consider other energy sources (e.g., district heating or wood stoves). The delivered energy is calculated for a single year using SIMIEN, see Section 2.2 and Section 3.1 for further details. For other time periods, the energy demand is modelled as constant for all years (variation between years is expected to average out over time, potential changes in climatic conditions are not included). Three scenarios for modelling the carbon footprint of electricity are used. The first two are taken from the Norwegian standard for carbon footprint of buildings [20]. Here, the average emission intensities are calculated towards 2050, for the physical production mix of Norway (18 g CO2-eq. per kWh) and for the European production mix (EU28 + NO, 136 g CO2-eq. per kWh). These provide two different system perspectives, one with Norway as the system and one with Europe as the system. In addition, a third and dynamic scenario is calculated based on the FutureBuilt ZERO methodology [24]. This approach is the same approach as for the European production mix from the Norwegian standard, but with annual emission intensities instead of averages over the entire period. Here, the emissions start at ca. 300 g CO2-eq. per kWh in 2022 and, as fossil fuels are phased out, decline until a steady state of 24 g CO2-eq. per kWh is reached in 2050. The first two scenarios provide an upper and lower bound for the emission over time, whereas the third scenario also will show the importance of when the upgrades are being performed.
The end of life of the materials is excluded as this will have little impact on the carbon footprint of the materials used. Instead, the potential benefits are linked to reduced resource use outside the system boundary. Resalati et al. [12] have analysed the circular properties of VIPs and show how these can influence the environmental performance, especially for the materials with high environmental impact in the production stage. The most significant gain would be to use recycled core material today, but this is not current practice.
For the construction stage, the carbon footprint is mainly due to the energy consumption of construction equipment. This is modelled based on the volume of earth that has to be excavated in order to access the basement wall.

2.4. Investment Cost and Life Cycle Cost (LCC)

Cost calculations follow the same system boundary as the carbon footprint, which means that it is material costs (A1–A3), labour costs (A5), and energy costs in the operation (B6). The investment cost is the cost for A1–A3 and A5, covering both materials and labour for the basement upgrade. The purpose of the investment cost analysis is to analyse what the difference in investment cost is for the VIP/XPS versus only XPS upgrades. Life cycle costs are calculated based on investment cost and energy cost. The purpose of the life cycle cost is to analyse the payback periods for the various alternatives. Cost of repair and maintenance are excluded, as these are assumed to be identical for the alternatives.
Material costs are based on a combination of sources, primarily the Norwegian construction cost index Norsk Prisbok [25] and information from construction material manufacturers. Only aggregated values are provided, due to confidentiality. The energy cost is based on the electricity price from Statistics Norway for Q1 in 2022, and with an estimated annual increase of 2.6%. It should be noted that the electricity prices in Norway currently are highly volatile, and it is difficult to predict future developments. This approach is an estimate based on prices returning to a more normal situation.

2.5. Comparison with Case Studies from OPPTRE

The integrated approach is tested for two specific building cases, to see how the results from the generic tool compare to real-life cases. The upgrades are from the OPPTRE project [3]. OPPTRE was a research project on energy upgrading of wooden dwellings to nearly zero energy level (nZEB), which ran from 2018–2022. A core element of OPPTRE was an architecture competition, where six architect teams designed upgrades for six different real-life cases. These provided cases of state-of-the-art upgrading with high energy ambitions, as well as the consequences on cost and carbon footprint. Two of the OPPTRE cases included energy upgrading of the exterior basement walls. The OPPTRE project provided SIMIEN files [17] that were used in an architectural competition on upgrading of wooden dwellings. The SIMIEN files provided energy demand for the existing basement and for the refurbished solution. Calculations were then performed to determine the amount of materials needed for VIP/XPS and XPS only. Combined, this provided the energy demand and the material consumption that were needed to calculate the carbon footprint. The results are compared, with the two specific results from the OPPTRE project plotted against results from the generic tool. A limitation of this approach is that it is based on only two cases, where a positive correlation can only be used to support the findings. However, significant deviations will be an indication that can invalidate the generic tool.

3. Parametric Model and Case Study

3.1. Generic Basement Model

A generic model of a basement was defined in order to investigate the possible reduction in energy demand of basements with retrofit wall insulation. The basement model is developed in Excel. The input into the generic model is the annual energy demand and the amount and types of materials. Based on this input, the model calculates the carbon footprint, investment cost and life cycle cost annually for a time period of 60 years. The generic case study includes a 2.4 m high basement (floor dimension 10 × 6 m) with varying ratios of the wall exposed over ground level. Two scenarios of existing wall constructions are studied: (a) an uninsulated concrete wall and (b) an uninsulated light-weight aggregate wall (LWA). Central material parameters and U-values of existing and retrofit basement constructions are given in Table 1 and Table 2. It is assumed that retrofitting is performed with XPS insulation and a foundation wall plate below ground level and XPS or VIP insulation (wrapped in a watertight membrane) covered with plaster above ground level. Only the insulation materials, concrete and LWA are taken into account when calculating the U-values of the retrofit construction, while all materials are taken into account in calculations of carbon footprint (see Section 2.3).
SIMIEN (Section 2.2) was used to calculate the yearly energy demand of the generic basement. The calculation model includes the basement envelope, components for heating and ventilation, and internal loads (technical equipment, lighting, and people). Standardized values for detached houses according to NS3031:2014 [26] were used as input values for heating, ventilation, and internal loads. Calculations were performed for the model with and without retrofit insulation on the basement walls, i.e., various basement wall U-values. The heating and ventilation components and internal loads are equal in all calculation cases. The calculations are performed for the climate of Oslo, Norway, in accordance with NS3031:2014. Oslo is the standard climate used in energy calculations of buildings according to the Norwegian building code. According to the Köppen climate classification [27] Oslo is within the subarctic continental group (group Dfc), characterized by the coldest month averaging below 0 °C and 1–3 months averaging above 10 °C.
Table 3 shows the U-values for the concrete and light-weight aggregate walls, with a variation in how much of the lower part of the basement wall is below the ground. The upper 30 cm of the wall are always above ground, and the percentages refer to how much the lower 210 cm is below ground. For example, if the ratio is 40% below ground, this means that 84 cm is below the ground (40% of 210 cm) and 156 cm is above the ground (30 cm + 60% of 210 cm). The total area of the basement walls is ca. 81 m2.

3.2. Residential Case Buildings (OPPTRE)—Comparison with Case Studies

The generic basement model presented in Section 3.1 has locked a number of parameters: basement size/heated gross internal area (Norwegian: bruttoareal, BRA), location, U-values, etc. In order to investigate the validity of the generic model, the results from the model were compared to the results for two actual residential case buildings from the research project OPPTRE—Energy upgrading of wooden dwellings to nearly zero energy level [3]. Here, the parameters from OPPTRE were used in the generic model. The goal of OPPTRE was to propose a nearly zero energy level (nZEB) for renovation of wooden dwellings, with ambitious upgrades to bring the energy consumption closer to the current building code requirements for new buildings
OPPTRE has identified cost-efficient upgrading concepts that at the same time provides satisfactory indoor climate and low carbon footprint. In the context of OPPTRE, energy upgrading involves an optimalization of the building envelope that results in increased comfort and reduced energy demand. Optimalization of the building envelope means upgrading to an optimal level regarding energy demand, moisture safety and cost-efficiency. OPPTRE included calculations of energy demand for different actual residential buildings. Two of these case buildings are included in the present study, these are shown in Figure 3.
These two are similar to many Norwegian wooden dwellings that are ageing towards renovation. General information about the two buildings is given in Table 4. SIMIEN was used to calculate the yearly energy demand of the two residential case buildings (see Section 2.2). The energy demand of the buildings is calculated with the existing basement wall construction and with a refurbished solution with retrofit insulation materials and thermal resistances equal to the ones presented in Table 1.

4. Results and Discussion

4.1. Energy Consumption

The energy consumption has been calculated based on the U-values calculated in the parametric model for the basement for different ratios of basement wall below ground and for three upgrading scenarios (with the existing construction and upgrades with VIP/XPS and only XPS). The results are presented in Table 5 (ΔU is the difference in U-value before and after the upgrade and ΔE is the difference in energy demand). The results show that the concrete construction has the highest energy consumption before the upgrade and also the highest reduction, 88.3% for the most exposed basement. Depending on how much of the wall is exposed, the energy reduction is from 43.2% to 88.3% for the concrete wall and from 20.4 to 36.5% for the light-weight aggregate (LWA) wall.
The annual reduction in energy consumption is in the range 6021–69,892 kWh per year for the concrete wall and 1923–4881 kWh per year for the LWA wall. In comparison, the OPPTRE case studies show a slightly lower reduction in energy demand, as shown in Table 6. In addition, the OPPTRE case studies also have 12–35% larger wall area. This means that the parametric model for the light-weight aggregate (LWA) wall has the best fit with the real-life case studies, although it also overestimates the energy reduction. This is partly due to a better initial U-value but may also be due to differences in use. In the generic model the whole area is heated area, whereas the OPPTRE cases show a more varied use in practice.
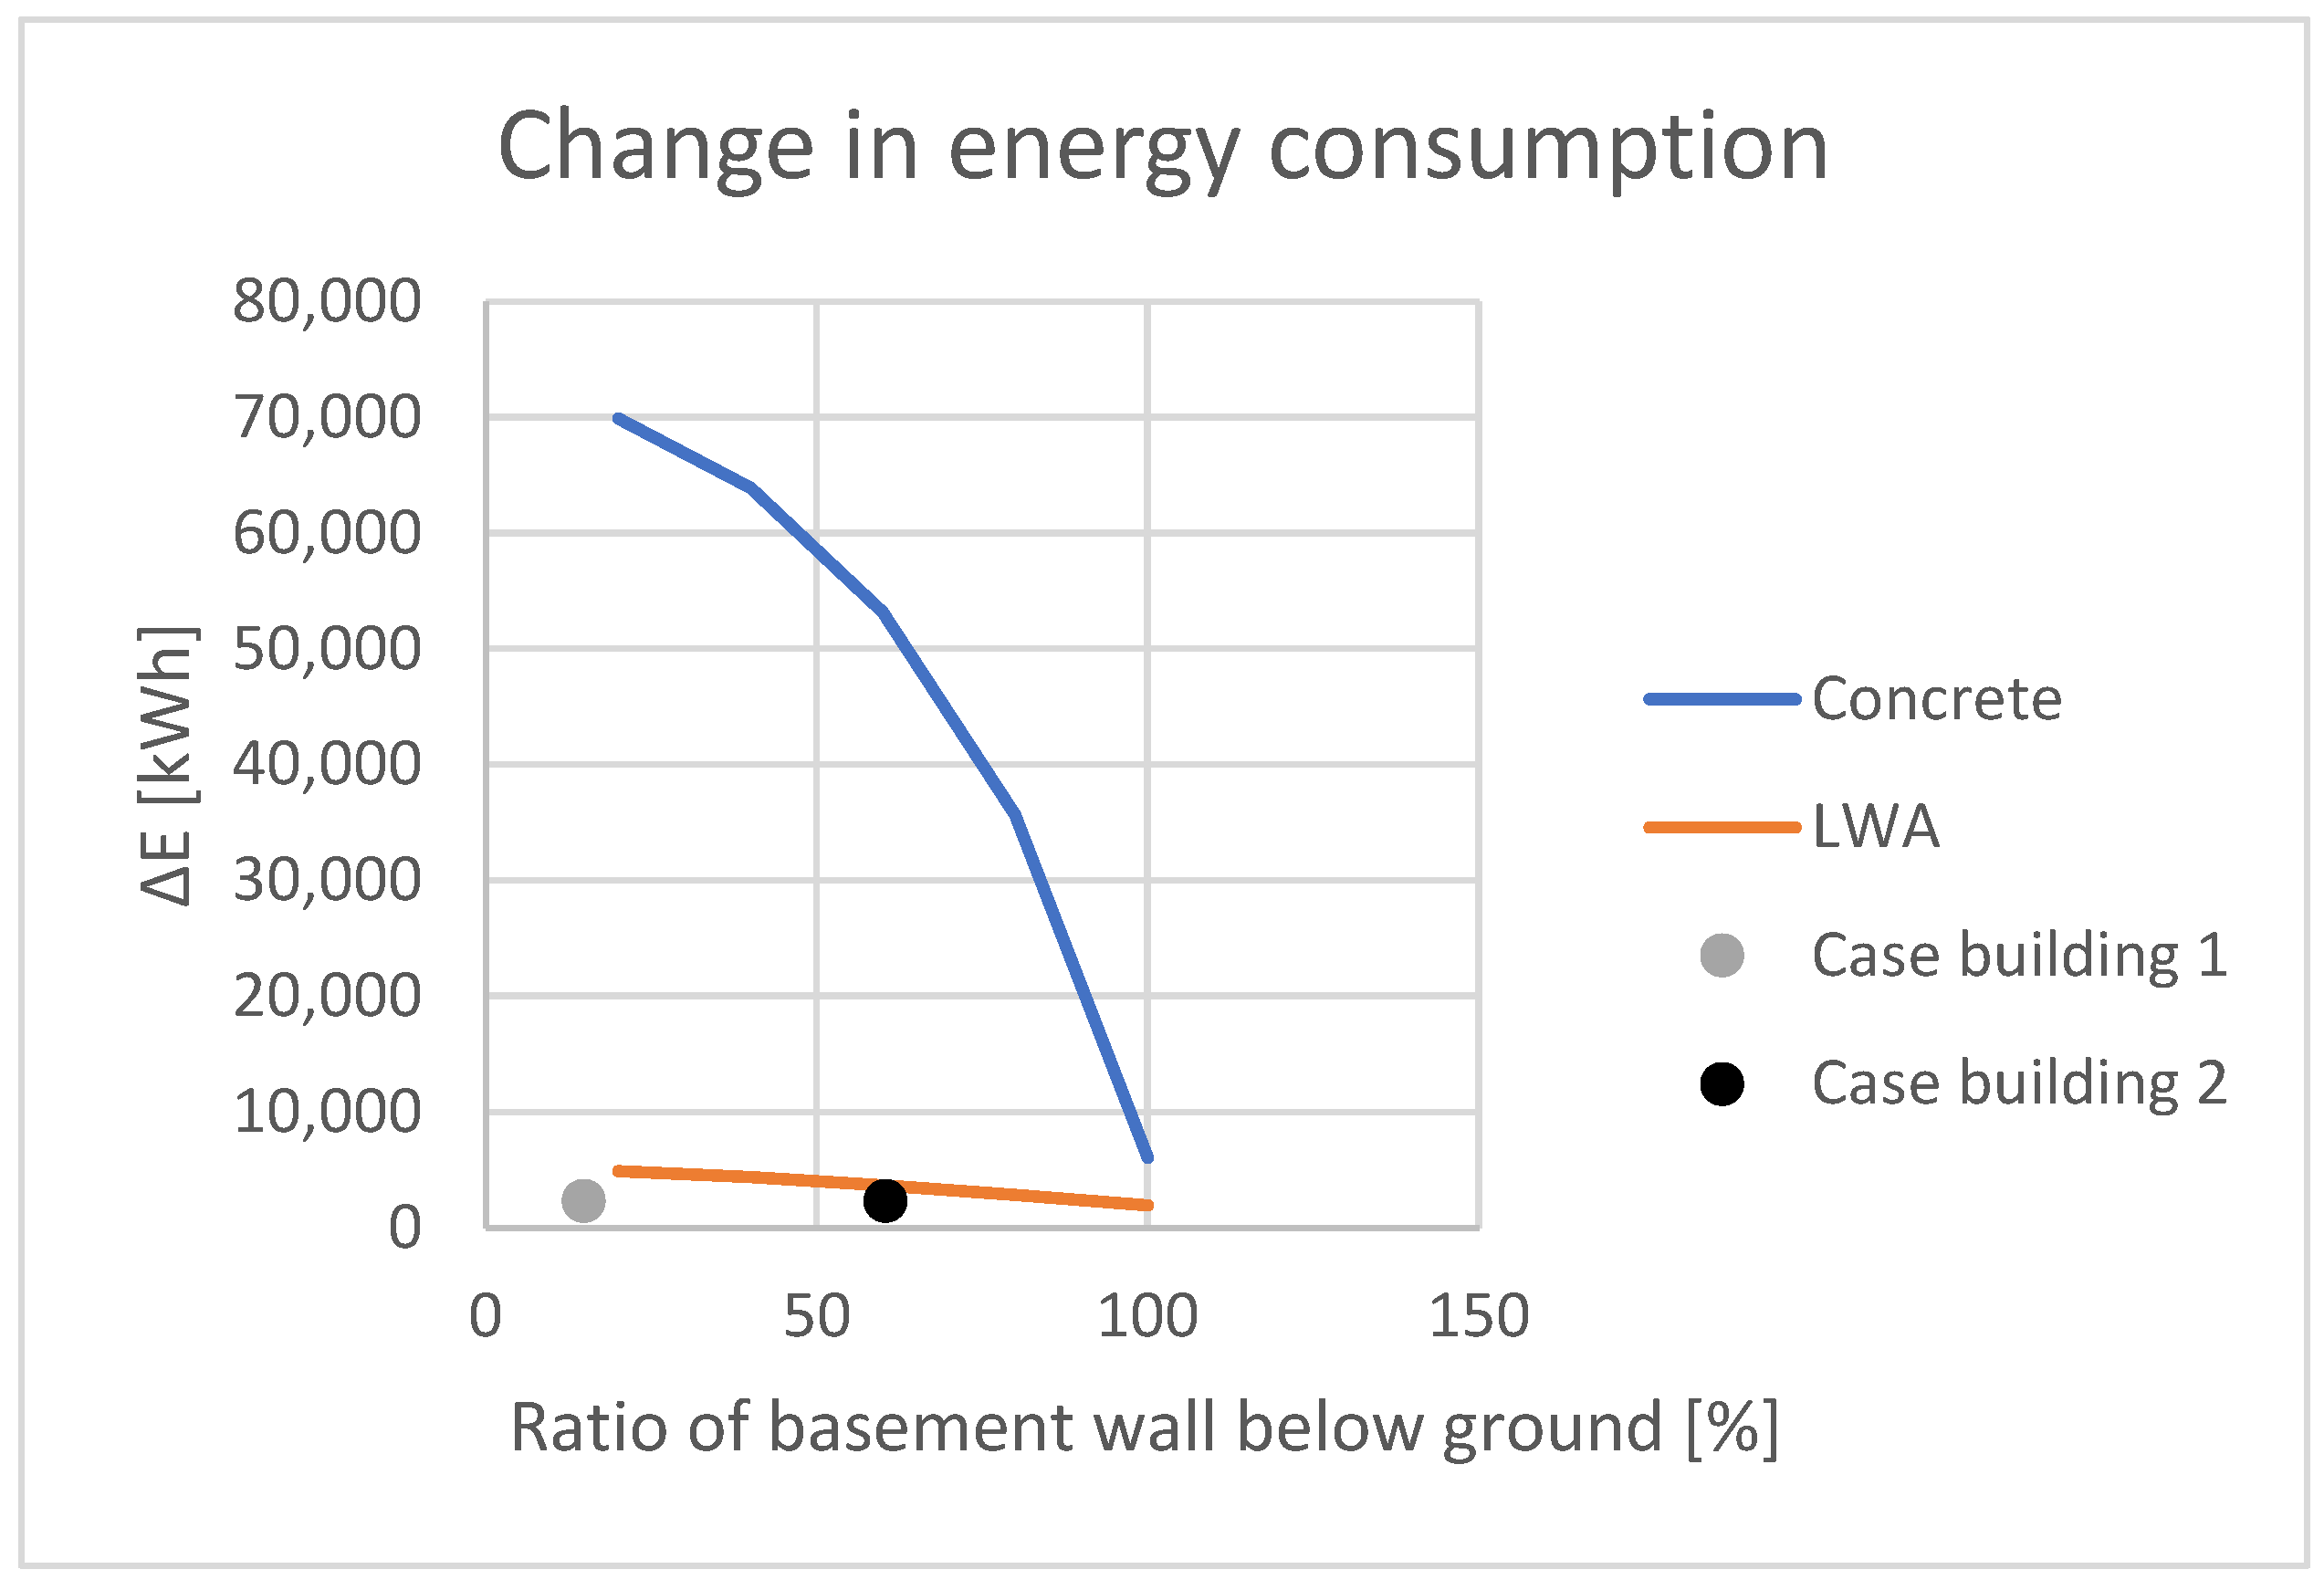
The lines in Figure 4 plot the energy demand of the two alternatives (concrete and light-weight aggregate (LWA)), depending on how much of the basement wall is below the ground. The two dots mark the energy loss for the two case buildings from the OPPTRE project, as presented in Section 3.2. The results show a major difference in energy loss for basements with concrete walls versus basements with light-weight aggregate walls (concrete walls are a factor 23–31 higher than the OPPTRE cases, LWA are 1.6–2.1 higher). It is highly unlikely that concrete basements with an energy loss of this magnitude will be used as heated area. Therefore, the carbon footprint analysis and cost analysis will focus on the light-weight aggregate basement walls. As Figure 4 shows, these also correspond well to the real-life cases from the OPPTRE project [3]. The difference between the LWA alternative and the OPPTRE cases is still relatively large, the change in energy consumption is 37–53% lower in the case results compared to the results from the generic model. This is likely explained by a combination of physical differences between the specific and the generic, as well as differences in how the basements are used. The energy calculations in the generic tool are based on standardised methods, which are known to overestimate the energy consumption in older buildings (the prebound effect, which is the gap between measured and calculated energy consumption [28]).

4.2. Carbon Footprint

The carbon footprint of the upgrade alternatives has been calculated for three different electricity scenarios (as described in Section 2.3), as this is a parameter that has significant impact on the results. The results are shown for the existing basement (Figure 5a), where the carbon footprint is only due to the energy use. Figure 5b,c show the two upgrade alternatives, with Figure 5b showing an upgrade with only XPS and Figure 5c showing and upgrade with a combination of VIP above ground and XPS below ground. The results show that the carbon footprint is significantly influenced by the choice of electricity mix.
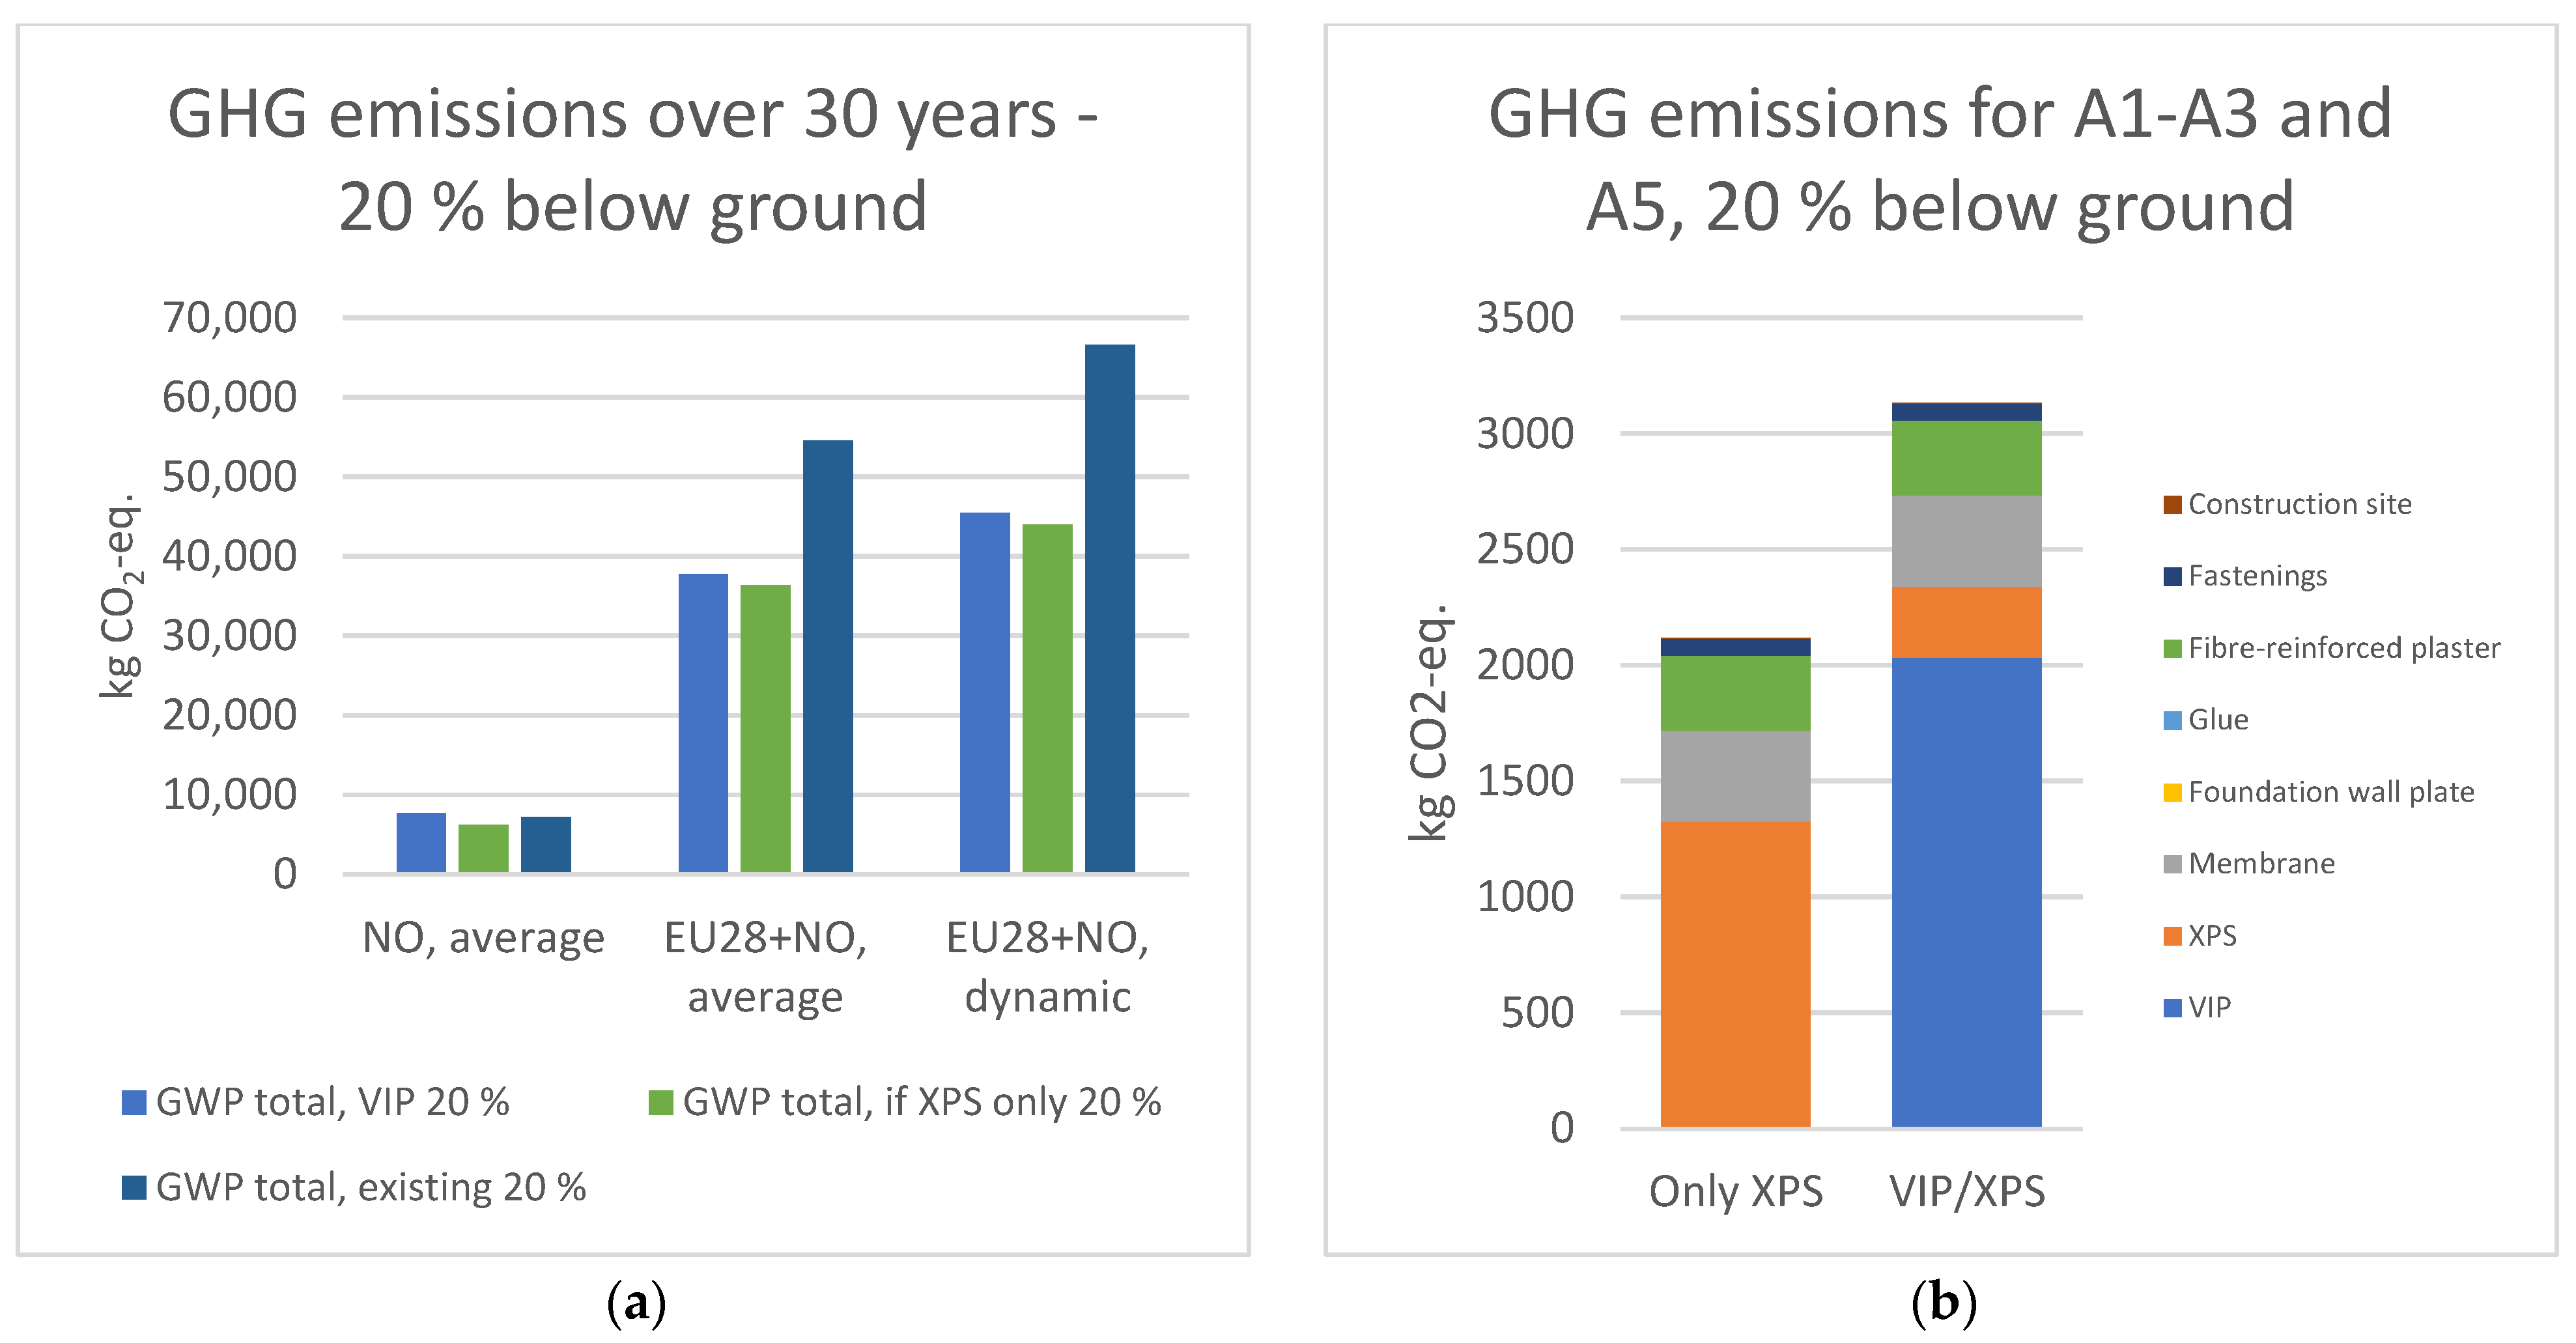
Figure 6a,b show the results for a scenario with 20% of the wall below the ground, accumulated over 30 years. The reason for selecting 20%, is that this will be the scenario with the highest carbon footprint, as it has the highest amount of VIP. The first figure shows the accumulated carbon footprint for the three different alternatives (no upgrade, only XPS and VIP/XPS) with three different electricity scenarios. The results show that in all cases the VIP/XPS upgrade has a slightly higher carbon footprint than the upgrade with only XPS. Only with the Norwegian electricity scenario does no upgrade perform better than upgrades, here the VIP/XPS has a ca. 7% higher carbon footprint than no upgrade. This shows that when the energy grid has a very low emission intensity, the payback period of the carbon footprint for materials becomes longer. With the other two electricity scenarios, the upgrade alternatives outperform the no upgrade alternative. The difference between VIP/XPS and only XPS is ca. 3–4%, showing that the carbon footprint of materials is much less significant when the energy grid has a high carbon emission intensity. Figure 6b shows the carbon footprint for the materials (life cycle modules A1-A3) and construction (life cycle module A5). Here, the carbon footprint is 48% higher for the superinsulation alternative.
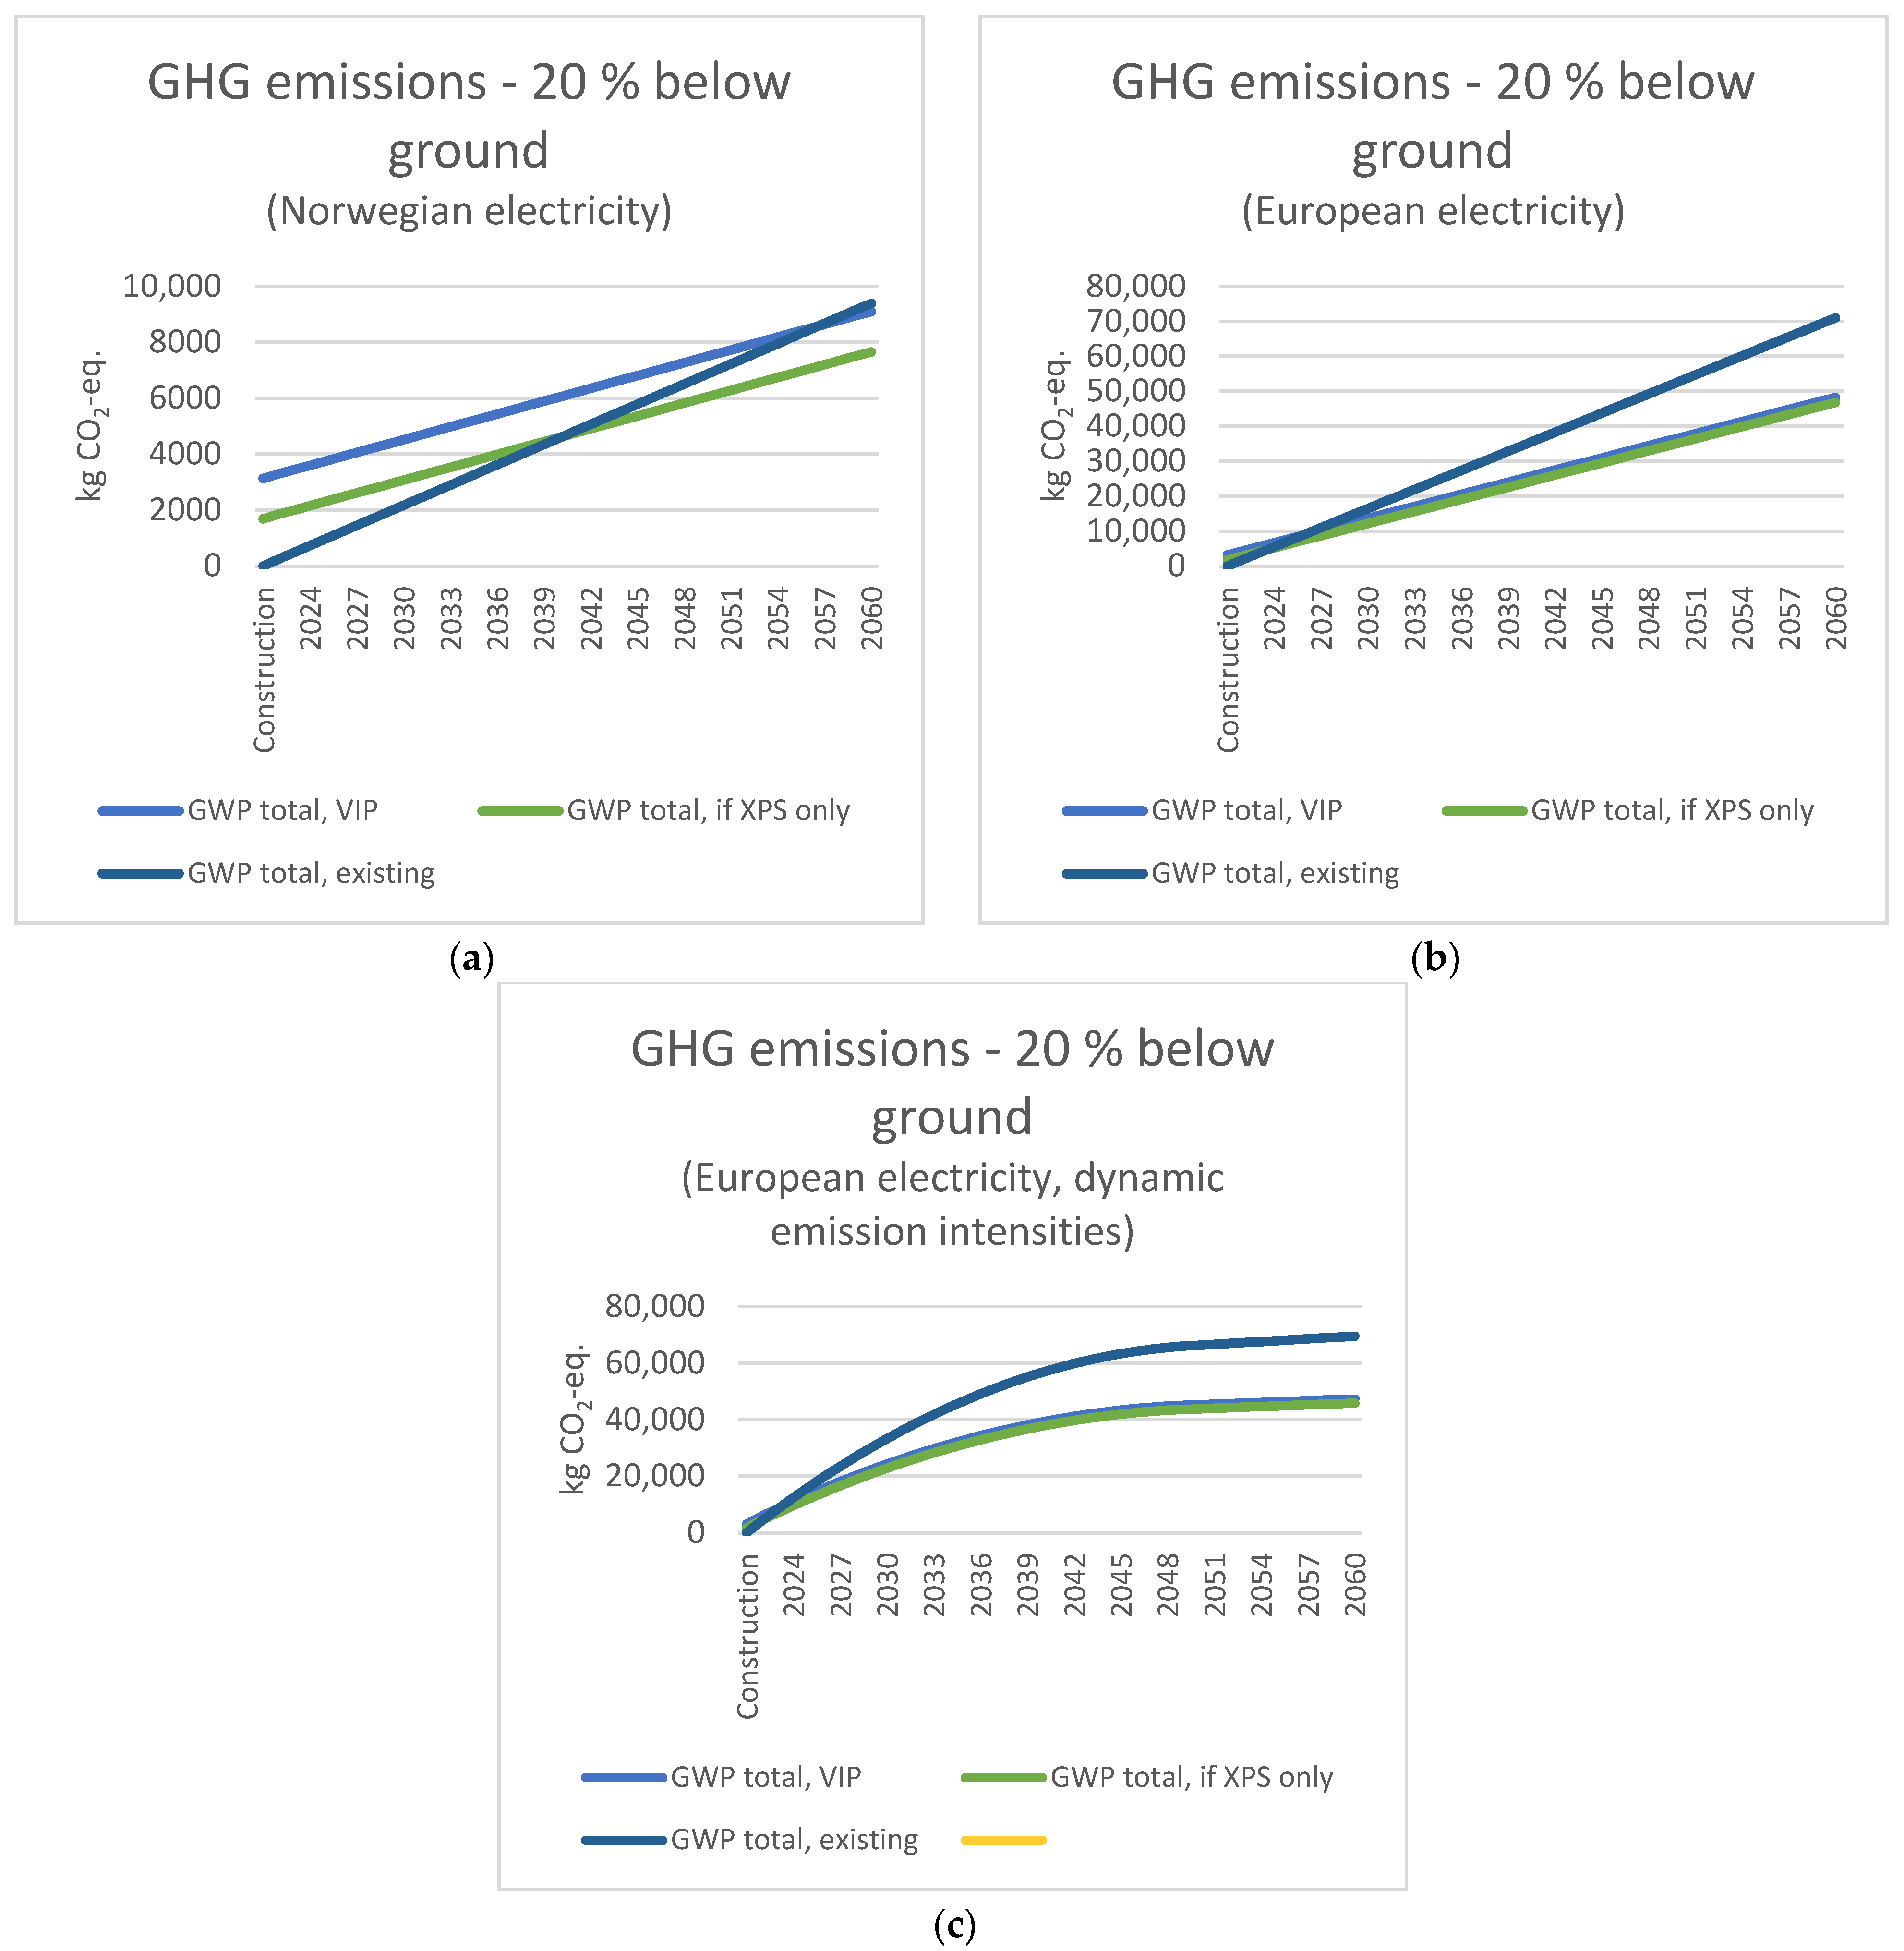
The previous figures show the accumulated carbon footprint over a period of 30 years. To understand how different methodological choices influence the results, it is useful to plot the results over time, as shown in Figure 7a–c. These figures show the carbon footprint payback time for the two alternative upgrades, for a scenario where 20% of the wall is below the ground. Figure 7 shows the results with Norwegian electricity mix. This choice of electricity mix has the longest payback period, with 18 years for the upgrade with only XPS and 35 years for the upgrade with VIP and XPS. Figure 7b shows the results with the European electricity mix, with a payback period of 2 and 4 years, respectively. Figure 7c shows the results with the European dynamic electricity mix. Here, the payback period is 1 year for both upgrade alternatives (ca. 6 months for only XPS and ca. 12 months for VIP and XPS). Choice of electricity mix significantly influences the results of the carbon footprint analysis.
The results show that energy upgrading of the basement will have a positive effect on the carbon footprint, but that the payback time is significantly influenced by the emission intensity of the electricity factor.

4.3. Costs

The cost calculations consist of an analysis of the investment costs for the two upgrading alternatives and a simplified life cycle cost for all three alternatives, with the energy cost for the existing basement and the investment cost and energy cost for the two upgrading alternatives. The results were initially calculated in NOK but are converted to Euro (1 Euro = 10.08 NOK [29]). The results distinguish between general costs and material specific costs (including labour specific for each of the insulation alternatives). The general cost is the same for both projects, covering rigging and operations (including digging and refilling). Figure 8a shows the investment cost for the two upgrading alternatives. Here, it is clear that the cost increases with how much of the basement is below the ground. This means that the increased cost of construction and operations outweigh the decreased cost for insulation that is due to less area above the ground. However, the difference in investment cost between the two alternatives (1a versus 1b, etc.) has the opposite trend, with the highest difference when most of the wall is above the ground. This ranges from 71% higher (for 20% below ground) to 23% higher (for 100% below ground).
The life cycle costs in a 30-year time perspective are calculated for four alternatives: no upgrading, upgrading with only XPS and upgrading with VIP and XPS. For the no upgrading alternative, there are two variants. The first is no upgrade at all. The second is that the drainage is improved, but that there is no energy upgrade (no insulation). The results are shown in Figure 8b. The results show that for the alternatives with no energy upgrade, the life cycle costs decrease in line with how much of the basement is below the ground. This is due to the reduced heat loss when more of the wall is below the ground, as the U-values are different above and below ground. For the alternatives with energy upgrading, the life cycle costs are almost the same regardless of how much of the wall is below the ground. This is because the insulation makes the U-values similar above and below ground. The trend is that the life cycle costs for VIP and XPS decrease slightly when more of the wall is below the ground and increase slightly for the alternative with only XPS. Both energy upgrades have the same energy consumption for the whole building. This means that the VIP and XPS upgrade always will have a higher life cycle cost, as it has a higher investment cost. The difference in life cycle cost is from 8% to 17% higher, with difference increasing with how much of the wall is above the ground.
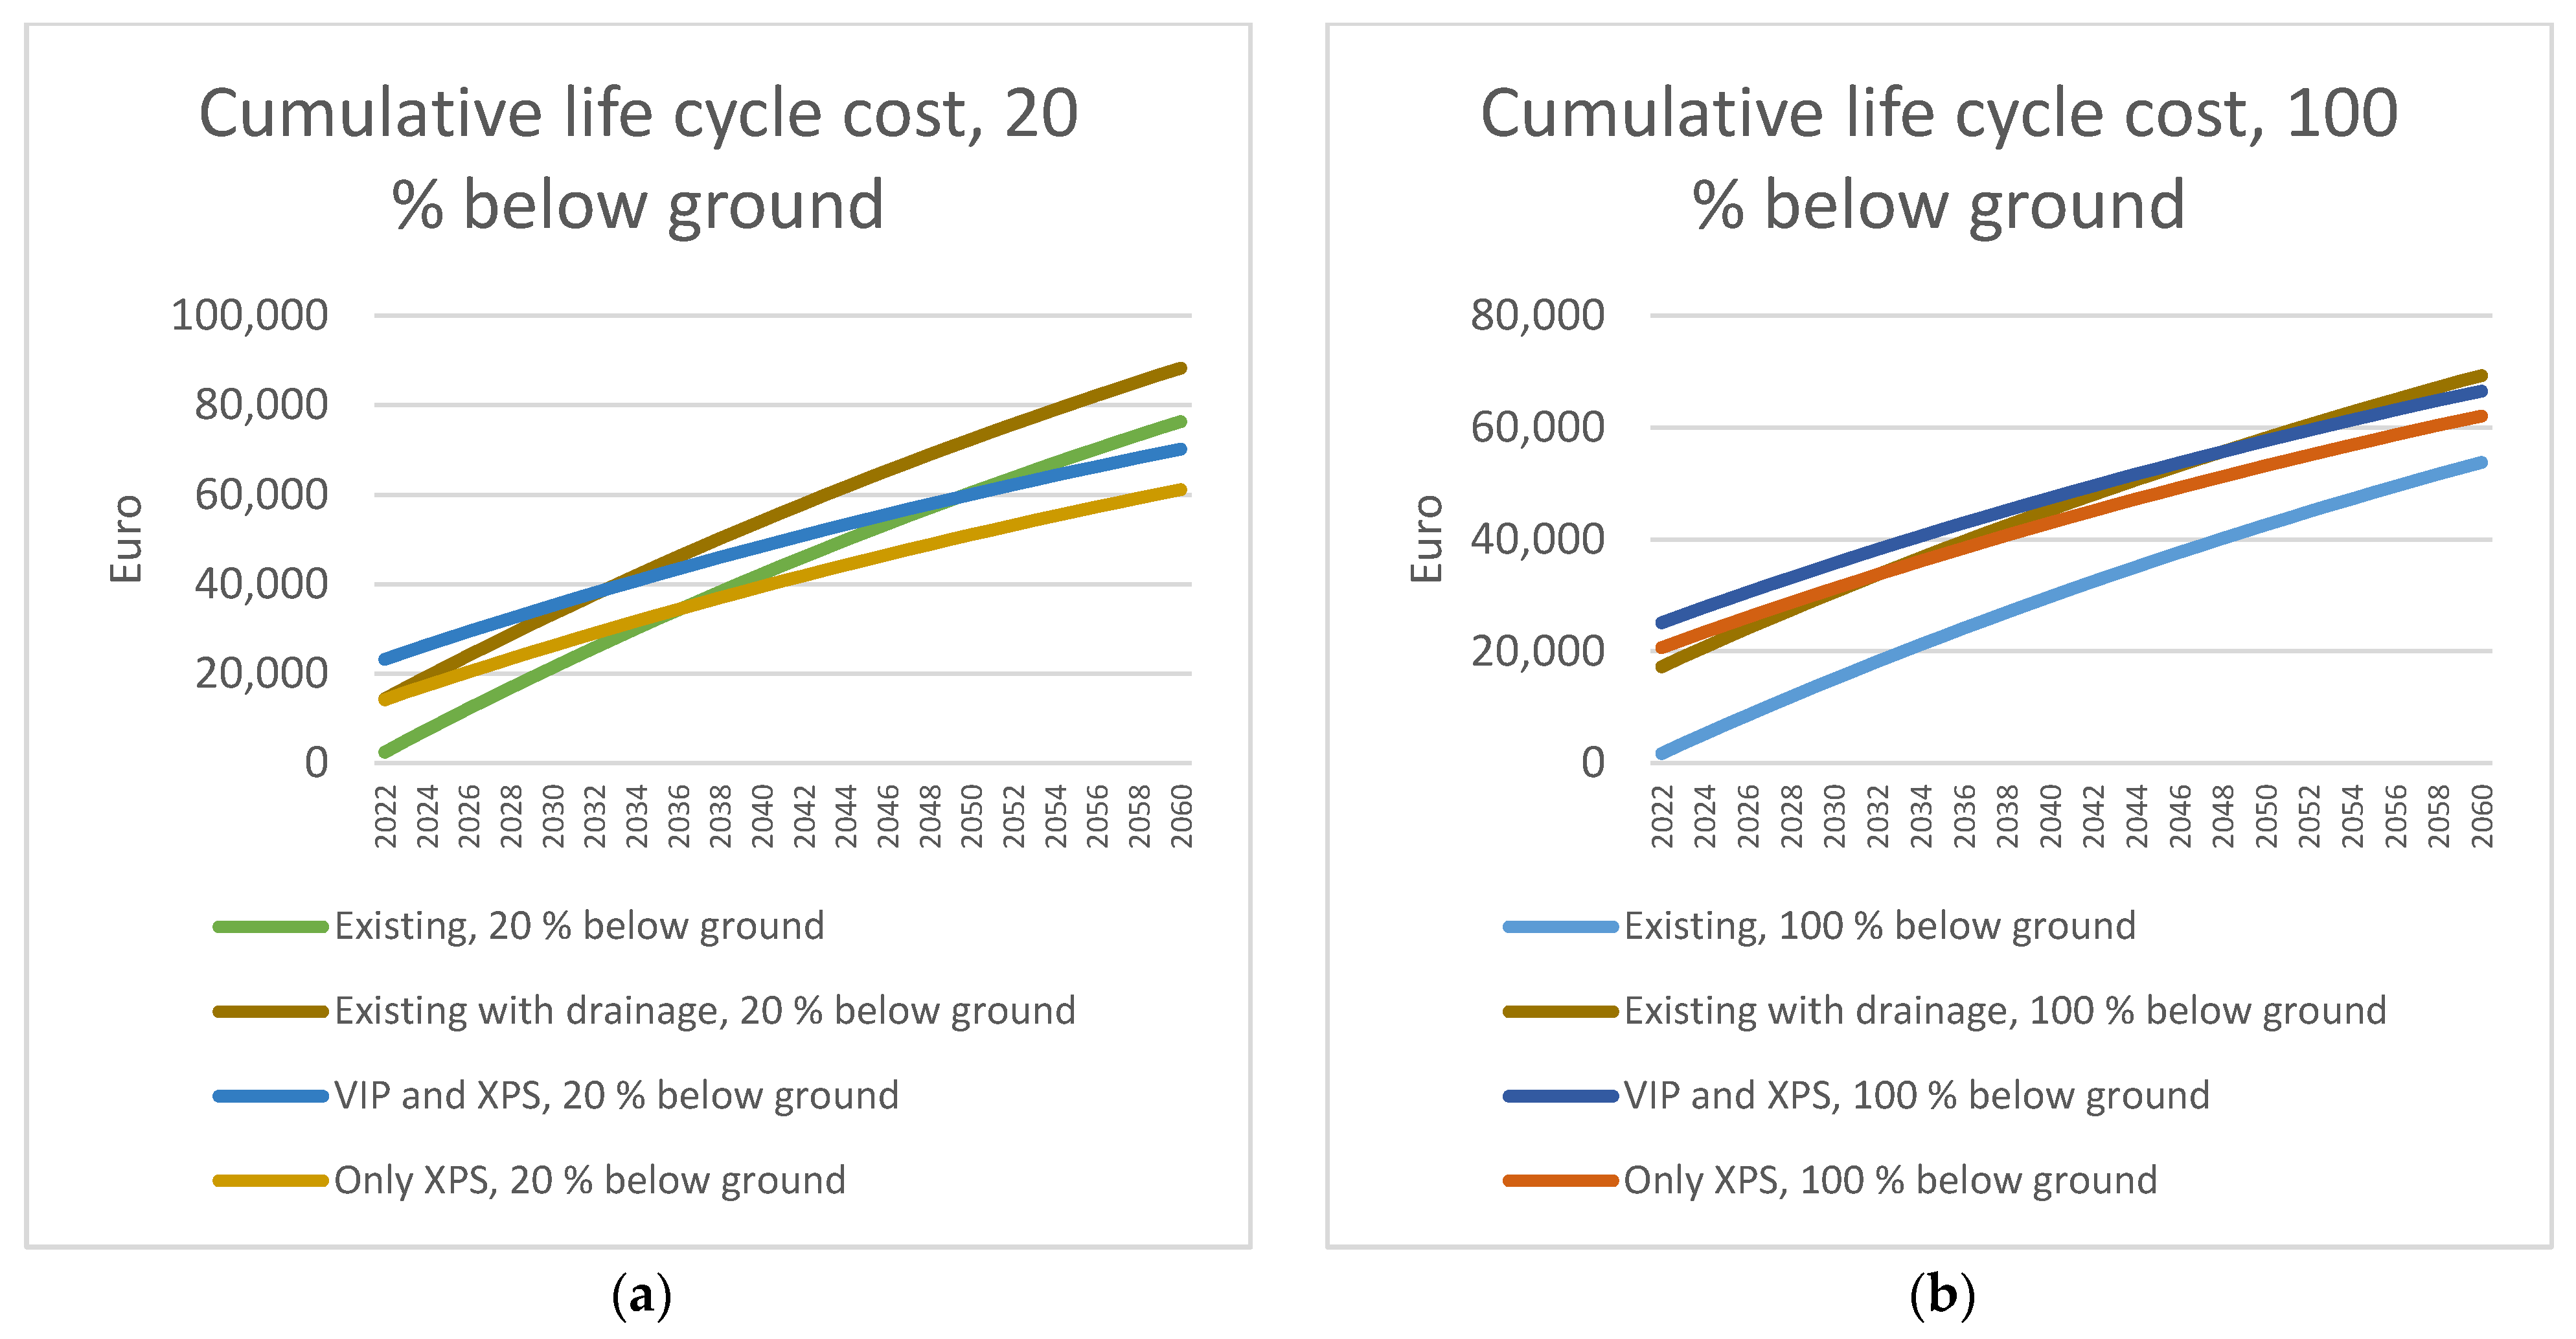
Figure 9a,b shows the cumulative life cycle costs over time for the alternative with 20% of the wall below the ground and for 100% below the ground. Here, we see that the life cycle costs are more competitive when less of the wall is below the ground, but that this difference disappears when 100% of the wall is below the ground. With 20% of the wall below the ground, the energy upgrade with only XPS has lower life cycle costs after 14 years, compared to no upgrade. For the energy upgrade with VIP and XPS, it takes 25 years. The least favourable alternative in the long run is draining without adding insulation. Here, the energy upgrade with XPS only is better after less than one year, and the VIP and XPS is better after 10 years. With 100% of the wall below the ground, the picture is different. The energy loss of the existing wall is significantly lower below the ground, which means that even in a 40-year period no upgrading will have lower life cycle costs. Additionally, here the least favourable alternative in the long run is draining without energy upgrading. Energy upgrading with only XPS will have lower life cycle costs after 9 years, and energy upgrading with VIP and XPS will have lower life cycle costs after 26 years.

4.4. Overall Discussion of Cases

Energy upgrading of basement exterior walls has an exclusively positive impact on the energy use of the building, which in all cases is reduced when additional insulation is added. For carbon footprint and cost it is a more mixed picture. The product and construction stages (A1–A3 and A5) will lead to both GHG emissions and costs, whereas the reduced energy consumption will lead to both reduced GHG emissions and reduced costs. For the carbon footprint, the three main parameters that influence the results are (i) the choice of time horizon, (ii) the choice of emission intensity for the electricity grid, and (iii) how much of the wall is below the ground. Lower carbon footprint and shorter time horizon will make no upgrade a more favourable option. The carbon footprint for the materials is significantly different between VIP/XPS and only XPS, but this is significant only when the emission intensity of electricity is low, and the time horizon is short. In most cases, the difference between the upgrade with VIP/XPS is only slightly higher than the energy upgrade with only XPS. This means that the carbon footprint of a an aesthetically more pleasing solution (a “good” solution) is in most cases insignificant.
For the cost analysis, the results are not as clear. The investment cost for the VIP/XPS upgrade is ca. 20–70% higher, depending on how much of the wall is below the ground (more above ground leads to a higher difference). In a 30-year perspective this difference is less important, and the difference between the VIP/XPS and only XPS is 8% to 17% higher. This is the economic cost of an aesthetically more pleasing solution. These results do not take into account the recent extreme fluctuations in cost for both construction materials and energy, and they depend on the assumption that these costs return to previous rates in the near future. Furthermore, the price estimates do not take into account potential future carbon costs for materials and energy [30]. Introduction of such measures could lead to shorter payback period.
This study compares VIP/XPS with only XPS, which that a novel technology that is not standardised in the market is compared with a well-established solution for energy upgrade. Technology development and increased adoption in the market are expected to reduce both the costs and the carbon footprint of the VIP/XPS solution, which will reduce the carbon and price gap between the two choices.

5. Conclusions

The results show that energy upgrades will in almost all cases lead to a reduced carbon footprint, and that the reduction correlates positively with how much of the wall is above the ground. The two most significant parameters for carbon footprint are emission intensity for the electricity and time horizon.
From an economic perspective, the life cycle costs over 30 years strongly depend on how much of the wall is above the ground. When only 20–40% of the basement wall is below the ground, the life cycle cost for the VIP/XPS upgrade will be almost the same as the life cycle cost of no upgrade (±3%), whereas the upgrade with only XPS will be 10–16% lower. When more than 40% of the wall is below the ground, the life cycle cost of upgrades will be higher compared to no upgrade due to the cost of excavation in the construction stage.
The least favourable option (“bad”) is to install a drainage system without doing an energy upgrade at the same time. This will not change the energy consumption but will lead to higher costs and higher carbon footprint. This is a likely outcome in cases where the basement drainage must be improved, but the homeowner will not accept a less aesthetically pleasing solution (“ugly”). Using VIP in combination with XPS to perform energy upgrade of a basement exterior wall may lead to an aesthetically more pleasing solution (“good”) than an upgrade with XPS only (“ugly”), as the basement will not protrude from the outer wall. Under such circumstances a VIP upgrade may be the best alternative.
The results correspond well with previous studies, which conclude that although VIP insulation has a high carbon footprint compared to other insulation materials, it can still be a desirable insulation product in specific applications [31]. The best choice of insulation material, especially for renovations, will always depend on the specific application, geographical location, and existing building geometry. Therefore, more studies on specific cases using an integrated approach will facilitate knowledge-based renovation solutions for energy upgrading of the building mass. A limitation of the approach used here, is that the environmental impact is limited to carbon footprint. Further research could be to address a broader range of environmental impact categories, to look into other applications of VIP at the building level, as well as to analyse the potential effect of carbon costs or carbon taxes on the life cycle cost and payback time.

Author Contributions

Conceptualization, C.S., J.-E.G., N.S.B. and M.S.; Formal analysis, C.S. and N.S.B.; Funding acquisition, M.S.; Investigation, C.S. and N.S.B.; Methodology, C.S. and J.-E.G.; Project administration, M.S.; Software, C.S., J.-E.G. and N.S.B.; Visualization, C.S. and J.-E.G.; Writing—original draft, C.S., J.-E.G., N.S.B. and M.S.; Writing—review and editing, C.S., J.-E.G., N.S.B. and M.S. All authors have read and agreed to the published version of the manuscript.

Funding

This research was funded by the Research Council of Norway under the large-scale programme for energy research (ENERGIX), project number 282389.

Data Availability Statement

Not applicable.

Acknowledgments

This research has received data from the research project OPPTRE, which is funded by ENERGIX, project number 280956. The authors would like to thank Bjørn S. von der Leyen from SINTEF Community for performing the calculations for investment costs and energy prices.

Conflicts of Interest

The authors declare no conflict of interest. The funders had no role in the design of the study; in the collection, analyses, or interpretation of data; in the writing of the manuscript; or in the decision to publish the results.

References

  1. Sandberg, N.H.; Næss, J.S.; Brattebø, H.; Andresen, I.; Gustavsen, A. Large Potentials for Energy Saving and Greenhouse Gas Emission Reductions from Large-Scale Deployment of Zero Emission Building Technologies in a National Building Stock. Energy Policy 2021, 152, 112114. [Google Scholar] [CrossRef]
  2. Fufa, S.M.; Flyen, C.; Venås, C. Grønt Er Ikke Bare En Farge: Bærekraftige Bygninger Eksisterer Allerede; SINTEF Akademisk Forlag: Oslo, Norway, 2020. [Google Scholar]
  3. NAK 527; OPPTRE—Kostnadseffektiv Energioppgradering Av Småhus i Tre. Norske arkitekters landsforbund: Oslo, Norway, 2020.
  4. Klöckner, C.A. A Comprehensive Model of the Psychology of Environmental Behaviour—A Meta-Analysis. Glob. Environ. Chang. 2013, 23, 1028–1038. [Google Scholar] [CrossRef] [Green Version]
  5. Klöckner, C.A.; Nayum, A. Specific Barriers and Drivers in Different Stages of Decision-Making about Energy Efficiency Upgrades in Private Homes. Front. Psychol. 2016, 7, 1362. [Google Scholar] [CrossRef] [PubMed] [Green Version]
  6. Roberts, M.; Allen, S.; Coley, D. Life Cycle Assessment in the Building Design Process—A Systematic Literature Review. Build. Environ. 2020, 185, 107274. [Google Scholar] [CrossRef]
  7. Selvig, E.; Enlid, E.; Næss, A.; Alfredsen, G.; Gobakken, L.R.; Sandland, K.M. Lavutslippsmaterialer i Bygg. Barrierer Og Muligheter. NIBIO Rapport 6(20); NIBIO: Ås, Norway, 2020. [Google Scholar]
  8. Jelle, B.P.; Gao, T.; Sandberg, L.I.C.; Tilset, B.G.; Grandcolas, M.; Gustavsen, A. Thermal Superinsulation for Building Applications—From Concepts to Experimental Investigations. Int. J. Struct. Anal. Des. 2014, 1, 8. [Google Scholar]
  9. Lakatos, Á. Novel Thermal Insulation Materials for Buildings. Energies 2022, 15, 6713. [Google Scholar] [CrossRef]
  10. Skaar, C.; Gaarder, J.E.; Sletnes, M. A Parametric Study of the Energy Performance and Carbon Footprint of Super-Insulation in Terrace Constructions. IOP Conf. Ser. Earth Environ. Sci. EES 2019, 352, 012024. [Google Scholar] [CrossRef]
  11. Alam, M.; Picco, M.; Resalati, S. Comparative Holistic Assessment of Using Vacuum Insulated Panels for Energy Retrofit of Office Buildings. Build. Environ. 2022, 214, 108934. [Google Scholar] [CrossRef]
  12. Resalati, S.; Okoroafor, T.; Henshall, P.; Simões, N.; Gonçalves, M.; Alam, M. Comparative Life Cycle Assessment of Different Vacuum Insulation Panel Core Materials Using a Cradle to Gate Approach. Build. Environ. 2021, 188, 107501. [Google Scholar] [CrossRef]
  13. Grazieschi, G.; Asdrubali, F.; Thomas, G. Embodied Energy and Carbon of Building Insulating Materials: A Critical Review. Clean. Environ. Syst. 2021, 2, 100032. [Google Scholar] [CrossRef]
  14. Wernery, J.; Mancebo, F.; Malfait, W.J.; O’Connor, M.; Jelle, B.P. The Economics of Thermal Superinsulation in Buildings. Energy Build. 2021, 253, 111506. [Google Scholar] [CrossRef]
  15. Biswas, K.; Patel, T.; Shrestha, S.; Smith, D.; Desjarlais, A. Whole Building Retrofit Using Vacuum Insulation Panels and Energy Performance Analysis. Energy Build. 2019, 203, 109430. [Google Scholar] [CrossRef]
  16. Qu, K.; Chen, X.; Wang, Y.; Calautit, J.; Riffat, S.; Cui, X. Comprehensive Energy, Economic and Thermal Comfort Assessments for the Passive Energy Retrofit of Historical Buildings—A Case Study of a Late Nineteenth-Century Victorian House Renovation in the UK. Energy 2021, 220, 119646. [Google Scholar] [CrossRef]
  17. SIMIEN. Available online: https://simien.no/ (accessed on 4 October 2022).
  18. NS 3031:2014; Beregning av Bygningers Energiytelse: Metode og Data = Calculation of Energy Performance of Buildings: Method and Data. Standard Norge: Lysaker, Norway, 2014.
  19. NS-EN ISO 13370:2017; Thermal Performance of Buildings—Heat Transfer via the Ground—Calculation Methods. Standard Norge: Lysaker, Norway, 2017.
  20. NS 3720:2018; Metode for Klimagassberegninger for Bygninger. Standard Norge: Lysaker, Norway, 2018.
  21. NS-EN 15804:2012+A2:2019; Sustainability of Construction Works—Environmental Product Declarations—Core Rules for the Product Category of Construction Products. Standard Norge: Lysaker, Norway, 2019.
  22. Petrovic, B.; Myhren, J.A.; Zhang, X.; Wallhagen, M.; Eriksson, O. Life Cycle Assessment of a Wooden Single-Family House in Sweden. Appl. Energy 2019, 251, 113253. [Google Scholar] [CrossRef]
  23. Wiik, M.R.K.; Selvig, E.; Fuglseth, M.S.; Lausselet, C.; Resch, E.; Andresen, I.; Brattebø, H.; Hahn, U. GHG Emission Requirements and Benchmark Values in Norwegian Building Codes. IOP Conf. Ser. Earth Environ. Sci. EES 2020, 588, 8. [Google Scholar] [CrossRef]
  24. Andresen, I.; Resch, E.; Wiik, M.R.K.; Selvig, E.; Stoknes, S.; Andresen, I.; Wiik, M.R.K.; Fufa, S.M.; Gustavsen, A. NOTAT FutureBuilt ZERO—Kriterier, Regneregler og Dokumentasjonskrav The Norwegian ZEB Definition and Lessons Learnt from Nine Pilot Zero Emission Building Projects; IOP Conference Series: Earth and Environmental Science (EES); FutureBuilt: Oslo, Norway, 2020; p. 10. [Google Scholar]
  25. Norsk Prisbok. Available online: https://www.norskprisbok.no/Home.aspx (accessed on 14 October 2022).
  26. NS 3031:2014; Beregning av Bygningers Energiytelse—Metode og Data. Standard Norge: Lysaker, Norway, 2014.
  27. Köppen, W. Das geographische System der Klimate; Gebrüder Borntraeger: Berlin, Germany, 1936. [Google Scholar]
  28. Sunikka-Blank, M.; Galvin, R. Introducing the Prebound Effect: The Gap between Performance and Actual Energy Consumption. Build. Res. Inf. 2012, 40, 260–273. [Google Scholar] [CrossRef]
  29. Valutakurser Og Renter—DNB. Available online: https://www.dnb.no/bedrift/markets/valuta-renter/valutakurser-og-renter/HistoriskeValutakurser/Hovedvalutaer-mndogor/Hovedvalutaer-mndogor.html (accessed on 5 December 2022).
  30. Royapoor, M.; Du, H.; Wade, N.; Goldstein, M.; Roskilly, T.; Taylor, P.; Walker, S. Carbon Mitigation Unit Costs of Building Retrofits and the Scope for Carbon Tax, a Case Study. Energy Build. 2019, 203, 109415. [Google Scholar] [CrossRef]
  31. Rabani, M.; Madessa, H.B.; Ljungström, M.; Aamodt, L.; Løvvold, S.; Nord, N. Life Cycle Analysis of GHG Emissions from the Building Retrofitting: The Case of a Norwegian Office Building. Build. Environ. 2021, 204, 108159. [Google Scholar] [CrossRef]
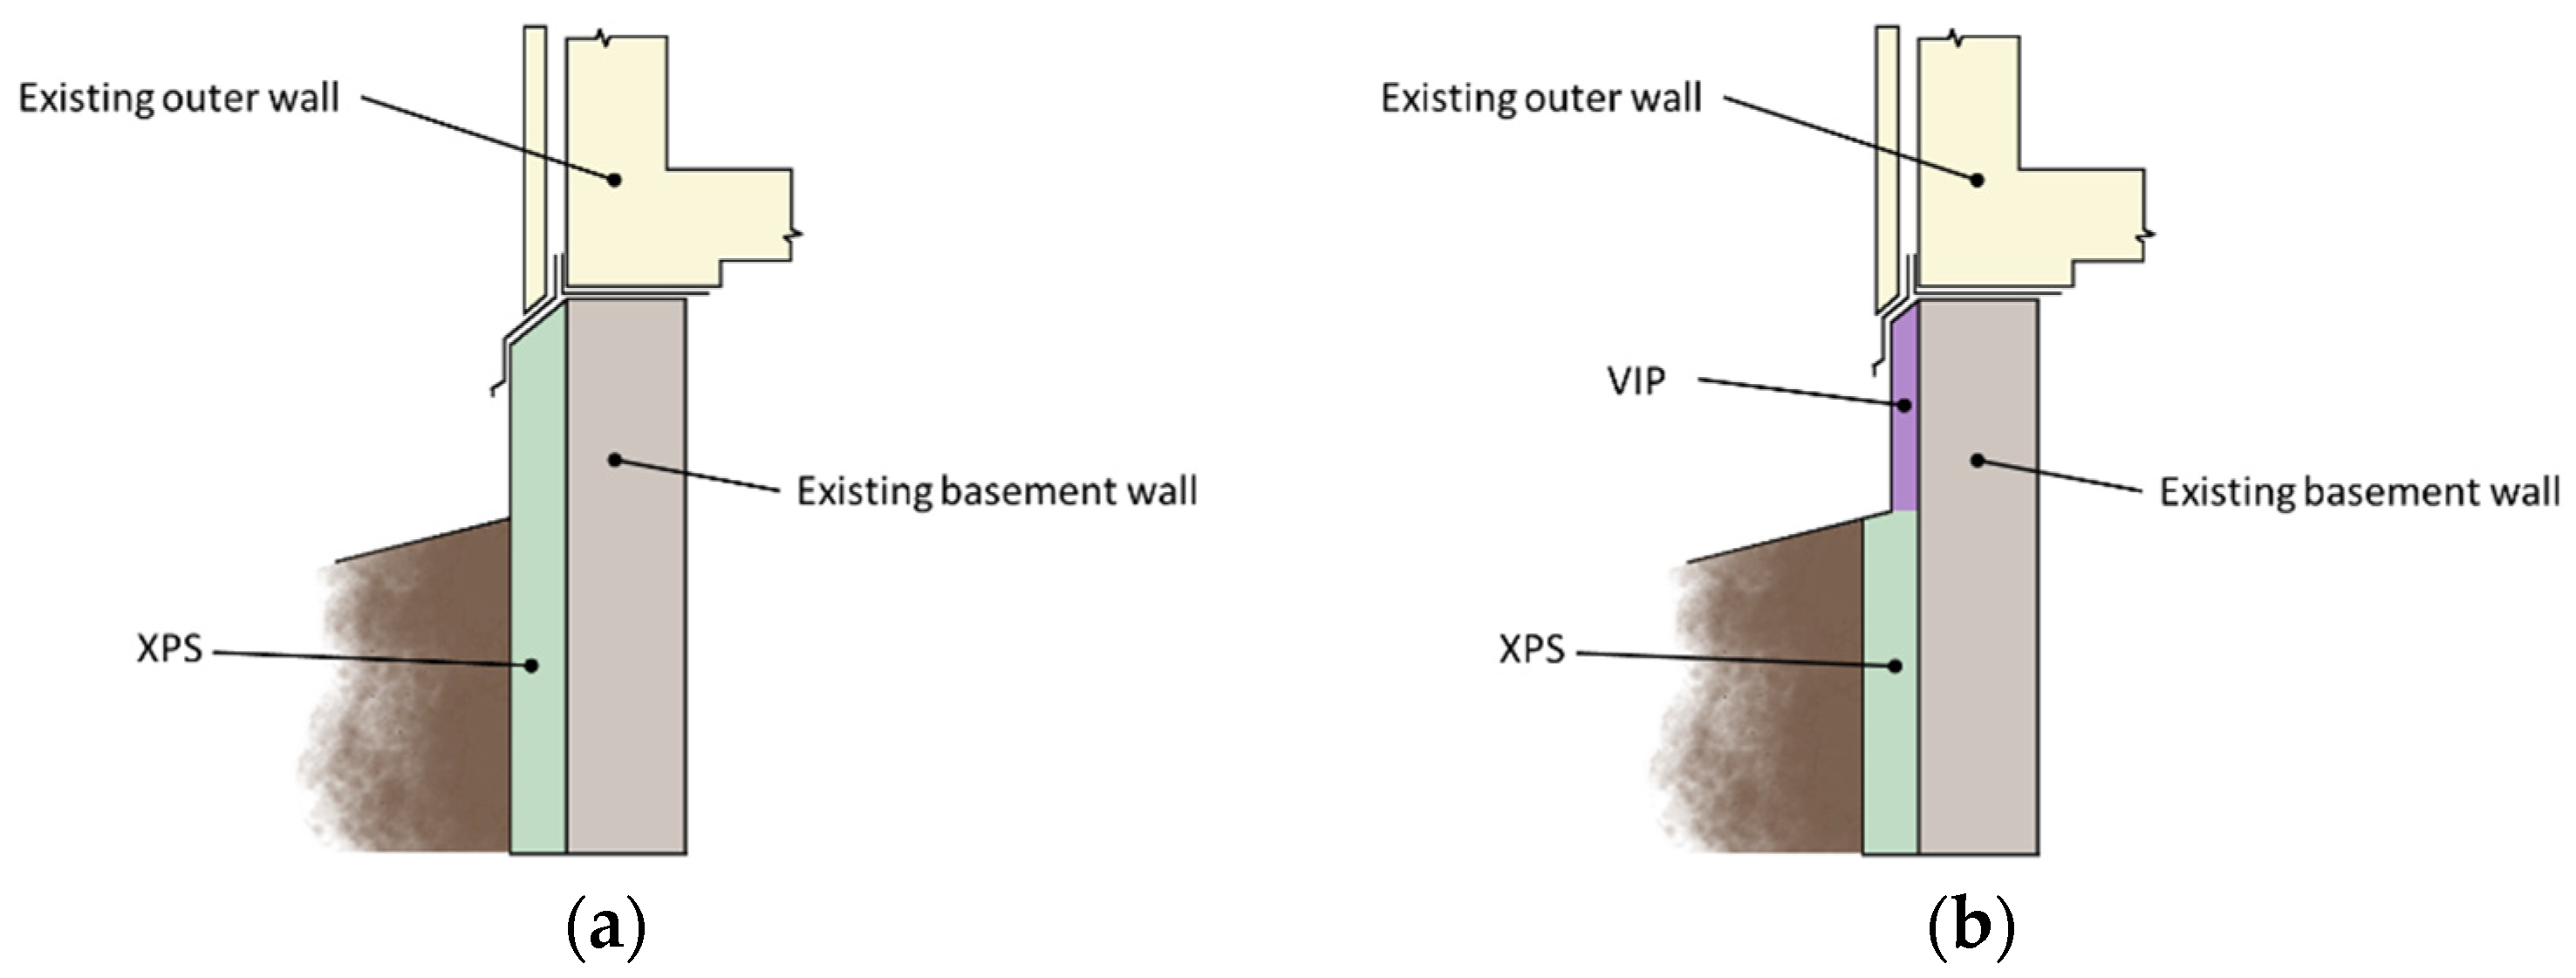
Figure 1. Basement details illustrating the difference between (a) ordinary insulation and (b) superinsulation. With the ordinary insulation, the insulation will protrude from the wall and change the look of the building.
Buildings 13 00133 g001
Figure 2. Life cycle modules based on NS3720 and EN15804.
Buildings 13 00133 g002
Figure 3. The two OPPTRE case studies [3]: (a) Malvik 1989 by Pir II; (b) Sandefjord 1972 by Hans Hus Arkitekter.
Buildings 13 00133 g003
Figure 4. Difference in energy loss for basement with concrete and light-weight aggregate walls, compared to no upgrade.
Buildings 13 00133 g004
Figure 5. Accumulated GHG emissions over 30 years for three different electricity scenarios: (a) the existing basement; (b) an upgrade with only XPS; (c) an upgrade with superinsulation (VIP above ground and XPS below ground). Percentages indicate how much of the wall is below the ground.
Buildings 13 00133 g005
Figure 6. (a) Accumulated GHG emissions over 30 years for three different electricity scenarios, with 20% of the wall below the ground; (b) GHG emissions for materials and construction (life cycle modules A1–3 and A5), with 20% of the wall below the ground.
Buildings 13 00133 g006
Figure 7. (a) GHG emissions for light-weight aggregate wall, Norwegian electricity mix (18 g CO2-eq. per kWh); (b) GHG emissions for light-weight aggregate wall, European electricity mix (136 g CO2-eq. per kWh); (c) GHG emissions for light-weight aggregate wall, European dynamic emission intensity (starting at 318 g CO2-eq. per kWh in 2022 and declining to 24 g CO2-eq. per kWh from 2050 and onwards).
Buildings 13 00133 g007
Figure 8. (a) The cost of upgrading with VIP and XPS versus upgrading with only XPS. Values in Eruo. Basement wall height is 240 cm, where 30 cm are always above ground. Percentages refer to how much of the remaining 210 cm are below the ground; (b) the cumulative life cycle cost for four alternatives (no upgrade, only drainage, upgrade with VIP and XPS, and upgrade with only XPS). Values in Euro.
Buildings 13 00133 g008
Figure 9. (a) The cumulative life cycle cost for four alternatives with 20% of the basement below ground (no upgrade, only drainage, upgrade with VIP and XPS, and upgrade with only XPS). Values in Euro; (b) The cumulative life cycle cost for four alternatives with 100% of the wall below the ground (no upgrade, only drainage, upgrade with VIP and XPS, and upgrade with only XPS). Values in Euro.
Buildings 13 00133 g009
Table 1. Material parameters and U-values of existing and retrofit wall construction. LWA = light weight aggregate.
ElementMaterialThicknessλU-Value
mW/mKW/m2K
Existing wall construction
(two alternatives)
Concrete (uninsulated)0.22.03.704
LWA (uninsulated)0.250.20.704
Retrofit wall construction
(two alternatives)
Concrete + VIP/Concrete + XPS0.22/0.3-0.32
LWA + VIP/LWA + XPS0.27/0.35-0.25
Existing floor construction
(same for both alternatives)
Concrete and XPS0.12.00.35
0.10.035
Table 2. Materials used for retrofitting.
Material/ProductThicknessλ
mmW/mK
VIP200.007
Waterproof membrane around VIP--
XPS 1000.035
Foundation wall plate--
Fastenings above ground--
Fastenings between XPS and VIP--
Fibre-reinforced plaster10-
Glue5-
Table 3. U-values of basement walls used in the energy calculations, calculated according to NS-EN ISO 13370:2017 Thermal performance of buildings—heat transfer via the ground—calculation methods.
Concrete WallLight-Weight Aggregate Wall
Ratio of Lower Wall below Ground [%]Above GroundBelow GroundOriginal U-Value [W/m2K]New U-Value [W/m2K]Original U-Value [W/m2K]New U-Value [W/m2K]
0%30 + 210 = 240 cm0 cm3.700.220.7040.175
20%30 + 168 = 198 cm42 cm2.140.2000.5920.16
40%30 + 126 = 156 cm84 cm1.600.1910.5310.154
60%30 + 84 = 114 cm126 cm1.310.1830.4830.148
80%30 + 42 = 72 cm168 cm1.120.1750.4450.143
100%30 + 0 = 30 cm210 cm0.9820.1690.4130.138
Table 4. Information about the two residential case buildings from OPPTRE.
Case Building 1—Malvik 1989Case Building 2—Sandefjord 1972
Year of construction1989 (1)1972
Heated gross internal area274 m2192 m2
Number of floors2 + basement1 + basement
Basement Heated + unheated partHeated (2)
Adjacent zone to basement wallsMainly basement walls above ground level. Parts of the heated space have borders to unheated space or towards ground.All basement walls are partly below and partly above ground level.
Area of basement walls109 m2 (of which 16 m2 below ground level)91 m2 (of which 55 m2 below ground level)
U-value existing basement walls0.42 W/m2K0.46 W/m2K
U-value retrofit basement walls0.19 W/m2K0.20 W/m2K
(1) Extension/annex added in 2004. (2) Originally the basement was unheated and used for storage. It was later included in the heated living space.
Table 5. Energy consumption before and after upgrading.
ConstructionRatio of Wall below GroundEnergy Demand
ExistingRetrofitReduction
%(-)kWh/yrkWh/yr/m2kWh/yrkWh/yr/m2ΔE%
Concrete
ΔU = 3.38
200.279,1231030.29231120.269,89288.3
400.472,863948.78980116.963,88387.7
600.661,819804.98668112.953,15186.0
800.843,957572.48307108.235,65081.1
100113,926181.37905102.9602143.2
LWA
ΔU = 0.454
200.213,375174.28494110.6488136.5
400.412,653164.88298108.0435534.4
600.611,716152.68061105.0365531.2
800.810,622138.37792101.5283026.6
10019419122.6749697.6192320.4
Note: The m2 in the formula kWh/yr/m2 refers to the wall area inside the basement.
Table 6. Energy consumption before and after upgrading for the whole building for the OPPTRE cases.
Case BuildingEnergy DemandΔEYearly Energy Demand Reduction for the Whole BuildingΔUΔE/ΔU
ExistingRetrofit
kWh/YearkWh/YearkWh/Year%W/m2K(kWh/Year)/(W/m2K)
148,27145,99422774.70.239939
245,07942,78322965.10.268789
Disclaimer/Publisher’s Note: The statements, opinions and data contained in all publications are solely those of the individual author(s) and contributor(s) and not of MDPI and/or the editor(s). MDPI and/or the editor(s) disclaim responsibility for any injury to people or property resulting from any ideas, methods, instructions or products referred to in the content.