Article

Numerical Analysis of Mechanical Behavior of Self-Centering Joint between CFDST Column and RC Beam

1
College of Civil Engineering, Fuzhou University, Fuzhou 350116, China
2
School of Civil Engineering, Fujian University of Technology, Fuzhou 350118, China
3
School of Ecological Environment and Urban Construction, Fujian University of Technology, Fuzhou 350118, China
*
Author to whom correspondence should be addressed.
Buildings 2023, 13(1), 135; https://doi.org/10.3390/buildings13010135
Submission received: 12 November 2022 / Revised: 15 December 2022 / Accepted: 28 December 2022 / Published: 4 January 2023
(This article belongs to the Special Issue Recent Advance in Steel and Composite Structures)

Abstract

:
The existing connection between the concrete-filled double steel tubular (CFDST) column and the reinforced concrete (RC) beam is difficult to repair and reuse after damage. In this paper, a self-centering joint between the CFDST column and the RC beam is proposed. The self-centering of the joint is realized by prestressed steel strands, and the energy dissipation is realized by friction. The overall purpose of the research is to analyze the influence of steel strand and friction on the mechanical behavior of the joint. By comparing the envelope curve and the restoring force model of a numerical joint model with theoretical values, accuracy of the numerical model was verified. Then, joints with different parameters, including the friction, prestress of steel strands, and ratio of the resisting moment provided by steel strands to the resisting moment provided by friction in the opening moment of joints, were numerically analyzed. The results showed that the joints with greater friction and prestress of steel strands had higher bearing capacity. Increasing the friction could increase the energy dissipation capacity of the joint, but it would increase the residual deformation of the joint. To reduce residual deformation, the prestress of steel strands should be increased. When the resultant force of the pretension of steel strands was greater than friction, the steel head could be kept pressed on the connecting block, making the stress changes of steel strands and the self-centering performance of the joint stable.

1. Introduction

The concrete-filled double steel tubular (CFDST) structure is a structure in which concrete is filled between inner and outer steel tubes. Compared with the concrete-filled steel tubular (CFT) structure, it has advantages of lighter self-weight, higher flexural rigidity, and better fire resistance [1,2]. Nowadays, joints composed of CFDST columns and frame beams have been widely studied and applied [3,4].
The mechanical behavior of joints between CFDST columns and RC beams under different loading conditions has been experimentally and theoretically studied by scholars, such as Zhang et al. [3,5]. In addition, the mechanical behavior and failure modes of joints between CFDST columns and steel beams have been studied [6,7,8,9,10,11,12]. Guo et al. [13,14] and Zhang et al. [15] conducted experiments and theoretical analysis on the seismic performance and failure mechanism of composite joints between CFDST columns and steel beams with RC slabs. From previous studies, it could be concluded that when the displacement of the RC beam end was large, concrete at the RC beam end (near the joint) in the connection between the CFDST column and the RC beam was severely crushed. When the CFDST column and the steel beam were connected by welding, the welded part was partially torn due to shearing [9]. Bolt slip occurred when the CFDST column and the steel beam were bolted together [6].
Therefore, no matter whether CFDST columns are connected with RC beams, steel beams, or steel beams with RC slabs, there is a possibility that the connection performance of joints will be severely degraded during large earthquakes. These types of joint failures lead to the decline of joint integrity and reliability. At the same time, the residual deformations of some of the joints mentioned above after a major earthquake reached 67% [5], 86% [8], and 61% [15], respectively. The excessive residual deformations will hinder the use of the structure. At present, there is little research on reducing the damage of the connection between CFDST column and beam and reducing the residual deformation of the joint. Therefore, it is necessary to take reasonable measures to alleviate the damages of connections between CFDST columns and frame beams and reduce their residual deformations after an earthquake.
The design of self-centering by prestressed steel strands and energy-dissipating by friction is a way to solve the above problems. Earthquake energy could be dissipated through friction to reduce structural damages [16,17]. The residual deformations of structures after an earthquake could be significantly reduced by self-centering design [18]. The combination of self-centering by steel strands and energy dissipation by friction allowed structures to achieve significant and reliable energy dissipation while maintaining the self-centering capability [19,20,21,22,23,24,25,26,27].
In this paper, a new type of joint between CFDST columns and RC beams with the self-centering capability and friction energy dissipation is proposed. For joints with self-centering by steel strands and energy dissipation by friction, the reasonable magnitude of prestress of steel strands, friction, and the ratio of the resisting moment provided by steel strands to the resisting moment provided by friction in the opening moment of the joint needs to be further studied. Therefore, numerical analysis of joints between CFDST columns and RC beams with different prestress of steel strands and friction was carried out through the finite element method. The load–displacement curves, envelope curves, stress variation curves of steel strands, and energy dissipation of joints were analyzed to evaluate the mechanical behavior of the joints. The results may provide a reference for the seismic design of self-centering structures between CFDST columns and frame beams and help the popularization and application of CFDST structures in seismic areas.

2. Joint Configurations and Working Mechanism

2.1. Joint Configurations

Figure 1a shows the self-centering joint between the CFDST column and the RC beam in this paper, which is mainly composed of a precast RC beam, CFDST columns, a steel seat, a connecting block, friction plates, steel strands, anchorages, and bolts. The CFDST column is welded with a flange plate at the end of the steel seat. Similarly, the steel seat is also welded with flange plates at both ends of its connection with the CFDST column. The CFDST column and the steel seat are connected by bolts. Figure 1b shows the joint details. For better understanding, Figure 1c shows the explosion of the joint.
The steel head is embedded in the end of the precast RC beam near the joint. One end of the longitudinal bars was welded on the steel head to transfer the force of the longitudinal bars to the steel head. Within the length of the part where the steel head was located inside the beam, the transverse reinforcement adopted a short length, and its two ends were welded to the inner side of the flange of the steel head.
Through the anchorages of prestressed steel strands, the connecting block is tightly pressed on the steel head. One side of the friction plate is welded with the connecting block as a whole, and the other side is compressed with the steel head through bolts. The steel head is provided with bolt sliding groove as the space for bolt sliding. The connecting block is connected with the steel seat by welding.
The specific construction process of this type of joint is as follows: when the component is prefabricated, the connecting block is pressed against the steel head of the prefabricated beam through the prestressed steel strands to form a prefabricated beam with prestressing. When the components are installed on site, the connecting block is connected to the outer steel tube of the CFDST column by welding. In this way, the prestress is transferred to the joint, making the joint self-centering. For friction energy dissipation, it is realized by presetting the friction plate on the contact surface between the connecting block and the steel head.

2.2. Working Mechanism

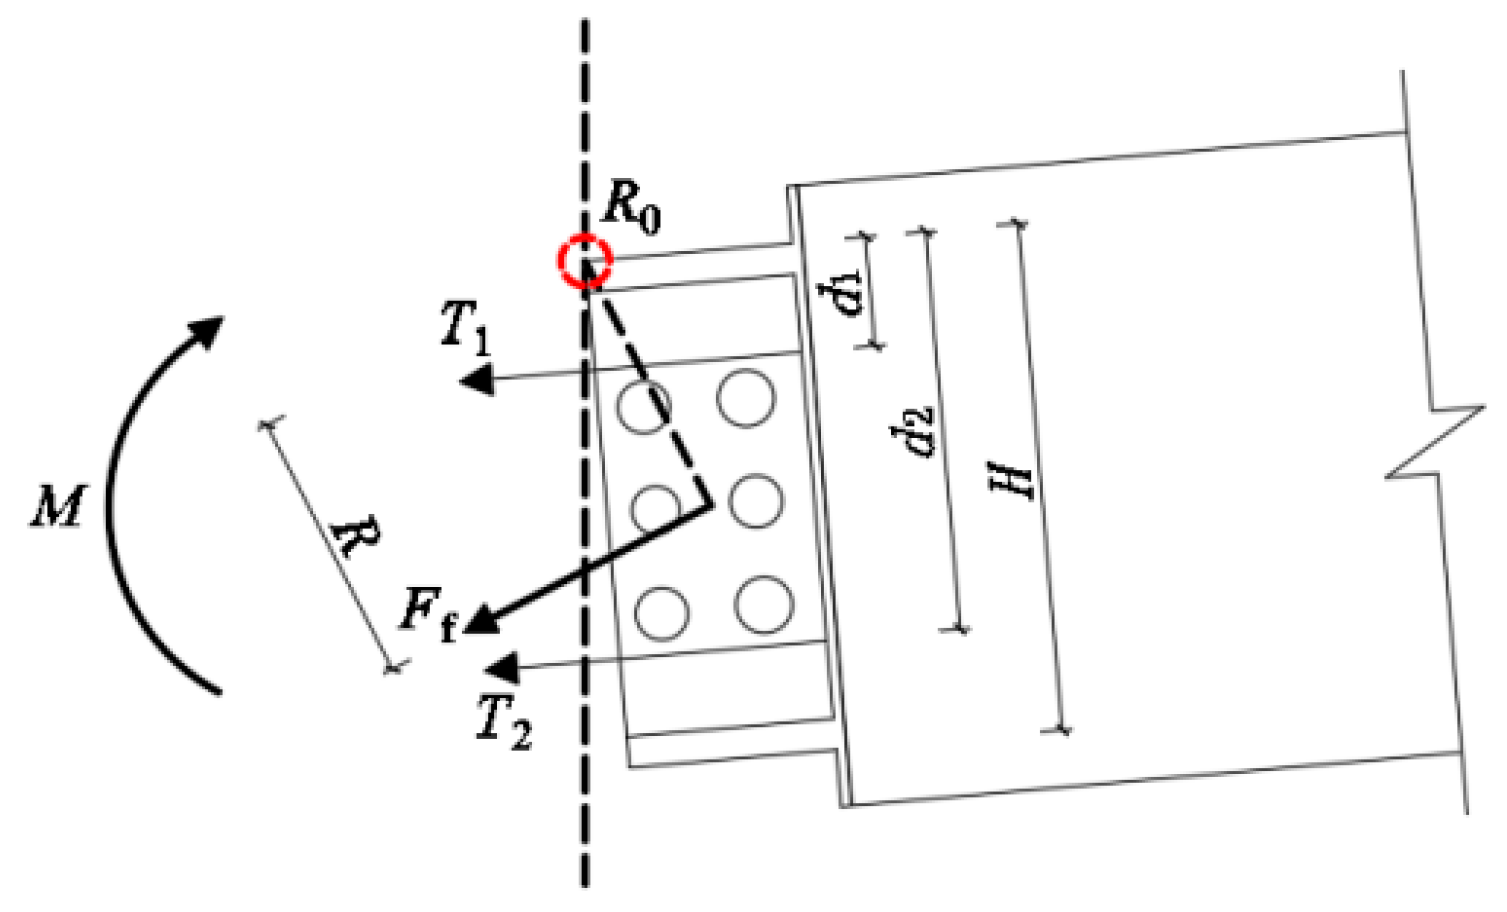
Under an earthquake, the contact surface between the steel head of the precast RC beam and the connecting block opens and closes alternately, driving the relative sliding between the friction plate and the steel head to realize energy dissipation in the form of friction. The bending moment of the joint is composed of the moment provided by tensile forces of steel strands and the moment provided by the friction. Considering the symmetry of the precast RC beam rotating clockwise and counterclockwise around the joint, the working mechanism is explained only by taking the counterclockwise rotation of the beam as an example, as shown in Figure 2.
where R0 is the rotation center, T1 and T2 are tensile forces of an upper and lower steel strand, respectively, Ff is the resultant force of friction of a friction surface, R is the distance from Ff to R0, d1 and d2 are the distance from T1 and T2 to R0, respectively, and H is the distance between the upper and lower rotation centers.
The total bending moment M of the joint can be expressed as:
M = M f + M T
where Mf is the resisting moment provided by friction, which hereinafter is called the friction moment for short; and MT is the resisting moment provided by tension of steel strands, which hereinafter is called the tensile moment for short.
When the friction plate starts sliding, the friction moment, Mf0, (two friction surfaces in total) can be expressed as:
M f 0 = 2 F f R
Considering that the magnitude of friction resultant remains unchanged during the relative rotation of the beam and the column, which equals Ff, and the force arm of Ff remains R, then the friction moment remains unchanged, as given in Equation (3):
M f = M f 0
When the steel head is not separated from the connecting block, the tensile moment MT0 can be expressed as:
M T 0 = T i 0 d i 0
When the steel head is separated from the connecting block, the relative rotation of the beam and the column is θ. Based on the joint rotation angle of 0.04 rad, sin(θ) ≈ θ, and cos(θ) ≈ 1, linear approximation shall be considered in the corresponding calculation of the joint. The elongation of steel strands is Δl = diθ, and the tensile increment of steel strand is ΔT = kidiθ, where ki = EA/L is the tensile stiffness of steel strands. At the same time, assuming that the distance, di, between the tension of steel strands and the rotation center remains the initial distance, di0, then MT can be expressed as:
M T = ( T i 0 + Δ T i ) d i = ( T i 0 d i 0 + k i d i 0 2 θ )
That is:
M T = M T 0 + k i d i 0 2 θ = M T 0 + K θ
where K = k i d i 0 2 is the rotational stiffness after the joint is opened, that is, the second stiffness.

3. Finite Element Model Developing

3.1. Modeling Parameters

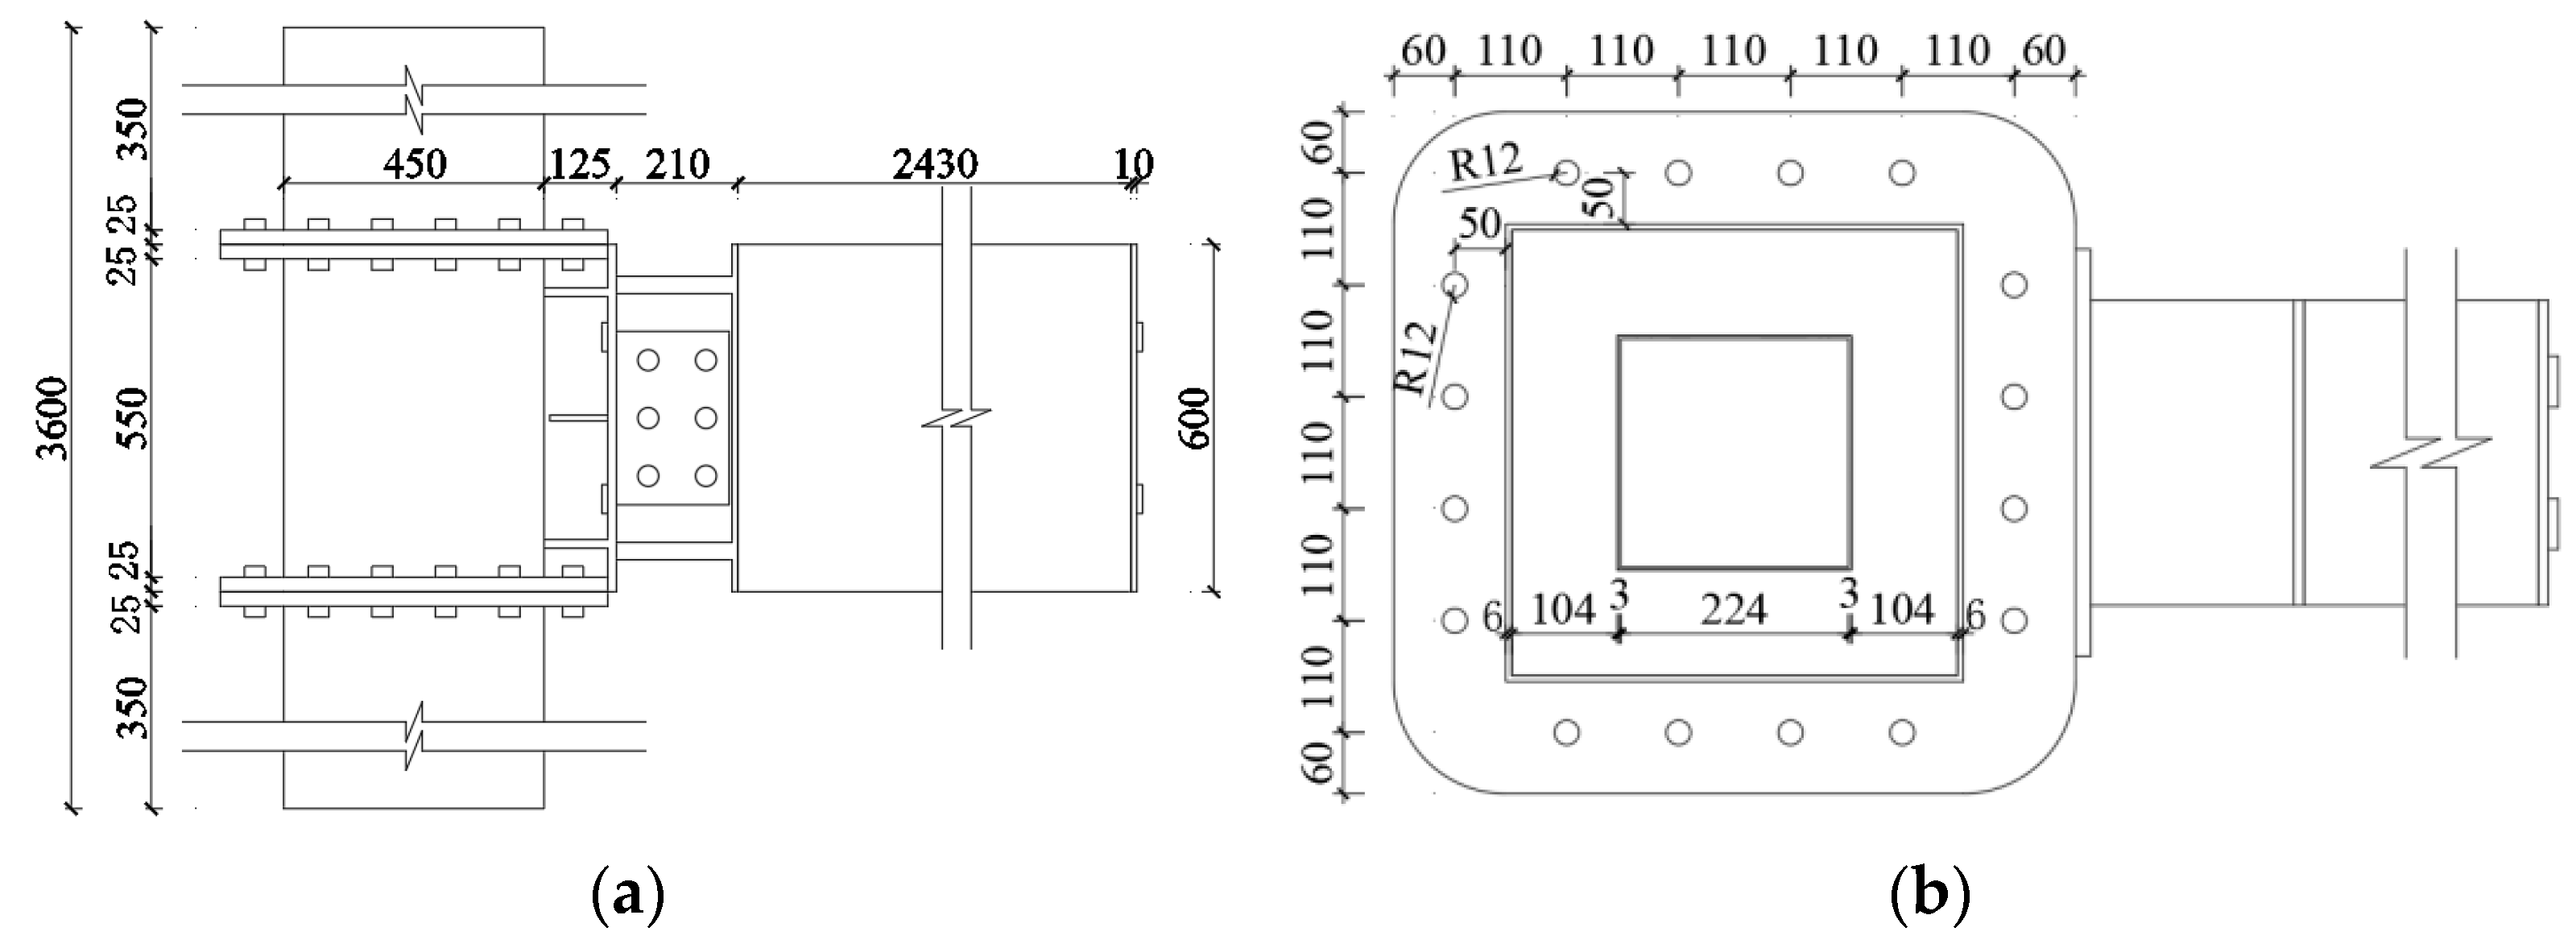
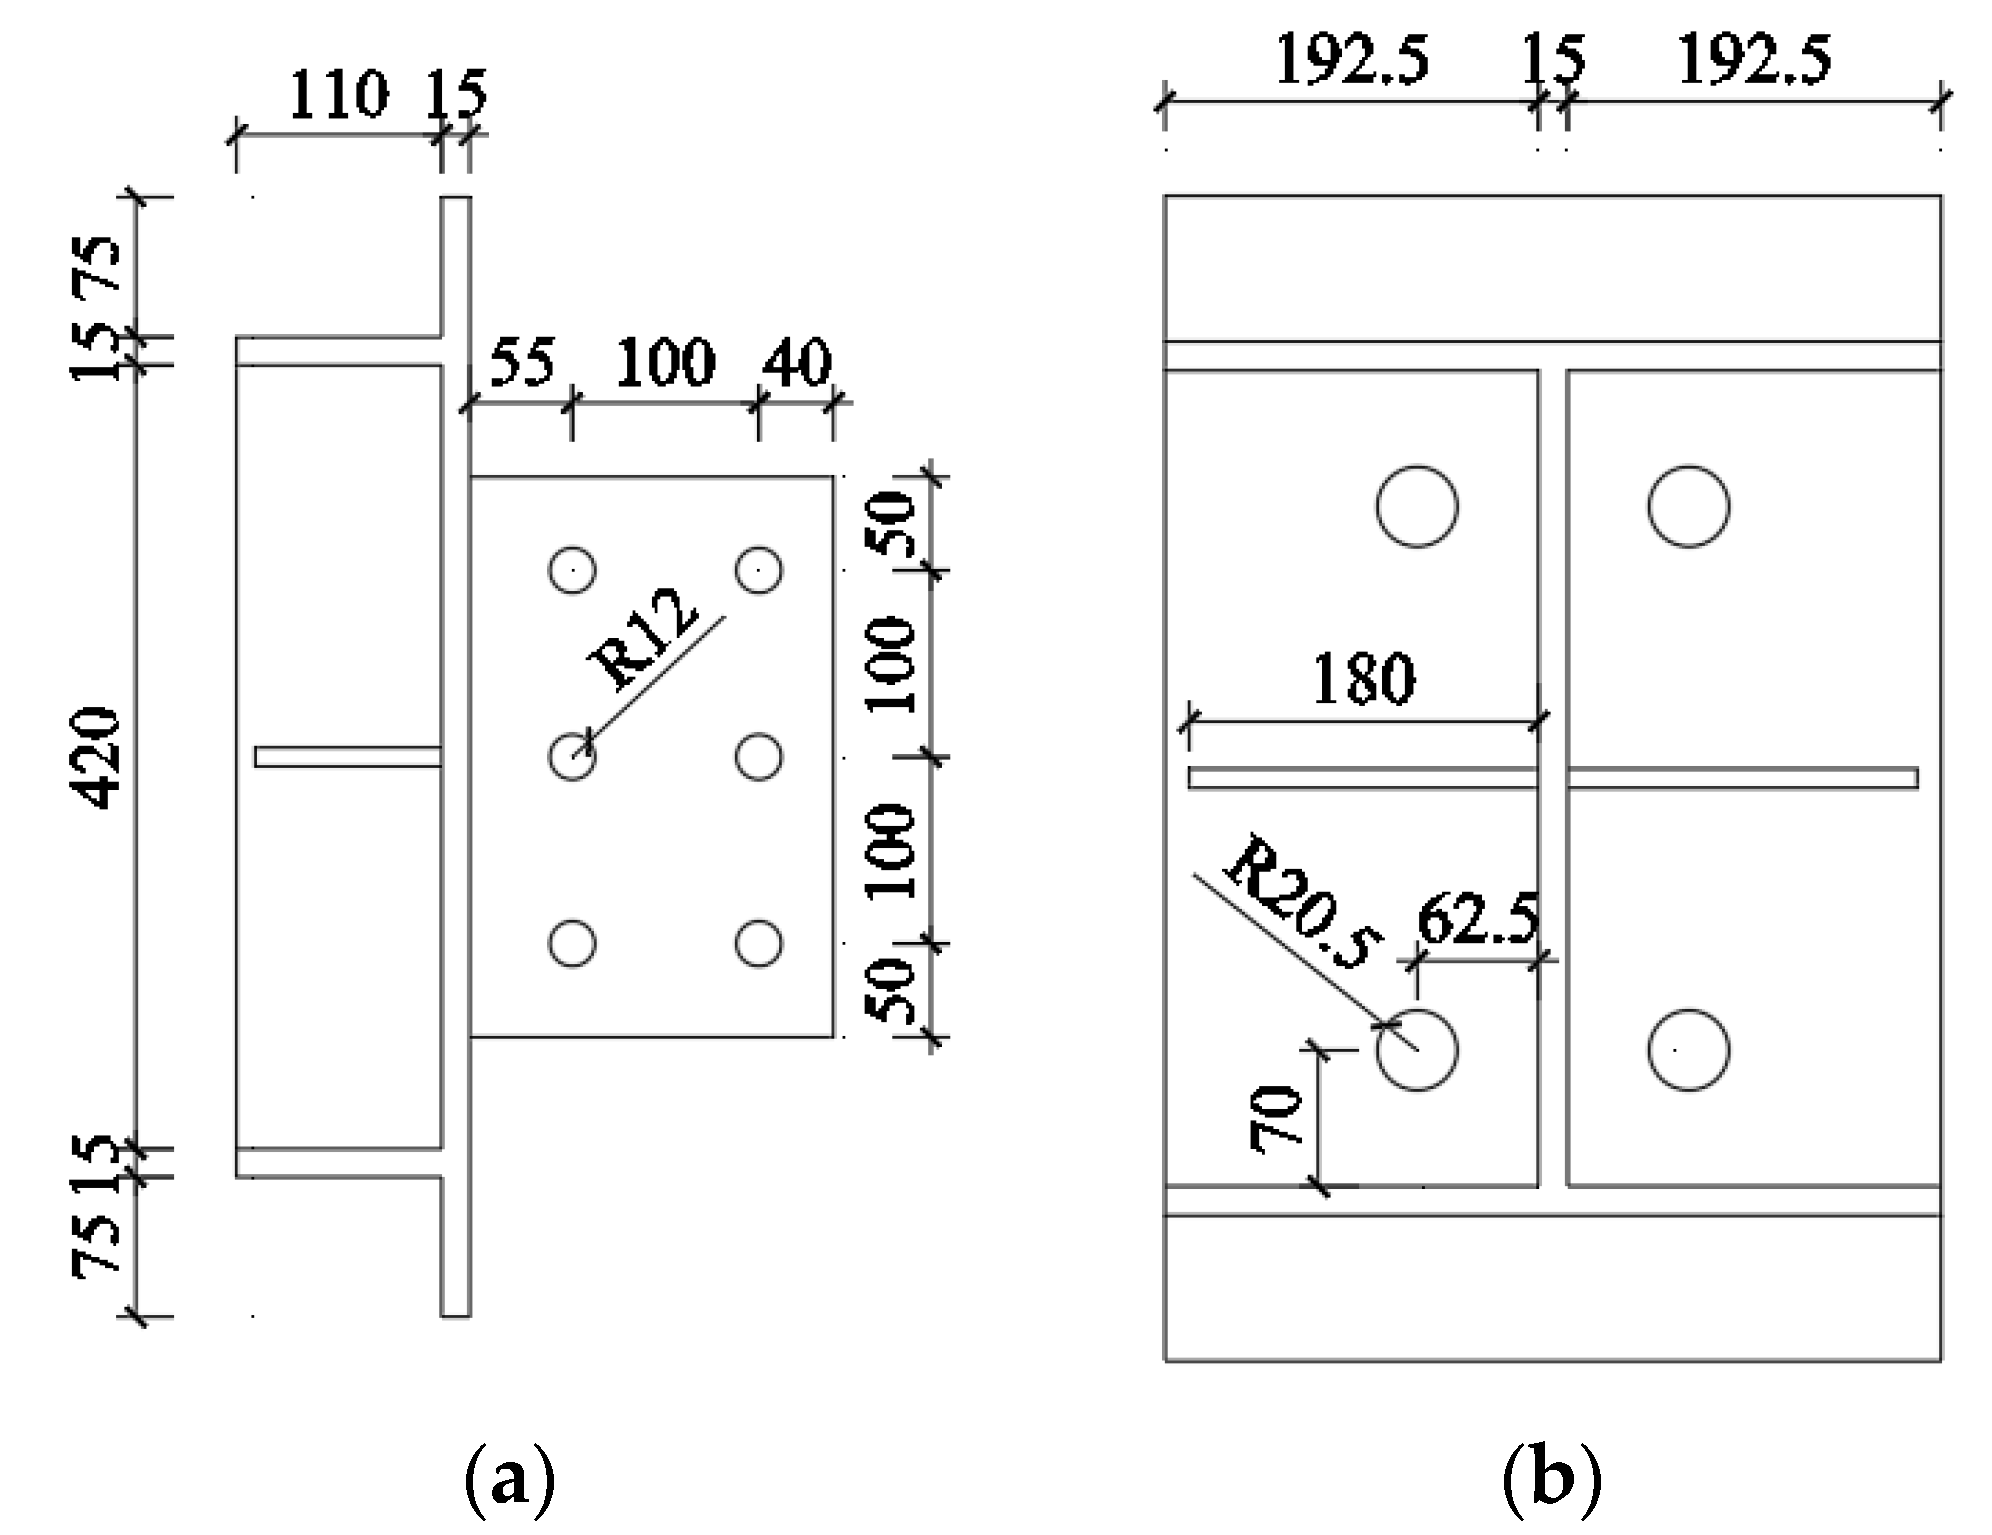
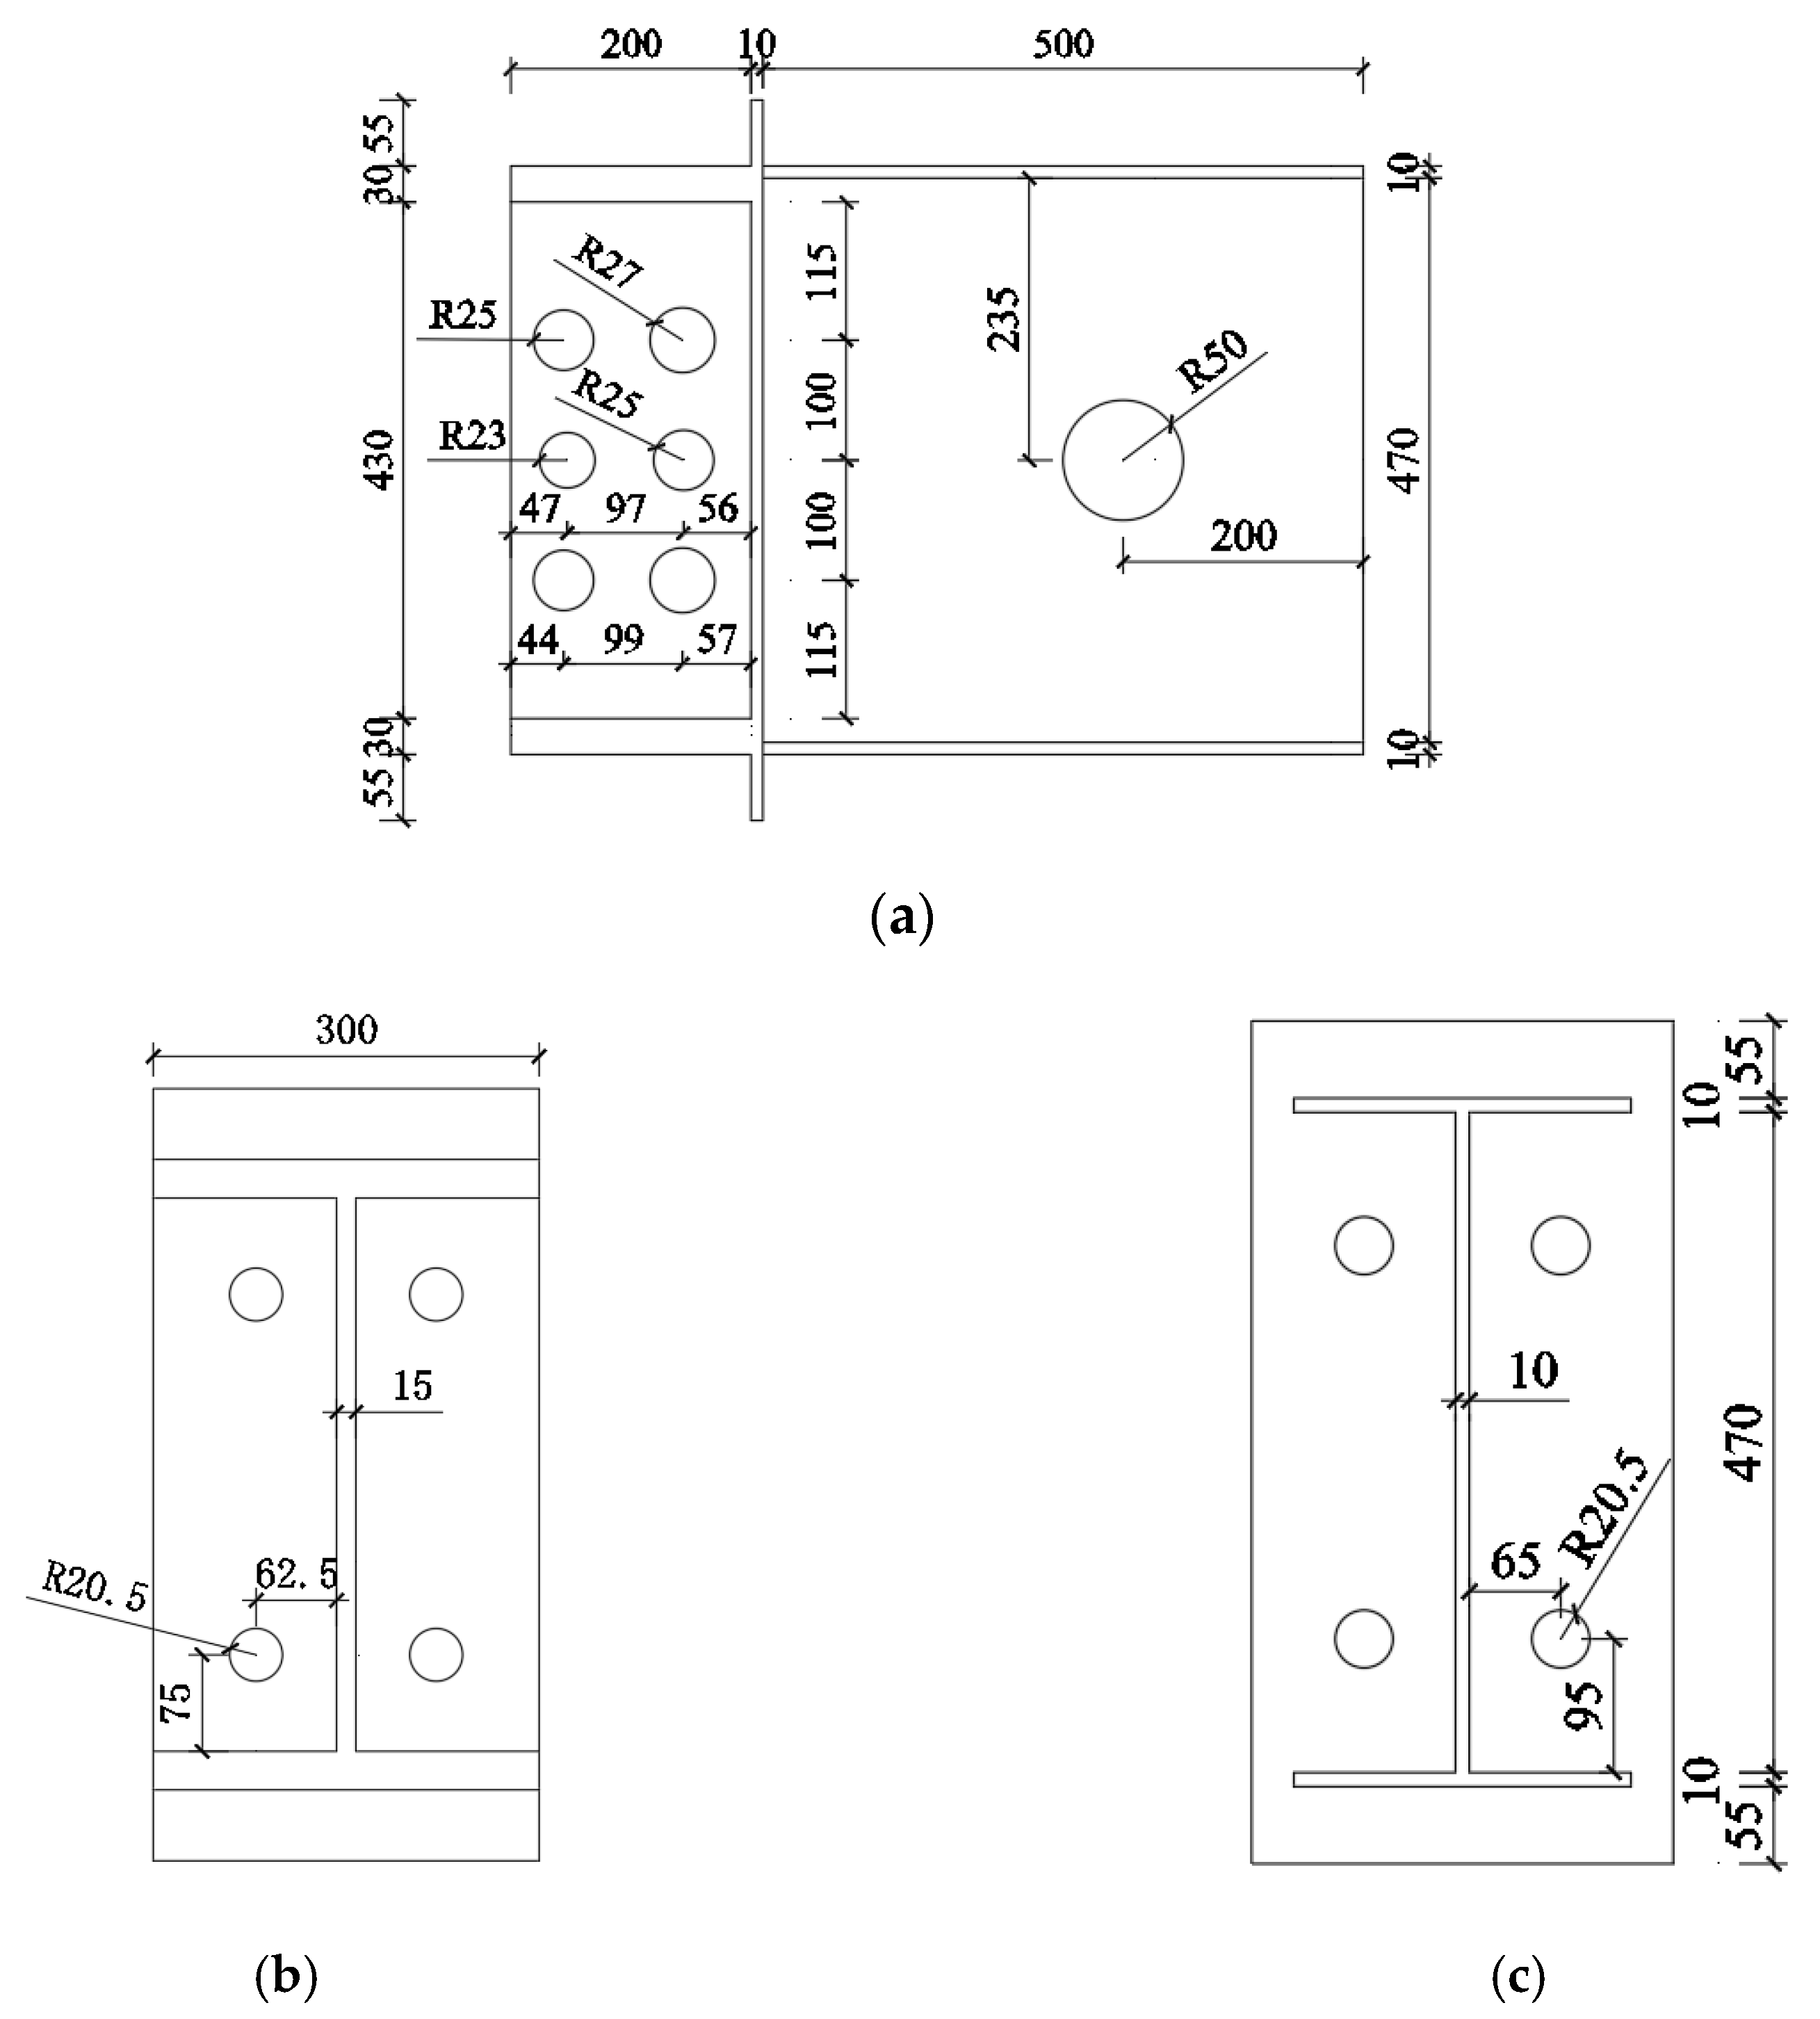
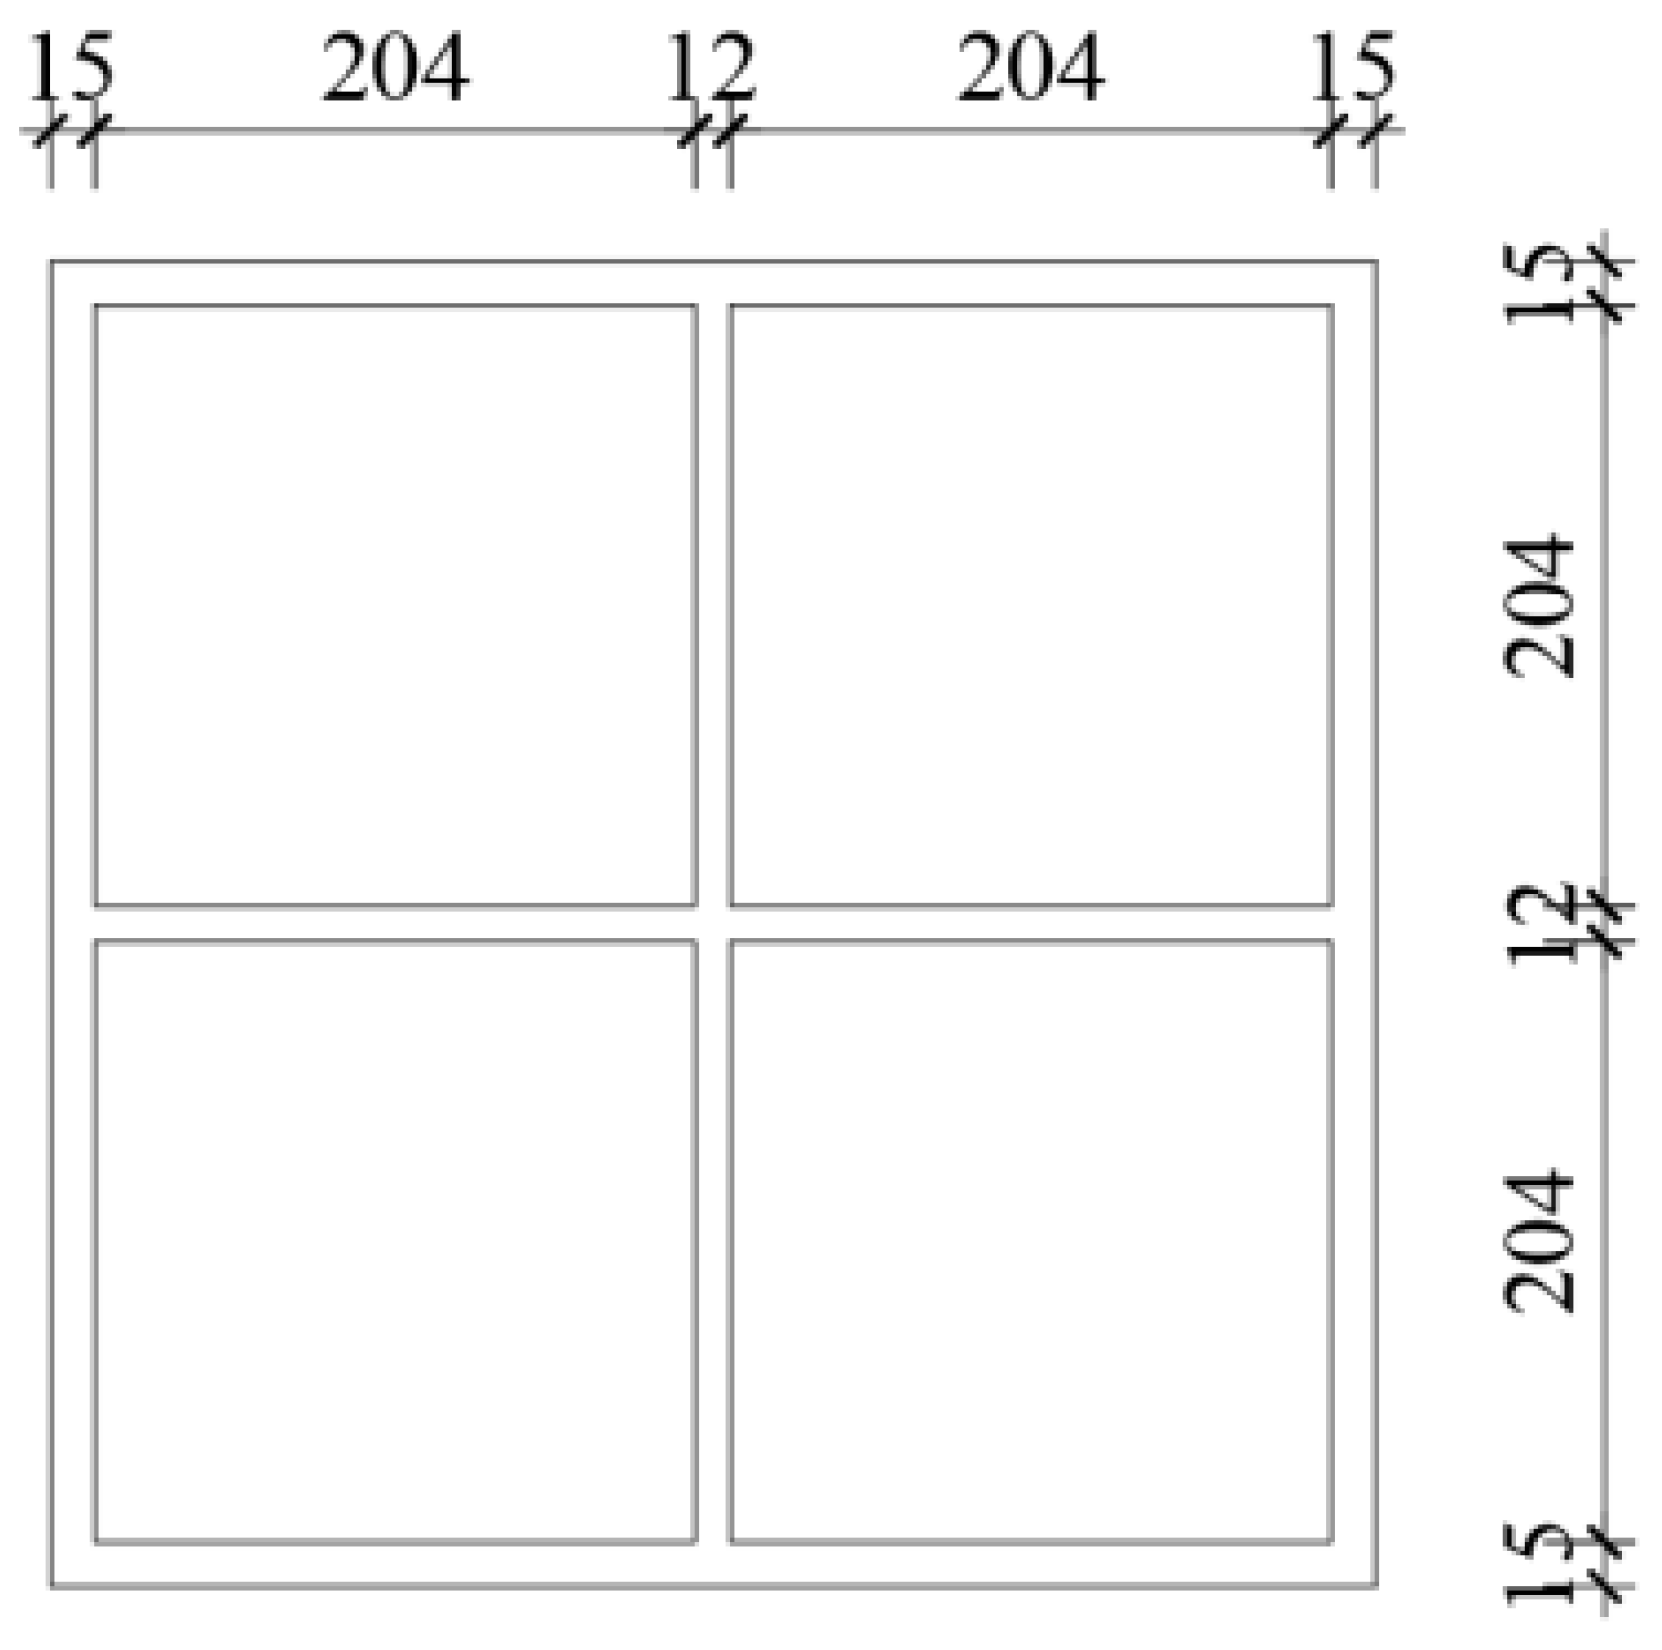
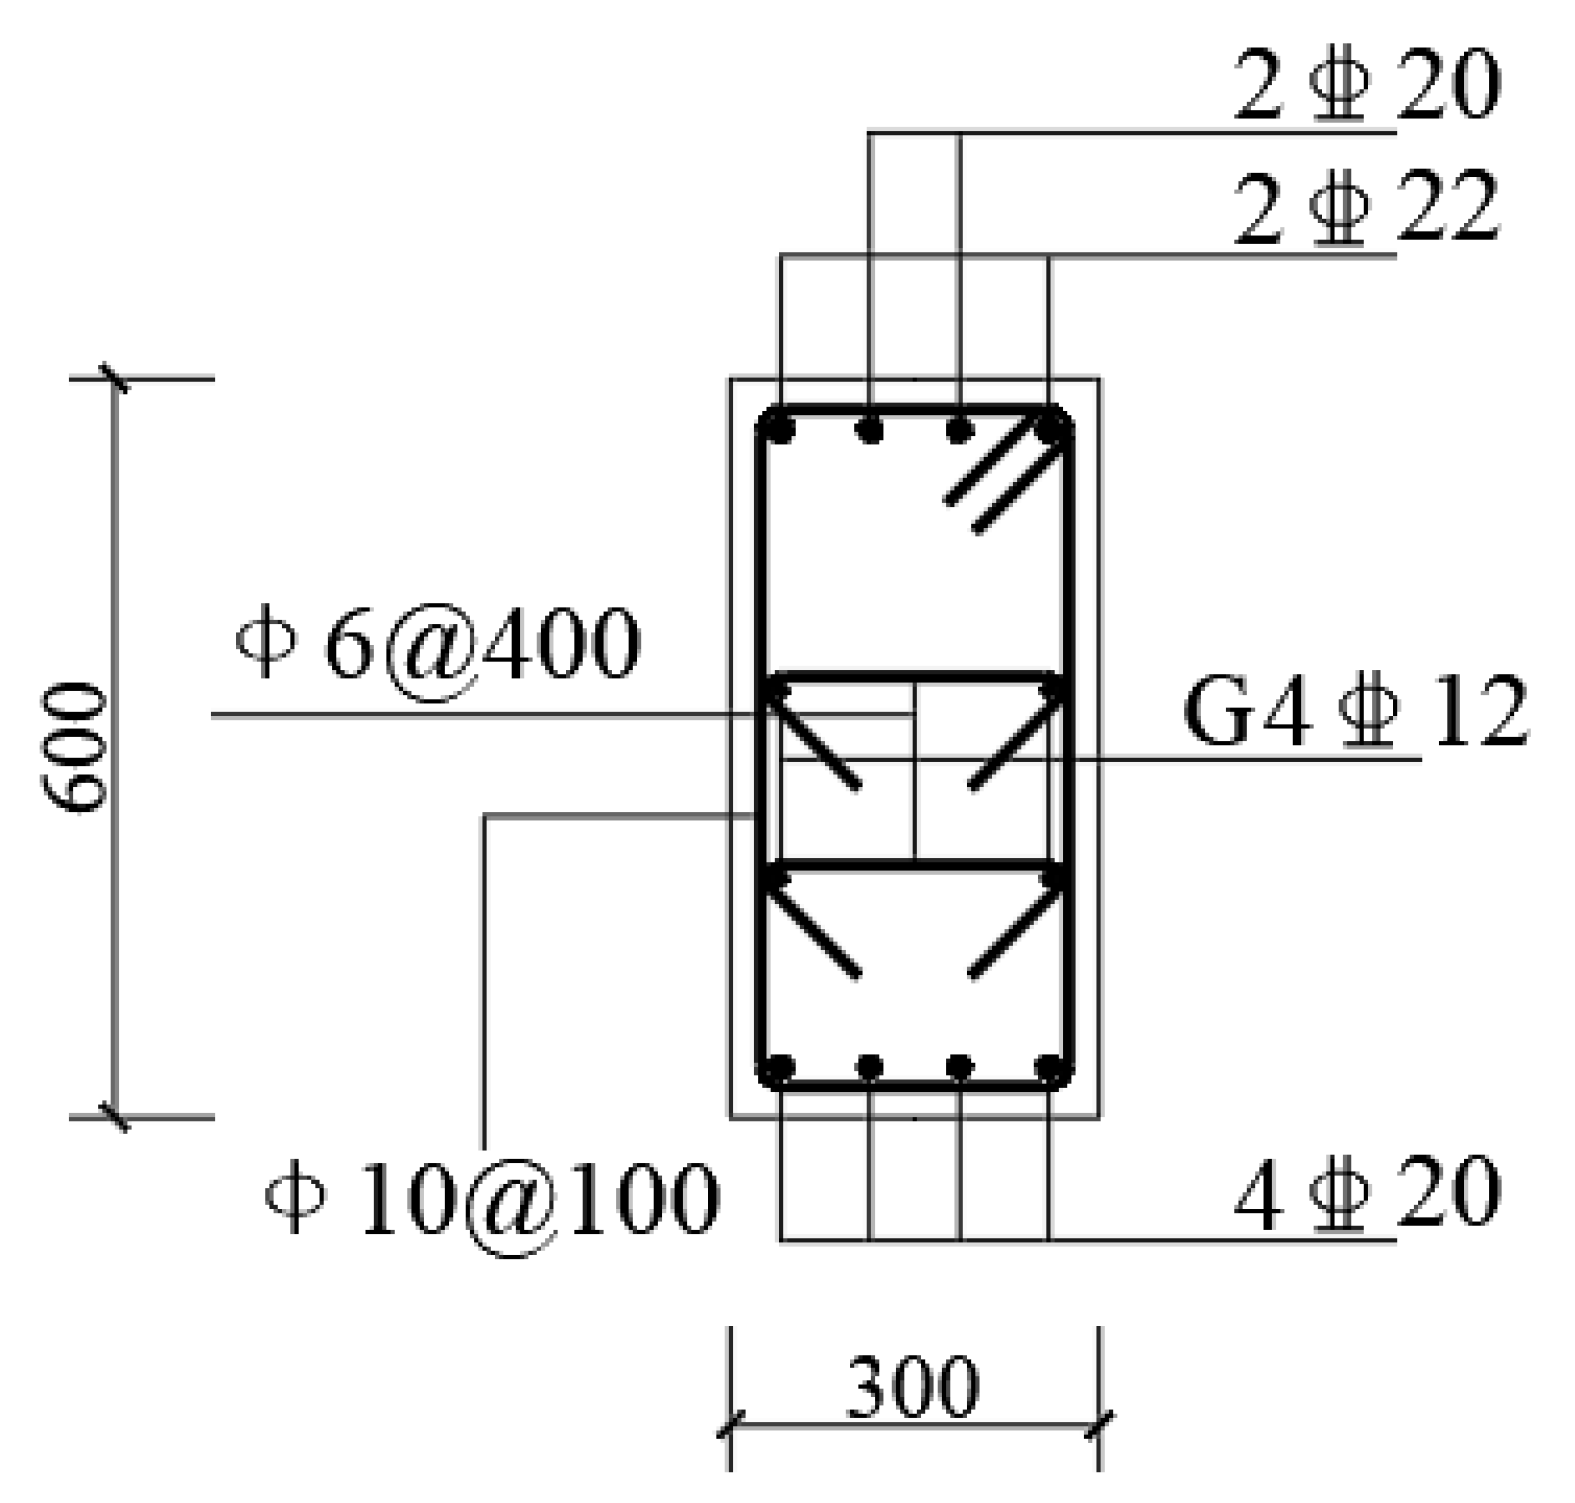
The finite element software ABAQUS was used for numerical analysis. The theoretical formula was compared to verify the rationality of the modeling, so as to provide the basis for the subsequent parametric analysis. The specific dimensions of joints are shown in Figure 3, Figure 4, Figure 5, Figure 6 and Figure 7.
The CFDST column was composed of C35 concrete and square tubes made of Q235B steel, and the precast RC beam was made of C30 concrete. HPB300 reinforcement and HRB400 reinforcement were used for beam reinforcement. Q345B steel was used for the steel seat, the connecting block, and friction plates. The steel head was made of Q235B steel. The column was connected to the steel seat through M24 high-strength bolts of grade 10.9, which were used as friction plate bolts as well. The unbonded prestressed steel strand was used, which was made of seven twisted steel wires with nominal diameter of 15.20 mm and tensile strength of 1860 MPa.

3.2. Material Properties and Meshing

In this paper, the bilinear stress–strain model was adopted for the constitutive model of steel. The slope of the strengthening section of the reinforcement constitutive model was 0.01 times that of the initial elastic modulus, and the slope of the strengthening stage of steel plates constitutive model was 0.02 times that of the initial elastic modulus. The properties of steel are shown in Table 1.
The classic concrete damage-plastic model [14,28] was used to simulate the concrete material behavior under cyclic loading. The key constitutive parameters of C30 and C35 concrete are shown in Table 2. For concrete in tension, the model proposed by Mander et al. [29] is selected.
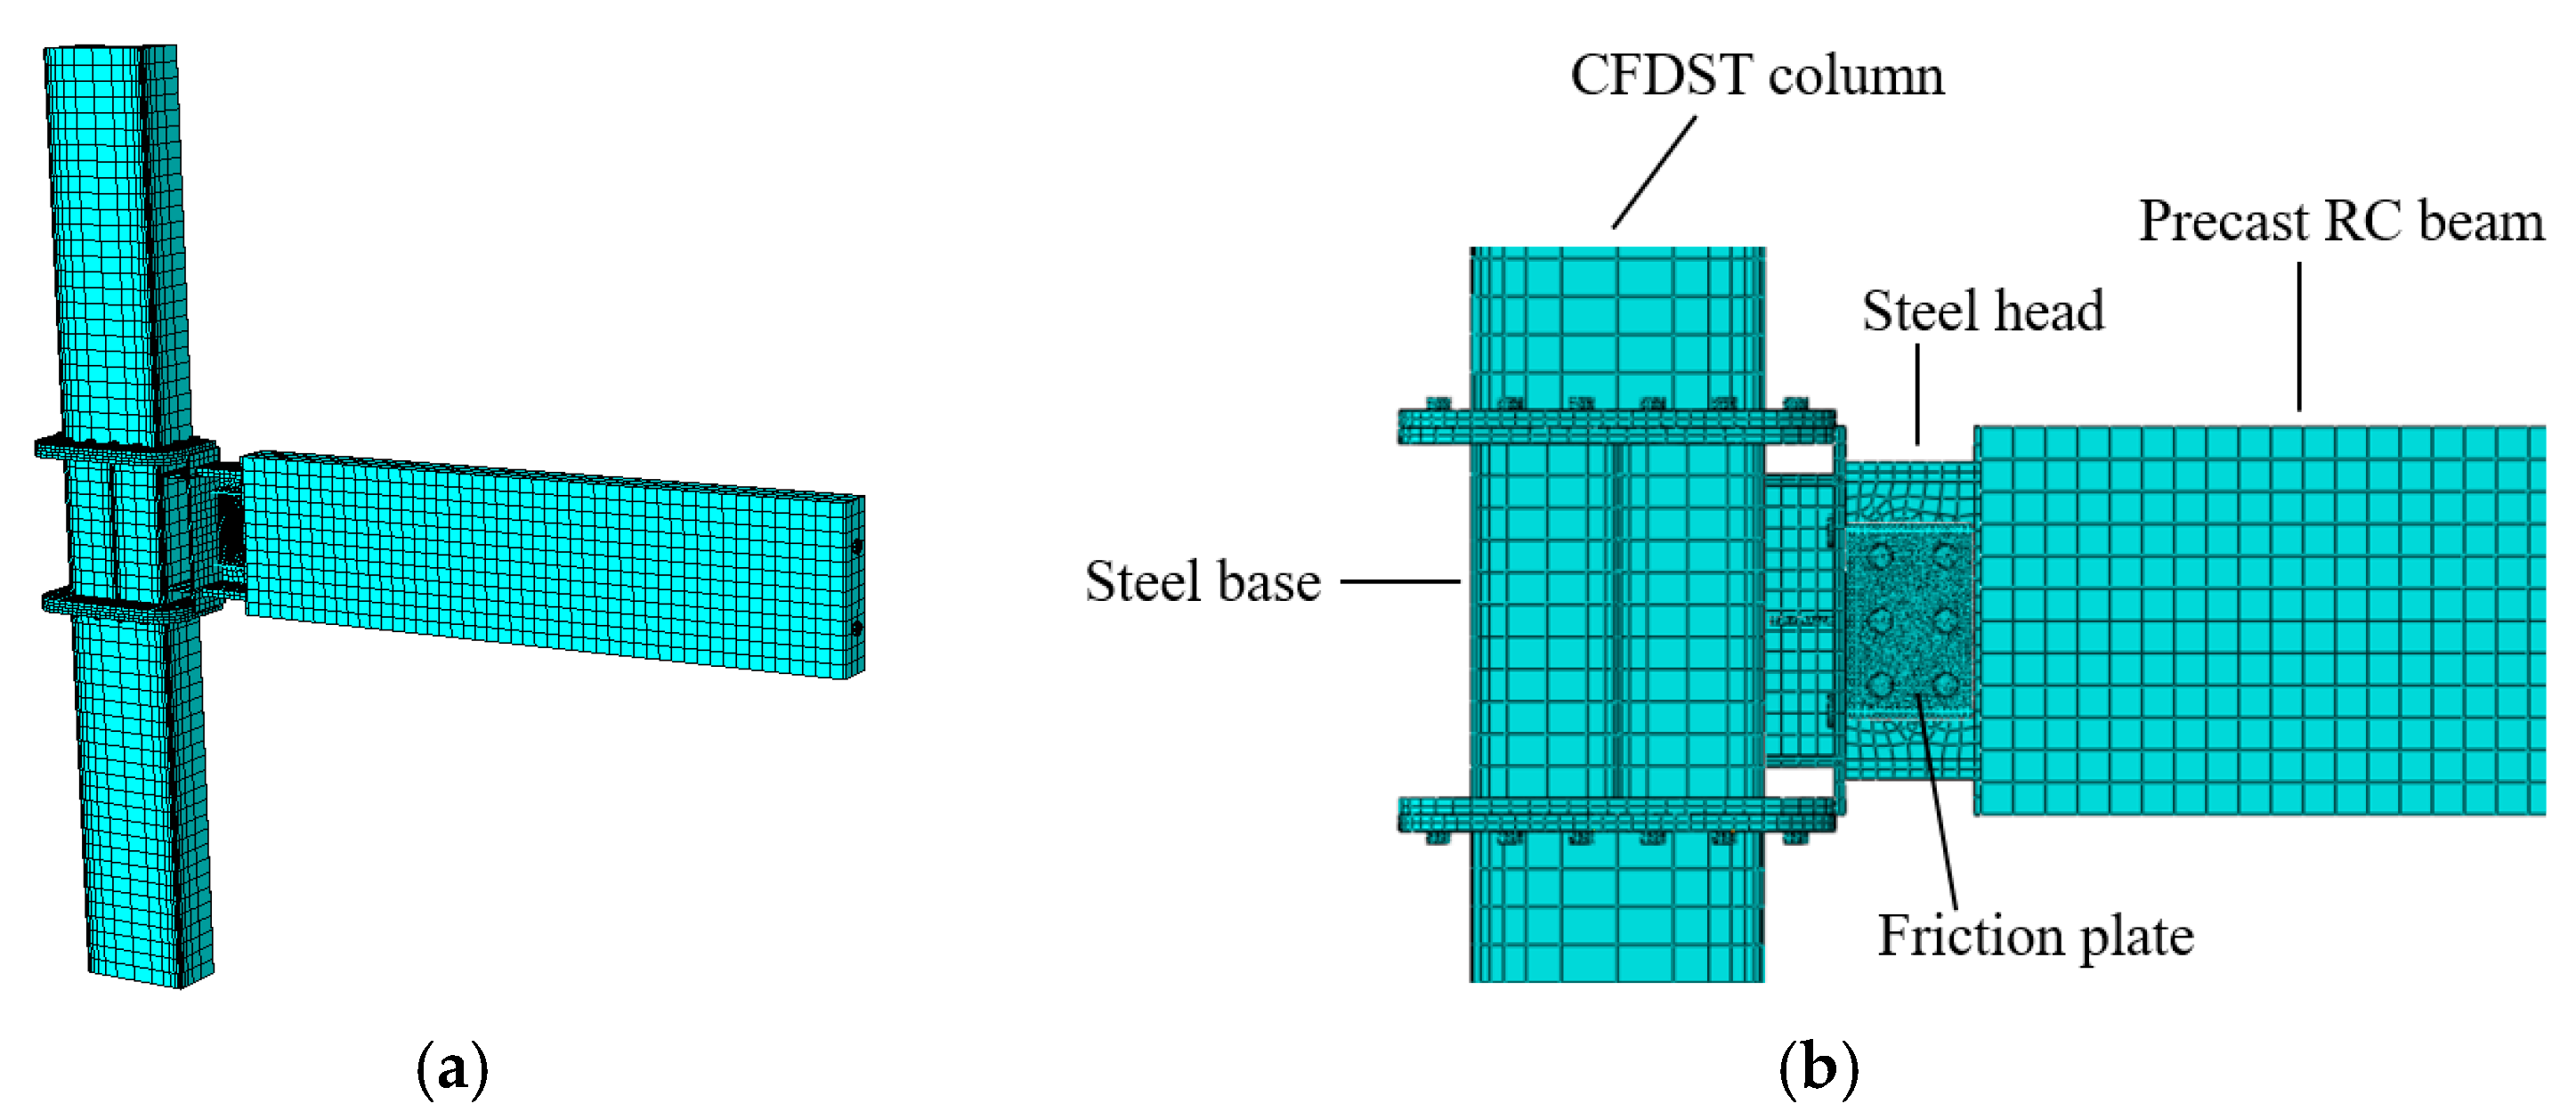
Considering the symmetry of the joint, a 1/2 model of the joint was established. When the model was meshed, C3D8R elements were used for three-dimensional entities, and T3D2 elements were used for reinforcement and steel strands. The meshing result is shown in Figure 8.

3.3. Interaction and Loading Protocol

In the model, contact pairs were adopted to simulate the interaction between components. The “hard” contact is adopted for normal contact between components. The friction coefficients in the tangential direction of 0.5 and 0.45 were adopted for the contact pairs between steel and concrete and the contact pairs between steel components separately [7].
Several specific surfaces were coupled to the reference points (RP1,RP2,RP3), where loads and boundary conditions were applied. The details of the boundary conditions are shown in Figure 9a.
An axial load of 370.25 kN was applied to the column, which was about 10% of the axial bearing capacity of the column. The design value of the maximum bending moment of the joint was 259.7 kN∙m, and the opening moment of the joint was taken as 50% of the design value of the yield, which was 130 kN∙m. In order to ensure the self-centering performance of the joint, the tensile moment should be greater than the friction moment. Therefore, the tensile moment in the opening moment of the joint accounted for 60%, and the friction moment accounted for 40%. Accordingly, the bolt preload was 54.5 kN and the prestress of steel strands was 572 MPa. The displacement loading method was adopted for the cyclic loading at the beam end. In order to investigate the joint rotation angle when the steel strand yields, the maximum rotation angle of the joint was set at 0.06 rad, and the loading history is shown in Figure 9b.

4. Numerical Model Verification

4.1. Load–Displacement Curves

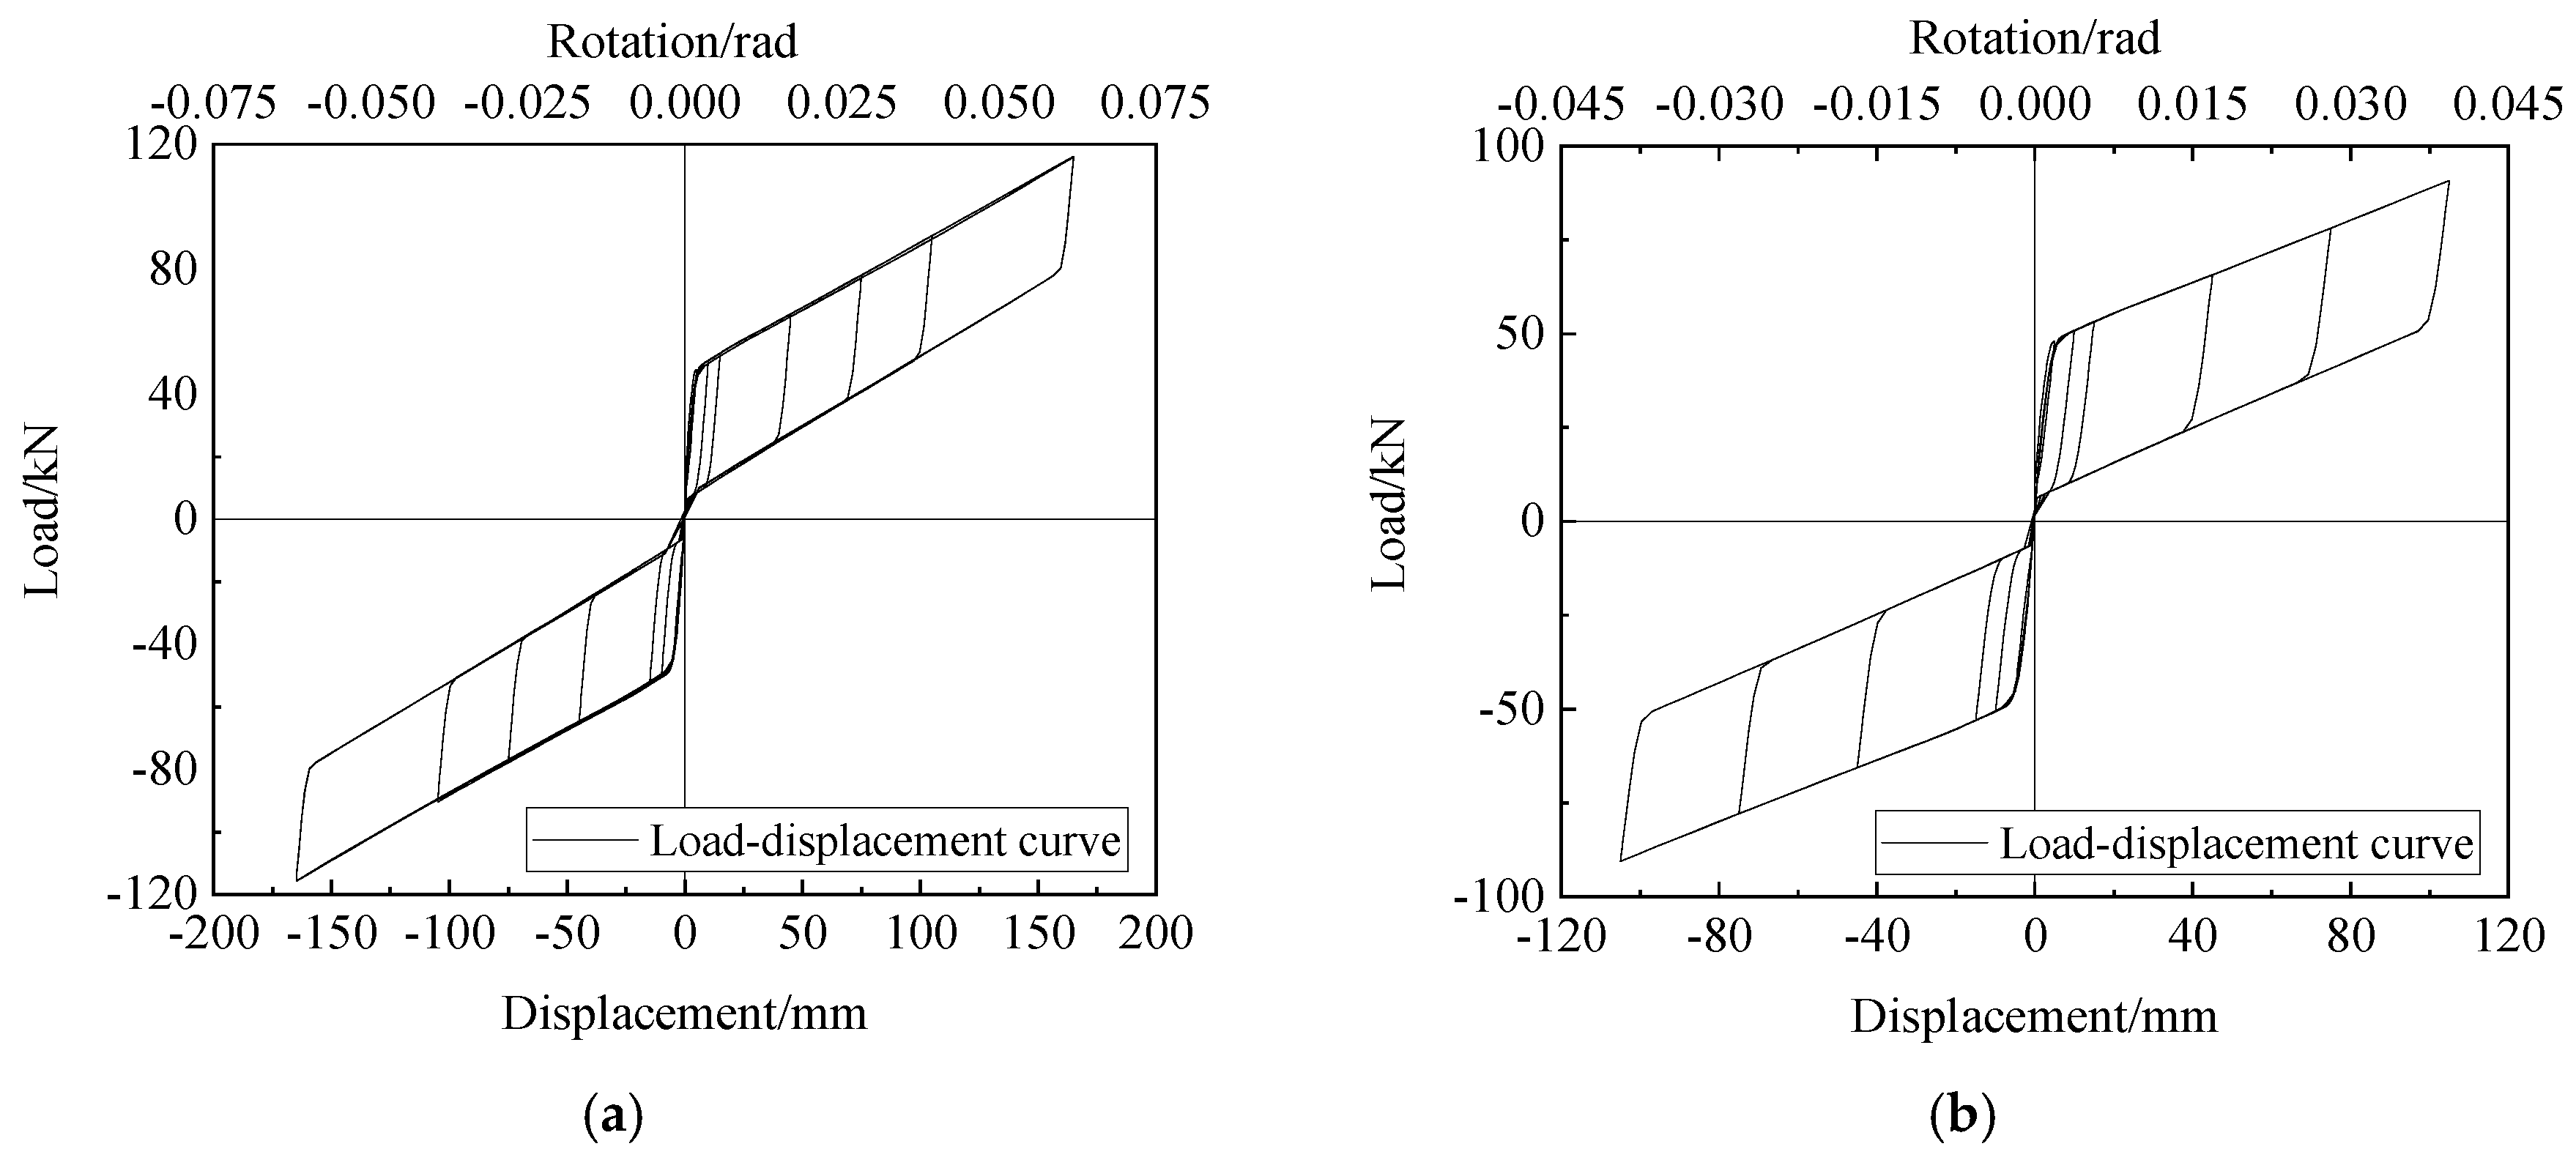
Figure 10a shows the load–displacement curve under the maximum rotation angle of 0.06 rad of the joint. According to Chinese Standard GB/T 5224-2014 [30], the yield stress of steel strands used in this paper is 1635.7 MPa. It could be calculated that the steel strands yielded when the loading amplitude reached ±109 mm. Therefore, only the results within 0.04 rad of the load–displacement curve (the corresponding beam end displacement amplitude reached 105 mm) were retained, as shown in Figure 10b.
As can be seen from Figure 10b,
(1)
The self-centering joint between the CFDST column and the RC beam had a considerable self-centering performance. Considering that the self-centering factor was η = 1 − │δmax│, where δ was the residual deformation and Δmax was the loading amplitude, the calculation showed that the self-centering factor of the joint was η = 1 − │(−0.31/−105)│ = 99.7%, and the ratio of the residual deformation was only 0.3%. It showed that the proportion of the tensile moment and the friction moment in the opening moment was reasonable.
(2)
During the cyclic loading, there was no obvious cumulative plastic deformation or obvious changes in the loading and unloading stiffness, indicating that the design of joint with energy dissipation by friction had been well realized, and the energy dissipation in the form of damage to the components had been reduced.
(3)
When the maximum rotation angle of the joint reached 0.04 rad, the resisting bending moment provided by the joint was 240.5 kN∙m, which was not completely consistent with 259.7 kN∙m obtained in the previous joint design. The reasons are as follows: Firstly, the main equations for the joint design are shown in Equations (7)–(9). The value of each parameter obtained during the joint design was an approximation of the exact solution of each parameter. Secondly, the joint model was flexible due to the elastic-plastic materials used in the finite element model, while the assumption of rigidity of each member in the joint was adopted in the joint design.
M T 0 = M T σ 0 , d i
M f 0 = M f F f , R
The resisting moment Mmax provided by the joint when the loading amplitude reached θmax was:
M max = M σ 0 , F f , d i , R , θ max
where σ0 was the prestress of steel strands.

4.2. Envelope Curves

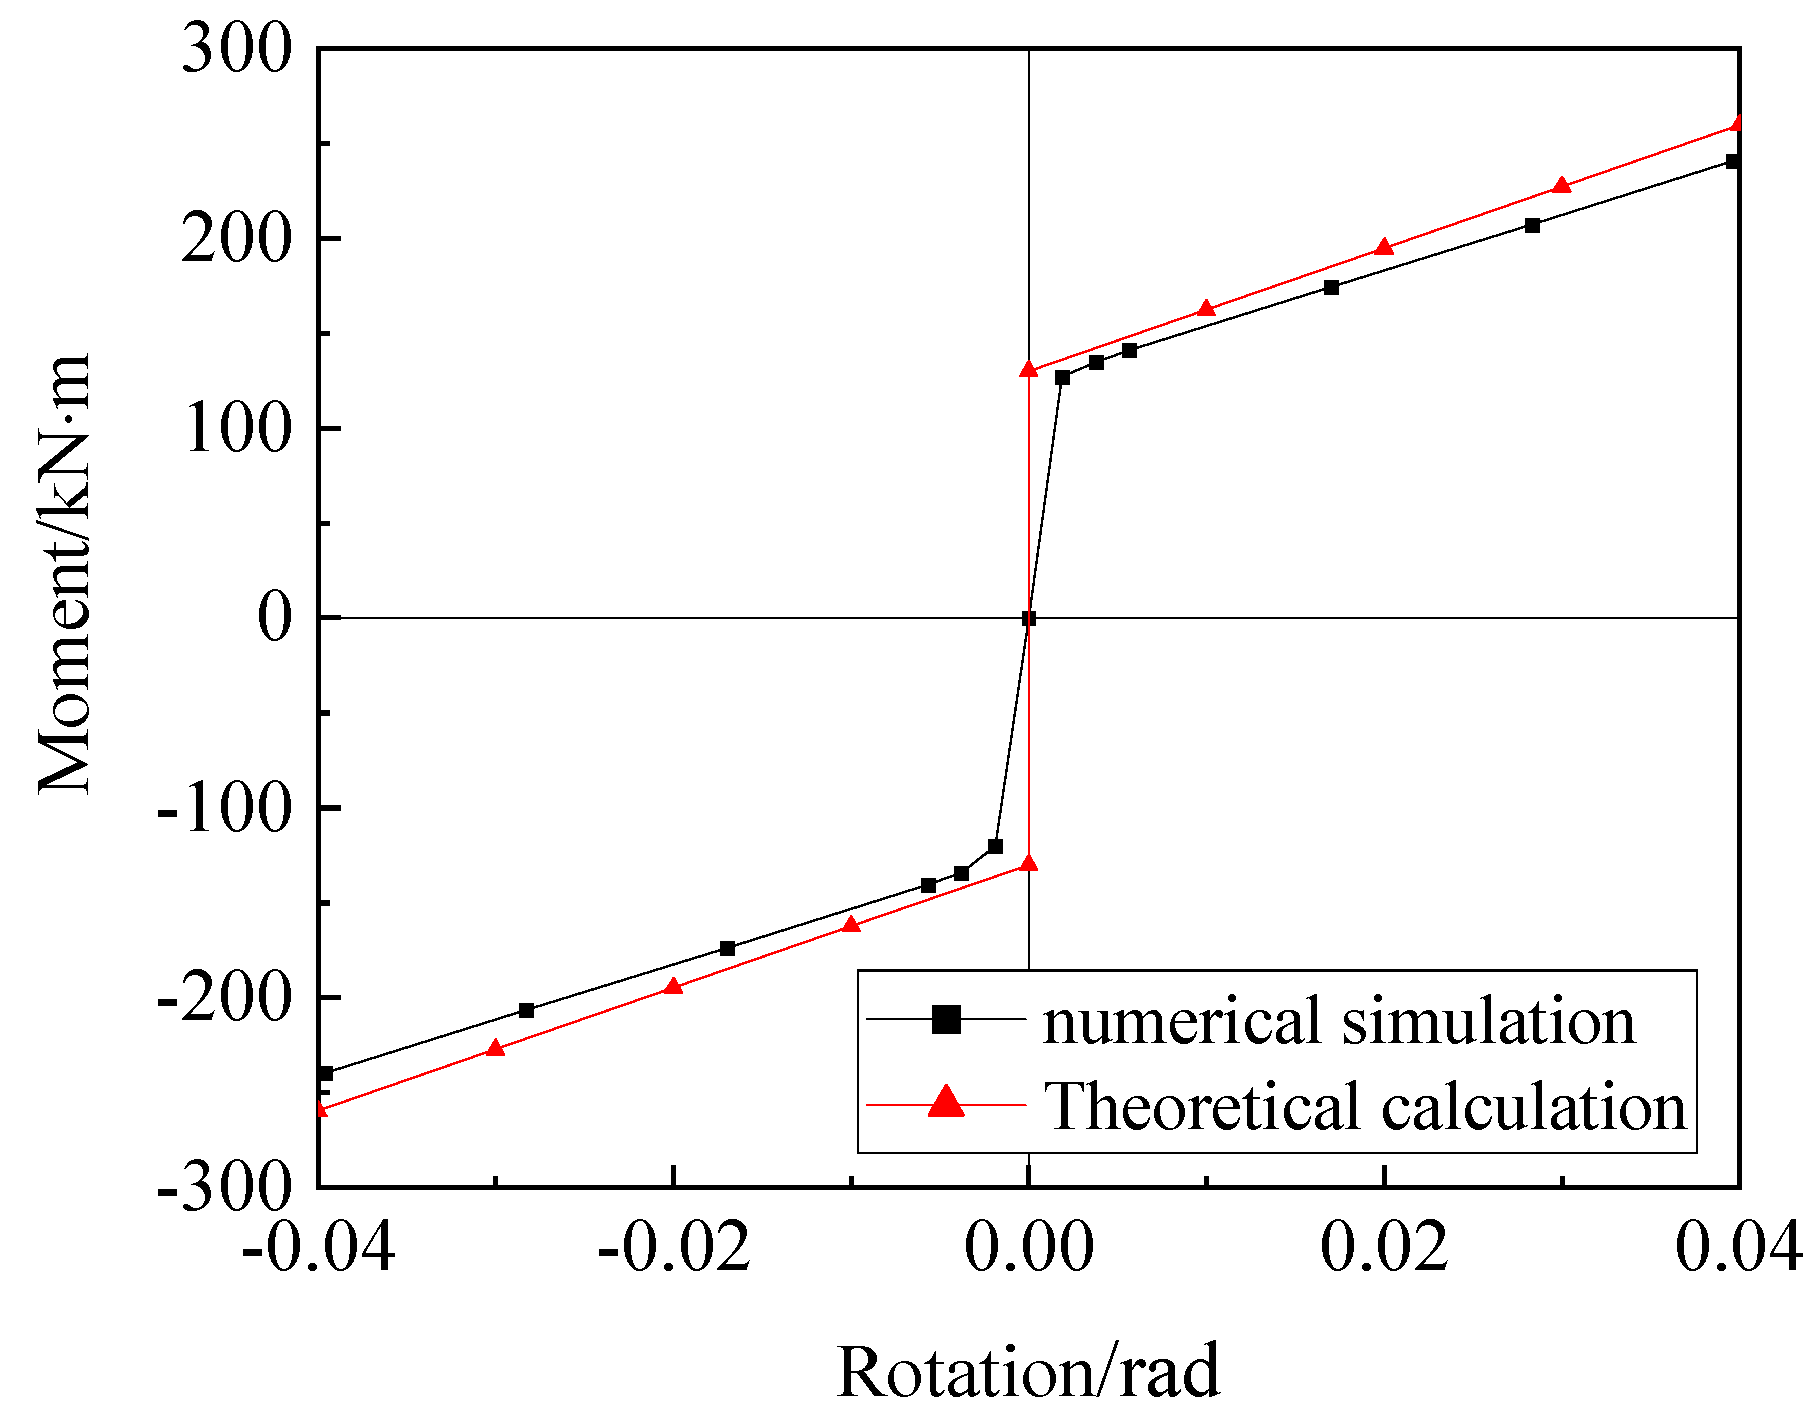
The envelope curve of the joint was obtained by connecting the positive and negative peak-load points of the first cycle of each loading level of the hysteretic curve, as shown in Figure 11.
As can be seen from Figure 11, envelope curves of numerical simulation and theoretical calculation of the joint were generally consistent with each other, indicating that the numerical model was reasonable. The value of the joint envelope curve in the numerical simulation under the same joint rotation was slightly lower than the theoretical calculation. The reason was that the theoretical derivation was based on the assumption of the rigidity of each member of the joint, while elastic-plastic materials were used in the numerical model, which reduced the rigidity of the joint.

4.3. Joint Restoring Force Model

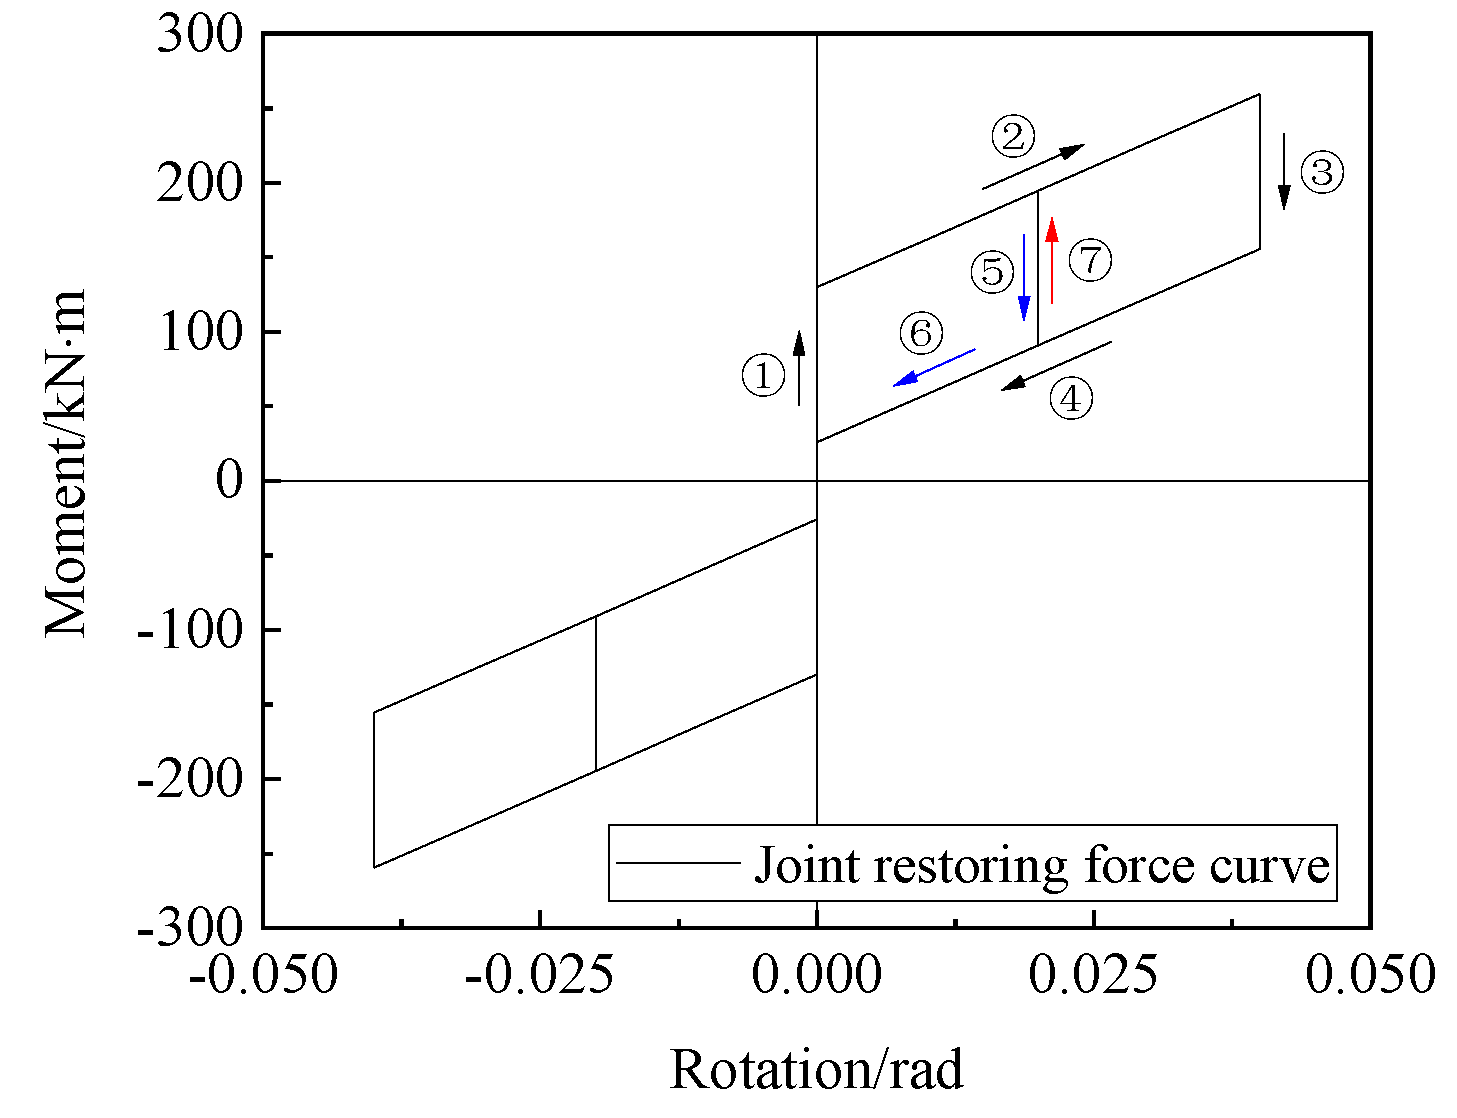
With the limit of joint rotation of 0.04 rad, the joint restoring force model, M-θ, could be obtained from Equations (1)–(6) as follows.
M = M open + K θ ± M open M open + K θ 0 < θ < 0.04   rad θ = 0 0.04   rad < θ < 0
The theoretical model of joint restoring force is shown in Figure 12. Considering its symmetry, only some parts are described here. The loading and unloading path when the maximum rotation θmax of joint reached 0.04 rad was ①-②-③-④. The unloading path when the joint was loaded until θ reached somewhere between 0~0.04 rad was ①-②-⑤-⑥. The path of unloading and reloading when the joint was loaded until θ reached somewhere between 0~0.04 rad was ①-②-⑤-⑦-②. It should be noted that the corresponding bending moment reduction value of path ③ was 2Mf. Figure 13 shows the comparison between the numerical simulation results of the joint restoring force and the calculation results of Equation (10). It can be seen that they are in good agreement with each other.
Based on the above discussion, the numerical simulation results were consistent with the joint working mechanism and theoretical analysis, which showed that the modeling method was reasonable and could be used for parametric analysis below.

5. Parametric Analysis

There are many factors that affect the energy dissipation, the self-centering performance and the bearing capacity of self-centering joints between CFDST columns and RC beams, mainly including the value of the prestress of steel strands (controlling the joint self-centering performance, the joint bearing capacity, etc.) and the value of friction (controlling the energy dissipation, the joint bearing capacity, etc.). The ratio of the two is another factor worth considering. Parametric analysis of these influencing factors was carried out as shown below.

5.1. The Friction

5.1.1. Parametric Settings

The joint numerical model mentioned above is the numerical model J1-0 here. The friction is proportional to the bolt preload. By changing the bolt preload, five groups of joints were established. The bolt preload changed in multiples of 15 kN, as shown in Table 3.

5.1.2. Results and Analysis

(1)
Load–Displacement Curves
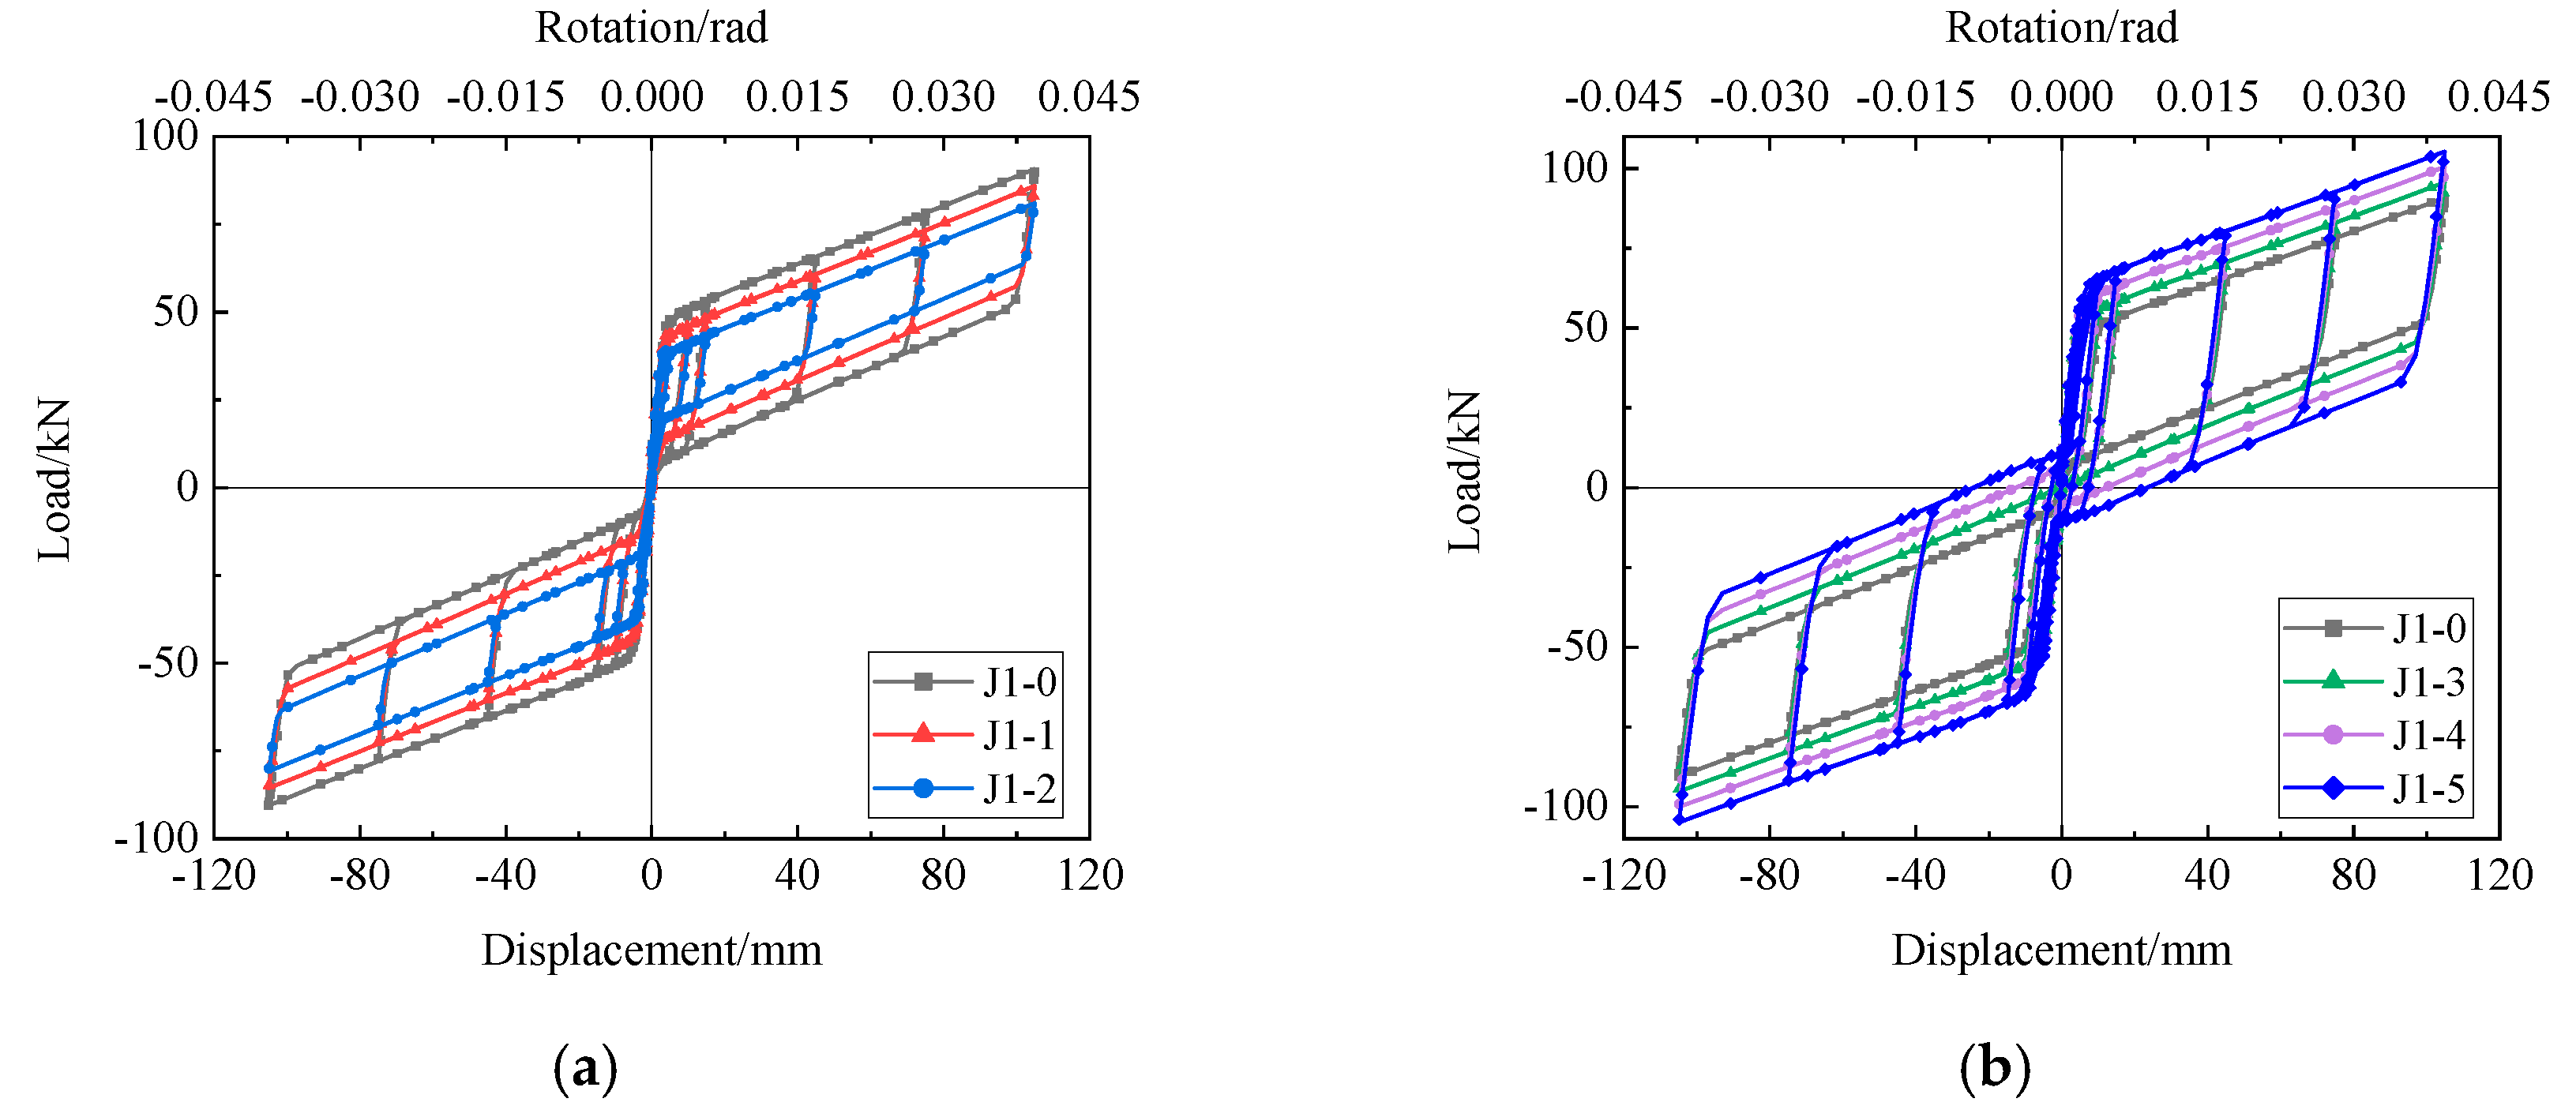
According to the previous simulation results, the steel strands yielded when the relative rotation of the beam and the column reached 0.04 rad, thus 0.04 rad was taken as the loading amplitude of J1-0~J1-5. The load–displacement curves of J1-0~J1-5 are shown in Figure 14.
As can be seen from Figure 14a, with the decrease in friction, the bearing capacity and opening bending moments of joints decreased gradually, and the areas surrounded by the load–displacement curves decreased gradually as well, indicating the decrease in the energy dissipation of joints. At the same time, the residual deformations of joints were small. As can be seen from Figure 14b, as friction increased, the bearing capacity and the opening moments of joints increased gradually, and the areas surrounded by the curves increased gradually as well, indicating the increase in the energy dissipation of joints, but the residual deformations of joints increased as well, and ratios of the residual deformations of J1-3~J1-5 were 2.5%, 11.9%, and 23.0%, respectively.
There were two main reasons for these. Firstly, as shown in Figure 15, with the increase in friction, the resisting bending moments provided by joints increased, the areas and degrees of damages of the concrete of the beams increased gradually, and the degree of plastic deformations exhibited by each joint was deepened. Secondly, as friction increased, the friction moment gradually exceeded the tensile moment. As a result, when unloading, the tensile moment could not resist the friction moment. Consequently, the joints could not be pulled back to the initial positions, but maintained balance under certain rotations of each joint, resulting in residual deformations.
Compared with the theoretical restoring force model of joints, the energy dissipation of J1-1~J1-5 was still mainly based on friction, which had achieved the design goal. The key data of the joint load–displacement curves are shown in Table 4.
(2)
Envelope Curves
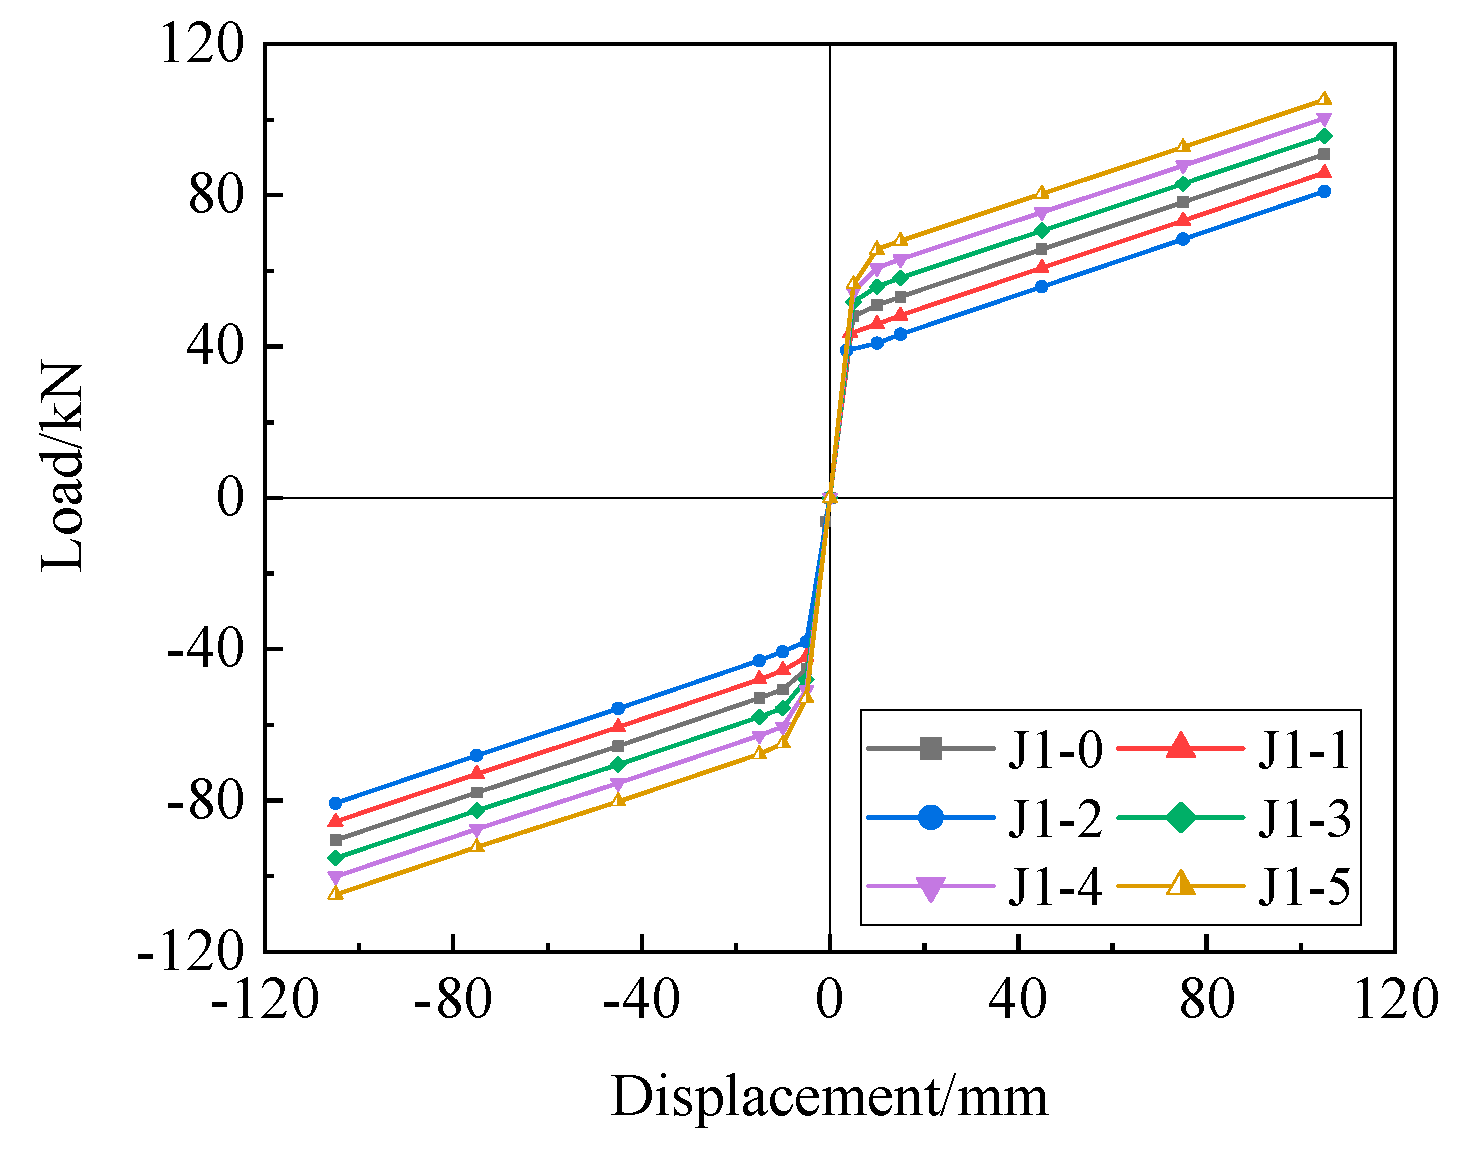
The envelope curves of J1-0~J1-5 are shown in Figure 16. As can be seen from Figure 16, the stiffness of each joint before opening and the second stiffness after opening were consistent with each other, indicating that the stiffness before opening and the second stiffness had no correlation with friction. The opening loads and the maximum bearing capacity of joints were positively correlated with friction, indicating that increasing the joint friction had a direct influence on improving the opening loads and the maximum bearing capacity of joints.
(3)
Stress Variation Curves of Steel Strands
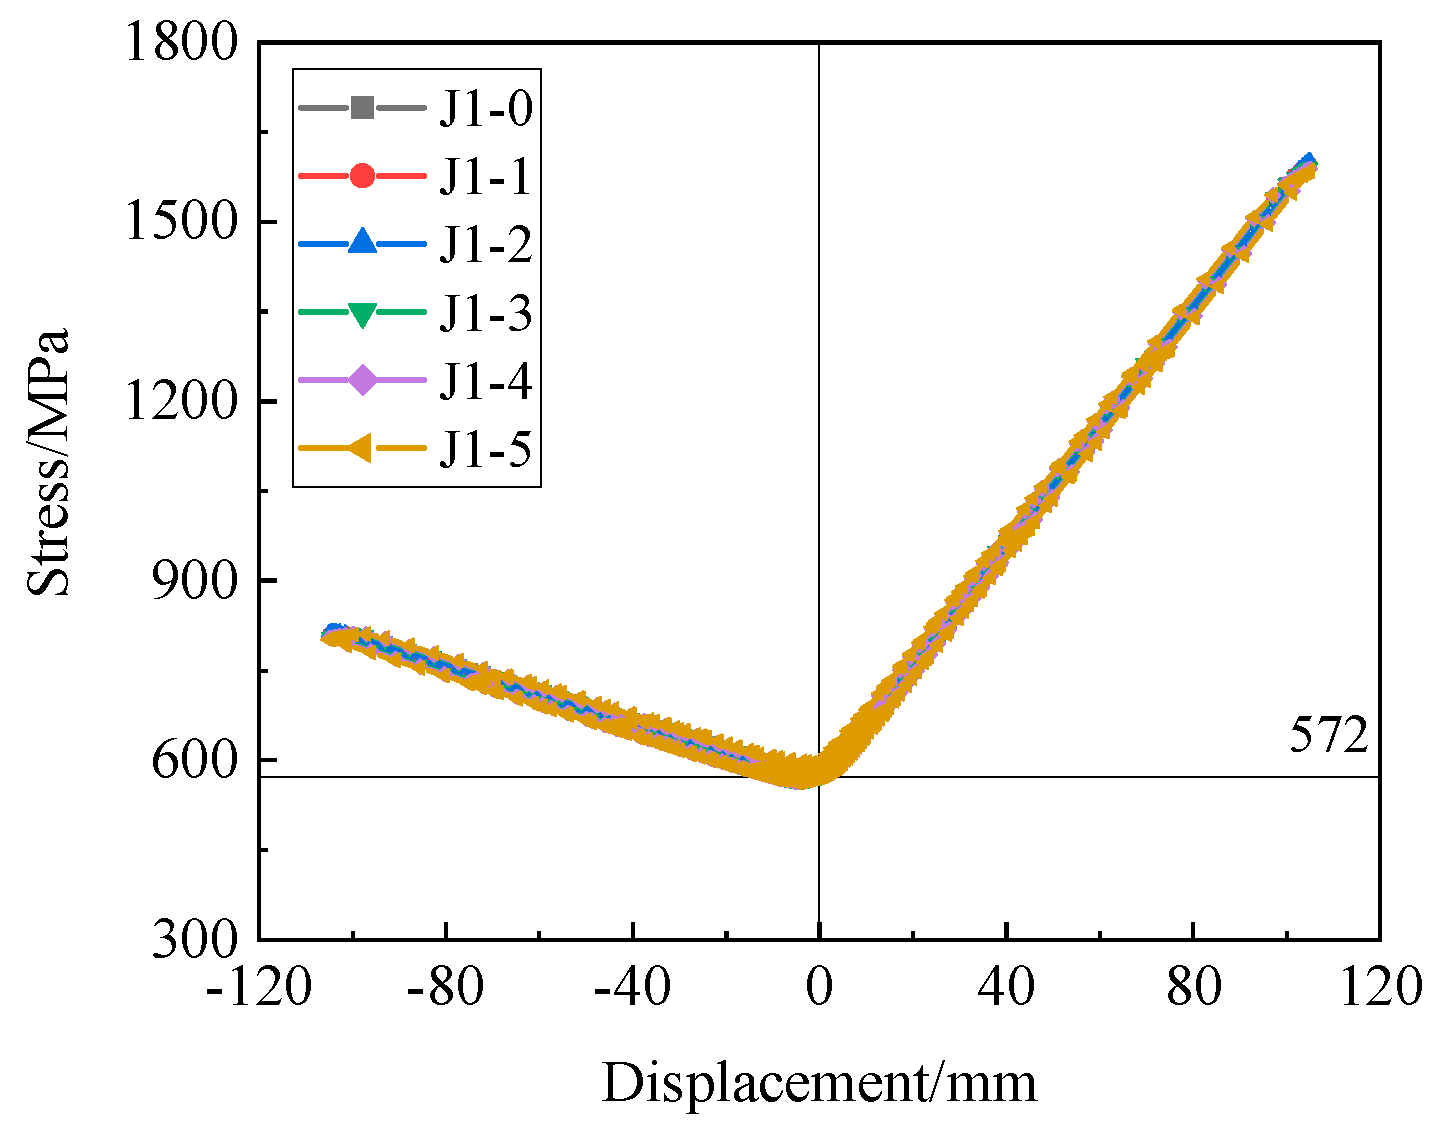
Due to the symmetry of steel strand layouts, only one steel strand is taken for stress change analysis here at each joint. The curves between the steel strand stress and the loading displacements are shown in Figure 17.
It can be seen from Figure 17 that the variation trends of steel strand stress at J1-0~J1-5 were generally consistent with each other, indicating that the variations of steel strand stress were mainly related to their layout positions and joint geometries but not to the joint friction. When unloading, the stress of steel strands could return to the prestress, and the stress loss was little. With the increase in friction, the stress of steel strands when unloaded to initial position was slightly lower than the prestress of 572 MPa. The reason is that the plastic deformations of joints increase gradually, and the distances between the anchorages at both ends of steel strands decrease slightly. The stress of steel strands of each joint remained elastic and changed stably during cyclic loading, indicating that the self-centering performance of each joint was stable and reliable. It was worth noting that there were ring parts in the stress change curves of steel strands. This was due to the cumulative plastic deformations of joints, resulting in the non-coincidence of the loading and unloading trajectories of the loading positions, and the tensile strains of steel strands could not be reproduced symmetrically during cyclic loading, rather than the steel strands participating in the energy dissipation.
(4)
Energy Dissipation
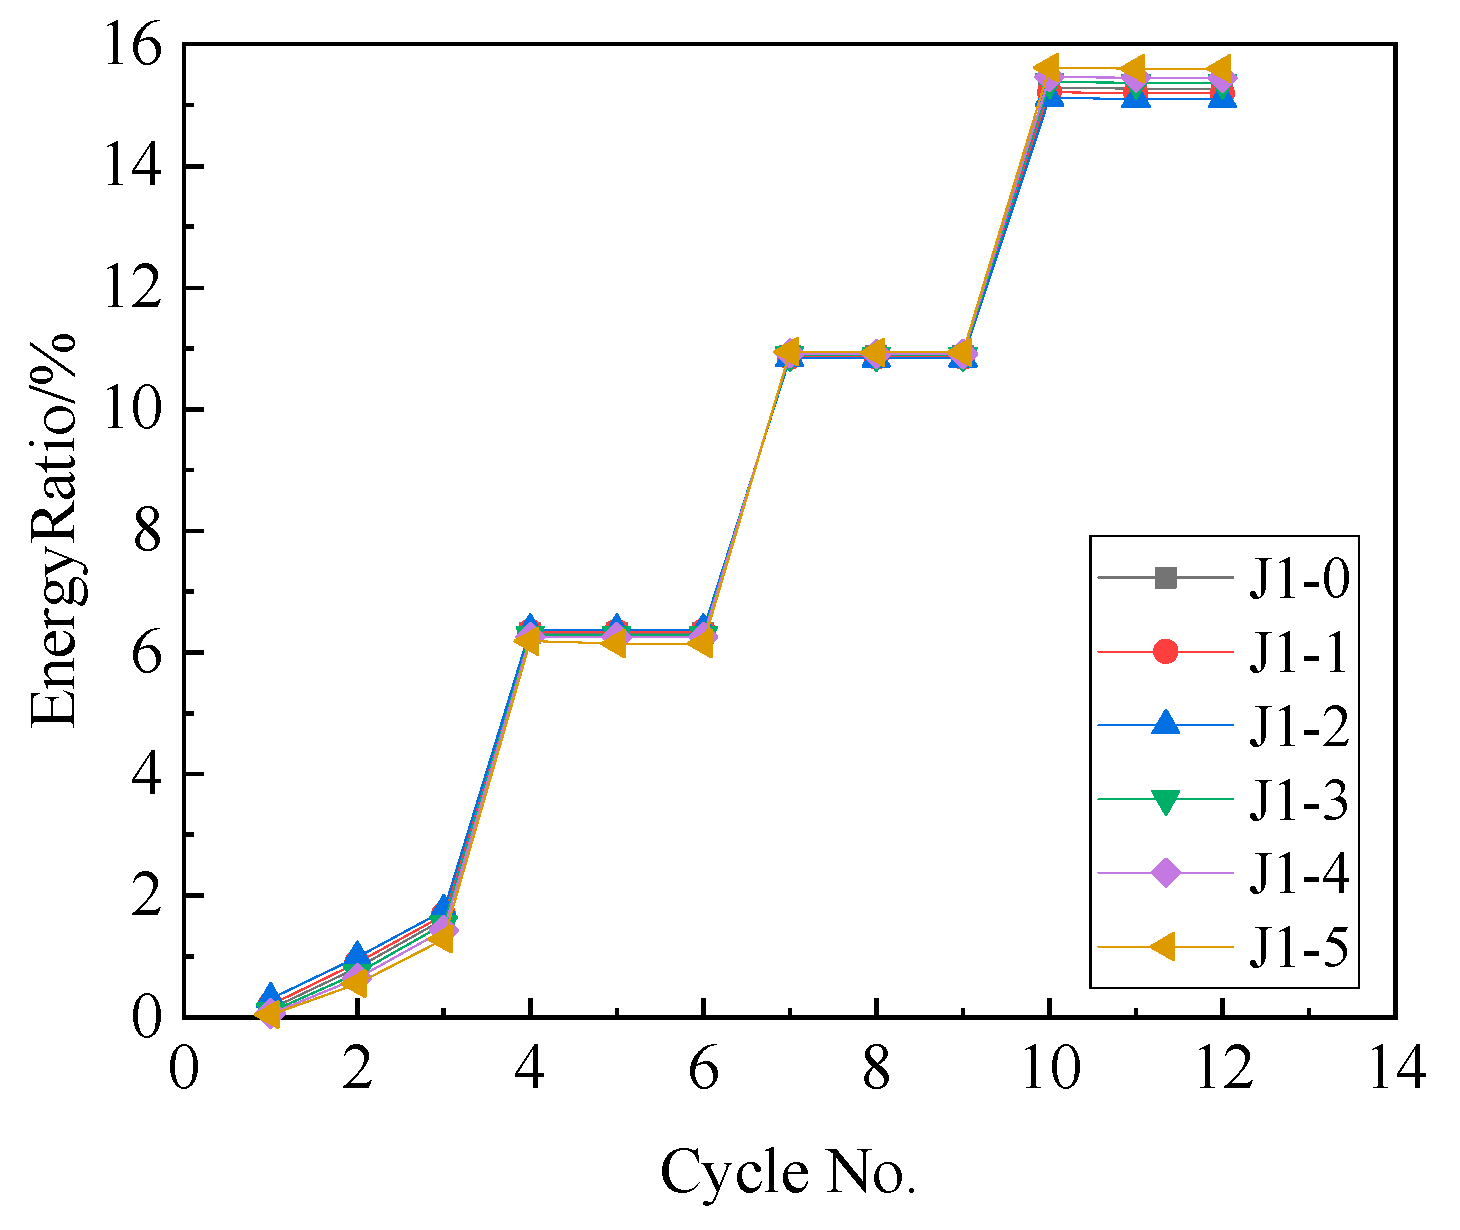
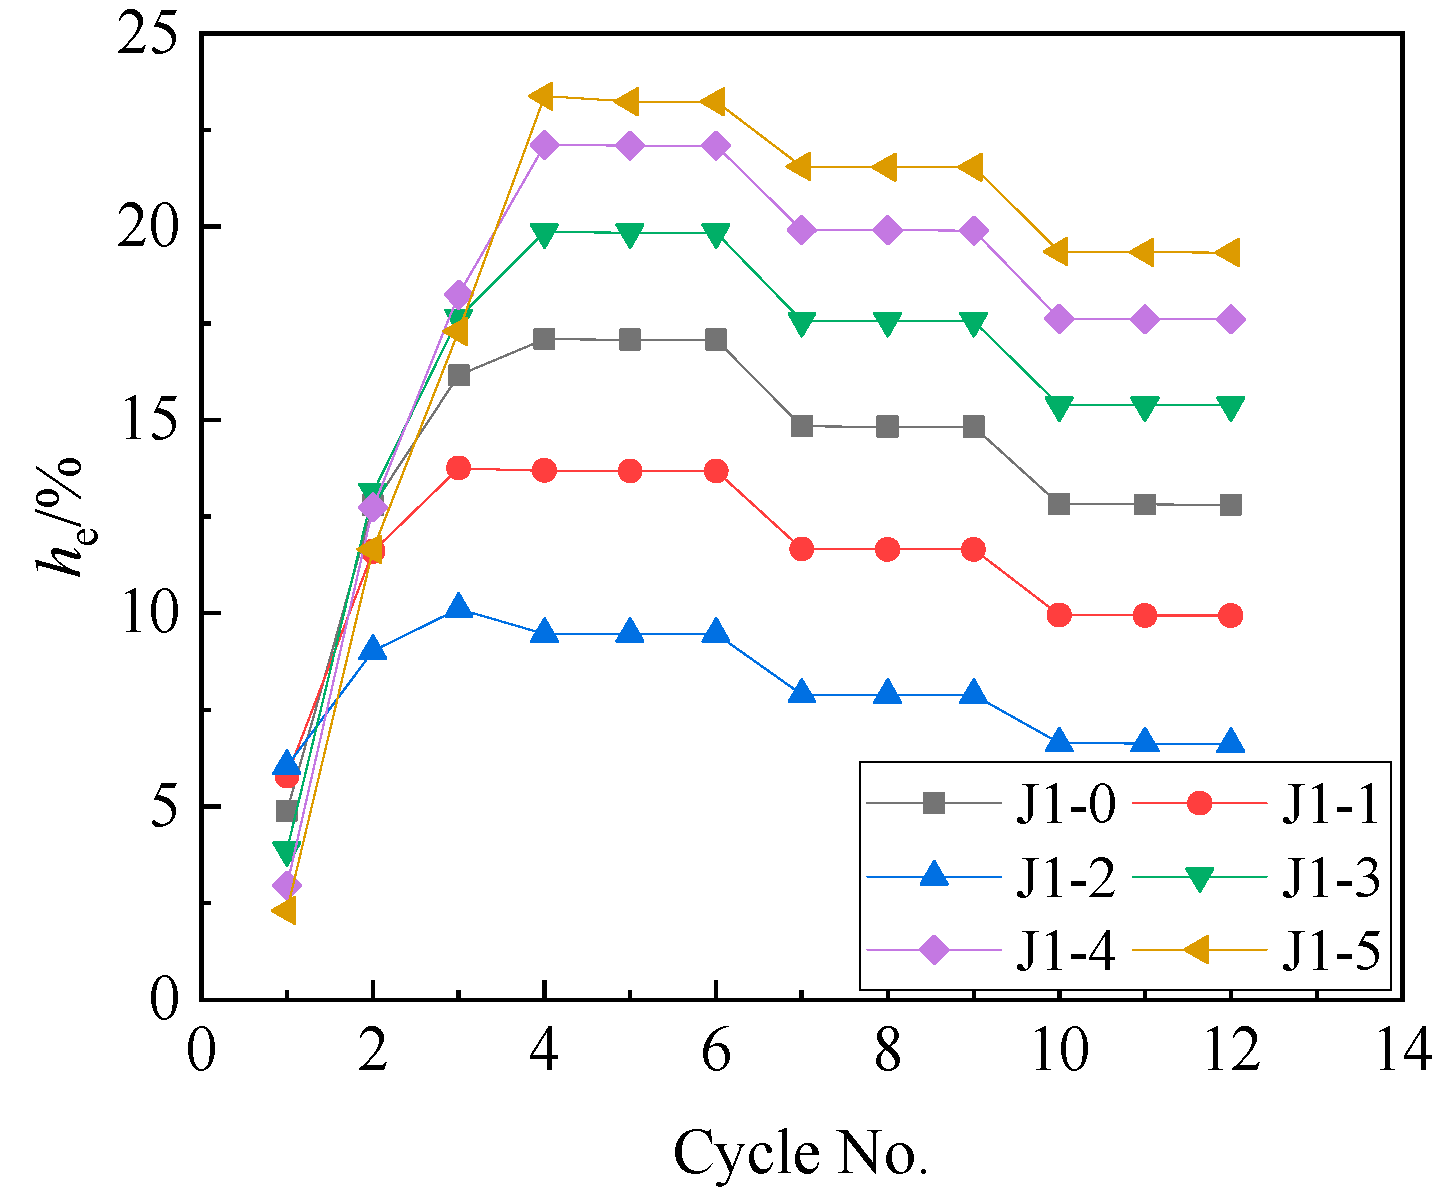
Figure 18 shows the energy dissipation ratio of each cycle, which is equal to the ratio of the energy dissipation of a single cycle to the sum of the energy dissipation of all cycles. Moreover, the equivalent viscous damping ratio, he, is shown in Figure 19.
It can be seen from Figure 18 that the energy dissipation per cycle of each joint was stable under cyclic loading and was not greatly affected by the cumulative damage. It can be seen from Figure 19 that the hemax of each joint increased with the increase in friction, indicating the increase in the energy dissipation of joints. After the third cycle, the average values of he of each joint were (J1-0~J1-5) 15.0%, 12.0%, 8.2%, 17.6%, 19.7%, and 21.0%, respectively.

5.2. Prestress of Steel Strands

5.2.1. Parametric Settings

J1-0 was taken as the numerical model J2-0 for parametric analysis here. Pretension of steel strands changed in multiples of 20 kN, corresponding to the steel strand prestress of about 72 MPa. Five groups of joints were established, as shown in Table 5.
According to Equation (5),
T i = T i 0 + k i d i 0 θ
Therefore, σi can be expressed as:
σ i = T i A 0 = σ i 0 + k i d i 0 A 0 θ
Substituting the yield stress σi = σs = 1635.7 MPa of steel strands into Equation (12), it could be obtained that the rotation amplitudes of J2-1~J2-5 were 0.04 rad, 0.043 rad, 0.035 rad, 0.032 rad, and 0.03 rad, respectively, and the corresponding theoretical displacement amplitudes were 106 mm, 114 mm, 92 mm, 84 mm, and 79 mm, correspondingly. Considering the flexibility of materials adopted in joints, after the joints were loaded to the theoretical loading displacement amplitudes in the numerical simulation, two groups of cyclic loads with 4% and 8% greater than the theoretical loading displacement amplitudes were supplemented, in order to approach the yield states of steel strands as closely as possible. The amplitudes were 110 mm, 118 mm, 95 mm, 87 mm, 82 mm, and 114 mm, 122 mm, 98 mm, 90 mm, and 85 mm, respectively.

5.2.2. Results and Analysis

(1)
Load–Displacement Curves
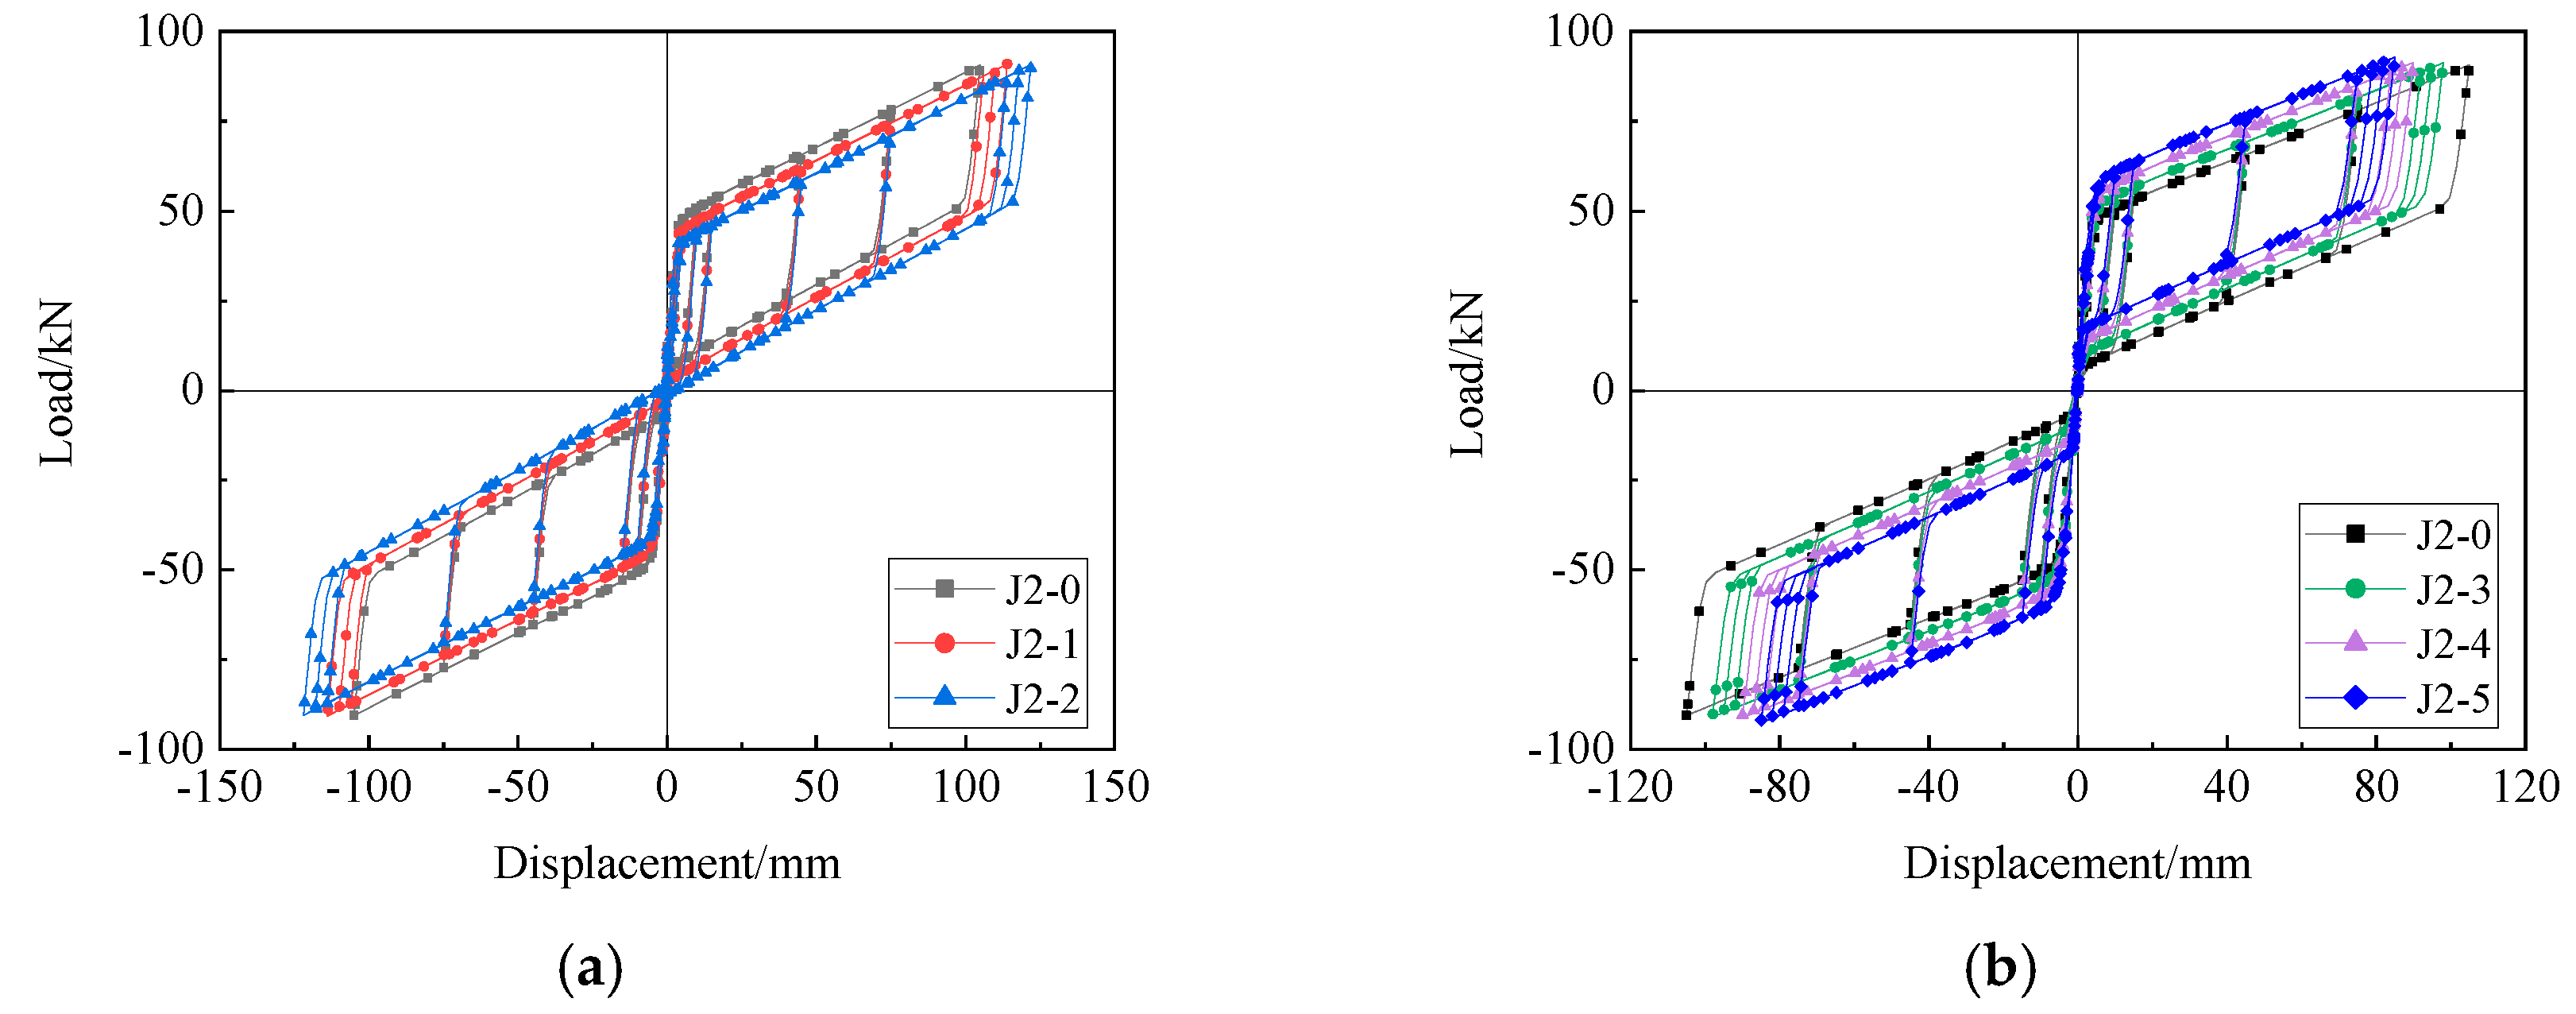
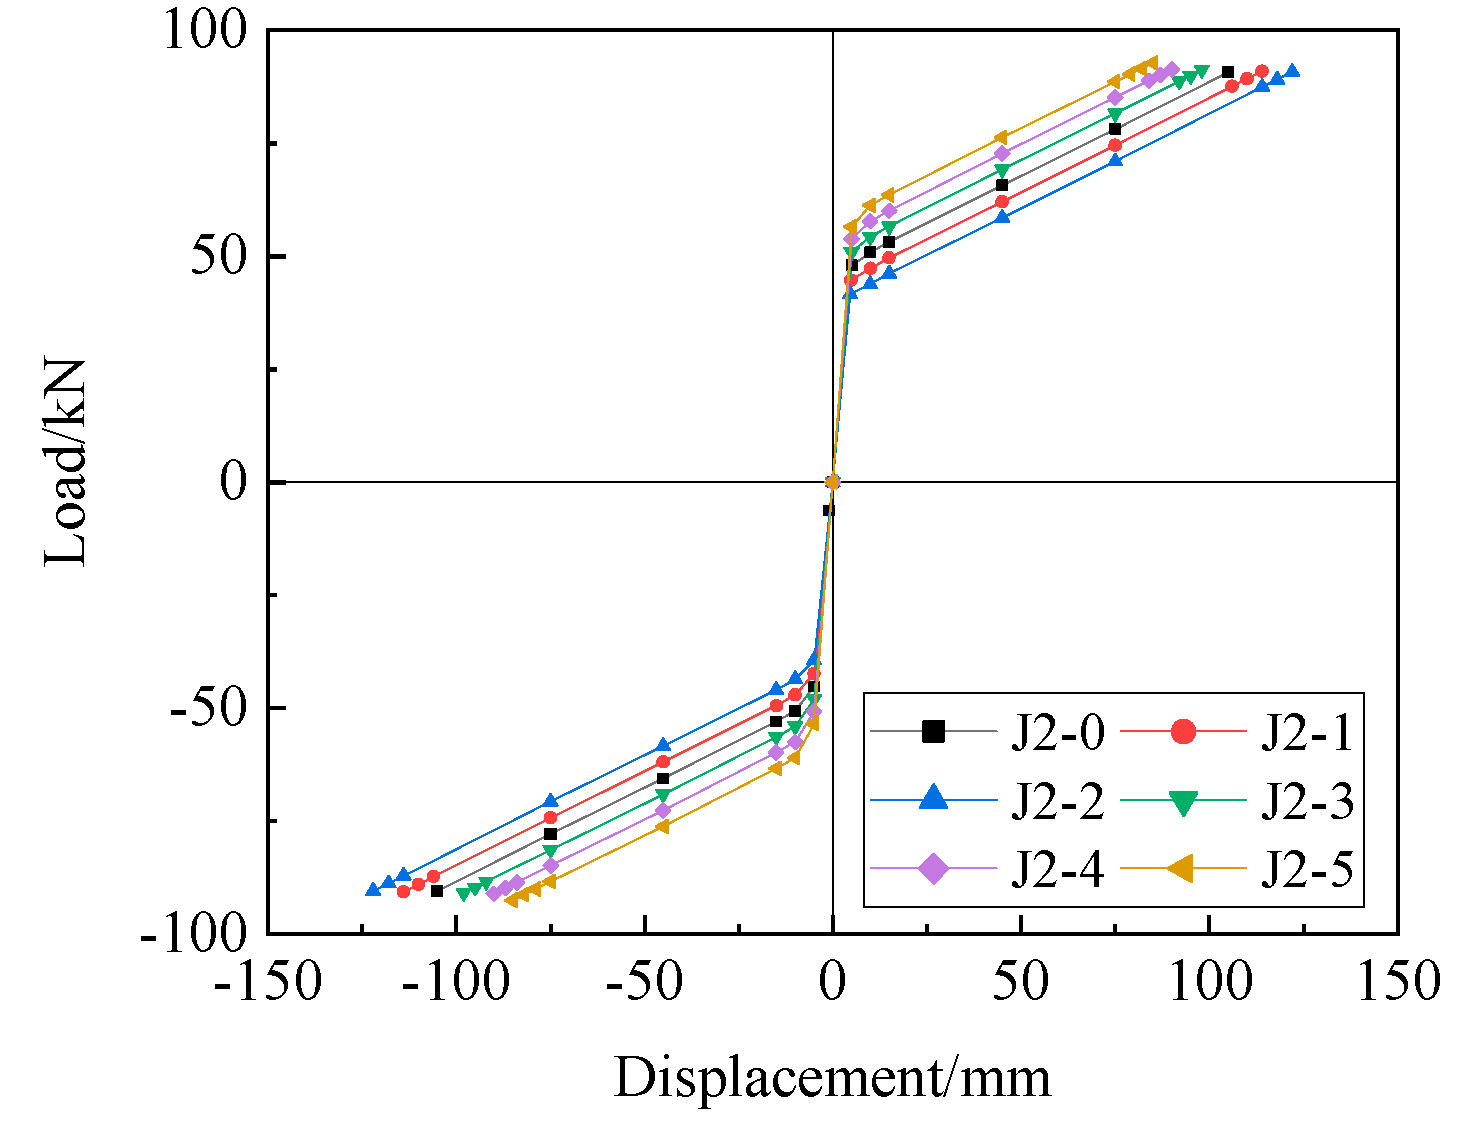
The load–displacement curves of J2-0~J2-5 are shown in Figure 20. As can be seen from Figure 20a, the opening loads of joints decreased with the decrease in the prestress of steel strands.
If the inflection points of the load–displacement curves (when the joint is opened) were defined as the yield of joints, with the decrease in the prestress of steel strands, the deformations of each joint from the opening to the maximum bearing capacity (yield of steel strands) increased gradually, which meant the ductility of each joint increased gradually. At the same time, the areas enclosed by the load–displacement curves increased gradually, indicating the increase in the energy dissipation of joints. However, this was not the direct result of the variation of steel strand tension, but, with the decrease in the steel strand pretension, the joint deformation capacity and friction energy dissipation were enhanced. It can be seen from Figure 20b that with the increase in prestress of steel strands, the opening loads of joints increased, and the energy dissipation and the ductility of each joint decreased gradually. Moreover, there was a negative correlation between the residual deformations of joints and the pretension of steel strands. Ratios of the residual deformations of J2-1~J2-5 were 1.5%, 2.9%, 0.8%, 0.6%, and 0.5%, respectively. The key data of the joint load–displacement curves are shown in Table 6.
(2)
Envelope Curves
The envelope curves of J2-0~J2-5 are shown in Figure 21. It can be seen from Figure 21 that the stiffness before opening and the second stiffness of each joint were basically consistent with each other, indicating that the stiffness before opening and the second stiffness had no correlation with the prestress of steel strands.
(3)
Stress Variation Curves of Steel Strands
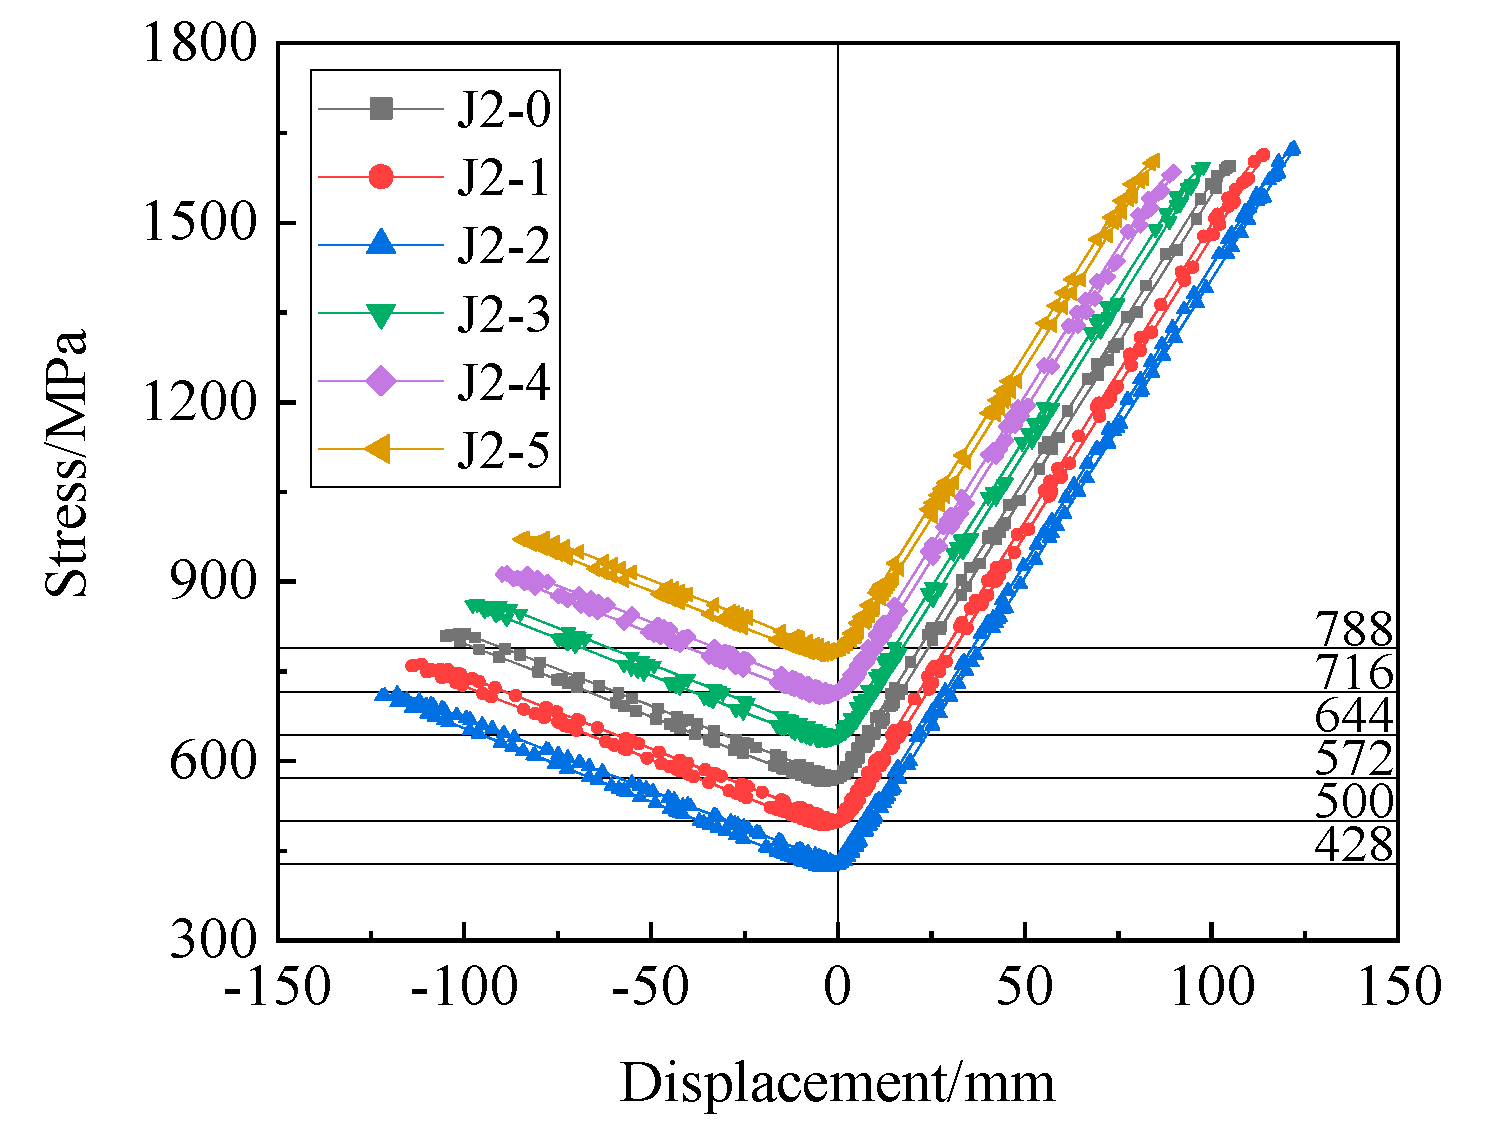
Similar to the above, only one steel strand from each joint was taken for stress variation analysis, and the relationship curves between the steel strand stress and the loading displacements are shown in Figure 22.
It can be seen from Figure 22 that the variation trends of the steel strand stress at J2-0~J2-5 were generally consistent with each other, which showed that the variation of steel strand stress was mainly related to its layout and the joint geometry, but not to the prestress of steel strands. When unloading, the stress of steel strands could return to prestress, and the stress loss was little. Moreover, with the increase in the prestress of steel strands, the stress values of steel strands increased level by level during cyclic loading. However, the available joint deformations decreased gradually before the steel strands yielded, indicating the decrease in the deformation capacity of joints. The steel strand stress of each joint remained elastic and changes stably during cyclic loading, which showed that the self-centering performance of joints was stable and reliable when the prestress of steel strands changed. In addition, the stress variation curves of steel strands had ring parts, which was also caused by the non-coincidence of loading and unloading trajectories of loading positions.
(4)
Energy Dissipation
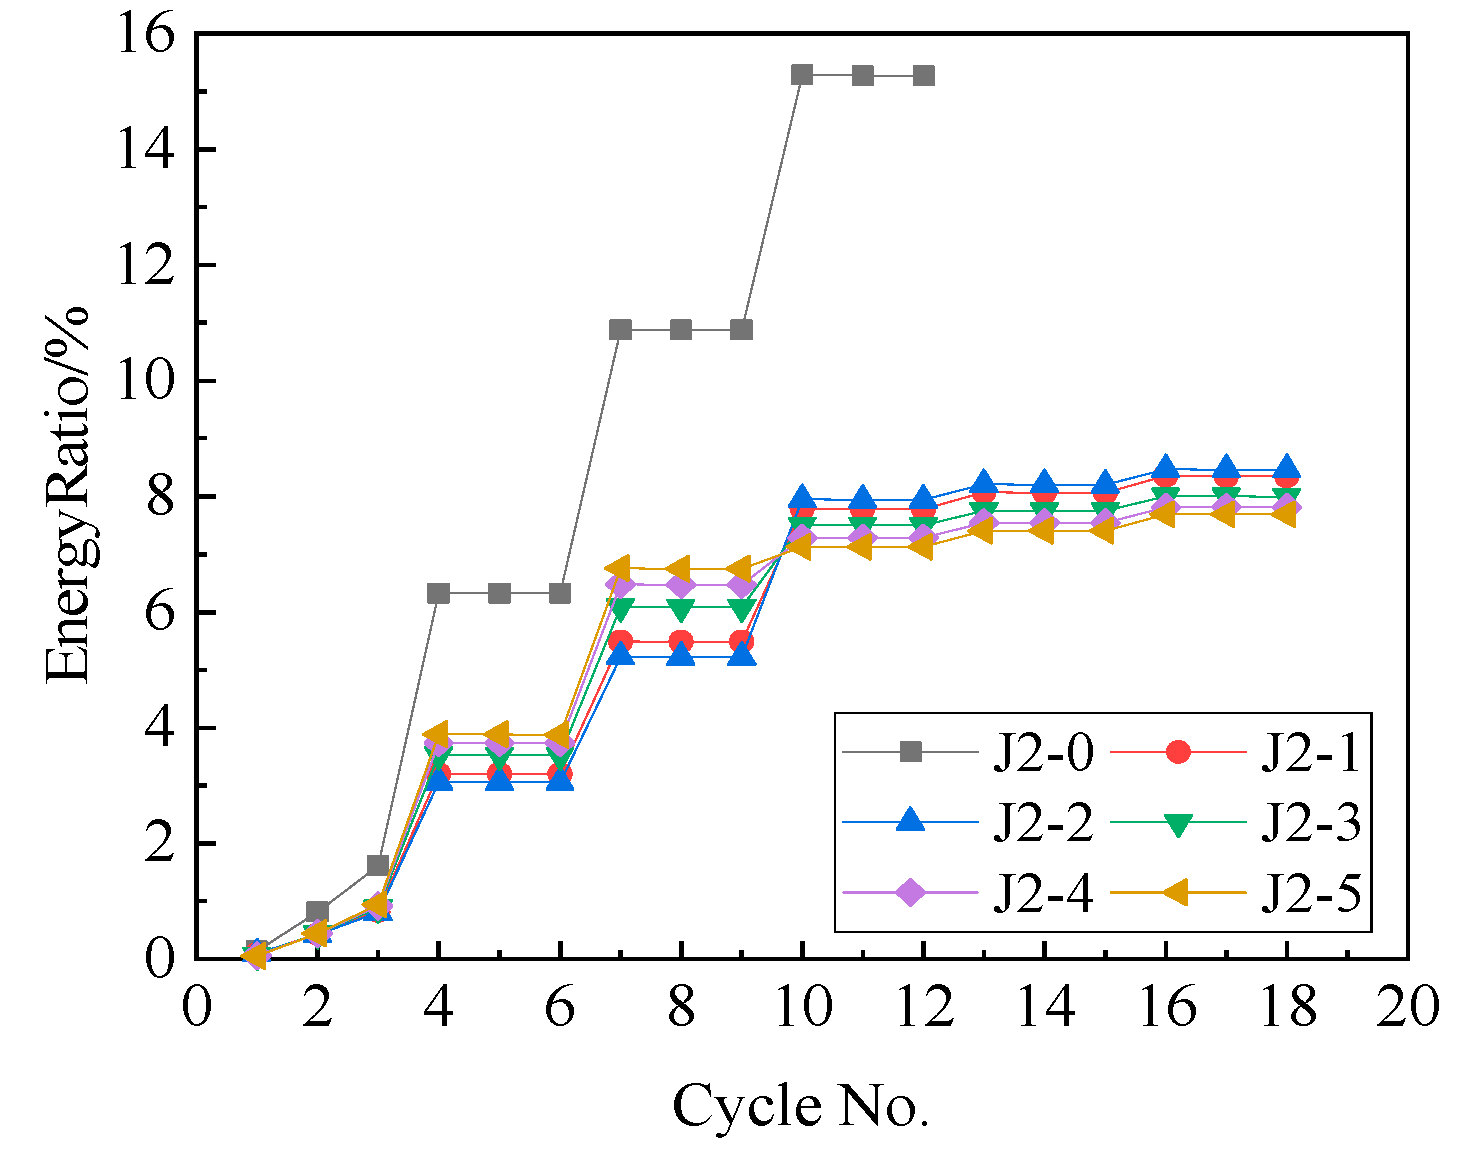
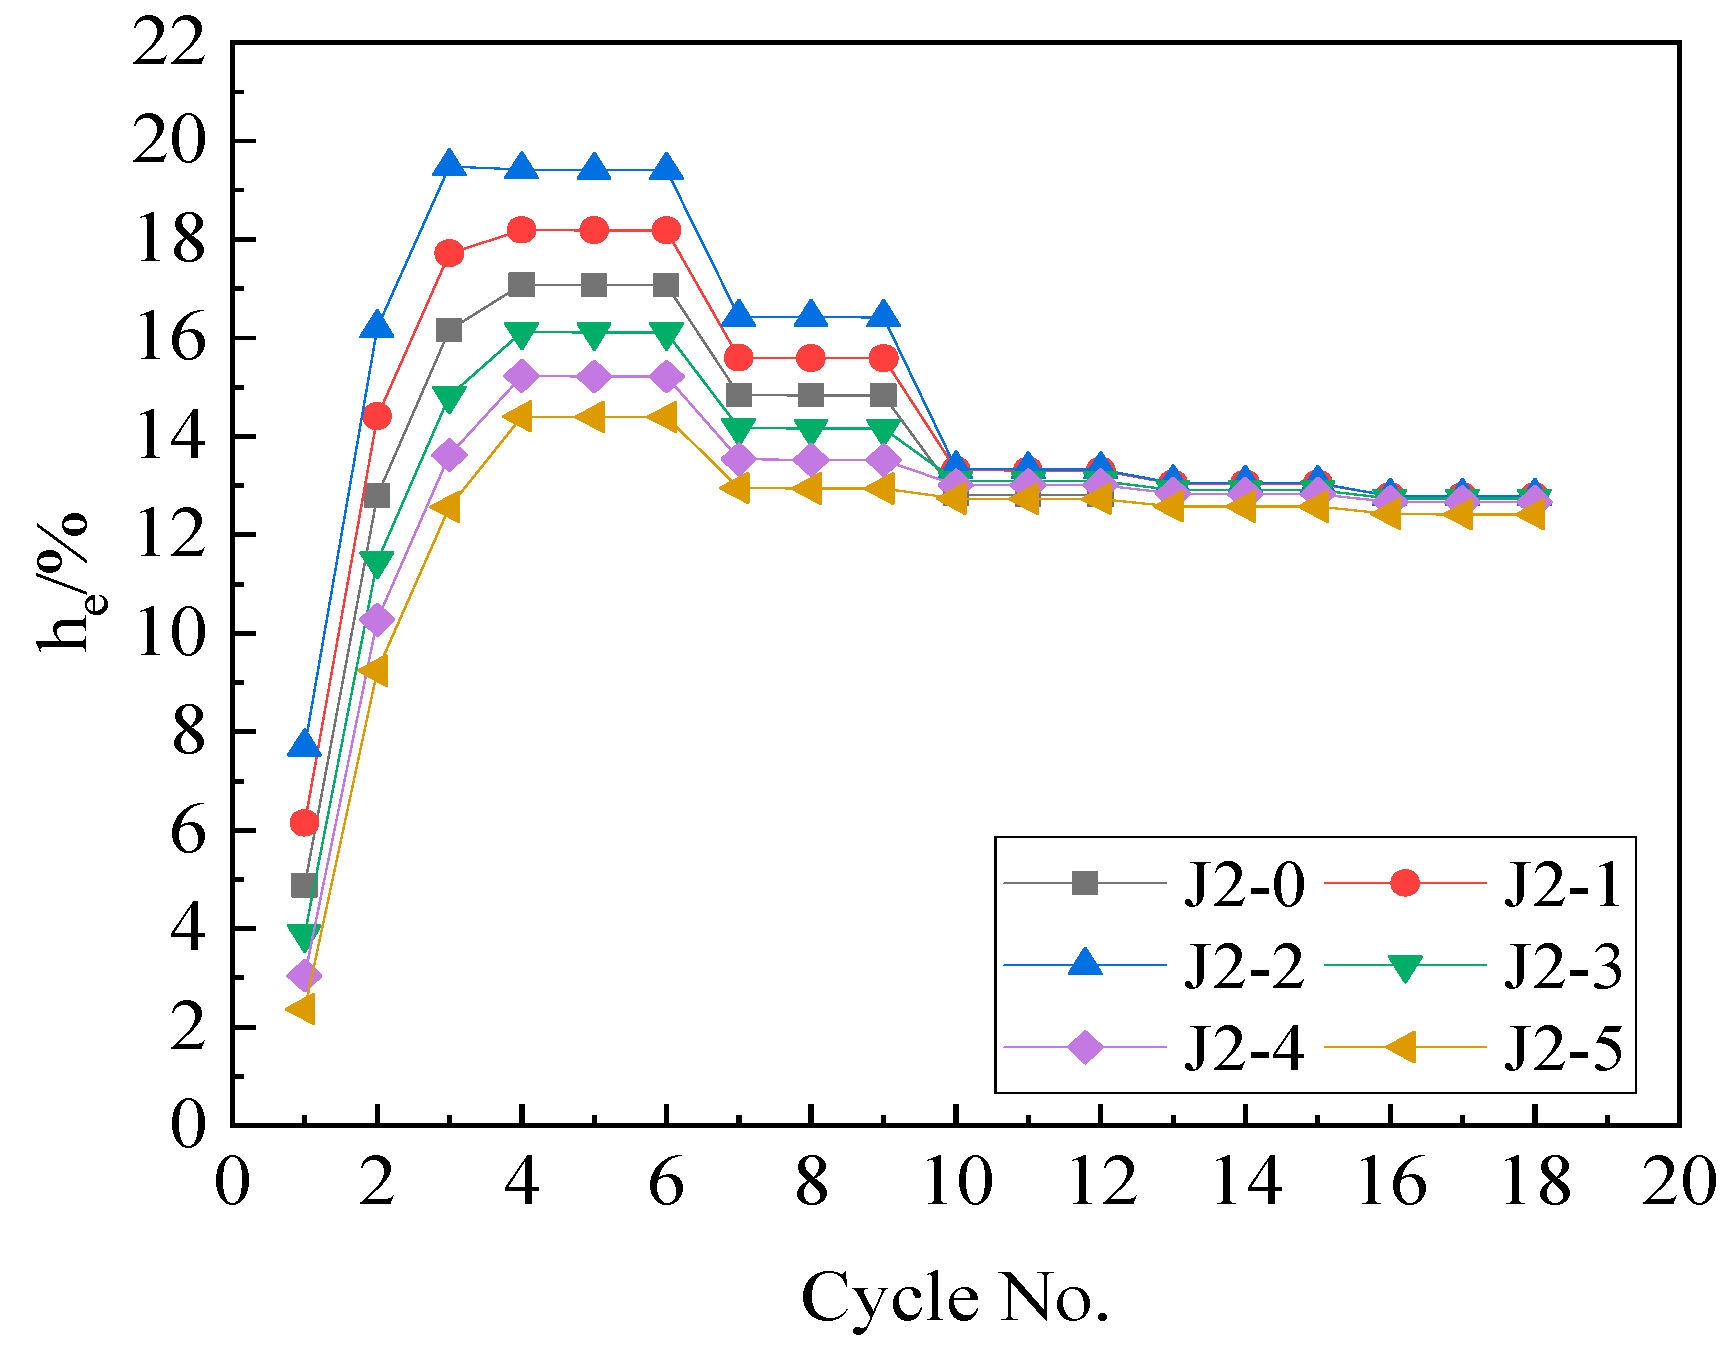
The energy dissipation ratio of each cycle is shown in Figure 23, and the equivalent viscous damping ratio he and the number of loading cycles is shown in Figure 24.
It can be seen from Figure 23 that the energy dissipation of each cycle of joints was stable. The energy dissipation ratio of J2-0 was significantly greater than that of other joints, because the numbers of loading cycles of J2-1~J2-5 were more than that of J2-0 under the large beam end displacements. From Figure 24, it could be concluded that the average values of he of each joint (J2-0~J2-5) after the second circle were: 15.0%, 14.8%, 15.3%, 13.9%, 13.5%, and 13.0%, respectively.
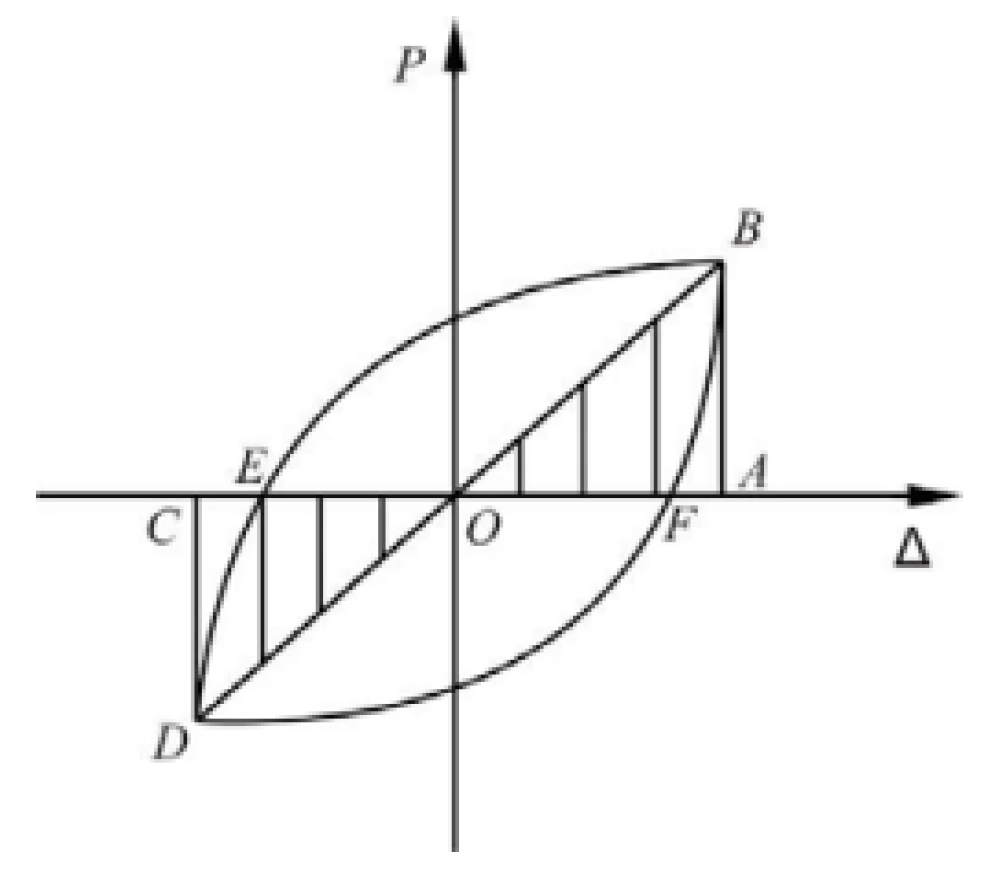
Furthermore, it can be seen from Figure 24 that the hemax of each joint decreased with the increase in prestress of steel strands. The calculation method of he is shown in Figure 25 and Equation (11).
h e = 1 2 π S FBE + S FDE S Δ AOB + S Δ COD
The bearing capacity of joints increased with the increase in prestress of steel strands, and the values of points B and D in Figure 25 increased accordingly; thus, S Δ AOB and S Δ COD in Equation (13) increased. However, there was no significant increase in the energy dissipation of joints (as shown in Figure 20), which eventually led to the decrease in he.

5.3. Ratio of the Tensile Moment to the Friction Moment in the Opening Moment

5.3.1. Parametric Settings

The influence of the values of the friction and the steel strand prestress on the mechanical behavior of joints has been analyzed, respectively, in Section 4.1 and Section 4.2. The influence of the ratio, β, of the tensile moment to the friction moment in the opening moments of joints is considered here. In the opening moments of the joints, β directly affects the self-centering performance and energy dissipation of joints, as well as the development of the bearing capacity of joints after the joints are opened. Therefore, β is important for the mechanical behavior of self-centering joints with design of energy dissipation by friction. The consistency of other parameters, other than the two moments, was controlled in order to determine their values. The parametric settings are shown in Table 7.
J2-0 was taken as the numerical model J3-0 for parametric analysis here. The opening moment of 130 kN∙m of J3-0 was kept as the fixed value; four groups of joints were established according to the different values of β, as shown in Table 7. The loading protocol of the four groups of comparison joints were different with each other, and the specific process was the same as Section 5.2.

5.3.2. Results and Analysis

(1)
Load–Displacement Curves
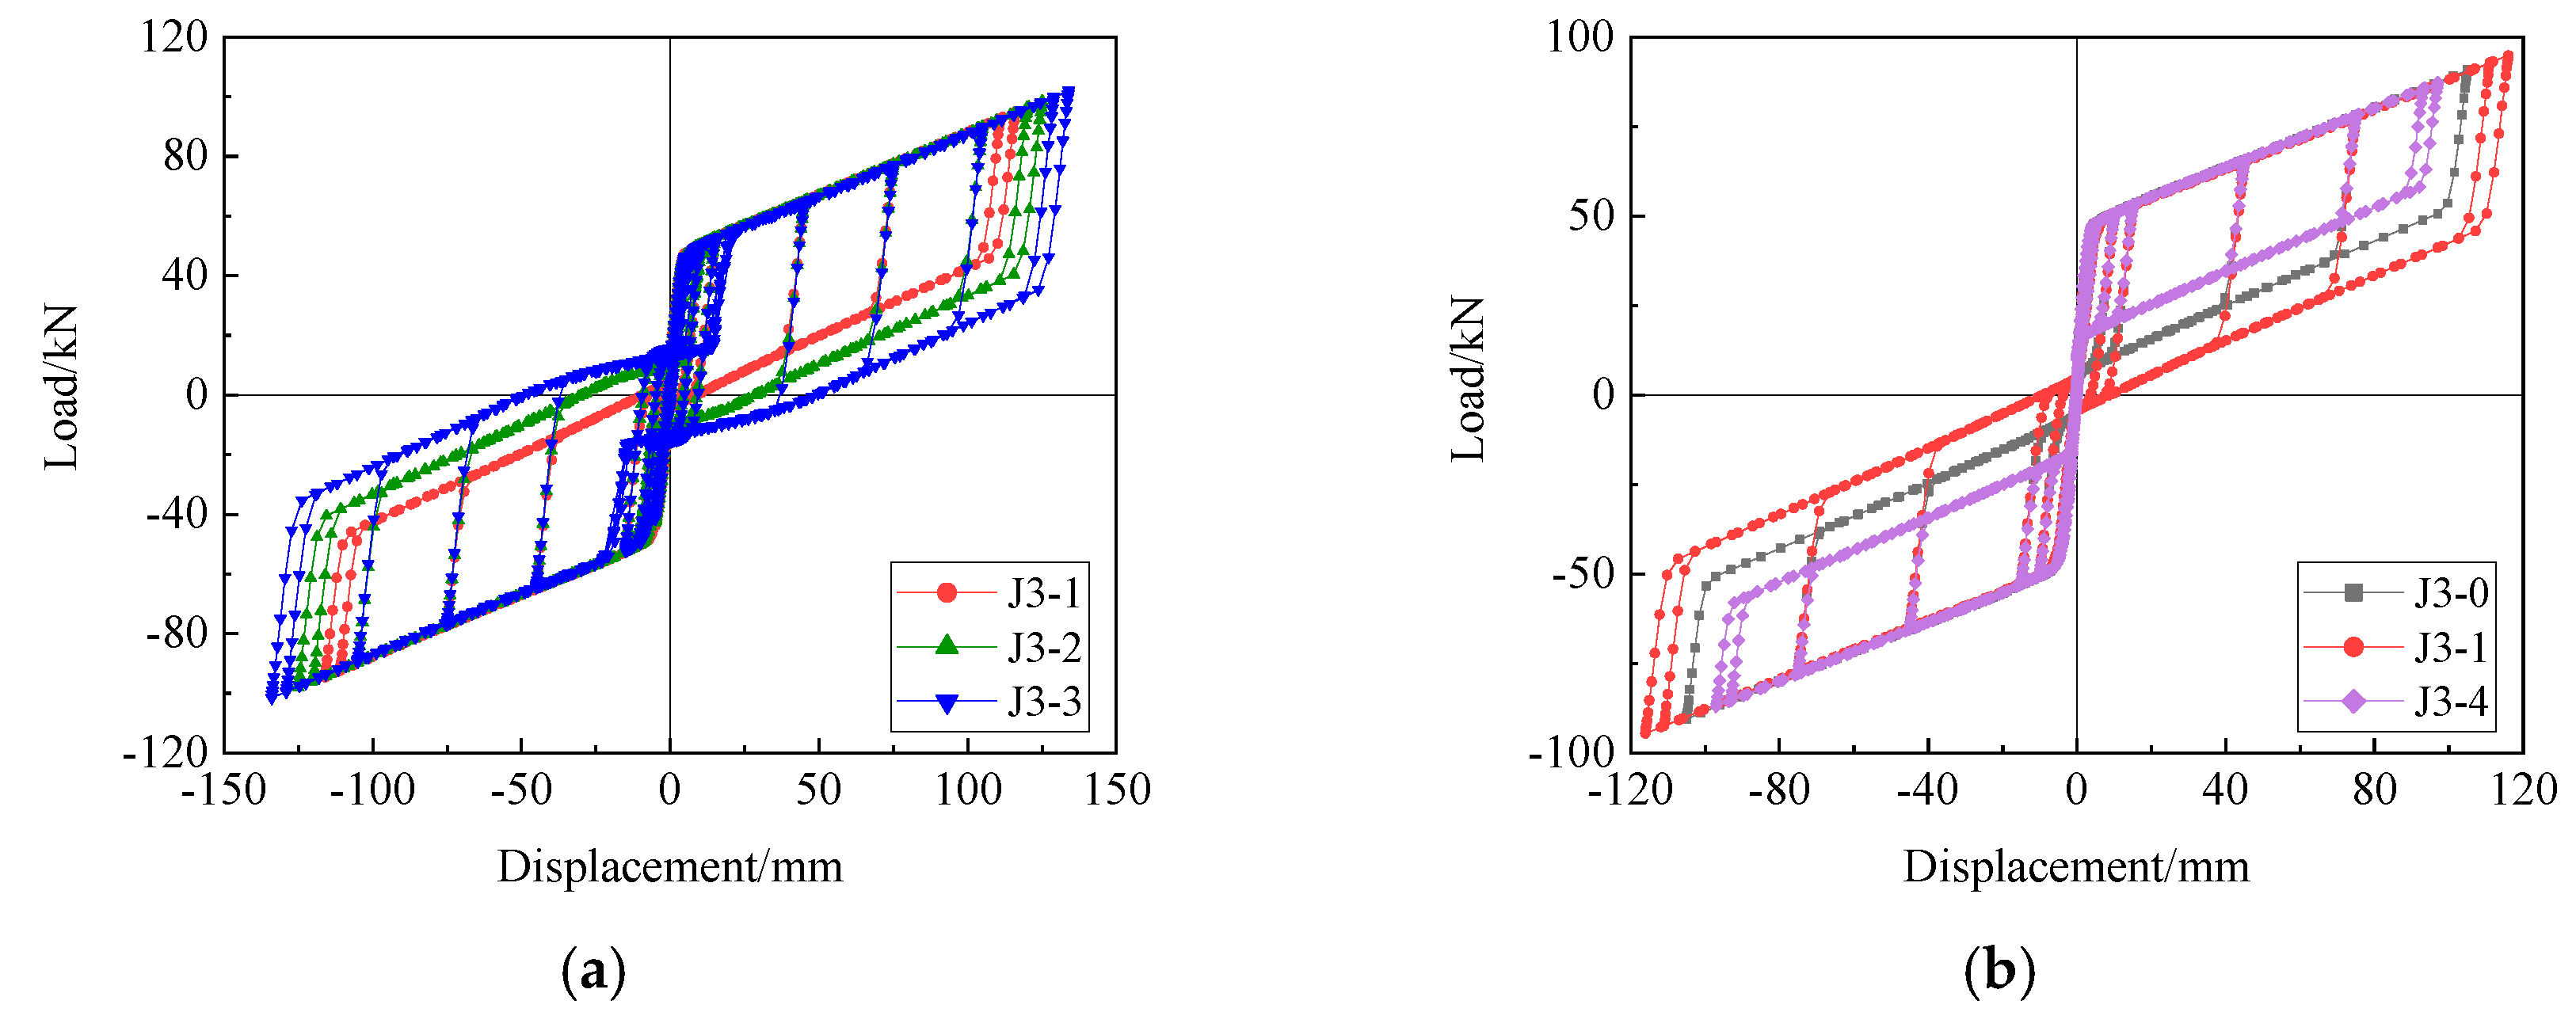
The load–displacement curves of J3-0~J3-4 are shown in Figure 26. As can be seen from Figure 26a, the areas enclosed by the load–displacement curves increased gradually with the decrease in β, indicating the increase in the energy dissipation of joints. The residual deformations of joints increased gradually, and the self-centering performance decreased, indicating that the joints changed from the type of both self-centering and energy dissipation to the type of energy dissipation. The reason is that with the increase in the proportion of the friction moment in joints, the energy dissipation under the same rotational deformation of joints increased, and the reduction of strand prestress enhanced the deformation capability of joints. As result, the energy dissipation of joints was enhanced. However, the tensile moment when unloading was not enough to resist the friction moment, resulting in the increase in the residual deformations of joints.
In addition, the maximum bearing capacity of joints increased gradually with the decrease in β. The reason was that the maximum tension of steel strands was fixed; with the increase in the friction moment in the opening moment, the sum of the maximum tensile moment and the friction moment increased. At the same time, the ductility of joints was gradually improved. It can be seen from Figure 26b that with the increase in β, the variation trend of the maximum bearing capacity, the energy dissipation, the residual deformations, and the ductility of joints was opposite to the above, and the reason was consistent with the above and would not be repeated. The key data of load–displacement curves are shown in Table 8.
It could not be ignored that the load–displacement curves of J3-2 and J3-3 had similar horizontal parts. The reason was that the resultant force of the steel strand tension and joint friction of J3-2 and J3-3 were (212.8 kN, 293.4 kN) and (159.6 kN, 342.4 kN) respectively. Therefore, the respective friction of J3-2 and J3-3 was sufficient to resist the steel strand tension. When the joint was opened for the first time and loaded in a negative direction, the steel head disengaged from the connecting block and maintained the disengaged state. At the same time, a rotation center was formed somewhere in the central axis of the beam. In addition, the steel strands were symmetrically arranged along the central axis of the beam. When the beam rotated around the new rotation center, the increase and decrease in the tension of the upper and lower steel strands were approximately the same, resulting in the approximate invariance of the tensile moment, thus forming a similar horizontal part of the load–displacement curves. Then, as the rotation deformation of the beam increased, the displacement of the steel head made up for the outward movement of the rotation center, the steel head contacted the connecting block again, and the deformation characteristics of joints returned to the theoretical model.
(2)
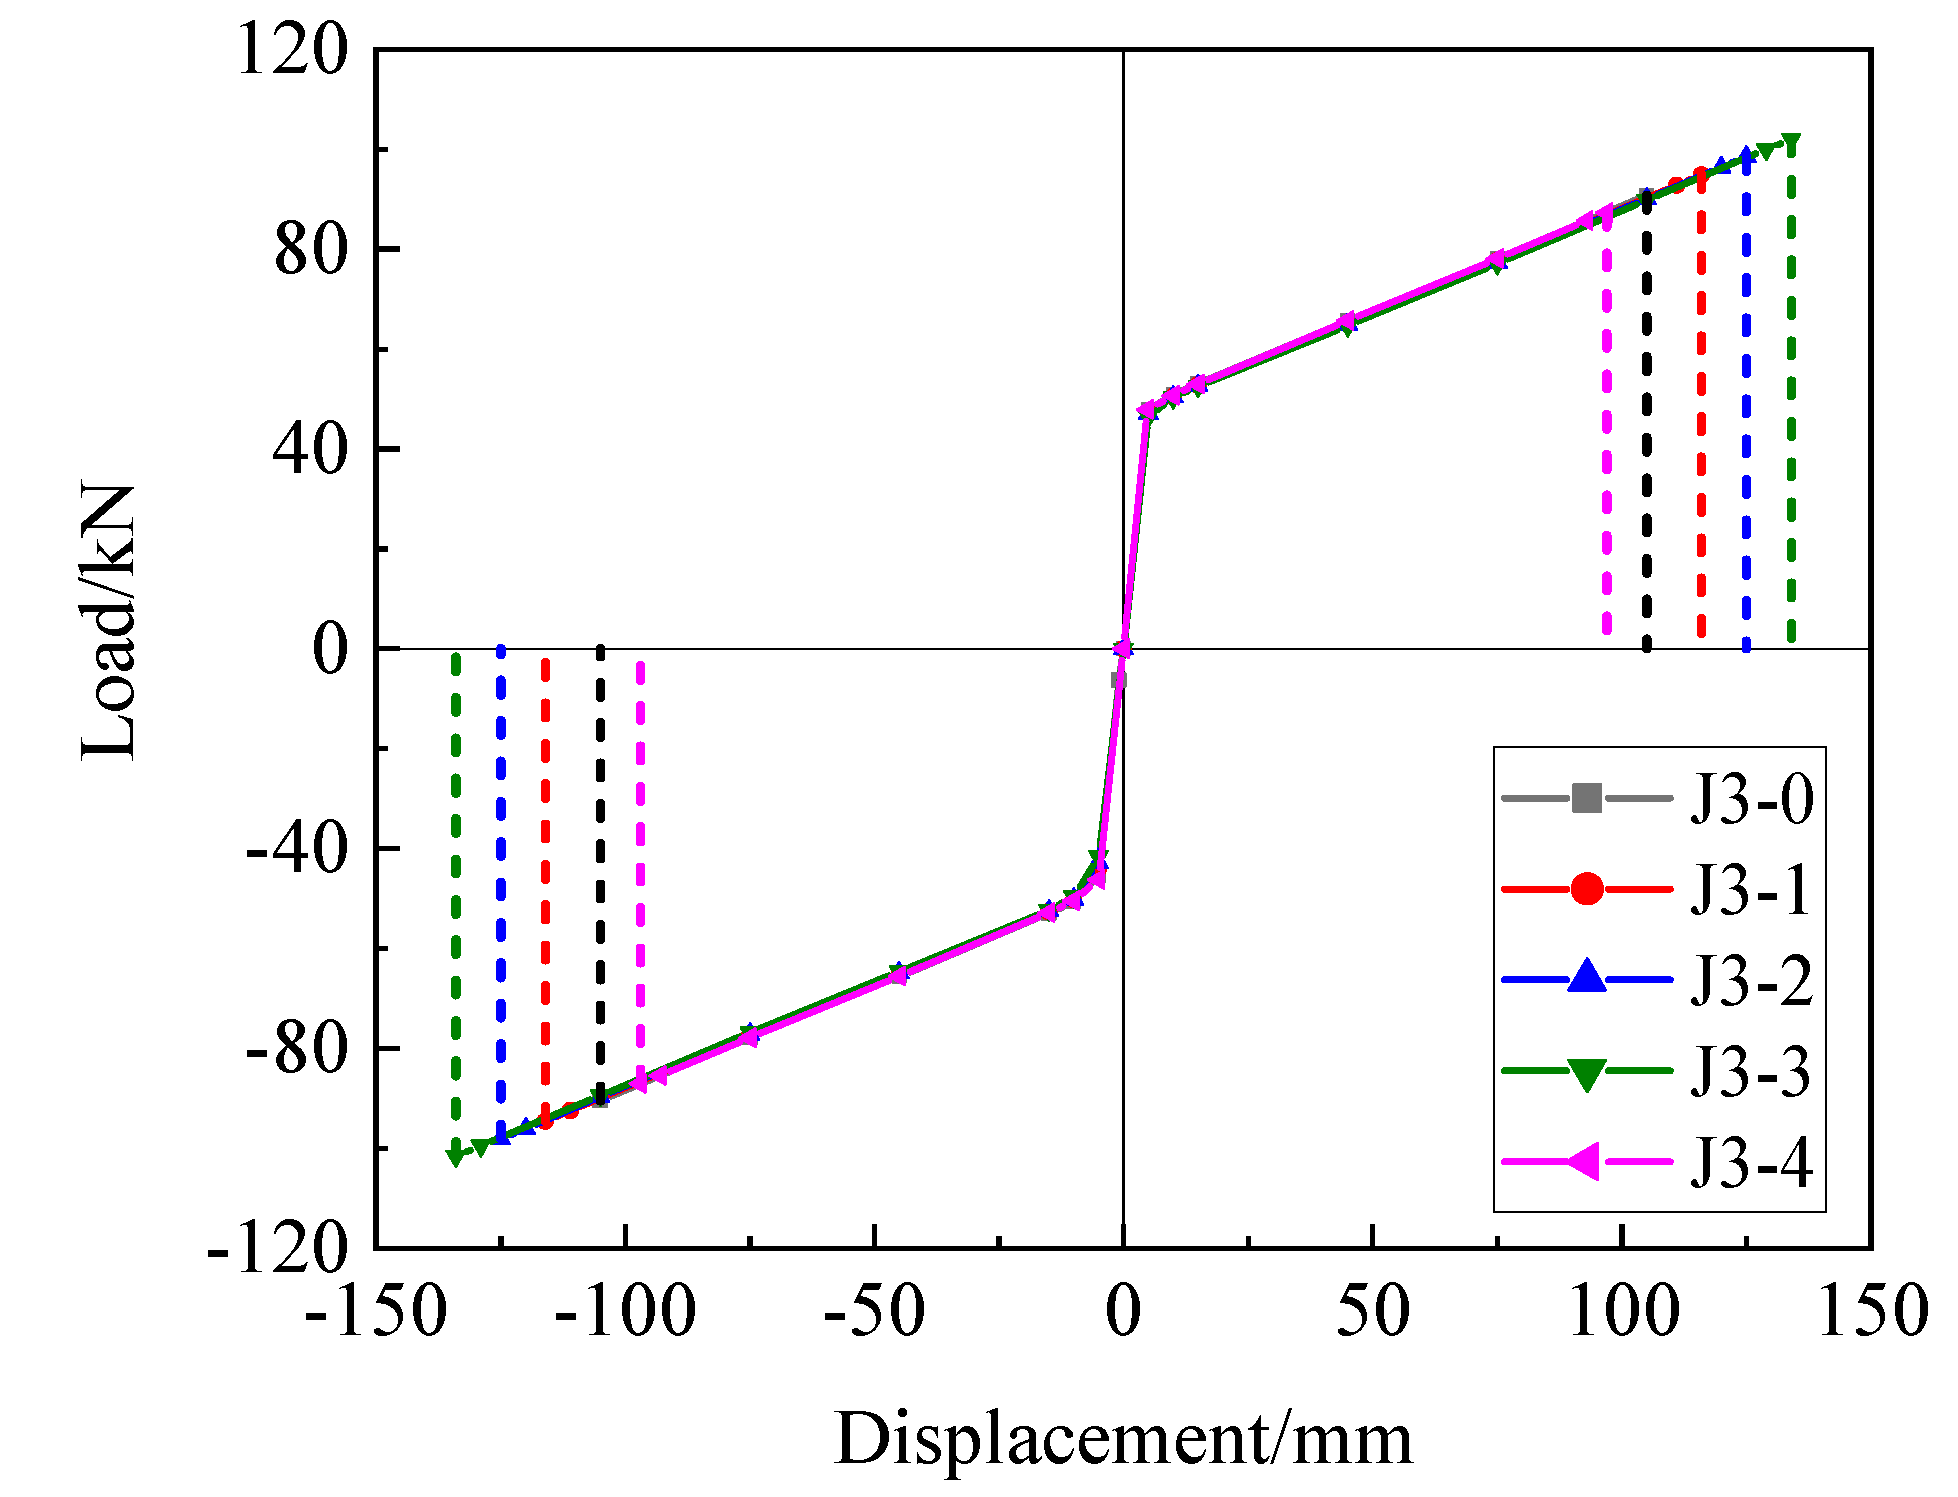
Envelope Curves
The envelope curves of J3-0~J3-4 are shown in Figure 27. As can be seen from Figure 27, the stiffness before opening, the opening load, and the second stiffness of each joint were basically consistent with each other. The maximum bearing capacity of joints and their corresponding deformations increased with the increase in β.
(3)
Stress Variation Curves of Steel Strands
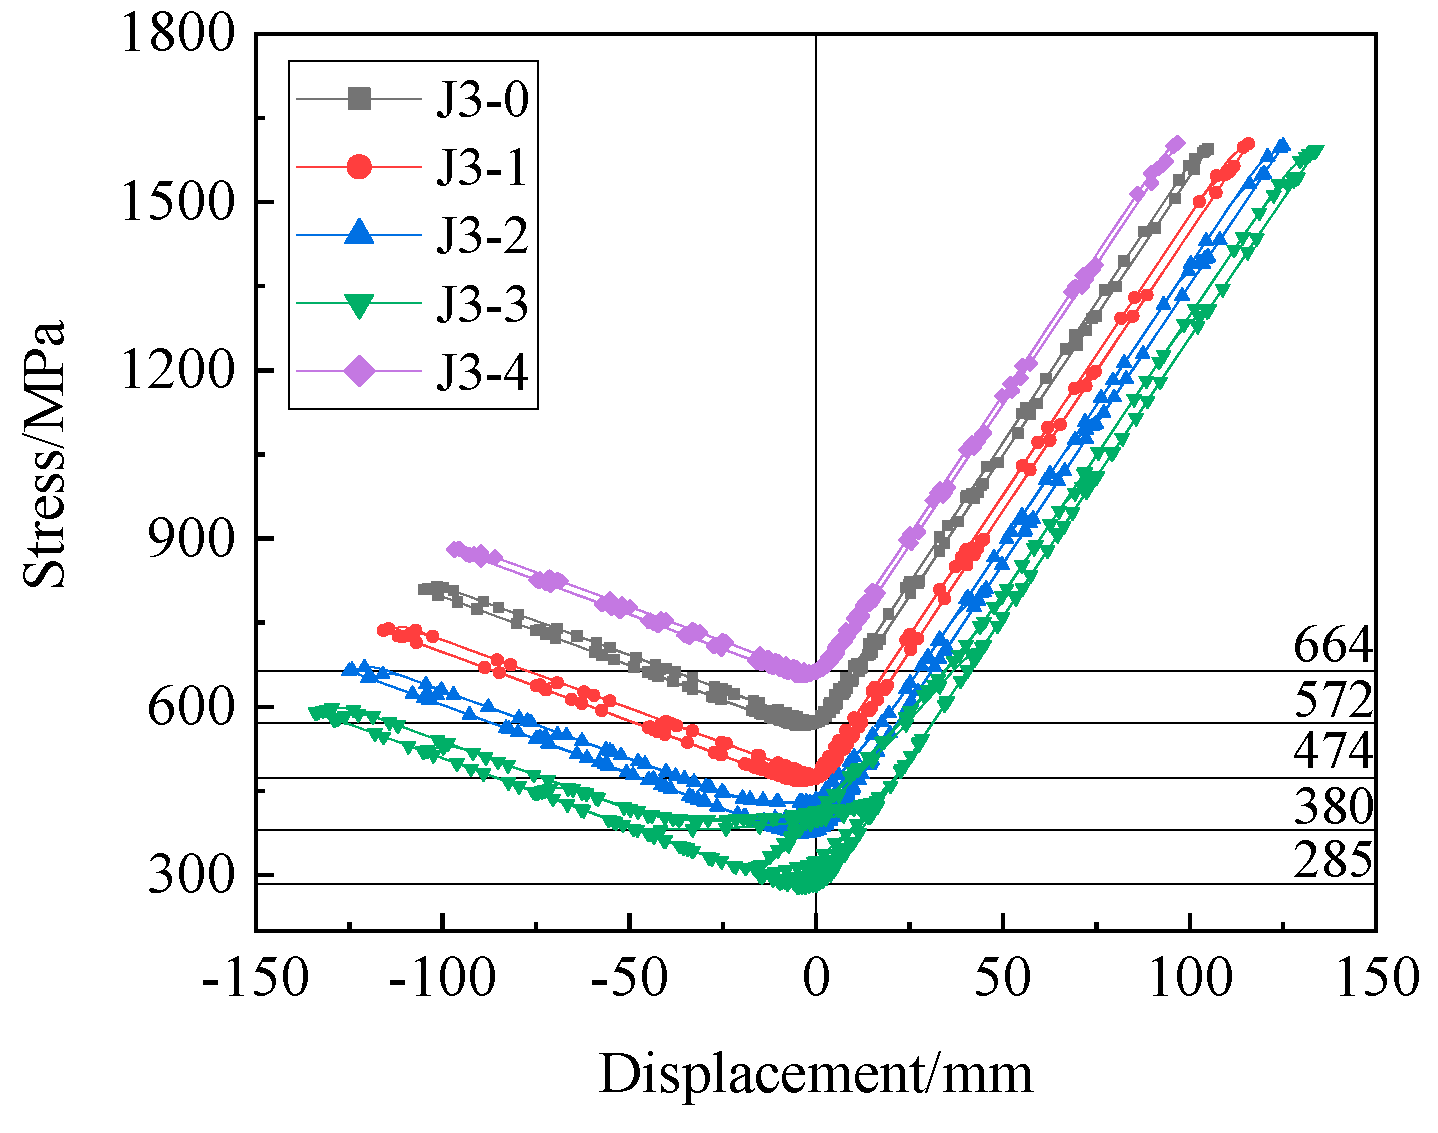
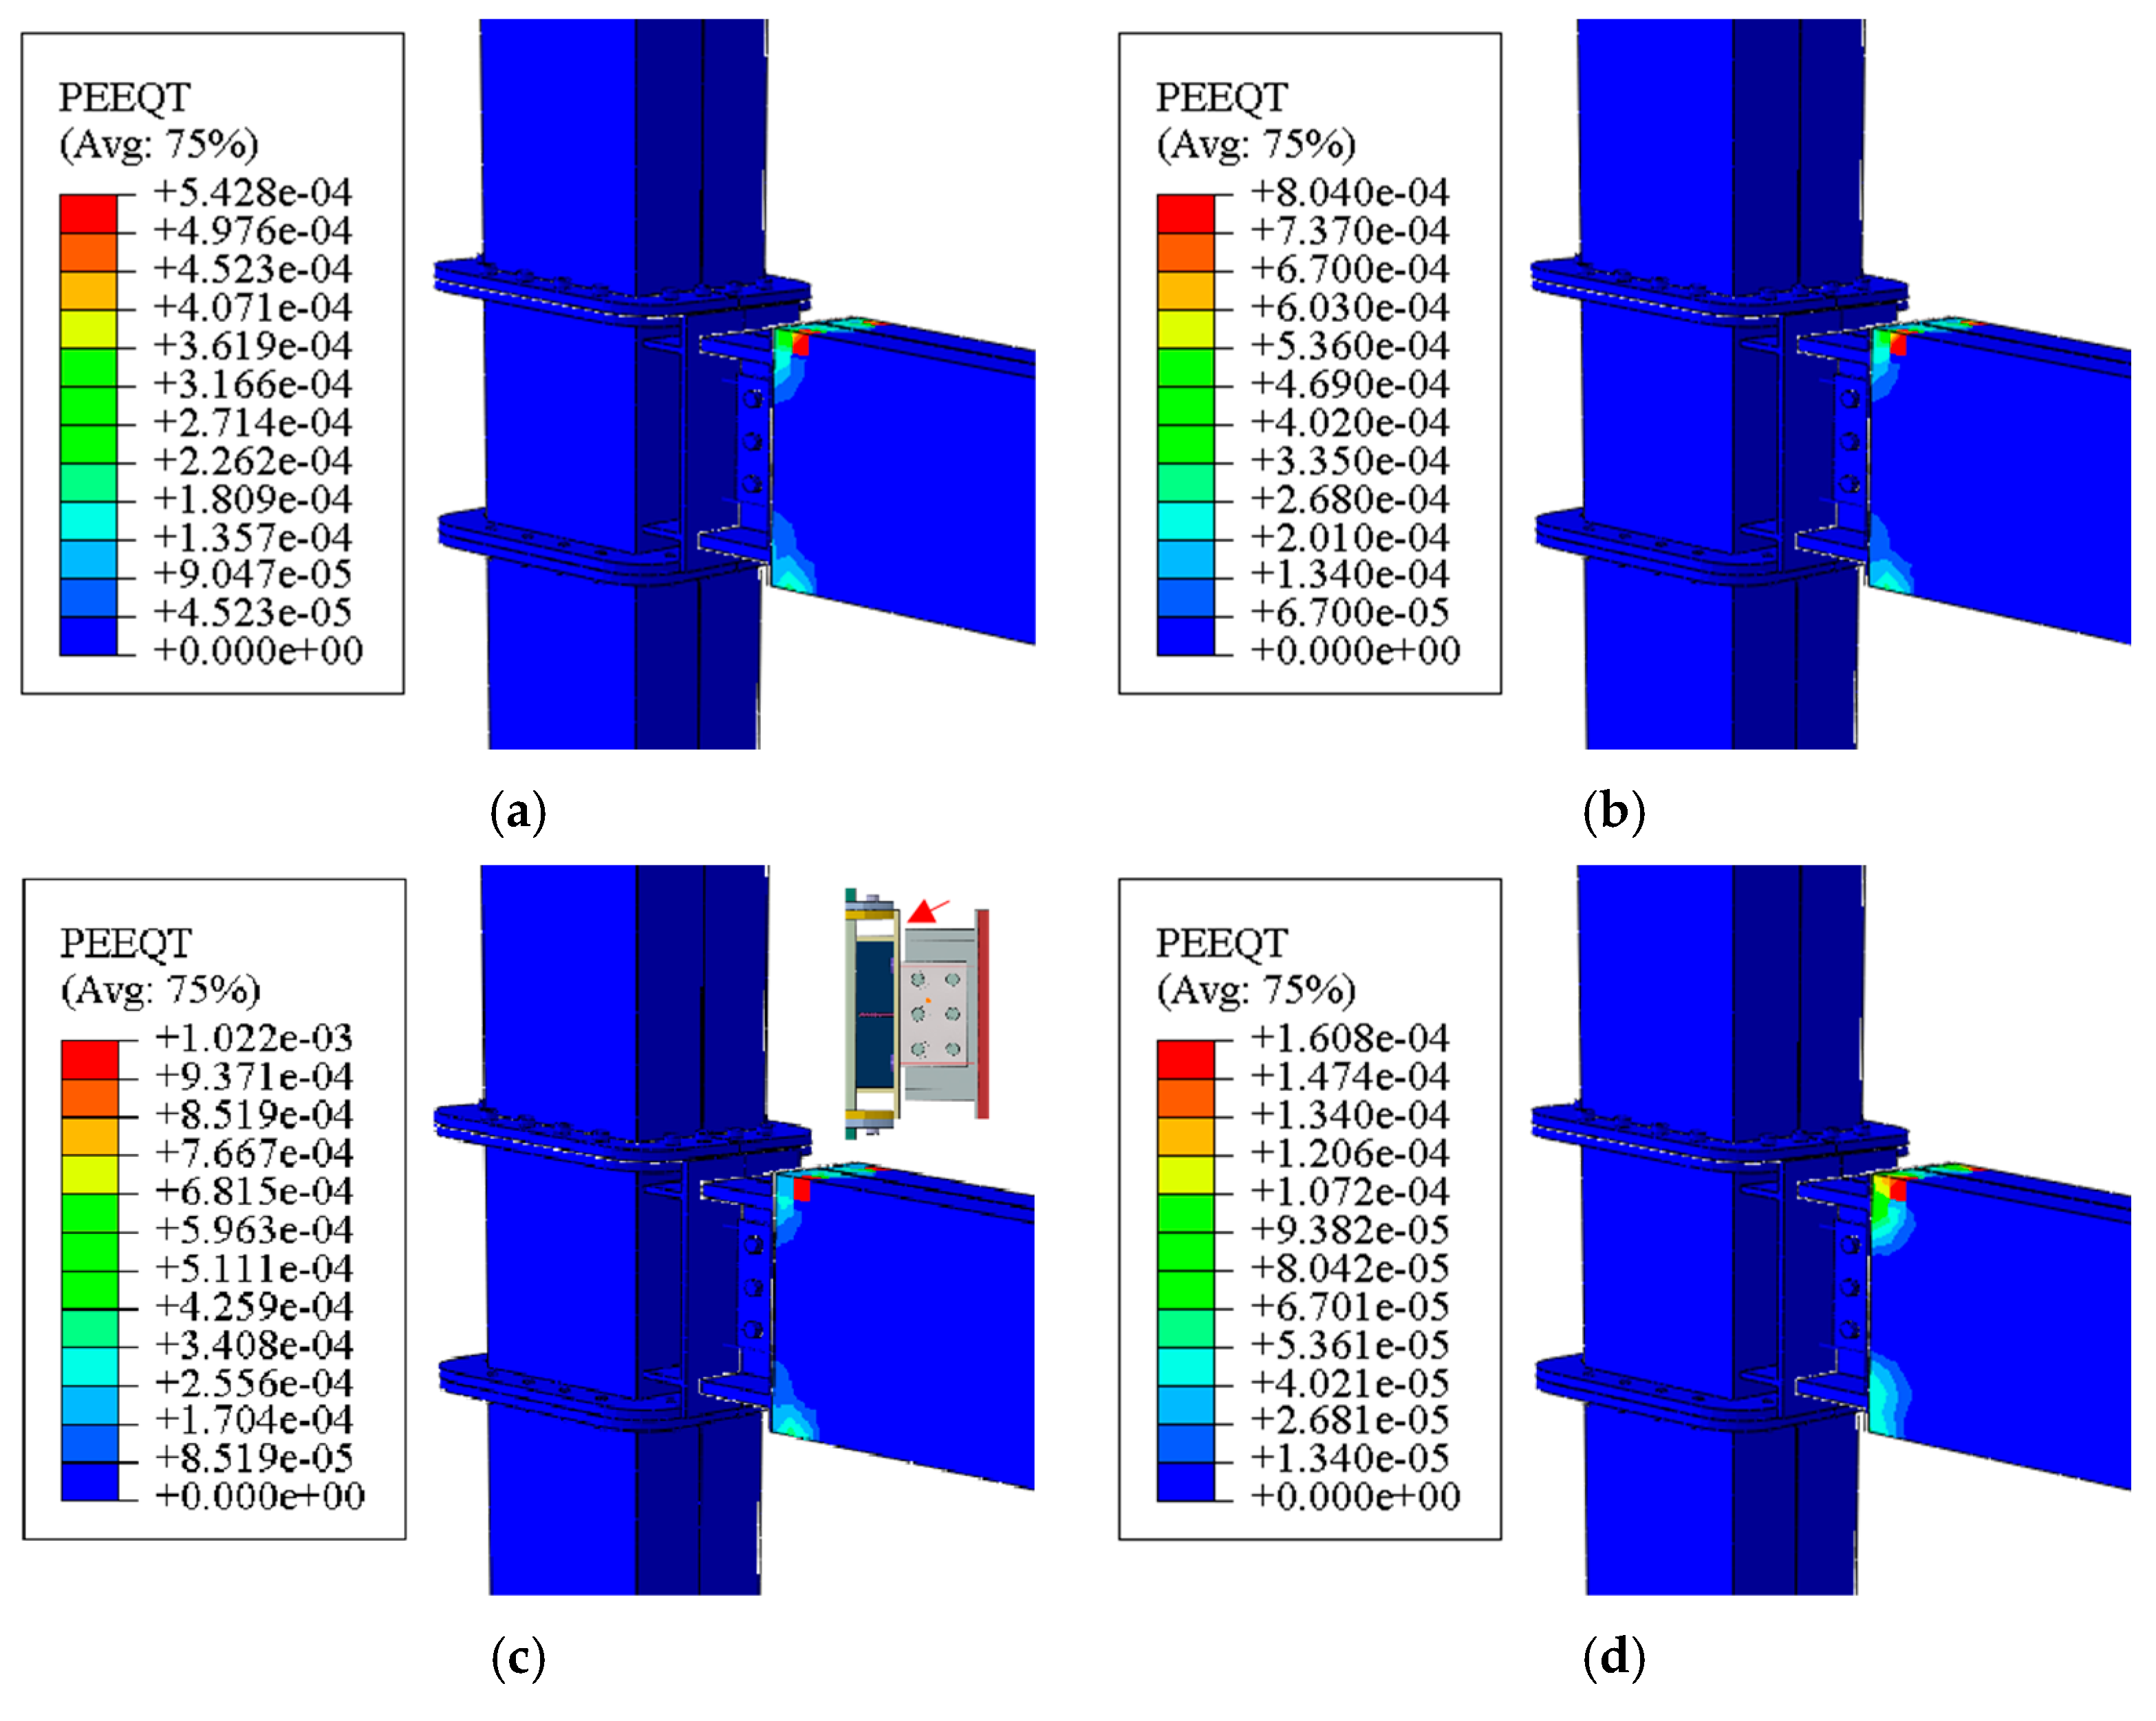
Stress variation curves of steel strands of J3-1~J3-4 are shown in Figure 28 (J3-0 is the same with J1-0). It can be seen from Figure 28 that when unloading, the stress of steel strands of J3-0, J3-1, and J3-4 returned to their prestress respectively, and the stress loss is little. The steel strand stress of J3-2 and J3-3 could not return to their prestress when unloaded to the initial positions. The reason was the same as that in Figure 26a. When the joint was completely unloaded, the steel head at the joint could not be fully close to the connecting block, resulting in the tensile state of steel strands beyond pretension (as shown in Figure 29). The pretension of steel strands of J3-0, J3-1, and J3-4 was greater than their friction, respectively, and the steel head could be close to the connecting block, thus there was no over-tension state of steel strands when unloading.
In addition, as can be seen from Figure 28, with the decrease in β, the stress of steel strands decreased level-by-level during cyclic loading, but the available joint deformations increased gradually before steel strands yielded, indicating the increase in the deformation capacity of joints.
(4)
Energy Dissipation
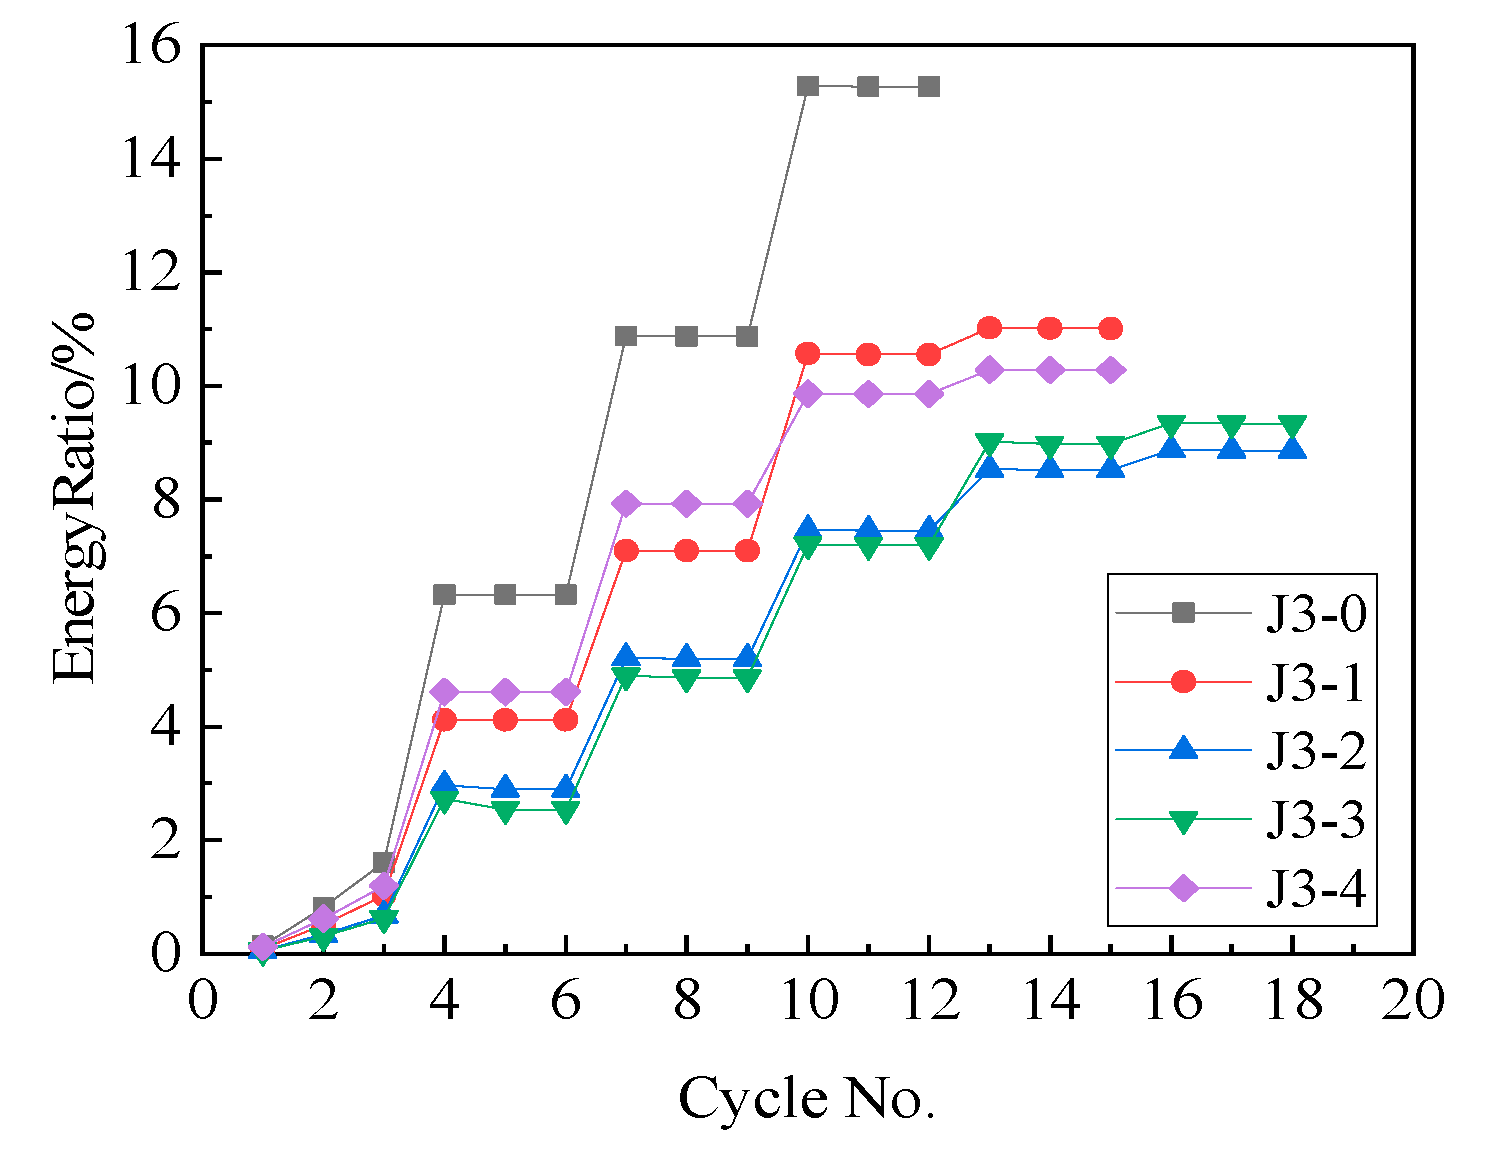
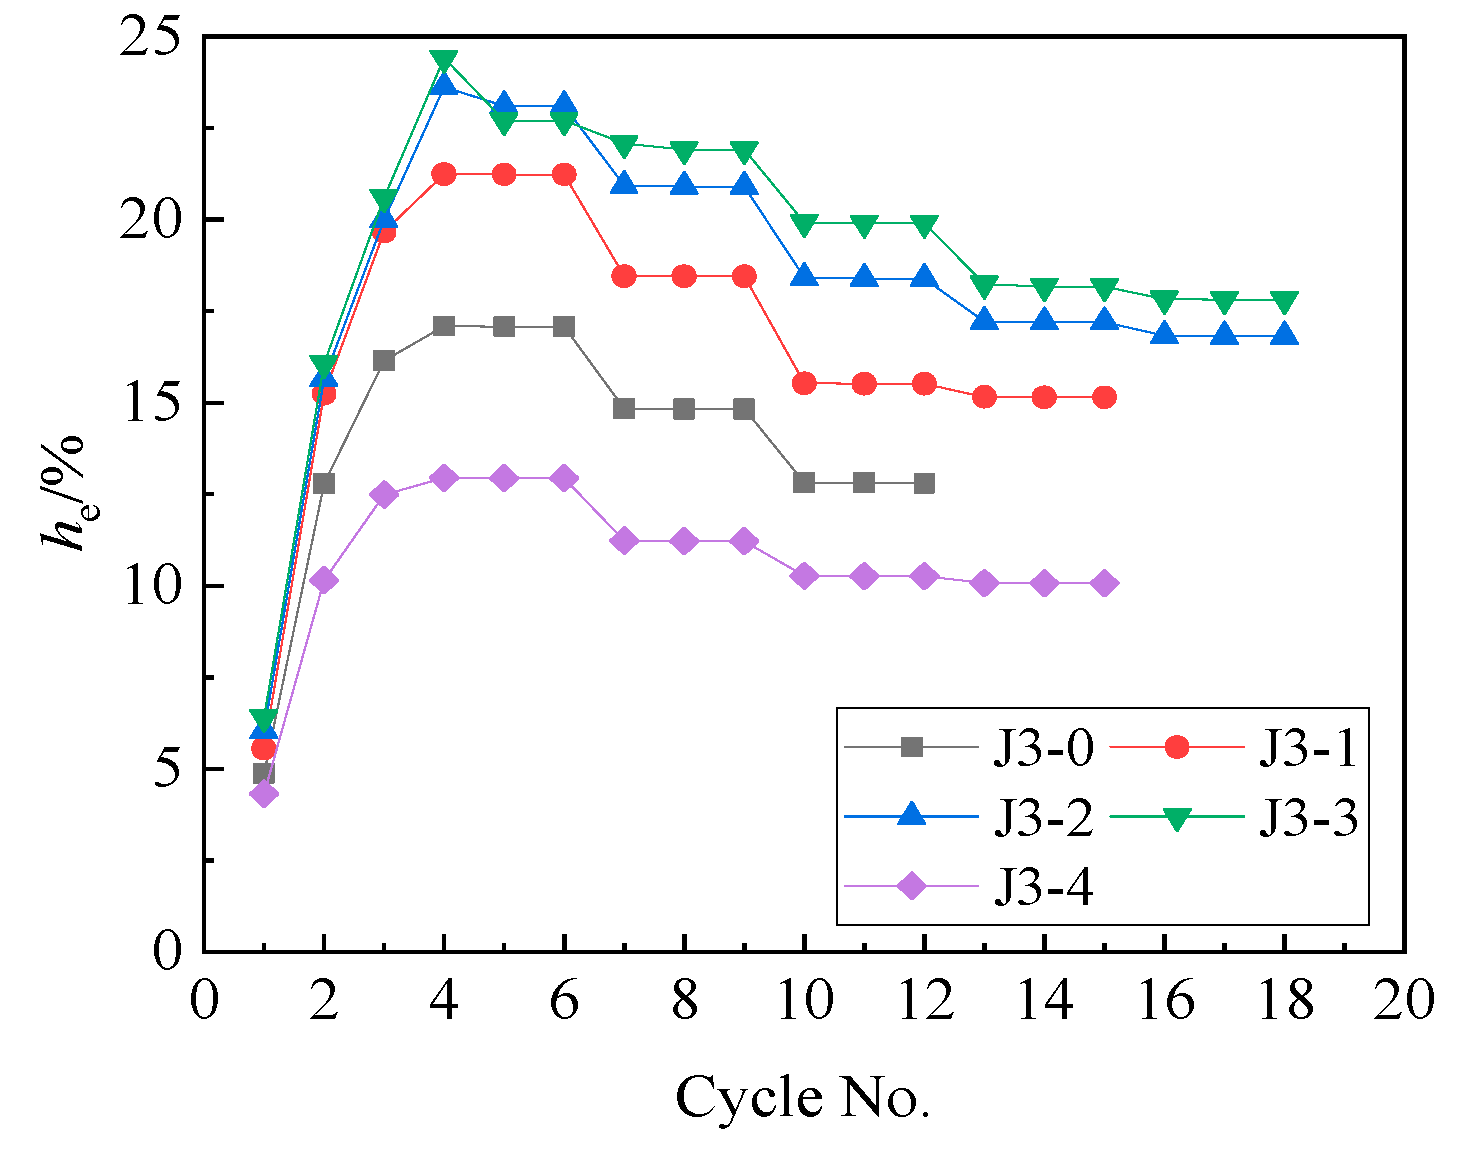
The energy dissipation ratio of each cycle is shown in Figure 30, and the equivalent viscous damping ratio he is shown in Figure 31.
As can be seen from Figure 30, the energy dissipation of each circle of each joint was stable. β of J3-0 was significantly greater than that of other joints for the same reason as Figure 23. As can be seen from Figure 31, the hemax of each joint decreased with the increase in β for the same reason as Figure 24. The average values of he of each joint after the second cycle were (J3-0~J3-4): 15.0%, 17.7%, 19.4%, 20.3%, and 11.2%, respectively.

6. Conclusions

Through the comparison of a numerical model of the joint and three groups of joints with different parameter settings, the obtained data such as load–displacement curves, envelope curves, and stress variation curves of steel strands were analyzed. The influences of friction, steel strand prestress, and the ratio of the tensile moment to the friction moment in the joint-opening moment on the mechanical behavior of the joints were studied. The following conclusions are obtained:
(1)
The self-centering joint between the CFDST column and the RC beam proposed in this paper achieves stable energy dissipation and good self-centering performance under cyclic loading.
(2)
Increasing friction can enhance the energy dissipation with hemax greater than 21% and increase the opening load and the maximum bearing capacity of the joint. However, when the friction is excessive, the residual deformation of the joint increases with the max residual deformation rate of 35.0%, and the self-centering performance of the joint decreases.
(3)
Increasing prestress of steel strands can increase the opening load of the joint, enhance the energy dissipation and the deformation capacity of the joint, and reduce the residual deformation of the joint with the minimum residual deformation rate of 0.3%, but the maximum bearing capacity of the joint cannot be improved by increasing the prestress of steel strands.
(4)
Reducing the ratio of the tensile moment to the friction moment in the opening moment can enhance energy dissipation and maximum bearing capacity of the joint and improve the joint ductility. However, the residual deformation of the joint increases significantly, and the self-centering performance decreases.
(5)
When the structure is required to achieve good energy dissipation and good self-centering performance, the tensile moment in the opening moment of the joint shall be controlled to account for more than 50%, and the greater value shall be taken to avoid the decline of the self-centering performance in case of stress loss of steel strands caused by the structural deformation. Moreover, the joint should have the opening load as large as possible, even though the sufficient deformation capacity of the joint is needed. In addition, the resultant force of the initial tensile force of steel strands shall be greater than the friction so as to keep the steel head in contact with the connecting block during cyclic loading, which ensures the stability of the self-centering performance of the joint.
(6)
The joint restoring force model was in good agreement with the numerical model and could be used as references for the further theoretical research on the connection between CFDST columns and steel beams.

Author Contributions

Data curation, H.M.; Formal analysis, S.S.; Investigation, S.S.; Project administration, X.Y.; Resources, X.Y.; Supervision, X.Y.; Writing—original draft, S.S.; Writing—review and editing, S.S. and X.L. All authors have read and agreed to the published version of the manuscript.

Funding

This work was financially sponsored by National Natural Science Foundation of China [NO. 52278490], the Science and Technology Planning Project of Fujian [NO. 2022Y3001] and the Science and Technology Planning Project of Fuzhou [NO. 2021-Y-082].

Data Availability Statement

Not applicable.

Conflicts of Interest

The authors declare no conflict of interest.

References

  1. Han, L.H.; Zhao, X.L. Investigation on concrete filled double skin steel tubes (CFDSTs) under pure torsion. J. Constr. Steel Res. 2013, 90, 221–234. [Google Scholar]
  2. Tao, Z.; Han, L.H.; Zhao, X.L. Behaviour of concrete-filled double skin (CHS inner and CHS outer) steel tubular stub columns and beam-columns. J. Constr. Steel Res. 2004, 60, 1129–1158. [Google Scholar] [CrossRef]
  3. Zhang, Y.; Guo, D. Structural Analysis of Concrete-Filled Double Steel Tubes; Springer: Singapore, 2021. [Google Scholar]
  4. Hu, Y.; Zhao, J.; Zhang, D.; Chen, C. Experimental seismic performance of CFDST-steel beam frames with different construction details. J. Constr. Steel Res. 2019, 162, 105736. [Google Scholar] [CrossRef]
  5. Zhang, Y.F.; Zhao, J.H.; Cai, C.S. Seismic behavior of ring beam joints between concrete-filled twin steel tubes columns and reinforced concrete beams. Eng. Struct. 2012, 39, 1–10. [Google Scholar] [CrossRef]
  6. Wang, J.; Guo, L.; Guo, X.; Ding, Z. Seismic response investigation on CFDST column to steel beam blind-bolted connections. J. Constr. Steel Res. 2019, 161, 137–153. [Google Scholar] [CrossRef]
  7. Wang, J.; Guo, L. Experimental and analytical behavior of square CFDST column blind bolted to steel beam connections. Int. J. Steel Struct. 2020, 20, 612–635. [Google Scholar] [CrossRef]
  8. Zhang, Y.; Gao, J.; Li, Y.; Demoha, K. Experimental analysis of hysteretic behavior and strain field of external diaphragm joints between steel beams and CFDST columns. Adv. Struct. Eng. 2020, 23, 1129–1141. [Google Scholar] [CrossRef]
  9. Zhang, Y.; Jia, H.; Li, Y.; Demoha, K. Experiments on cyclic performance of external diaphragm joints between CFDST columns and steel beams. B. Earthq. Eng. 2020, 18, 3843–3861. [Google Scholar] [CrossRef]
  10. Ahmed, A.D.; Güneyisi, E. Lateral response of double skin tubular column to steel beam composite frames. Turk. J. Eng. 2022, 6, 16–25. [Google Scholar] [CrossRef]
  11. Yin, Y.Z.; Zhang, Y. Research on the joint of concrete-filled steel tubular column and steel beam. Appl. Mech. Mater. 2013, 351–352, 174–178. [Google Scholar] [CrossRef]
  12. Nan, L.; Dong, N.Z. Numerical simulation of joint between concrete-filled square steel tubular column and steel beam on seismic behavior. Appl. Mech. Mater. 2015, 744–746, 207–210. [Google Scholar]
  13. Guo, L.; Wang, J.; Wang, W.; Duan, M. Seismic evaluation and calculation models of CFDST column blind bolted to composite beam joints with partial shear interaction. Eng. Struct. 2019, 196, 109269. [Google Scholar] [CrossRef]
  14. Guo, L.; Wang, J.; Wang, W. Theoretical model and structural performance of assembled joint between circular CFDST column and composite beam. Arch. Civ. Mech. Eng. 2020, 20, 75. [Google Scholar] [CrossRef]
  15. Zhang, D.; Zhao, J.; He, S. Cyclic testing of concrete-filled double-skin steel tubular column to steel beam joint with RC slab. Adv. Civ. Eng. 2018, 2018, 7126393. [Google Scholar] [CrossRef]
  16. Wolski, M.; Rides, J.M.; Sause, R. Experimental study of a self-centering beam-column connection with bottom flange friction device. J. Struct. Eng. 2009, 135, 479–488. [Google Scholar] [CrossRef]
  17. Huang, L.; Zhou, Z.; Huang, X.; Wang, Y. Variable friction damped self-centering precast concrete beam-column connections with hidden corbels: Experimental investigation and theoretical analysis. Eng. Struct. 2020, 206, 110150. [Google Scholar] [CrossRef]
  18. Morgen, B.G.; Kurama, Y.C. A Friction Damper for Post-Tensioned Precast Concrete Moment Frames. PCI J. 2004, 49, 112–133. [Google Scholar] [CrossRef]
  19. Zhang, A.; Zhang, Y.; Li, R.; Wang, Z. Cyclic behavior of a prefabricated self-centering beam-column connection with a bolted web friction device. Eng. Struct. 2016, 111, 185–198. [Google Scholar] [CrossRef]
  20. Koshikawa, T. Moment and energy dissipation capacities of post-tensioned precast concrete connections employing a friction device. Eng. Struct. 2017, 138, 170–180. [Google Scholar] [CrossRef]
  21. Huang, L.; Zhou, Z.; Clayton, P.M.; Zeng, B. Experimental investigation of friction-damped self-centering prestressed concrete beam-column connections with hidden corbels. J. Struct. Eng. 2020, 146, 04019228. [Google Scholar] [CrossRef]
  22. Guo, T.; Song, L.; Zhang, G. Numerical simulation of the seismic behavior of self-centering steel beam-column connections with bottom flange friction devices. Earthq. Eng. Eng. Vib. 2011, 10, 229–238. [Google Scholar] [CrossRef]
  23. Yun, C.; Chao, C.; Cong, C. Study on seismic performance of prefabricated self-centering beam to column rotation friction energy dissipation connection. Eng. Struct. 2021, 241, 112136. [Google Scholar] [CrossRef]
  24. Morgen, B.G.; Kurama, Y.C. Seismic design of friction-damped precast concrete frame structures. J. Struct. Eng. 2007, 133, 1501–1511. [Google Scholar] [CrossRef]
  25. Latour, M.; Piluso, V.; Rizzano, G. Free from damage beam-to-column joints: Testing and design of DST connections with friction pads. Eng. Struct. 2015, 85, 219–233. [Google Scholar] [CrossRef]
  26. Kim, H.J.; Christopoulos, C. Friction damped posttensioned self-centering steel moment-resisting frames. J. Struct. Eng. 2008, 134, 1768–1779. [Google Scholar] [CrossRef]
  27. Tsai, K.C.; Chou, C.C.; Lin, C.L.; Chen, P.C.; Jhang, S.J. Seismic self-centering steel beam-to-column moment connections using bolted friction devices. Earthq. Eng. Struct. D. 2008, 37, 627–645. [Google Scholar] [CrossRef]
  28. Hou, C.; Han, L.H.; Zhao, X.L. Behaviour of circular concrete filled double skin tubes subjected to local bearing force. Thin-Walled Struct. 2015, 93, 36–53. [Google Scholar] [CrossRef]
  29. Mander, J.B.; Priestley, M.J.N.; Park, R. Theoretical stress-strain model for confined concrete. J. Struct. Eng. 1988, 114, 1804–1826. [Google Scholar] [CrossRef] [Green Version]
  30. GB/T 5224-2014; Steel Strand for Prestressed Concrete. Chinese Standard Press: Beijing, China, 2014. (In Chinese)
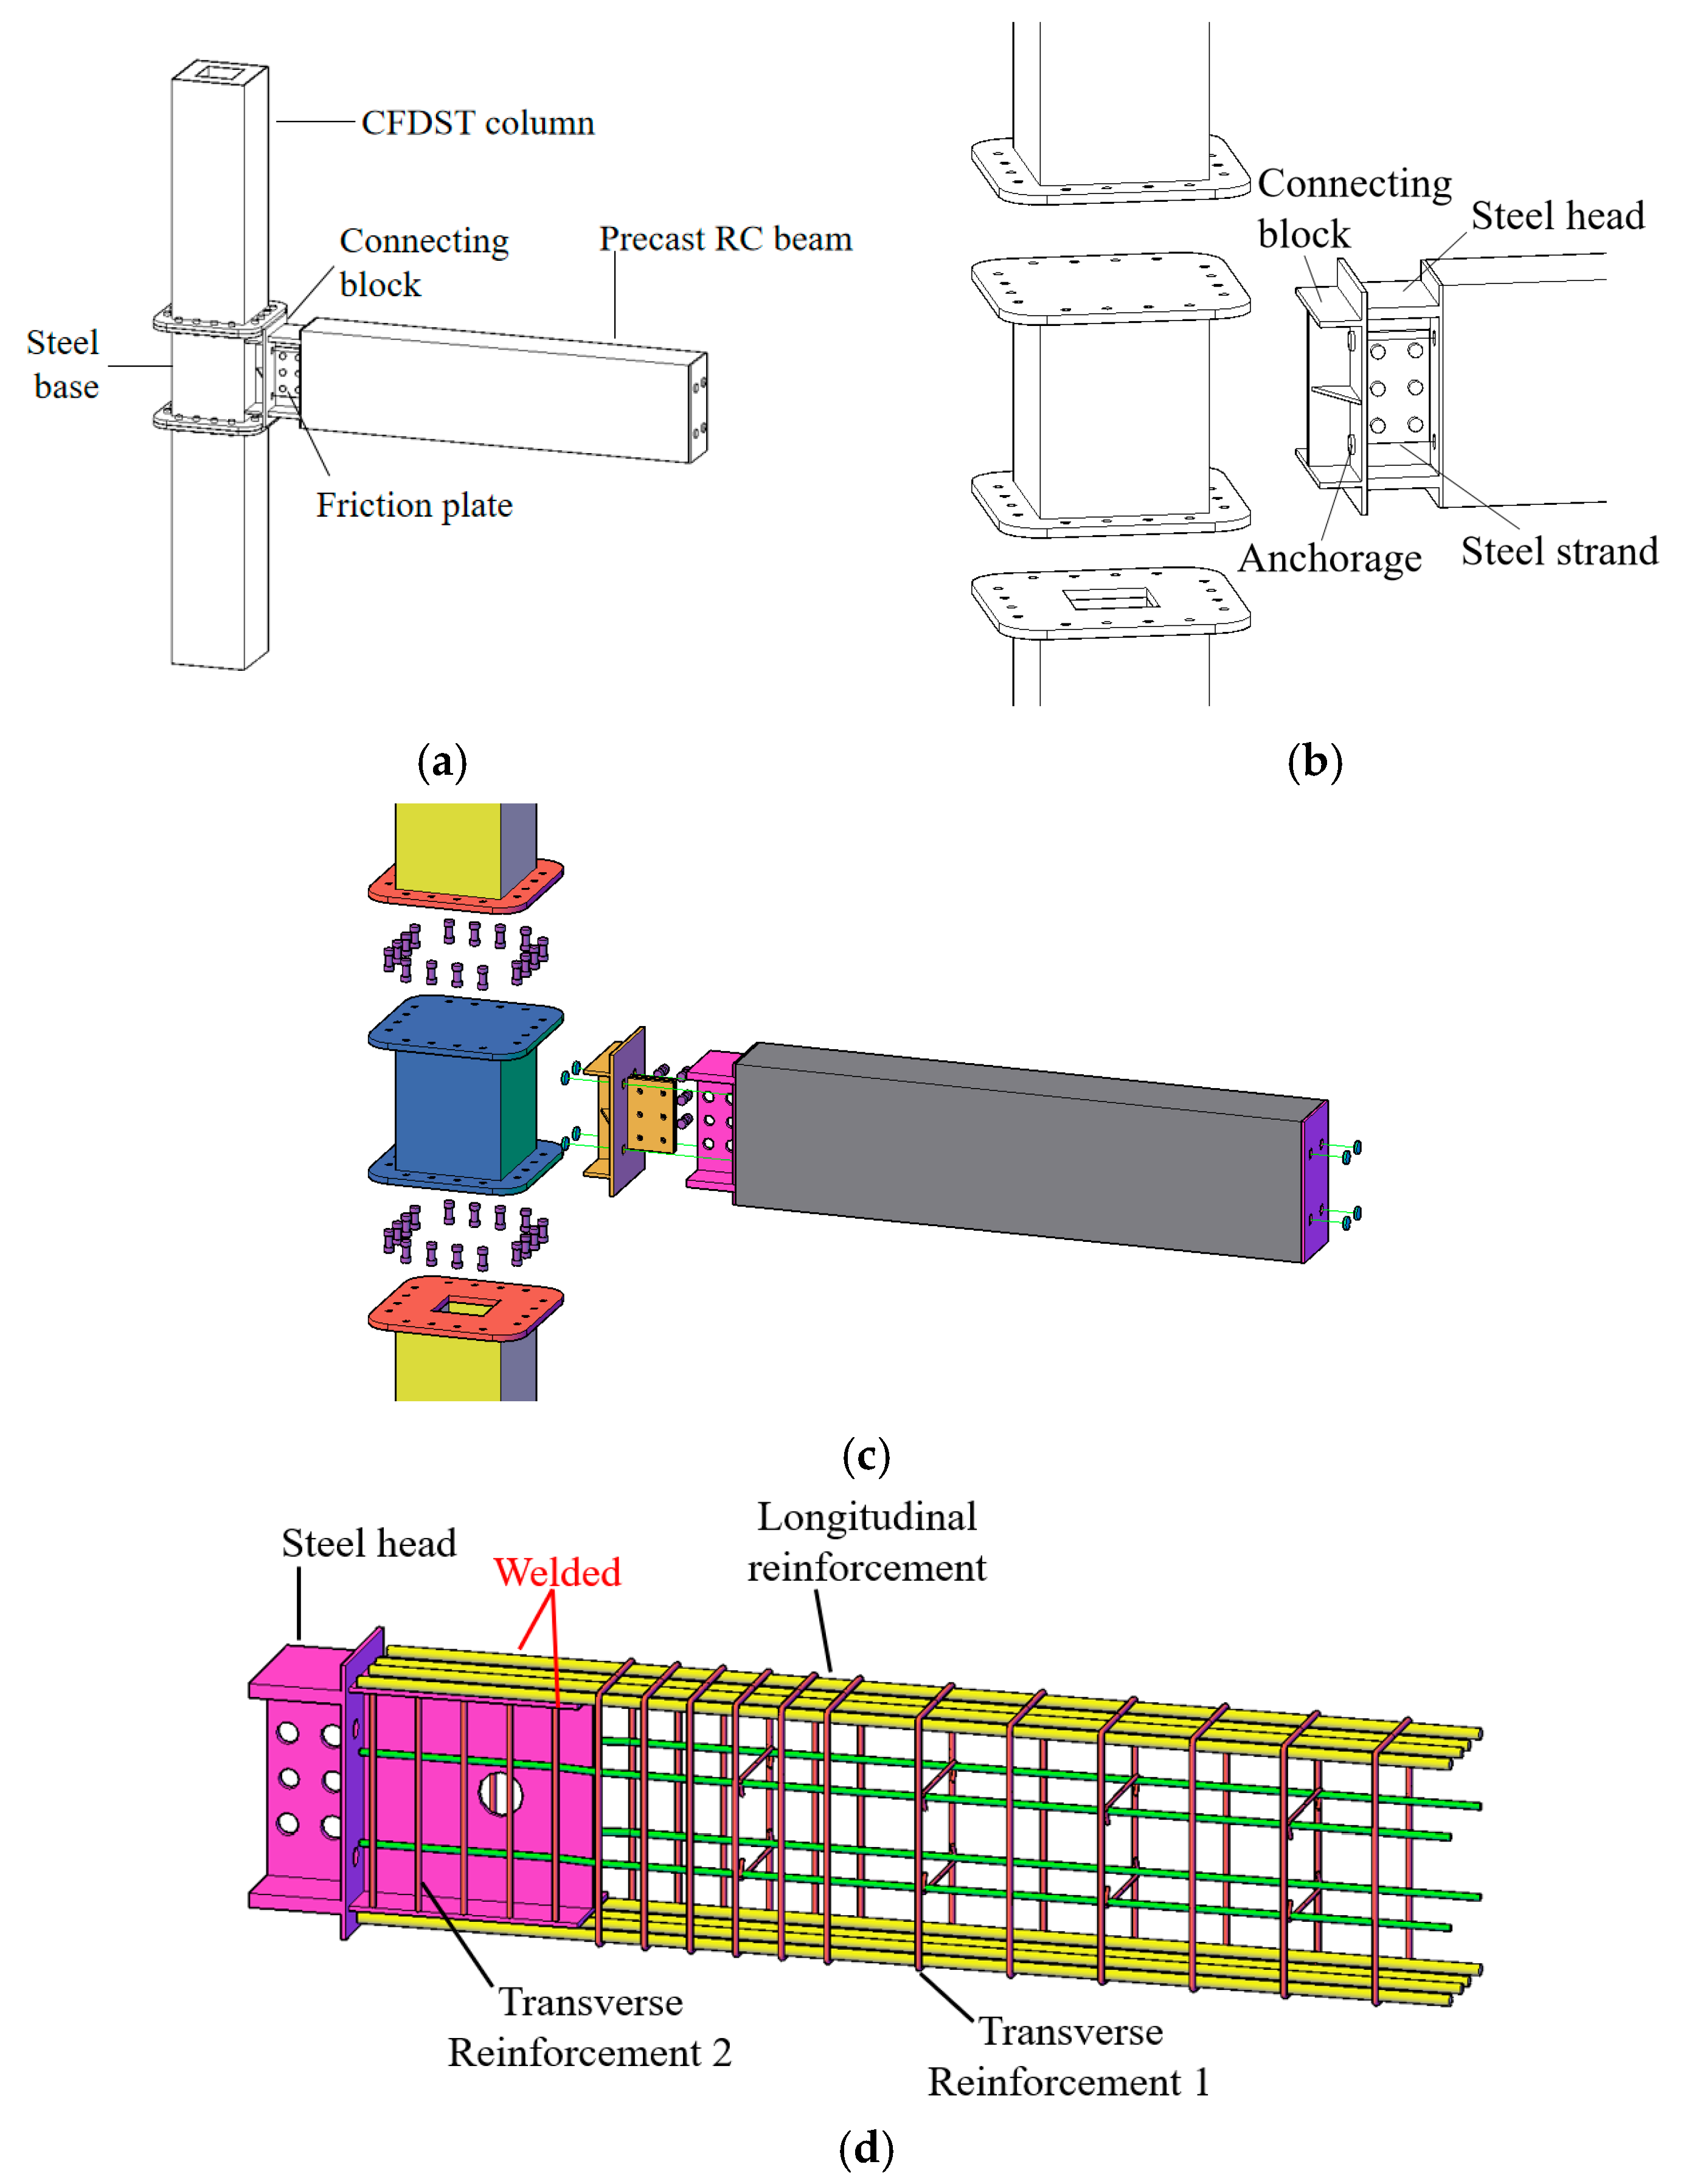
Figure 1. Self-centering joints between CFDST columns and RC beams: (a) Overall assembly of the joint; (b) Joint details; (c) Explosion of the joint; (d) Arrangement of steel components in the beam.
Buildings 13 00135 g001
Figure 2. Calculation diagram of the bending moment (joint opened).
Buildings 13 00135 g002
Figure 3. Dimensions of the joint (unit: mm): (a) Front view of the joint; (b) Top view of the joint.
Buildings 13 00135 g003
Figure 4. Dimensions of the connecting block (unit: mm): (a) Front view of the connecting block; (b) Left view of the connecting block.
Buildings 13 00135 g004
Figure 5. Dimensions of the steel head (unit: mm): (a) Front view of the steel head; (b) Left view of the steel head; (c) Right view of the steel head.
Buildings 13 00135 g005
Figure 6. Cross section dimensions of the steel seat.
Buildings 13 00135 g006
Figure 7. Reinforcement of the precast RC beam.
Buildings 13 00135 g007
Figure 8. Meshing of the joint: (a) Overview of the joint; (b) Details of the joint.
Buildings 13 00135 g008
Figure 9. Loading protocol: (a) Boundary conditions; (b) Loading history.
Buildings 13 00135 g009
Figure 10. Load–displacement curves: (a) Maximum joint rotation of 0.06 rad; (b) Maximum joint rotation of 0.04 rad.
Buildings 13 00135 g010
Figure 11. Envelope curves of the joint.
Buildings 13 00135 g011
Figure 12. Theoretical joint restoring force model.
Buildings 13 00135 g012
Figure 13. Comparison of joint restoring force.
Buildings 13 00135 g013
Figure 14. Load–displacement curves: (a) J1-0~J1-2; (b) J1-0, J1-3~J1-5.
Buildings 13 00135 g014
Figure 15. Comparison of joint failures: (a) J1-0; (b) J1-1; (c) J1-2; (d) J1-3; (e) J1-4; (f) J1-5. (PEEQT represents the equivalent plastic tensile strain, which indicates the degree of cracking of concrete).
Buildings 13 00135 g015
Figure 16. Envelope curves of joints.
Buildings 13 00135 g016
Figure 17. Stress variation curves of steel strands.
Buildings 13 00135 g017
Figure 18. Energy dissipation ratio–cycle no. curves.
Buildings 13 00135 g018
Figure 19. Equivalent viscous damping ratio–cycle no. curves.
Buildings 13 00135 g019
Figure 20. Load–displacement curves: (a) J2-0~J2-2; (b) J2-0, J2-3~J2-5.
Buildings 13 00135 g020
Figure 21. Envelope curves of joints.
Buildings 13 00135 g021
Figure 22. Stress variation curves of steel strands.
Buildings 13 00135 g022
Figure 23. Energy dissipation ratio–cycle no. curves.
Buildings 13 00135 g023
Figure 24. Equivalent viscous damping ratio–cycle no. curves.
Buildings 13 00135 g024
Figure 25. Calculation diagram of he.
Buildings 13 00135 g025
Figure 26. Load–displacement curves: (a) J3-1~J3-3; (b) J3-0, J3-1, J3-4.
Buildings 13 00135 g026
Figure 27. Envelope curves of joints.
Buildings 13 00135 g027
Figure 28. Stress variation curves of steel strands.
Buildings 13 00135 g028
Figure 29. Comparison of joint failures: (a) J3-1; (b) J3-2; (c) J3-3; (d) J3-4.
Buildings 13 00135 g029
Figure 30. Energy dissipation ratio–cycle no. curves.
Buildings 13 00135 g030
Figure 31. Equivalent viscous damping ratio–cycle no. curves.
Buildings 13 00135 g031
Table 1. Steel properties.
MaterialYield StrengthUltimate StrengthPoisson’s RatioElastic Modulus
(MPa)(MPa) (×105 MPa)
Q235b2354700.32.06
Q345b345560
HPB3003004202.10
HRB4004005402.00
Table 2. Concrete properties.
Concrete MarkCompressive StrengthStrain (at Compressive Strength)Poisson’s RatioElastic Modulus
(MPa) (×105 MPa)
C3023.70.0020.223,027
C3527.624,872
Table 3. Parametric settings of J1-0~J1-5.
Joint NumbersBolt PreloadPretension of Steel Strand
(kN)(kN)
J1-054.580
J1-139.5
J1-224.5
J1-369.5
J1-484.5
J1-599.5
Table 4. Key data of joint load–displacement curves.
Joint NumbersLoading DirectionsJoint Opening LoadsUltimate LoadsResidual Deformation Rate
(kN)(kN)(%)
J1-0Positive48.5690.770.3
Negative48.4590.47
J1-1Positive43.5385.880.6
Negative43.3586.61
J1-2Positive39.0881.000.4
Negative38.0080.75
J1-3Positive53.6195.602.5
Negative53.5395.27
J1-4Positive58.66100.4611.9
Negative58.46100.10
J1-5Positive63.71105.2823.0
Negative62.79104.87
Table 5. Parametric settings of J2-0~J2-5.
Joint NumbersPrestress of Steel StrandsBolt Preload
(MPa)(kN)
J2-057254.5
J2-1500
J2-2428
J2-3644
J2-4716
J2-5788
Table 6. Key data of joint load–displacement curves.
Joint NumbersLoading DirectionsJoint Opening LoadsUltimate LoadsResidual Deformation Rate
(kN)(kN)(%)
J2-0Positive48.5690.770.3
Negative48.4590.47
J2-1Positive44.9291.001.5
Negative44.8990.70
J2-2Positive41.3090.832.9
Negative41.3190.50
J2-3Positive52.0191.260.8
Negative51.9190.96
J2-4Positive55.5291.410.6
Negative55.4291.12
J2-5Positive59.0392.830.5
Negative58.9392.56
Table 7. Parametric settings of J3-0~J3-4.
Joint NumbersβPrestress of Steel StrandsBolt Preload
(MPa)(kN)
J3-06:457254.5
J3-15:547467.9
J3-24:638081.5
J3-33:728595.1
J3-47:366440.8
Table 8. Key data of joint load–displacement curves.
Joint NumbersLoading DirectionsJoint Opening LoadsUltimate LoadsResidual Deformation Rate
(kN)(kN)(%)
J3-0Positive48.5690.770.3
Negative48.4590.47
J3-1Positive48.2594.937.5
Negative48.1994.59
J3-2Positive48.2198.5322.4
Negative48.0398.10
J3-3Positive48.11102.0635.0
Negative47.26101.62
J3-4Positive48.2787.350.5
Negative48.2187.09
Disclaimer/Publisher’s Note: The statements, opinions and data contained in all publications are solely those of the individual author(s) and contributor(s) and not of MDPI and/or the editor(s). MDPI and/or the editor(s) disclaim responsibility for any injury to people or property resulting from any ideas, methods, instructions or products referred to in the content.