Review

Damage Mechanism and Modeling of Concrete in Freeze–Thaw Cycles: A Review

1
School of Water Conservancy Engineering, Zhengzhou University, Zhengzhou 450001, China
2
Communications Construction Company of CSCEC 7th Division Co., Ltd., Zhengzhou 450004, China
*
Author to whom correspondence should be addressed.
Buildings 2022, 12(9), 1317; https://doi.org/10.3390/buildings12091317
Submission received: 29 June 2022 / Revised: 18 August 2022 / Accepted: 25 August 2022 / Published: 28 August 2022
(This article belongs to the Section Building Materials, and Repair & Renovation)

Abstract

:
The deterioration of concrete microstructures in freeze–thaw (F–T) cycles is the primary reason for the reduction in the service life of concrete. This paper reviews recent progress in the theory of damage mechanisms and damage models of concrete in F–T cycles. It is a detailed review of the salt-freeze coupling condition, microstructure testing, and models for the evolution of concrete properties that are subjected to F–T damage. Summarized in this paper are the deterioration theory of water phase transition; the mechanism of chloride-F–T and sulfate-F–T damage; the microstructure testing of hydration products, pore structure, microcracks, and interfacial transition zones (ITZ). Furthermore, F–T damage models for the macrostructure are presented. Finally, the issues that are existing in the research and outlook of concrete F–T damage are highlighted and discussed. This paper is helpful in understanding the evolution of F–T damage, and also provides a comprehensive insight into possible future challenges for the sustainable design and specifications of concrete in cold environments.

1. Introduction

The destructive effect of freeze–thaw (F–T) cycles on concrete is the primary cause of concrete failure in cold areas [1,2]. The F–T damage of concrete is a complex physical and chemical phenomenon [3,4] that begins with the internal microstructure of concrete. For example, in the F–T cycle, the pore structure of concrete deteriorates; thus, the permeability of concrete increases, and the F–T damage is accelerated by the entry of an external water and erosion medium [3]. The surface shedding and scaling of concrete is caused by the F–T cycle, and the risk of steel bar corrosion is increased [4]. The precondition for improving the frost resistance and service life of concrete is to understand the damage mechanism and performance evolution model in an F–T environment.
Therefore, many studies on the deterioration of concrete under F–T cycle erosion have been reported. The damage mechanism of concrete in an F–T environment has been expounded by many researchers. The hydraulic pressure theory [5] and osmotic pressure theory [6,7] were subjects of early research that was related to F–T damage mechanisms. The migration of solution in pores is the cause of F–T damage in concrete in these two theories; however, the direction of migration is different in both. In addition, the saturation theory [8], crystallization pressure theory [9], micro-ice lens theory [10,11], glue spall theory [12], and pore mechanics [13] have also been used to explain the F–T concrete deterioration mechanism. Based on previous F–T theoretical studies, the latest research [14,15,16] suggests that F–T damage is caused by the combined action of crystallization pressure, ice expansion pressure, and low-temperature suction, rather than a single factor. For the damage resulting from the coupling of ion erosion and F–T cycles, researchers believe that the combined effects of F–T damage, salt crystallization, salt chemical corrosion, and calcium loss lead to the deterioration of the pore structure [17].
There have been many achievements in the performance evolution and micromorphology of concrete during F–T cycles, which are categorized into macro, meso, and micro damage from different research scales. Macroscopic research [18,19] has mainly discriminated the damage of concrete based on experimental indexes such as material surface state, mechanical property test, ultrasonic, acoustic emission, and resistivity. In mesoscopic research [20,21,22,23], nuclear magnetic resonance (NMR) and computed tomography (CT) techniques were primarily used to identify the crack propagation and pore parameter evolution of concrete. The evolution of microcracks and pores in the specimen was discussed using a parameterized damage model. At the micro level [24,25,26], most of the studies analyzed the microscopic pore structure of cement-based materials using scanning electron microscopy (SEM) and mercury intrusion porosimetry (MIP). The changes in the chemical components, microcracks, and micropores in the damage process were revealed. In addition, thermal analysis and X-ray diffraction (XRD) techniques were often used to quantitatively analyze the hydration process and deteriorated products of cementitious materials that were under F–T erosion [27,28,29].
The deterioration of concrete under a F–T cycle can be characterized by establishing a specific model. The parameters of the F–T damage model have gradually changed from a macro index to a micro index in recent studies. The F–T damage mechanism is discussed by comparing the evolution process of the concrete microstructures with the macroscopic damage. The performance data are needed to establish a concrete damage model include the mass loss rate [30], RDEM [31], compressive strength [32], resistivity, and micro-reference quantity [33,34]. For the evolution of the microstructure, the changes in the pore structure distribution, microcrack density, and fractal dimension have also become an important part of the F–T damage model. Classical functions such as the parabola [35], power function [36], exponential function [37], logistics function [38], Boltzmann function [39], and Weibull distribution function [40] are used in common damage equation forms.
The F–T damage mechanism of concrete is significant for improving the durability of concrete in cold areas. The prediction and evaluation of concrete service life are guided by models of the F–T damage of concrete. To review the latest progress in the research on F–T damage of concrete, the theoretical analyses and microscopic tests of the concrete damage mechanism in F–T cycles are introduced in detail in this paper. A review of the F–T damage theory, damage mechanism of salt-freezing coupling, and the quantitative analysis of the microstructure are also presented. The F–T damage evolution models of macro index and micro index are discussed. The theory and issue of the concrete F–T damage model, especially combined with the application of advanced detection methods, are reviewed. In conclusion, the scope of this paper is to provide a systematic review of concrete F–T damage and future challenges for the sustainable design and specifications of concrete in cold environments.

2. Damage Mechanism

2.1. Deterioration Theory

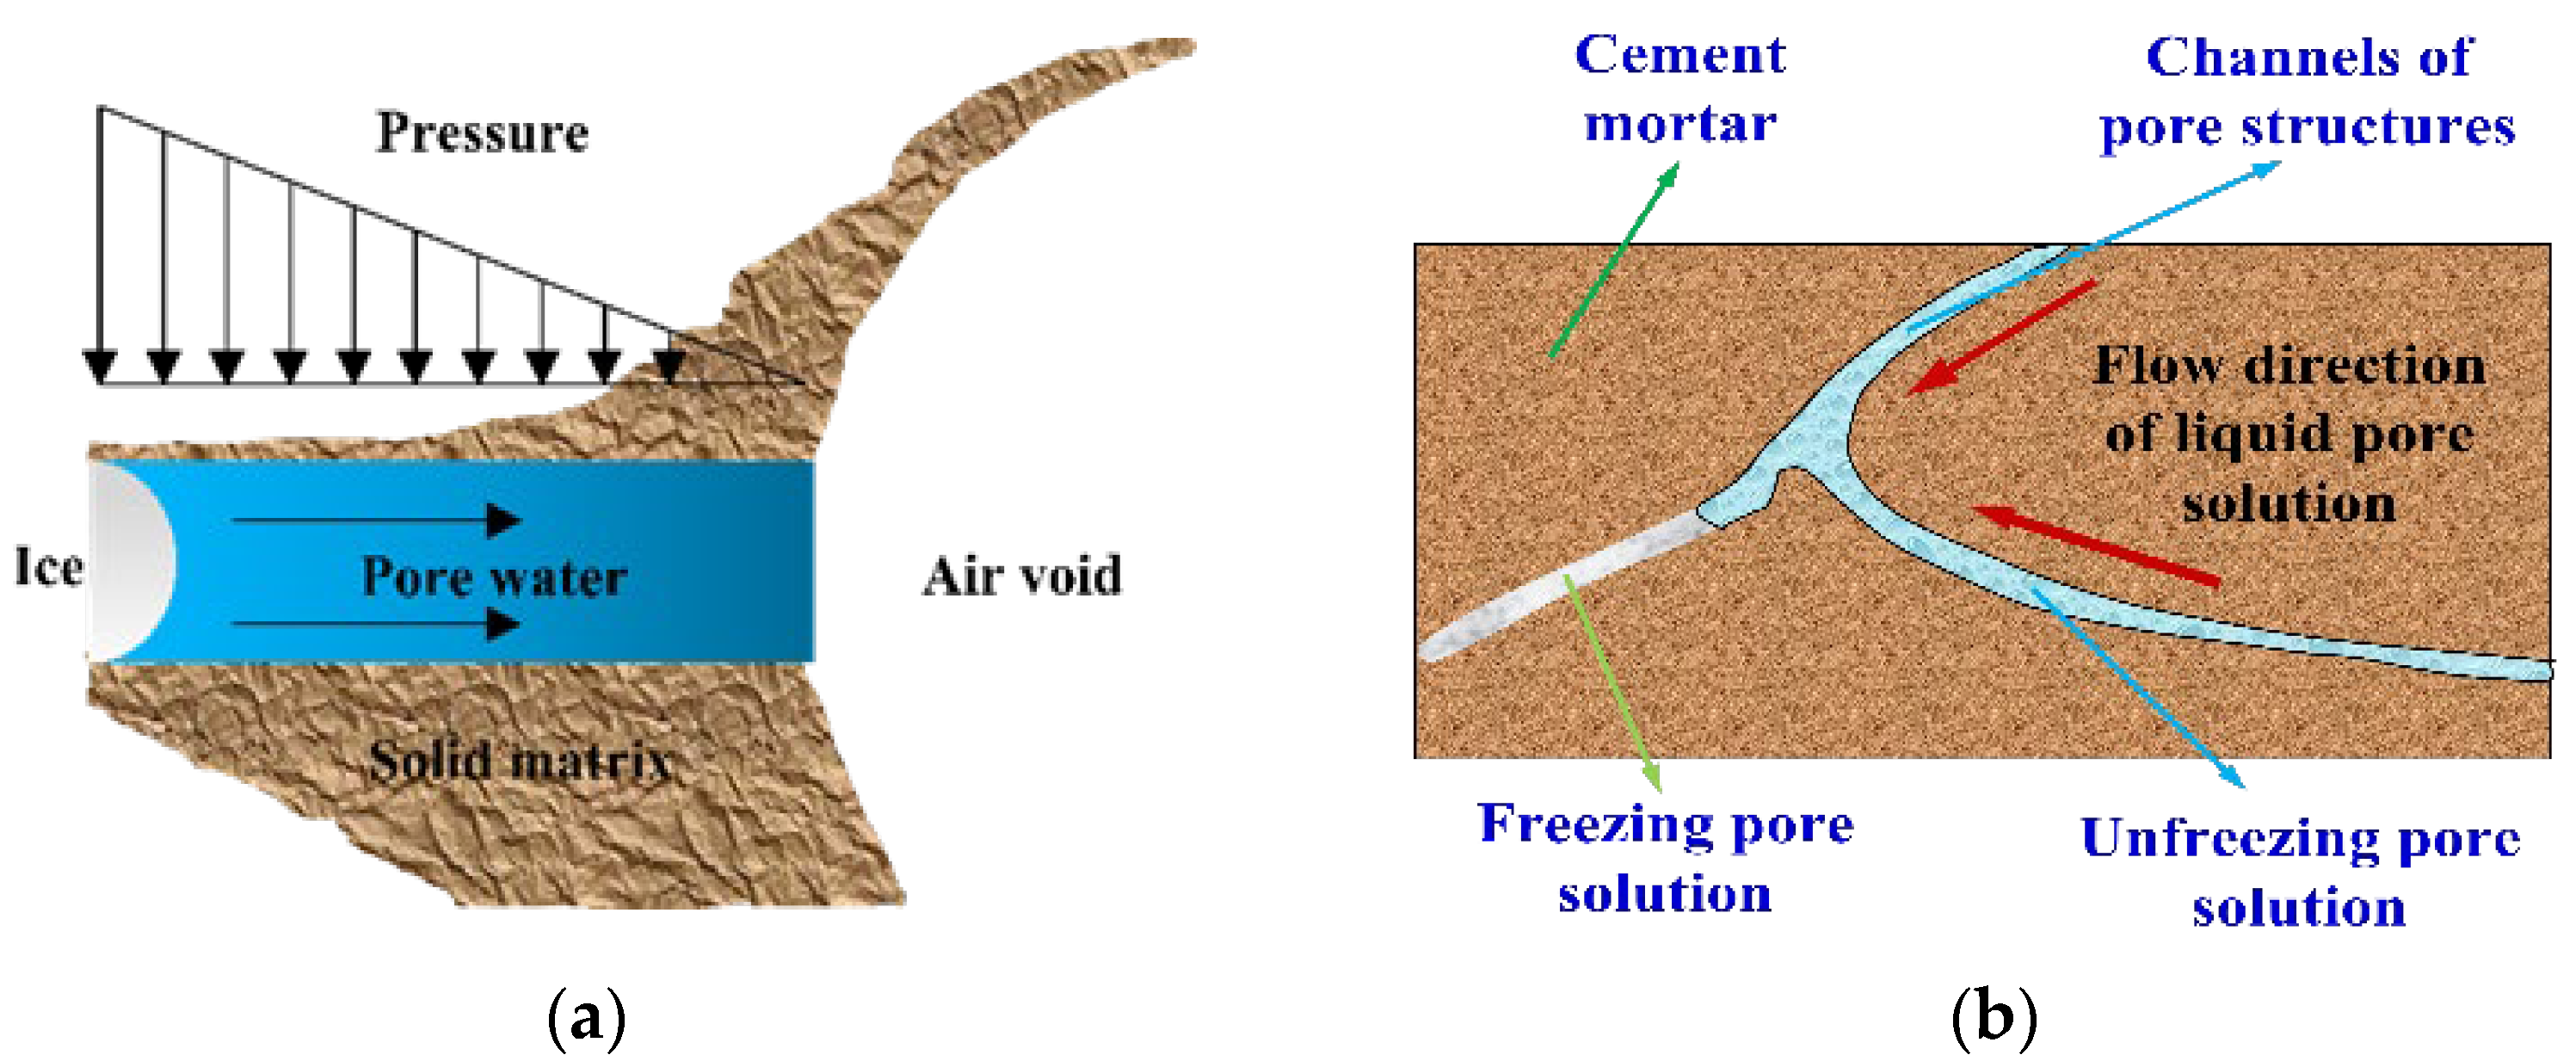
2.1.1. Hydraulic Pressure Theory and Osmotic Pressure Theory

According to the pore size, concrete pores are divided into gel pores, capillary pores, and voids. Various pores are not isolated, and the types of water in the corresponding pores are also different: bulk water, capillary water, gel pore structure water, and gel pore adsorption water [41]. Bulk water and capillary water can freeze in the natural environment [42], while saturated gel pore water can freeze at −30 °C to −80 °C. These two theories suggest that the difference in the freezing point between pores is the initial factor of concrete frost damage.
These two theories were first proposed by Powers and were based on Darcy’s law. According to the hydraulic pressure theory, when concrete is affected by an external low temperature, its effect occurs from the outside to the inside. First, the pore water on the surface of the concrete is frozen, and the volume difference between ice and water leads to the migration of liquid water through the capillaries. If the temperature continues to decrease, the volume of ice increases to compress the liquid water continuously, resulting in compressive stress in the pores and tensile stress in the concrete (Figure 1a). The capillary water flow is proportional to the stress that is produced in the concrete. With a continuous increase in tensile stress, microcracks occur inside the concrete when it reaches its ultimate tensile strength [43]. The hydrostatic pressure is related to pore length, viscosity coefficient, permeability coefficient, icing amount, and cooling rate. The greater the icing rate is, then the smaller the permeability is, and the longer the pore size is, then the more vulnerable the concrete is to F–T damage [44]. Reducing the pore spacing in a material can reduce the hydrostatic pressure, which provides theoretical support for the air-entraining agent [45]. Because of its high w/c ratio and porosity, ordinary concrete will gradually expand at low temperature due to the pressure that is caused by the continuous freezing of water; for air-entraining concrete, ice is formed in the micropores that is formed by the air-entraining agent, and the cement paste gradually shrinks. Hydrostatic pressure theory cannot explain the expansion of ordinary concrete and the freezing of non-expansive liquids [36,46].
In an experimental and practical environment, the damage to concrete that is caused by the F–T of the salt solution is more severe than that of pure water. Powers et al. proposed the osmotic pressure theory in 1953 [6]. The theory holds that there are certain salt ions in concrete. The freezing of the macropores and capillaries first leads to an increase in the solution concentration in the unfrozen pores, which causes the supercooled water in the gel pores to begin to migrate. Owing to the complexity of the pore structure, the migration permeability rate is different, resulting in an osmotic pressure that damages the interior of the material. In addition, the saturated vapor pressure of water is higher than that of ice, resulting in osmotic pressure when unfrozen water moves to the ice (Figure 1b). The osmotic pressure is directly proportional to the solution concentration, but the icing amount is inversely proportional to the solution concentration. It can be seen that at a certain concentration, the coupling of the two pressures will produce the maximum value [47].
Figure 1. Hydrostatic pressure and osmotic pressure model. (a) Hydrostatic pressure principle [36]; (b) Osmotic pressure model [48].
Buildings 12 01317 g001

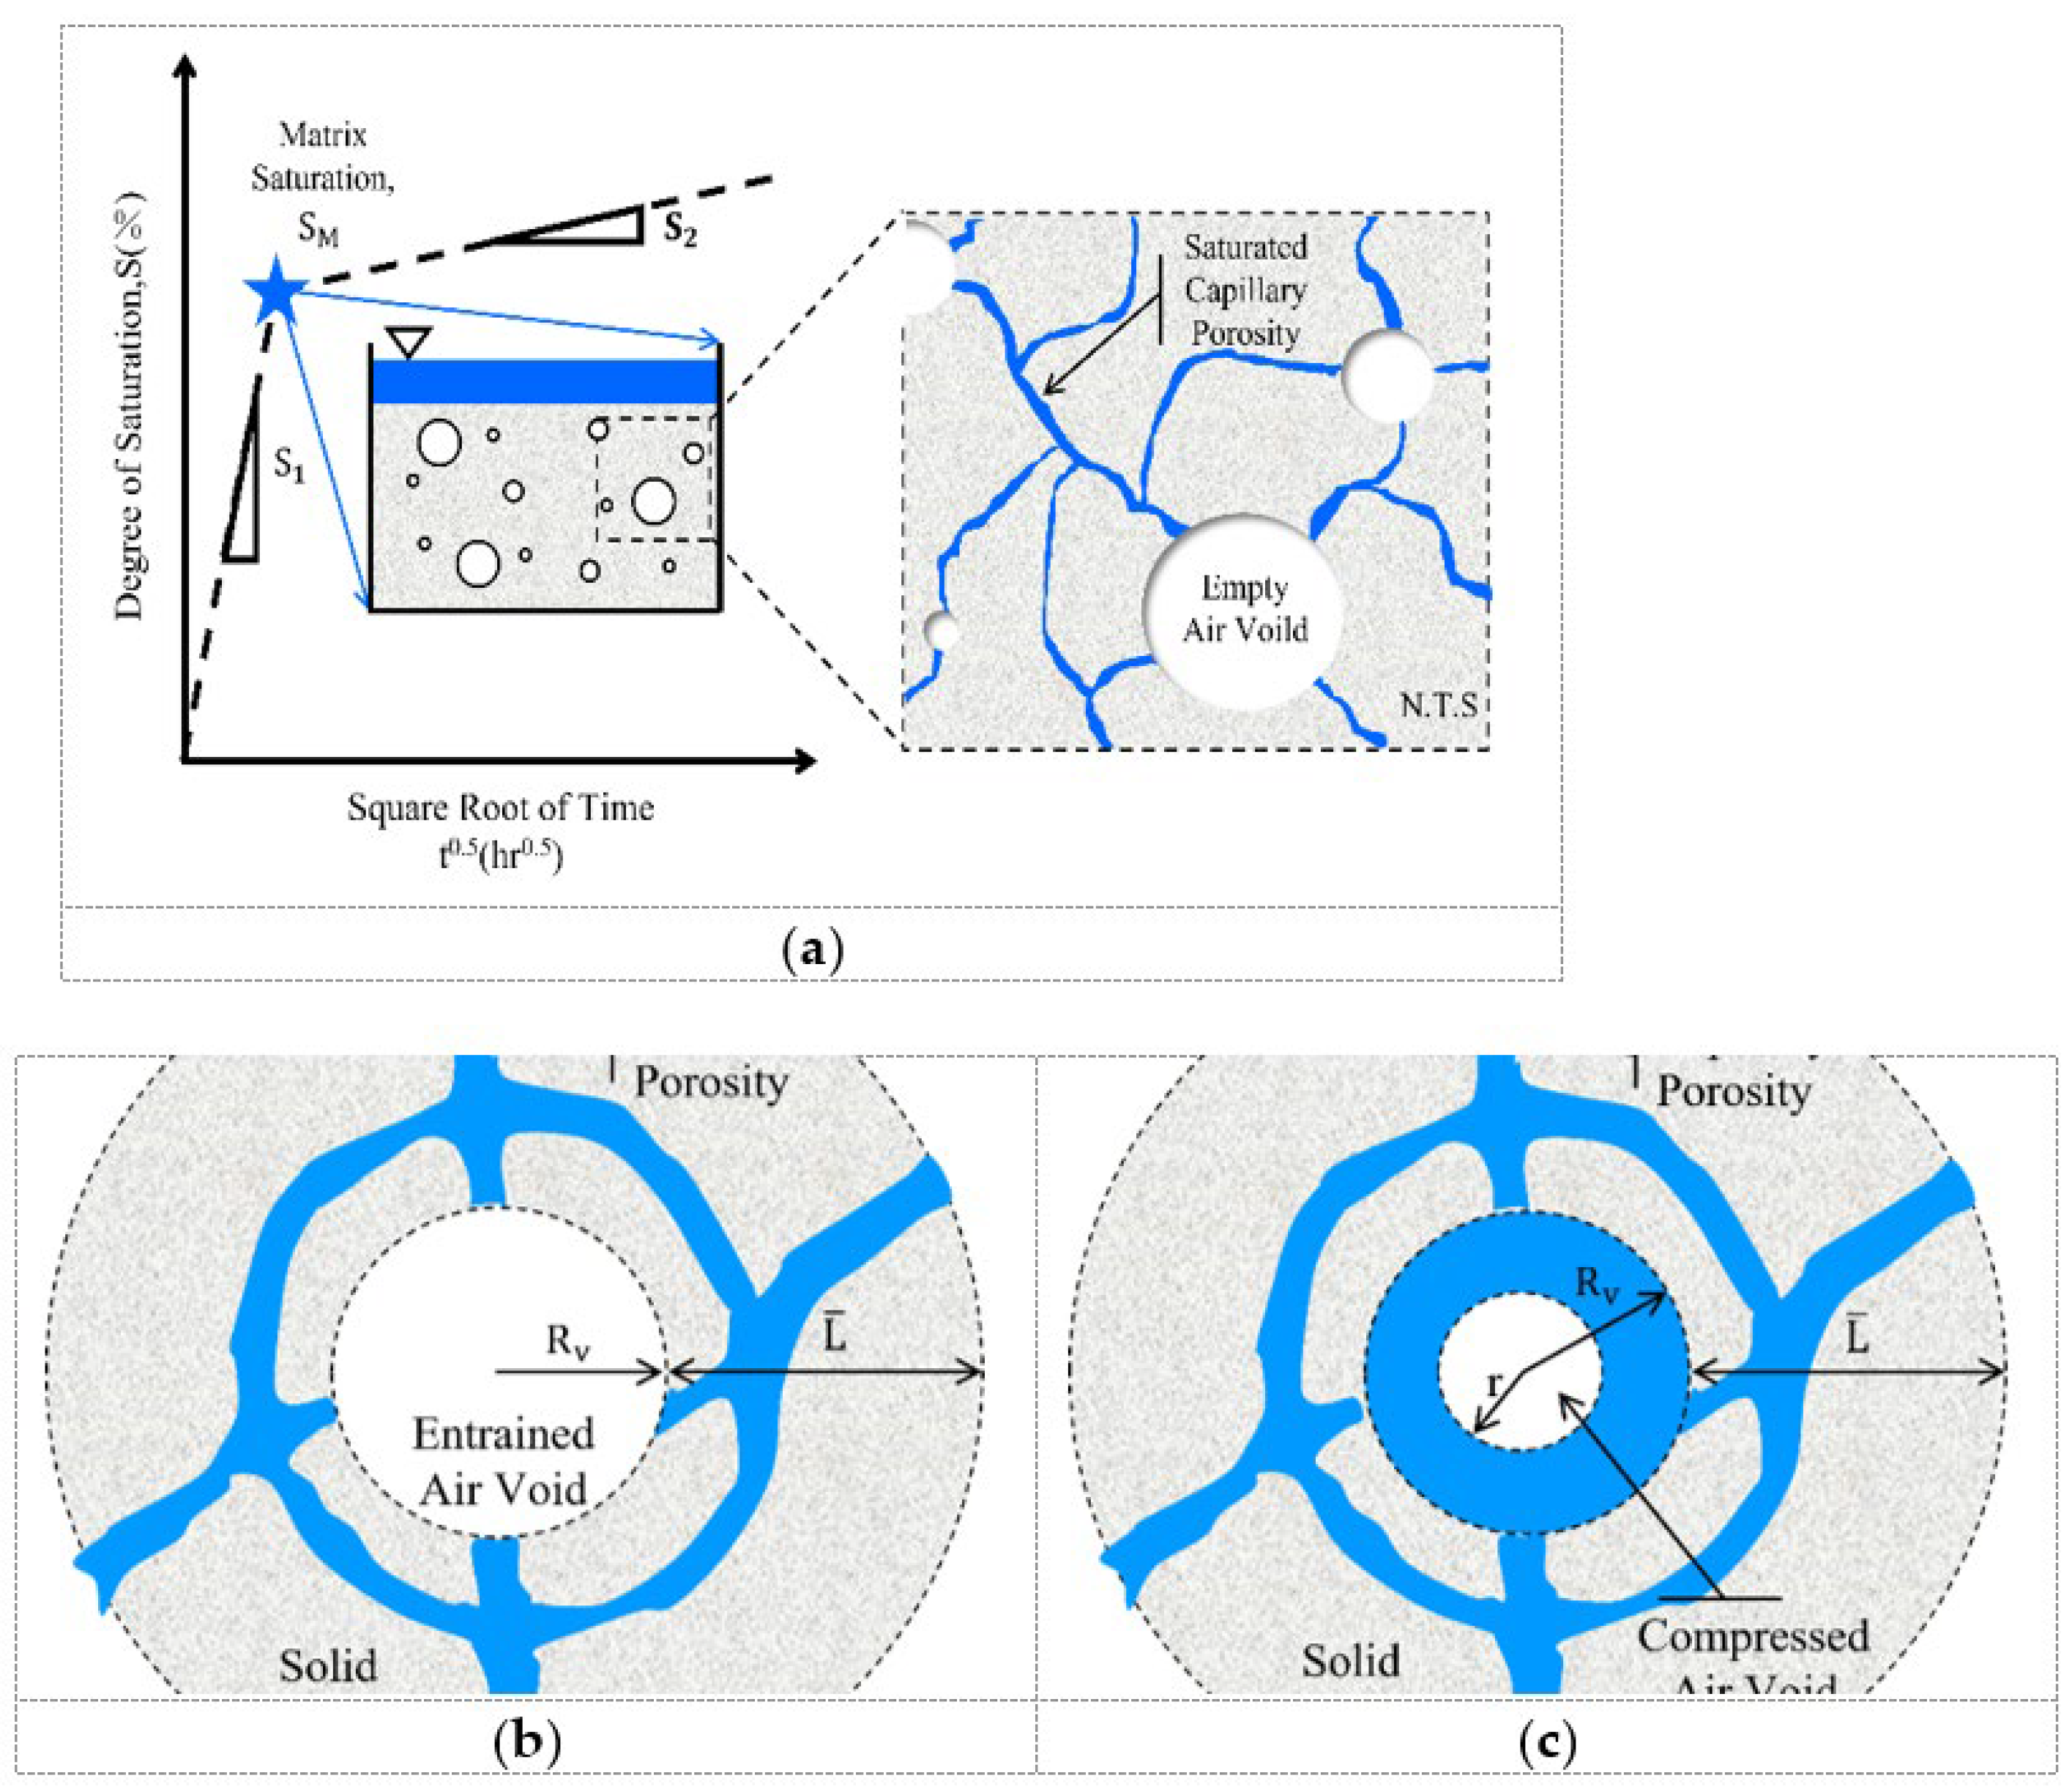
2.1.2. Critical Saturation Theory

F–T damage may occur only when the moisture content reaches a certain condition, and the external temperature alternates between positive and negative. Based on the above conditions, Fagerlund [8,49] proposed the critical saturation theory, which holds that the critical saturation of concrete is an important condition for determining its deterioration. The gas content in the pores only affects the concrete at the time of which the material water reaches the critical value, and the damage to the concrete is slow when the water saturation is below the critical saturation. However, concrete deteriorates rapidly when it exceeds the critical saturation, and it is generally believed that the critical saturation is in the range of 78–91% (Figure 2). Subsequently, Fagerlund [50] determined that the diffusion of gas in concrete is limited by multiple factors. A theory of gas dissolution and diffusion in concrete is established, which can be used to evaluate the effects of the void structure parameters, material diffusivity, and time on the spacing factor. After entering the new century, owing to the development of experimental technology, multi-medium water filling dynamics that are based on critical saturation theory [51] have been proposed. Water filling dynamics divide the water absorption of concrete into two stages. The first stage is affected by the properties of gel pores and capillaries; these pores have a strong water absorption capacity owing to the influence of negative pressure. The second stage is caused by the air in pores that are dissolved in the solution and diffused to larger pores or surfaces. Through the pore elastic–plastic model that was established [52], it was verified that concrete shrinks when the water saturation is lower than the critical value and it expands when it is higher than the critical value.

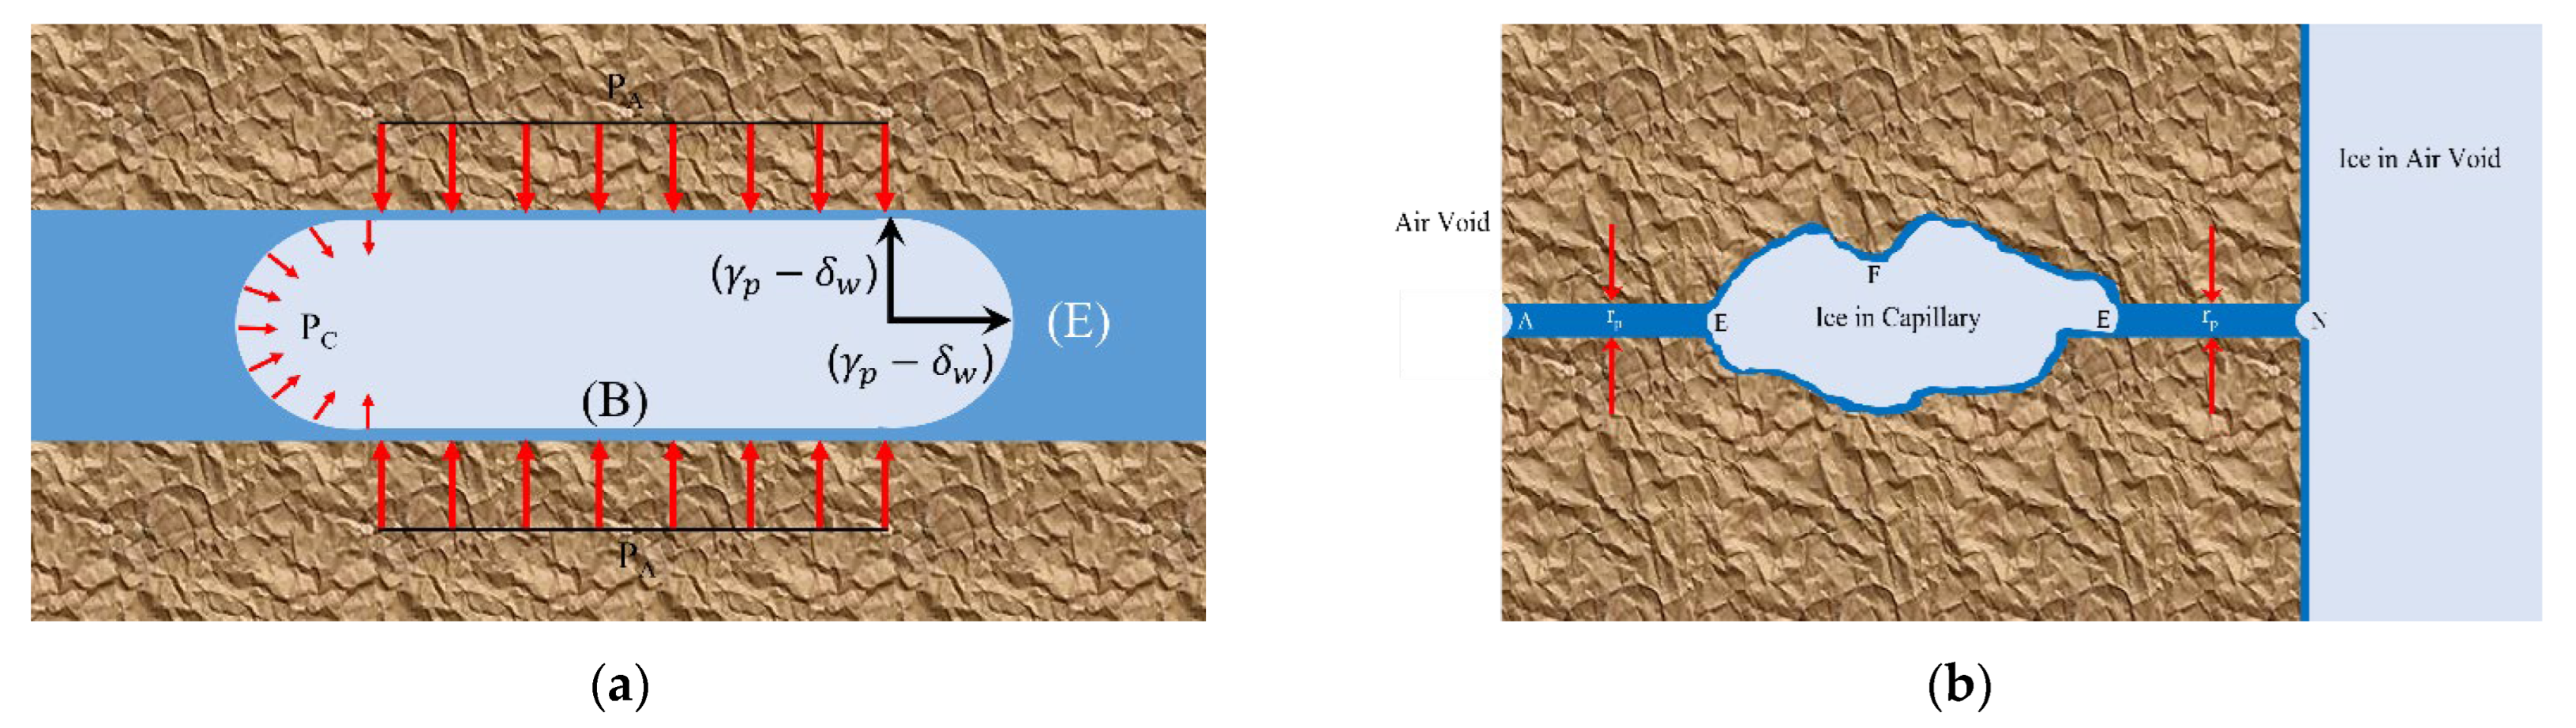
2.1.3. Crystallization Pressure Theory

Scherer [9] proposed that crystallization pressure is one of the main causes of frost damage in concrete. The magnitude and direction of the crystallization pressure depend on various factors, such as the pore shape, the environmental temperature, the initial conditions, and the icing degree. The ice crystals that are inside the concrete tend to grow from the high-pressure area to the low-pressure direction, which ensures the stability of the ice crystal pressure [53]. Owing to the difference in curvature between the crystal surface and the end, the cylindrical crystal that is in the void attempts to increase in the direction of reducing the pressure difference (pore wall), and the pore wall produces radial compressive stress to resist the pressure difference. When the corresponding circumferential tensile load in the pores exceeds the material threshold value, the pores inside the material are destroyed (Figure 3a). For irregular ink-bottle pores, ice crystals are formed in the large cavity in the capillary pore. When the ice crystal grows, the net circumferential stress in the capillary cavity is compressed regardless of whether the ice is full of pores (Figure 3b). This explains the instant shrinkage of concrete at the end of the freezing process. The researchers found that the maximum crystallization pressure can be up to 10.9 MPa, which greatly exceeds the failure stress of 0.374 MPa [54]. When the temperature is below the critical point, the concrete will crack and destroy; when the temperature rises, the ice will melt, and the concrete crack will close [55]. The fatigue damage leads to the damage of the concrete, and the repeated cracking that is caused by periodic crystallization pressure leads to the gradual expansion and connection of concrete microcracks and the nonlinear failure of concrete.

2.1.4. Micro-Ice Lens Theory

Setzer [10,11,56] established the theory of micro-ice lenses that was based on non-equilibrium thermodynamics and the three-phase equilibrium theory of porous media. This theory holds that concrete cannot reach complete saturation, and water, ice, and steam coexist in the pores. During the cooling process, the chemical potential of ice in the macropores is smaller than that of water in the gel pores. The compression of the concrete matrix causes supercooled water to flow to the macropores and become trapped in the micro-ice lens, so the gel pore saturation decreases and the concrete shrinks. In the heating process, the water in the large pores cannot flow back to the gel pores freely under the action of the ice front that is produced by different pore interfaces and because the micro-ice lens is still in the frozen state. If there is water situated outside, the gel pore absorbs it, which leads to an increase in the total saturation and expansion of concrete. The F–T cycle is like a low-temperature pump, which is powered by the change of temperature and migration of supercooled water. The micro-ice lens prevents the return of the water during the heating process and absorbs the water continuously during cooling, resulting in the expansion of concrete during heating and the shrinkage of it during cooling. The saturation of concrete increases with an increase in the number of cycles, and when the ultimate saturation is reached, the concrete fails (Figure 4). In addition, the migration of water also provides conditions for the growth of ice. In the early stage of freezing and thawing, the water rate of the concrete is faster, the macroscopic micro-ice lens grows, and the state of the concrete is similar to that of saturated soil; in the later stage, the ice stress is greater than the critical value, and the micro-crack propagates. F–T damage occurs in concrete under the combined action of the formation of the capillary ice lens and the movement of water in gel pores, so reducing the capillary pores and increasing the gel pores can effectively prevent F–T damage, which can be obtained by reducing the water–cement ratio and using an air entraining agent [57].

2.1.5. Glue Spall Theory

Aiming at understanding the spalling phenomenon of concrete surfaces under the condition of F–T cycles, Valenza et al. [12,58,59] established the theory of adhesive spalling. The theory holds that when concrete is damaged by the F–T process, a composite mechanism is formed between the ice shell that is formed by the freezing of water and the concrete surface, owing to the existence of the salt solution. The shrinkage of the ice body produces tensile stress on the surface of the concrete when it is shrinking in the external environment [60] because the linear expansion coefficients of the two are different (at −10 °C, 10 × 10−6 K−1 on the surface of the concrete and 50 × 10−6 K−1 in ice). When the temperature reaches −20 °C, it will produce 2.6 MPa of stress on the concrete, which exceeds the critical value of concrete strength and causes concrete failure (Figure 5). Valenza et al. also proposed that fracture mechanics can be used to judge whether ice cracks will penetrate the crack surface and they considered that the damage to the concrete surface is relatively constant for each cycle.

2.1.6. Theory of Unsaturated Porous Elasticity

The theory of unsaturated porous elasticity was developed by Coussy [13] and it was based on continuum thermodynamics and water-phase transition kinetics. It was originally used to study the deformation that is caused by freezing water. The stress of porous materials can be divided into matrix stress, thermal stress, and internal stress according to the source of the force, in which thermal stress can be ignored. There are two different phases in the pores: solid crystal and liquid solution. When the concrete is saturated, the main reason for concrete expansion is the hydraulic pressure that is caused by water condensation. In contrast to the hydrostatic pressure theory, the stress that is produced in the freezing process of saturated non-air-entrained slurries is limited, owing to the action of the matrix stress. The ice crystal pressure in the concrete becomes the only expansion source when a bubble is introduced because the existence of the bubble suppresses the hydrostatic pressure. Moreover, the concrete shrinks when the thermal shrinkage is dominant to it [61].
The theory of unsaturated porous elasticity, considering thermodynamic equilibrium, mechanical equilibrium, and the conservation of pore water mass, provides sufficient theoretical support for the analysis of the F–T mechanism of concrete, and the experimental results of the model are highly correlated with the actual situation. Relevant scholars have found that there is a significant correlation between pore pressure and freezing rate, and regardless of the degree of supercooling, the volume of ice in the melting stage is significantly larger than that in the cooling stage, so it can be considered that the ice is not discharged in the melting process [52,58]. Using this theory, the freeze–thaw durability of concrete can be predicted and the effects of air content, curing time, saturation, and water–cement ratio on the F–T damage of concrete can be studied [62,63]. For different damage models, the theoretical basis varies, such as in Darcy’s law, porous media mechanics, phase transition theory, and thermodynamics (Table 1). For example, for the deformation performance of concrete, the hydraulic pressure theory explains the expansion phenomenon of concrete after cycles, but it cannot explain the concrete deterioration caused by the volume non-expansion of some solutions after freezing. The theory of micro-ice lenses qualitatively describes the phenomenon of the alternating shrinkage and expansion of concrete caused by water migration and phase transformation. The glue spall theory explains the spalling phenomenon of concrete surfaces by using an analogy. The relationship between the macroscopic damage degree and microcosmic performance evolution of concrete is established using the unsaturated porous elasticity theory. Each theory has its scope of application, and the study of F–T damage should not be limited to a specific theory. Recently, based on previous F–T theory, researchers [14,15,64] believed that F–T damage is not caused by a single factor, but by the combined action of crystallization pressure, the water pressure caused by ice expansion, and low-temperature suction caused by the surface tension of water. However, this is currently difficult to express quantitatively.
In recent years, damage mechanics has become a prominent topic in the theoretical study of F–T damage; the original defects in concrete can be regarded as initial damage variables, and concrete microcracks gradually expand and lead to concrete deterioration failure with the deepening of the F–T degree, which is consistent with the law of the damage accumulation process. The study of F–T damage mainly involves studying the interaction mechanism between water and concrete, and not just the influence of stress that is caused by water phase transformation on concrete. Most classical theories focus on the influence of the water phase transition and pay less attention to changes in the local water–concrete pore structure. It is suggested that the multi-scale evolution equation of damage to concrete can be formulated by combining pore mechanics with concrete damage mechanics in the future, and the coupling relationship between pore structure characteristics, liquid phase transition, matrix deformation, and damage variable characterization can be completed. The establishment and development of the F–T damage constitutive equation for porous materials are analyzed based on the temperature–humidity–force field of concrete.

2.2. Salt-Freeze Coupling

2.2.1. Mechanism of Chloride-F–T Damage

In the actual service environment of concrete, it is eroded by various salt ions. Chloride is widely used in cold areas as a de-icing salt to remove snow from concrete pavements and other outdoor platforms, and there is also a large amount of chloride in seawater [27,65]. The existence of chloride salts reduces the various properties of concrete F–T cycles. Some scholars in the United States have found that the concrete at pavement joints in cold areas deteriorates prematurely. The study found that this is due to the accumulation of de-icing salt solution, owing to the failure of waterproof material at the joint, which leads to the continuous entry of the solution into concrete to increase local water saturation. According to the critical saturation theory, this leads to the rapid deterioration of concrete [66,67].
The chemical corrosion effects of different chlorides on concrete are significantly different [68]. When chloride salt penetrates the concrete, it produces Friedel’s salt [18,69,70], such as that in the main chemical reactions between NaCl and cementitious materials, as shown in Equations (1) and (2), respectively. The damage caused by NaCl to concrete and the volume expansion of concrete when in a NaCl salt solution is caused by the crystallization of Friedel’s salt. This type of crystallization pressure causes little damage to concrete, and NaCl has a limited effect on the durability and safety of plain concrete during long-term action.
3 C a O · A l 2 O 3 + C a ( O H ) 2 + 2 N a C l + 10 H 2 O C a 4 A l 2 ( O H ) 12 C l 2 · 4 H 2 O + 2 N a O H
C a 4 A l 2 ( O H ) 12 S O 4 · 6 H 2 O + 2 N a C l C a 4 A l 2 ( O H ) 12 C l 2 · 4 H 2 O + N a 2 S O 4 + 2 H 2 O
CaCl2 produces Friedel’s salt when it is with cementitious materials and reacts with CH to form calcium oxychloride [71], as shown in Equation (3). Calcium oxychloride can cause serious damage to concrete in the absence of air-entraining agents or auxiliary cementitious materials [32]. The volume of calcium oxychloride is 203% larger than that of unreacted Ca(OH)2 (CH), which may cause concrete to be damaged by excessive tensile stress [72].
C a C l 2 + 3 C a ( O H ) 2 + 12 H 2 O 3 C a ( O H ) 2 · C a C l 2 · 12 H 2 O
The reaction of MgCl2 is similar to that of NaCl. It also reacts with Ca(OH)2 and calcium silicate hydrate gel (C-S-H) to produce magnesium silicate hydrate (M-S-H) and Mg(OH)2 without a cementing ability, which leads to the rapid failure of concrete. Simultaneously, MgCl2 and Mg(OH)2 also produce magnesium oxychloride under certain conditions [73,74], as shown in Equations (4)–(6). A study has found that when concrete is exposed to different chloride solutions in an F–T environment, the corrosion of concrete in CaCl2 is more serious. The authors believe that this is caused by expansive calcium oxychloride, which causes cracks in the concrete [75].
C a ( O H ) 2 + M g C l 2 M g ( O H ) 2 + C a C l 2  
C S H + M g C l 2 M S H + C a C l 2  
( 3   o r   5 ) M g ( O H ) 2 + M g C l 2 + 8 H 2 O ( 3   o r   5 ) M g ( O H ) 2 · M g C l 2 · 8 H 2 O  
Due to the different expansion properties of solutions and concrete during freezing, concrete surface spalling and concrete cracks [76,77] are caused, which is called surface scaling. This makes it easier for the solution to invade into the concrete (Figure 6a). When the concentration of NaCl is 3%, the damage of the concrete reaches its maximum. This is the result of the comprehensive action of osmotic pressure and hydrostatic pressure. When the concentration of ions increases due to the freezing or evaporation of the solution when it is entering the pores of the concrete, the ions may crystallize. For the crystallization that appears on the surface of concrete, we call it ‘efflorescence’. As for the crystallization phenomenon that occurs inside the pores, we call it ‘subflorescence’, which is an important cause of concrete microcracks (Figure 6b). When the volume of ice increases, ions gather due to osmotic pressure, and NaCl or sulfate crystals precipitate. In contrast, crystallization has not been found in most studies because the concentration of salt ions that are used in the experiment is not supersaturated. However, Xiao [37] et al. and Li [78] et al. found the phenomenon of ion crystallization in their experiments.
The existence of chloride salt in F–T conditions will also cause the following hazards [17,58,59,65]: the water retention and moisture absorption function of salt itself speeds up the water absorption rate of concrete and shortens the time for it to reach the critical water retention degree; the concentration difference occurs when the salt permeates from the outside to the inside, and the difference in the icing rate of salt solution at different concentrations simultaneously leads to a stress difference and a greater osmotic pressure; the main function of de-icing salt is to eliminate snow, which causes snow to absorb a lot of heat, which rapidly decreases the surface temperature of the concrete, accelerates the freezing rate of supercooled water that is in the capillaries, increases the hydrostatic pressure, and makes surface spalling more serious; in the process of constant circulation, the expansion pressure that is caused by the repeated crystallization of salt in concrete due to supersaturation leads to frost heave damage.
Accordingly, the F–T environment also has a negative effect on the resistance of concrete to chloride-ion penetration. Some studies [29,79,80] have found that the permeability of concrete increases after F–T cycles, and the level of damage is proportional to the number of F–T cycles, which is caused by the degradation of the concrete surface pore structure. The salt solution enters the concrete through the capillaries, and the large osmotic pressure and crystallization pressure inside the concrete lead to new microcracks. Moreover, water and chloride ions accelerate the erosion that occurs [81]. The coupling effect of chloride and F–T cycles also has some advantages: the existence of chloride salt increases the compressibility of ice and the freezing point of the water drops, which reduces the damage degree incurred by the concrete [82].
Currently, the damage mechanism of the chloride-F–T process is still in the qualitative research stage [79]. Some scholars [83,84,85] do not agree with the above research results, for example, some scholars have found that the spalling of concrete surfaces has little to do with the existence of salt. F–T damage does not always occur at 3% concentration, and even the presence of salt can delay the failure time of concrete. The deformation of concrete at low concentrations is mainly due to the action of water, and the effect of salt is gradually strengthened only when the concentration is more than 15%. These disputes show that salt freezing is not only the result of a single factor, but also the result of the joint action of the salt solution, types of concrete, and environmental conditions, which cannot be fully revealed by an exact model.

2.2.2. Mechanism of Sulfate-F–T Damage

Concrete also suffers from sulfate erosion when it is affected by F–T cycles in winter and early spring [86,87,88]. Sulfate erosion is divided into physical and chemical types [68,89,90]. In terms of physical erosion, the external sulfate enters the concrete through the microcracks of the concrete, and the diffusion rate is accelerated if the external concentration is greater than the internal concentration. Crystallization occurs when the solution concentration in the pores reaches a supersaturated state. The crystallization expansion rates of Na2SO4 and MgSO4 in a supersaturated solution are 311% and 11%, respectively [91,92,93]. Salt crystallization will make the concrete fill the void and make the concrete dense, but the concrete will be destroyed when the expansion pressure caused by continuous crystallization exceeds the critical value of the concrete [94]. The chemical erosion of concrete by sulfate can be divided into two aspects. Sulfate reacts with the internal hydration products of concrete. On the one hand, it produces expansive insoluble substances such as ettringite and gypsum, as shown in Equations (7) and (8), respectively, which fills the interior of the concrete in the early stage but leads to concrete deterioration when it exceeds a certain amount. On the other hand, the decomposition of C-S-H and CH under sulfate erosion leads to a gradual loss of the cement shape, as shown in Equation (9). At low temperatures [95,96,97], gypsum may form tobermorite (CaCO3·CaSO4·CaSiO2·15H2O) with compounds such as CH, silica, and calcium carbonate. The volume of the reaction product expands, and cracks appear in the concrete to reduce its strength. In addition, when the temperature is less than 15 °C, it may be attributed to the reaction of sulfate with C-S-H and carbonate under the condition of exposure to sufficient water, which may lead to the formation of white carbothiosilicate (CaSiO3·CaCO3·CaSO4·15H2O, TSA) without a cementation ability. TSA itself does not cause the expansion. However, the TSA crystal nucleus continues to form and consume C-S-H. This causes the concrete to lose its cementation ability, and the structure gradually deteriorates and fails.
N a 2 S O 4 · 10 H 2 O + C a ( O H ) 2 = C a S O 4 · 2 H 2 O + 2 N a ( O H ) + 8 H 2 O  
3 C a S O 4 · 2 H 2 O + 4 C a O · A l 2 O 3 · 13 H 2 O + 14 H 2 O = 3 C a O · A l 2 O 3 · 3 C a S O 4 · 32 H 2 O + C a ( O H ) 2  
N a 2 S O 4 + C a ( O H ) 2 + 2 H 2 O = C a S O 4 · 2 H 2 O + 2 N a ( O H )  
The interaction mechanism between sulfate and F–T cycles is complicated [28,37,98]; the sulfate diffusion rate decreases at low temperatures, whereas the large pores created by F–T cycles lead to increased sulfate permeability. Sulfate increases the compressibility of ice, and the freezing point of water inside the concrete decreases; however, the crystallization pressure that is produced by the supersaturated solution promotes the F–T damage of the concrete. Sulfate crystal expansion, chemical corrosion, and a water frost heaving force lead to sulfate-F–T coupling damage [24,35,99]. When the coupling erosion begins, the F–T cycles cause microcracks on the concrete surface, and SO42− is quickly transferred to the interior. The surface voids that are filled by ettringite and gypsum which are produced by the reaction of SO42− with concrete decrease the porosity of concrete, and concrete becomes dense, which restricts the effect of the cycles. With the deepening of the F–T erosion, the growing micro-cracks accelerate sulfate erosion, while C-S-H and CH continue to decrease. Finally, the crystallization pressure that is produced by sulfate, frost heave pressure, and the expansion pressure of ettringite and gypsum acts on the pores of the concrete. Wang et al. [38] proposed a united damage model and found that the corrosion products that were produced by sulfate in the early stage protected the concrete, and that the cycles caused damage. In the later stage, the physical and chemical actions of salt ions are the first causes of concrete deterioration, while the F–T damage effect is weakened owing to the loose internal structure of the concrete. For a low-concentration (3%) sodium sulfate solution, owing to the slow production rate of corrosion products, its reinforcement effect on concrete lasts longer [35]. Li et al. [24] analyzed the effect of sulfate types on F–T concrete and found that magnesium sulfate produces corrosion products and converts CH into gypsum, which reduces the alkalinity of concrete and further promotes the decomposition of C-S-H. Therefore, the magnesium sulfate solution had a stronger corrosion effect than the sodium sulfate solution did.
Generally speaking, salt freezing damage mainly leads to the surface spalling and the internal deterioration of concrete, which is the result of salt crystallization, phase transformation, and chemical corrosion [17,100]. Figure 7 reveals this process. Firstly, CH is unstable during concrete freezing, resulting in a frost heave pressure and an osmotic pressure. The increase in the ion concentration of unfrozen water in macropores causes CH to migrate to macropores when it is under osmotic pressure. Salt ions react with CH to form expansion products. At the same time, ice crystals gradually increase and squeeze the pore wall. Subsequently, due to the increase in the crystallization pressure and osmotic pressure in the large pore, the unfrozen water flows to the small hole, and micro-cracks also appear in the small hole under the action of hydrostatic pressure. In the process of melting, some of the erosion products decompose instantly (such as Friedel’s salt), ice crystals melt, and CH from decomposition begins to precipitate, which may block the channel between macropores and small pores. With each cycle, the more the internal crack space expands, then the more serious the concrete deterioration is.
In the case of the coupling erosion of chloride salt and sulfate, they have a certain inhibitory effect [23,68]. The diffusion rate of sulfate is slower than that of chloride salt, but it can produce expansion products such as ettringite and gypsum to make the surface of the concrete compact and delay the corrosion of chloride salt. However, when chloride ion has penetrated into the concrete, sulfate has little effect on the corrosion rate of chloride ions [101]. On the other hand, the existence of chloride ion also delays sulfate corrosion. The reason is that chloride ions permeate into the concrete to fill the void with Friedel’s salt, and chloride leads to the increase of the solubility of sulfate corrosion products and the decrease of pore pressure [102,103]. Up to now, the research on the coupling effect of chloride-sulfate-F–T cycle is still very limited [104].

2.3. Microstructure Testing

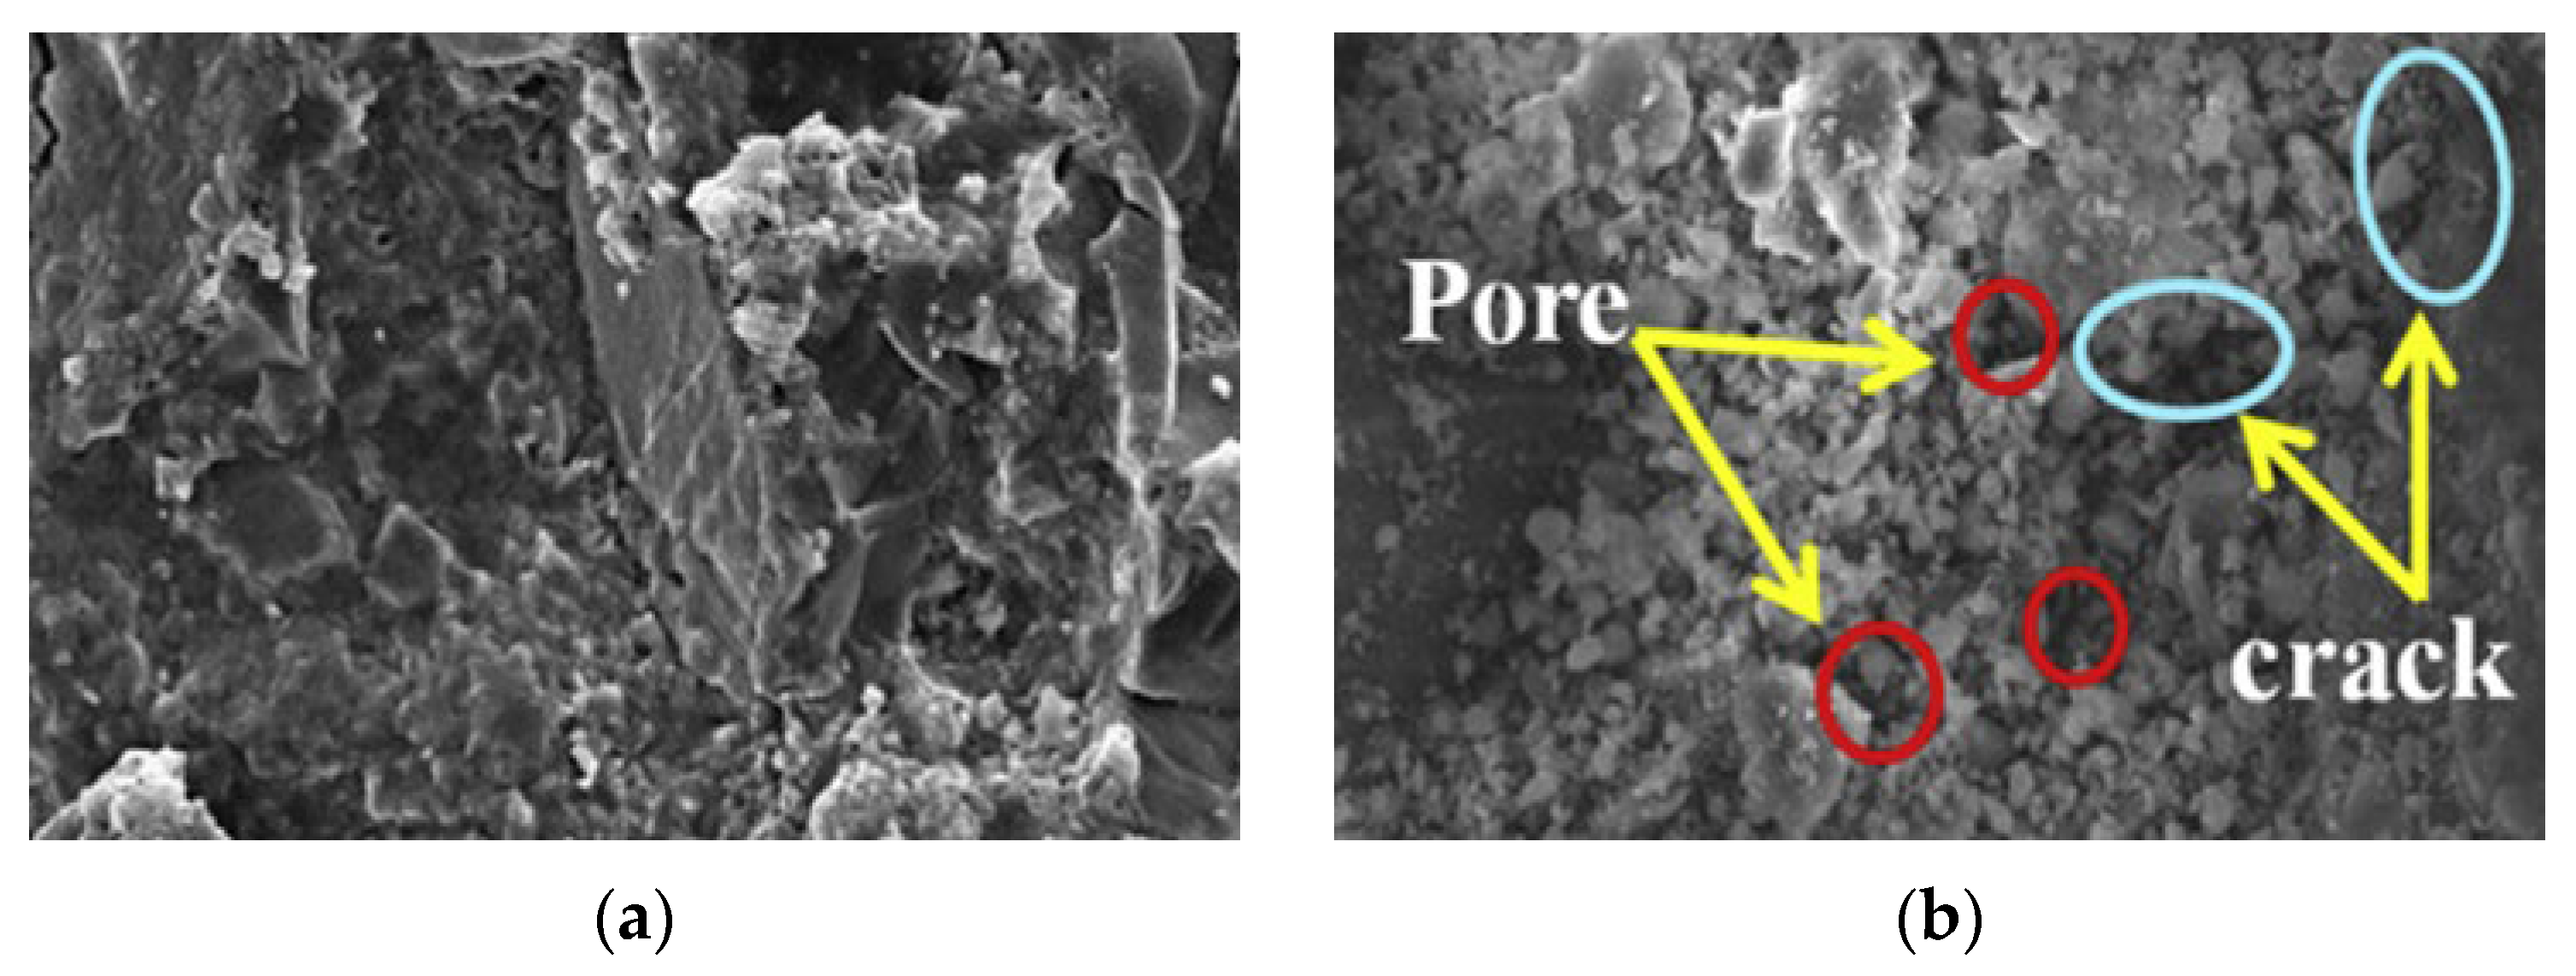
2.3.1. SEM Observation
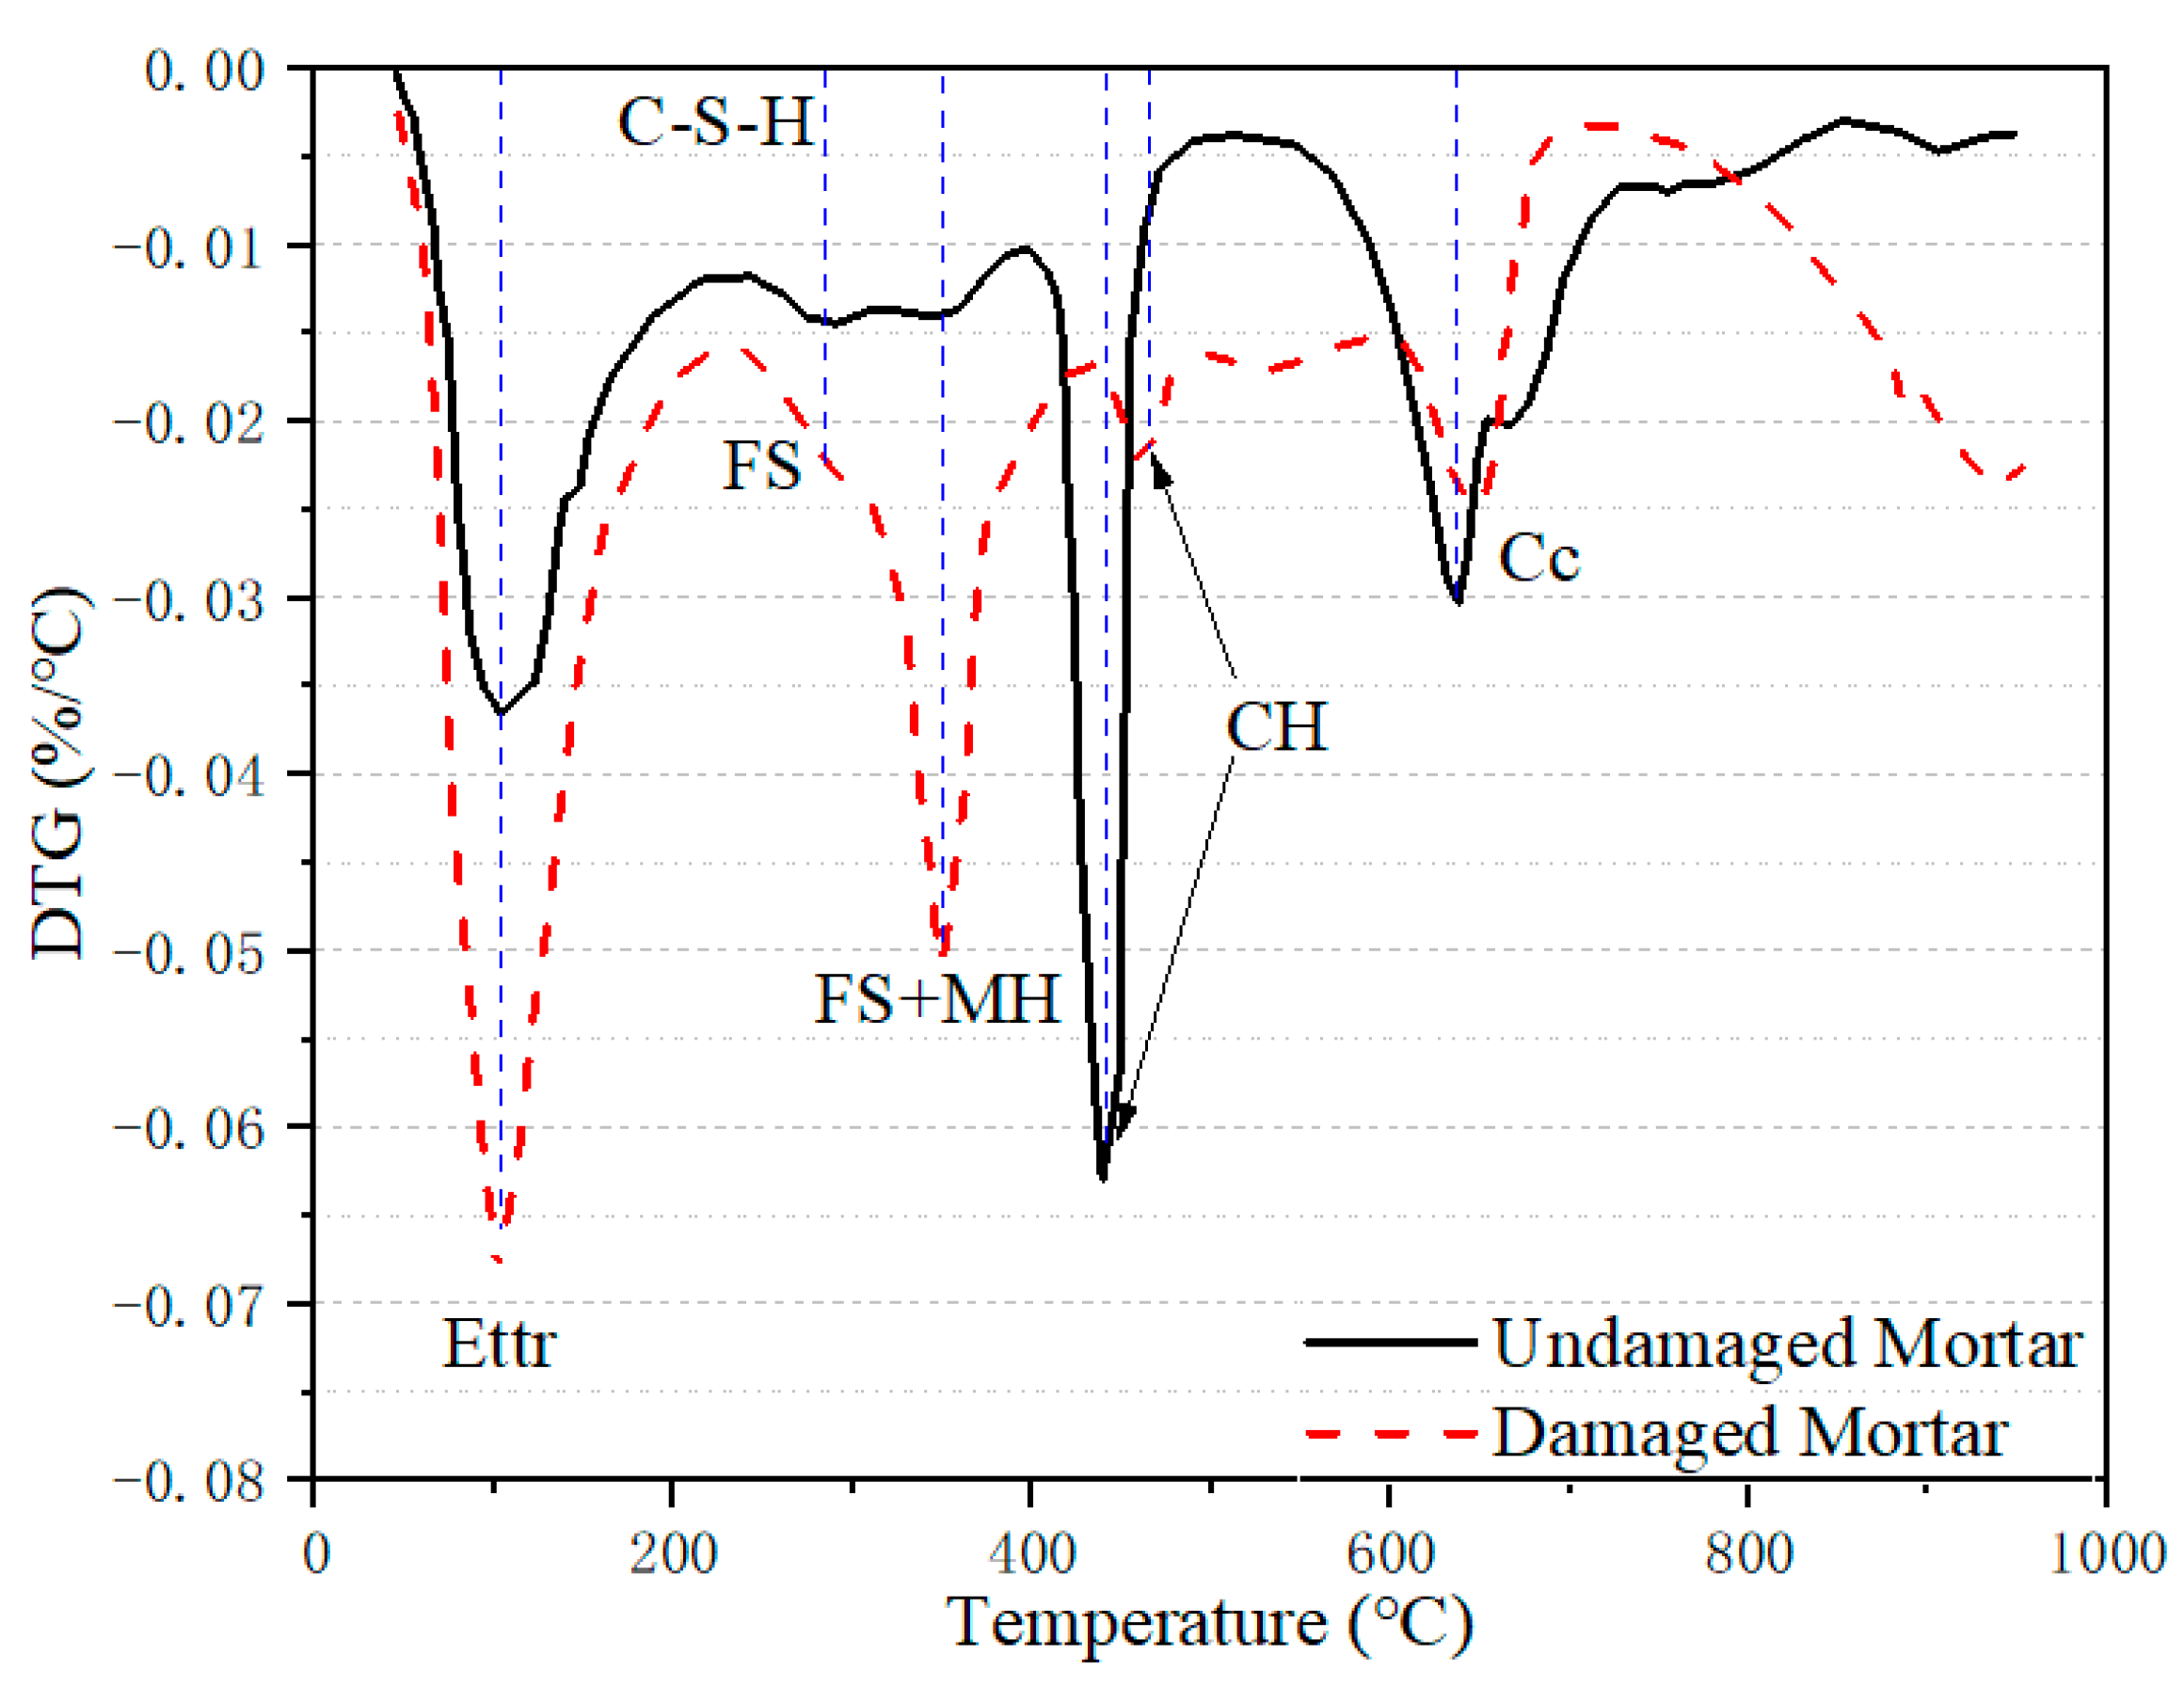
SEM observes the changes in concrete morphology and the process of microstructure deterioration at the micro level to explain the mechanism of performance degradation [24,25,26,79]. As shown in Figure 8, SEM images of concrete in the initial conditions without visible microcracks show that the concrete is dense. After F–T cycles, the expansion of the corrosion products and ice in the pores causes the nanostructure of the concrete to deteriorate [105]; pores and microcracks grow and expand, and the structure becomes loose [36,80,106]. Wen et al. [107] reported a large amount of fibrous and coral-like C-S-H gels at the beginning of the F–T erosion. With the extension of the F–T experiment, ettringite began to appear. The expansion, caused by excessive ettringite, caused concrete cracking, and visible pores and so, cracks appeared in concrete.
When concrete is subject to the coupling action of chloride-F–T cycles, SEM shows that the void expands, microcracks develop into cracks, the concrete becomes loose and porous, and the degree of the internal microdamage of the concrete when it is subject to the coupling action is much more serious than a single erosion factor is [29,108]. For the concrete that is under the condition of the F–T cycles in 4% NaCl solution (see Figure 9), it was found that at the initial stage, there were a few micropores and microcracks; after 20 F–T cycles, the internal pores expanded and C-S-H was consumed; after 40 F–T cycles, the C-S-H was flocculent, and the microcracks expanded; after 60 F–T cycles, the cracks were connected with each other, the pore expanded, the C-S-H decreased, and the concrete lost its bond property [109].
The SEM images of concrete that was frozen and thawed with different sulfate ions have great differences in micro-morphology [88]. After F–T cycles in water (Figure 10), the pore structure is loose and there is a small amount of acicular ettringite crystals in the pores. Hydrated calcium silicate covers the surface of the spherical particles that are not completely hydrated; the F–Ted concrete in 10% Na2SO4 solution produces massive amounts of acicular ettringite and parts of the C-S-H gel, which form a complex network structure. It surrounds the cement-based surface, and the unhydrated particles basically disappear, indicating that sodium sulfate causes deep erosion on cement-based materials; the concrete in the 10% MgSO4 solution is similar to that in the sodium sulfate solution, but the ettringite content is significantly reduced, and there are massive C-S-H gels.
From the results of the SEM testing, under the action of F–T cycles, the pores of the concrete increased and the microcracks expanded, leading to loosening of the concrete microstructure [110]. Pores and microcracks appeared in the concrete after chloride ion infiltration. After salt freezing cycles, a large number of large pore holes and cracks appeared. For the sulfate-F–T cycle, the researchers found that in the early stage of the cycle, a large number of columnar or acicular ettringite crystals were formed at the edge of the macropore, and ettringite played a filling role. After 200 cycles, ettringite filled the channel and the concrete began to produce new microcracks. At the same time, it was found that in the low concentration (2%) Na2SO4 solution, the morphology of the concrete changed little after the cycle, while the high concentration of Na2SO4 (5%) had an important effect on the morphology of the concrete. Hence, under the action of an F–T cycle and ion coupling, due to the increase in the pore size and the cracks, the deterioration of the concrete structure when it was under the coupling action was more serious than that which was under the single action [111,112].

2.3.2. Composition

TG-DSC, XRD, and EDS are commonly used testing methods for the quantitative analysis of corrosion products in concrete [28,113]. Low-density C-S-H, high-density C-S-H, and CH are the main hydration products, and their contents are closely related to the concrete performance. Xie et al. [114] tested the content of three types of hydration products of UHPC in F–T cycles using the statistical nanoindentation method and deconvolution technique. It was found that after 1500 F–T cycles, the low-density C-S-H, high-density C-S-H, and CH decreased by 10.58%, 14.56%, and 3.3%, respectively. Liu et al. [115] analyzed the volume fraction of the components under different cycles using micro-CT and nanoindentation technology and found that the initial C-S-H and pore volume fractions were 71.8% and 5.6%, respectively. After 600 F–T cycles, the initial C-S-H and pore volume fractions were 63.0% and 18%, respectively. The increase in the pore structure was the main factor for the decline in the RDEM of the specimen.
Through the analysis of the composition of concrete under different sulfate-F–T conditions [25], it is found that regardless of the type of sulfate solution, the contents of ettringite and gypsum increased, whereas the concentration of silicate decreased. The amount of corrosion products in a MgSO4 solution was higher than that in a Na2SO4 solution. Brucite, which caused by the reaction between MgSO4 and silicate, was also observed. These results indicate that the erosion of MgSO4 is more severe under F–T conditions. The diffraction peak of ettringite is positively correlated with Na2SO4 in the sulfate-F–T cycle test, and the occurrence time of the diffraction peak of gypsum is negatively correlated with the sulfate concentration. This proves that the sulfate concentration is beneficial for the corrosion of concrete [110]. The acicular crystals were mainly composed of ettringite after the 200th F–T cycle, while columnar gypsum crystals began to appear after 300 F–T cycles. XRD analysis revealed that after 300 cycles, the diffraction peak of CH disappeared and CH disappeared completely, while the diffraction peaks of ettringite and gypsum reached their highest points [35,37]. Wang et al. [17] used XRD and thermal analysis to determine that the amount of CH was inversely proportional to the number of F–T cycles in NaCl. Qiao et al. [65] carried out the thermal separation of F–T damaged and undamaged mortars using a de-icing salt (Figure 11). At 400–500 °C, the CH content of the damaged mortar was 1/12 that of the undamaged mortar. Combined thermal analysis, EDS, and XRD and found that although the microcracks that were produced in the chloride-F–T environment could provide sufficient water, the amount of CH and C-S-H that were produced by volcanic ash was not high, and the gel was loose owing to a low temperature, ion erosion, crystallization pressure, and other factors [116]. The analysis of the phase composition in the F–T cycles shows that C-S-H is constantly decomposed and new pores appear. The existence of salt erosion leads to the further consumption of C-S-H, significantly reducing the content of cement hydration products and accelerating the deterioration of the microstructure of concrete. The existence of chloride and sulfate leads to the accelerated decomposition of C-S-H and CH in concrete, forming ettringite, gypsum, and unstable Friedel’s salt. For each cycle, more corrosion products are formed, and to a certain extent, the expansion pressure that causes cracks in the concrete is increased, and this accelerates the entry of the solution, and as a result, the concrete fails [117,118].

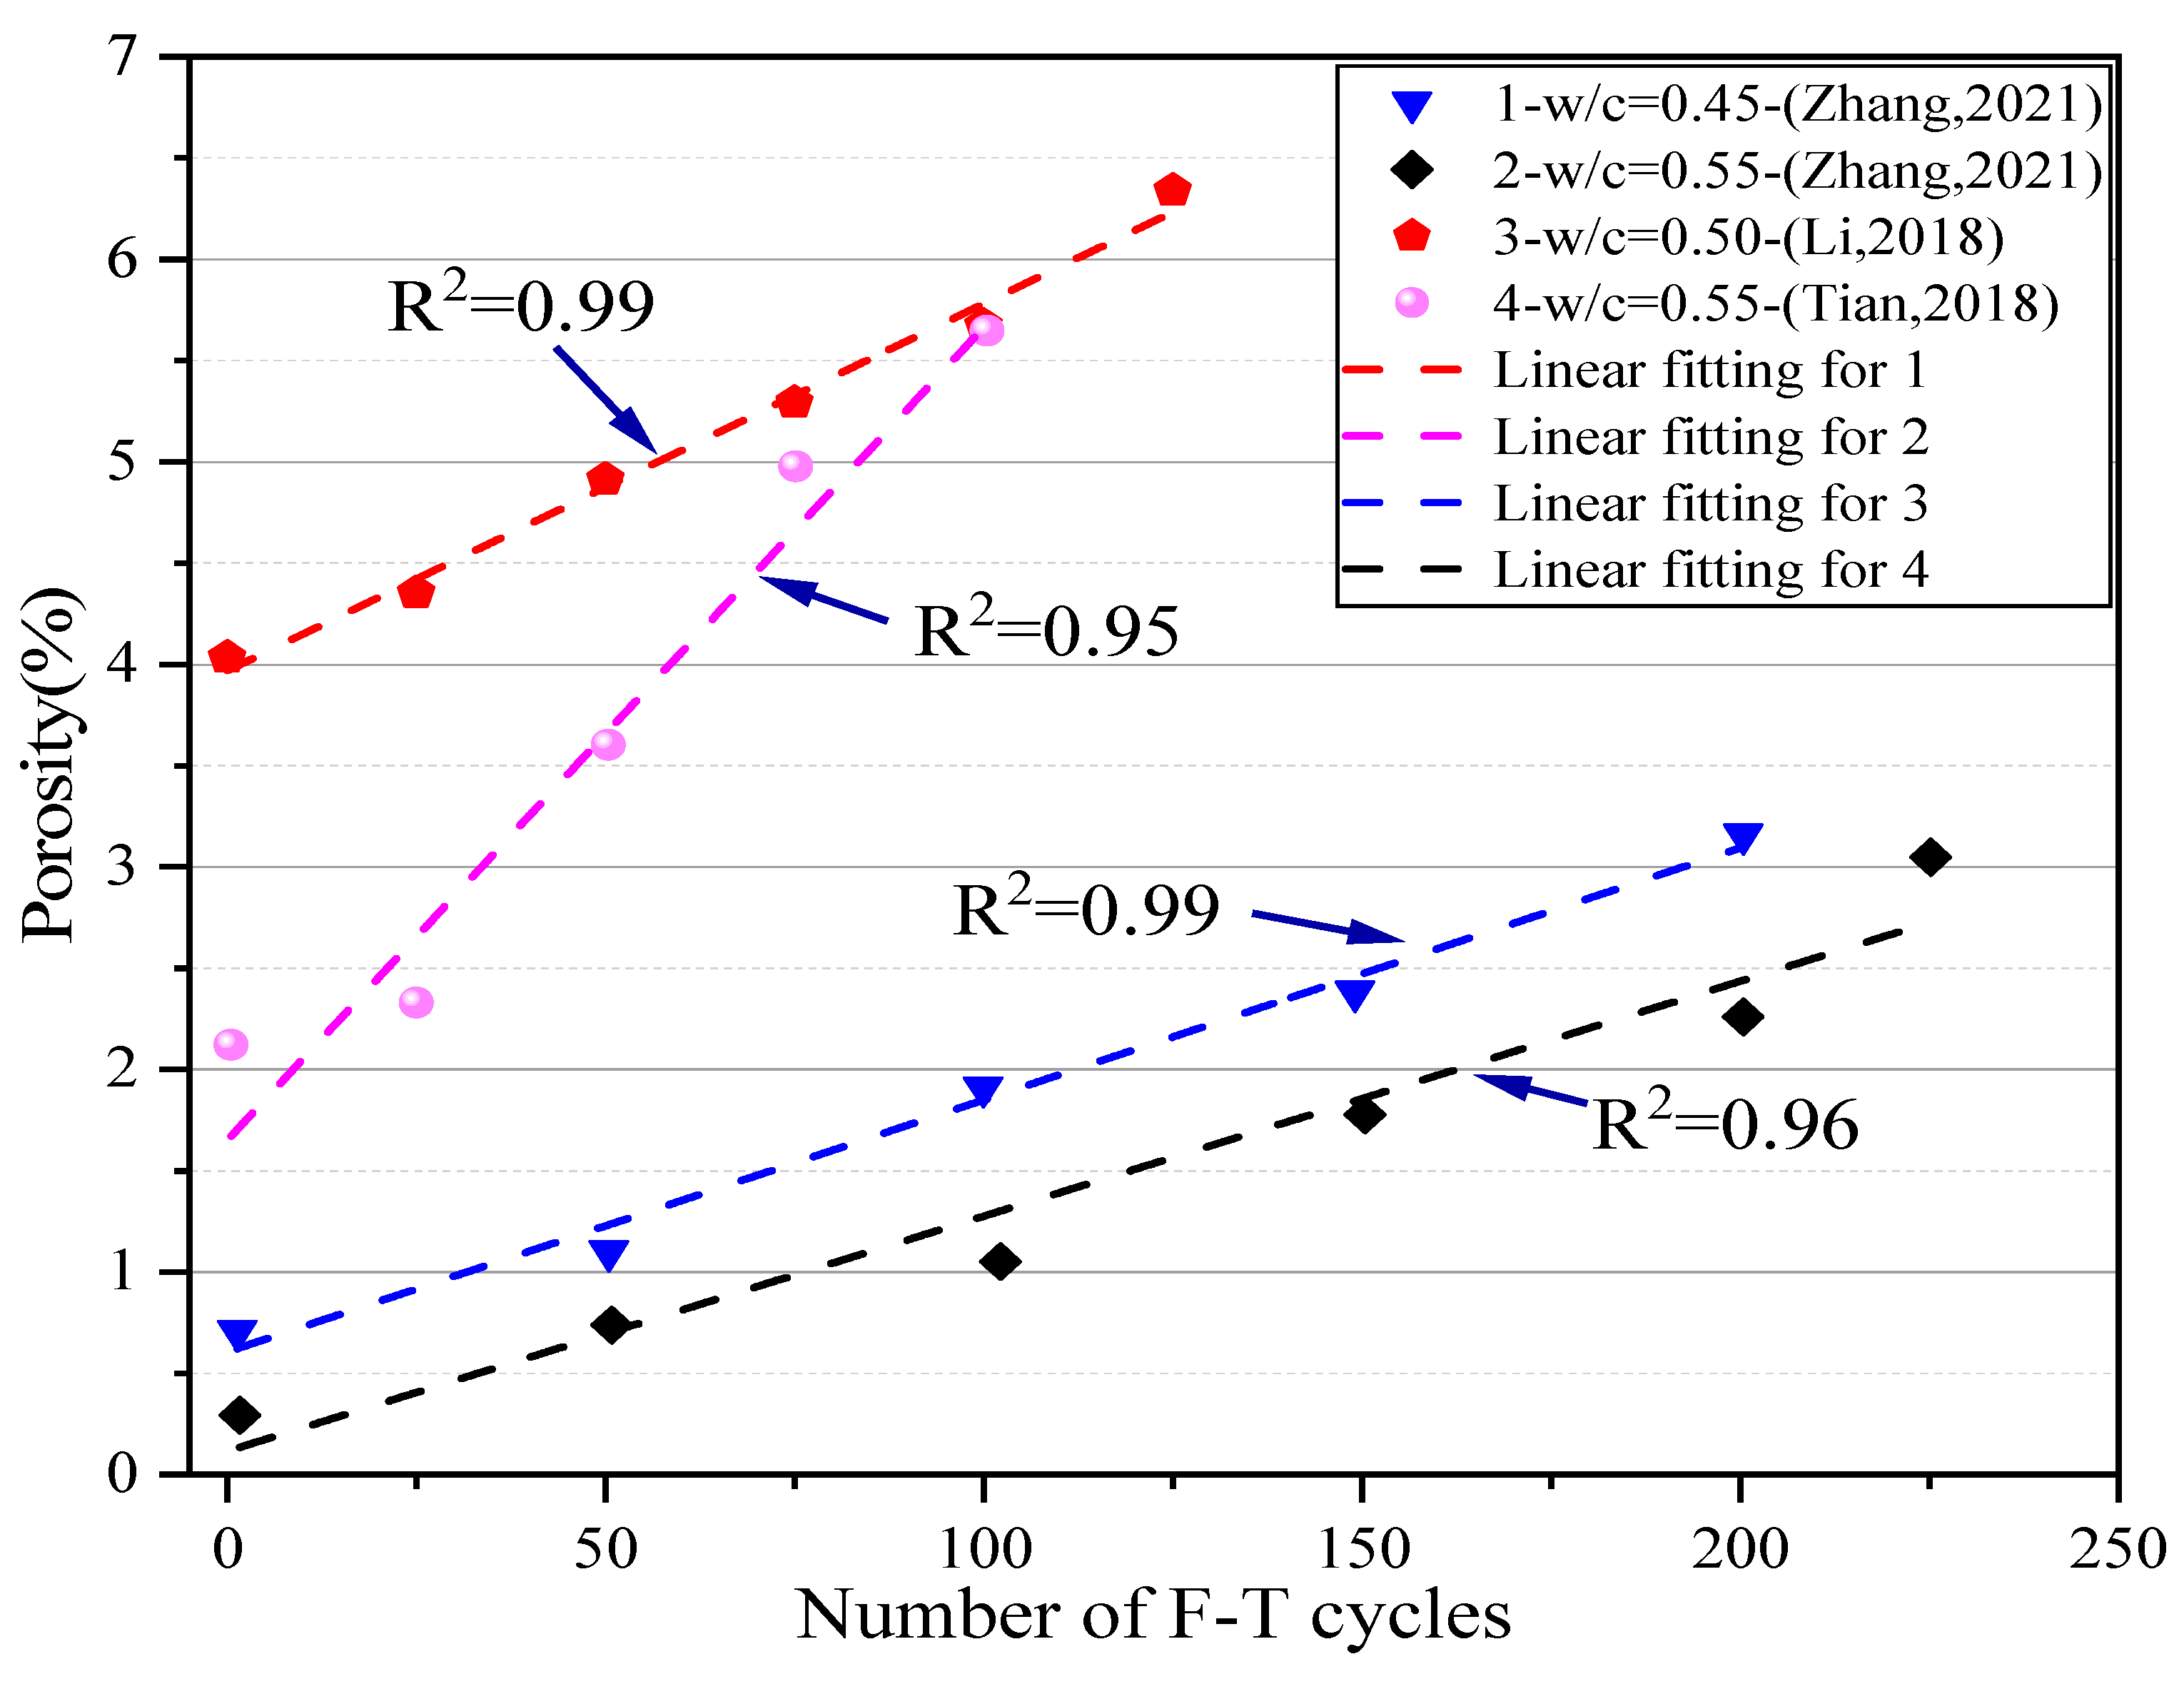
2.3.3. Pore Structure

The pore structure is the main factor affecting the durability and safety of concrete. The pores of concrete are generally distributed in the range of 3–100,000 nm, and the pores that are smaller than 50 nm are considered to have little effect on the F–T properties [119,120]. The experimental methods also differed according to the pore size. Methods for testing the pore structure include optical microscopy, MIP, CT, NMR, and nitrogen adsorption [121,122,123].
Zhang et al. [124] explored the change in porosity of concrete with different water–cement ratios (w/c) before and after F–T cycles using the MIP technique. The porosity with a w/c of 0.4 was increased by 2.7% after 50 cycles, whereas that of concrete with 0.6 w/c increased by 7% after 25 cycles. It can be observed that the lower the w/c, then the smaller the change in the concrete pore structure after cycling is (Figure 12). There was a linear correlation between porosity and the number of cycles, and the correlation between the two linear fitting curves was excellent. The peak diameters of the pore size distributions of concrete that was mixed with nano-silica, nano-TiO2, and polypropylene fiber are 30 nm, 40 nm, and 50 nm, respectively, whereas ordinary concrete has two peak diameters of 80 nm and 3000 nm [99]. Other scholars [33] used MIP to test the pore structure of concrete with different auxiliary cementitious materials; the shape of the pore structure curves of the concrete did not change after the F–T cycles, i.e., the macropores (>1000 nm) increased, the transitional pores (10–100 nm) decreased, and other pores changed slightly. These results indicate that some transition pores deteriorated seriously under F–T cycles and were torn into macropores, and thus, the pore structure became loose. However, other scholars have expressed different opinions. Sun et al. [125] used the NAM method to test the MIP of concrete with a different diatomite content after F–T. The F–T damage was most apparent in the pore structure of small concrete pores (≤100 nm).
CT [20,21,22,122] technology is often used to detect changes in concrete porosity. The X-ray absorption coefficients of the different concrete component densities were different. The internal damage incurred by the concrete can be analyzed according to its CT grey value, and the pores are extracted according to the three-dimensional reconstruction technique to calculate the pore characteristic parameters.
Liu et al. [115] analyzed the internal pores of shotcrete using micro-CT technology and performed a 3D reconstruction (Figure 13). The cracks are shown in red, and the micropores are shown in blue. The micropores in the concrete mainly appeared near the initial defects in concrete that did not undergo F–T cycles. With the deepening of the F–T deterioration, the micropores began to appear far away from the cracks, some pores began to connect, and the cracks began to expand. Finally, the size of the micropores increased, and most of the micropores penetrated each other. The expansion of microcracks and micropores were the key factors for the F–T deterioration of concrete.
Zheng et al. [126] used CT technology and 3D reconstruction to integrate pores into small pores (V < 0.1 mm³), mesopores (0.1 ≤ V ≤ 1 mm³), and macropores (V > 1 mm³), according to their pore volume. The proportions of small, medium, and large pores were 47.3%, 39.8%, and 12.9%, respectively, before the F–T cycles, and 35.8%, 45.7%, and 18.5%, respectively, after 50 cycles. The proportion of small pores was decreased, whereas that of large and middle pores was increased. Li et al. [20] found a linear relationship between the increment in porosity and the number of F–T cycles using the CT scanning of mortar in 4% NaCl. In addition, it is found that the shape factor of pores is less than 1 (between 0.2 and 0.4), which shows that these pores are not spherical. The application of F–T cycles cause concrete pores to be torn, making them more irregular [21]. Through the reconstruction of the concrete pore structure that was scanned using CT, it was found that the concrete porosity (>0.1 mm) increased slowly at first, then increased rapidly, and finally slowed down gradually [127]. After 25 cycles, the porosity only increased by 0.18% after 50, 75, and 100 cycles. Small pores (0–0.5 mm2) had increased at first, then they decreased slightly, and finally they increased rapidly. This may be because larger pores were cut by cracks to form smaller pores, while mesopores (0.5–5 mm2) were increasing. In addition, it was found that 3DP technology can simulate the actual axial compression behavior of a concrete well. Chen et al. [128] supported this result.
NMR has the advantages of being nondestructive, fast, and accurate; therefore, it is often used to obtain the pore structure parameters of concrete [24,129,130]. Liu et al. [131] investigated the effect of F–T damage on the pore size distribution of cement mortar for the first time, using NMR. The first spectral peak (approximately 1 ms) was a small pore, whereas the second spectral peak (approximately 40–60 ms) was a large pore. The F–T cycles caused the spectral curve to expand outward as a pore, and the spectral peak increased by approximately 25% after 100 cycles, whereas the macropore peak increased by 100%. The F–T cycles caused the micropores in the mortar to change to large pores and the emergence of many new micropores. Wang et al. [129] carried out more detailed NMR tests of mortar pore structures and divided the pores into micropores (<5 nm), small pores (5 nm < r < 20 nm), mesopores (20 nm < r < 100 nm), and macropores (>100 nm), and they considered that the degree of harm had increased. Figure 14a shows the pore size distribution trend of mortar with 0.45 w/c, that underwent F–T cycles. The macropore porosity increased rapidly. However, the other pores did not change significantly, indicating that F–T cycles mainly lead to the upgrading of mesopore pore cracking to macropores, but it had little effect on small pores. In a study [132], it was also found by using low-frequency NMR, that after 200 cycles, the porosity of concrete increased by 53.49%, and the number of harmless pores (<20 nm), medium pores (20–200 nm), and macropores (>200 nm) had increased (Figure 14b). The proportion of harmless pores decreased from 84.9% to approximately 50%, whereas the proportion of medium and large pores increased rapidly from 15.1% to 50%. The deterioration that was caused by the F–T cycles mainly caused the micropores to gradually become medium-sized pores and large pores. Shen et al. [133] investigated the effect of F–T cycles on concrete porosity by using NMR and found that there was an abrupt change in the changing trend of concrete porosity in 10 cycles; the porosity of concrete increased by 12% in the first 10 cycles and 22% after 10–20 cycles. The pores were divided into micropores (<10 nm), mesopores (10–100 nm), and macropores (>100 nm). After 20 F–T cycles, the micropores and mesopores were increased by 62% and 155%, respectively, while the macropore increase had exceeded 100%. The F–T cycles mainly affected the mesopores and macropores of the concrete.
Figure 12. Variation of porosity after F–T cycles under different water–cement ratios [20,127,131].
Buildings 12 01317 g012
Figure 13. 3D reconstruction model of cracks and pores in shotcrete that underwent different F–T cycles [115].
Buildings 12 01317 g013
Figure 14. Change of pore structure after F–T cycles. (a) NMR test results of mortar [129]; (b) NMR test results of concrete [133].
Buildings 12 01317 g014
The degree of F–T damage mainly depends on the pore structure, and the pore size of concrete varies from 0.5 nm to centimeter [134]. The size of the pores has a decisive effect on the role of water freezing. First of all, the surface adsorption force between the water and the pore wall increases with the decrease of the pore size, so the pore diameter is inversely proportional to the freezing point. Secondly, the smaller the pore size is, then the lower the humidity requirement of the pore is, and the easier it is for it to absorb water. It is found that when the pore is 0.01 mm, the freezing temperature of water is less than −20 °C when the relative humidity is 90% to 99%. When the pore is greater than 0.1 mm and the relative humidity is more than 99%, it can be frozen at −4~0 °C [135]. On the other hand, the value of the w/c has a great influence on the pores because the hydration reaction consumes the water of the pores and fills the pores, resulting in an increase in the number of gel pores. The pores almost disappear when the w/c is less than 0.36 [136].
MIP, CT scanning, NMR, and other techniques were used to analyze the changes in the concrete pore structure [137]. During cycling, concrete porosity is proportional to the number of cycles. Many researchers have explored the changing trend of characteristic parameters, such as pore size distribution and pore shape, with F–T cycles. First, the proportion of mesopores and macropores increased, micropores continued to expand, micropores developed into microcracks, and microcracks expanded into macroscopic cracks and pores. Second, the pore structure deteriorated slowly during the early cycles. With the expansion of the pores, water entered completely, and the porosity of the concrete increased rapidly. After 200 F–T cycles, the pore structure deteriorated significantly [132], and the growth slowed after the basic failure of the concrete. The pores in the concrete were round when they were not frozen or thawed. The pores of the concrete were torn under the action of F–T, and the pore shape evolved in an irregular direction. Hence, it is necessary to optimize the w/c and material ratio in order to obtain the best pore structure.

2.3.4. Microcracks

The F–T cycles no longer solely deteriorated the pore shape of concrete; however, they also expanded the preliminary microcracks of concrete and had produced new microcracks [138]. There were some micropores and a small number of microcracks in the concrete itself, and the width of the microcracks was approximately 5–10 μm. With an increase in the number of cycles, microcracks had started to develop. When a massive range of microcracks increased, the mechanical properties of concrete was decreased, and the transmission performance was increased [139].
The propagation of microcracks was quantitatively analyzed using a scanning electron microscope and image processing technology [140]. After 300 cycles, the maximum crack length (MCL) and maximum crack width (MCW) increased by 114.8% and 72.3%, respectively. F–T damage led to a rapid increase in microcracks in the concrete, and the width was also increased. Liu et al. [141] used convolution neural network technology to segment CT scan images and performed a three-dimensional reconstruction. It was discovered that after 0, 300, and 600 cycles, the length of the micro-cracks in the concrete was 172.5 μm, 323.9 μm, 532.0 μm, respectively, and the number of micro-cracks per unit area was 84,112,214. Every 300 cycles, the number of microcracks was increased by 34% and 91%. The F–T cycles lead to the enlargement and initiation of concrete microcracks. As shown in Figure 15, Li et al. [34] extracted the distribution characteristics of concrete microcracks in the cycles using a fluorescence microscope; when the RDEM was from 1 to 0.4, the length density and volume density of microcracks were increased by 0.175 mm/mm2 and 0.295%, respectively. Both are linearly related to the RDEM, indicating that the formation and development of microcracks are closely related to the degree of the F–T damage of the concrete. The microcracks of abnormal saturated specimens after cycling were analyzed by means of three-dimensional X-ray and an acoustic emission technique. It was found that the volume of microcracks expanded with the increase in the F–T cycle, and the formation of microcracks was closely related to saturation. Concrete microcracks with 95% saturation were distributed in all components, whereas the 75% saturation of concrete only found microcracks in the ITZ. The critical saturation value of concrete was 85% [142].
Liu [143] and Dong [144,145] used CT technology to find that the increase in microcracks after F–T cycles changes the bending degree and macroscopic crack length of the concrete, which causes the fracture path to change from a straight line to a bending path, and therefore, the crack resistance of concrete decreases. Luo et al. [146], through nano-CT scanning, found that under the initial conditions, the surface of the concrete was intact, and the overall defects were few. After 500 cycles, many microcracks appeared around the aggregate and extended into the cement paste. After 700 F–T cycles, microcracks were found in all components, indicating that the F–T cycles destroy the matrix and the aggregate. In a study [147], it was found that there were also microcracks in the surface and interior of the macropores in concrete, which may also be due to concrete pore tearing which was precipitated by applying a hydrostatic stress and a freezing pressure.
F–T cycles accelerate the growth and propagation of microcracks in concrete, which inevitably influences the macroscopic properties of concrete. In the existing research, the microcrack information of concrete during F–T cycles is extracted by microscopy and CT reconstruction technology; the evolution process of concrete microcracks is analyzed qualitatively or quantitatively, and the relationship is established between the processes of change undergone by the concrete’s macroscopic properties, and the deterioration mechanism of the concrete during these cycles is revealed. In addition, the w/c also has an effect on the microcracks of concrete. With the increase of w/c, there are more initial defects in concrete and the crack width increases. The microcracks expand under the action of F–T, and different pores (10~50 μm) are connected, which leads to the deterioration of pores. Therefore, low water–cement ratio concrete can have better freeze–thaw resistance [119,133].

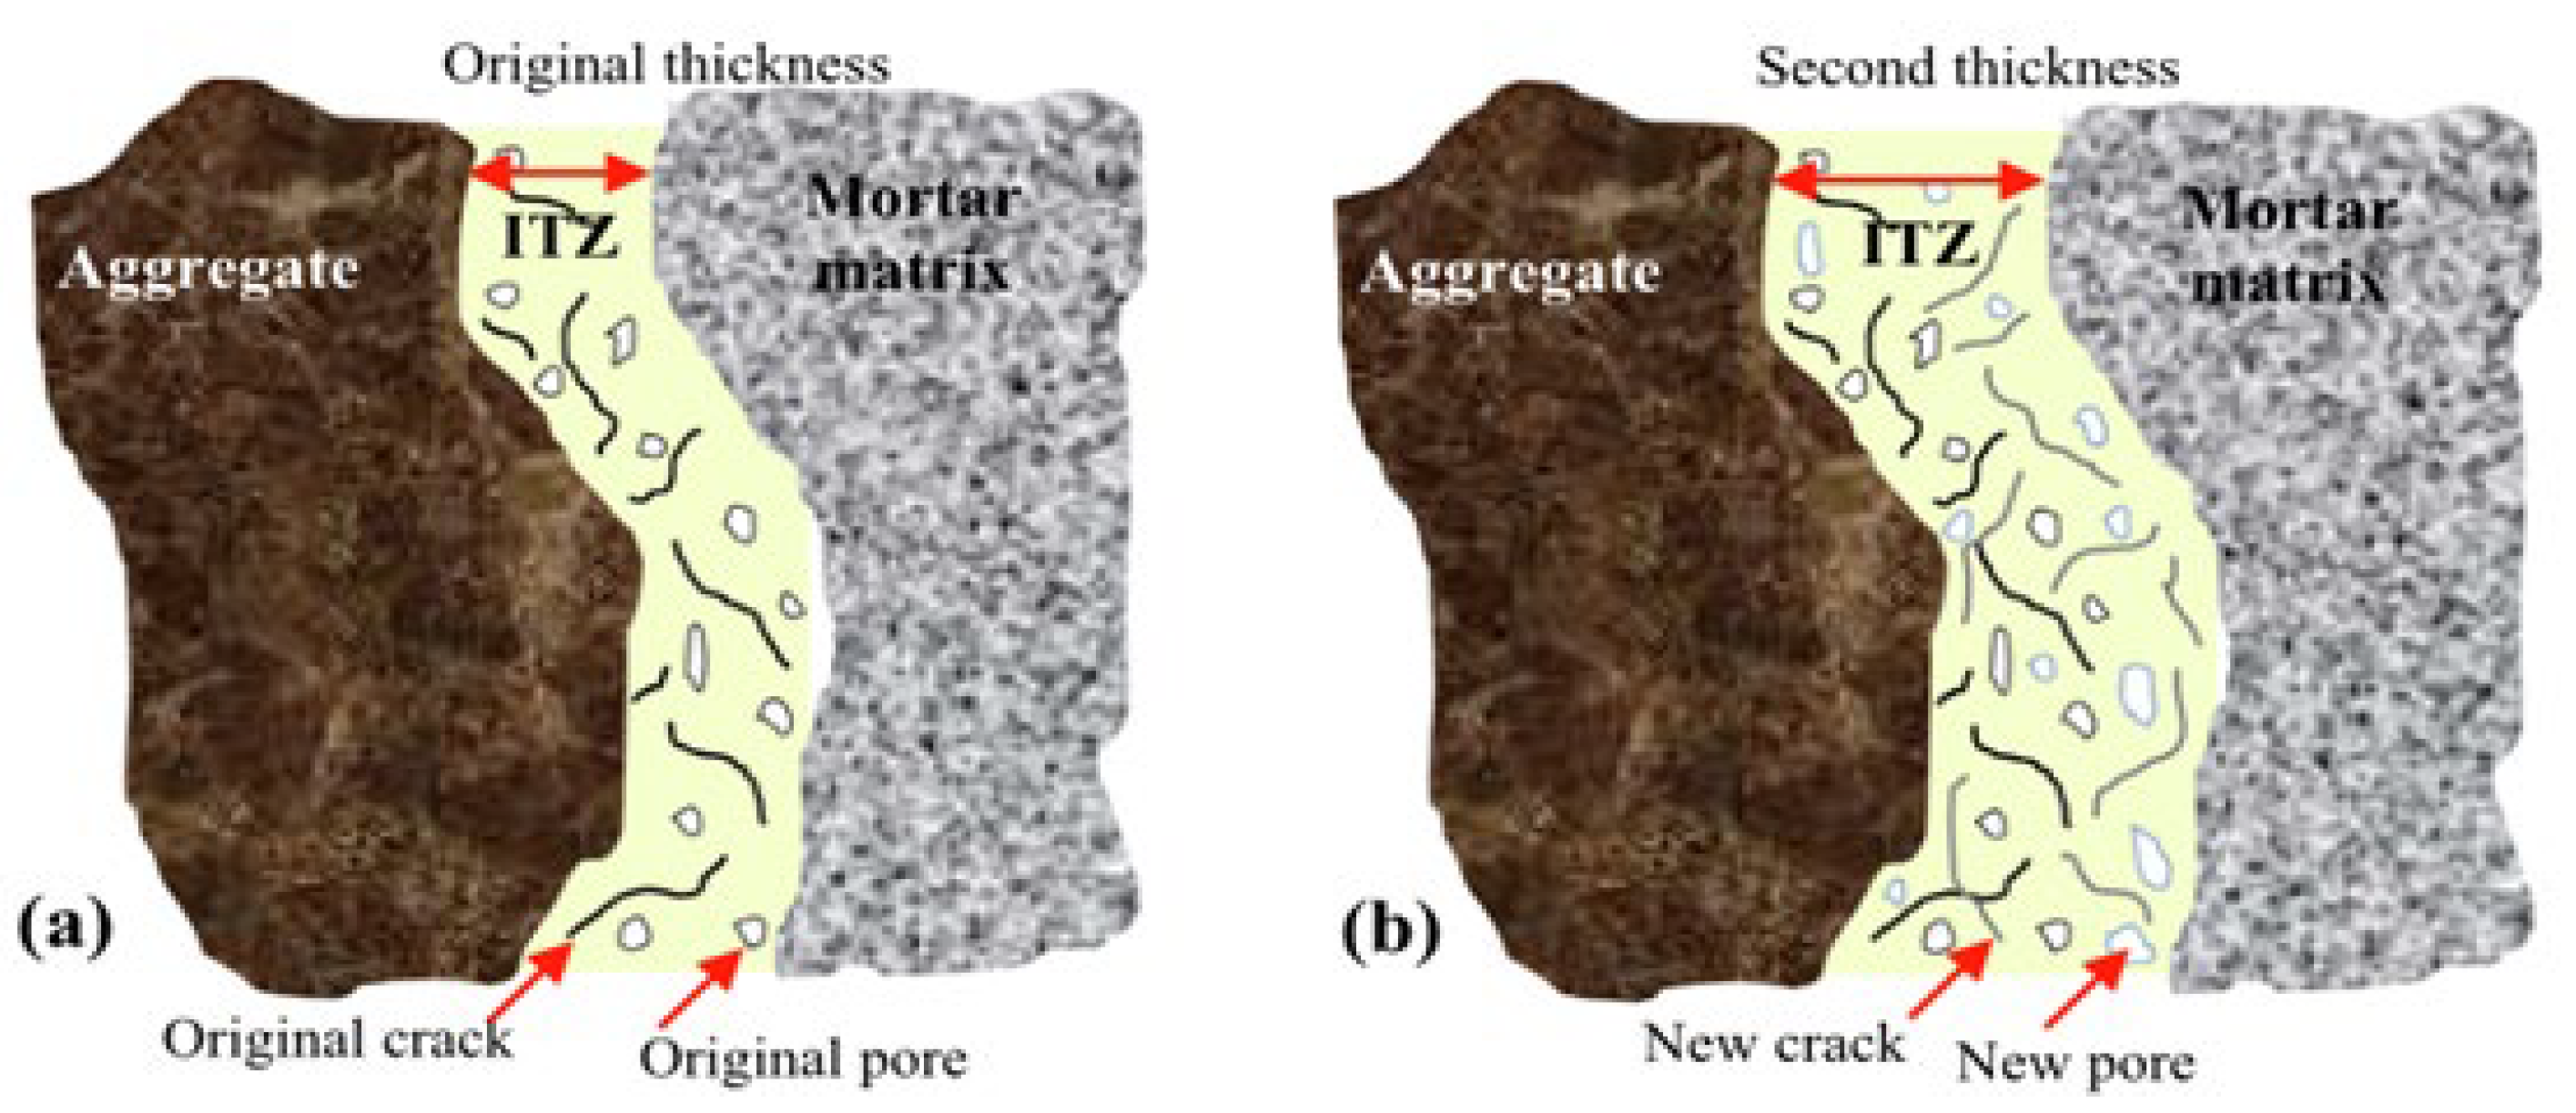
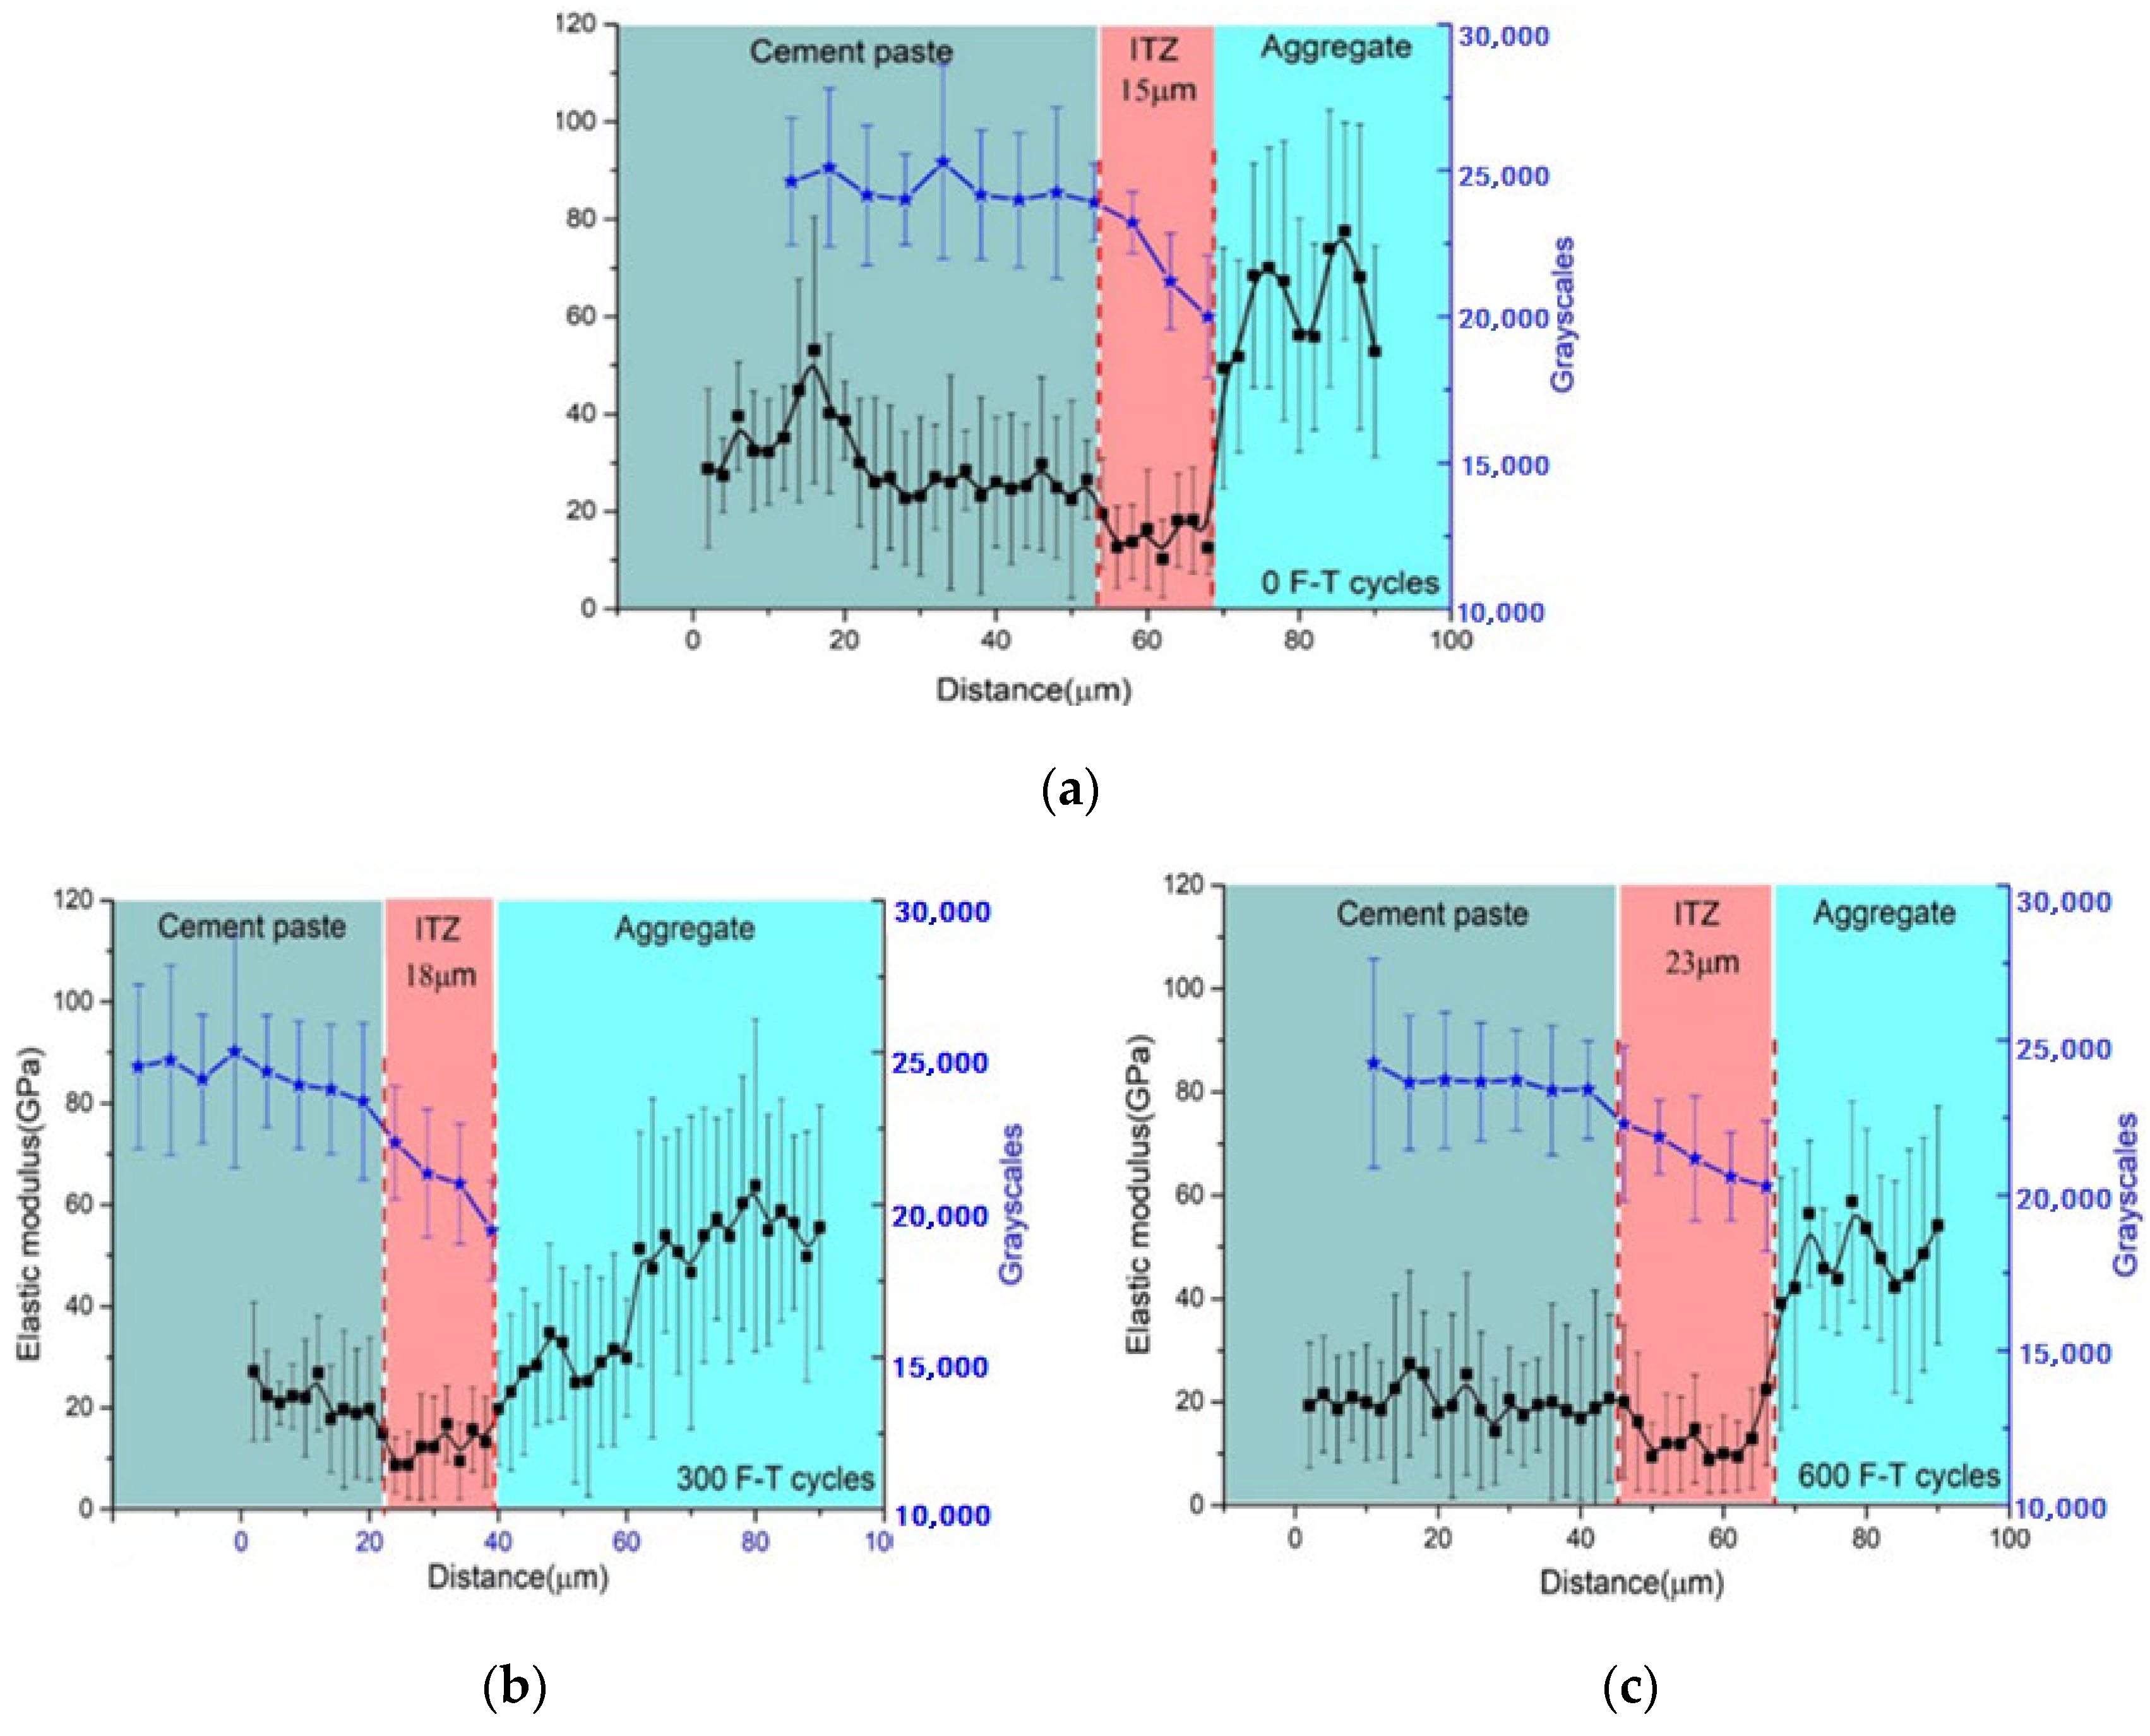
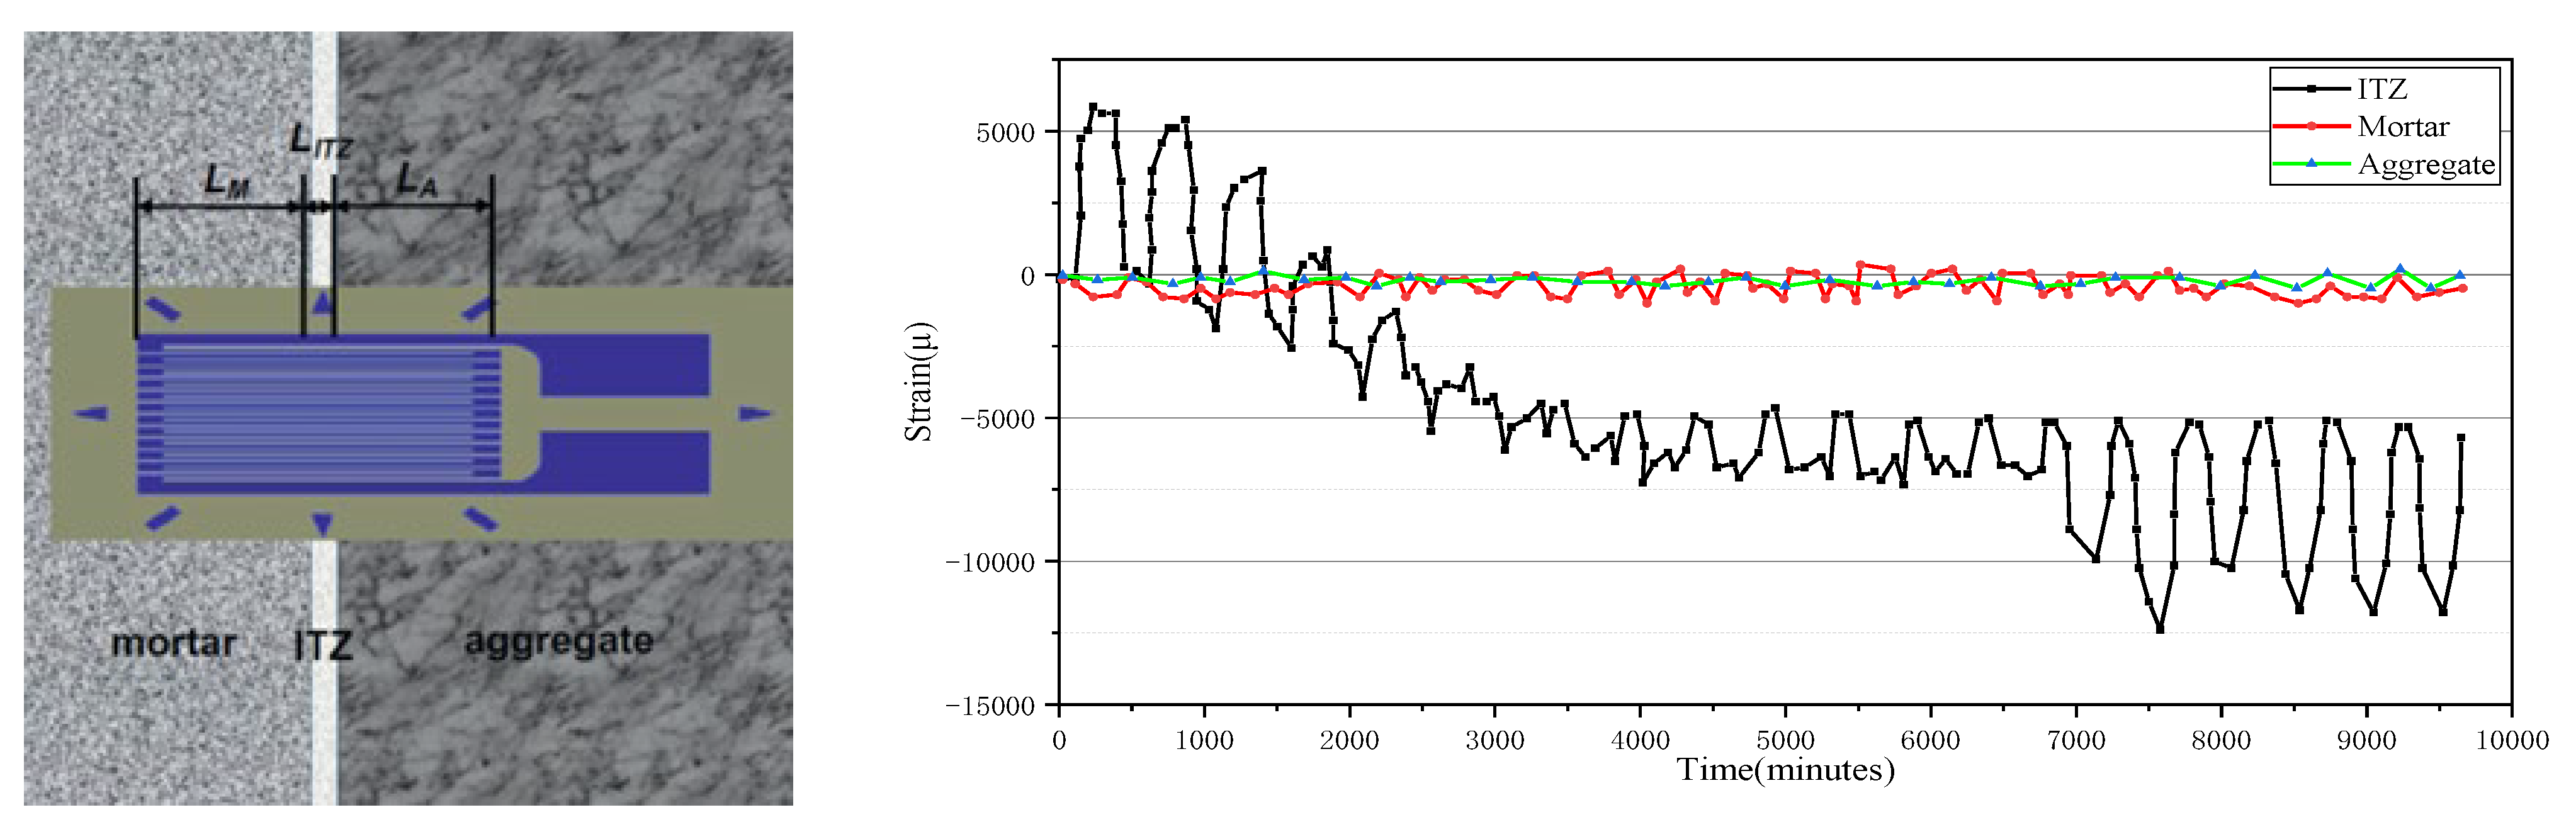
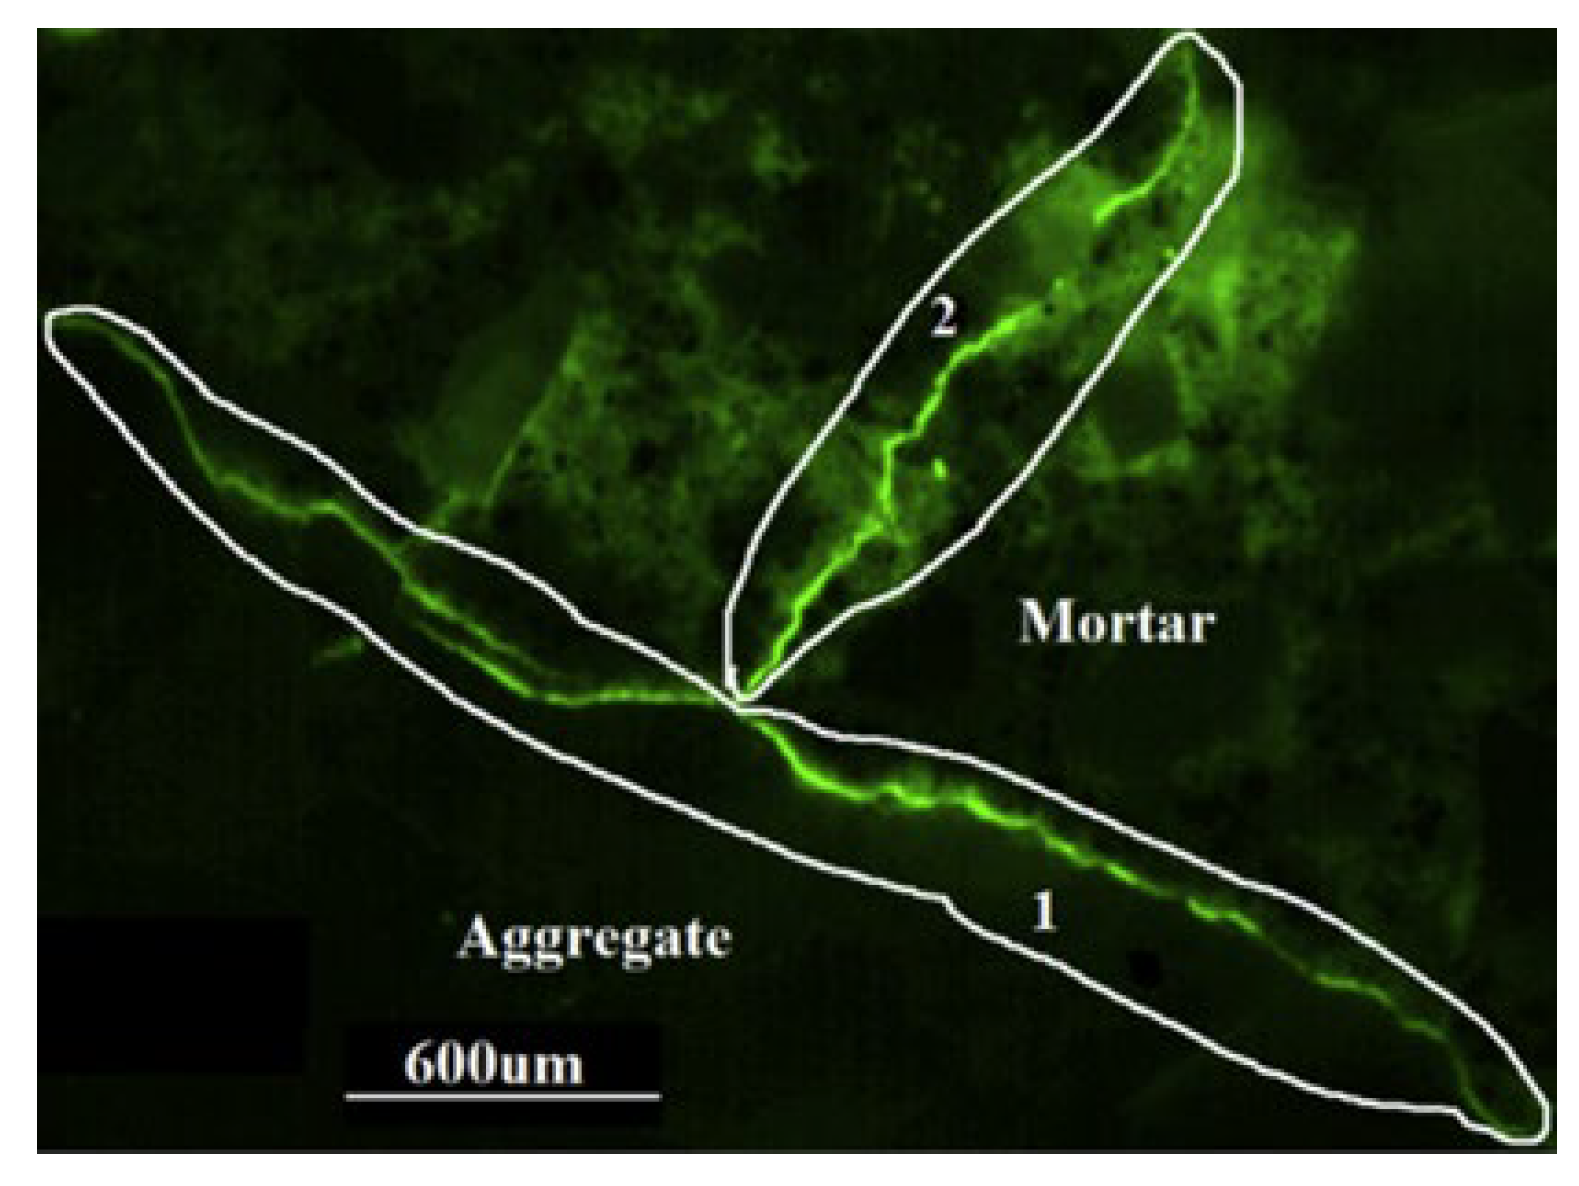
2.3.5. Interfacial Transition Zone

Concrete is a composite phase composed of different engineering materials, namely, aggregate, paste, and ITZ. Owing to the micro-zone bleeding effect in the formation process of concrete, the porosity of this area is high, which is the weak link in the concrete strength chain [148,149], and is usually the site of the beginning of pores and microcracks in concrete after F–T damage [150]. The microcracks in the ITZ can account for more than 70% of the total matrix microcracks [34], and can be used as a channel to make it easier for external solutions to invade the interior and accelerate the deterioration of concrete under the action of F–T [151,152]. In the initial state (Figure 16a), the ITZ produced many pores and microcracks because of its initial defects. In the process of F–T cycles, the ITZ produces many new microcracks (Figure 16b), microstructure deterioration, ITZ thickness increases, and strength decreases [153]. Qiao et al. [27] quantified the microcracks in concrete under different conditions of deicing salts-F–T erosion using an optical microscope (OM) and found that the ITZ is the main zone of microcracks.
Microhardness testing and nanoindentation technology are the main methods that are used to characterize the thickness of the ITZ. Yang et al. [140] found that after 0 cycles, 225 cycles, and 300 cycles, the ITZ thickness of concrete was 20 μm, 40 μm, and 50 μm, respectively, and the hardness was decreased significantly. After cycling, microcracks had first appeared around the aggregate [146]. Xie et al. [107] used nanoindentation to analyze the performance evolution of the ITZ after the F–T cycles. After 0 and 1500 cycles, the concrete ITZ thicknesses were 22 μm and 60 μm, respectively. Lyu et al. [116] explored the performance evolution of a concrete ITZ under chloride-F–T conditions. After 140 F–T cycles, the aggregate and mortar gradually separated, and the ITZ width increased from 42 to 76 μm. In a study [113], after 200 F–T cycles, the ITZ thickness of cement models 32.5, 42.5 and 52.5 increased by 25%, 20%, and 18%, respectively, which may be related to differences in the cement hydration process. As shown in Figure 17, the ITZ indentation modulus of shotcrete was 30% lower than that of cement slurry when using nanoindentation and CT technology. At 0–300 cycles and 300–600 cycles, the ITZ width increased by 20% and 27.7%, respectively. After 600 cycles, a portion of the aggregate was detached from the paste. The permeability of the ITZ was positively correlated with the number of F–T cycles [115,133,141].
Hao et al. [154] studied the performance of the new vs. old ITZ of recycled concrete under the conditions of chloride-F–T erosion and found that the old ITZ has higher porosity and more cracks after erosion, and the new transition zone mortar has a higher strength and a stronger corrosion resistance. Zou et al. [147] analyzed the ITZ porosity of silane-modified recycled concrete after F–T cycles using backscattering electron microscopy and found that the surface-modified concrete had the lowest ITZ porosity. The ITZ of concrete changed after adding steel fiber during the cycles, and the difference in thermal expansion between the steel fiber and matrix caused the surrounding ITZ to crack and produce micropores [155]. Pang et al. [156] explored the effects of different types of aggregates on the F–T resistance of a concrete ITZ. Using EDS and nanoindentation, it was found that the width of ITZ in NA, SSA, and CSA concrete was 42.6 μm, 37.6 μm, and 45 μm, respectively, and the Vickers hardness was 27.59, 31.65, and 43 respectively. After 60 cycles, the RDEM of NA, SSA, and CSA concrete were 80%, 52%, and 19%, respectively. Sicat et al. [157] examined the deformation behavior of the ITZ during F–T cycles by preparing artificial ITZ specimens, as shown in Figure 18. The results show that the mortars and aggregates are undeformed, while the deformation of the ITZ increases significantly during the cycles. The microscopic observation results reveal that the deformation behavior of the ITZ is closely related to the occurrence and development of microcracks. With the increase in the number of cycles, the proportion of pores in the ITZ increases gradually. The coalescence and expansion of pores increase the thickness of the ITZ. The F–T cycles will widen the overall thickness of the weak band ITZ, resulting in a decrease in the interfacial bonding performance between the aggregate and the cement paste. Therefore, the macroscopic mechanical properties of the concrete deteriorate [116].

3. Modeling for Concrete in F–T Environments

Different characterization indices can be obtained by testing the deterioration performance of F–T concrete. A damage evolution model of concrete under F–T cycles was established by quantifying these data. It plays a key role in evaluating the frost resistance and predicting the deterioration process of concrete [158].

3.1. Damage Model for RDEM

Mass loss, relative strength, and RDEM are common damage indices used when evaluating the degree of F–T damage of concrete. RDEM is the most common nondestructive real-time testing technique for analyzing the degree of internal damage of the coagulation [159]. Combined with the change in the RDEM and material damage theory, many scholars have established the damage evolution equation of concrete under F–T cycles (Table 2).
Theoretical equations that are related to the F–T damage model of concrete involve many types of material damage theories, such as the material mechanical fatigue equation, macroscopic phenomenological damage mechanics, and meso-statistical damage mechanics. The specific establishment process is not repeated in this study, but the above model inevitably has a certain scope of application in the process of establishment. Wang et al. [4,38] regarded concrete that was subjected to salt erosion and F–T cycles to be in different damage states and established a nonlinear superposition model of the double damage state; however, the model ignores the effect of salt solution concentration and needs to be tested separately in practical applications. The RDEM index is difficult to characterize for the spalling phenomenon of the surface after many cycles. Wang et al. [129] proposed a coupling model that considered the mass loss rate and RDEM. Nili et al. [160] believed that the deterioration of concrete under F–T conditions can be divided into two parts, and there is no apparent direction in the concrete deterioration in the initial stage. When the RDEM of concrete was 0.8, the concrete entered the development stage, and the internal damage of the concrete accumulated and it deteriorated rapidly; however, the model was only suitable for ordinary concrete with a w/c of 0.4–0.5. The applicability of these models is limited, and the correlation between different models is poor. At the same time, it is difficult to explain the performance of other types of concrete. In the future research, it is far from enough to take RDEM as the research object. We need to study the freeze–thaw damage model of concrete more comprehensively [158,159].

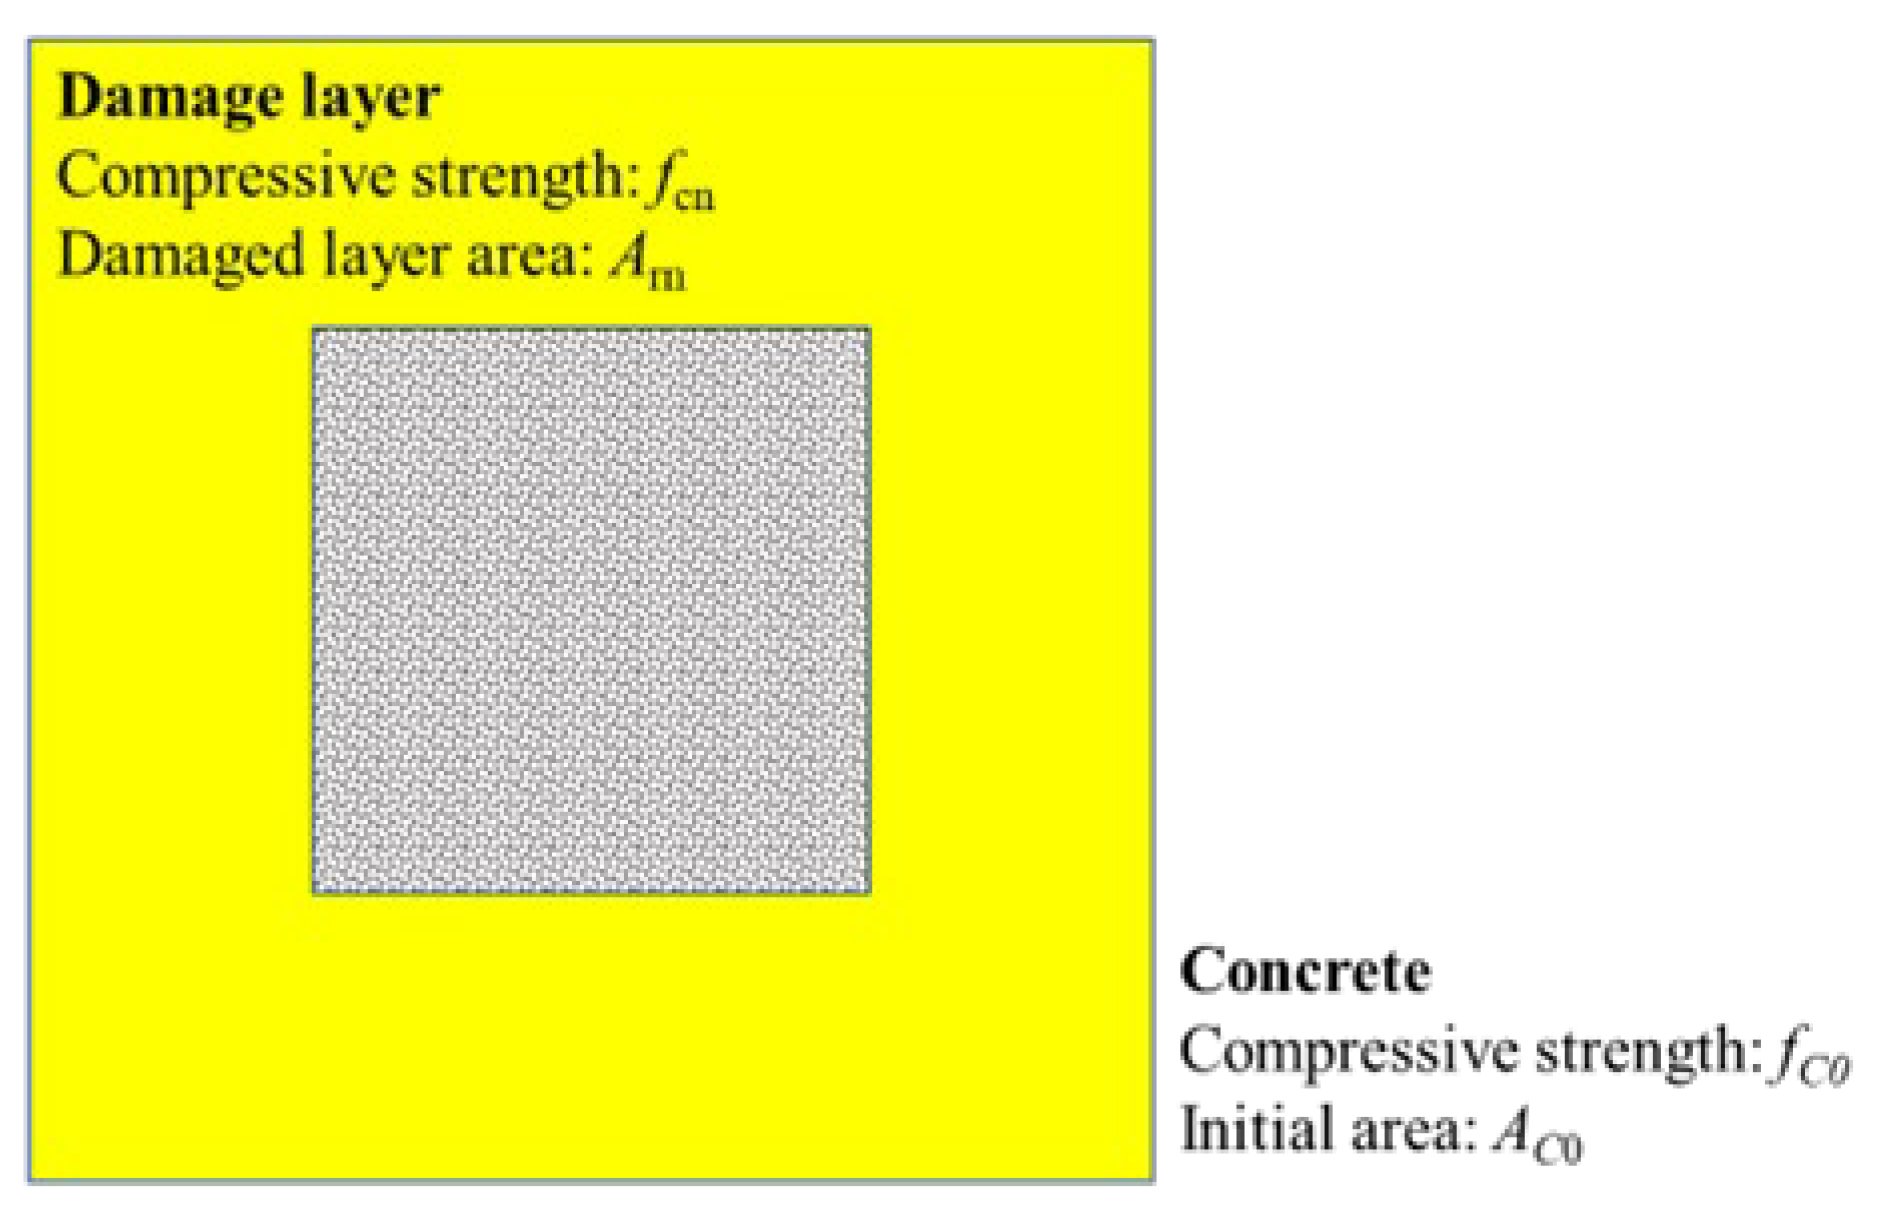
3.2. Damage Layer Thickness Model

Although the damage model that was based on the RDEM and mass loss has a good correlation with the experimental results, for practical engineering, the application of the above experimental methods is very limited. Based on the ultrasonic method that is commonly used in concrete engineering testing, Guan [161] proposed an F–T damage evaluation model and method for concrete with damage layer thickness, which is convenient for engineering applications and can accurately reflect the development of the concrete damage that is caused by F–T damage from the surface to the interior.
The damage-layer thickness model adopts the damage variable, Dh, which is based on the damage-layer thickness. The damage variable of the concrete damage layer is modified through the evolution of the damage layer area and the compressive strength during concrete F–T cycles, as illustrated in Figure 19 and Equations (10) and (11).
β = 1 ( f c n f c o A c n A r n A c o A r n )  
D n = 1 [ ( b 2 h d n β ) ( h 2 h d n β ) b h ]  
where β is the correction coefficient, fcn, and Acn are the compressive strength and cross-sectional area of concrete after cycles, respectively; fc0 and Ac0 are the compressive strength and cross-sectional area of concrete in the initial state, respectively; Arn is the area of concrete damage layer after F–T cycles; hdn is the thickness of the damage layer after F–T cycles; b and h are the width and height of the specimen interface, respectively.
When combined with the ultrasonic test of the concrete damage layer under F–T cycles, Guan [161,162] found that the thickness of the damage layer increases gradually with the increase in the influence of cycles on concrete. The T-evaluation result of the damage layer model was accurate.

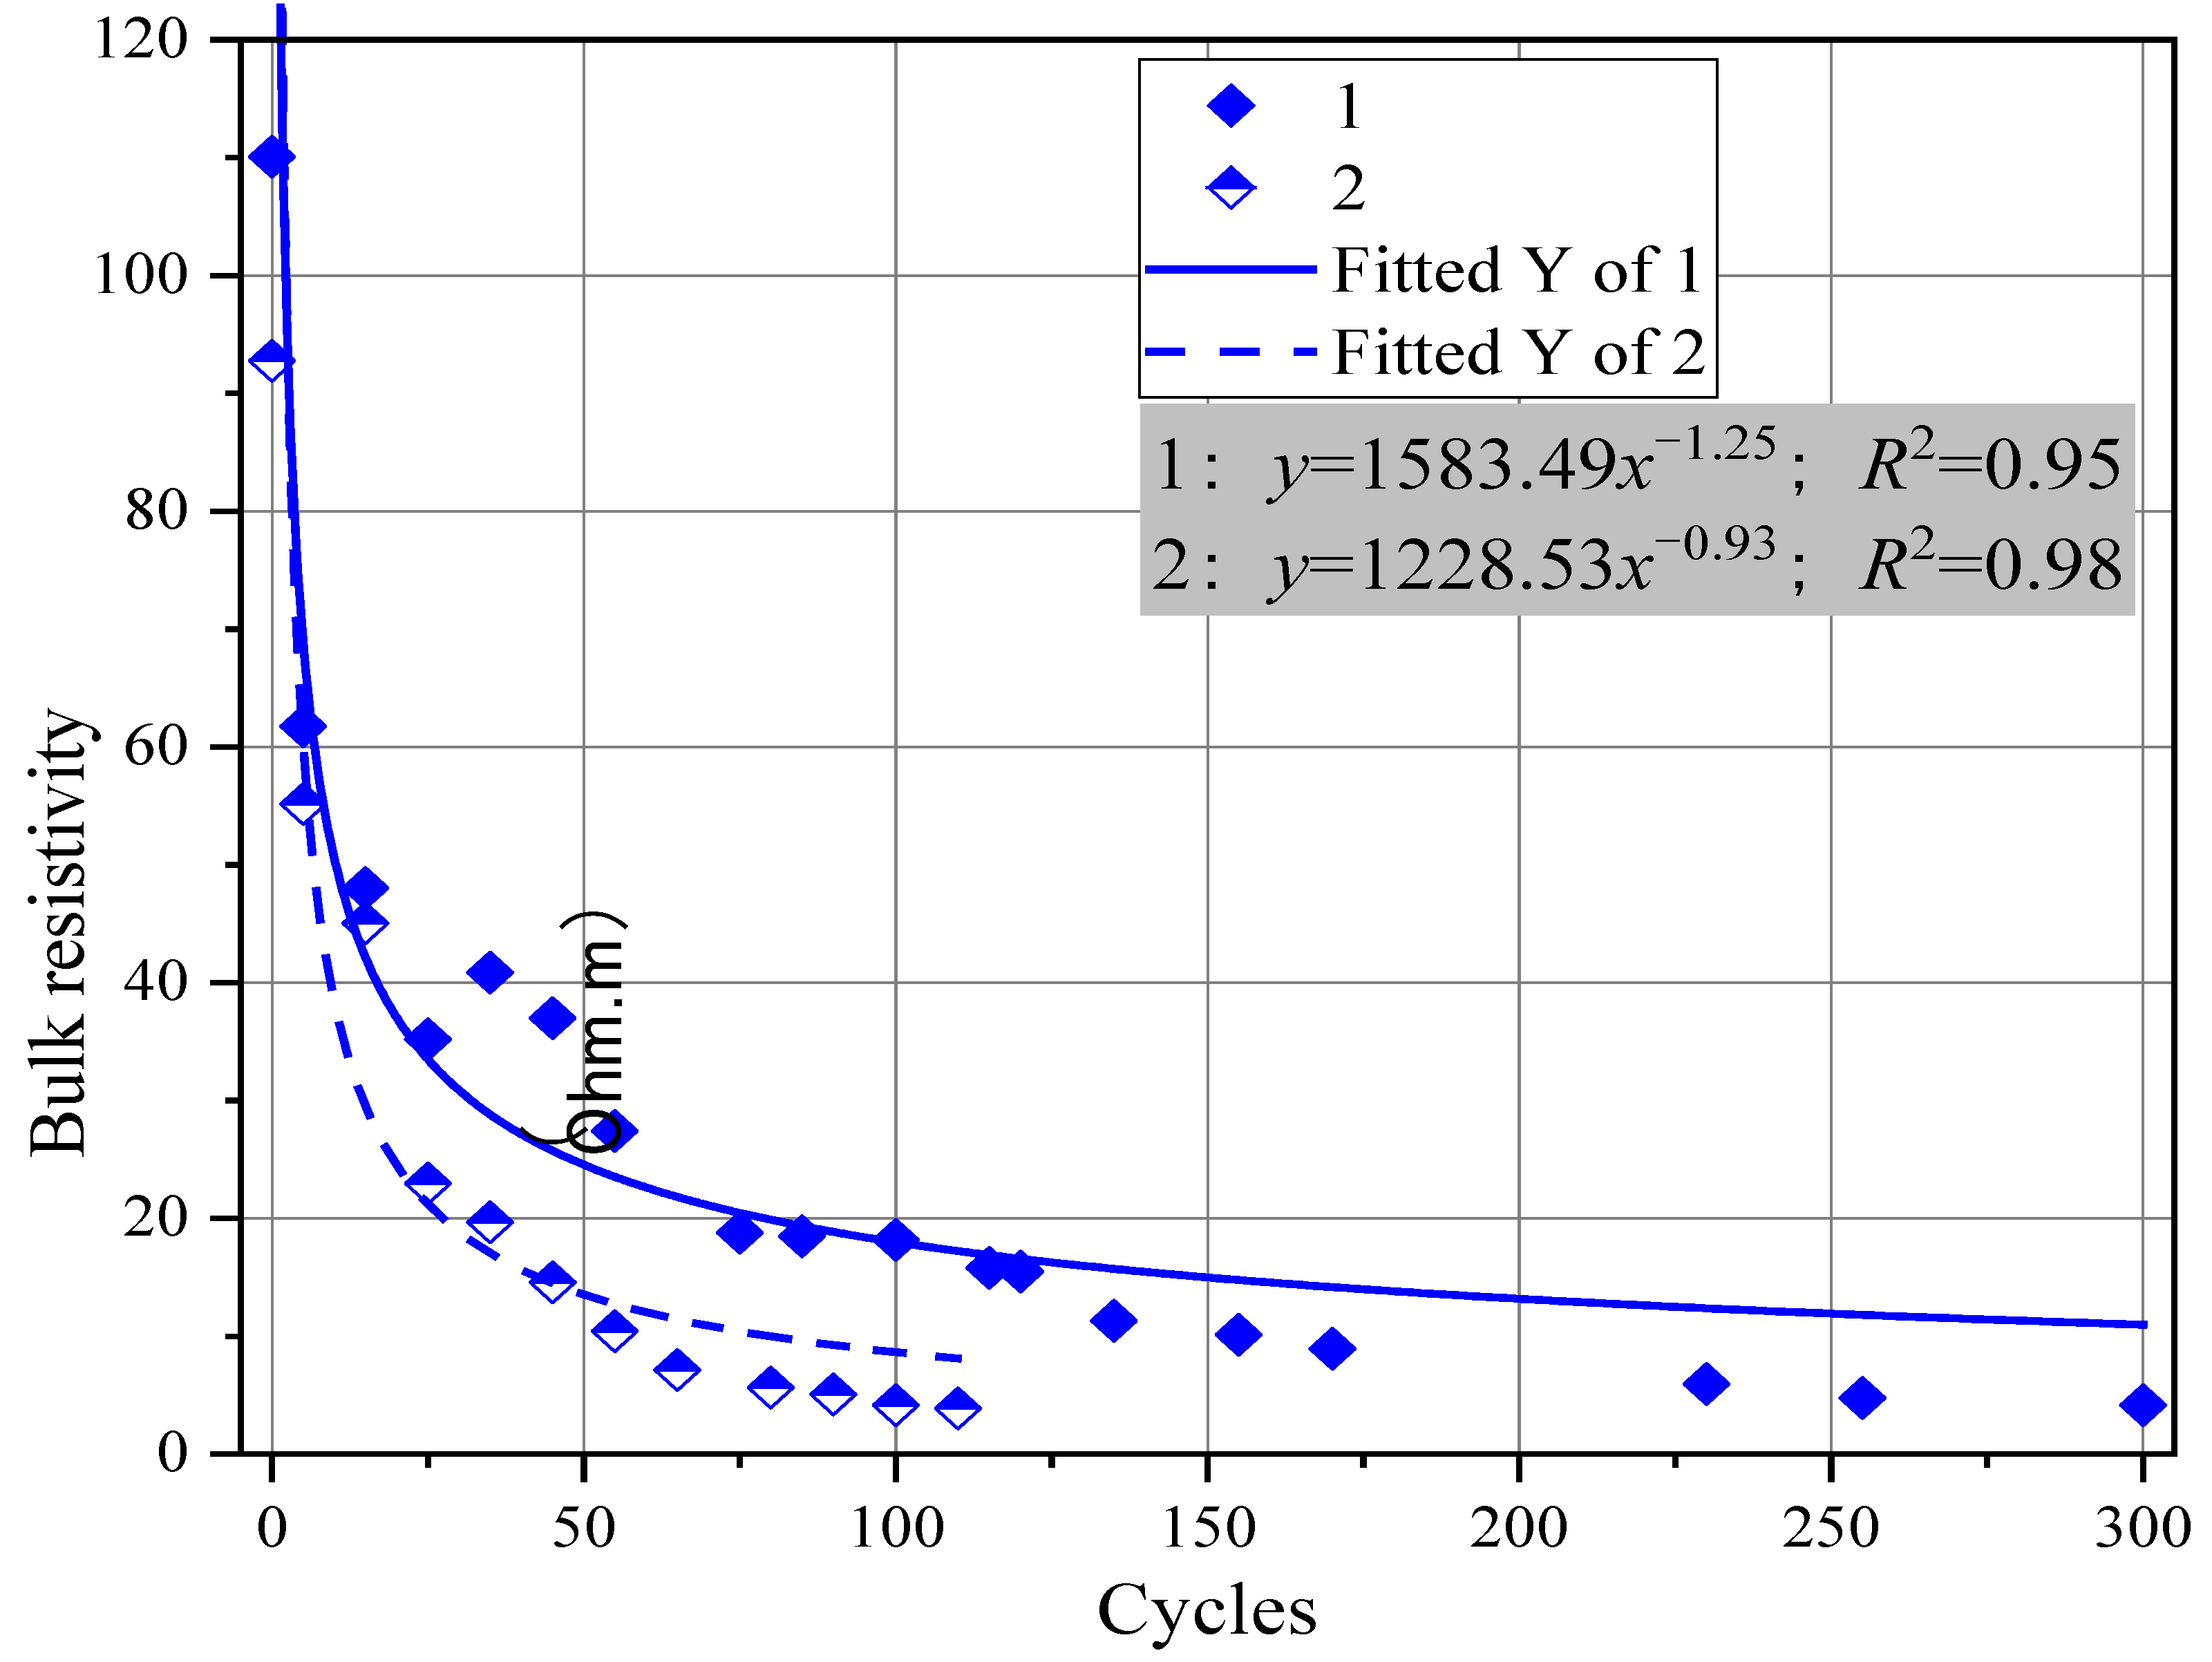
3.3. Damage Model for Bulk Resistivity

In the coupling environment of the salt solution and F–T cycles, the damage to the concrete that in caused by F–T is more rapid. Hosseinzadeh et al. [32] investigated the effect of different types of cementitious materials on the chloride-F–T resistance of concrete and found that the saturation and electrical conductivity of concrete were changed by the entry of solution, the bulk resistivity, and the number of cycles of concrete and these are attenuated in a power law. According to this changing trend, a fitting formula for the electrical resistivity of concrete was established to characterize the damage degree of the F–T cycles, as shown in Figure 20 and Equation (12).
D r = a n ( 0.54 ~ 1.04 )
where Dr is the damage rate that is characterized by the resistivity of concrete, n is the number of cycles, and a is a power-law fitting parameter that is related to the type of gel material. According to the power law fitting of the above bulk resistivity and number of cycles, the failure time of concrete in a salt-freezing environment can be effectively evaluated.
In addition to the above commonly used indicators, other macroscopic indexes are often used to characterize the damage evolution of concrete during F–T deterioration, such as acoustic emission (AE), various strength indexes, density, and so on. These models are basically empirical or semi-empirical models that are obtained directly on the basis of experiments (Table 3). Each model has its limitations, for example, the prediction of ultra-high-performance concrete (UHPC) by the mass loss model is inconsistent with the actual situation of concrete, and the strength index needs to carry out destructive tests on concrete. Although the above macroscopic index model is accurate for a certain types of concrete, it is not satisfactory for the damage prediction of other types of concrete when they are under the action of multiple factors [163,164]. In the future research, the damage model should pay more attention to the micro-damage of concrete and establish the exact damage model in turn.

3.4. Damage Model for Microstructure

The microstructure of the concrete material determines its macroscopic performance, and the deterioration and evolution of the microstructure, such as the pore structure and microcracks of concrete during F–T cycle damage, is the main mechanism of F–T damage. Several researchers have established damage evolution equations by studying the development of pore structures and concrete cracks.
Wang et al. [129] believed that the continuous deterioration of concrete pores at the micro level is an essential factor of F–T damage and they proposed a comprehensive growth coefficient of pore structure for the first time. The deterioration of concrete is characterized by the increment of different pore porosities and total porosities, and the evolution equation of the pore structure is established as shown in Equation (13). It was found to have a natural logarithmic relationship with the number of cycles. Finally, a microscopic F–T damage model (Equation (14)) was established by comprehensively considering the initial porosity and the w/c of the concrete. The model can connect macroscopic indexes, such as the mass damage rate and RDEM, with the deterioration of the internal pore structure, which makes the F–T damage more detailed.
C g p = P a n P a 0 P b n P b 0 P c n P c 0 P d n P d 0 ( P n P 0 ) 4  
D = C g p a 1 + A C + b A c 2 c A c + d e ( e 1 + A c + f A c + g ) e h A c  
where Cgp is the pore growth coefficient, Pan/Pa0, Pbn/Pb0, Pcn/Pc0, Pcn/Pc0, Pdn/Pd0, and Pn/P0 are micropores (<5 nm), small pores (5 nm < r < 20 nm), medium pores (20 nm < r < 100 nm), large pores (>100 nm), and the ratio of total porosity to initial value after n F–T cycles, respectively; Ac is the initial porosity; a, b, c, d, e, f, g, and h are fitting parameters.
Jin et al. [33] explored the distribution of pore size parameters of eight types of concrete and found that the changes in the total pore surface area, porosity, and average pore size were irregular; only the fractal dimension of the pore surface decreased after the F–T cycles. Therefore, the pore evolution law of concrete is analyzed using microdamage mechanics and the thermodynamic fractal theory, and therefore the fractal dimension of the pore surface can be obtained. A micro-scale F–T damage model was established, which can quantitatively compare the F–T damage of concrete under different mixed conditions and verify that there is an apparent inverse relationship between the model parameters and the durability coefficient, as shown in Equation (15).
w = 1 D s , n D s , m i n D s 0 D s , m i n  
w: according to the relative damage degree of concrete based on fractal dimension, there is no damage when it is walled at 0, and the maximum damage occurs when it is wicked at 1. Ds,n is the fractal dimension of pore surface after n F–T cycles, Dso is initial pore surface fractal dimension, and Ds,min is the fractal dimension and is the minimum, which is usually 2.
Sun et al. [125] measured the pore size distribution of diatomite concrete using MIP and NAM. The results showed that the pore structure, which was mainly smaller than 200 nm, deteriorated after the F–T cycles. The cumulative pore volume distribution that was between 2 nm and 350 μm was analyzed using a multifractal theory, and the multifractal F–T damage model of the diatomite concrete was established, as shown in Equations (16) and (17).
D q = l i m ε 0 log [ k ( q , ε ) ] log ( ε ) , q 1  
D 1 = l i m ε 0 i = 1 N ( ε ) p i ( ε ) log [ p i ( ε ) ] log ( ε ) , q = 1  
where Dq is other fractal dimensions except information dimension, D1 is the information dimension, ԑ is the equal interval length, k(q,ԑ) is the distribution function of multifractal theory, pi(ԑ) is the relative pore volume of each interval, and q is the moment order of cumulative pore size distribution (−10–10). The information dimension characterizes the uniformity of the pore size distribution; the larger the D1 is, then the more uniform the pore size is. It was found that when the concrete goes through the cycles, D1 generally increases by approximately 5%, which indicates that the F–T pressure causes the critical pores around the larger pores to be destroyed first. The inhomogeneity and connectivity of the concrete decreased, and the concrete began to deteriorate.
Zhang et al. [132] studied the change in the porosity of concrete with different w/c and that underwent under F–T, and the change in porosity that was measured by NMR can well characterize the deterioration of concrete, as shown in Equation (18). In this equation, D is the relative porosity change, pn is the porosity after n F–T cycles, and p0 is the initial porosity. The model calculation showed that the damage degree with w/c of 0.45a and 0.55 after 200 cycles was 0.9 and 1.2, respectively, which was similar to the trend of mass loss and RDEM. It was also found that the correlation between porosity damage, bending strength, and splitting tensile strength was higher than 0.95, as shown in Figure 21.
D = p n p 0 1 p 0  
Li et al. [170] iteratively calculated different void distributions and they proposed a meso-damage model of pore distribution under F–T, which assumes that the pores are continuous and cylindrical. The characteristic pore diameter of the concrete after n cycles can be analyzed by DSC and MIP, and iterative calculations are performed.
In the first step, the initial damage was zero, as shown in Equation (19):
D 0 c u m = D 0 * = 0  
In the second step, the cumulative damage was considered to consist of the initial damage in the first step and the damage after an F–T cycle, as shown in Equation (20):
D 1 c u m = π ( D 0 * + D 1 * ) 2 ( 1 + μ )  
By analogy, the damage after n cycles was accumulated by the damage caused by the previous n F–T cycles, such as Equation (21):
D F T = D n c u m = π i = 0 n D i * 2 ( 1 + μ )  
In Equations (19)–(21), n is the number of F–T cycles; D0cum, D1cum, and Dncum are the cumulative damages after 0, 1, and n cycles, respectively; D0*, D1*, and Dn* are damage parameters after 0, 1, and n cycles, respectively, and are related to the change in pore size and characteristic pore diameter; DF–T are the mesoscopic frost damage parameters; μ: is Poisson’s ratio. The characteristic pore diameter of concrete increases continuously under F–T cycles. The necessary and sufficient condition for undamaged concrete is that the characteristic pore diameter of the concrete is less than the critical aperture, and when the characteristic pore diameter is larger than the critical pore diameter, then the concrete is damaged.
Li et al. [20] believed that the damage of concrete under F–T cycles is caused by a combination of external spalling and internal pore deterioration, and the effect of cycles on internal pores can be obtained according to the change in porosity, as shown in Equation (22). The mass-loss rate can characterize the effect of external spalling, as shown in Equation (23):
Δ p n = 0.017 n  
D m ( n ) = 4.06 × 10 4 n 2.33 100  
According to the synthesis of meso-mechanics, the macroscopic and microscopic cross-scale damage model under the condition of chloride-F–T of cement mortar was established, as shown in Equation (24). The maximum error between the model and the actual situation was 3.6%, indicating that the fitting result was excellent.
D ( n ) = [ 1 D m ( n ) ] ( 1 Δ p n ) 1 + 0.017 α n  
where D(n) is a parameter of a macro- and micro-F–T damage model, Δpn is the porosity increment, n is the number of cycles, Dm(n) is the macroscopic damage that is characterized by mass loss rate, and α is the fitting parameter related to Poisson’s ratio μ of concrete (Equation (25)).
α = ( 13 15 μ ) ( 1 μ ) 14 10 μ  
Li et al. [34] obtained quantitative data on concrete microcrack evolution during F–T cycles based on digital image processing (DIP) and a vacuum epoxy resin impregnation technique. It was found that the area density and length density of matrix microcracks are directly proportional to the number of cycles, and there is a good correlation between the microcrack parameters and the macroscopic properties of concrete. The empirical formula between the evolution of microcracks and the deterioration of the compressive strength of concrete during F–T cycles is obtained, as shown in Equation (26).
α D c = 625.93 x 2 100.48 x + 1.02  
where Dc is the relative compressive strength of concrete, and x is the microcrack area density (%).
The deterioration process of concrete under F–T conditions is a cumulative damage process that is in accordance with irreversible thermodynamics, and the change in its macroscopic performance is the result of the continuous deterioration of the microstructure. The pore structure of concrete changes when it incurs the processes of damage. Micropores gradually expanded and developed into macroscopic cracks. Few studies have been conducted on the microstructure damage model, mainly focusing on the change in porosity and microcrack parameters. In recent years, the fractal theory has revealed that the meso-damage of concrete does not lie in the change in its porosity, but the change in its pore size distribution is key to the deterioration of concrete performance [171,172].
From the above process of establishing the F–T damage model, based on various indexes, it can be seen that the overall trend of the establishment of the damage model shows a trend from experience to theory, from macro to micro index, and from single index to comprehensive index. The early F–T damage model was mainly based on macroscopic indices such as the RDEM and compressive strength. In recent years, damage mechanics and fractal theory have become prominent subjects in concrete F–T research [153,173]. Many scholars have established concrete damage models based on the damage mechanics theory and fractal theory, and the test index has gradually turned to micro-indicators. Different testing methods have different applicable conditions; therefore, a variety of testing methods can be combined to overcome the limitations of each testing method and accurately predict the F–T deterioration process of concrete.

4. Summary

The damage mechanism and modeling of concrete under the F–T cycle are key issues in durability research. This paper reviews the recent progress in the study of F–T damage in concrete, focusing on the damage mechanism and modeling, and summarizes the theoretical model of F–T damage for testing microstructure evolution. Based on this review, the main conclusions are as follows:
(1)
From the concrete F–T deterioration theory, it can be revealed that the water phase transition during the F–T cycles is the main cause of concrete F–T damage;
(2)
Under the condition of a salt-freezing coupling environment, the F–T damage of concrete is accelerated by salt crystallization expansion and salt solution erosion. The effects of various salt solutions on concrete F–T cycle damage are different because of the inconsistent effects of salt solutions on the pores and hydration products;
(3)
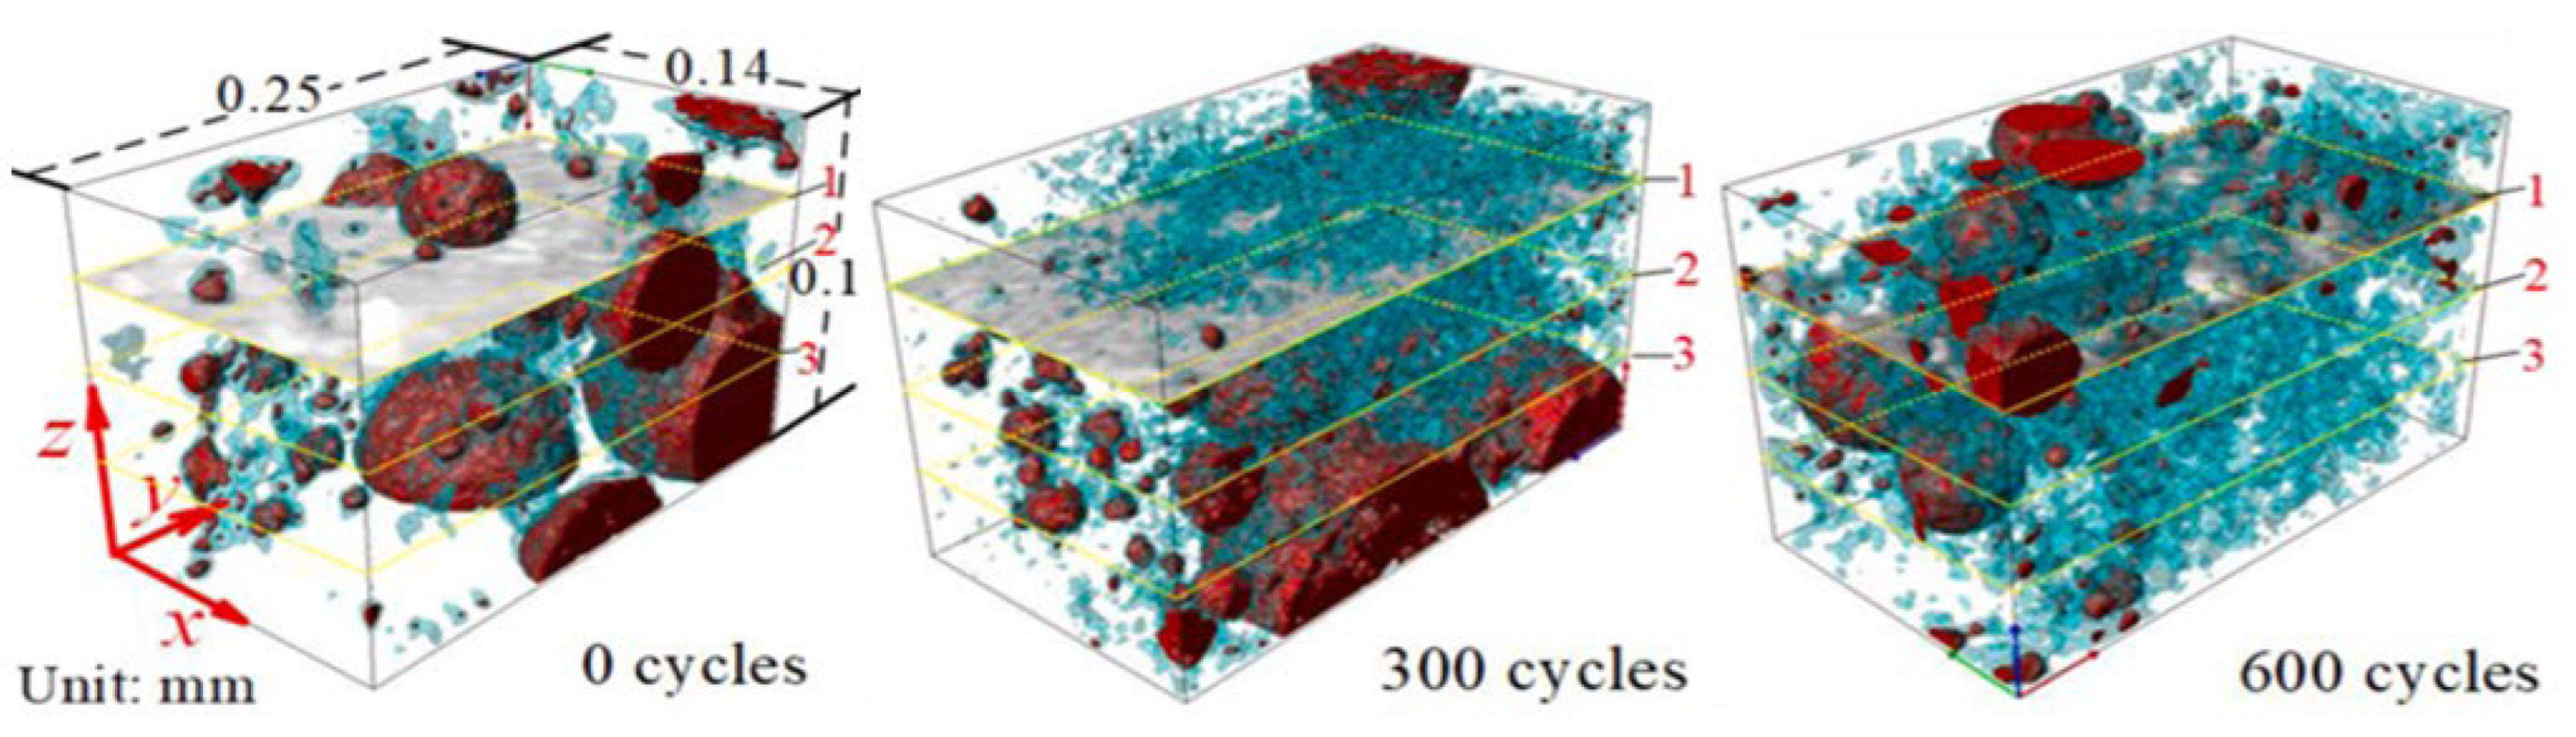
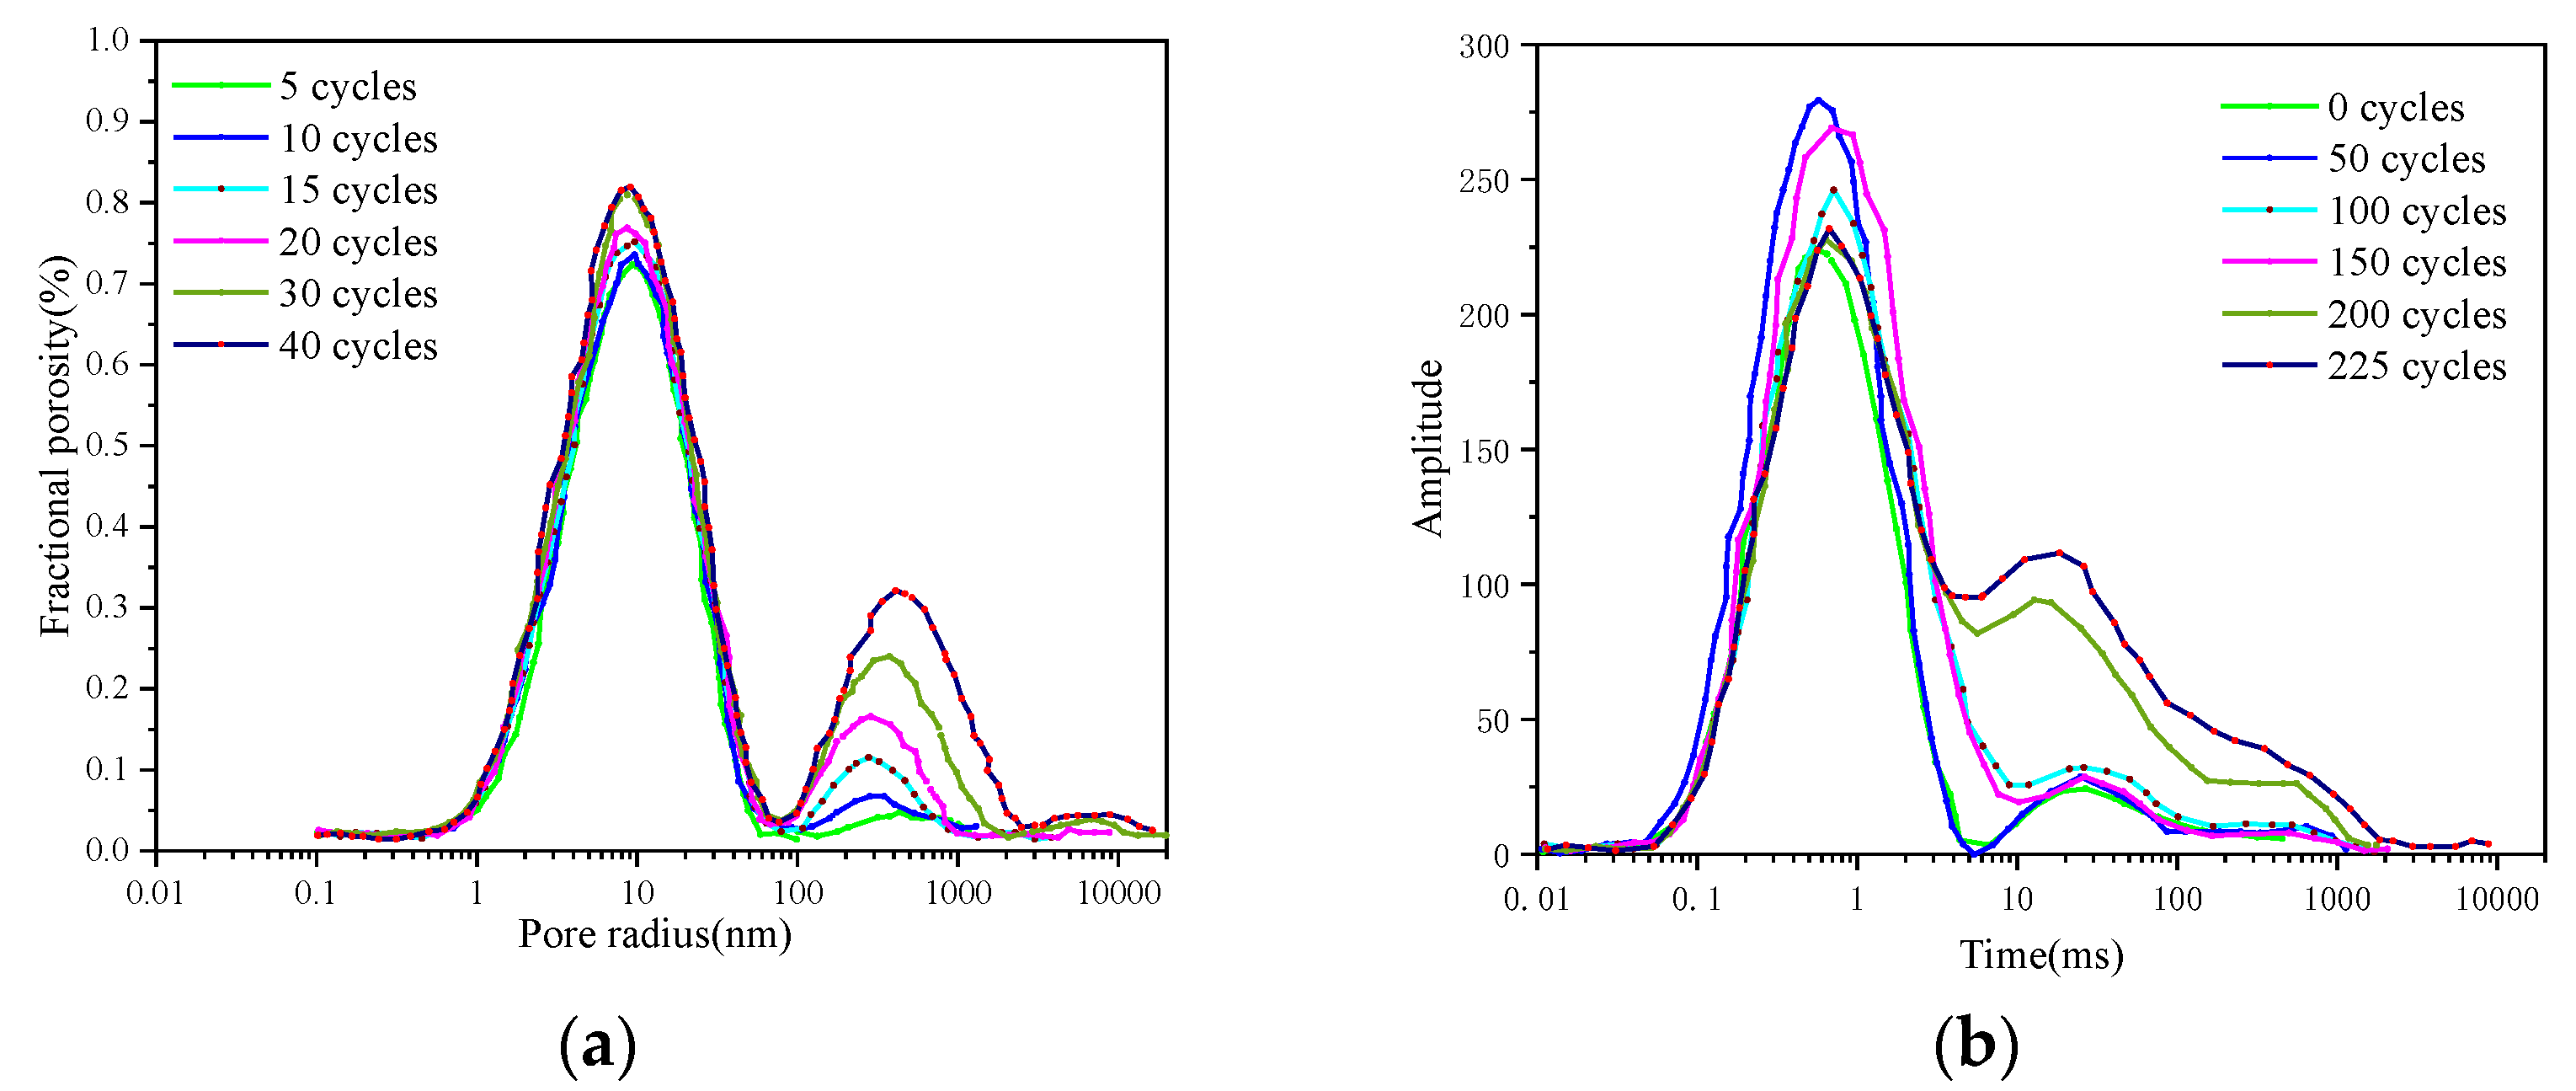
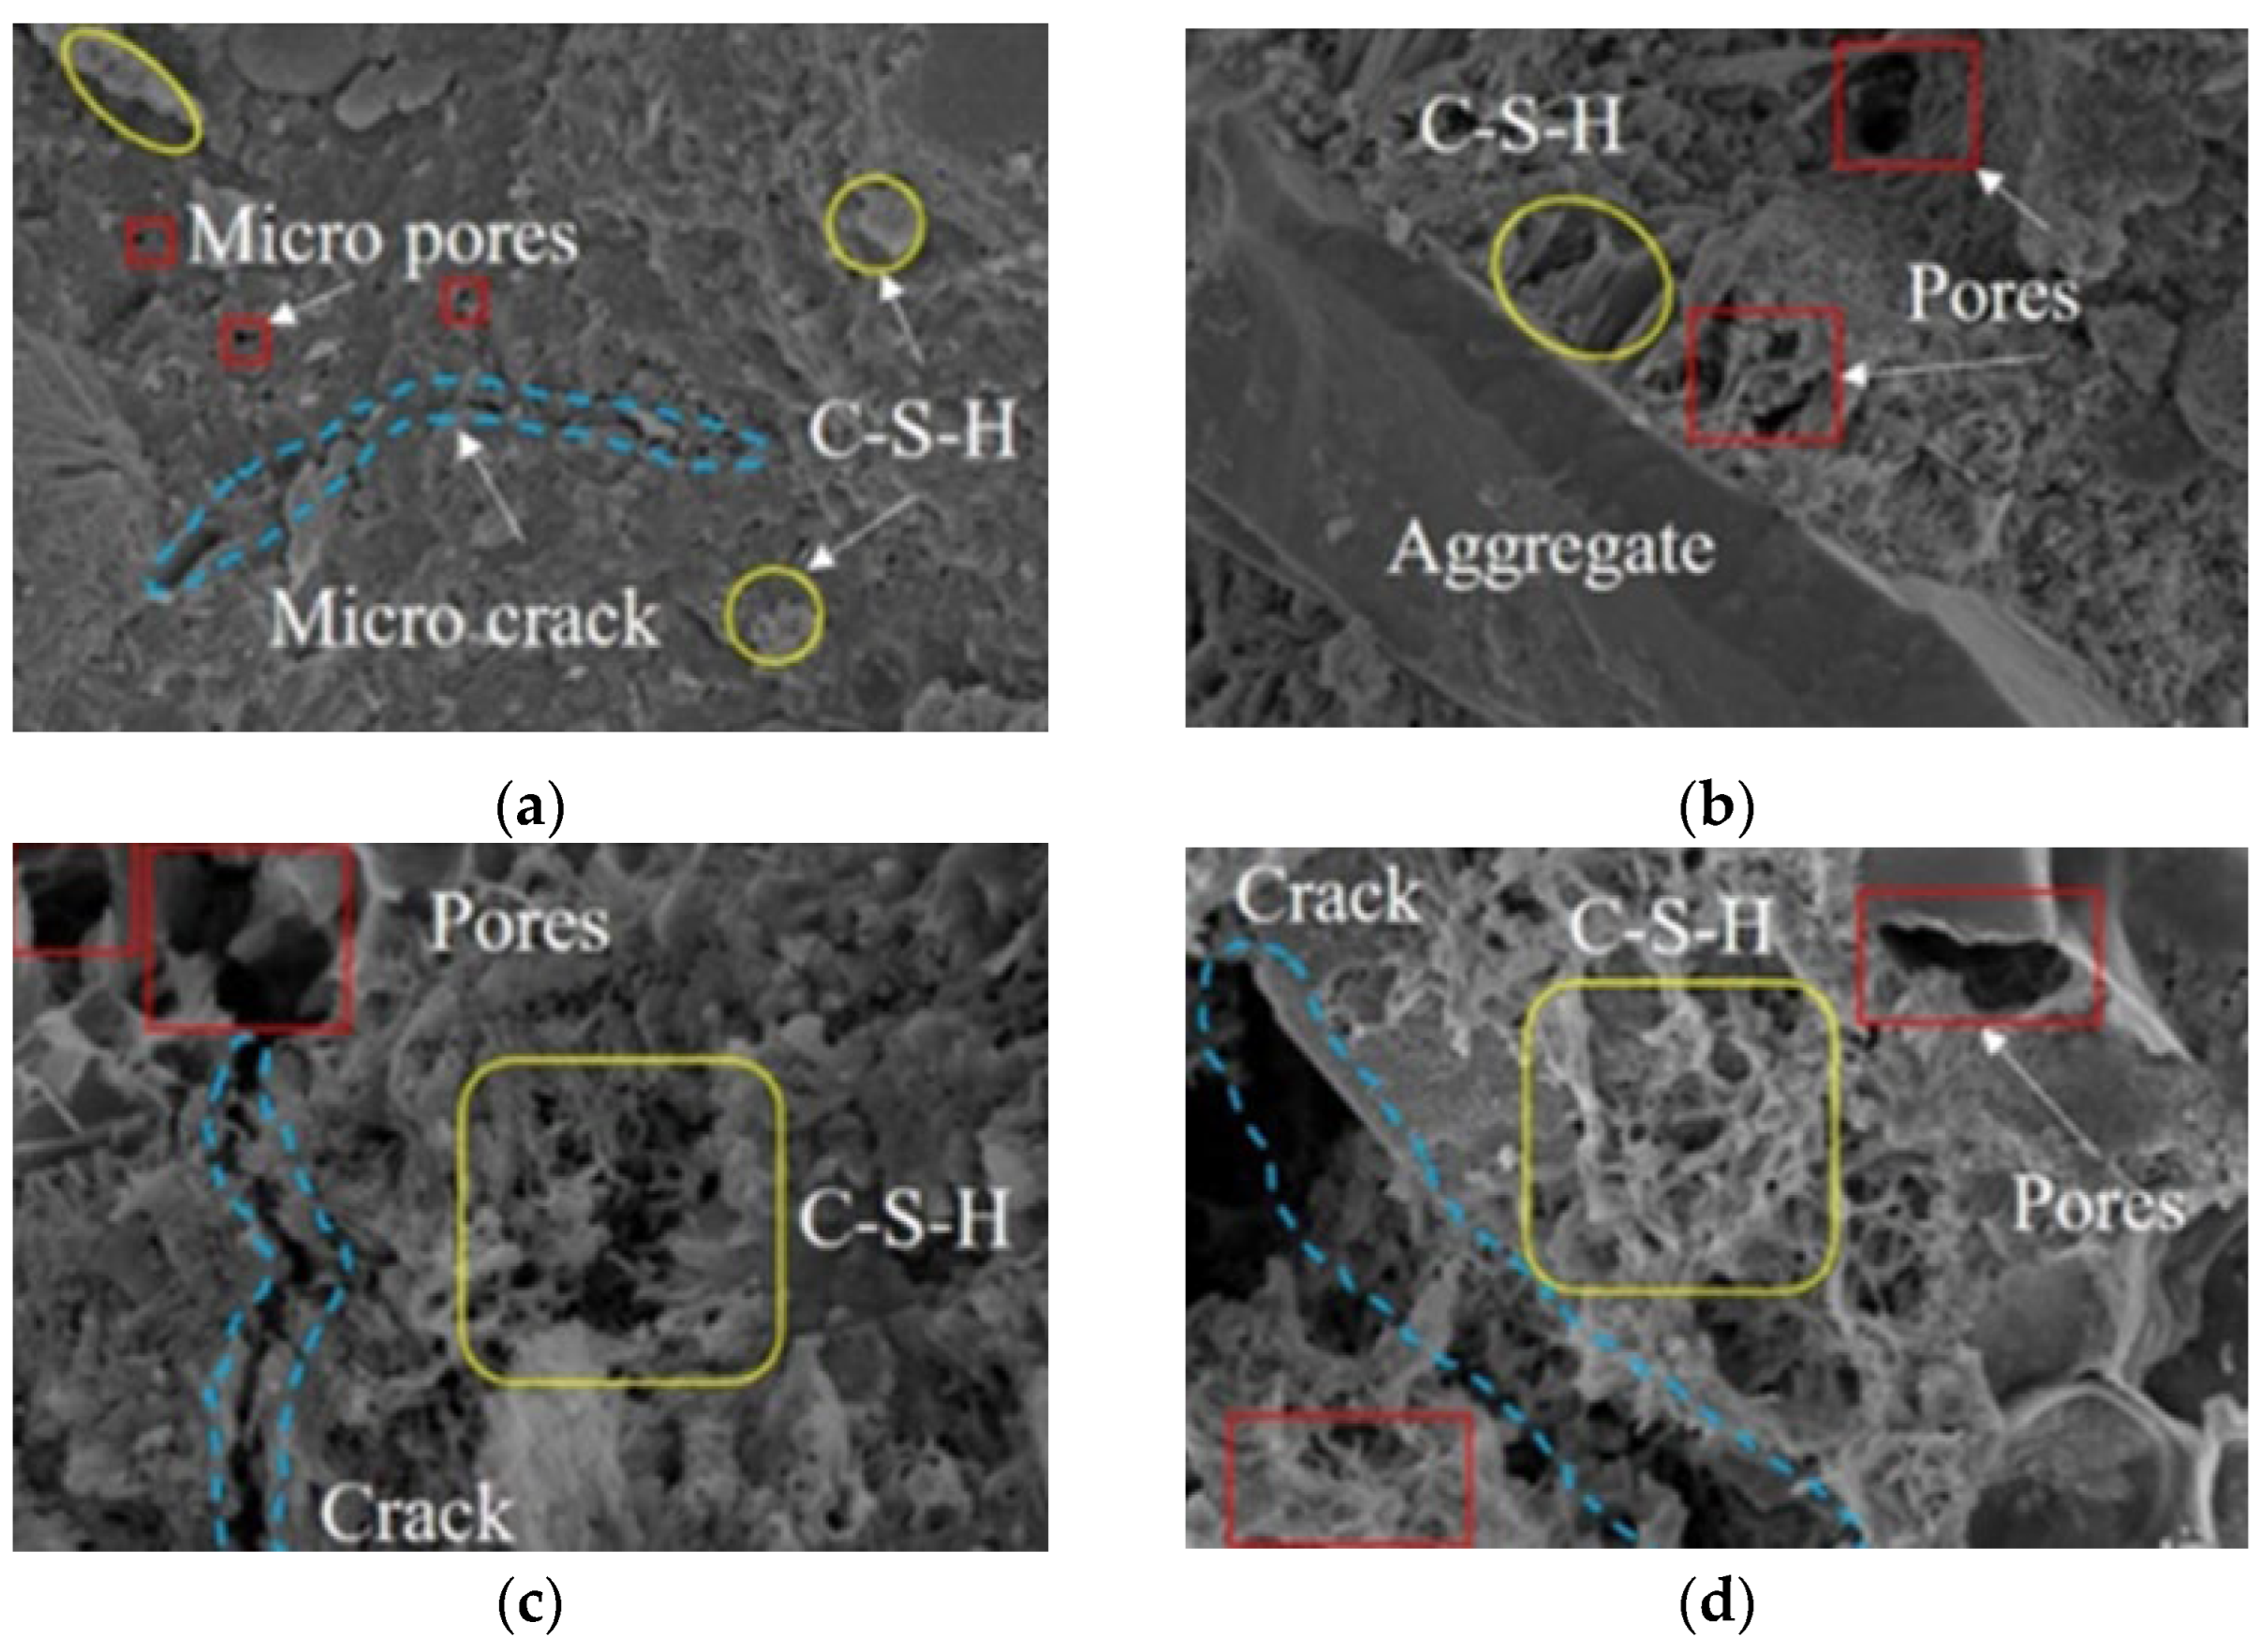
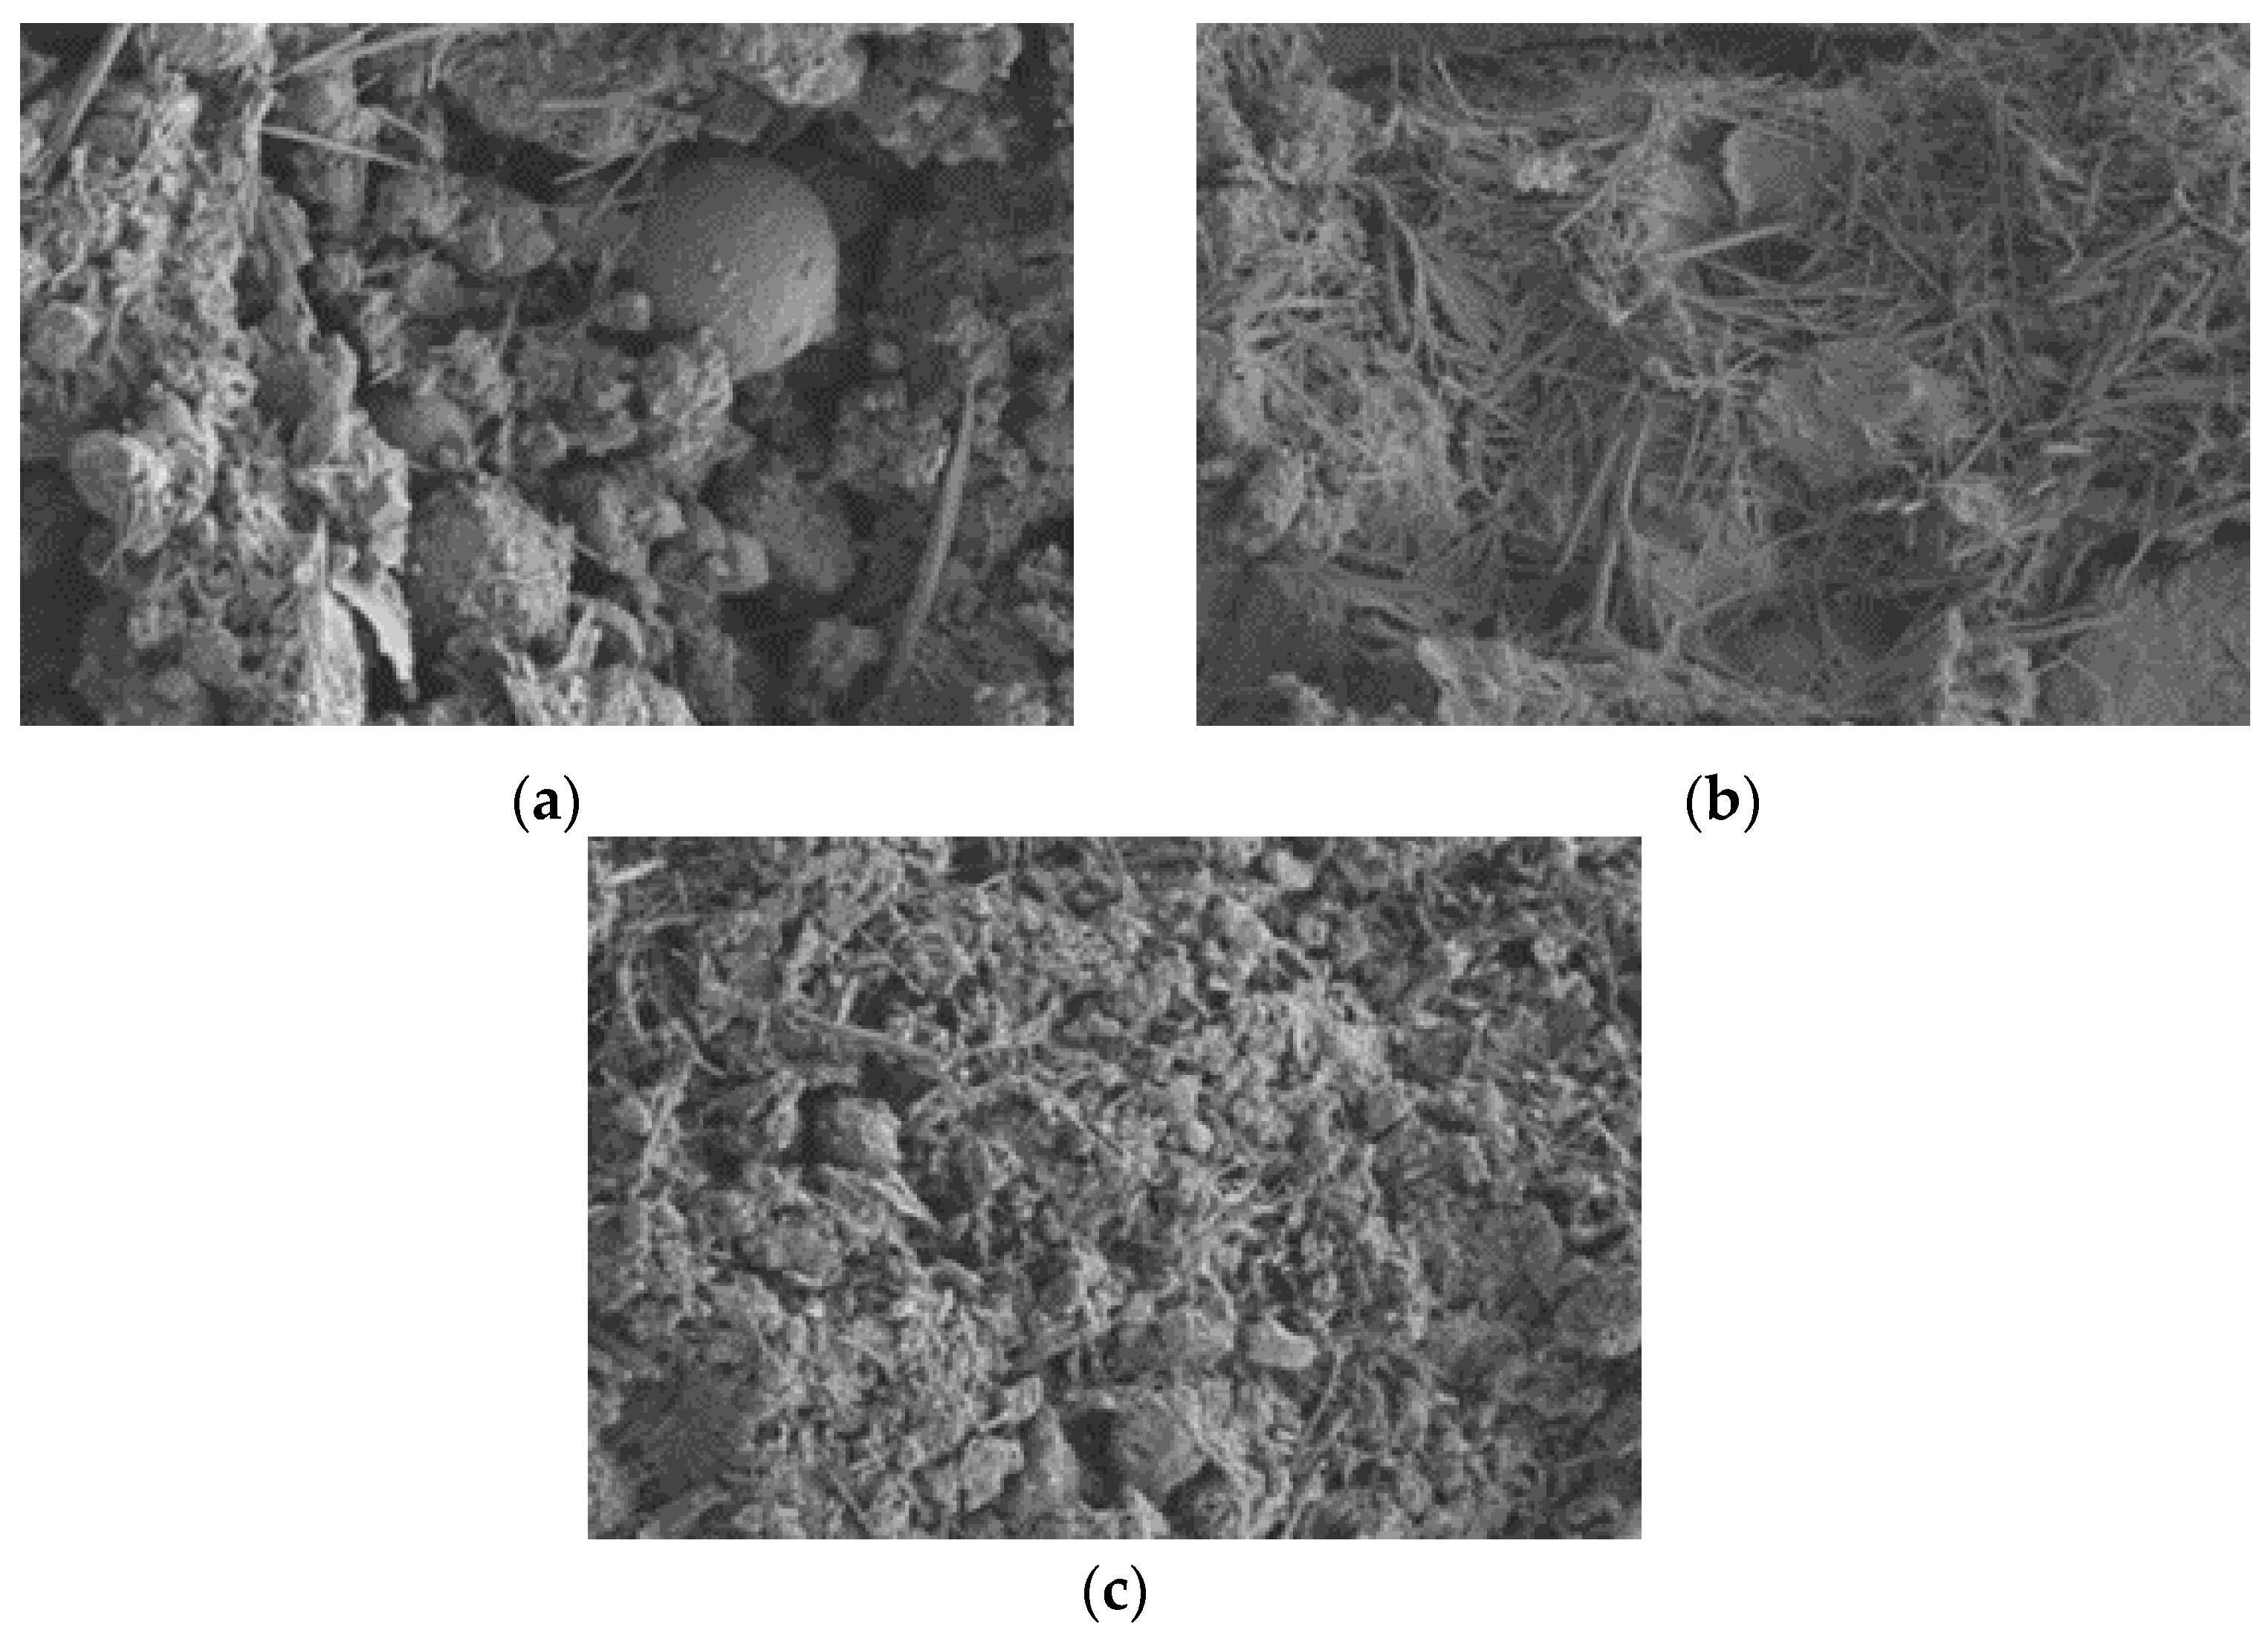
During the F–T cycles, the deterioration of the concrete microstructure is a synthetic result. The microstructure test results show that the porosity increases, the microcracks expand, and the ITZ widens during the F–T cycles. The loss of hydration products and salt crystal expansion during salt freezing was determined by a phase analysis;
(4)
The damage model for the concrete microstructure in the F–T cycle essentially reveals the damage mechanism, and the deterioration model for the pore structure and the microcrack growth model were established to reflect the F–T damage process.

5. Recommendations for Future Research

(1)
The evolution of pore damage has always been the focus of the analysis of the concrete F–T cycle mechanism. However, the applicable conditions for different mechanisms are diverse, and the theoretical model of unified coordination among pore structure damage, water-phase transformation, matrix deformation, and damage variables need to be further explored.
(2)
Pore structure degradation and microcrack growth have been used to model F–T damage; however, the influence of erosion effects on hydration product components and the deterioration of the ITZ are not involved in the F–T damage model, and the response of the composition index and ITZ parameters in the damage model is novel and creative. Further research should be conducted in this area.
(3)
There are many detection techniques used to establish F–T damage models, but some are superficial for characterizing the F–T damage of concrete. In the wake of developments in science and technology, the emergence of advanced detection methods, such as acoustic emission and optical fiber monitoring, has provided a new field of vision for the study of concrete F–T damage. It is necessary to carry out related research to further understand freeze–thaw fatigue damage.

Author Contributions

Conceptualization, J.G., Y.X. and W.J.; methodology, W.S., Y.X., W.L. and W.J.; validation, J.G., Y.X., W.S., W.L. and W.J.; formal analysis, W.S., Y.X. and W.L.; investigation, W.S. and Y.X.; resources, J.G., Y.X. and W.J.; data curation, W.S., W.L. and Y.X.; writing—original draft preparation, W.S., Y.X. and W.L.; writing—review and editing, J.G., W.S. and Y.X.; visualization, W.S., Y.X. and W.L.; supervision, J.G. and W.J.; project administration, J.G., W.S. and Y.X.; funding acquisition, J.G. All authors have read and agreed to the published version of the manuscript.

Funding

This research was funded by National Natural Science Foundation of China (U2040224, 52130901).

Institutional Review Board Statement

Not applicable.

Informed Consent Statement

Not applicable.

Data Availability Statement

Not applicable.

Conflicts of Interest

The authors declare no conflict of interest.

References

  1. Mehta, P.K. Concrete durability-fifty years progress. In Proceedings of the 2nd International Conference on Concrete Durability, Montreal, QC, Canada, 1 September 1991; p. 132. [Google Scholar]
  2. Wenchen, M. Simulate Initiation and Formation of Cracks and Potholes. Master’s Thesis, Northeastern University, Boston, MA, USA, 2016. [Google Scholar]
  3. Qiu, J.S.; Zhou, Y.X.; Vatin, N.I.; Guan, X.; Sultanov, S.; Khemarak, K. Damage constitutive model of coal gangue concrete under freeze–thaw cycles. Constr. Build. Mater. 2020, 264, 120720. [Google Scholar] [CrossRef]
  4. Wang, B.; Wang, F.; Wang, Q. Damage constitutive models of concrete under the coupling action of freeze–thaw cycles and load based on Lemaitre assumption. Constr. Build. Mater. 2018, 173, 332–341. [Google Scholar] [CrossRef]
  5. Powers, T.C. A working hypothesis for further studies of frost resistance of concrete. J. Proc. 1945, 41, 245–272. [Google Scholar]
  6. Powers, T.C.; Helmuth, R.A. Theory of Volume Changes in Hardened Portland-Cement Paste During Freezing. In Proceedings of the Thirty-Second Annual Meeting of the Highway Research Board, Washington, DC, USA, 13–16 January 1953; pp. 285–297. [Google Scholar]
  7. Powers, T.C.; Willis, T.F. The Air Requirement of Frost Resistant Concrete. Highw. Res. Board Proc. 1950, 29, 184–211. [Google Scholar]
  8. Fagerlund, G. Critical Degrees of Saturation at Freezing of Porous and Brittle Materials, Report 34; Division of Building Technology, Lund Institute of Technology: Lund, Sweden, 1972; p. 408. [Google Scholar]
  9. Scherer, G.W. Crystallization in pores. Cement. Concr. Res. 1999, 29, 1347–1358. [Google Scholar] [CrossRef]
  10. Setzer, M.J. Micro-ice-lens formation in porous solid. J. Colloid. Interf. Sci. 2001, 243, 193–201. [Google Scholar] [CrossRef]
  11. Setzer, M.J. Mechanical stability criterion, triple-phase condition, and pressure differences of matter condensed in a porous matrix. J. Colloid. Interf. Sci. 2001, 235, 170–182. [Google Scholar] [CrossRef]
  12. Valenza, J.J.; Scherer, G.W. A review of salt scaling: I. Phenomenology. Cem. Concr. Res. 2007, 37, 1007–1021. [Google Scholar] [CrossRef]
  13. Coussy, O. Poromechanics of freezing materials. J. Mech. Phys. Solids 2005, 53, 1689–1718. [Google Scholar] [CrossRef]
  14. Liu, L.; Shen, D.; Chen, H.; Sun, W.; Qian, Z.; Zhao, H.; Jiang, J. Analysis of damage development in cement paste due to ice nucleation at different temperatures. Cem. Concr. Comp. 2014, 53, 1–9. [Google Scholar] [CrossRef]
  15. Gong, F.; Jacobsen, S. Modeling of water transport in highly saturated concrete with wet surface during freeze/thaw. Cem. Concr. Res. 2019, 115, 294–307. [Google Scholar] [CrossRef]
  16. Eriksson, D.; Wahlbom, D.; Malm, R.; Fridh, K. Hygro-thermo-mechanical modeling of partially saturated air-entrained concrete containing dissolved salt and exposed to freeze–thaw cycles. Cem. Concr. Res. 2021, 141, 106314. [Google Scholar] [CrossRef]
  17. Wang, Y.; Li, J.H.; Ueda, T.; Zhang, D.W.; Deng, J. Meso-scale mechanical deterioration of mortar subjected to freeze thaw cycles and sodium chloride attack. Cem. Concr. Comp. 2021, 117, 103906. [Google Scholar] [CrossRef]
  18. Mesbah, A.; Francois, M.; Cau-dit-Coumes, C.; Frizon, F.; Filinchuk, Y.; Leroux, F.; Ravaux, J.; Renaudin, G. Crystal structure of Kuzel’s salt 3CaO center dot Al2O3 center dot 1/2CaSO4center dot 1/2CaCl2center dot 11H(2)O determined by synchrotron powder diffraction. Cem. Concr. Res. 2011, 41, 504–509. [Google Scholar] [CrossRef]
  19. Wenchen, M. Behavior of Aged Reinforced Concrete Columns under High Sustained Concentric and Eccentric Loads. Ph.D. Thesis, University of Nevada, Las Vegas, NV, USA, 2021. [Google Scholar]
  20. Li, Y.; Li, Y.Q.; Guan, Z.Z.; Ding, Q.J. Elastic modulus damage model of cement mortar under salt freezing circumstance based on X-ray CT scanning. Constr. Build. Mater. 2018, 191, 1201–1209. [Google Scholar] [CrossRef]
  21. Gonzalez, D.C.; Mena, A.; Minguez, J.; Vicente, M.A. Influence of air-entraining agent and freeze–thaw action on pore structure in high-strength concrete by using CT-Scan technology. Cold Reg. Sci. Technol. 2021, 192, 103397. [Google Scholar] [CrossRef]
  22. Sokhansefat, G.; Moradian, M.; Finnell, M.; Behravan, A.; Ley, M.T.; Lucero, C.; Weiss, J. Using X-ray computed tomography to investigate mortar subjected to freeze–thaw cycles. Cem. Concr. Comp. 2020, 108, 103520. [Google Scholar] [CrossRef]
  23. Xu, F.; Yang, Z.Q.; Liu, W.Q.; Wang, S.G.; Zhang, H.G. Experimental investigation on the effect of sulfate attack on chloride diffusivity of cracked concrete subjected to composite solution. Constr. Build. Mater. 2020, 237, 117643. [Google Scholar] [CrossRef]
  24. Li, Y.; Wang, R.J.; Li, S.Y.; Zhao, Y.; Qin, Y. Resistance of recycled aggregate concrete containing low- and high-volume fly ash against the combined action of freeze–thaw cycles and sulfate attack. Constr. Build. Mater. 2018, 166, 23–34. [Google Scholar] [CrossRef]
  25. Jiang, L.; Niu, D.T.; Yuan, L.D.; Fei, Q.N. Durability of concrete under sulfate attack exposed to freeze–thaw cycles. Cold Reg. Sci. Technol. 2015, 112, 112–117. [Google Scholar] [CrossRef]
  26. Nili, M.; Ramezanianpour, A.A.; Sobhani, J. Evaluation of the effects of silica fume and air-entrainment on deicer salt scaling resistance of concrete pavements: Microstructural study and modeling. Constr. Build. Mater. 2021, 308, 124972. [Google Scholar] [CrossRef]
  27. Qiao, C.; Hosseinzadeh, N.; Suraneni, P.; Wei, S.; Rothstein, D. Petrographically quantifying the damage to field and lab-cast mortars subject to freeze–thaw cycles and deicer application. J. Infrastruct. Preserv. Resil. 2021, 2, 9. [Google Scholar] [CrossRef]
  28. Niu, D.T.; Jiang, L.; Fei, Q.N. Deterioration Mechanism of Sulfate Attack on Concrete under Freeze-thaw Cycles. J. Wuhan Univ. Technol. 2013, 28, 1172–1176. [Google Scholar] [CrossRef]
  29. Wang, D.Z.; Zhou, X.M.; Meng, Y.F.; Chen, Z. Durability of concrete containing fly ash and silica fume against combined freezing-thawing and sulfate attack. Constr. Build. Mater. 2017, 147, 398–406. [Google Scholar] [CrossRef]
  30. Wang, Y.Z.; Liu, Z.; Fu, K.; Li, Q.M.; Wang, Y.C. Experimental studies on the chloride ion permeability of concrete considering the effect of freeze–thaw damage. Constr. Build. Mater. 2020, 236, 117556. [Google Scholar] [CrossRef]
  31. Zhang, X.; Wang, L.; Zhang, J. Mechanical behavior and chloride penetration of high strength concrete under freeze–thaw attack. Cold Reg. Sci. Technol. 2017, 142, 17–24. [Google Scholar] [CrossRef]
  32. Hosseinzadeh, N.; Suraneni, P. Synergistic effects of air content and supplementary cementitious materials in reducing damage caused by calcium oxychloride formation in concrete. Cem. Concr. Comp. 2021, 122, 104170. [Google Scholar] [CrossRef]
  33. Jin, S.S.; Zheng, G.P.; Yu, J. A micro freeze–thaw damage model of concrete with fractal dimension. Constr. Build. Mater. 2020, 257, 119434. [Google Scholar] [CrossRef]
  34. Li, S.G.; Chen, G.X.; Ji, G.J.; Lu, Y.H. Quantitative damage evaluation of concrete suffered freezing-thawing by DIP technique. Constr. Build. Mater. 2014, 69, 177–185. [Google Scholar] [CrossRef]
  35. Xiao, Q.H.; Li, Q.; Cao, Z.Y.; Tian, W.Y. The deterioration law of recycled concrete under the combined effects of freeze–thaw and sulfate attack. Constr. Build. Mater. 2019, 200, 344–355. [Google Scholar] [CrossRef]
  36. Yu, H.; Ma, H.; Yan, K. An equation for determining freeze–thaw fatigue damage in concrete and a model for predicting the service life. Constr. Build. Mater. 2017, 137, 104–116. [Google Scholar] [CrossRef]
  37. Xiao, Q.H.; Cao, Z.Y.; Guan, X.; Li, Q.; Liu, X.L. Damage to recycled concrete with different aggregate substitution rates from the coupled action of freeze–thaw cycles and sulfate attack. Constr. Build. Mater. 2019, 221, 74–83. [Google Scholar] [CrossRef]
  38. Wang, B.X.; Pan, J.J.; Fang, R.C.; Wang, Q. Damage model of concrete subjected to coupling chemical attacks and freeze–thaw cycles in saline soil area. Constr. Build. Mater. 2020, 242, 118205. [Google Scholar] [CrossRef]
  39. Hang, M.; Cui, L.; Wu, J.; Sun, Z. Freezing-thawing damage characteristics and calculation models of aerated concrete. J. Build. Eng. 2020, 28, 101072. [Google Scholar] [CrossRef]
  40. Chen, F.L.; Qiao, P.Z. Probabilistic damage modeling and service-life prediction of concrete under freeze–thaw action. Mater. Struct. 2015, 48, 2697–2711. [Google Scholar] [CrossRef]
  41. Dahmani, L.; Khenane, A.; Kaci, S. Behavior of the reinforced concrete at cryogenic temperatures. Cryogenics 2007, 47, 517–525. [Google Scholar] [CrossRef]
  42. Jiang, Z.W.; He, B.; Zhu, X.P.; Ren, Q.; Zhang, Y. State-of-the-art review on properties evolution and deterioration mechanism of concrete at cryogenic temperature. Constr. Build. Mater. 2020, 257, 119456. [Google Scholar] [CrossRef]
  43. Zeng, Q.; Li, K.; Fen-chong, T.; Dangla, P. In A study of the Behaviors of Cement-Based Materials Subject to Freezing. In Proceedings of the 2010 International Conference on Mechanic Automation and Control Engineering, Wuhan, China, 26–28 June 2010; pp. 1611–1616. [Google Scholar]
  44. Liu, Z.; Zhang, Y.; Jiang, Q.; Zhang, W.; Wu, J. Solid Phases Percolation and Capillary Pores Depercolation in Hydrating Cement Pastes. J. Mater. Civil. Eng. 2014, 26, 04014090. [Google Scholar] [CrossRef]
  45. Sun, Z.; Scherer, G.W. Effect of air voids on salt scaling and internal freezing. Cem. Concr. Res. 2010, 40, 260–270. [Google Scholar] [CrossRef]
  46. Rønning, T.F. Freeze–Thaw Resistance of Concrete: Effect of: Curing Conditions, Moisture Exchange and Materials. Ph.D. Thesis, The Norwegian Institute of Technology, Trondheim, Norway, 2001. [Google Scholar]
  47. Washburn, E.W. The dynamics of capillary flow. Phys. Rev. 1921, 17, 273. [Google Scholar] [CrossRef]
  48. Sun, M.; Xin, D.B.; Zou, C.Y. Damage evolution and plasticity development of concrete materials subjected to freeze–thaw during the load process. Mech. Mater. 2019, 139, 103192. [Google Scholar] [CrossRef]
  49. Smith, S.H.; Qiao, C.Y.; Suraneni, P.; Kurtis, K.E.; Weiss, W.J. Service-life of concrete in freeze–thaw environments: Critical degree of saturation and calcium oxychloride formation. Cem. Concr. Res. 2019, 122, 93–106. [Google Scholar] [CrossRef]
  50. Fagerlund, G. The Long Time Water Absorption in the Air-Pore Structure of Concrete; Division of Building, Lund Institute of Technology: Lund, Sweden, 1993. [Google Scholar]
  51. Masoodi, R.; Pillai, K.M. Wicking in Porous Materials: Traditional and Modern Modeling Approaches; CRC Press: Boca Raton, FL, USA, 2012. [Google Scholar]
  52. Liu, L.; Qin, G.; Qin, S.N.; Tao, G.H. Simulation of the volumetric deformation and changes in the pore structure of unsaturated cement-based materials subjected to freezing/thawing. Constr. Build. Mater. 2020, 230, 116964. [Google Scholar] [CrossRef]
  53. Valenza, J.J.; Scherer, G.W. A review of salt scaling: II. Mechanisms. Cem. Concr. Res. 2007, 37, 1022–1034. [Google Scholar] [CrossRef]
  54. De Kock, T.; Boone, M.A.; De Schryver, T.; van Stappen, J.; Derluyn, H.; Masschaele, B.; De Schutter, G.; Cnudde, V. A Pore-Scale Study of Fracture Dynamics in Rock Using X-ray Micro-CT Under Ambient Freeze–Thaw Cycling. Environ. Sci. Technol. 2015, 49, 2867–2874. [Google Scholar] [CrossRef]
  55. Deprez, M.; De Kock, T.; De Schutter, G.; Cnudde, V. A review on freeze–thaw action and weathering of rocks. Earth Sci. Rev. 2020, 203, 103143. [Google Scholar] [CrossRef]
  56. Bluhm, J.; Setzer, M.J.; Kruschwitz, J. Modeling of ice formation in porous media. In IUTAM Symposium on Physicochemical and Electromechanical Interactions in Porous Media; Huyghe, J.M., Raats, P., Cowin, S.C., Eds.; Symposium on the Mechanics of Physicochemical and Electromechanical Interactions in Porous Media: New York, NY, USA, 2005; Volume 125, pp. 329–334. [Google Scholar]
  57. Rosenqvist, M.; Fridh, K.; Hassanzadeh, M. Macroscopic ice lens growth in hardened concrete. Cem. Concr. Res. 2016, 88, 114–125. [Google Scholar] [CrossRef]
  58. Valenza, J.J.; Scherer, G.W. Mechanism for salt scaling of a cementitious surface. Mater. Struct 2007, 40, 259–268. [Google Scholar] [CrossRef]
  59. Valenza, J.J.; Scherer, G.W. Mechanisms of salt scaling. Mater. Struct. 2005, 38, 479–488. [Google Scholar] [CrossRef]
  60. Valenza, J.J.; Scherer, G.W. Characterization of saturated porous bodies. Mater. Struct. 2004, 37, 21–30. [Google Scholar]
  61. Coussy, O.; Monteiro, P. Poroelastic model for concrete exposed to freezing temperatures. Cem. Concr. Res. 2008, 38, 40–48. [Google Scholar] [CrossRef]
  62. Dong, Y.J.; Su, C.; Qiao, P.Z.; Sun, L.Z. A thermal-hydraulic-mechanical coupling model for freezing process simulation of cementitious materials with entrained air voids. Constr. Build. Mater. 2020, 243, 118253. [Google Scholar] [CrossRef]
  63. Mayercsik, N.P.; Vandamme, M.; Kurtis, K.E. Assessing the efficiency of entrained air voids for freeze–thaw durability through modeling. Cem. Concr. Res. 2016, 88, 43–59. [Google Scholar] [CrossRef]
  64. Gou, Y.; Zhang, L.; Liu, C.; Zhang, H.; Wei, C.; Cai, X.; Yang, H.; Guan, Q.; Zhai, S.; Liu, L. Investigation of freeze–thaw mechanism for crumb rubber concrete by the online strain sensor. Measurement 2021, 174, 109080. [Google Scholar] [CrossRef]
  65. Qiao, C.; Chen, X.; Suraneni, P.; Weiss, W.J.; Rothstein, D. Petrographic analysis of in-service cementitious mortar subject to freeze–thaw cycles and deicers. Cem. Concr. Compos. 2021, 122, 104112. [Google Scholar] [CrossRef]
  66. Qiao, C.; Suraneni, P.; Weiss, J. Flexural strength reduction of cement pastes exposed to CaCl2 solutions. Cem. Concr. Compos. 2018, 86, 297–305. [Google Scholar] [CrossRef]
  67. Li, W.; Pour-Ghaz, M.; Castro, J.; Weiss, J. Water Absorption and Critical Degree of Saturation Relating to Freeze–Thaw Damage in Concrete Pavement Joints. J. Mater. Civ. Eng. 2012, 24, 299–307. [Google Scholar] [CrossRef]
  68. Song, Q.; Nie, J.; Wu, D.K.; Hu, Y.R.; Chen, Y.X. Effect of SO42−, Cl and Mg2+ on the system of C-S-H and Ca(OH)2. Constr. Build. Mater. 2021, 285, 122955. [Google Scholar] [CrossRef]
  69. Birnin-Yauri, U.A.; Glasser, F.P. Friedel’s salt, Ca2Al(OH)6 center dot 2H2O: Its solid solutions and their role in chloride binding. Cem. Concr. Res. 1998, 28, 1713–1723. [Google Scholar] [CrossRef]
  70. Qiao, C.; Suraneni, P.; Weiss, J. Damage in cement pastes exposed to NaCl solutions. Constr. Build. Mater. 2018, 171, 120–127. [Google Scholar] [CrossRef]
  71. Farnam, Y.; Dick, S.; Wiese, A.; Davis, J.; Bentz, D.; Weiss, J. The influence of calcium chloride deicing salt on phase changes and damage development in cementitious materials. Cem. Concr. Compos. 2015, 64, 1–15. [Google Scholar] [CrossRef]
  72. Qiao, C.Y.; Suraneni, P.; Weiss, J. Phase Diagram and Volume Change of the Ca(OH)2 CaCl2 H2O System for Varying Ca(OH)2/CaCl2 Molar Ratios. J. Mater. Civil. Eng. 2018, 30, 04017281. [Google Scholar] [CrossRef]
  73. Xie, N.; Dang, Y.; Shi, X. New insights into how MgCl2 deteriorates Portland cement concrete. Cem. Concr. Res. 2019, 120, 244–255. [Google Scholar] [CrossRef]
  74. Sutter, L.; Peterson, K.; Touton, S.; Van Dam, T.; Johnston, D. Petrographic evidence of calcium oxychloride formation in mortars exposed to magnesium chloride solution. Cem. Concr. Res. 2006, 36, 1533–1541. [Google Scholar] [CrossRef]
  75. Ghazy, A.; Bassuoni, M. Resistance of concrete to different exposures with chloride-based salts. Cem. Concr. Res. 2017, 101, 144–158. [Google Scholar] [CrossRef]
  76. Nadelman, E.; Kurtis, K. Durability of Portland-limestone cement-based materials to physical salt attack. Cem. Concr. Res. 2019, 125, 105859. [Google Scholar] [CrossRef]
  77. Lee, B.Y.; Kurtis, K.E. Effect of pore structure on salt crystallization damage of cement-based materials: Consideration of w/b and nanoparticle use. Cem. Concr. Res. 2017, 98, 61–70. [Google Scholar] [CrossRef]
  78. Li, B.; Mao, J.; Nawa, T.; Liu, Z. Mesoscopic chloride ion diffusion model of marine concrete subjected to freeze–thaw cycles. Constr. Build. Mater. 2016, 125, 337–351. [Google Scholar] [CrossRef]
  79. Zhu, P.H.; Hao, Y.L.; Liu, H.; Wang, X.J.; Gu, L. Durability evaluation of recycled aggregate concrete in a complex environment. J. Clean Prod. 2020, 273, 122569. [Google Scholar] [CrossRef]
  80. Wang, D.Z.; Zhou, X.M.; Fu, B.; Zhang, L.R. Chloride ion penetration resistance of concrete containing fly ash and silica fume against combined freezing-thawing and chloride attack. Constr. Build. Mater. 2018, 169, 740–747. [Google Scholar] [CrossRef]
  81. Yazdchi, M.; Asl, A.F.; Talatahari, S.; Gandomi, A.H. Evaluation of the Mechanical Properties of Normal Concrete Containing Nano-MgO under Freeze–Thaw Conditions by Evolutionary Intelligence. Appl. Sci. 2021, 11, 2529. [Google Scholar] [CrossRef]
  82. Qiu, W.L.; Teng, F.; Pan, S.S. Damage constitutive model of concrete under repeated load after seawater freeze–thaw cycles. Constr. Build. Mater. 2020, 236, 117560. [Google Scholar] [CrossRef]
  83. Wang, Y.Z.; Liu, Z.; Zhang, B.H.; Fu, K. A time-dependent diffusive model for the simulation of chloride penetration in concrete considering the effect of natural salt freeze–thaw cycles. Cold Reg. Sci. Technol. 2022, 201, 103622. [Google Scholar] [CrossRef]
  84. Hou, R.; Qi, Z.; Li, T.; Fu, Q.; Meng, F.; Liu, D.; Li, Q.; Zhao, H.; Yu, P. Mechanism of snowmelt infiltration coupled with salt transport in soil amended with carbon-based materials in seasonally frozen areas. Geoderma 2022, 420, 115882. [Google Scholar] [CrossRef]
  85. Luo, S.; Bai, T.; Guo, M.; Wei, Y.; Ma, W. Impact of Freeze–Thaw Cycles on the Long-Term Performance of Concrete Pavement and Related Improvement Measures: A Review. Materials 2022, 15, 4568. [Google Scholar] [CrossRef]
  86. Kunther, W.; Lothenbach, B.; Skibsted, J. Influence of the Ca/Si ratio of the C–S–H phase on the interaction with sulfate ions and its impact on the ettringite crystallization pressure. Cem. Concr. Res. 2015, 69, 37–49. [Google Scholar] [CrossRef]
  87. Kunther, W.; Lothenbach, B.; Scrivener, K. Influence of bicarbonate ions on the deterioration of mortar bars in sulfate solutions. Cem. Concr. Res. 2013, 44, 77–86. [Google Scholar] [CrossRef]
  88. Zhao, N.; Wang, S.; Wang, C.; Quan, X.; Yan, Q.; Li, B. Study on the durability of engineered cementitious composites (ECCs) containing high-volume fly ash and bentonite against the combined attack of sulfate and freezing-thawing (F–T). Constr. Build. Mater. 2019, 233, 117313. [Google Scholar] [CrossRef]
  89. Hime, W.G.; Mather, B. “Sulfate attack,” or is it? Cem. Concr. Res. 1999, 29, 789–791. [Google Scholar] [CrossRef]
  90. Li, C.; Jiang, Z.W.; Myers, R.J.; Chen, Q.; Wu, M.X.; Li, J.Q.; Monteiro, P. Understanding the sulfate attack of Portland cement-based materials exposed to applied electric fields: Mineralogical alteration and migration behavior of ionic species. Cem. Concr. Comp. 2020, 111, 103630. [Google Scholar] [CrossRef]
  91. Wang, K.; Guo, J.; Yang, L. Effect of dry–wet ratio on sulfate transport-reaction mechanism in concrete. Constr. Build. Mater. 2021, 302, 124418. [Google Scholar] [CrossRef]
  92. Bayraktar, O.Y.; Eshtewi, S.; Benli, A.; Kaplan, G.; Toklu, K.; Gunek, F. The impact of RCA and fly ash on the mechanical and durability properties of polypropylene fibre-reinforced concrete exposed to freeze–thaw cycles and MgSO4 with ANN modeling. Constr. Build. Mater. 2021, 313, 125508. [Google Scholar] [CrossRef]
  93. Tosun-Felekoğlu, K. The effect of C3A content on sulfate durability of Portland limestone cement mortars. Constr. Build. Mater. 2012, 36, 437–447. [Google Scholar] [CrossRef]
  94. Steiger, M.; Asmussen, S. Crystallization of sodium sulfate phases in porous materials: The phase diagram Na2SO4–H2O and the generation of stress. Geochim. Cosmochim. Acta 2008, 72, 4291–4306. [Google Scholar] [CrossRef]
  95. Al-Amoudi, O.S.B. Attack on plain and blended cements exposed to aggressive sulfate environments. Cem. Concr. Compos. 2002, 24, 305–316. [Google Scholar] [CrossRef]
  96. Bensted, J. Thaumasite—Background and nature in deterioration of cements, mortars and concretes. Cem. Concr. Comp. 1999, 21, 117–121. [Google Scholar] [CrossRef]
  97. Sotiriadis, K.; Hlobil, M.; Viani, A.; Mácová, P.; Vopálenský, M. Physical-chemical-mechanical quantitative assessment of the microstructural evolution in Portland-limestone cement pastes exposed to magnesium sulfate attack at low temperature. Cem. Concr. Res. 2021, 149, 106566. [Google Scholar] [CrossRef]
  98. Piasta, W.; Marczewska, J.; Jaworska, M. Durability of air entrained cement mortars under combined sulphate and freeze–thaw attack. In Proceedings of the 7th Scientific-Technical Conference Material Problems in Civil Engineering (MATBUD), Cracow University of Technology, Cracow, Poland, 22–24 June 2015; Tracz, T., Hager, I., Eds.; Volume 108, pp. 55–62. [Google Scholar]
  99. Ren, J.G.; Lai, Y.M. Study on the durability and failure mechanism of concrete modified with nanoparticles and polypropylene fiber under freeze–thaw cycles and sulfate attack. Cold Reg. Sci. Technol. 2021, 188, 103301. [Google Scholar] [CrossRef]
  100. Farnam, Y.; Bentz, D.; Sakulich, A.; Flynn, D.; Weiss, J. Measuring freeze and thaw damage in mortars containing deicing salt using a low-temperature longitudinal guarded comparative calorimeter and acoustic emission. Adv. Civ. Eng. Mater. 2014, 3, 316–337. [Google Scholar] [CrossRef]
  101. Sun, H.F.; Jiang, C.; Cao, K.; Yu, D.; Liu, W.; Zhang, X.G.; Xing, F.; Zhao, D.D. Monitoring of steel corrosion and cracking in cement paste exposed to combined sulfate-chloride attack with X-ray microtomography. Constr. Build. Mater. 2021, 302, 124345. [Google Scholar] [CrossRef]
  102. Wu, J.; Wei, J.; Huang, H.; Hu, J.; Yu, Q. Effect of multiple ions on the degradation in concrete subjected to sulfate attack. Constr. Build. Mater. 2020, 259, 119846. [Google Scholar] [CrossRef]
  103. Du, J.; Tang, Z.; Li, G.; Yang, H.; Li, L. Key inhibitory mechanism of external chloride ions on concrete sulfate attack. Constr. Build. Mater. 2019, 225, 611–619. [Google Scholar] [CrossRef]
  104. Chen, D.; Deng, Y.; Shen, J.; Sun, G.; Shi, J. Study on damage rules on concrete under corrosion of freeze–thaw and saline solution. Constr. Build. Mater. 2021, 304, 124617. [Google Scholar] [CrossRef]
  105. Qingli, D.; Ng, K. Transmission X-Ray Microscope Nanoscale Characterization and 3D Micromechanical Modeling of Internal Frost Damage in Cement Paste. J. Nanomech. Micromech. 2014, 4, A4013005–A4013010. [Google Scholar]
  106. Du, W.; Liu, Q.T.; Lin, R.S. Effects of toluene-di-isocyanate microcapsules on the frost resistance and self-repairing capability of concrete under freeze–thaw cycles. J. Build. Eng. 2021, 44, 102880. [Google Scholar] [CrossRef]
  107. Wen, Y.; Sun, H.; Hu, S.D.; Xu, G.M.; Wu, X.Z.; Song, C.C.; Liu, Z.; Li, Z.J. Microstructure and life prediction model of steel slag concrete under freezing-thawing environment. Nanotechnol. Rev. 2021, 10, 1776–1788. [Google Scholar] [CrossRef]
  108. Sakr, M.R.; Bassuoni, M.T. Silane and methyl-methacrylate based nanocomposites as coatings for concrete exposed to salt solutions and cyclic environments. Cem. Concr. Comp. 2021, 115, 103841. [Google Scholar] [CrossRef]
  109. Huang, X.; Wang, T.; Pang, J.; Song, F. Experimental Study on the Effect of Freeze–Thaw Cycles on the Apparent and Mechanical Properties of Rubber Concrete Under Chloride Environment. Arab. J. Sci. Eng. 2022, 47, 4133–4153. [Google Scholar] [CrossRef]
  110. Tian, W.; Gao, F.F. Damage and Degradation of Concrete under Coupling Action of Freeze–Thaw Cycle and Sulfate Attack. Adv. Mater. Sci. Eng. 2020, 2020, 8032849. [Google Scholar] [CrossRef]
  111. Wang, R.; Hu, Z.; Li, Y.; Wang, K.; Zhang, H. Review on the deterioration and approaches to enhance the durability of concrete in the freeze–thaw environment. Constr. Build. Mater. 2022, 321, 126371. [Google Scholar] [CrossRef]
  112. Jia, P.; Li, L.; Zhou, J.; Zhang, D.; Guan, Z.W.; Dong, J.F.; Wang, Q.Y. Performance Evolution of Recycled Aggregate Concrete under the Coupled Effect of Freeze–Thaw Cycles and Sulfate Attack. Appl. Sci. 2022, 12, 6950. [Google Scholar] [CrossRef]
  113. Divanedari, H.; Eskandari-Naddaf, H. Insights into surface crack propagation of cement mortar with different cement fineness subjected to freezing/thawing. Constr. Build. Mater. 2020, 233, 117207. [Google Scholar] [CrossRef]
  114. Xie, R.F.; Lu, L.J.; Qiao, P.Z.; Zhou, Z.D. Nanoindentation-based micromechanical characterisation of ultra-high-performance concrete exposed to freezing-thawing. Mag. Concr. Res. 2022, 74, 162–176. [Google Scholar] [CrossRef]
  115. Liu, M.X.; Liu, D.X.; Qiao, P.Z.; Sun, L.Z. Characterization of microstructural damage evolution of freeze–thawed shotcrete by an integrative micro-CT and nanoindentation statistical approach. Cem. Concr. Comp. 2021, 117, 103909. [Google Scholar] [CrossRef]
  116. Lyu, Z.; Shen, A.; Wang, W.; Lin, S.; Guo, Y.; Meng, W. Salt frost resistance and micro characteristics of polynary blended concrete using in frost areas. Cold Reg. Sci. Technol. 2021, 191, 103374. [Google Scholar] [CrossRef]
  117. Zhang, J.; Wang, Y.; Pang, J.; Lu, Y.; Bu, Y. Experimental Study on Damage Characteristics of Solidified Mud under Coupling Action of Freeze–Thaw Cycle and Chloride Salt. Geofluids 2022, 2022, 6050432. [Google Scholar] [CrossRef]
  118. Ji, R.; Li, T.; Yang, J.; Xu, J. Sulfate Freeze–Thaw Resistance of Magnesium Potassium Phosphate Cement Mortar according to Hydration Age. Materials 2022, 15, 4192. [Google Scholar] [CrossRef]
  119. Ebrahimi, K.; Daiezadeh, M.J.; Zakertabrizi, M.; Zahmatkesh, F.; Korayem, A.H. A review of the impact of micro- and nanoparticles on freeze–thaw durability of hardened concrete: Mechanism perspective. Constr. Build. Mater. 2018, 186, 1105–1113. [Google Scholar] [CrossRef]
  120. Wang, J.B.; Niu, D.T.; He, H. Frost durability and stress-strain relationship of lining shotcrete in cold environment. Constr. Build. Mater. 2019, 198, 58–69. [Google Scholar] [CrossRef]
  121. Wang, Y.; Zhang, S.H.; Niu, D.T.; Fu, Q. Quantitative evaluation of the characteristics of air voids and their relationship with the permeability and salt freeze–thaw resistance of hybrid steel-polypropylene fiber-reinforced concrete composites. Cem. Concr. Comp. 2022, 125, 104292. [Google Scholar] [CrossRef]
  122. Xu, F.; Wang, S.L.; Li, T.; Liu, B.; Zhao, N.; Liu, K.N. The mechanical properties and resistance against the coupled deterioration of sulfate attack and freeze–thaw cycles of tailing recycled aggregate concrete. Constr. Build. Mater. 2021, 269, 121273. [Google Scholar] [CrossRef]
  123. Zhang, B.; Li, Q.B.; Niu, X.J.; Yang, L.; Hu, Y.; Zhang, J.L. Influence of a novel hydrophobic agent on freeze–thaw resistance and microstructure of concrete. Constr Build. Mater. 2021, 269, 121294. [Google Scholar] [CrossRef]
  124. Zhang, P.; Wittmann, F.H.; Vogel, M.; Muller, H.S.; Zhao, T.J. Influence of freeze–thaw cycles on capillary absorption and chloride penetration into concrete. Cem. Concr. Res. 2017, 100, 60–67. [Google Scholar] [CrossRef]
  125. Sun, M.; Zou, C.Y.; Xin, D.B. Pore structure evolution mechanism of cement mortar containing diatomite subjected to freeze–thaw cycles by multifractal analysis. Cem. Concr. Comp. 2020, 114, 103731. [Google Scholar] [CrossRef]
  126. Zheng, X.; Liu, F.; Luo, T.; Duan, Y.; Yi, Y.; Hua, C. Study on Durability and Pore Characteristics of Concrete under Salt Freezing Environment. Materials 2021, 14, 7228. [Google Scholar] [CrossRef]
  127. Tian, W.; Han, N. Pore characteristics (>0.1 mm) of non-air entrained concrete destroyed by freeze–thaw cycles based on CT scanning and 3D printing. Cold Reg. Sci. Technol. 2018, 151, 314–322. [Google Scholar] [CrossRef]
  128. Chen, J.; Deng, X.; Luo, Y.; He, L.; Liu, Q.; Qiao, X. Investigation of microstructural damage in shotcrete under a freeze–thaw environment. Constr. Build. Mater. 2015, 83, 275–282. [Google Scholar] [CrossRef]
  129. Wang, Y.; Yang, W.; Ge, Y.; Liu, P.; Zhang, A. Analysis of freeze–thaw damage and pore structure deterioration of mortar by low-field NMR. Constr. Build. Mater. 2021, 319, 126097. [Google Scholar] [CrossRef]
  130. Jia, H.L.; Ding, S.; Zi, F.; Dong, Y.H.; Shen, Y.J. Evolution in sandstone pore structures with freeze–thaw cycling and interpretation of damage mechanisms in saturated porous rocks. Catena 2020, 195, 104915. [Google Scholar] [CrossRef]
  131. Liu, T.; Zhang, C.; Zhou, K.; Tian, Y. Freeze-thaw cycling damage evolution of additive cement mortar. Eur. J. Environ. Civ. Eng. 2021, 25, 2089–2110. [Google Scholar] [CrossRef]
  132. Zhang, K.; Zhou, J.; Yin, Z. Experimental Study on Mechanical Properties and Pore Structure Deterioration of Concrete under Freeze–Thaw Cycles. Materials 2021, 14, 6568. [Google Scholar] [CrossRef] [PubMed]
  133. Shen, Y.; Wang, Y.; Wei, X.; Jia, H.; Yan, R. Investigation on meso-debonding process of the sandstone-concrete interface induced by freeze–thaw cycles using NMR technology. Constr. Build. Mater. 2020, 252, 118962. [Google Scholar] [CrossRef]
  134. Sypek, M.; Latawiec, R.; Lazniewska-Piekarczyk, B.; Pichor, W. Impact of Surfactant and Calcium Sulfate Type on Air-Entraining Effectiveness in Concrete. Materials 2022, 15, 985. [Google Scholar] [CrossRef] [PubMed]
  135. He, B.; Xie, M.; Jiang, Z.; Zhang, C.; Zhu, X. Temperature field distribution and microstructure of cement-based materials under cryogenic freeze–thaw cycles. Constr. Build Mater. 2020, 243, 118256. [Google Scholar] [CrossRef]
  136. Yao, H.; Xie, Z.; Huang, C.; Yuan, Q.; Yu, Z. Recent progress of hydrophobic cement-based materials: Preparation, characterization and properties. Constr. Build. Mater. 2021, 299, 124255. [Google Scholar] [CrossRef]
  137. Zeng, W.; Ding, Y.; Zhang, Y.; Dehn, F. Effect of steel fiber on the crack permeability evolution and crack surface topography of concrete subjected to freeze–thaw damage. Cement Concrete Res. 2020, 138, 106230. [Google Scholar] [CrossRef]
  138. Sanchez, L.F.M.; Drimalas, T.; Fournier, B.; Mitchell, D.; Bastien, J. Comprehensive damage assessment in concrete affected by different internal swelling reaction (ISR) mechanisms. Cem. Concr. Res. 2018, 107, 284–303. [Google Scholar] [CrossRef]
  139. Soroushian, P.; Elzafraney, M. Damage effects on concrete performance and microstructure. Cem. Concr. Comp. 2004, 26, 853–859. [Google Scholar] [CrossRef]
  140. Yang, X.L.; Shen, A.Q.; Guo, Y.C.; Zhou, S.B.; He, T.Q. Deterioration mechanism of interface transition zone of concrete pavement under fatigue load and freeze–thaw coupling in cold climatic areas. Constr. Build. Mater. 2018, 160, 588–597. [Google Scholar] [CrossRef]
  141. Liu, M.; Qiao, P.; Sun, L. Dependence of chloride ion diffusivity on evolution of pore-structures in freeze–thawed shotcrete: Multiscale characterization and modeling. Cem. Concr. Comp. 2021, 123, 104222. [Google Scholar] [CrossRef]
  142. Shields, Y.; Garboczi, E.; Weiss, J.; Farnam, Y. Freeze-thaw crack determination in cementitious materials using 3D X-ray computed tomography and acoustic emission. Cem. Concr. Comp. 2018, 89, 120–129. [Google Scholar] [CrossRef]
  143. Liu, M.X.; Qiao, P.Z.; Sun, L.Z. Multiscale modeling of damage and fracture in freeze–thawed shotcrete. Int. J. Damage Mech. 2022, 31, 142–162. [Google Scholar] [CrossRef]
  144. Dong, Y.; Su, C.; Qiao, P.; Sun, L.Z. Microstructural damage evolution and its effect on fracture behavior of concrete subjected to freeze–thaw cycles. Int. J. Damage Mech 2018, 27, 1272–1288. [Google Scholar] [CrossRef]
  145. Dong, Y.J.; Su, C.; Qiao, P.Z.; Sun, L.Z. Microstructural crack segmentation of three-dimensional concrete images based on deep convolutional neural networks. Constr. Build. Mater. 2020, 253, 119185. [Google Scholar] [CrossRef]
  146. Luo, Q.; Liu, D.X.; Qiao, P.Z.; Feng, Q.G.; Sun, L.Z. Microstructural damage characterization of concrete under freeze–thaw action. Int. J. Damage Mech. 2018, 27, 1551–1568. [Google Scholar] [CrossRef]
  147. Zou, D.J.; Wang, Z.Z.; Shen, M.M.; Liu, T.J.; Zhou, A. Improvement in freeze–thaw durability of recycled aggregate permeable concrete with silane modification. Constr. Build. Mater. 2021, 268, 121097. [Google Scholar] [CrossRef]
  148. Wu, K.; Han, H.; Li, H.; Dong, B.; Liu, T.; De Schutter, G. Experimental study on concurrent factors influencing the ITZ effect on mass transport in concrete. Cem. Concr. Compos. 2021, 123, 104215. [Google Scholar] [CrossRef]
  149. Wu, K.; Shi, H.; Xu, L.; Ye, G.; De Schutter, G. Microstructural characterization of ITZ in blended cement concretes and its relation to transport properties. Cem. Concr. Res. 2015, 79, 243–256. [Google Scholar] [CrossRef]
  150. Maruyama, I.; Sasano, H.; Lin, M. Impact of aggregate properties on the development of shrinkage-induced cracking in concrete under restraint conditions. Cem. Concr. Res. 2016, 85, 82–101. [Google Scholar] [CrossRef]
  151. Cwirzen, A.; Penttala, V. Aggregate-cement paste transition zone properties affecting the salt-frost damage of high-performance concretes. Cem. Concr. Res. 2005, 35, 671–679. [Google Scholar] [CrossRef]
  152. Lizarazo-Marriaga, J.; Higuera, C.; Claisse, P. Measuring the effect of the ITZ on the transport related properties of mortar using electrochemical impedance. Constr. Build. Mater. 2014, 52, 9–16. [Google Scholar] [CrossRef]
  153. Zheng, X.; Wang, Y.; Zhang, S.; Xu, F.; Zhu, X.; Jiang, X.; Zhou, L.; Shen, Y.; Chen, Q.; Yan, Z.; et al. Research progress of the thermophysical and mechanical properties of concrete subjected to freeze–thaw cycles. Constr. Build. Mater. 2022, 330, 127254. [Google Scholar] [CrossRef]
  154. Hao, L.; Liu, Y.; Wang, W.; Zhang, J.; Zhang, Y. Effect of salty freeze–thaw cycles on durability of thermal insulation concrete with recycled aggregates. Constr. Build. Mater. 2018, 189, 478–486. [Google Scholar] [CrossRef]
  155. Zhou, Z.; Xie, R.; Qiao, P.; Lu, L. On the modeling of tensile behavior of ultra-high performance fiber-reinforced concrete with freezing-thawing actions. Compos. Part B Eng. 2019, 174, 106983. [Google Scholar] [CrossRef]
  156. Pang, B.; Zhou, Z.; Cheng, X.; Du, P.; Xu, H. ITZ properties of concrete with carbonated steel slag aggregate in salty freeze–thaw environment. Constr. Build. Mater. 2016, 114, 162–171. [Google Scholar] [CrossRef]
  157. Sicat, E.; Gong, F.; Ueda, T.; Zhang, D. Experimental investigation of the deformational behavior of the interfacial transition zone (ITZ) in concrete during freezing and thawing cycles. Constr. Build. Mater. 2014, 65, 122–131. [Google Scholar] [CrossRef]
  158. Siamardi, K.; Shabani, S. Evaluation the effect of micro-synthetic fiber on mechanical and freeze–thaw behavior of non-air-entrained roller compacted concrete pavement using response surface methodology. Constr. Build. Mater. 2021, 295, 123628. [Google Scholar] [CrossRef]
  159. Petersen, L.; Lohaus, L.; Polak, M.A. Influence of freezing-and-thawing damage on behavior of reinforced concrete elements. ACI Mater. J. 2007, 104, 369–378. [Google Scholar]
  160. Nili, M.; Azarioon, A.; Hosseinian, S.M. Novel Internal-Deterioration Model of Concrete Exposed to Freeze–Thaw Cycles. J. Mater. Civ. Eng. 2017, 29, 04017132. [Google Scholar] [CrossRef]
  161. Guan, X.; Chen, J.; Qiu, J.; Gao, Y.; Gao, J. Damage evaluation method based on ultrasound technique for gangue concrete under freezing-thawing cycles. Constr. Build. Mater. 2020, 246, 118437. [Google Scholar] [CrossRef]
  162. Guan, X.; Qiu, J.; Song, H.; Qin, Q.; Zhang, C. Stress–strain behaviour and acoustic emission characteristic of gangue concrete under axial compression in frost environment. Constr. Build. Mater. 2019, 220, 476–488. [Google Scholar] [CrossRef]
  163. Azarsa, P.; Gupta, R.; Biparva, A. Assessment of self-healing and durability parameters of concretes incorporating crystalline admixtures and Portland Limestone Cement. Cem. Concr. Compos. 2019, 99, 17–31. [Google Scholar] [CrossRef]
  164. Hasholt, M.T.; Christensen, K.U.; Pade, C. Frost resistance of concrete with high contents of fly ash—A study on how hollow fly ash particles distort the air void analysis. Cem. Concr. Res. 2019, 119, 102–112. [Google Scholar] [CrossRef]
  165. Xiao, Q.H.; Niu, D.T.; Zhu, W.P. Strength degradation model and durability service life prediction of concrete in freezing-thawing circumstance. Build. Struct. 2011, 41, 203–207. [Google Scholar]
  166. Yu, H.; Sun, W.; Ma, H.; Zhang, Y.; Miao, C.; Jin, Z.; Liu, J. Predicting method of concrete service life based on damage development equation. J. Archit. Civil. Eng. 2012, 29, 1–7. [Google Scholar]
  167. Mu, R. Durability and Service Life Prediction of Concrete Subjected to the Combined Action of Freezing-Thawing, Sustained External Flexural Stress and Salt Solution. Ph.D. Thesis, Southeast University, Nanjing, China, 2000. [Google Scholar]
  168. Zhang, F.; Li, S.; Li, S. Three-dimensional Random Damage Prediction Model of Concrete Caused by Freeze-thaw. J. Civil. Archit. Environ. Eng. 2011, 33, 31–35. [Google Scholar]
  169. Cho, T. Prediction of cyclic freeze–thaw damage in concrete structures based on response surface method. Constr. Build. Mater. 2007, 21, 2031–2040. [Google Scholar] [CrossRef]
  170. Li, B.; Mao, J.; Nawa, T.; Han, T. Mesoscopic damage model of concrete subjected to freeze–thaw cycles using mercury intrusion porosimetry and differential scanning calorimetry (MIP-DSC). Constr. Build. Mater. 2017, 147, 79–90. [Google Scholar] [CrossRef]
  171. Zhang, C.; Ma, W.; Liu, X.; Tian, Y.; Orton, S.L. Effects of high temperature on residual punching strength of slab-column connections after cooling and enhanced post-punching load resistance. Eng. Struct. 2019, 199, 109580. [Google Scholar] [CrossRef]
  172. Xu, W.-H.; Zhang, Q.-N.; Ma, W.-C.; Wang, E.-H. Response of Two Unequal-Diameter Flexible Cylinders in A Side-by-Side Arrangement: Characteristics of FIV. China Ocean Eng. 2020, 34, 475–487. [Google Scholar] [CrossRef]
  173. Chen, X.; Wang, D.Y.; Tang, J.B.; Ma, W.C.; Liu, Y. Geotechnical stability analysis considering strain softening using micro-polar continuum finite element method. J. Cent. South Univ. 2021, 28, 297–310. [Google Scholar] [CrossRef]
Figure 2. Schematic diagram of saturation theory [49]. (a) The water absorption rate of concrete by stages; (b) Matrix saturation state; (c) Pore saturation state.
Buildings 12 01317 g002
Figure 3. Schematic diagram of crystallization pressure theory [53]. (a) Schematic of a cylindrical crystal in a pore of radius γ p . Both the hemispherical end (E) and the cylindrical body (B) adopt the radius, γ p δ w . (b) Schematic of ice forming in a capillary cavity and in an air void. N is connection pore between equivalent liquid and crystal interface. F point represent the curvature of the crystal is negative. A is curvedliquid/vapor meniscus.
Buildings 12 01317 g003
Figure 4. Micro-ice lens model [10].
Buildings 12 01317 g004
Figure 5. Schematic diagram of glue spall theory [53]. (a) Rough glass surface, (b) Epoxy/glass composite at initial temperature T 0 . (c) Interface of composite, illustrating the islands of epoxy and the thin scallops of glass removed when T T 0 . (d,e) Schematic representation of an epoxy/glass/epoxy sandwich seal and the stress that arises in the composite. (d) Sandwich seal, dimensions and orientation. (e) Schematic of stress that arises in the glass surface under the epoxy, σ g , in the epoxy, σ e , and the glue spall stress around the boundary of the epoxy, σ g s .
Buildings 12 01317 g005
Figure 6. Physical erosion mechanism of salt ions. (a) Surface scaling mechanism; (b) Salt crystallization mechanism.
Buildings 12 01317 g006
Figure 7. Principle of salt freezing failure mechanism.
Buildings 12 01317 g007
Figure 8. Microstructure of concrete under different F–T cycles in water [79]. (a) 0 times 1000×; (b) 300 times 1000×.
Buildings 12 01317 g008
Figure 9. Microstructure of concrete in 4% NaCl solution under different cycles [109]. (a) 0 times 2000×; (b) 20 times 2000×; (c) 40 times 2000×; (d) 60 times 2000×.
Buildings 12 01317 g009
Figure 10. Effect of different sulfate ions on micro-morphology of concrete after F–T [88]. (a) Water 5000×; (b) 10% Na2SO4 5000×; (c) 10% MgSO4 5000×.
Buildings 12 01317 g010
Figure 11. DTG data of mortar before and after F–T cycles [65].
Buildings 12 01317 g011
Figure 15. Concrete micro-crack [34].
Buildings 12 01317 g015
Figure 16. Deterioration mechanism of ITZ before and after F–T cycles [113]. (a) ITZ initial state; (b) Deterioration of ITZ after F–T cycles.
Buildings 12 01317 g016
Figure 17. Changes of ITZ width and elastic modulus under different F–T [115]. (a) 0 cycle; (b) 300 cycles; (c) 600 cycles.
Buildings 12 01317 g017
Figure 18. Measurement of ITZ deformation during F–T cycles [157].
Buildings 12 01317 g018
Figure 19. Thickness model of F–T damage layer of concrete.
Buildings 12 01317 g019
Figure 20. Bulk resistivity of concrete under different F–T cycles.
Buildings 12 01317 g020
Figure 21. Correlation between strength and relative porosity of concrete [132].
Buildings 12 01317 g021
Table 1. A brief introduction to the main F–T theories.
ModelPore Pressure ExpressionSymbolic MeaningApplication/Limitation
Hydrostatic
Pressure [5]
p = k 3 n Δ i ( K E 3 r E + r E 2 2 + K E 3 r r 2 2 ) p: Hydraulic pressure
k: Permeability coefficient
n: Viscous resistance
rE: Pose radius
KE: Pose influence range
The function of air entraining agent and the phenomenon of freezing expansion of materials/Unable to explain the critical water content.
Osmotic Pressure [6] P 0 = R T V ln 10 ( 1.1489 t 273.1 + t + 1.33 × 10 5 t 2 9.084 8 t 3 ) P0: Osmotic pressure difference
V: Molar volume of solution
R: Gas constant
T: Temperature
t: Icing temperature
Solute precipitation in salt solution accelerates F–T damage/The formation and release of pressure cannot be quantified.
Critical saturation theory [49]No definite formula Effect of water saturation on concrete deterioration/Macro description, unable to explain the micro mechanism.
Crystallization pressure theory [9] σ s = 2 γ ( 1 r p 1 r ) , σ c = γ r p δ σ s : Crystal tail pressure
σ c : Pressure in the middle of the crystal
γ : Surface energy of crystal and liquid
r p : Small pore diameter
r : Radius of the crystal
δ : Thickness of unfrozen water layer
Shrinkage of air-entraining concrete at low temperature/Extension of hydrostatic pressure theory.
Micro-ice lens theory [10]No definite formula Explains the transport of water and the obvious increase of water absorption rate during F–T/There is no theoretical expression, which is essentially an extension of osmotic pressure theory.
Glue spall theory [59] σ x = T T x B ( T ) [ a c a s b σ x n exp ( Q T ) q ] d T q = d T d t σ x : Stress on the ice
T: Temperature
b, n: Theoretical parameter
a c , a s : Coefficient of thermal expansion
Intuitively explains the spalling phenomenon of concrete surface after F–T/difficult to explain the internal damage.
Theory of unsaturated porous elasticity [61] p = ( ρ l ρ c ) n c n l ρ l k l + n c ρ c k c ρ l , ρ c : Density of water and ice
n l , n c : Relative volume fraction of water and ice
k l , k c : Bulk modulus of water and ice
Constructing the relationship between macroscopic damage and microscopic characterization of concrete during F–T/The theoretical basis is too complex to carry out numerical calculation.
Table 2. F–T cyclic damage model of concrete based on RDEM.
FormulaTheoretical BasisApplicable ScopeProvenance
D n = 1 0.6 log N log N 0.4 log ( N n )
N: Standard F–T fatigue life, generally set at 300;
n: Number of cycles.
Mechanical fatigue equation of materialF–T in pure waterYu et al. [36]
D 1 = a + b x + c x 2 D 2 = α β ln ( k n γ ) D n = D 1 + D 2 D 1 D 2
D1: Salt erosion factor;
D2: F–T cycles factors;
Dn: Coupling situation, n: Number of F–T cycles;
x: Sulfate erosion days;
α, β, γ, k, a, b c: Fitting parameters.
Macroscopic phenomenological damage mechanicsSalt-freeze couplingWang et al. [38]
D n = 1 exp [ ( n 3878.347 ) 0.819 ]
n: Number of F–T cycles.
Meso-statistical damage mechanics5% sodium sulfate F–T cyclesXiao et al. [37]
D n = 1 e b n , n n c
D n = 1 1 k 2 c [ n ln ( k ) b ] , n c n 300
b: Fitting parameters;
k: The general value is 1.25;
nc: The number of cycles when RDEM is 0.8.
Low cycle fatigue theory & meso-statistical damage theoryF–T cycles of 0.4~0.5 water–cement ratio concreteNili et al. [160]
D n = a n 2 + b n + c
a, b, c: Fitting parameters;
n: Number of cycles.
Empirical formulaSteel slag concreteWen et al. [107]
D n = 1 E n E 0 + 1 10 ( W n W 0 0.9 ) 2
D n = e a n 1
En/E0, Wn/W0: RDEM and relative mass loss after F–T cycles;
a: Fitting parameters;
n: Number of F–T cycles.
Empirical formulaAir entraining concrete.
(considering quality loss)
Wang et al. [129]
Note: Dn in the above formula is the RDEM of concrete.
Table 3. F–T cyclic damage model of concrete that is based on other macroscopic indexes.
Damage ModelFormulaSymbolic MeaningProvenance
Compressive strength model D = 0.824 w 0.133 ( 2.528 a 2 + 1.013 a + 0.956 ) ( 0.556 ln b + 2.779 ) e 0.001 n a: Fly ash content;
b: Air contents;
w: Water/binder ratio;
n: Number of F–T cycles;
f0: Initial strength.
Xiao et al. [165]
Mass decay model D = { a t , ( 0 t t 0 ) 0.5 b t 2 + c t + ( c a ) 2 2 b , ( t t 0 ) a, b, c: Fitting parameters;
t0: Damage speed change point
t 0 = a c b ;
t: Mass denudation time.
Yu et al. [166]
Mass decay model D = alg ( b n + 1 ) ( 1 + c 10 0.01 n d 1 + 10 0.01 n d ) n: Number of F–T cycles;
a, b, c, d: Fitting parameters.
Mu et al. [167]
Tensile strength model D = 1 f t n f t o = 1 ( 1 0.00296 n ) 0.234 ft0: Initial tensile strength;
ftn: Tensile strength after F–T cycles;
n: Number of F–T cycles.
Zhang et al. [168]
Residual strain model D ( ) = 300 ( 5632.71 + 4957.77 a 2300 b + 6.64 n 4411.99 a 2 + 163.27 b 2 8.88 × 10 3 n 2 ) D(·): Limit state function;
a: w/b ratio;
b: gas drainage;
n: Number of F–T cycles.
Cho et al.
[169]
Acoustic emission stress-strain model D = { 0 , ε 0.4 ε p a e b x b e 0.4 b , 0.4 ε p ε ε p c + d x + e x 2 + f x 3 , ε ε p a, b, c, d, e, f: Fitting parameters;
ε p : Peak strain;
x: Normalized strain;
ε : Compressive strain.
Qiu et al. [3]
Publisher’s Note: MDPI stays neutral with regard to jurisdictional claims in published maps and institutional affiliations.

