Article

The Impact of Energy Renovation on Continuously and Intermittently Heated Residential Buildings in Southern Europe

1
Department of Mechanical Engineering, Aalto University, 02150 Espoo, Finland
2
Department of Civil Engineering, Tampere University, 33100 Tampere, Finland
3
Department of Architecture and Built Environment, University of Nottingham, Nottingham NG7 2RD, UK
4
FinEst Centre for Smart Cities, Tallinn University of Technology, 19086 Tallinn, Estonia
5
College of Urban Construction, Nanjing Tech University, Nanjing 210037, China
*
Author to whom correspondence should be addressed.
Buildings 2022, 12(9), 1316; https://doi.org/10.3390/buildings12091316
Submission received: 26 July 2022 / Revised: 22 August 2022 / Accepted: 24 August 2022 / Published: 27 August 2022
(This article belongs to the Section Building Energy, Physics, Environment, and Systems)

Abstract

:
To achieve carbon neutrality in the EU, it is important to renovate the existing EU residential buildings for a higher building energy efficiency. This study examines the impacts of several novel renovation technologies on energy consumption, CO2 emissions and indoor climates in southern European residential buildings through building-level simulations. Three typical residential buildings in South Europe were chosen as the demo buildings to implement the novel technologies. The technologies were classified into passive, ventilation and generation packages, and then simulated independently under the intermittent and continuous heating schedules. Additionally, two final combinations of renovation technologies were also simulated to demonstrate the maximum energy and CO2 emissions reduction potential of the demo buildings. All novel retrofit technologies manifested obvious effects on the energy consumption and CO2 emissions. Nevertheless, the effects were significantly affected by the heating schedule. When the intermittent heating schedule was switched to the continuous heating schedule, the relative energy conservation and CO2 emissions reduction potential of the thermal insulation improvement measures (e.g., bio-aerogel thermal insulation) increased, while those of the generation measures (e.g., solar assisted heat pump) diminished. Renovation with the final combinations reduced the primary energy consumption by up to 66%, 74% and 65% in the continuously heated Greek, Portuguese and Spanish demo buildings, the corresponding CO2 emissions reductions of which were 65%, 75% and 74%, respectively.

1. Introduction

Global warming as a result of greenhouse gas (GHG) emissions has become a focal topic of public debate over the past few decades. Around 75% of the global GHG emissions come from energy use [1]. Among numerous energy-consuming sub-sectors, the building sector is the greatest single contributor to global energy consumption and GHG emissions, accounting for about 40% of primary energy consumption and 33% of GHG emissions [2]. Thus, buildings have significant potential to achieve energy saving and GHG emission reductions.
To overcome the current environmental and energy challenges, it is important to improve building energy efficiency significantly. In the European Union (EU), the policy makers have realized the importance of building energy performance and published relative regulations, including the Energy Performance of Buildings Directive (EPBD) [3] and the Energy Efficiency Directive (EED) [4]. In addition to the requirement to improve the energy efficiency of new buildings, the energy efficiency regulations also require the implementation of energy efficiency measures in connection with major renovations. This encouraged more ambitious renovations in the existing stock of buildings, especially for those built prior to the oil crises and the rise of contemporary concerns about energy security and global warming. The latest proposal of the EPBD specifies that new buildings must be zero-emission buildings by 2030 and sets a target to achieve a zero-emission building stock by 2050 [5].
However, only 12% of the EU residential stock has been renovated to meet climate change targets, while 9% of the non-residential stock has been renovated to date [6]. Renovation rates of existing buildings are as low as only 1.2–1.4% per year in Europe, which cannot ensure the transition of the EU building sectors towards climate-neutral levels by 2050 [7]. Thus, the EU commission published its Renovation Wave Strategy to boost the renovations in 2020. It aims to double the annual energy renovation rates within the next 10 years and ensure that renovations lead to higher energy and resource efficiency, and 35 million buildings could be renovated by 2030. The renovation wave in the EU focuses on tackling energy poverty and the worst-performing buildings and decarbonizing heating and cooling [8].
Although the building stock is heterogeneous across Europe, one common feature is that residential buildings comprise the majority of the floor area in all the EU countries, the share of which varies from at least 60% to more than 85%. Residential buildings comprise 84%, 81% and 83% of the total floor area in Greece, Portugal and Spain, respectively. Around 38% of the EU residential building stock was built before the 1970s, when the first national thermal regulations were created, which means that a significant part of the EU residential buildings were built without taking thermal insulation performance as a primary consideration. In southern European countries, the proportion of residential buildings constructed before the 1970s in Greece, Portugal and Spain is on par or lower than the EU levels, being 31%, 38% and 31%, respectively [9].
Regarding the energy consumption levels of residential stocks, the average residential energy consumption is 184 kWh/m2a in the EU [9]. Specific to different southern European countries, the average residential energy consumption is 121 kWh/m2a, 70 kWh/m2a and 103 kWh/m2a in Greece, Portugal and Spain, respectively, which is much higher than nearly zero energy building (NZEB) energy performance level for residential buildings in the corresponding countries. To satisfy the NZEB energy performance levels, the existing residential buildings in Greece, Portugal and Spain would have to consume less than 75 kWh/m2a, 55 kWh/m2a and 50 kWh/m2a of non-renewable primary energy [10].
Thus, the EU residential stock reserves significant energy saving potential. Several studies on the building energy saving potential in southern European countries can be found in the literature. According to a study based on the Greek residential stock, if Greek residential buildings complied with the minimum requirement of the Hellenic Building Energy Performance Regulation (REPB), annual space-heating energy could be reduced by 63% to 70%, depending on the climate zones [11]. A case study illustrated that the primary energy consumption of a Portuguese stone masonry building could be reduced by around 52% by implementing energy retrofits according to the Passive House Certificate for retrofit (EnerPHit) requirements [12]. Another study assessed the potential of energy conservation measures for the Spanish building stock, and it showed that applying all energy conservation measures as a package offers a potential technical reduction in the final energy demand of 55% and a 65% reduction in CO2 emissions [13].
Building energy is significantly wasted nowadays due to outdated construction practices, the use of inefficient systems or appliances and a lack of effective technical control systems. To limit the energy waste, the renovation of the existing buildings could stem from demand-side management, supply-side management and energy consumption patterns [14].
In terms of demand-side management, the heating and cooling demands can be reduced by renovating the building fabric (e.g., installing thermal insulation panels) and windows (e.g., multiple glazing windows) and using advanced technologies such as window shading systems, etc. Compared with a conventional building, the energy saving potential of a well-insulated building varies from 50% to 90% depending on the type of building, climate conditions, construction year and thermal insulation level before renovation [15]. A study on the European residential stock showed that the improvement of the building shells of existing and new residential buildings provides a huge energy saving potential, which could amount to roughly 90 Mtoe by 2030 for all EU countries [16].
Regarding the performance of envelope retrofits in southern European climates, taking the renovation of three Albanian traditional houses in different cities as an example, when their exterior walls, windows and ceilings were well insulated by typical measures, the corresponding annual total energy demand was reduced by 36% to 46% depending on the outdoor temperature level of the buildings’ location [17]. According to a study based on the modelling of a renovation of a multi-family building in Portugal, if the building was insulated to fulfill the requirement of major renovations (Portaria 297/2019), the annual primary energy demand and CO2 emissions would be decreased by 33% and 26%, respectively [18]. Another study analyzing energy conservation potential in the Spanish building stock by modelling showed that insulating the floor, exterior wall, roof and windows to meet the standards of the building code in force could foster a reduction of around 40% in the final energy consumption of the Portuguese residential stock [13].
In addition, promoting energy-efficient equipment and low-energy technologies can also conserve building energy consumption from the demand side. The common technologies include heat recovery ventilation, energy-efficient lighting and appliances, the smart control of technical systems, thermal storage, etc. As a requirement of the Passivhaus standard [19], heat recovery ventilation is widely implemented in northern and central European countries. A study showed that ventilation heat recovery can reduce the primary energy consumption by a minimum of 20% in Germany and Sweden [20].
Due to climate differences, the impact of heat recovery ventilation on building energy consumption in southern European countries is much lower. A study on the Spanish residential building stock stated that the installation of ventilation systems with heat recovery capacities in the residential stock could lead to a 3% reduction in the final energy demand [13]. Additionally, the study also estimated the residential energy saving potential of the improvement of the efficiency of lighting or appliances, which would result in a 3% or 2% final energy demand reduction, which is lower than the maximum energy reduction potential (7%) offered by single retrofit technologies (e.g., thermal insulation of the floor), while the corresponding CO2 emissions could be reduced by 10% or 7%. Another study focusing on the case of multi-family buildings constructed from 1961 to 1980 in Portugal showed that replacing an old gas boiler with a more efficient gas-condensing boiler could bring about a 42% reduction of the annual primary energy demand and CO2 emissions [18].
Retrofit technologies for supply-side management consist of electric system retrofitting and the use of renewable energy as alternative energy sources to provide buildings with electricity and thermal energy. The common renewable energy sources (RES) applicable to the residential sector include bioenergy, solar, wind and low-enthalpy geothermal energy. To utilize the renewable energy in residential retrofits, the corresponding technologies, such as biomass boilers, solar thermal collectors, photovoltaic panels and wind turbine and ground-source heat pumps, may be taken into account [21].
The utilization of renewable energy in residential buildings has significant energy saving and carbon emission reduction potential for southern European countries. Mata et al. [13] analyzed the energy conservation potential of utilizing renewable energy in the Spanish residential stock through building-stock modelling. The study showed that the installation of solar collectors for hot water or the replacement of existing fuel boilers with biomass boilers with an efficiency of 90% could reduce the annual final energy demand of the residential stock by 7% or 5%, which is equal or close to the maximum energy conservation potential (7% reduction) brought about by insulating the floor, the external walls or the roof in the same study. The corresponding CO2 emissions were reduced by 7% after installing solar collectors and even 40% with more efficient biomass boilers.
In addition, a case study of a typical stand-alone family house in Greece also demonstrated the significant energy saving potential of RES systems in southern European climatic conditions [22]. In a Greek house, the conventional system consists of water radiators powered by a boiler, a split cooling unit and an electric heater for domestic hot water (DHW). These were replaced by a ground-source heat pump for heating/cooling and a solar thermal system with electric backup heating for DHW. The RES system realized an energy consumption reduction of 54% relative to the conventional systems.
Regarding the passive measures beneficial for heating and cooling demand reductions, bio-aerogel thermal insulation is more environmentally friendly than other thermal insulation materials on the market, while having a relatively good thermal insulation performance [23]. A PV vacuum window has thermal insulation properties similar to multi-glazing windows, and the integrated PV module can also produce electricity for a building’s internal usage [24]. The insulating breath membrane panels can not only improve the thermal insulation level of a building envelope, but also reduce heat loss through infiltration if they are installed over the building structure [25].
In terms of low-energy technologies, a room-specific air handling unit with heat recovery (RAHU) is an energy saving option, as a mechanical ventilation system, since it utilizes the excess heat of exhaust air to heat up the supply air [26].
As for the generation measures, a photovoltaic/thermal (PV/T) system is a power generation technology that converts solar radiation into usable thermal and electrical energy [27]. In addition, a solar-assisted heat pump (SAHP) is another option, which contains a heat pump and solar collectors acting as an evaporator in a single integrated system [28].
Although the studies verified the performances of these novel retrofit technologies individually, to the authors’ best knowledge, there is no research that combines them in different packages to assess their building-level performance.
In addition to renovating buildings through the building envelope or technical systems, changing occupant behaviors, such as a heating schedule, have significant impacts on building energy consumption, which can also be seen as energy renovation methods. Differently from the common continuous heating used in northern European countries, intermittent heating is more commonly used in Southern European countries. Either intermittent heating habits or the absence of heating are common in Portugal due to warm climate conditions, low incomes and expensive energy costs, as well as some cultural contexts and rooted habits [29]. In Greece as well, to reduce the operational costs, most of the residential building owners use their space-heating systems for only 3–4 h per day [30]. Correspondingly, the lower limit of acceptable indoor temperatures during the heating season in southern European countries is lower than that in Nordic countries. According to [31], the lower limit of accepted indoor temperatures is 18 °C in Portugal, which is lower than 20 °C in Finland, according to [32].
The simulation-based study conducted by Laskari et al. [33] revealed that heating schedules affect residential energy usage and indoor temperatures effectively. Several studies [11,12,13] proved that energy renovation measures and their packages have significant energy saving potential for the southern European residential stock. However, to the authors’ best knowledge, no scientific paper has discussed the heating schedules as an effective influencing factor in building energy efficiency achieved by renovation. Thus, the impacts of intermittent or continuous heating schedules on the energy conservation potential of different energy renovation technologies are still not fully understood or are oversimplified.
This study aims to analyze and present the impacts of energy renovation technologies and their combinations on building energy consumption, CO2 emissions and indoor climates through dynamic building simulations. Scientific research which evaluates the building-level performances of the novel retrofit technologies is still lacking. Thus, the novelty of this study is its assessment of the performance of several novel technologies and their combinations at the building level. Three typical residential buildings in Greece, Portugal and Spain were chosen as the demo sites to implement building-level simulations of retrofit technologies. The analysis focuses on the retrofit technologies that are not yet in the market. In the pre-study, the selected technologies were estimated to have a payback time less than 12 years. The actual cost efficacy was not included in this analysis. Moreover, the study focused mostly on reducing space-heating and DHW energy consumption, because the summer air room temperatures are still acceptable without mechanical cooling systems according to the test reference years’ weather data. Only one of the demo buildings was equipped with an air conditioning device. Based on these simulations with different heating schedules, this study also evaluated and quantified the impacts of intermittent or continuous heating schedules on the building energy efficiency achieved by energy renovation. In addition, as these demo sites cover three different types of residential buildings in southern Europe, this research can also play a guiding role in methods for choosing the most effective retrofit technologies for residential renovations under these climatic conditions.

2. Materials and Methods

2.1. Building Descriptions

To describe the demo buildings in the simulation software as accurately as possible, most of the properties of the building envelope and HVAC systems were defined based on either the input data sheets from the building owners or remaining unavailable data that came from the literature or online database TABULA WebTool [34].

2.1.1. Greek Apartment Building

The Greek apartment building is located in Peristeri, Athens. As shown in Figure 1, it is attached to two other buildings on the east and west sides. The ground floor is a workshop, and there are apartments on the first and second floors, which were constructed in the 1980s. Figure 2 shows the Greek apartment building model built for the simulation. All of these floors are included in the simulation model. There is no energy certificate for this building.
Regarding the building envelope, its façade was built with hollow bricks, containing a polystyrene layer in the middle of the external wall structure. The roof has an 8 cm coating of cement mortar for waterproofing. All the windows on the first apartment floor are single glazed, while the second apartment floor is equipped with double-glazed windows. Table 1 presents the detailed thermophysical properties of the building envelope. Since field tests of its airtightness were not implemented for this building, the air leakage rate of this demo building was given an assumed value based on the typical airtightness of Spanish residential buildings [35].
The first and second apartment floors of the Greek demo building are heated with an oil boiler and water radiator system, and the bedrooms and living rooms are equipped with split cooling units. The DHW is supplied by a low-pressure water system from a triple-energy boiler that also works flexibly with a solar collector and electricity. Table 1 shows further properties of the HVAC systems in this apartment building.

2.1.2. Portuguese Social House

The demo site in Portugal is a historic social house located in Lisbon. This social house was constructed in the 1970s, and it has two floors with an apartment on the first floor and the public social space on the second floor (see Figure 1). Figure 2 presents the Portuguese social house model built for the simulation. All these floors are included in the simulation model. This first-floor apartment consists of a bedroom, a living room, a kitchen and a bathroom. This house does not have any energy certificate.
Regarding the building envelope of this social house, there is no thermal insulation in the building envelope. Its façade was built with stone. The roof consists of a sloped light outer cover. All the windows are single glazed windows with wooden frames. The properties of the building envelope are shown in Table 1. As a field-tested value of the airtightness was not available, the same assumed air leakage rate of the Greek demo building was used for this demo house model.
In terms of the HVAC systems, all the living spaces are heated by portable electric heaters. There is no cooling system in the house. The DHW is supplied by a natural gas heater. This house is naturally ventilated but not adequate for maintaining a good indoor air quality according to the occupants’ feedback. Further properties of the HVAC systems are presented in Table 1.

2.1.3. Spanish Terraced House

The Spanish demo building is a terraced house with four apartments (see Figure 1), which is located in Valladolid. Each apartment consists of two residential floors, with a bedroom, a living room and a bathroom on the upper floor and a kitchen and a vestibule on the ground floor. There is also an unheated basement area below the residential section. Figure 2 shows the Spanish terraced house model built for the simulation. To speed up the simulation process, only two apartments were included in the simulation model.
Regarding the building envelope of this terrace house, its external walls and roof are not insulated at all. The windows include single-glazed windows and double-glazed windows. The properties of the building envelope are shown in Table 1. As a field-tested value of airtightness was not available, the same assumed air leakage rate of the Spanish demo building was used for this demo house model, which is equal to the typical airtightness of Spanish residential buildings [35].
In terms of the HVAC systems, each apartment is heated by an independent heating system, which are a mix of gas boilers and electric heaters. There is no cooling system. This house is naturally ventilated but not adequate for a good indoor air quality. Further properties of the HVAC systems are presented in Table 1.

2.2. Country-Specific Input Data

2.2.1. Weather Data

The weather data are presented with the typical climatological conditions of the studied cities (Athens, Lisbon and Valladolid) from ASHRAE IWEC2 Weather File. The data consist of the hourly outdoor air temperature, relative humidity, direct and diffused insolation and the wind speed and direction. The temperatures in these three cities are presented in Figure 3. The outdoor temperature in Valladolid is the lowest among all three cities. The outdoor temperature in Lisbon is more stable than that in Athens. The annual heating degree hours at an indoor temperature of 15.5 °C are 612.3 °Ch, 467.5 °Ch and 1577.8 °Ch in Athens, Lisbon and Valladolid, respectively. The heating design temperatures of Athens, Lisbon and Valladolid are 1.8 °C, 4.9 °C and −3.8 °C [36].

2.2.2. Primary Energy and CO2 Emission Factors

Primary energy is the metric used for building energy rating and minimum energy performance requirements for buildings in most EU countries. Correspondingly, to evaluate the energy performance of the demo buildings before and after renovation, the primary energy factors (PEFs) were introduced to convert the energy demand of the buildings into the primary energy demand. PEFs indicate how much primary energy is used to generate a unit of electricity or a unit of useable thermal energy. Table 2 shows the PEFs of different energy carriers in Greece, Portugal and Spain, which are slightly different according to their energy structures.
There is also a connection between energy consumption and CO2 emissions, which is reflected by a coefficient, the carbon emission factors. This illustrates how much CO2 is released when a unit of electricity or a unit of useable thermal energy is consumed. As shown in Table 2, the carbon emission factors of natural gas and oil in the three countries are similar, while the carbon emission factors of electricity are quite different depending on the proportion of fossil energy used for the power generation of the specified countries.
Based on the simulated purchased energy, the primary energy and CO2 emissions of the demo buildings were calculated using the primary energy and CO2 emission factors.

2.2.3. Occupant Behaviors

As user behaviors have a significant impact on building energy consumption and indoor climates, the usage profiles used for the simulations were defined based on building owners’ feedback or former experiences in order to ensure that the simulation results were close to the measured values.
To simulate the internal heat gain and CO2 concentrations at the building level accurately, the occupants’ numbers in the demo buildings were defined depending on the occupants’ feedback. The Greek, Portuguese and Spanish demo buildings were occupied by 8, 1, and 9 residents respectively. The occupancy schedules for different rooms were defined based on the occupants’ typical behavior and applied to all the demo buildings. In addition to occupants, lighting and equipment also affect internal heat gains significantly. In all the demo buildings, each room was equipped with a lighting device, the rated input of which was 7 W. The annual consumption of the equipment was normalized to 3.0 kWh/m2a.
The opening schedules for doors and windows affect air flows between rooms through the building envelopes significantly. Thus, defining appropriate opening schedules for doors and windows is essential for accurately simulating the energy consumption rates of existing demo buildings. The external doors were assumed to be always closed, while the internal doors were kept open. As occupants often open or close windows according to indoor climate conditions, an opening control macro was customized in the simulation of the demo buildings to reflect a typical usage of windows. The prerequisites of window opening included ambient temperature, room temperature, the occupancy schedule and indoor air quality. Windows would be opened when either of the following conditions were met: (1) The ambient temperature was in the range of 10–25 °C; the room temperature was in the range of 22.0–24.5 °C; or the room was occupied. (2) The indoor CO2 concentration was above 1800 ppm.
Operating schedules for the space-heating and cooling systems varied significantly in the existing demo buildings, as shown in Table 3. The two apartments in the Greek demo building were intermittently heated in winter, while bedrooms and living rooms in the apartments were intermittently cooled in summer. As for the Portuguese demo house, only the living room was intermittently heated for several months. The heating schedules in the Spanish demo house were much more complex. Each apartment floor had a different heating schedule, and the heating setpoint during the daytime was slightly higher than that during the nighttime. These heating schedules were integrated into their corresponding demo building models and used as the reference models with the intermittent heating schedules. In the reference models with continuous heating schedules, all the demo buildings were assumed to be heated continuously to 20 °C except in June, July and August. As shown in Table 4, the DHW consumption was concentrated in the morning and night, and the DHW usage schedule was applicable to all the demo buildings.

2.3. Description of the Analyzed Retrofit Technologies

The simulated retrofit technologies were classified into three retrofit packages, including the passive package, consisting of bio-aerogel thermal insulation, PV vacuum windows and phase change material (PCM); the ventilation package, consisting of an insulating breath membrane and room-specific air handling unit with heat recovery (RAHU); and the generation package, consisting of a photovoltaic/thermal (PV/T) system and solar-assisted heat pump (SAHP). As shown in Figure 4, the packages were integrated into the reference building models and simulated separately, while the simulation of the retrofit technologies in each package followed the rule of starting from a single technology and expanding to all technologies. According to the simulated impacts of the retrofit technologies on the building energy consumption and indoor climates, the final combinations of the retrofit technologies were prepared and simulated at the building level. Finally, the primary energy consumption and CO2 emissions were calculated with the country-specific primary energy and CO2 emissions factors based on the simulated purchased energy.

2.3.1. Passive Package

Bio-aerogel thermal insulation material is an environmentally friendly insulating material, which is made of starch-based aerogel [23]. Compared with more common thermal insulation material types, such as mineral wool or expandable polystyrene (EPS), it has a rather similar insulation performance, while having the characteristics of non-toxicity and biodegradability. The bio-aerogel thermal insulation material was used to create a prefabricated panel installed on the outside or inside of the external walls and roofs in this study. The detailed parameters of the bio-aerogel thermal insulation panel are presented in Table 5.
A PV vacuum window is a daylight-management apparatus with photovoltaic solar cells embedded in a window [24]. This kind of window can not only generate electricity during the daytime, but also decreases heat transfer through the windows due to its low U-value (see Table 5). To maximize the electricity generation of PV vacuum windows, they were installed only on the south façades of the demo buildings. The total areas of the PV vacuum windows were 11.2 m2, 1.1 m2 and 19.6 m2 in the Greek, Portuguese and Spanish demo buildings, respectively.
Phase change material (PCM) is a substance which releases and absorbs sufficient energy at the phase transition between solid and liquid to provide effective heating and cooling [37]. Thus, when PCM is utilized in building retrofits, it can be regarded as a passive cooling and heating method, since PCM can store/release extra indoor heat by the phase change. The PCM with a chosen phase change temperature is injected into sealed containers. The containers can be installed under the floor or ceiling in the actual installation. There are many PCM products with different phase change temperatures on the market. In this study, the PCM product S21, a salt hydrate, was chosen and treated as an independent PCM layer installed under the ceiling, further properties of which are presented in Table 5. To protect the PCM layer, it was encapsulated by aluminum plates (0.5 mm). Although the nominal melting temperature of S21 is 22 °C, the actual melting process starts at 18 °C, reaches its peak at 27 °C and ends at 36 °C [38]. Figure 5 shows the partial enthalpies during the melting and solidifying processes.

2.3.2. Ventilation Package

The insulating breath membrane is designed to improve the thermal performance of roofs and walls. It can protect insulation from air and water infiltration and enable water vapor to be evacuated if the membrane is installed on the outside of the building structure. Thus, the insulating breath membrane can be seen as a thermal insulating measure, which can also improve the airtightness of a building after retrofit. The breath membrane layer (26 mm) was installed on the external walls and roofs of the demo buildings, further details of which are presented in Table 6. According to the airtightness test results based on the standard EN 13859-2 [39], the air leakage rate of the breath membrane under a 50 Pa positive pressure difference is 0.16 m3/hm2 and 0.18 m3/hm2 under a negative pressure difference of 50 Pa. Since the air leakage rates of the demo houses after installing the breath membranes were not measured, two cases with different assumed air leakage rates were simulated in this study. For an ideal case, the tested air leakage rate of the breath membrane was assumed to be the air leakage rate of demo houses. In the other assumed case, the air leakage rate was the average of the original case and the ideal case, which may be closer to the real situation (see Table 6).
A room-specific air handling unit with heat recovery (RAHU) is an independent mechanical ventilation device installed above the windows [26]. It consists of heat pipes which transfer the heat of exhaust air to the supply air and fans. At the hot interface of the heat pipes, the volatile liquid inside turns into vapor by absorbing heat from the exhaust air. The vapor then travels back to the cold interface and condenses back into liquid by releasing the latent heat to heat the supply air. All rooms with window except the kitchens and bathrooms in the demo buildings were equipped with RAHU, and their ventilation rates were defined based on the NZEB Design Strategies for Residential Buildings in Mediterranean Regions [40], as shown in Table 7. The efficiency of the heat recovery depends on the air flow rates of ventilation systems.

2.3.3. Generation Package

A photovoltaic/thermal (PV/T) system converts solar radiation into usable thermal and electrical energy [27]. The system consists of a PV-T panel, hot water tank and backup heater. As the most important component of the PV/T system, the PV/T panel combines photovoltaic solar cells, which convert sunlight into electricity, with a solar thermal collector, which transfers the otherwise unused waste heat from the PV module to heat transfer fluid. In this study, maximizing the energy return within the limited installation space, the PV-T panel could produce roughly 80% of the output of the equivalent area of a flat plate solar thermal collector, and it also produced electricity. The maximum available area for the PV/T panel installation was used in the simulation to reduce the purchased energy as much as possible. The total areas of the PV/T panels in the Greek, Portuguese and Spanish demo buildings were 26 m2, 24 m2 and 10 m2 respectively. The size of the hot water tanks was established depending on the PV/T panel size. Additionally, an electric backup heater was integrated into the PV/T system, because there is a mismatch between the energy production of a PV/T panel and the building energy demand. Table 8 shows the detailed parameters of the PV/T systems for the different demo buildings.
A solar-assisted heat pump (SAHP) is a heat pump in which solar thermal collectors act as the evaporator in a single integrated system [28]. The solar collector operates more like an ambient heat exchanger than a solar thermal collector, because it also transfers heat from the ambient air through the convection. During times when solar radiation is not available, the SAHP acquires thermal energy from the ambient air. The SAHP was used for the space and DHW heating in the Greek and Spanish demo buildings, while it was only used for the DHW heating in the Portuguese demo building, since the electric heaters were used as the heating system. The existing boilers in all the demo buildings were reserved as the backup heaters. The solar thermal collector was placed on the roof of the demo buildings to maximize the utilization of the solar radiation. In order to cover as much of the heating demand as possible, the SAHP with the maximum thermal generation capacity was tested in the building-level simulations. Correspondingly, the largest available hot water tank was chosen. The volume of the hot water tanks were 0.42 m3, 0.42 m3 and 2 m3 in the Greek, Portuguese and Spanish demo buildings, respectively. The specific parameters of the SAHPs for the different demo buildings are presented in Table 8.

2.4. Building-Level Simulations

2.4.1. Simulation Tool

The dynamic simulation tool IDA Indoor Climate and Energy (IDA ICE) was chosen to simulate the demo buildings in this study. It is a platform enabling dynamic multi-zone simulations and the modelling of building characteristics including geometry, structures and technical systems. IDA ICE can accurately model the building, its systems, and controllers to provide the corresponding output of the building energy consumption, the indoor air quality and the thermal comfort. It was validated against the EN 15255-2007 and EN 15265-2007 standards [41]. The simulation tool has also been validated in several studies [42,43]. As building energy consumption and indoor climate data were required for this study, the IDA ICE was a suitable software for this task.

2.4.2. Modelling Principles of Novel Technologies

IDA ICE supports the detailed modelling of different renovation technologies. These novel technologies were simulated using the default standard IDA ICE models or the customized models based on them. The material properties or technical properties of each technology were used as input data for the models in the simulation.
The standard wall layer model was used to simulate the bio-aerogel thermal insulation and insulating breath membrane. The input data for the wall layer model included the layer thickness and material properties, including the thermal conductivity, density and specific heat. Additionally, while simulating the insulating breath membrane, the building airtightness was also redefined separately in order to model its impact on the air infiltration.
As for the simulation of the PV vacuum window, the standard window model and PV panel model with the same dimensions were utilized to simulate the passive properties and electricity generation capacity of the PV vacuum window, respectively.
A default PCM layer model was used to simulate the PCM in the study. IDA ICE uses the enthalpy method, which takes into account the hysteresis effect when modelling the PCM [44]. The hysteresis effect means that the PCM material has a solidification temperature that is different from the melting one [45]. The heat capacity was determined in the model as a function of the temperature and state of the PCM.
To simulate the RAHU, the standard air handling unit defined for a single room was utilized. In the air handling unit model, a recuperative heat exchanger model with the heat recovery efficiency of the developed RAHU was used to model the performance of the heat pipes.
Regarding the modelling of the PV/T system, the default solar thermal collector model and PV panel model of the same size were applied for modelling the PV-T panel in the system. The parameters of these two models were defined according to the technical properties of the chosen PV-T panel.
The simulation of the SAHP required a customized brine-to-water heat pump model, in which the evaporating side is connected to a standard solar collector model. The technical properties of the SAHP were used as the input data for these IDA ICE models. The part-load operation of the heat pump was taken into account.

3. Results

3.1. Reference Cases before Renovation

3.1.1. Intermittent Heating

Table 9 shows the breakdown of the purchased energy of the demo buildings before renovation, when they were intermittently heated based on their own schedules. Although the purchased energy levels varied in the different demo buildings, the purchased energy rates for the space and DHW heating accounted for the majority of the total purchased energy, which were 71%, 89% and 86% in the Greek, Portuguese and Spanish demo buildings, respectively. The specific proportion depended on the building envelope characteristics, heating setpoint, heating schedule, DHW consumption, etc. For instance, the proportion of the space- and DHW-heating demand in the Greek demo building was much lower than those in the other two demo buildings, because the existing heating systems utilize the solar heat through solar thermal collectors to cover the partial heating demand, and the heating time period in this demo building was the shortest among all the buildings. In addition, the electricity consumption of the equipment, lighting, and HVAC auxiliaries comprised about 10–30% of the total purchased energy in these demo buildings.
Table 9 also presents the calculated primary energy and CO2 emissions of the non-renovated demo buildings. The primary energy and CO2 emissions factors of electricity are much higher than those of fuel in the studied countries. The Portuguese social house consumed much more electricity than the Spanish terraced house. Thus, although the total purchased energy of the Portuguese social house was lower than that of the Spanish terraced house, the primary energy and CO2 emissions of the Portuguese social house were higher than those of the Spanish terraced house.
Regarding the indoor climate of the non-renovated demo buildings with intermittent heating, the simulated indoor temperature level and CO2 concentration were used to evaluate the thermal comfort and indoor air quality. As shown in Table 10, for over 40% of the time, the indoor temperature was lower than the heating setpoint 20 °C in the Greek and Portuguese demo buildings, which was much higher than that in the Spanish demo house, since the space-heating system could not heat the living spaces to the setpoint temperature during the limited heating period. The overheating problem in the Greek demo building was the worst among all the demo buildings, because the time in which the temperature was over 25 °C was concentrated in the summer daytime, when the cooling systems did not operate. As there was no mechanical ventilation system, for the majority of the time, the CO2 concentration was higher than 1200 ppm in all the demo buildings. Moreover, the CO2 concentration was lower than 1200 ppm for only 20% of the time due to the high occupancy density.

3.1.2. Continuous Heating

Table 11 shows the breakdown of the purchased energy of the demo buildings before renovation, when they were continuously heated from September to May. Compared with the purchased energy levels in the intermittently heated buildings (see Table 10), the energy consumption required for space heating increased dramatically, followed by the extended heating time, when the demo buildings were continuously heated. Subsequently, the share of the space- and DHW-heating demand of the total purchased energy further increased to 86%, 94% and 88% in the Greek, Portuguese and Spanish demo buildings, respectively. The electricity consumption of the equipment, lighting, and HVAC auxiliaries comprised about 6–14% of the total purchased energy in these demo buildings.
Based on the simulated purchased energy, the primary energy and CO2 emissions were also calculated and are shown in Table 11. The CO2 emission factor of the electricity in Greece is much higher than that in Spain. The Greek apartment building consumed similar levels of electricity to the Spanish terraced house. Therefore, although the total purchased energy of the Greek apartment building was lower than that of the Spanish terraced house, the level of CO2 emissions of the Greek apartment building was higher than that of the Spanish terraced house.
As the demo buildings were continuously heated from September to May, for over 90% of time, the indoor temperature was in the comfortable zone, from 20 to 25 °C, in all the demo buildings (see Table 12). Regarding the indoor air quality, for over half of the time, the CO2 concentration was over 1200 ppm in all the demo buildings.

3.2. Retrofit Package Simulations

3.2.1. Greek Apartment Building

Intermittent Heating

Table 13 shows the purchased fuel, electricity, primary energy and CO2 emissions in the intermittently heated Greek apartment building after renovation. Regarding the passive package, the bio-aerogel thermal insulation brought about a 15% reduction in both the primary energy use and CO2 emissions, since it can affect the space-heating demand significantly, while the installation of the PV vacuum windows and PCM only reduced the primary energy by 8% and 2%, the corresponding CO2 emissions reduction values of which were 8% and 1%.
As for the first step in the ventilation package, the installation of the breath membrane resulted in a 14% and 15% primary energy reduction, with the assumption of a 50% and 100% airtightness improvement. Considering the slight difference between the two cases, increasing the airtightness had only a minimal effect on the energy demand, implying that the main energy efficiency impact was derived from the improved thermal insulation. The RAHU had a negative effect on the primary energy consumption and CO2 emissions, increasing the primary energy by 7% and the CO2 emissions by 8%.
In terms of the generation technologies, the primary energy and CO2 emissions after installing the PV/T system were reduced by 26%, which was higher than the value of 14% after installing the SAHP. As the SAHP consumed more electricity than the PV/T system, and the CO2 emission factor is relatively high in Greece, the CO2 emissions after retrofitting with the PV/T system were 1% higher than they were before renovation. Thus, the final combination with the PV/T system resulted in a higher primary energy and CO2 emissions reduction rate (48%) in the Greek apartment building.
Comparing the changes to the indoor climate before and after renovating the intermittently heated buildings (see Table 10 and Table 13), the indoor temperature level grew higher after retrofitting the building envelopes (e.g., the bio-aerogel thermal insulation, breath membrane, etc.), which entailed better thermal comfort in winter and worse overheating issues in summer. Regarding the indoor air quality, installing the breath membrane brought about a higher CO2 concentration level due to the airtightness improvement, while the indoor CO2 concentration was controlled at a value always lower than 1200 ppm after renovating with the RAHU.

Continuous Heating

As shown in Table 14, the energy consumption and CO2 emissions reduction percentage after renovation was altered when the intermittent heating schedule was switched to a continuous heating schedule. As shown in Figure 6, the primary energy conservation potential of the bio-aerogel thermal insulation increased significantly to 43%, while the impact of the PV vacuum window or PCM on the primary energy was maintained at an 8% reduction or lowered to almost 0%.
Similar to the impact of the bio-aerogel thermal insulation, the primary energy reduction increased to 42% or 46% when the building airtightness was improved by 50% or 100% after retrofitting with the breath membrane. Then, the primary energy and CO2 emissions increased by 10% after installing the RAHU (see Figure 6 and Figure 7).
Regarding the generation measures, the impacts of the PV/T system and SAHP were a lowering of the primary energy to 17% and 11%, respectively.
Retrofitting with either of the final combination scenarios could reduce the total purchased energy by over 60%. However, as the primary energy factor and CO2 emission factor of electricity is incredibly high in Greece, and more electricity was consumed if the SAHP was chosen as the generation measure, the primary energy and CO2 emissions were only reduced by 54% and 46% after renovating with the final combination, including the SAHP.
Table 14 also shows the indoor climate after retrofitting with different renovation measures when the Greek apartment building was continuously heated. Almost all of the time, the indoor temperature was maintained in the range of 20–25 °C after renovation. The indoor air quality was similar to that when the building was intermittently heated.

The Effects of the Heating Schedule

The measures used to insulate the external walls and roof (the bio-aerogel thermal insulation and breath membrane) brought about a much higher energy saving and CO2 emissions reduction potential when the intermittent heating schedule was switched to the continuous heating schedule. As shown in Table 14, the indoor temperature was maintained at a similar level before and after renovation when the building was continuously heated. However, when the building was intermittently heated, the indoor temperature level improved gradually following the thermal insulation improvement. This means that the partial building energy efficiency effected by the renovation led to the improved temperature level.
In addition, when the intermittent heating schedule was switched to the continuous heating schedule, the energy conservation potential percentage of the generation measures was reduced. The capacity of the generation measures could not cover the increased heating demand due to the extended heating time. The backup heating demand increased dramatically in order to satisfy the heating demand. The share of backup energy in the total energy consumption became much higher than that of the utilized energy from the generation measures when the Greek apartment building was continuously heated.

3.2.2. Portuguese Social House

Intermittent Heating

As shown in Table 15, the retrofit technologies led to changes in the energy consumption and CO2 emissions of different levels in the Portuguese social house. Among all the retrofit technologies, the bio-aerogel thermal insulation had the largest impact on the building energy consumption and CO2 emissions, reducing the primary energy by 44% and CO2 emissions by 43%. In contrast, the PV vacuum windows and PCM had basically no impact on the energy conservation, as well as the CO2 emissions.
The impact of the breath membrane was similar to that of the bio-aerogel thermal insulation, resulting in a 38% and 37% reduction in the primary energy and CO2 emissions when the airtightness was improved by 50% and 39%, and a 38% reduction in the primary energy and CO2 emissions when the airtightness was improved by 100%. Installing the RAHU raised the primary energy and CO2 emissions by 11%, mainly due to the increased space-heating demand.
Regarding the generation measures, the PV/T system could produce electricity for the electric heaters, similar to the solar thermal system for the DHW heating, while the SAHP was only used for the DHW heating in the Portuguese social house. Thus, the installation of the PV/T system led to a 16% primary energy reduction and an 18% CO2 emissions reduction, which is much higher than the 4% primary energy reduction and 6% CO2 emissions reduction brought about by installing the SAHP.
Compared with the 46% primary energy and CO2 emissions reduction after retrofitting with the final combination including the SAHP, the impact of the final combination including the PV/T system was more effective in the Portuguese social house, reducing the primary energy and CO2 emissions by 58%.
In addition, Table 15 also presents the indoor temperature level and CO2 concentration after renovation. Compared with the indoor temperature level before renovation (see Table 10), the indoor temperature level improved markedly after retrofitting with the thermal insulation measures, especially the bio-aerogel thermal insulation and breath membrane.
However, covering the building envelopes with the breath membrane had a negative impact on the indoor air quality, and the proportion of the time when the CO2 concentration was below 1800 ppm fell to a minimum of 34% because of the improved airtightness. By comparison, installing an RAHU in each bedroom and living room guaranteed that the CO2 concentration was always below 1200 ppm all year round.

Continuous Heating

Similar to the situation in the Greek apartment building, the energy conservation and CO2 emissions reductions brought about by certain technologies changed significantly when the Portuguese social house was continuously heated (see Table 16). As presented in Figure 8, the primary energy reduction acquired from the bio-aerogel thermal insulation reached 65%, while the impact of the PV vacuum windows and PCM on the primary energy was negligible.
In terms of the ventilation package, the primary energy and CO2 emissions reduction after renovating with the breath membrane increased to 60% and 59% when a 50% airtightness improvement was assumed (see Figure 8 and Figure 9). When the airtightness improvement was raised from 50% to 100%, the primary energy and CO2 emissions reduction only increased by 1%. With the breath membrane installed and the building airtightness raised to 100%, installing the RAHU led to a 10% increase in the primary energy and CO2 emissions.
As for the generation measures, replacing the existing gas boiler with the PV/T system or SAHP resulted in a 14% or 2% reduction in the primary energy consumed. Finally, retrofitting with the final combination including the PV/T system or SAHP reduced the primary energy by 74% or 65% and the CO2 emissions by 75% or 65%.
When the Portuguese social house was continuously heated, the thermal comfort level was improved compared to when it was intermittently heated. As shown in Table 12 and Table 16, at all times, the indoor temperature was maintained above the heating setpoint of 20 °C. The technologies in the passive and ventilation packages alleviated the overheating issue in the summer. The impact of the PCM on the energy consumption and CO2 emissions was negligible, while it lowered the maximum temperature by 0.5 °C. The indoor CO2 concentration levels before and after renovation were similar to those when the Portuguese social house was intermittently heated.
Thus, when the demo building was renovated with either final combination scenario, for almost all the time, the indoor temperature was maintained in the comfortable zone (20–25 °C) and the CO2 concentration was always below 1200 ppm.

The Effect of the Heating Schedule

If the intermittent heating schedule was switched to the continuous heating schedule in the Portuguese social house, the impacts of the thermal insulating measures on the energy consumption and CO2 emissions became more significant for the same reasons that explained the improvements in the Greek apartment building.
Additionally, the percentage of the energy conservation and CO2 emissions reduction potential of the generation measures was reduced following the heating schedule change. Regarding the PV/T system, even when more generated electricity was consumed by the electric heaters, due to the extended heating time, the share of the increased electricity consumption required for the space heating within the total energy consumption far exceeded that of the utilized PV production.
The SAHP was only used for DHW heating in the Portuguese social house. Following the increased space-heating demand, the proportion of the DHW heating within the total energy consumption decreased. This resulted in a decreased contribution of the SAHP to the energy conservation.

3.2.3. Spanish Terraced House

Intermittent Heating

Table 17 shows the changes in the energy consumption and CO2 emissions after renovating the Spanish terraced house with intermittent heating. As insulating the external walls and roof led to a dramatically decreased space-heating demand, the bio-aerogel thermal insulation had the greatest impact on the primary energy (40% reduction) and CO2 emissions (43% reduction) among all the retrofit technologies. The installation of the PV vacuum windows and PCM had a minor effect on the primary energy, resulting in a 6% and 1% reduction, respectively.
As the insulating breath membrane affects the thermal insulation performance of building envelopes and the building airtightness, covering the building envelopes with the breath membrane achieved a 33% primary energy reduction and 35% CO2 emissions reduction when a 50% airtightness improvement was assumed. When the airtightness improvement was 100%, the reduction percentage increased to 34% for the primary energy and 36% for the CO2 emissions. After installing the RAHU, the primary energy consumption increased by 8%, thus satisfying the increased space-heating demand caused by the higher ventilation rate.
Regarding the performance of the generation measures, the SAHP exhibited a higher energy conservation potential, with a 29% reduction in the primary energy, than the PV/T system. The primary energy and CO2 emissions were reduced by 64% and 66% after retrofitting with the final combination including the PV/T system, while the final combination including the SAHP brought about a 63% primary energy reduction and 72% CO2 emissions decrease in the Spanish demo.
As shown in Table 10 and Table 17, the indoor temperature levels before and after renovation were maintained at a similar level, because the daily heating time in the intermittent heating schedule was long enough to heat up the living spaces to the setpoint in the Spanish terraced house. As for the indoor air quality, the CO2 concentration in the Spanish terraced house was much lower than that in the other two demo buildings due to the lower occupancy density (see Table 10). Thus, even when the airtightness was improved after installing the breath membrane, the CO2 concentration was below 1800 ppm almost all of the time. Certainly, the installation of the RAHU could further improve the indoor air quality, maintaining the CO2 concentration below 1200 ppm all year round.

Continuous Heating

Table 18 presents the building energy consumption and CO2 emissions of the Spanish terraced house after renovation, when it was continuously heated. In terms of the passive package, the impact of the bio-aerogel thermal insulation and PV vacuum windows increased the reduction in the primary energy slightly to 42% and 7%, and to 45% and 6% for the reduction in CO2 emissions (see Figure 10 and Figure 11), while the PCM had almost no impact on the primary energy and CO2 emissions.
As for the impact of the insulating breath membrane, the primary energy and CO2 emissions were reduced by 35% and 37% when the airtightness was improved by 50%, and 36% and 38% when the airtightness was improved by 100%. Comparatively, the primary energy and CO2 emissions increased by 9% after installing the RAHU.
In terms of the generation measures, the installation of the PV/T system reduced primary energy consumption by 15% and the CO2 emissions by 14%. In contrast, the impact of the SAHP was much slighter, lowering the primary energy consumption by 15% and the CO2 emissions by 14%.
Finally, the final scenario including the PV/T system or SAHP led to a 63% or 65% reduction in the primary energy. The CO2 emissions were reduced by 65% or 75%, correspondingly.
Regarding the indoor thermal conditions, for almost all the time, the indoor temperature was maintained above 20 °C due to the heating schedule change (see Table 18). The overheating time and maximum indoor temperature decreased slightly after retrofitting with the technologies in the passive and ventilation package. The PCM had the greatest impact on the lowering of the maximum indoor temperature among all the technologies. The indoor CO2 concentration level after renovation was similar to that when the Portuguese social house was intermittently heated.

The Effect of the Heating Schedule

As the intermittent and continuous heating schedules were quite similar in the Portuguese terraced house, the primary energy and CO2 emission conservation potential of the thermal insulation measures only increased by 2–3% when the intermittent heating schedule was switched to the continuous heating schedule.
When the Spanish demo building was continuously heated, the primary energy and CO2 emissions reductions after renovating with the PV/T system were 4% and 9% lower than those when the intermittent heating was in place due to the increased backup heating demand. The primary energy and CO2 emissions reduction percentage achieved by the SAHP was maintained at the same level when the house was intermittently or continuously heated.

4. Discussion

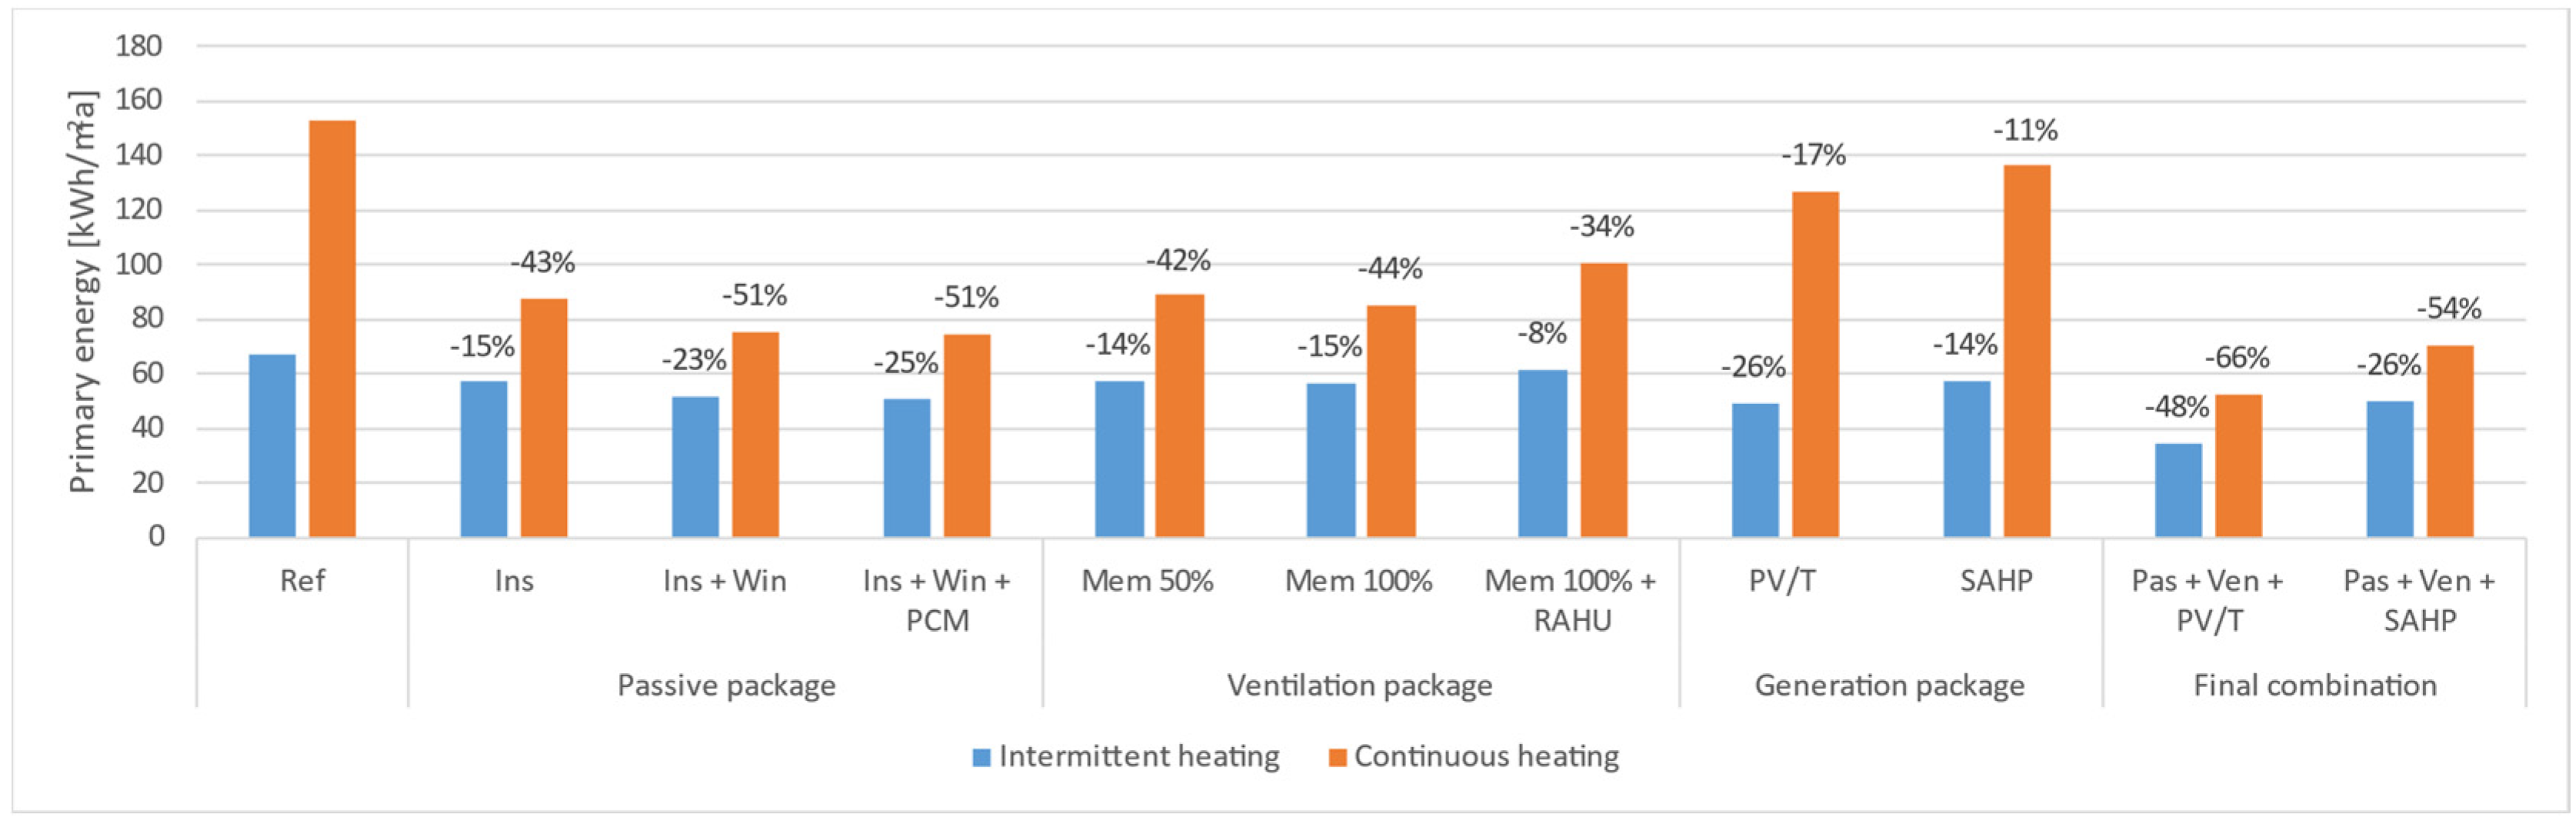
The simulation results of the renovation technologies in the demo buildings reveal the energy conservation and CO2 emissions reduction potentials of the novel technologies under southern European climate conditions. They are of great significance to the development of sustainable renovation concepts for southern European residential buildings based on these novel technologies. In addition, the comparison between the simulation results under the intermittent or continuous heating schedules shows how the heating schedule affects the energy conservation and CO2 emissions reduction achieved by the renovation technologies.
The residential buildings in northern European countries are commonly continuously heated, while intermittent heating schedules are more commonly used in southern European countries. According to the simulation results, this difference heating schedules has a significant impact on the reduction in the building energy consumption acquired by energy renovations. In the same building, the technologies in the passive or ventilation packages had a higher energy conservation potential when the building was continuously heated than when it was intermittently heated. When the residential buildings were continuously heated, the energy efficiency brought about by the passive or ventilation packages was fully reflected in the altered energy consumption, since the indoor temperature was maintained at a similar level before and after renovation. However, part of the energy efficiency achieved by the passive or ventilation packages was attributed to the increased temperature level when the continuous heating schedule was switched to the intermittent heating schedule.
Among the demo buildings analyzed in this study, only the Greek demo building was equipped with air conditioning devices for cooling. The cooling demand was unexpectedly low in this demo. The proportion of the time when the indoor temperatures were higher than 25 °C was 20.7%, 7.1%, and 11.9% in the Greek, Portuguese, and Spanish demo buildings, which were still within the acceptable range according to occupants’ feedback. The analysis in this study was based on the average weather data. It did not consider the exceptionally hot weather conditions, such as heat waves. Cooling is required in exceptionally hot situations. Global warming and heat waves are becoming stronger, longer and more frequent. Thus, thermal comfort and space cooling demand analyses should be carried out during heat waves for the sake of addressing health and comfort in future research.
The retrofit packages had varying degrees of impact on the building energy consumption. The passive package focused on reducing heat loss through the building envelope by installing the thermal insulation and changing windows, thereby reducing the space-heating demand, which accounts for the majority of the total energy consumption. In terms of the ventilation package, the space-heating demand was further reduced, since heat loss through the building envelope declined as a result of the thermal insulation and airtightness improvements, and the poor indoor air quality caused by the airtightness improvement was also resolved by the installation of the RAHU. In terms of the generation packages, the installation of the PV/T system or SAHP resulted in a considerable reduction in the energy consumption and CO2 emissions. To maximize the energy consumption and CO2 emissions reduction in the demo buildings, the renovation of the demo buildings with the final combinations of the retrofit technologies is recommended, as this guaranteed that the primary energy and CO2 emissions were reduced by over 60% when they were continuously heated.
In addition to energy consumption and CO2 emissions reduction, some retrofit technologies also affected the indoor climate significantly. As the indoor climate has a significant impact on the physical and mental health of occupants, it is important to take into account the changes to the indoor climate before and after renovation. When the existing demo buildings were intermittently heated, for a significant portion of the time, the indoor temperature was much lower than the space-heating setpoint. After insulating the external walls and roofs with bio-aerogel thermal insulation material or a breath membrane, the indoor temperature increased significantly. However, the airtightness improvement caused by installing the breath membrane also led to higher CO2 concentrations than the levels before renovation. Thus, it is essential to install the RAHU in order to lower the indoor CO2 concentrations when the breath membrane is used in the retrofitting.
Simulation is an ideal tool for assisting in decision-making when retrofit technologies and their sizing are being selected. However, when these technologies are applied in real projects, it may be impossible to implement all the technologies involved in the final combinations, as they were simulated in the building models in this study due to several reasons, such as budget limitations, historical building protections, etc. Thus, the priority of each technology in the renovation should be determined according to its impact on the energy consumption and indoor climate. The technologies in the passive package can be sorted in terms of priority in the order of bio-aerogel thermal insulation, PV vacuum windows and PCM. For the ventilation package, the insulating breath membrane is highly recommended for renovation due to its significant effect on the space-heating demand. Meanwhile, installing the RAHU is required in order to maintain a good indoor air quality after renovation with the insulating breath membrane. The PV/T system and SAHP are both suitable for residential renovations in the warm region of Europe. However, the best choice of generation measures depends on the on-site conditions of the demo buildings. The PV/T system is recommended for residential buildings heated by electric heating systems, while the SAHP is more suitable for residential buildings equipped with a hydronic heat distribution system (e.g., water radiators).
These renovation suggestions are only based on the simulation results, and it is not known whether the choice of a specified technology and the method for installing it will be affected by many other factors in the actual renovation, such as installation and maintenance costs, local regulations, etc. Since the Portuguese local regulations do not allow for the renovation of the outside of building facades, as in the case of the Portuguese demo house, the insulation panels can only be installed on the inside of the building facades, and the thickness should be reduced in order to reduce the budget and the occupation of living spaces. As these novel technologies will be applied in renovations, it is necessary to implement the investment analysis and life cycle cost calculation. However, the prices of some novel technologies have not yet reached a competitive level (e.g., the bio-aerogel thermal insulation), and the customer price of some novel technologies (e.g., the RAHU, SAHP) has not yet been determined for the studied countries. As the projects on which this study is based are further advanced, more detailed analyses, such as multi-objective optimizations, will be presented in the next relevant paper.
There are some limitations to the building-level simulations of retrofit technologies. The selected demo buildings are only examples of the existing residential building stock in South Europe. They cannot describe all the residential building stock’s possible features, such as heat transfer coefficients of building envelopes, implemented technical systems, renovation statuses, local weather conditions and microenvironments, usage and maintenance situations, etc. For the reference cases, not all input data of the demo building models were defined according to the existing demo buildings. Parts of the input data were specified based on assumptions, while some other data came from the literature. In terms of the retrofit package simulations, the parameters of several novel technologies came from the limited laboratory tests, which may differ from the values when they are applied in the renovations. The unavailable parameters of some components in the novel technologies, such as the parameters of the solar thermal collectors integrated into the SAHP, were defined according to similar products on the market or the built-in models in IDA ICE.

5. Conclusions

The main objective of this paper was to analyze and examine energy renovations with novel technologies in three representative residential buildings in the southern European countries. Additionally, it also revealed the impact of the heating schedule on the energy conservation and CO2 emissions reduction potentials of novel technologies. In the building-level simulations, the novel renovation technologies were divided into the passive, ventilation and generation retrofit packages, then simulated separately under the intermittent or continuous heating schedule in the modelling software IDA ICE. Finally, two different combination scenarios of the retrofit packages were also simulated to calculate the maximum energy conservation and CO2 emissions reduction potentials of all the demo buildings.
The dynamic simulation results show that all the retrofit technologies analyzed in this study have different effects on the building energy consumption and CO2 emissions. Among the technologies included in the passive package, insulating the external walls and roofs with bio-aerogel thermal insulation materials had the greatest impact on the primary energy consumption and CO2 emissions in the demo buildings, while the PV vacuum windows and PCM had a much smaller impact. In terms of the ventilation package, the insulating breath membrane had a similar impact on the primary energy and CO2 emissions to the bio-aerogel thermal insulation material in the demo buildings. In regard to the lowering of the indoor CO2 concentrations after installing the insulating breath membrane, the installation of the RAHU resulted in slightly increased primary energy consumption and CO2 emissions. Regarding the generation package, the PV/T system led to a considerable energy and CO2 emissions reduction in all the demo buildings. The impact of the SAHP on the primary energy and CO2 emissions in the Greek and Portuguese demo buildings was minor compared to that in the Spanish demo building.
Thus, to achieve a greater energy saving and CO2 emissions reduction, the bio-aerogel thermal insulation and insulating breath membrane are the most recommendable renovation measures. If the insulating breath membrane is used, it is necessary to install the RAHU to ensure good indoor air quality. In contrast, the PV vacuum window and PCM are less recommendable due to their minor effects on the energy consumption and CO2 emissions. The choice of generation technologies depends on the actual conditions of the buildings, such as the type of existing heating system.
As for the maximum primary energy and CO2 emissions reduction in the demo buildings, the final combination including the PV/T system brought about a 66% and 74% reduction in the primary energy and a 65% and 75% reduction in the CO2 emissions in the Greek and Portuguese demo buildings. The final combination including the SAHP reduced the primary energy by 65% and the CO2 emissions by 74% in the Spanish demo building.
The energy and CO2 emissions conservation potential of the retrofit technologies was significantly affected by the heating schedules applied to the demo buildings. The energy conservation potential of the thermal insulating measures, such as the bio-aerogel thermal insulation and insulating breath membrane, was enhanced when the intermittent heating schedule was switched to the continuous heating schedule in the demo buildings. Most of the time, the indoor temperature was maintained at the heating setpoint in the continuously heated demo buildings. Nevertheless, when the buildings were intermittently heated, for a considerable portion of the time, the indoor temperature was lower than the heating setpoint due to the shortened heating period. Even during the heating period, the indoor temperature may not reach the heating setpoint. Therefore, although the thermal insulation was improved significantly after renovation, the space heating system still worked at a relatively high power to approach the heating setpoint. The space heating demand did not reduce as much as that in the continuously heated building. The thermal insulation improvement resulted in an indoor temperature increase in the intermittently heated demo buildings.
However, the relative energy and CO2 emissions reduction achieved by the generation technologies decreased when the intermittent heating schedule was switched to the continuous heating schedule. As the heating time extended, the space-heating demand increased significantly. The higher the space-heating demand was, the lower the proportion of the demand covered by the generation measures was and the higher the proportion of the back-up heating demand was. The energy and CO2 emissions conservation potential of the generation measures decreased following a higher share of the heating demand covered by the back-up heater.
The results and conclusions of this study can be generalized to similar climates and buildings when deep renovations are conducted in the existing residential buildings.

Author Contributions

Conceptualization, J.J. and R.K.; data curation, Y.W.; investigation, Y.W. and J.H.; methodology, Y.W. and J.H.; project administration, R.K.; supervision, J.J. and R.K.; validation, Y.W. and J.H.; visualization, Y.W. and J.H.; writing—original draft, Y.W.; writing—review & editing, Y.W., K.Q., J.J. and R.K. All authors have read and agreed to the published version of the manuscript.

Funding

This study is part of the SUREFIT and FINEST Twins projects. The SUREFIT project is funded by the European Union (Horizon 2020 program, grant number: 894511). The FINEST Twins project is funded by the European Union (Horizon 2020 program, grant no. 856602) and the Estonian government.

Institutional Review Board Statement

Not applicable.

Informed Consent Statement

Not applicable.

Data Availability Statement

Not applicable.

Acknowledgments

The authors would like to thank the partners of the SUREFIT project, AMSolutions, Faculdade Santa Maria, ISQ Group, PCM Products and the University of Nottingham.

Conflicts of Interest

The authors declare no conflict of interest.

References

  1. A Global Breakdown of Greenhouse Gas Emissions by Sector. Available online: https://www.visualcapitalist.com/a-global-breakdown-of-greenhouse-gas-emissions-by-sector/ (accessed on 26 June 2022).
  2. Energy Efficency for Buidlings. Available online: https://www.euenergycentre.org/images/unep%20info%20sheet%20-%20ee%20buildings.pdf (accessed on 26 June 2022).
  3. EUR-Lex-32010L0031-EN-EUR-Lex. Available online: https://eur-lex.europa.eu/eli/dir/2010/31/oj/eng (accessed on 26 June 2022).
  4. EUR-Lex-32012L0027-EN-EUR-Lex. Available online: http://data.europa.eu/eli/dir/2012/27/oj/eng (accessed on 26 June 2022).
  5. EUR-Lex-02010L0031-20210101-EN-EUR-Lex. Available online: http://data.europa.eu/eli/dir/2010/31/2021-01-01/eng (accessed on 26 June 2022).
  6. Energy Efficiency of the Building Stock in the EU. Available online: https://www.rics.org/zh/news-insight/latest-news/news-opinion/energy-efficiency-of-the-building-stock-in-the-eu/ (accessed on 26 June 2022).
  7. A Renovation Wave. Available online: https://www.eurima.org/ (accessed on 26 June 2022).
  8. Renovation Wave Communication. Available online: https://ec.europa.eu/energy/sites/ener/files/eu_renovation_wave_strategy.pdf (accessed on 26 June 2022).
  9. EU Buildings Factsheets. Available online: https://ec.europa.eu/energy/eu-buildings-factsheets_en (accessed on 26 June 2022).
  10. D’Agostino, D.; Tzeiranaki, S.T.; Zangheri, P.; Bertoldi, P. Assessing Nearly Zero Energy Buildings (NZEBs) development in Europe. Energy Strateg. Rev. 2021, 36, 100680. [Google Scholar] [CrossRef]
  11. Gaglia, A.G.; Dialynas, E.N.; Argiriou, A.A.; Kostopoulou, E.; Tsiamitros, D.; Stimoniaris, D.; Laskos, K.M. Energy performance of European residential buildings: Energy use, technical and environmental characteristics of the Greek residential sector—Energy conservation and CO2 reduction. Energy Build. 2019, 183, 86–104. [Google Scholar] [CrossRef]
  12. Rodrigues, F.; Parada, M.; Vicente, R.; Oliveira, R.; Alves, A. High Energy Efficiency Retrofits in Portugal. Energy Procedia 2015, 83, 187–196. [Google Scholar] [CrossRef]
  13. Mata, É.; Medina Benejam, G.; Sasic Kalagasidis, A.; Johnsson, F. Modelling opportunities and costs associated with energy conservation in the Spanish building stock. Energy Build. 2015, 88, 347–360. [Google Scholar] [CrossRef]
  14. Ma, Z.; Cooper, P.; Daly, D.; Ledo, L. Existing building retrofits: Methodology and state-of-the-art. Energy Build. 2012, 55, 889–902. [Google Scholar] [CrossRef]
  15. Aditya, L.; Mahlia, T.M.I.; Rismanchi, B.; Ng, H.M.; Hasan, M.H.; Metselaar, H.S.C.; Muraza, O.; Aditiya, H.B. A review on insulation materials for energy conservation in buildings. Renew. Sustain. Energy Rev. 2017, 73, 1352–1365. [Google Scholar] [CrossRef]
  16. Lechtenböhmer, S.; Schüring, A. The potential for large-scale savings from insulating residential buildings in the EU. Energy Effic. 2011, 4, 257–270. [Google Scholar] [CrossRef]
  17. Dervishi, S.; Pashako, F.; Dushaj, X.; Dervishi, I.O. Energy performance optimization of traditional housing in Mediterranean climate. J. Build. Eng. 2022, 45, 103423. [Google Scholar] [CrossRef]
  18. Monzón-Chavarrías, M.; López-Mesa, B.; Resende, J.; Corvacho, H. The nZEB concept and its requirements for residential buildings renovation in Southern Europe: The case of multi-family buildings from 1961 to 1980 in Portugal and Spain. J. Build. Eng. 2021, 34, 101918. [Google Scholar] [CrossRef]
  19. Passive House Requirements. Available online: https://passiv.de/en/02_informations/02_passive-house-requirements/02_passive-house-requirements.htm (accessed on 26 June 2022).
  20. Fehrm, M.; Reiners, W.; Ungemach, M. Exhaust air heat recovery in buildings. Int. J. Refrig. 2002, 25, 439–449. [Google Scholar] [CrossRef]
  21. Canale, L.; Di Fazio, A.R.; Russo, M.; Frattolillo, A.; Dell’Isola, M. An Overview on Functional Integration of Hybrid Renewable Energy Systems in Multi-Energy Buildings. Energies 2021, 14, 1078. [Google Scholar] [CrossRef]
  22. Michopoulos, A.; Martinopoulos, G.; Papakostas, K.; Kyriakis, N. Energy consumption of a residential building: Comparison of conventional and RES-based systems. Int. J. Sustain. Energy 2009, 28, 19–27. [Google Scholar] [CrossRef]
  23. Nita, L.E.; Ghilan, A.; Rusu, A.G.; Neamtu, I.; Chiriac, A.P. New Trends in Bio-Based Aerogels. Pharmaceutics 2020, 12, 449. [Google Scholar] [CrossRef]
  24. Jarimi, H.; Qu, K.; Zhang, S.; Lv, Q.; Liao, J.; Chen, B.; Lv, H.; Cheng, C.; Li, J.; Su, Y.; et al. Performance Analysis of a Hybrid Thin Film Photovoltaic (PV) Vacuum Glazing. Future Cities Environ. 2020, 6, 1. [Google Scholar]
  25. Skytech-Pro-XL-Non-Combustible-and-Insulating-Breather-Membrane. Available online: https://www.winco-tech.com/wordpress/wp-content/uploads/2022/05/EN-WINCO-TDS-Skytech-Pro-XL-Non-combustible-and-insulating-breather-membrane-2.pdf (accessed on 26 June 2022).
  26. Barreto, G.; Qu, K.; Wang, Y.; Iten, M.; Riffat, S. An innovative window heat recovery (WHR) system with heat pipe technology: Analytical, CFD, experimental analysis and building retrofit performance. Energy Rep. 2022, 8, 3289–3305. [Google Scholar] [CrossRef]
  27. Das, D.; Kalita, P.; Roy, O. Flat plate hybrid photovoltaic- thermal (PV/T) system: A review on design and development. Renew. Sustain. Energy Rev. 2018, 84, 111–130. [Google Scholar] [CrossRef]
  28. Huang, B.J.; Chyng, J.P. Performance characteristics of integral type solar-assisted heat pump. Solar Energy 2001, 71, 403–414. [Google Scholar] [CrossRef]
  29. Magalhães, S.A.; de Freitas, V.P. A complementary approach for energy efficiency and comfort evaluation of renovated dwellings in Southern Europe. Energy Procedia 2017, 132, 909–914. [Google Scholar] [CrossRef]
  30. Dascalaki, E.; Balaras, C. Impacts on Indoor Thermal Comfort and Heating Energy Use in Hellenic Dwellings from Occupant Behavioral Reactions. Appl. Sci. 2021, 11, 6254. [Google Scholar] [CrossRef]
  31. Costa-Carrapiço, I.; González, J.N.; Raslan, R.; Sánchez-Guevara, C.; Redondas Marrero, M.D. Understanding thermal comfort in vernacular dwellings in Alentejo, Portugal: A mixed-methods adaptive comfort approach. Build. Environ. 2022, 217, 109084. [Google Scholar] [CrossRef]
  32. Ministry of the Environment. Decree (1009/2017) of the Ministry of the Environment on the Indoor Climate and Ventilation of New Buildings; Ministry of the Environment: Helsinki, Finland, 2017.
  33. Laskari, M.; de Masi, R.-F.; Karatasou, S.; Santamouris, M.; Assimakopoulos, M.-N. On the impact of user behaviour on heating energy consumption and indoor temperature in residential buildings. Energy Build. 2022, 255, 111657. [Google Scholar] [CrossRef]
  34. TABULA. WebTool. Available online: https://webtool.building-typology.eu/#bm (accessed on 26 June 2022).
  35. Feijó-Muñoz, J.; González-Lezcano, R.A.; Poza-Casado, I.; Padilla-Marcos, M.Á.; Meiss, A. Airtightness of residential buildings in the Continental area of Spain. Build. Environ. 2019, 148, 299–308. [Google Scholar] [CrossRef]
  36. ASHRAE. Climatic Design Conditions 2017. Available online: http://ashrae-meteo.info/v2.0/index.php?lat=53.00&lng=-1.25&place=%27%27&wmo=033540&ashrae_version=2017 (accessed on 26 June 2022).
  37. Wang, X.; Li, W.; Luo, Z.; Wang, K.; Shah, S.P. A critical review on phase change materials (PCM) for sustainable and energy efficient building: Design, characteristic, performance and application. Energy Build. 2022, 260, 111923. [Google Scholar] [CrossRef]
  38. PlusICE. Phase Change Materials. Available online: https://www.pcmproducts.net/files/thermal_storage_catalogue.pdf (accessed on 26 June 2022).
  39. EN EN-13859-2; Flexible Sheets for Waterproofing. Definitions and Characteristics of Underlays. Part 2: Underlays for walls. European Standard. European Committee for Standardization CEN: Brussels, Belgium, 2010.
  40. REHVA. NZEB Design Strategies for Residential Buildings in Mediterranean Regions; Design guideline Part 2; REHVA: Brussels, Belgium, 2021. [Google Scholar]
  41. Validation of IDA Indoor Climate and Energy 4.0 build 4 with respect to ANSI/ASHRAE Standard 140-2004. Equa Simulation AB. 2010. Available online: http://www.equaonline.com/iceuser/validation/ASHRAE140-2004.pdf (accessed on 26 June 2022).
  42. Dimitruk, P.; Schermelleh-Engel, K.; Kelava, A.; Moosbrugger, H. Challenges in nonlinear structural equation modeling. Method. Eur. J. Res. Methods Behav. Soc. Sci. 2007, 3, 100–114. [Google Scholar] [CrossRef]
  43. Björsell, N.; Bring, A.; Eriksson, L.; Grozman, P.; Lindgren, M.; Sahlin, P.; Shapovalov, A. IDA Indoor Climate and Energy. Build. Simul. 1999, 8, 1035–1042. [Google Scholar]
  44. Mazzeo, D.; Matera, N.; Cornaro, C.; Oliveti, G.; Romagnoni, P.; De Santoli, L. EnergyPlus, IDA ICE and TRNSYS predictive simulation accuracy for building thermal behaviour evaluation by using an experimental campaign in solar test boxes with and without a PCM module. Energy Build. 2020, 212, 109812. [Google Scholar] [CrossRef]
  45. Buonomano, A.; Guarino, F. The impact of thermophysical properties and hysteresis effects on the energy performance simulation of PCM wallboards: Experimental studies, modelling, and validation. Renew. Sustain. Energy Rev. 2020, 126, 109807. [Google Scholar] [CrossRef]
Figure 1. Outlook of the demo buildings.
Buildings 12 01316 g001
Figure 2. 3D models of the demo buildings in IDA ICE.
Buildings 12 01316 g002
Figure 3. The duration curve of yearly outdoor temperatures in Athens, Lisbon and Valladolid.
Buildings 12 01316 g003
Figure 4. Simulation of retrofit packages in IDA ICE.
Buildings 12 01316 g004
Figure 5. Melting and solidifying curves of the PCM product S21.
Buildings 12 01316 g005
Figure 6. Intermittent heating vs. continuous heating: simulated relative primary energy reductions after renovating the Greek demo building.
Buildings 12 01316 g006
Figure 7. Intermittent heating vs. continuous heating: simulated relative CO2 emissions reductions after renovating the Greek demo building.
Buildings 12 01316 g007
Figure 8. Intermittent heating vs. continuous heating: simulated relative primary energy reductions after renovating the Portuguese demo building.
Buildings 12 01316 g008
Figure 9. Intermittent heating vs. continuous heating: simulated relative CO2 emissions reductions after renovating the Portuguese demo building.
Buildings 12 01316 g009
Figure 10. Intermittent heating vs. continuous heating: simulated relative primary energy reductions after renovating the Spanish demo building.
Buildings 12 01316 g010
Figure 11. Intermittent heating vs. continuous heating: simulated relative CO2 emissions reductions after renovating the Spanish demo building.
Buildings 12 01316 g011
Table 1. Envelope and HVAC system properties of the demo buildings.
Demo BuildingGreek Apartment BuildingPortuguese Social HouseSpanish Terraced House
U-values of envelope [W/m2K]
External wall0.72.41.7
Roof3.93.81.6
External floor3.61.02.9
External door1.13.6/3.7/3.92.2
Windows5.9/35.15.8/2.8
g-value0.69/0.570.880.85/0.76
Solar transmittance0.62/0.540.830.83/0.7
Visible transmittance0.90/0.810.900.90/0.81
External window shadingMarquee--
Air leakage rate, n50 [ACH]6.76.76.7
Ventilation systemNatural ventilationNatural ventilationNatural ventilation
Exhaust air flow rate [L/s]---
Space heating systemOil boiler and water radiatorsPortable electric heaterGas boiler and water radiators
Design temperature of water radiators [°C]90/60-70/40
DHW heating systemSolar collector and boilerGas heaterGas boiler
DHW inlet/outlet temperature [°C]15/5515/4512/55
DHW use [L/day/person]5010026
Heating capacity of boiler [kW]65-65
Efficiency of boiler [%]81-81
Heating capacity of electric heater [kW]-1.2
Cooling systemSplit cooling unitsNoNo
Cooling capacity [kW]2.6/7--
Coefficient of performance3.1/5.6/6.1--
Table 2. Primary energy and CO2 emission factors in Greece, Portugal and Spain.
Energy CarrierGreecePortugalSpain
Primary energy factors [kWh/kWh]Natural gas1.0511.07
Oil1.11-
Electricity1.791.491.51
CO2 emissions factors [kg-CO2/MWh]Natural gas196204199
Oil264267-
Electricity572227190
Table 3. Intermittent heating and cooling schedules in the demo buildings.
Demo SiteLiving SpaceHeating Schedule
Greek apartment buildingThe whole apartment areaFrom 1 November to 31 March, 20 °C [7:00–9:00, 19:00–22:00]
Portuguese social houseLiving room in the ground apartmentFrom 1 December to 28 February, weekdays: 20 °C [7:00–8:00, 15:00–23:00], weekends and holidays: 20 °C [8:00–23:00]
Spanish terraced houseGround floorAll year round, 20 °C [14:00–23:00], 17 °C otherwise
Top floorAll year round, 18 °C [14:00–23:00], 17 °C otherwise
AtticFrom 1 October to 30 April, 20 °C [14:00–23:00]
Demo siteLiving spaceCooling schedule
Greek apartment buildingLiving rooms and bedrooms in the apartmentFrom 1 June to 30 September, 25 °C [19:00–24:00]
Table 4. DHW usage schedules in the demo buildings.
TimeDHW Usage Schedule
WeekdaysMax consumption [7:00–8:30, 20:00–22:00], half consumption [16:00–20:00]
Weekend and holidaysMax consumption [8:00–9:30, 20:00–22:00], half consumption [12:00–14:00, 16:00–20:00]
Table 5. Parameters of the bio-aerogel thermal insulation panel and PV vacuum window.
Retrofit TechnologyParameters
Bio-aerogel thermal insulation panelThermal conductivity [W/mK]: 0.037, density [kg/m3]: 43, specific heat [J/kgK]: 2260, thickness of thermal insulation panel [mm]: 50
PV vacuum windowSolar heat gain coefficient (SHGC): 0.42, solar transmittance: 0.3, visible transmittance: 0.65, U-value of glazing [W/m2K]: 0.6, efficiency of electricity generation [%]: 3.5
Table 6. Parameters of the insulating breath membrane.
Retrofit TechnologyParameters
Insulating breath membraneThermal conductivity [W/mK]: 0.029, density [kg/m3]: 96.15, specific heat [J/kgK]: 2260, air leakage rate (50% improvement) at 50 Pa [ACH]: 3.4, air leakage rate (100% improvement) at 50 Pa [ACH]: 0.07 (Greece), 0.15 (Portugal), 0.11 (Spain)
Table 7. Parameters of the RAHU in the demo buildings.
Demo SiteGreek Apartment BuildingPortuguese Social HouseSpanish Terraced House
Supply and exhaust airflow rate [L/s]Living room: 15/14
Bedroom: 8/7/4
Bedroom: 7
Social space: 24
Living room: 8
Bedroom: 5
Efficiency of heat recoveryLiving room: 0.64/0.66
Bedroom: 0.76
Bedroom: 0.76
Social space: 0.59
Living room: 0.76
Bedroom: 0.76
Table 8. Parameters of the retrofit technologies in the generation package.
Retrofit TechnologyParameters
PV/T systemConversion factor of solar thermal: 0.486, loss coefficient a1 [W/m2K]: 4.028, loss coefficient a2 [W/m2K]: 0.067, electricity generation efficiency: 0.13
SAHPTotal heating capacity [kW]: 11, COP: 4, dimension of each solar thermal collector panel [m]: 2.1 × 0.81, panel number: 4, conversion factor η0 of solar thermal collectors: 0.7, loss coefficient a1 of solar thermal collectors [W/m2K]: 4, loss coefficient a2 of solar thermal collectors [W/m2K]: 0.005
Table 9. Purchased energy, primary energy (kWh/m2a) and CO2 emissions (kg-CO2/m2) of the demo buildings before renovation with intermittent heating.
Demo SiteGreek Apartment BuildingPortuguese Social HouseSpanish Terraced House
Fuel heating total36.818.3115.0
Space heating + DHW36.8--
Space heating--99.2
DHW-18.315.7
Electricity total14.897.119.4
Equip + Light10.213.219.2
HVAC aux0.10.00.2
Space heating-83.9-
Space cooling4.5--
Total purchased energy51.6115.4134.4
Primary energy67.0163.0152.4
CO2 emissions18.228.326.6
Table 10. Indoor climates of the demo buildings before renovation with intermittent heating.
Demo SiteGreek Apartment BuildingPortuguese Social HouseSpanish Terraced House
Thermal comfort
Proportion of time when the indoor temperature is lower than the heating setpoint * [%]44.249.05.1
Proportion of time when the indoor temperature is higher than 25 °C [%]20.77.111.9
Maximum air temperature [°C]28.727.930.5
Indoor air quality
Proportion of time when the CO2 concentration is lower than 1200 ppm [%]20.334.241.3
Proportion of time when the CO2 concentration is lower than 1800 ppm [%]79.672.598.1
* Heating setpoint: 20 °C (Greece, Portugal), 18 °C (Spain).
Table 11. Purchased energy, primary energy (kWh/m2a) and CO2 emissions (kg-CO2/m2) of the demo buildings before renovation with continuous heating.
Demo SiteGreek Apartment BuildingPortuguese Social HouseSpanish Terraced House
Fuel heating total109.318.3145.5
Space heating + DHW109.3--
Space heating--129.8
DHW-18.315.7
Electricity total18.2210.819.4
Equip + Light10.213.219.2
HVAC aux0.80.00.2
Space heating-197.6-
Space cooling7.2--
Total purchased energy127.5229.1164.9
Primary energy152.8332.4185.0
CO2 emissions39.357.132.6
Table 12. Indoor climates of the demo buildings before renovation with continuous heating.
Demo SiteGreek Apartment BuildingPortuguese Social HouseSpanish Terraced House
Thermal comfort
Proportion of time when the indoor temperature is lower than 20 °C [%]0.60.00.1
Proportion of time when the indoor temperature is higher than 25 °C [%]0.07.19.9
Maximum air temperature [°C]25.027.930.5
Indoor air quality
Proportion of time when the CO2 concentration is lower than 1200 ppm [%]21.735.543.8
Proportion of time when the CO2 concentration is lower than 1800 ppm [%]79.773.398.2
Table 13. Energy consumption (kWh/m2a), CO2 emissions (kg/m2a) and indoor climate of the Greek apartment building after renovation, when it was intermittently heated.
Passive PackageVentilation PackageGeneration PackageFinal
Combination
InsIns + WinIns + Win + PCMMem 50%Mem 100%Mem 100% + RAHUPV/T SAHPPas + Ven + PV/TPas + Ven + SAHP
Oil total30.627.927.230.930.232.129.60.017.70.0
SH + DHW30.627.927.230.930.232.10.00.00.0 0.0
Backup heating 0.00.00.00.00.00.029.60.017.70.0
Electricity total13.011.711.513.113.114.69.432.08.427.8
Equip + Light10.28.68.610.210.210.24.810.24.79.1
HVAC aux0.10.10.10.10.11.40.20.10.91.2
Space cooling2.73.02.82.82.83.04.44.52.82.9
Heat pump0.00.00.00.00.00.00.017.20.014.6
Solar PV total 1.71.7 20.3 20.3
Used 1.71.7 9.3 9.8
Sold 0.00.0 11.0 10.5
Total purchased 43.639.638.744.043.346.739.032.026.127.8
Reduction [%]16%23%25%15%16%9%24%38%49%46%
Primary energy 56.951.650.557.456.761.449.457.334.549.8
Reduction [%]15%23%25%14%15%8%26%14%48%26%
CO2 emissions 15.514.113.815.715.516.819.118.39.515.9
Reduction [%]15%23%24%14%15%7%27%−1%48%13%
Indoor climate
T < 20 °C [%]40.234.334.340.039.242.544.144.233.533.2
T > 25 °C [%]19.824.424.619.922.019.520.720.725.125.1
T_max [°C]27.828.628.627.827.828.228.728.728.728.7
CO2 < 1200 [%]20.620.820.712.88.4100.020.220.3100.0100.0
CO2 < 1800 [%]79.980.880.666.446.2100.079.679.6100.0100.0
Ins: bio-aerogel thermal insulation; Win: PV vacuum window; PCM: phase change material; Mem: breath membrane; RAHU: room-specific air handling unit with heat recovery; PV/T: photovoltaic/thermal system; SAHP: solar-assisted heat pump; Pas: all the technologies included in the passive package; Ven: all the technologies included in the ventilation package; SH: space heating; DHW: domestic hot water; T < 20 °C/T > 25 °C: proportion of time when the indoor temperature is lower than 20 °C or higher than 25 °C; T_max: maximum air temperature; CO2 < 1200/1800: proportion of time when the CO2 concentration is lower than 1200 or 1800 ppm.
Table 14. Energy consumption (kWh/m2a), CO2 emissions (kg/m2a) and indoor climate of the Greek apartment building after renovation, when it was continuously heated.
Passive PackageVentilation PackageGeneration PackageFinal Combination
InsIns + WinIns + Win + PCMMem 50%Mem 100%Mem 100% + RAHUPV/T SAHPPas + Ven + PV/TPas + Ven + SAHP
Oil total56.546.645.957.354.264.899.261.735.713.1
SH + DHW56.546.645.957.354.264.80.00.00.00.0
Backup heating 0.00.00.00.00.00.099.261.735.713.1
Electricity total14.313.413.414.414.416.310.038.27.531.3
Equip + Light10.29.09.010.210.210.24.510.24.39.4
HVAC aux0.20.10.10.20.21.51.40.20.91.2
Space cooling3.94.34.34.04.04.64.17.22.34.8
Heat pump0.00.00.00.00.00.00.020.60.015.9
Solar PV total 1.71.7 20.3 20.31.6
Used 1.71.7 9.7 9.31.6
Sold 0.00.0 10.6 11.00.0
Total purchased 70.860.059.371.768.681.1109.299.943.244.4
Reduction [%]44%53%53%44%46%36%14%22%66%65%
Primary energy 87.775.274.588.885.4100.5127.0136.252.770.4
Reduction [%]43%51%51%42%44%34%17%11%66%54%
CO2 emissions 23.120.019.823.422.526.431.938.113.721.4
Reduction [%]41%49%50%40%43%33%19%3%65%46%
Indoor climate
T < 20 °C [%]0.90.10.00.60.50.50.00.60.40.4
T > 25 °C [%]0.00.00.00.00.00.00.00.00.00.0
T_max [°C]25.025.025.025.025.025.025.025.025.025.0
CO2 < 1200 [%]21.423.923.613.310.4100.022.021.7100.0100.0
CO2 < 1800 [%]80.281.981.767.248.6100.061.879.5100.0100.0
Table 15. Energy consumption (kWh/m2a), CO2 emissions (kg/m2a) and indoor climate of the Portuguese social house after renovation, when it was intermittently heated.
Passive PackageVentilation PackageGeneration PackageFinal Combination
InsIns + WinIns + Win + PCMMem 50%Mem 100%Mem 100% + RAHUPV/T SAHPPas + Ven + PV/TPas + Ven + SAHP
Gas total18.318.318.318.318.318.34.53.74.53.7
DHW18.318.318.318.318.318.30.00.00.00.0
Backup heating0.00.00.00.00.00.04.53.74.53.7
Electricity total49.549.248.755.354.366.888.5102.043.157.0
Equip + Light13.213.113.113.213.213.25.513.25.513.1
HVAC aux0.00.00.00.00.02.20.00.01.22.2
SH36.336.135.642.141.151.483.084.036.437.0
Heat pump0.00.00.00.00.00.00.04.80.04.7
Solar PV total 0.20.2 49.6 49.60.2
Used 0.20.2 8.7 9.60.2
Sold 0.00.0 40.9 400.0
Total purchased 67.867.567.073.672.685.193.0105.747.660.7
Reduction [%]41%42%42%36%37%26%19%8%59%47%
Primary energy 92.191.690.9100.799.2117.8136.4155.768.788.6
Reduction [%]44%44%44%38%39%28%16%4%58%46%
CO2 emissions 16.316.216.117.717.520.623.326.611.815.2
Reduction [%]43%43%43%37%38%27%18%6%58%46%
Indoor climate
T < 20 °C [%]33.533.633.936.736.942.949.249.138.638.4
T > 25 °C [%]2.72.20.03.83.92.07.07.10.20.5
T_max [°C]26.326.225.726.526.526.827.927.926.026.1
CO2 < 1200 [%]38.539.042.223.616.3100.034.234.1100.0100.0
CO2 < 1800 [%]75.575.776.261.633.6100.072.372.4100.0100.0
Table 16. Energy consumption (kWh/m2a), CO2 emissions (kg/m2a) and indoor climate of the Portuguese social house after renovation, when it was continuously heated.
Passive PackageVentilation PackageGeneration PackageFinal Combination
InsIns + WinIns + Win + PCMMem 50%Mem 100%Mem 100% + RAHUPV/T SAHPPas + Ven + PV/TPas + Ven + SAHP
Gas total18.318.318.318.318.318.44.53.74.63.8
DHW18.318.318.318.318.318.40.00.00.00.0
Backup heating0.00.00.00.00.00.04.53.74.63.8
Electricity total66.665.965.977.275.198189.8215.853.874.9
Equip + Light13.213.113.113.213.213.27.613.26.413.1
HVAC aux0.00.00.00.00.02.20.00.01.32.2
SH53.452.852.86461.982.6182.2197.846.154.9
Heat pump0.00.00.00.00.00.00.04.80.04.7
Solar PV total 0.20.2 49.6 49.60.2
Used 0.20.2 21.1 16.80.2
Sold 0.00.0 28.5 32.80.0
Total purchased 84.984.284.295.593.4116.4194.3219.558.478.7
Reduction [%]63%63%63%58%59%49%15%4%75%66%
Primary energy 117.5116.5116.5133.3130.2164.4287.3325.284.8115.4
Reduction [%]65%65%65%60%61%51%14%2%74%65%
CO2 emissions 20.620.420.423.322.728.548.955.414.519.7
Reduction [%]64%64%64%59%60%50%14%3%75%65%
Indoor climate
T < 20 °C [%]0.00.00.00.00.00.00.00.00.00.0
T > 25 °C [%]2.72.20.03.83.92.07.07.10.20.5
T_max [°C]26.326.225.726.526.526.827.927.926.026.1
CO2 < 1200 [%]39.540.043.224.316.3100.035.435.4100.0100.0
CO2 < 1800 [%]75.876.276.961.832.6100.073.373.2100.0100.0
Table 17. Energy consumption (kWh/m2a), CO2 emissions (kg/m2a) and indoor climate of the Spanish terraced house after renovation, when it was intermittently heated.
Passive PackageVentilation PackageGeneration PackageFinal
Combination
InsIns + WinIns + Win + PCMMem 50%Mem 100%Mem 100% + RAHUPV/T SAHPPas + Ven + PV/TPas + Ven + SAHP
Gas total58.051.150.268.167.277.597.145.633.15.9
SH + DHW58.051.150.268.167.277.597.145.633.15.9
Electricity total19.318.218.219.319.319.812.539.812.733.3
Equip + Light19.218.118.119.219.219.212.419.212.418.4
HVAC aux0.10.10.10.10.10.60.10.20.30.5
Heat pump0.00.00.00.00.00.00.020.40.014.4
Solar PV total 1.11.1 12.8 12.81.1
Used 1.11.1 6.9 7.01.1
Sold 0.00.0 5.9 5.80.0
Total purchased 77.2 69.3 68.4 87.4 86.5 97.3 109.6 85.4 45.8 39.2
Reduction [%]43%48%49%35%36%28%18%36%66%71%
Primary energy 91.182.181.2102.0101.0112.8122.8108.954.656.6
Reduction [%]40%46%47%33%34%26%19%29%64%63%
CO2 emissions 15.213.613.417.217.019.221.716.69.07.5
Reduction [%]43%49%49%35%36%28%18%37%66%72%
Indoor climate
T < 18 °C [%]0.0 0.0 0.0 4.6 0.0 0.2 5.1 5.1 0.0 0.0
T > 25 °C [%]11.4 10.1 10.5 12.4 12.0 9.9 11.7 11.8 8.3 8.3
T_max [°C]29.6 29.1 28.5 29.9 30.2 30.2 30.4 30.4 28.3 28.3
CO2 < 1200 [%]43.9 44.6 45.4 35.8 24.2 99.5 41.2 41.2 99.5 99.5
CO2 < 1800 [%]98.6 98.8 98.9 97.9 95.7 100.0 98.1 98.1 100.0 100.0
Table 18. Energy consumption (kWh/m2a), CO2 emissions (kg/m2a) and indoor climate of the Spanish terraced house after renovation, when it was continuously heated.
Passive PackageVentilation PackageGeneration PackageFinal
Combination
InsIns + WinIns + Win + PCMMem 50%Mem 100%Mem 100% + RAHUPV/T SAHPPas + Ven + PV/TPas + Ven + SAHP
Gas total72.262.962.184.583.697.9128.660.645.66.5
SH + DHW72.262.962.184.583.697.9128.660.645.66.5
Electricity total19.419.318.118.119.319.319.812.444.412.7
Equip + Light19.219.218.118.119.219.219.212.319.212.4
HVAC aux0.2 0.1 0.0 0.0 0.1 0.1 0.6 0.1 0.3 0.3
Heat pump0.00.00.00.00.00.00.00.024.90.0
Solar PV total 1.11.1 12.8 12.8
Used 1.11.1 6.9 7.0
Sold 0.00.0 5.9 5.8
Total purchased 91.5 81.0 80.2 103.8 102.9 117.7 141.0 105.0 58.3 44.2
Reduction [%]45%51%51%37%38%29%14%36%65%73%
Primary energy 106.4 94.6 93.8 119.6 118.6 134.7 156.3 131.9 68.0 63.9
Reduction [%]42%49%49%35%36%27%15%29%63%65%
CO2 emissions 18.0 16.0 15.8 20.5 20.3 23.2 27.9 20.5 11.5 8.5
Reduction [%]45%51%52%37%38%29%14%37%65%74%
Indoor climate
T < 20 °C [%]0.00.00.00.00.00.00.20.20.00.0
T > 25 °C [%]9.38.28.49.89.98.29.99.96.76.4
T_max [°C]29.629.128.530.230.230.230.430.428.428.3
CO2 < 1200 [%]47.048.349.436.724.598.443.943.998.498.4
CO2 < 1800 [%]98.898.999.097.996.5100.098.298.2100.0100.0
Publisher’s Note: MDPI stays neutral with regard to jurisdictional claims in published maps and institutional affiliations.

