Article

Developing Urban Heat Mitigation Strategies for a Historic Area Using a High-Fidelity Parametric Numerical Simulation: A Case Study in Singapore

Department of Architecture, National University of Singapore, Singapore 117566, Singapore
*
Author to whom correspondence should be addressed.
Buildings 2022, 12(9), 1311; https://doi.org/10.3390/buildings12091311
Submission received: 31 July 2022 / Revised: 20 August 2022 / Accepted: 22 August 2022 / Published: 26 August 2022

Abstract

:
The coexistence of developed areas and historic buildings is an important topic in urban planning. Our study focuses on this topic from the perspective of urban microclimate. A multi-physics CFD simulation is applied to model urban microclimate with anthropogenic heat and buoyancy effects. First, we clarified the impact of new development, i.e., high-rises on pedestrian-level air flow by comparing city structures in Case A (the past, 1960s) and Case B (the current, 2020s). The results showed an average wind speed decrease of 43% over time. Second, we assessed air temperature increments from anthropogenic heat emitted from Case C (high-rises), Case D (historic buildings), and Case E (both). We found that the mean air temperature increased by 0.16 °C for Case C, 0.52 °C for Case D, and 0.87 °C for Case E, respectively. Third, we developed heat mitigation strategies based on the assessment results in the previous steps. The integration of open spaces and building porosity, which create wind corridors together, can promote outdoor ventilation and heat dispersion in the study area. Compared with Case E, the three mitigation cases improve outdoor thermal environment, with mean temperature reductions of 33%, 25%, and 21%, respectively. Finally, we developed new mitigation strategies by considering the constraints in this special region, where modernity and history coexist. Our practical mitigation strategies will aid urban planning and support conservation efforts not only in Singapore, but also in other tropical and subtropical cities.

1. Introduction

Many cities have historic areas in their centers where historic buildings and a modern city context (i.e., high-rise buildings) coexist [1,2]. These historic areas are an important part of local tourism and cultural conservation [3,4]. Due to the economic and cultural significance of historic buildings, current measures for their conservation aim to keep their original form and allow occupancy of these buildings [5,6,7]. However, city centers tend to experience Urban Heat Island effect (UHI) due to factors arising from modern urban development such as high density, high-rise buildings and anthropogenic heat release [8,9,10,11,12]. The UHI phenomenon in city centers can lead to negative health impacts [13] for users of the historic area, especially tourists and occupants of the historic buildings. Therefore, a comprehensive method to improve the thermal environment of historic areas in city centers is needed that balances the users’ needs and architectural conservation. This study contributes to a better understanding of scientific and practical mitigation strategies for urban planning in historic areas in the process of urban development. Chinatown in Singapore is a typical area where historic shophouses and modern urban development coexist. Shophouses with two–three stories are the primary building form in Chinatown [14,15], whereas skyscrapers are dominant in other areas of the Central Business District (CBD) (Figure 1). Meanwhile, Singapore, one of densest cities worldwide, tends to suffer intense UHI effects [11,16,17,18,19]. Additionally, Singapore is in a tropical climate zone, and relies on air-conditioning (AC) for year-round thermal comfort [20]. The effect of anthropogenic heat from AC can be significant [10,12,21], especially in Chinatown, which is the densest city area of Singapore.
There are two main challenges regarding the thermal environment in Singapore’s Chinatown area. The first challenge is that the existing shophouses were designed to adapt to the functions and ambient environment of the past, without considering the use of AC systems which cause anthropogenic heat accumulation in the area [15]. The second one is the negative effect of surrounding high-rise buildings that have been constructed over the past 40 years. On the one hand, a large amount of AC-related anthropogenic heat emissions from skyscrapers can lead to localized temperature increases [10,11,22]. On the other hand, the blockage of airflow may result in anthropogenic heat not being readily removed [11]. Therefore, understanding heat dispersion within and around historic regions helps to improve future urban and architectural design.
Urban heat mitigation strategies can be implemented in newly built areas in or near existing historic regions in the process of urban development. Various mitigation strategies regarding urban morphology and anthropogenic heat have been proposed in previous studies. These strategies generally rely on modifying urban morphology to enhance airflow, and thus decrease the surrounding air temperature [23]. Some studies have proposed the recommended geometries of street canyons, one of the basic urban forms in a city [24,25]. In a high-density urban context, the effects of high-rise buildings are one of the main issues to explore. An earlier study from Priyadarsini et al. [17] suggested reducing the number of high-rise buildings to achieve a better thermal environment in street canyons. However, this does not appear possible in practice because a high-rise and high-density environment is an inevitable trend in Singapore due to the limited land availability [19]. This means that limiting the amount or the height of high-rise buildings in street canyons may not be an appropriate strategy. More practical suggestions have been provided by some later studies, focusing on the geometry of individual buildings. One useful strategy was proposed by Adelia et al. [22], which emphasized the importance of emission positions of outdoor AC units and building porosity in street canyons in Singapore residential areas. This study also indicated the positive impact of uniformity of building height, which concurred with studies by Erell & Williamson [26] and Kondo et al. [27]. Another strategy is from a study by Yuan et al. [28] who proposed using gaps between buildings with long façades in order to improve the wind environment on urban streets. These studies tend to focus on modifying building geometry to mitigate the localized UHI effect.
However, the above literature mainly focused on the localized effects of urban morphology and anthropogenic heat, such as in street canyons, while the effects of surrounding neighborhoods are overlooked. Therefore, there is a clear need to better understand the effects of urban morphology of both the historic area itself and the surrounding areas on the microclimate at the targeted historic area. Therefore, this study aims, firstly, to develop urban heat mitigation strategies for a historic area—Chinatown, Singapore—and secondly, to analyze the integrated effects of urban morphology and anthropogenic heat from both the historic shophouses and the surrounding high-rise buildings in the area. In this study, we conducted a high-fidelity CFD simulation to model the microclimate with anthropogenic heat and buoyancy effects and quantitatively investigate wind environment and air temperature increment in the Chinatown area.
The research structure is organized as follows. The design of scenarios for the numerical simulation and data analysis method are described in Section 2. In Section 3, the simulation results of all the cases are presented. Section 4 presents discussion on the effects of urban morphology and practical implications for historical areas. The main conclusions of this research and future study are presented in Section 5.

2. Methodology

This study comprised three steps. First, we compared the pedestrian-level air flow of the historic area in the 1960s and 2020s, considering the different urban and building forms of the Singapore CBD area in the past and current scenarios. In the second step, we compared the air temperature increment when involving the effects of anthropogenic heat due to air conditioning (AC) from both the surrounding high-rise buildings and the existing shophouses in the Chinatown area. The third step was to develop mitigation strategies based on the evaluation of results from the previous two steps. The mitigation strategies were developed from three aspects: focusing on the Chinatown area; focusing on the surrounding high-rise buildings; and integrating both strategies.

2.1. Simulation Scenarios Description

Eight parametric cases were simulated using CFD simulation: Five cases to investigate the impact of surrounding new development and anthropogenic heat due to AC on air flow and air temperature increment at the historic area as the first and second steps, and three cases to develop and evaluate mitigation strategies as the third step. As Table 1 and Figure 2a show, the first two cases represent the urban form in the study area in the 1960s (Case A) and 2020s (Case B). In these two cases, the effect of anthropogenic heat due to ACs was not considered because they were not widely used in the 1960s. Therefore, the impact of new high-rise buildings on the wind environment can be investigated by cross-comparing Cases A and B. The differences in anthropogenic heat dispersion among three cases at the second step (Cases C, D, and E) were mainly focused on anthropogenic heat emissions from ACs (Table 1 & Figure 2b). Specifically, at Case C, we only considered the anthropogenic heat due to ACs from the surrounding high-rise buildings. Case D only considers anthropogenic heat from shophouses in the historic area of Chinatown. In Case E, anthropogenic heat emission in both surrounding high-rise buildings and shophouses in the historic area were applied for simulation to represent the real scenario. Cases F, G, and H represent the proposed mitigation strategies (Table 1 & Figure 2c). The principle of the proposed mitigation strategies was to create a ventilation corridor by increasing porosity. In Case F, horizontal porosity was created by removing some shophouses. Case G focuses on the modification of the surrounding high-rise buildings to increase both vertical and horizontal porosity. The specific modifying methods in Cases F and G were based on the analysis of previous evaluation steps. Case H integrated the previous two methods into one case.

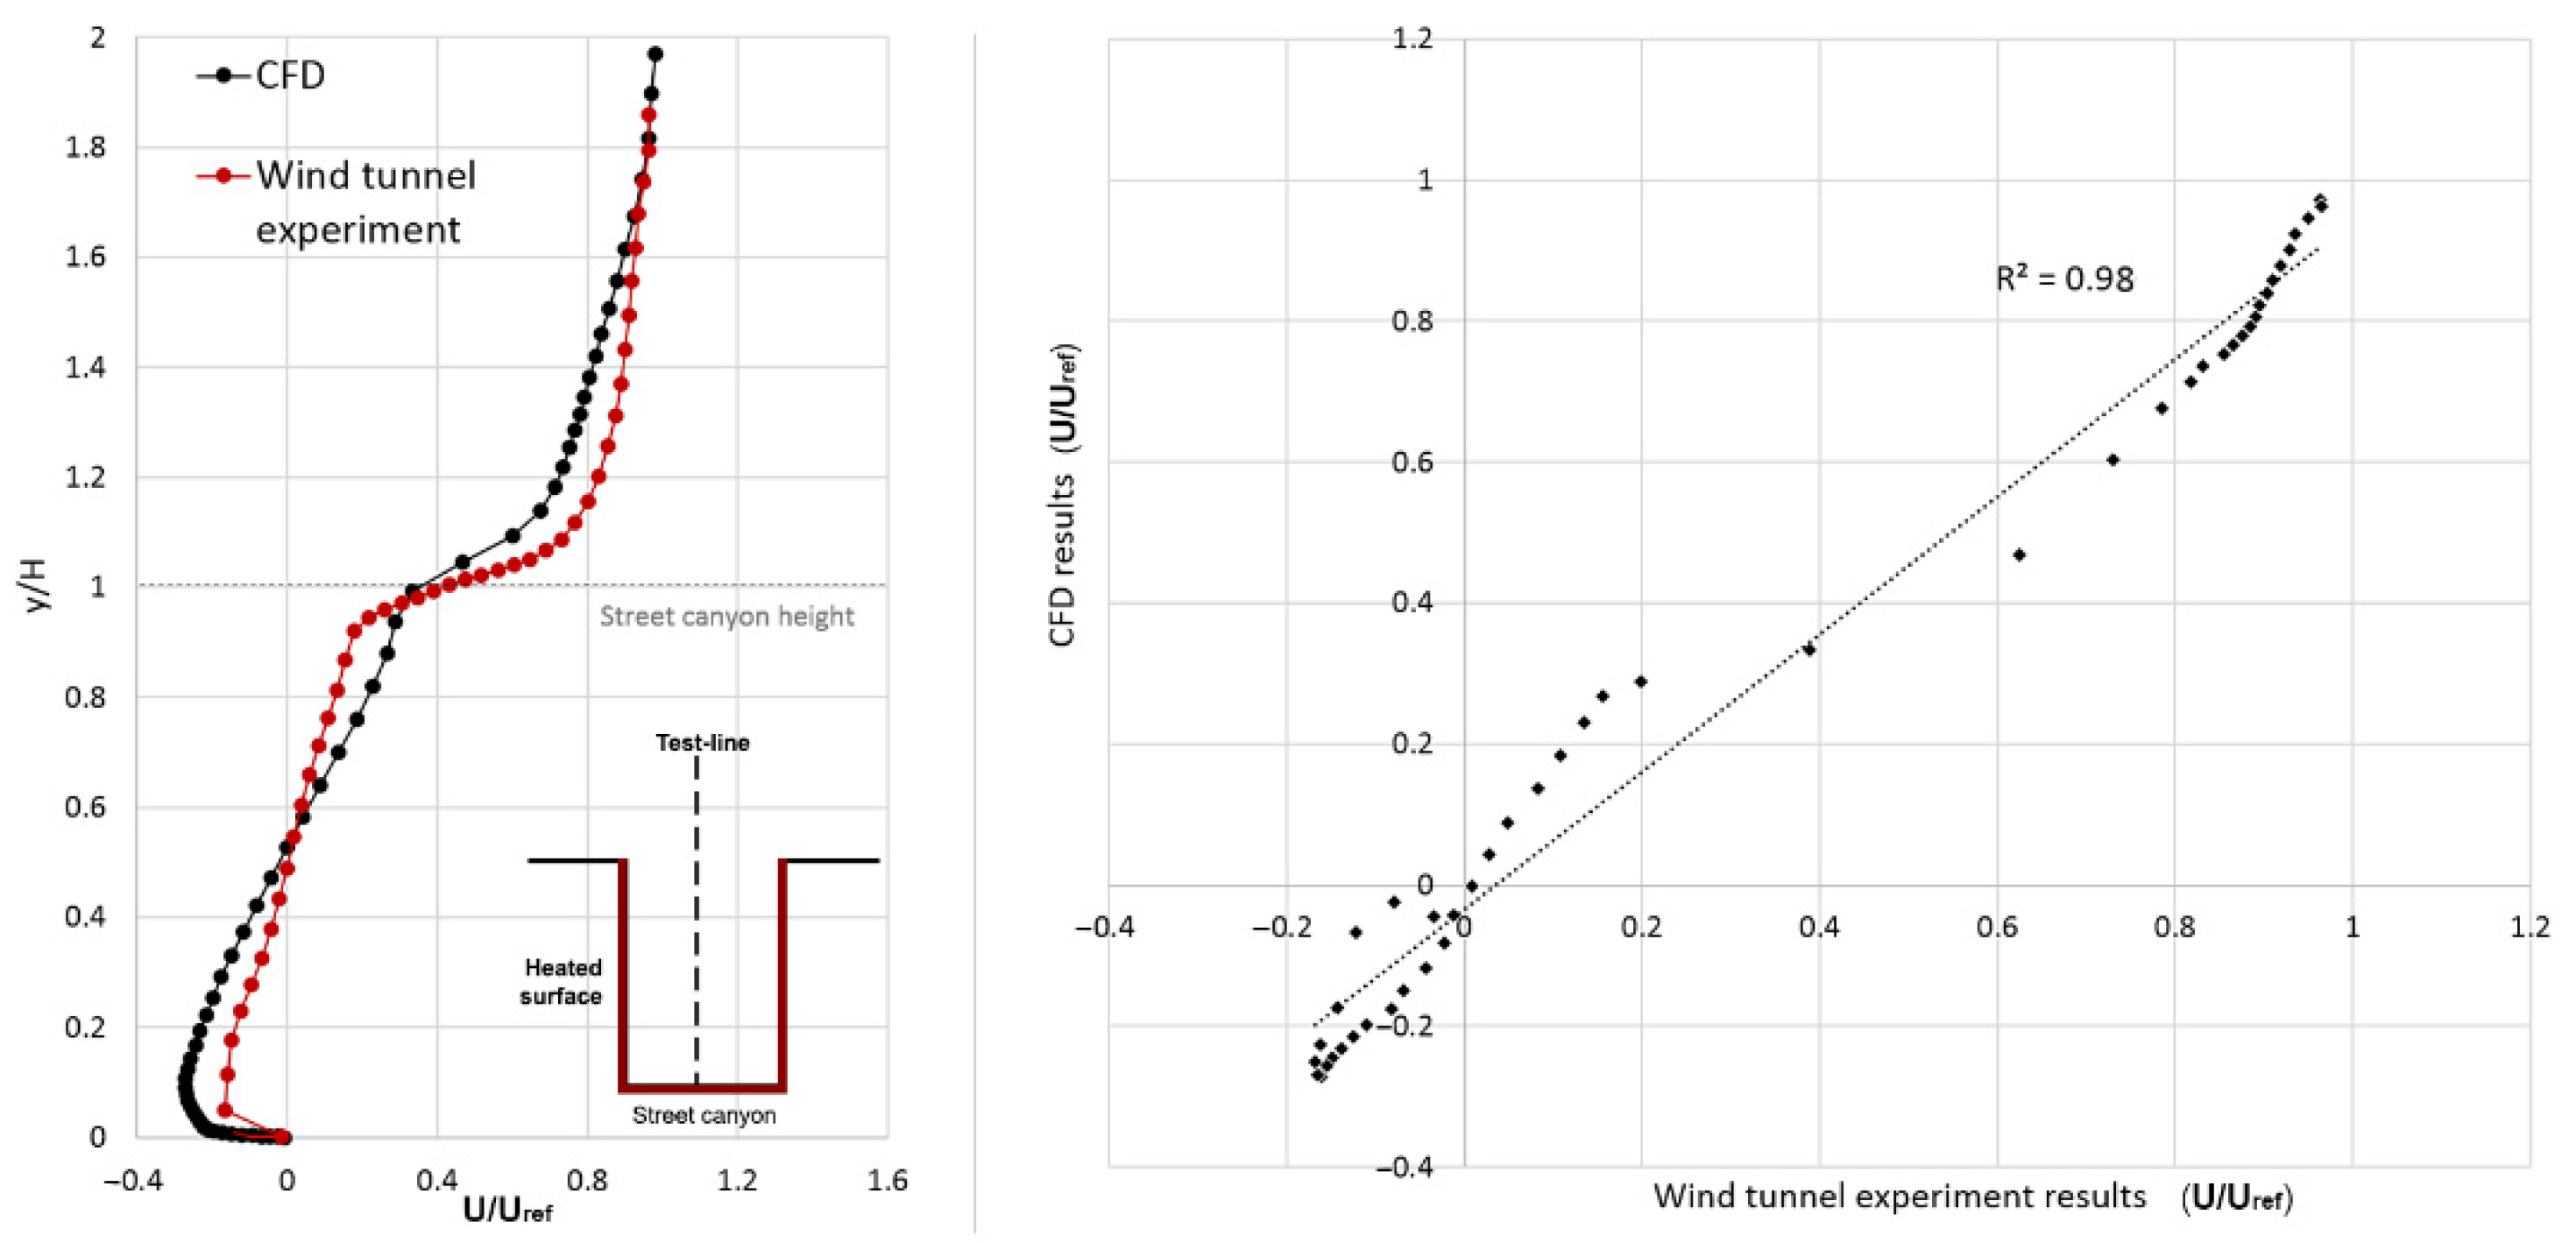
2.2. CFD Simulation Setup

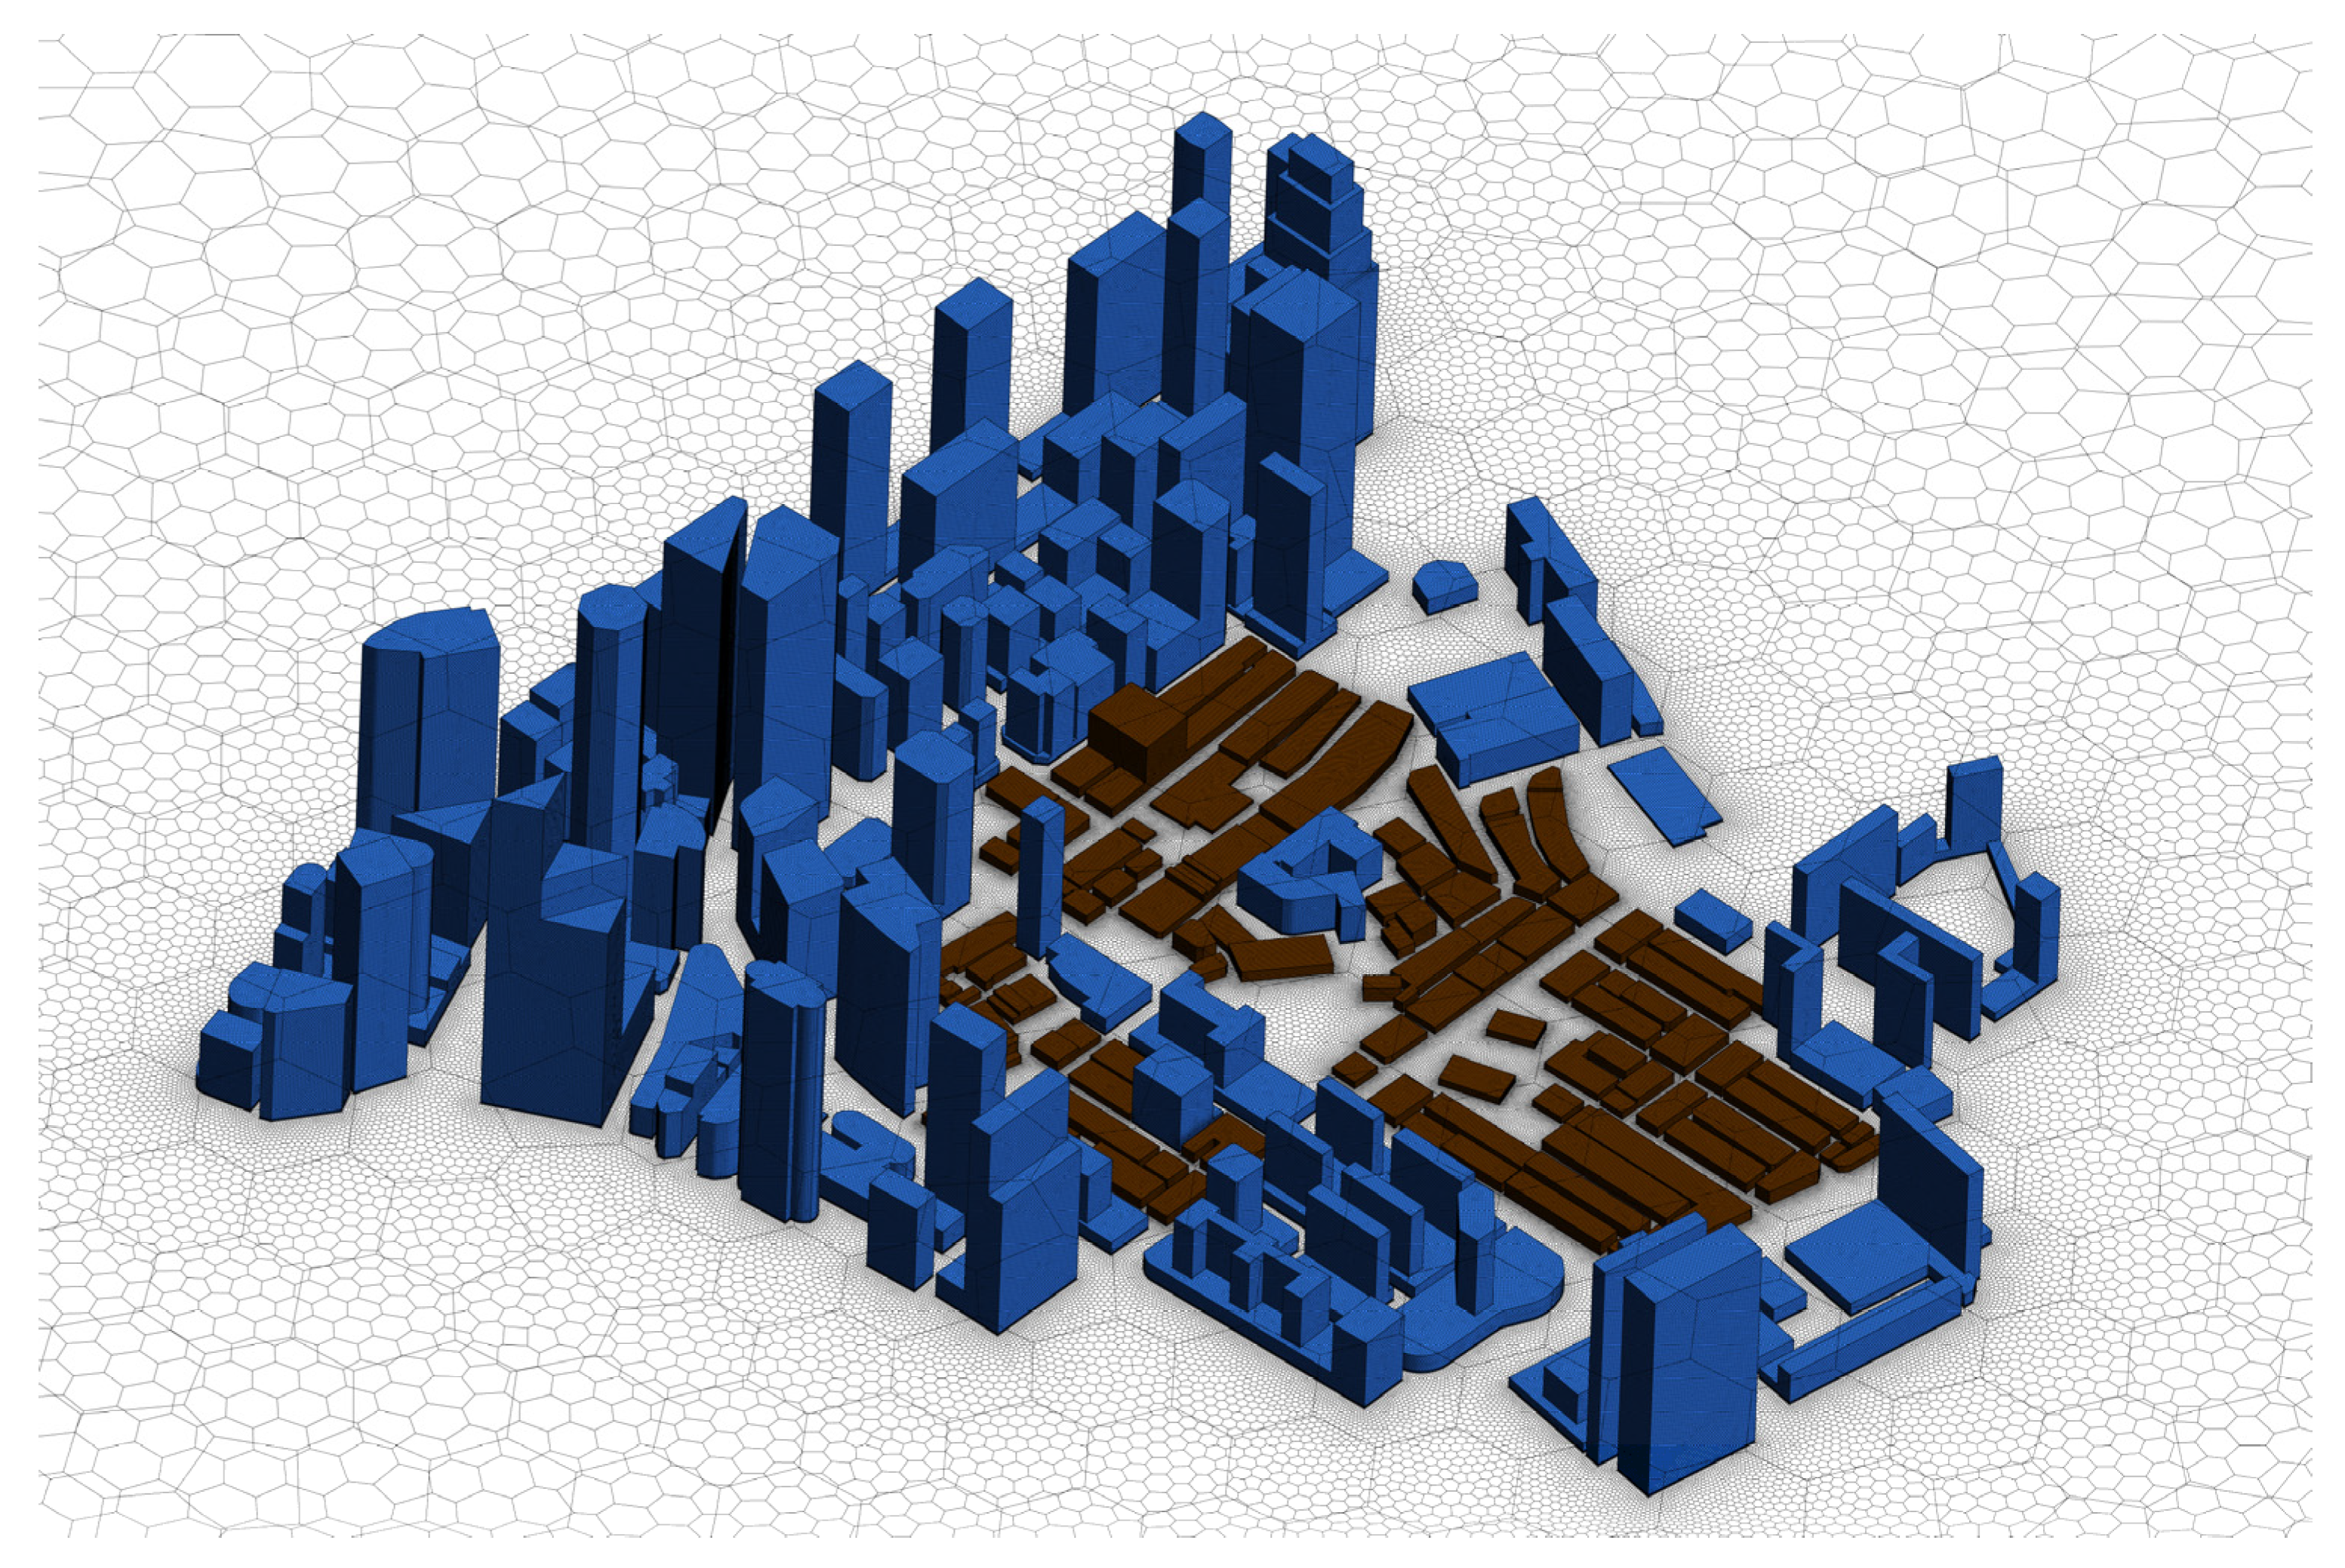
2.2.1. Computational Domain and Meshing

As shown in Figure 3, a simplified district model which represents the study area, was created and placed in the center of the computational domain. As suggested by Tominaga et al. [29], considering that maximum building height in the study area was approximately 33 m (Case A) and 280 m (Cases B–H), the domain heights were set as five times these heights, i.e., 165 m and 1400 m, respectively. The side dimensions were set at 15 times these heights, i.e., 495 m and 4200 m, respectively, which are the minimum dimensions for the inlet. Simulations were conducted with NE (northeast, i.e., the prevailing wind direction of Singapore [30], as the incoming wind direction. Figure 4 shows the applied mesh type is unstructured poly-hexcore mesh. We assigned the maximum size with 100 m for the less important area in the domain and 2 m for the surrounding high-rise buildings. In the targeted area with shophouses, we applied the maximum size as 1 m. In addition, we added four boundary layers with 1 m height for building walls. Taking Case B as an example, the average value of wall y+ of targeted buildings is around 250, which is well within the logarithm region.

2.2.2. Boundary Conditions

Table 2 summarized the CFD simulation settings. The bottom of the computational domain and building surfaces were set as a non-slip plane. Top side was set as symmetric plane. Regarding incoming wind speed, the annual average incoming wind speed, i.e., 7.6 m/s at 300 m above the ground, was applied in this study as a common scenario. Additionally, we used a power law equation for the incoming wind speed profile. Horizontal inflow velocity at the inlet of the computational domain reproduces an Atmospheric Boundary Layer (ABL) velocity profile, where the turbulence originates only from the friction and shear [31].
U ( z ) = u ABL κ ln ( z + z 0 z 0 ) .  
k ( Z ) = u ABL 2 C µ .  
ε ( Z ) = u ABL 3 κ ( z + z 0 ) .  
ω ( Z ) = ε ( Z ) C µ k ( z ) .  
In Equations (1)–(4), u ABL is the atmospheric boundary layer friction velocity, z is the height above the ground, z 0 = 0.5, which is the aerodynamic roughness length, κ = 0.42 and C µ = 0.09, which are constants of the turbulence model, U is the horizontal inflow velocity, k is the turbulence kinetic energy and ε and ω are the turbulence dissipation rate and specific dissipation rate respectively.
This study applied the SST k-ω model as the turbulence model, which has been validated by our team in a previous study [22]. In the validation, we compared the CFD simulation results and wind tunnel data from a study worked by Allegrini et al. [24]. All the simulation settings, i.e., domain configurations and boundary conditions, are the same as the ones at the wind tunnel experiment. The cross-comparison between simulation result using SST k-ω model and wind tunnel experiment shows there is a good agreement between SST k-ω and wind tunnel data, as Figure 5 shown. The validation results suggest the SST k-ω model can reproduce the mixed convection, caused by input air flow and buoyancy effect. Therefore, SST k-ω model was used in the simulation in this study.
The locations and geometries of AC condensers were set according to the real situation of the buildings in the study area. The buildings include two types of AC condensers, i.e., air-cooling and water-cooling. The air-cooling type was utilized in shophouses in Chinatown, residential buildings, and some office buildings in the surrounding area. The water-cooling type was the dominant type in retails, hotels, and office buildings in the surrounding area. Examples of locations and geometries of heat sources which represented the AC condensers in simulations are shown in Figure 6. AC condensers in the study area were set either on exterior walls or on the rooftop for both shophouses and surrounding high-rise buildings. Therefore, we modelled the AC condensers as vertical or horizontal stripes on exterior walls or blocks on the rooftop according to the real locations of the AC condensers in individual buildings.
Additionally, we need to apply the heat emission from AC condensers in the simulations to represent the impacts of anthropogenic heat from AC [10,32]. We applied the following equation to calculate the mass flow rate ( m a ) of heat emission from AC condensers [33]:
Q = m a c a Δ T .
Therefore, the mass flow rate ( m a ) is:
m a = Q c a Δ T
where Q is the anthropogenic heat from the AC condenser of each building, c a is the specific heat of air, and 1005 J/kg K. Δ T is the increase in air temperature from the background air temperature near the AC condensers. Accordingly, to determine the input amount of mass flow rate ( m a ), we also needed to determine the increase in air temperature from background air temperature near the condensers of AC, Δ T . Adelia et al. [22] and Yuan et al. [11] set m a as 0.245 kg/s, according to the study from Bojic et al. [34], and c a was set to 1.005 kj/kg.K, resulting in a Δ T of 13 °C. This value is in agreement with the 10–13 °C range of temperature increase near the condenser unit in Singapore measured by Bruelisauer et al. [35]. This study applied a Δ T of 13 °C for calculating the m a in our simulations.
In addition to the values of c a and Δ T , we need to estimate anthropogenic heat from the AC operation of each building ( Q ) . The anthropogenic heat from the AC condenser ( Q ) consists of the cooling loads ( Q c ) of buildings and the energy needed ( E c ) for AC operation [36]. Therefore, Q can be calculated as follows:
Q = Q c + E c ,   where   E c = Q c / COP ,   Q c = E c . COP
Thus ,   Q = Q c ( COP + 1 COP )
In this study, we calculated the anthropogenic heat emission for the different types individually, including retail buildings with air-cooling (shophouses); office and residential buildings with air-cooling; and retail, hotel, and office buildings with water-cooling. One of the differences between the air-cooling and water-cooling types is the ratio of sensible heat to the dispersed heat. The air-cooling type is considered as 100% sensible heat whereas the water-cooling type which applies to the cooling towers is normally approximately 75% of latent heat due to the evaporation effect and 25% of sensible heat [37,38]. Therefore, for the water-cooling type, the anthropogenic heat from one condenser unit is calculated as follows [36]:
Q = 0.25 Q c ( COP + 1 COP )
For commercial buildings, according to Version 3 of the Code for Environmental Sustainability of Buildings, issued in 2012, from the Building and Construction Authority (BCA) of Singapore, [39] the coefficient of performance (COP) of 4.2–4.29 (4.2 for multi-function areas, such as the lobby on the first floor and 4.29 for single function, such as offices above) is recommended for non-residential buildings when at full installed capacity. In this study, COP of 4.2 was applied. In addition, the design peak cooling load ( Q c ) was in the range of 100–180 W/m2 for office buildings, 120–260 W/m2 for hotels, and 250–350 W/m2 for retail buildings, according to the cooling load data obtained from the energy audit results during the operating hours, complied by the Building Construction Authority (BCA) and National Environment Agency (NEA). The dataset on the measured cooling load showed that the mean cooling load per air-conditioned floor area of office buildings (from 58 projects), hotels (from 32 projects), and retail buildings (from 28 projects), ranged from 54–100 W/m2, 40–98 W/m2, and 93–195 W/m2, respectively with mean values of 74 W/m2, 61 W/m2, and 130 W/m2, respectively [40]. Therefore, taking office building as an example, the average anthropogenic heat emission can be calculated as follows:
Q ¯ = Q c ¯ ( 4.2 + 1 4.2 )
In addition, Quah and Roth [10] measured and calculated the total anthropogenic heat flux of Q ¯ in commercial buildings in Singapore and showed that it ranged from 40–120 W/m2, with the largest mean hourly flux of 113 W/m2.
By understanding the average anthropogenic heat flux of Q ¯ , we can calculate the sensible heat Q as:
Q = Q ¯ A ,
where A is the gross floor area of the involved buildings.
In terms of residential buildings, the COP of the AC operation was set to 3.34 according to the energy label and tick rating of ACs operating in the apartments in Singapore [41]. Additionally, Q c is 2.5 kW per apartment in residential buildings, assuming one-split-AC operating in full-load capacity in each apartment unit. Q c values were found from Energy Efficient (E2) Singapore [42] and were calculated based on the total air-conditioned area [22]. Therefore, we can produce the result that Q A which represents anthropogenic heat from of each unit was 3.25 kW. Therefore, the total anthropogenic heat ( Q ) was calculated using equation as:
Q = Q A N
where Q A is 3.25 KW and N is the number of units in the residential buildings, and was calculated as:
N = ( 1 R p ) A G F A h ,
where A h is assumed as 80 m2 which is the typical area of one apartment unit in Singapore; and R p is the public area ratio which was assumed to be 20%. We calculated the gross floor area ( A G F ) as:
A G F = A F N F ,
where A F is the floor area of one building and N F is the number of floors of the building.
Table A1 at Appendix A shows a summary of the equations to calculate m a for different types of AC and building functions. By estimating the anthropogenic heat from the AC condenser ( Q ) with the above method, which has been applied in previous studies [11,12,22], we are able to calculate the m a for simulation input.

2.3. Data Analysis

The simulation’s outputs, including air temperature increment and wind speed, were exported for further comparison. Specifically, we selected 18 test lines where major visitors’ activities occurred: 13 test lines at the streets with both roadways and footways and 5 test lines at the roads with only footways (Figure 7). The test lines were selected from the middle of the streets, and average value within the analysis points from the selected test lines for each road were reported as a single value to represent their temperature increment and wind speed. The single temperature increment and wind speed values in each case scenarios were compared for further evaluation.

3. Results and Analysis

In this section, we presented the simulation results of proposed eight cases. Figure 8 shows the wind speed contours of Case A and Case B. Figure 9a presents the air temperature increment contours of Case C, D, and E. Figure 9b presents the air temperature increment contours of Case F, G, and H. The quantitative data, including wind speed and air temperature increment in each test line and the average value, are presented at Table A2 and Table A3 at Appendix B.

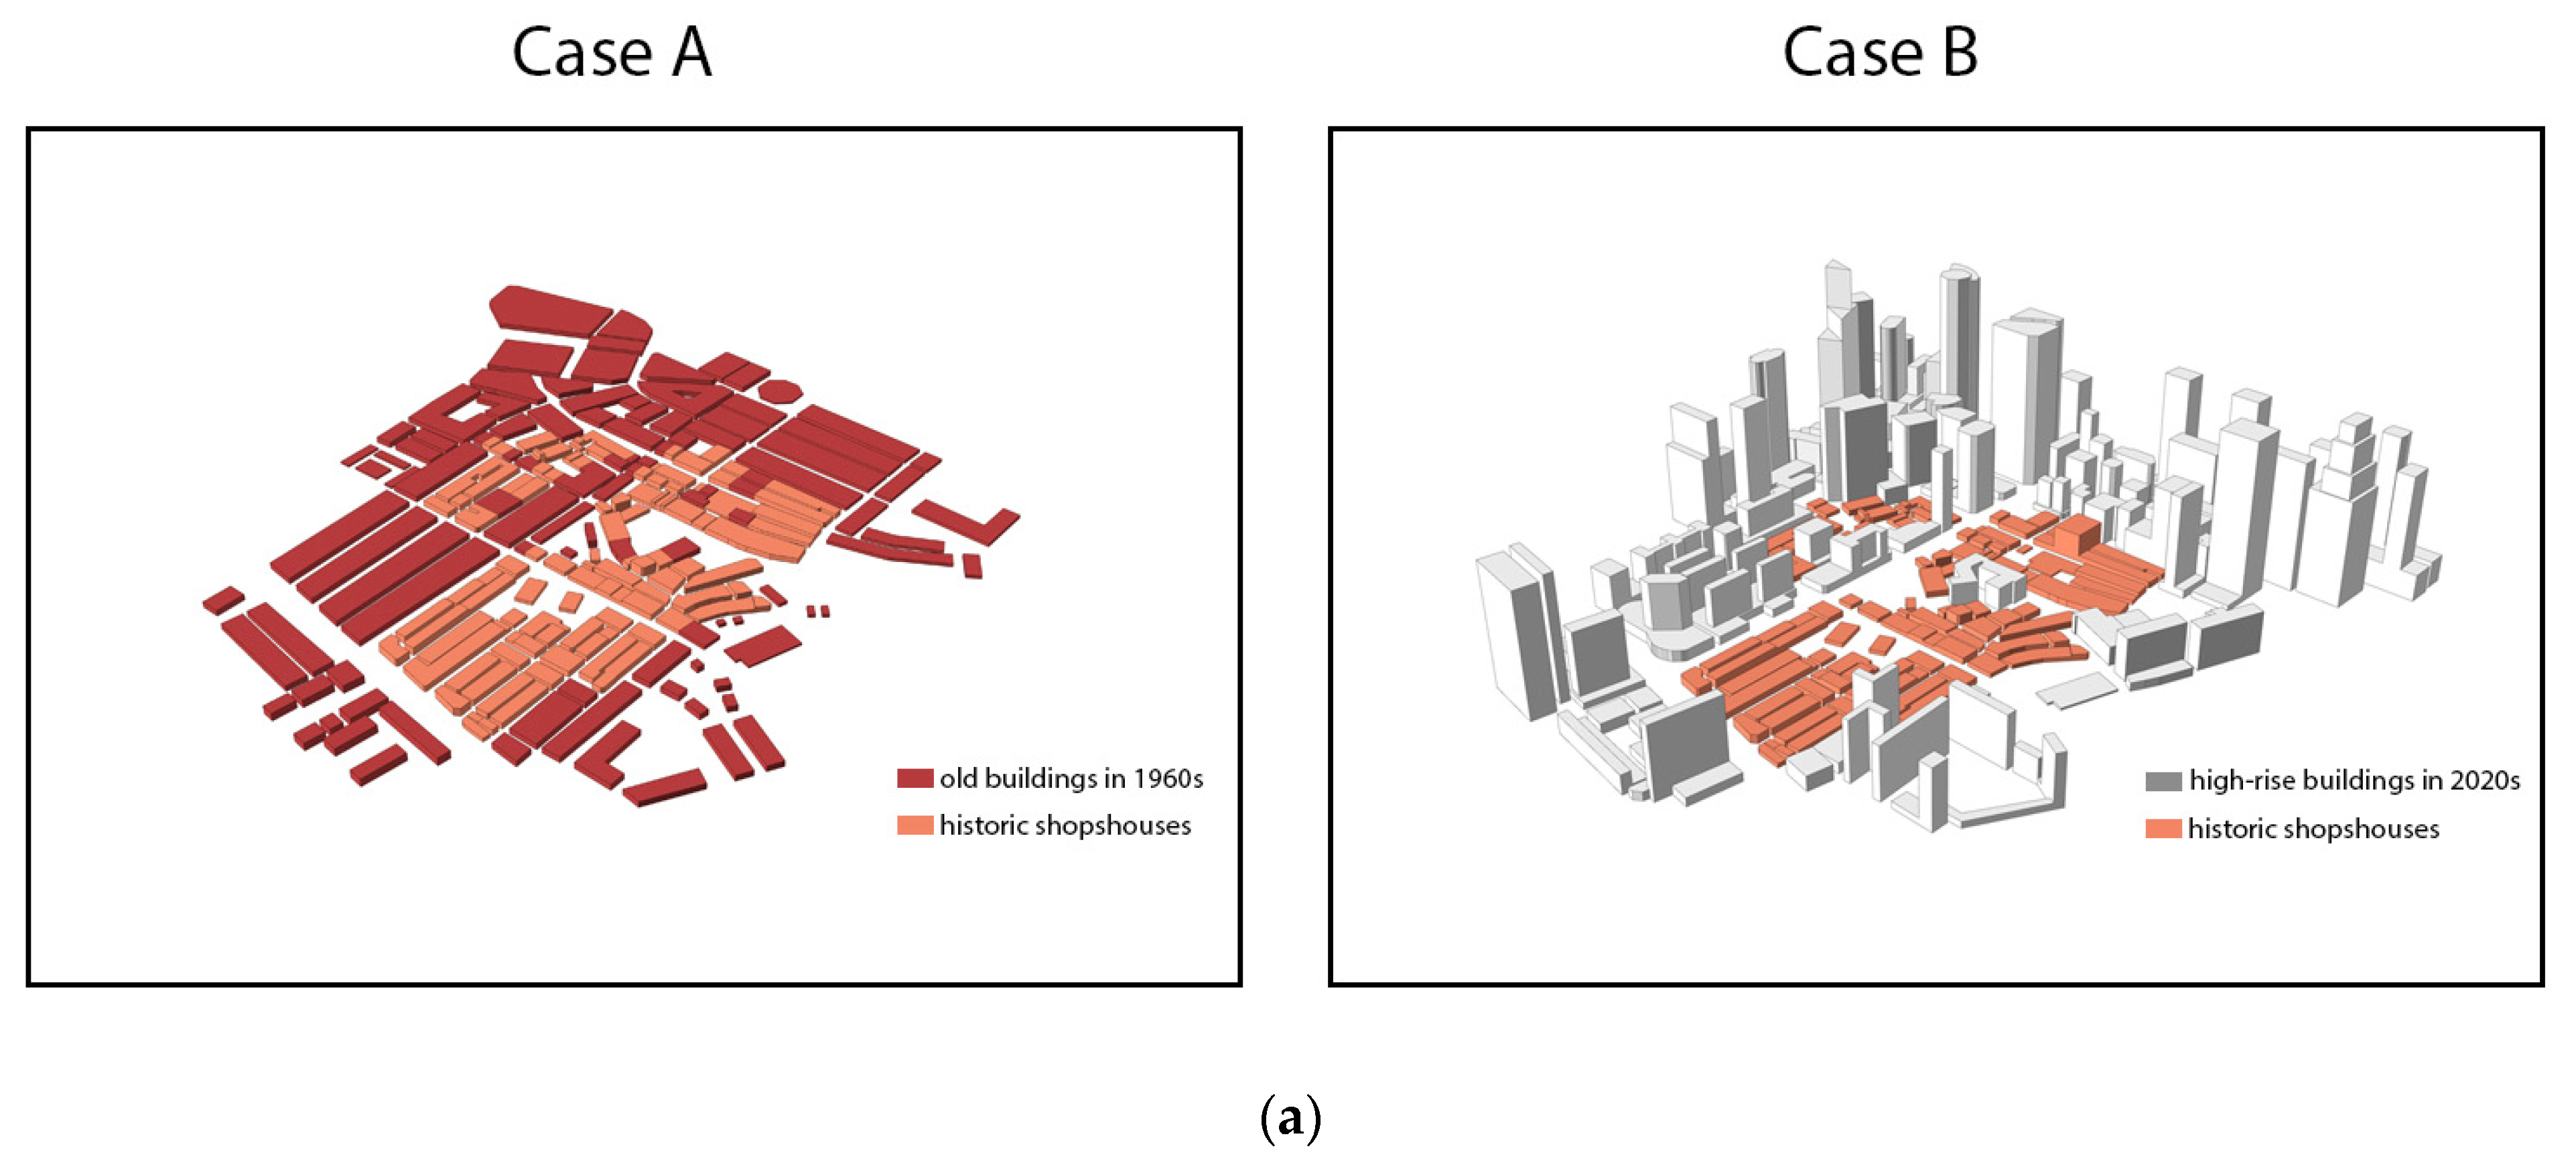
3.1. Comparison of Wind Speed between Cases A and B

To evaluate the impacts of newly built high-rise buildings on the wind speed in the Chinatown area, the CFD simulation was taken to obtain the wind speed at Case A (representing the 1960s scenario) and Case B (representing the current scenario). The wind environment results show that considerably more areas of Chinatown experienced extremely low wind speed (nearly 0 m/s) at the pedestrian level in Case B compared with Case A (Figure 8). Figure 10 shows the wind speed at the test streets showed differences from 84% to −80%, with an average of −43%, from 1.11 m/s decreased to 0.63 m/s for the tested values of wind speed, compared with Case B and Case A. Additionally, it can be noted that in Case B, only three tested streets (RTL1, RTL13 and FTL4) had higher wind speed and the other 15 streets had lower wind speed than the tested values of wind speed in Case A. This result clearly showed that the surrounding high-rise buildings caused reductions in wind speed in the Chinatown area. The only three streets with increased wind speed were observed at the locations closer to the wind inlet. The lower wind speed was likely to have been due to the high-rise buildings on the leeward side (wind shadow), especially in the areas farther from the wind corridor and the streets which are perpendicular to the prevailing wind direction. For example, at the test line on RTL7, which was the furthest test line from the oncoming wind, the wind speed decreased by 43% from 0.79 m/s to 0.45 m/s. The wind speed at the streets which are perpendicular to the prevailing wind direction, such as RTL9, RTL10, RTL11, and RTL12, also decreased significantly, i.e., by 47–80%.

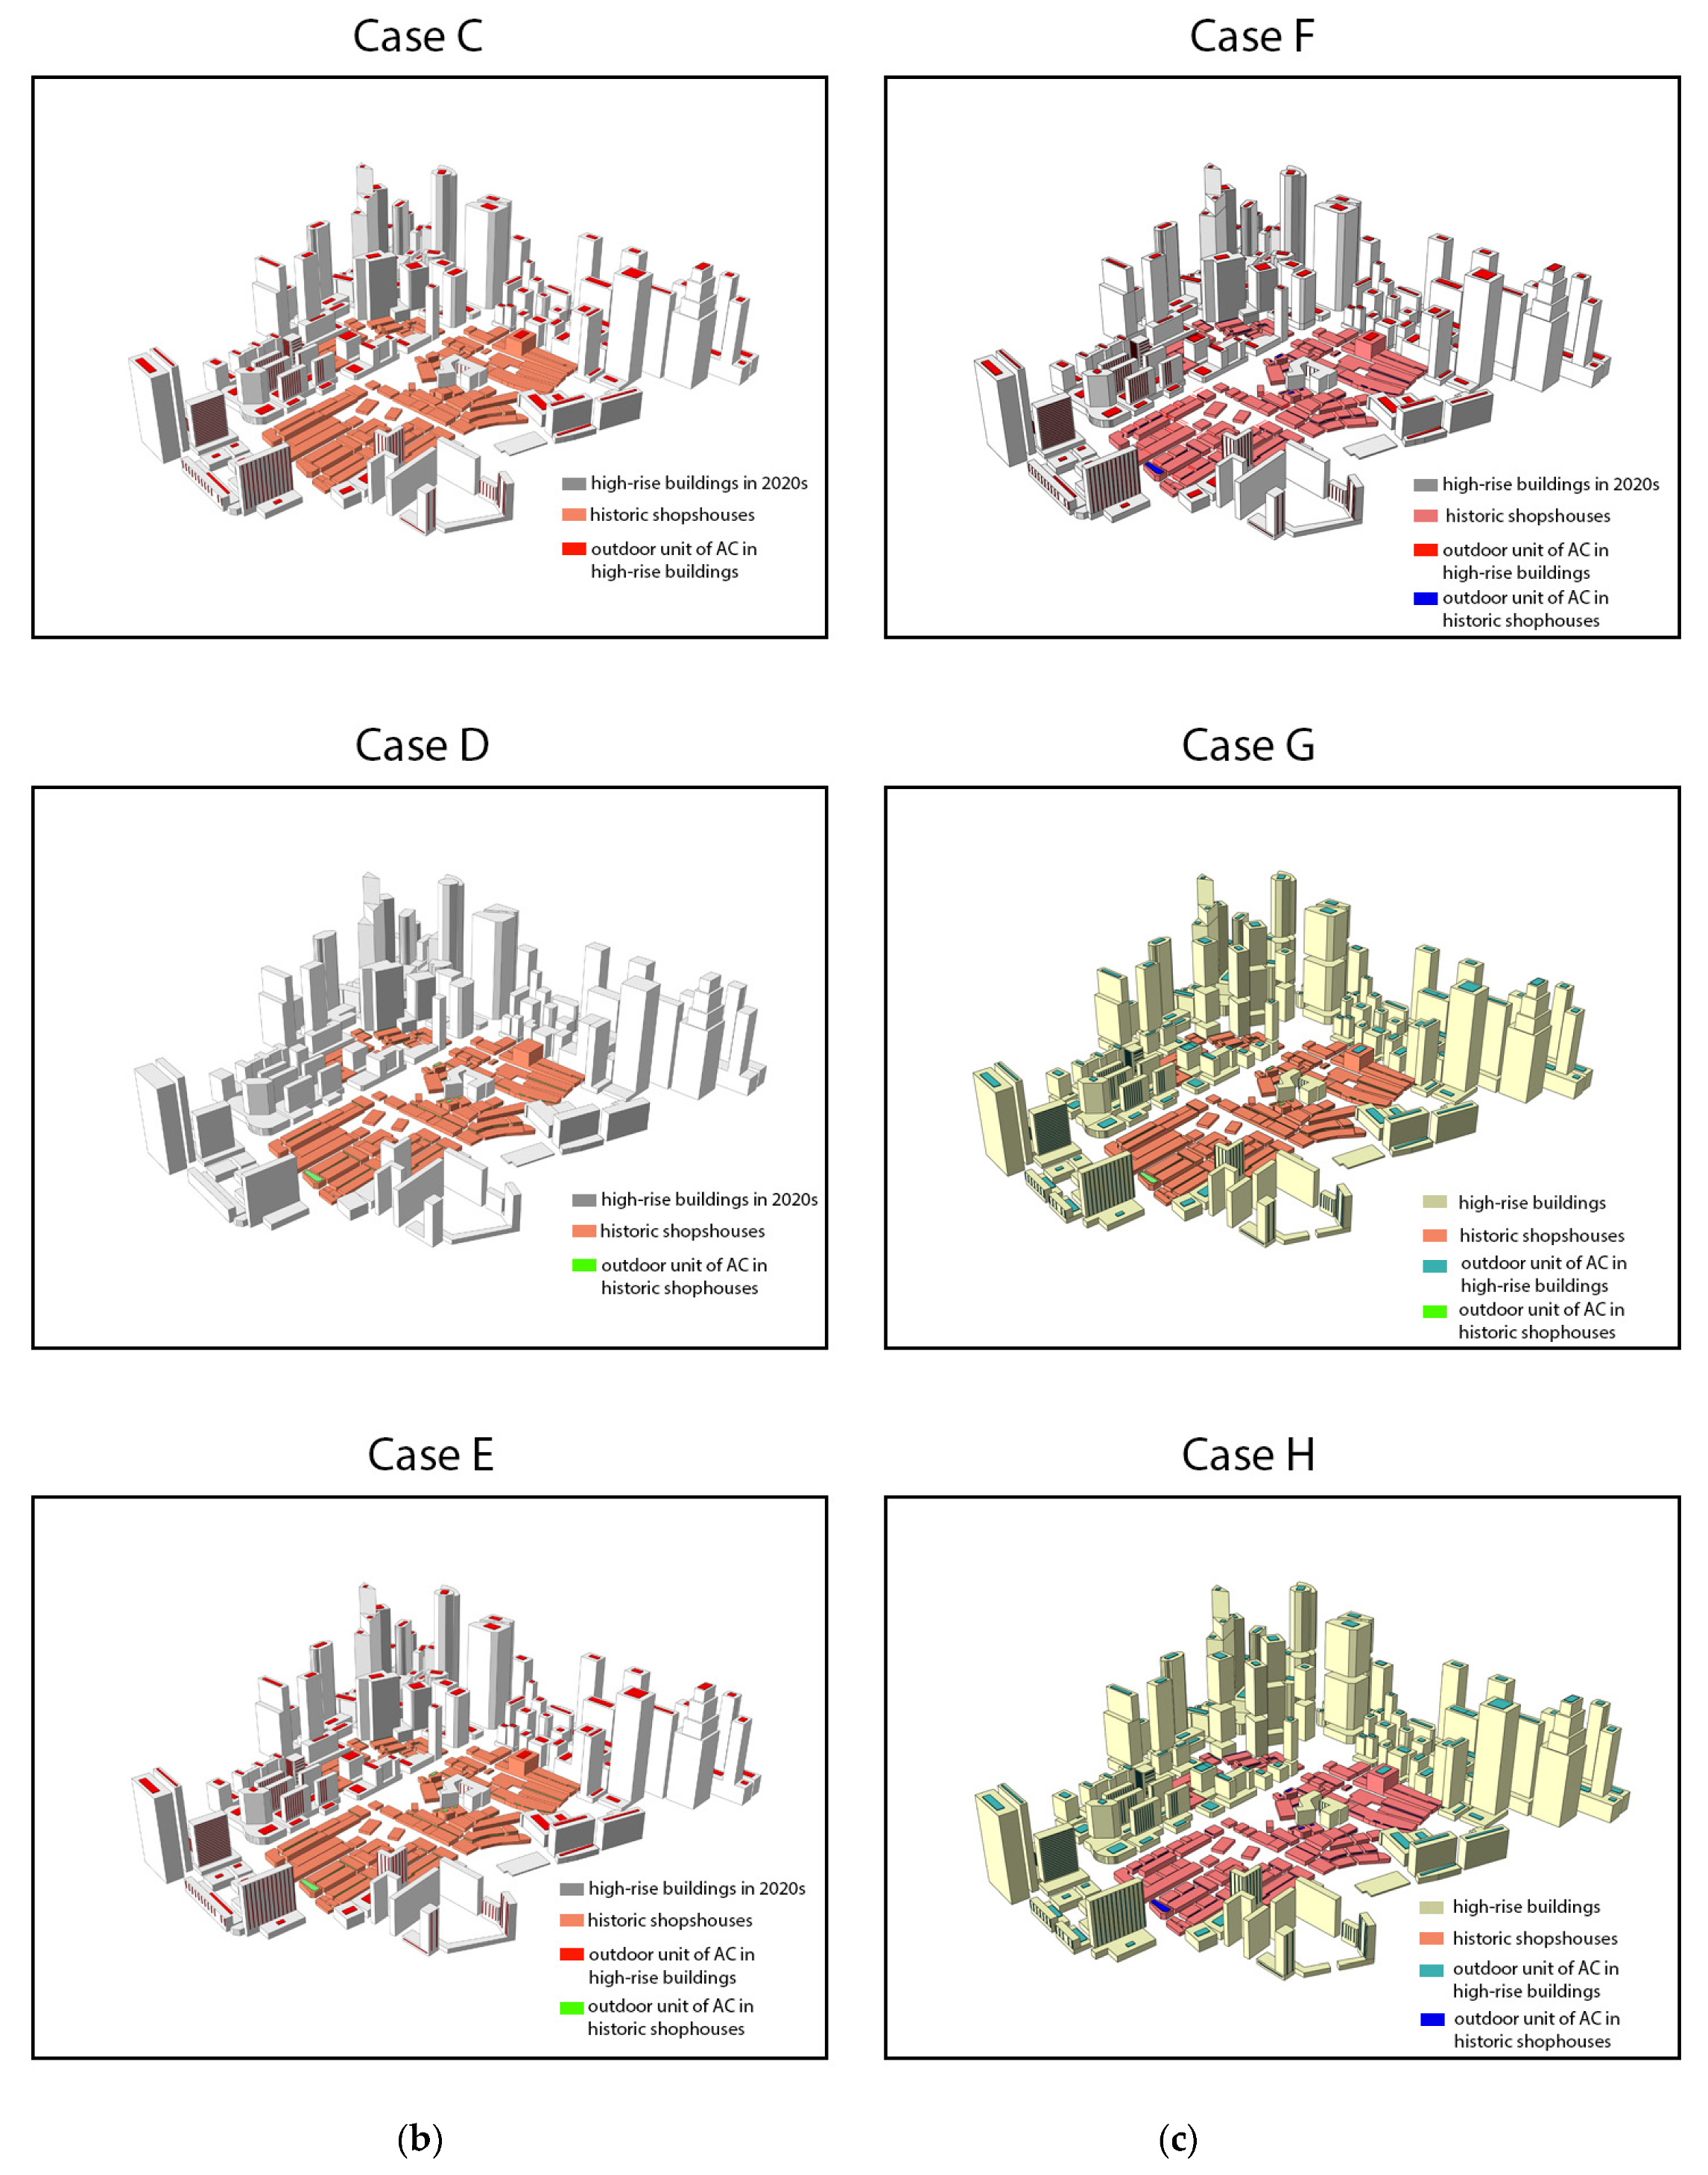
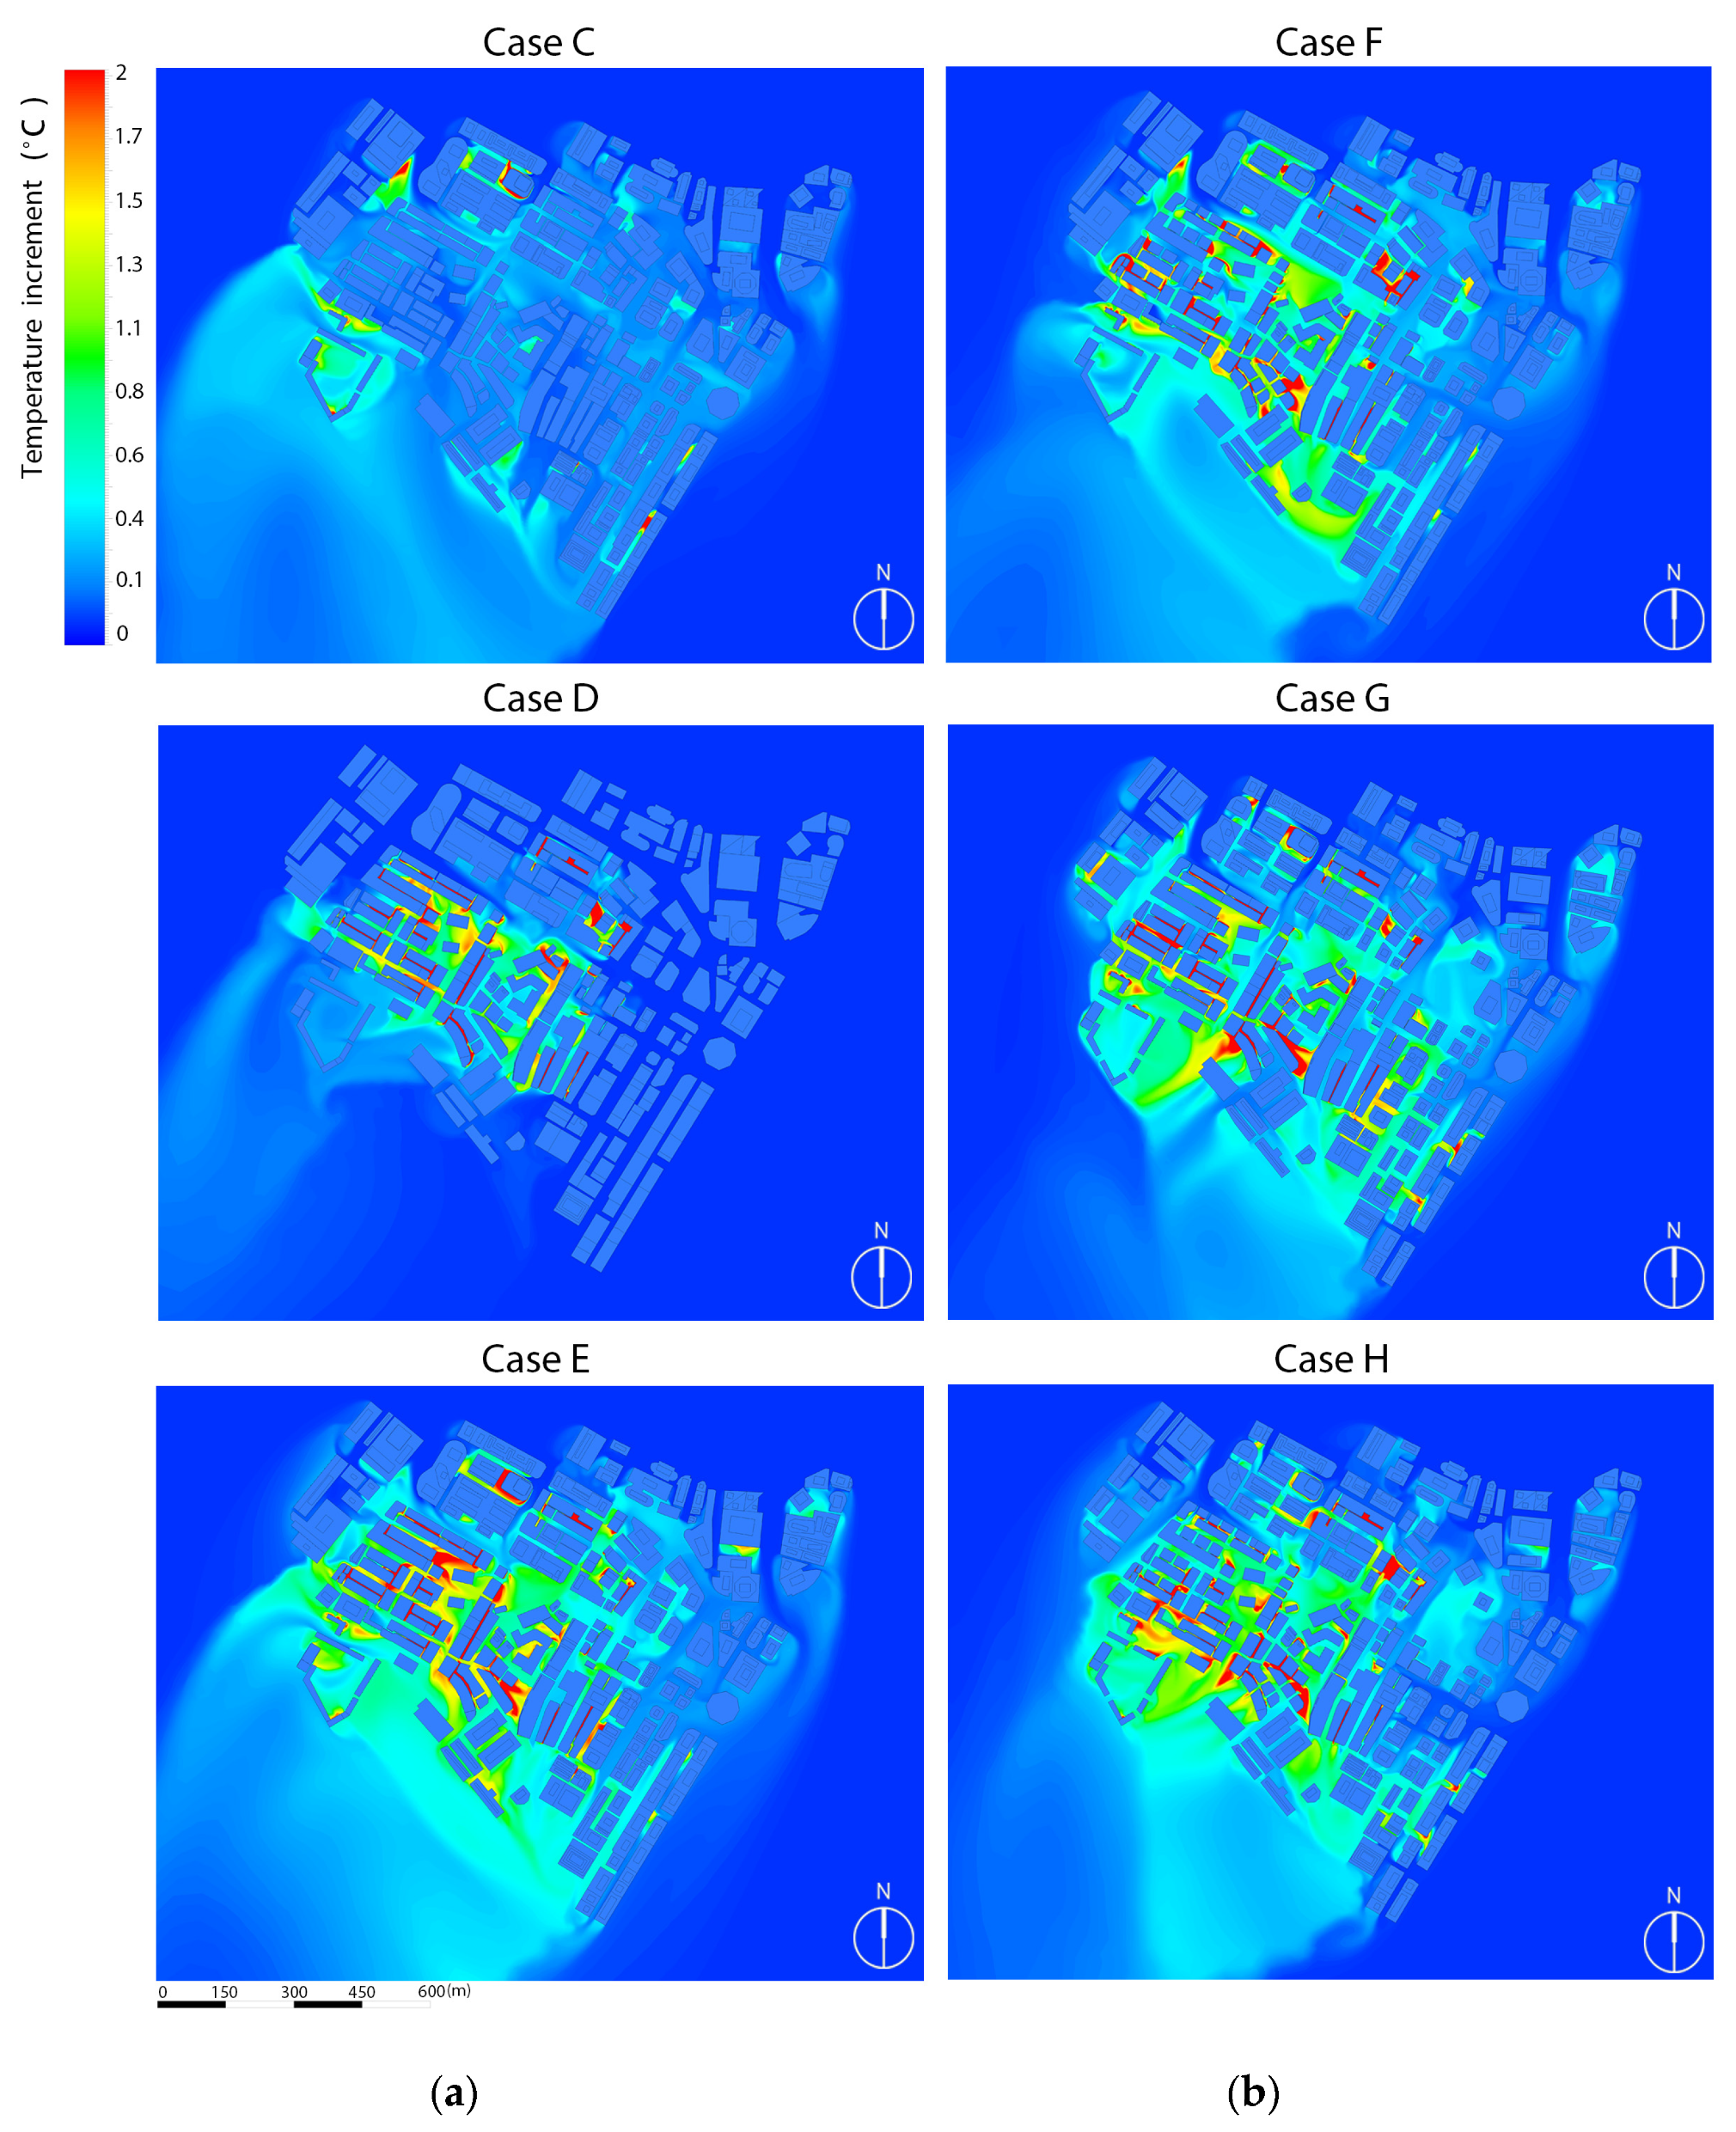
3.2. Comparison of Air Temperature Increments among Cases C, D, and E

Cases C and D assumes that the shophouses in the Chinatown area and the high-rise buildings in the surrounding area did not use AC, respectively. Case E represents the real scenario of the study area, with AC in use. In this way, we are able to compare the effects of anthropogenic heat in different areas on thermal environment in analyzing the Chinatown area. Figure 11a,b show the temperature increment in each test line of the three cases, comparing Case C with Case E and Case D with Case E. In the real scenario, Case E, the temperature increment at the pedestrian level at all tested streets increases by 0.87 °C on average, ranging from 0.13 °C at RTL13 to 1.45 °C at FTL1. The temperature increments of Cases C and D were compared with that of Case E to evaluate the effects of anthropogenic heat. Specifically, compared with Case E, the mean temperature increments of both of Cases C and D decreased, by averages of 82% and 41%, respectively. The result indicates that anthropogenic heat due to AC in both shophouses in Chinatown and high-rise buildings in the surrounding area significantly influenced the outdoor thermal environment in the Chinatown area. In addition, the result shows that the anthropogenic heat due to AC in shophouses influenced the outdoor air temperature more than those in high-rise buildings, most likely due to the types (i.e., water-cooling) and locations (i.e., rooftop) of the AC condensers in the skyscrapers.

3.3. Urban Heat Mitigation Strategies Evaluation among Case F, G, and H

According to the previous evaluation and analysis, the detailed mitigation strategies are described as Figure 12a,b. The main principle is to create porosity both vertically and horizontally to enhance ventilation at the pedestrian level in the Chinatown area. For Case F (Figure 12a), we focused on the Chinatown area. The principle is to remove some shophouses to allow the ventilation into the historic area, and we also consider the locations and amount of the removed shophouses carefully to retain the texture of the existing area simultaneously. In most cases, we removed one shophouse at a time instead of removing several adjacent shophouses, especially for the rows of shophouses closer to the wind inlet and parallel to the wind direction. Generally, the width of one shophouse is approximately 6 m [14]. One or more of 6 m porosity have little influence on the original texture of the historical area. Additionally, a group of (i.e., two or more) shophouses at the end of a row of shophouses where heat emission accumulated are removed to create open spaces for heat diffusion. Although two or more shophouses may be removed, it would have little effect on the texture of Chinatown because these buildings are at the end of a row of shophouses. In some rare cases, we remove a few adjacent shophouses in the middle of a row of shophouses which closer to the wind outlet. In terms of Case G (Figure 12b), both vertical and pedestrian-level porosity was applied accordingly for the high-rise buildings in the surrounding area. Specifically, in place where airflow is noticeably blocked and thus not able to entry Chinatown, buildings were removed and substituted by one or more super high-rise buildings. This is to create more open spaces at the wind gateway while maintain the gross floor areas for the original sites. Moreover, some buildings were redesigned to generate porosity to allow ventilation. Vertical porosity at different heights is applied in the building towers, which enables the incoming wind to be diverted into different levels and promotes vertical flow within the street canyon. Meanwhile, pedestrian-level porosity was applied in podium structures. Study shows that wind environment at the pedestrian level is significantly influenced by building morphology at podium layer [43]. Large podium volume tends to reduce the air volume and block the air flow, which is not desirable for pedestrians [44]. Thus, we diminished the large podium structures in surrounding buildings by random breaks and encourage wind penetration by providing ventilation corridors. Case H was simulated as the scenario including mitigation strategies in both areas.
Comparing the three mitigated cases with the real scenario, Case E, the results showed that all the three cases with mitigation strategies had decreased temperature increments, with average decreases of −33% for Case F, −25% for Case G, and −21% for Case H, respectively (Figure 13a–c).
This indicated that these strategies were effective to reduce outdoor air temperature in the Chinatown area. Although the mean value of all the three cases showed decreased temperature increments, some test streets with increased values can offer more information to select locations of porosity more effectively. More specifically, in Case F (Figure 13a), if the test streets are far from the wind inlet, such as RTL4 which is closed to the surrounding area, the porosity method applied to shophouses in Chinatown is unsatisfactory because the temperature increment of RTL4 increased by 3% compared with that of RTL4 in Case E. Additionally, the other test lines (i.e., RTL9, RTL10, RTL13, FTL3, and FTL5) with increased temperature increments were parallel to the prevailing wind direction. This means that the strategy to remove some shophouses to increase pedestrian-level porosity should consider the locations of existing shophouses, either near the wind inlet or perpendicular to the prevailing wind direction. For Case G (Figure 13b), although the mean value of the decreasing temperature increment in Chinatown was lower than the value of Case F, most test streets (14 of 18) still showed decreases ranging from 1% (RTL3) to 92% (RTL13). Similar to Case F, RTL4, which was far from the wind inlet, showed an unsatisfactory result because the temperature increment increased by 47% compared with the value of Case E. All the other test streets with increased values were those with only footway (FTL2, FRL3, and FTL4), which were narrower than the streets with both roadways and footways. These results indicated that the mitigation strategies for the surrounding area allowed more wind to enter into Chinatown for lowering the temperature increment of the entire area. However, some streets may be too narrow (i.e., streets with only footway) to adequately allow ventilation, resulting in unsatisfactory results locally. Case H (Figure 13c), which integrated both mitigation strategies in shophouses in Chinatown and high-rise buildings in the surrounding area, however, was less effective at decreasing the temperature increment in Chinatown than Cases F and G. The decreased temperature increment of Case H, 21–25% was slightly lower than that of Case G, but much lower than that of Case F (21–33% on average). There may be two reasons for this result. Firstly, it could be that anthropogenic heat from high-rise buildings in the surrounding area was dispersed into Chinatown via the ventilation corridor. Evidence of this was shown from RTL4, in Case F, which showed only a 3% temperature increment compared with Case E; however, for Cases G and H, when the ventilation corridor of the surrounding area was created, this value increased by 47% in Case G and 55% in Case H. Secondly, the wind environment was influenced by both the wind corridor in the surrounding area and the porosity in Chinatown; however, they may have opposing or negligible effects. As Table A2 in Appendix B shows, the wind speed in streets, RTL 3 and RTL 5 increased in both Cases F and G whereas it decreased in Case H, compared with the values in Case E.

4. Discussion

4.1. Effect of Anthropogenic Heat and Urban Morphology on the Urban Heat Environment in the Singapore Chinatown Area

In this study, the unsatisfactory urban heat environment at the pedestrian-level in Chinatown was due to the combined effect of heat emission from AC in both Chinatown and its surrounding areas, and that low wind speed was most likely due to blockages from surrounding high-rise buildings and the building geometry of Chinatown. Firstly, the high-rise buildings in the surrounding area can block the strong prevailing wind [13,45]. The wind environment simulation results of Cases A and B support this finding. However, this does not mean that high-rise buildings should be limited during the urban development process. In contrast, high-rise buildings are among the appropriate solutions for densely populated regions, such as Singapore [46]. Therefore, carefully designed high-rise buildings should be handled by related professionals in order to mitigate the negative effects for localized and existing wind environments. Secondly, the geometry of the Singapore Chinatown (i.e., the shophouses as a row) could be a barrier because it would obstruct the anthropogenic heat from dissipating and cause it to aggregate. Although the historic regions have restrictions for development and renovation, actions may be taken to simultaneously conserve existing historic buildings and enhance the outdoor thermal environment. The mitigation strategies on urban geometry in the Singapore Chinatown developed in this study considered both aspects. Third, urban heat mitigation strategies should consider the effect of anthropogenic heat, including the locations, types, and potential heat emissions. For example, in this study, the water-cooling type of AC on rooftops of high-rise buildings limited the negative effects on the pedestrian-level thermal environment in the Chinatown area. In contrast, although the shophouses in Chinatown dispersed much less anthropogenic heat, compared with high-rise buildings in surrounding areas, the effect was larger, which was probably due to the ineffective AC type and unplanned locations of AC condensers.

4.2. Practical Implications for Proposed Mitigation Strategies in Historic Areas

Based on our analysis, it is more effective to modify urban morphology at Chinatown area to mitigate the urban heat as the existing building geometry was not designed for its current functions and macro- and micro- climate conditions. However, these shophouses are historic buildings which need to be handled carefully with regard to any demolition or reconstruction actions. Although urban heat mitigation strategies in the surrounding area appeared to not be as effective as those in the Chinatown area, the results still showed great potential for improvements in the outdoor thermal environment. For architects, urban designers, and related professionals, it can be easier to consider mitigation strategies when starting new buildings. Thus, considering existing historic areas in advance is of great importance for these professionals. Additionally, a combination of mitigation strategies should be applied based on different situations. In this study, we suggest pedestrian-level porosity by removing some existing shophouses near the prevailing wind inlet and those perpendicular to the wind direction. Thus, if a redevelopment plan is undertaken in the historic area, these kinds of buildings should be considered as a priority for the benefit of outdoor wind and heat environment of the entire area. In terms of newly-built high-rises in surrounding areas, the principle was to create a ventilation corridor in the surrounding area to allow wind to penetrate Chinatown more easily, further influencing outdoor thermal performance. We suggest both vertical and horizontal porosity to create the ventilation corridor. In addition, the orientation of the wind corridor should be matched to the prevailing wind direction. We also noted from this study that separate mitigation strategies for historic area and surrounding areas may have opposing or negligible effects. This highlights the need for professionals to carefully design the locations of porosity to avoid anthropogenic heat in the surrounding area dispersing to the historic areas.

5. Conclusions

This study evaluated the impact of surrounding high density urban areas on the microclimate at historical areas, and developed the corresponding urban heat mitigation strategies. We investigated the impact of high-rise buildings on pedestrian-level air flow and assessed air temperature increment caused by anthropogenic heat. Multi-physics CFD simulation was applied to model the microclimate with anthropogenic heat and buoyancy effects. A total of eight parametric cases were designed in three steps. The following are specific research outputs to support urban and architectural design in historic area in Singapore and other high density tropical cities.
  • The average wind speed decreases of 43%, from 1.11 m/s in Case A to 0.63 m/s in Case B. This indicates the great impact of new development, i.e., high-rise buildings, on pedestrian-level air flow of the historic area.
  • The mean air temperature increased by 0.16 °C for Case C, 0.52 °C for Case D and 0.87 °C for Case E, respectively. This indicates that the anthropogenic heat emission from surrounding high-rise buildings had less effect than that from historic shophouses in Chinatown.
  • The integration of open spaces and building porosity, which create wind corridors together, can promote outdoor natural ventilation and heat dispersion at the study area. Compared with Case E, the three mitigation cases improve outdoor thermal environment, with mean temperature reduction of 33%, 25%, and 21%, respectively.
  • To retain the urban texture of the area, the locations and number of removed shophouses should include either one shophouse closer to the wind inlet and perpendicular to the wind direction as a priority, or a number of shophouses at the end or in the middle of the row where heat emission accumulates, in some cases.

6. Limitations and Future works

This study focuses on a common scenario with annual average wind speed. In future studies, we will consider various scenarios, e.g., the worse scenario, utilizing the lowest wind speed for simulation. Different wind directions will be utilized for further analysis in order to investigate other scenarios in addition to the prevailing wind direction. In addition, the effect of heat emission from vehicular traffic on the thermal environment will also be discussed. Moreover, urban heat plume impact will be included to make the simulation results more realistic. In terms of developing urban heat mitigation strategies, the contribution of urban greenery needs to be studied. Last but not least, quantitative analysis is needed to evaluate the performance of urban heat mitigation strategies, so as to give more practical suggestions to improve urban design in historic areas.

Author Contributions

Conceptualization, W.Z. and C.Y.; methodology, W.Z. and C.Y; software, W.Z., L.Z. and S.-J.M.; formal analysis, W.Z.; writing—original draft preparation, W.Z.; writing—review and editing, C.Y. and S.-J.M.; visualization, W.Z. and L.Z; supervision, C.Y.; project administration, C.Y.; funding acquisition, C.Y. All authors have read and agreed to the published version of the manuscript.

Funding

This research was funded by Singapore Ministry of Education, NUS Presidential Young Professorship, grant number R-295-000-172-133.

Data Availability Statement

Not applicable.

Acknowledgments

The authors would like to thank National University of Singapore for Wei ZHU’s Ph.D. research scholarship.

Conflicts of Interest

The authors declare no conflict of interest.

Nomenclature

Abbreviations
ABLAtmospheric boundary layer
ACAir-conditioning
BCABuilding and construction authority
CBDCentral Business District
CFDComputational fluid dynamics
COPCoefficient of performance
NENortheast
NEANational environment agency
UHIUrban heat island
Symbols
A Gross floor area of buildings (m2)
A h Typical area of one unit of residential buildings (m2)
A G F Gross floor area (m2)
c a Specific heat of air (J·kg−1·K−1)
C µ Model constant
E c Cooling energy (kw)
E2Energy Efficient Singapore
m a Input mass flow rate of heat emissions (kg·s−2)
N Number of units in residential buildings
N F Floor number of residential buildings
Q Total anthropogenic heat (kw)
Q A Anthropogenic heat from each unit of residential buildings (kw)
Q c Cooling loads generated in the indoor spaces (kw)
R p Public area ratio
u ABL Atmospheric boundary layer friction velocity (m/s)
z Hight above ground (m)
z 0 Aerodynamic roughness length (m)
ω Specific dissipation (s−1)
κ Turbulent kinetic energy (m2·s−2)
ε TKE dissipation rate (m2·s−3)

Appendix A

Table A1. Equations to calculate m a for buildings with different AC types and functions.
AC TypeBuilding FunctionEquation
Air cooling Shophouses (retail) m a = 130 × ( 4.2 + 1 4.2 ) A c a Δ T
Residential buildings m a = 1000 × 2.5 × ( 3.34 + 1 3.34 ) × ( 1 R p ) A GF A h c a Δ T
Water cooling Retail m a = 0.25 × 130 × ( 4.2 + 1 4.2 ) A c a Δ T
Office m a = 0.25 × 74 × ( 4.2 + 1 4.2 ) A c a Δ T
Hotel m a = 0.25 × 61 × ( 4.2 + 1 4.2 ) A c a Δ T

Appendix B

Table A2. Wind speed of all test streets and average value.
RTL1 RTL2 RTL3 RTL4 RTL5 RTL6 RTL7 RTL8 RTL9 RTL10 RTL11 RTL12 RTL13 FTL1 FTL2 FTL3 FTL4 FTL5 Ave
Case A0.731.0610.961.071.80.790.461.010.962.231.510.941.671.670.620.580.931.11
Case B1.010.540.610.760.80.760.450.360.340.510.450.641.150.540.360.321.070.640.63
Case B-A38%−49%−39%−21%−25%−58%−43%−22%−66%−47%−80%−58%22%−68%−78%−48%84%−31%−43%
Case C1.390.921.72.261.750.690.470.520.841.921.161.162.341.211.131.942.230.91.36
Case D1.391.470.991.4310.912.820.570.881.11.080.691.570.431.360.810.961.511.17
Case E1.621.621.522.381.441.190.390.331.521.861.271.313.041.361.170.622.092.251.47
Case C-E−14%−21%12%−5%22%42%21%58%45%3%−9%−12%−23%−11%−3%213%7%−60%−8%
Case D-E−14%27%35%40%−31%−24%623%73%−42%−41%−15%−47%−48%−68%16%31%−54%−33%−21%
Case F 1.91.82.082.491.641.070.580.421.131.812.352.232.212.281.390.472.440.761.61
Case G 1.611.381.771.892.252.060.680.821.241.691.961.53.841.860.770.891.061.311.59
Case H 1.221.621.161.620.791.980.771.181.231.462.321.881.742.390.970.791.261.291.43
Case F-E17%55%37%5%14%−10%49%27%−26%−3%85%70%−27%68%19%−24%17%−66%10%
Case G-E−1%19%16%−21%56%73%74%148%−18%−9%54%15%26%37%−34%44%−49%−42%8%
Case H-E−25%40%−24%−32%−45%66%97%258%−19%−22%83%44%43%76%−17%27%−40%−43%−3%
Table A3. Temperature increment at all test streets and average value.
RTL1 RTL2 RTL3 RTL4 RTL5 RTL6 RTL7 RTL8 RTL9 RTL10 RTL11 RTL12 RTL13 FTL1 FTL2 FTL3 FTL4 FTL5 Ave
Case C 0.220.190.150.120.160.250.20.250.080.060.210.110.130.120.120.110.240.140.16
Case D 0.460.490.781.050.30.430.240.570.391.140.040.540.090.770.950.640.350.070.52
Case E 1.31.261.420.921.161.031.431.080.370.310.480.670.131.450.940.890.490.350.87
Case C-E −83%−85%−89%−87%−86%−77%−86%−77%−78%−81%−56%−84%0−92%−87%−88%−51%−60%−82%
Case D-E −65%−61%−45%14%−74%−58%−83%−47%5%268%−92%−19%−31%−47%1%−28%−29%−80%−41%
Case F 0.710.320.970.950.780.731.180.620.510.510.280.280.230.230.590.890.260.460.58
Case G 1.050.641.411.350.390.750.340.980.30.290.290.390.010.21.091.070.910.230.65
Case H 0.860.690.891.431.120.61.020.680.460.690.220.370.880.230.420.90.690.20.69
Case F-E −45%−75%−32%3%−33%−29%−18%−43%38%65%−42%−58%77%−84%−37%0−47%31%−33%
Case G-E −19%−49%−1%47%−66%−27%−76%−9%−19%−6%−40%−42%−92%−86%16%20%86%−34%−25%
Case H-E −34%−45%−37%55%−3%−42%−29%−37%24%123%−54%−45%577%−84%−55%1%41%−43%−21%

References

  1. Sotoudeh, H.; Abdullah, W.M.Z.W. Evaluation of Fitness of Design in Urban Historical Context: From the Perspectives of Residents. Front. Archit. Res. 2013, 2, 85–93. [Google Scholar] [CrossRef]
  2. Egusquiza, A.; Brostrom, T.; Izkara, J.L. Incremental Decision Making for Historic Urban Areas’ Energy Retrofitting: EFFESUS DSS. J. Cult. Herit. 2022, 54, 68–78. [Google Scholar] [CrossRef]
  3. Aigwi, I.E.; Ingham, J.; Phipps, R.; Filippova, O. Identifying Parameters for a Performance-Based Framework: Towards Prioritising Underutilised Historical Buildings for Adaptive Reuse in New Zealand. Cities 2020, 102, 102756. [Google Scholar] [CrossRef]
  4. Gremmelspacher, J.M.; Campamà Pizarro, R.; van Jaarsveld, M.; Davidsson, H.; Johansson, D. Historical Building Renovation and PV Optimisation towards NetZEB in Sweden. Sol. Energy 2021, 223, 248–260. [Google Scholar] [CrossRef]
  5. Bedate, A.; Herrero, L.C.; Sanz, J.Á. Economic Valuation of the Cultural Heritage: Application to Four Case Studies in Spain. J. Cult. Herit. 2004, 5, 101–111. [Google Scholar] [CrossRef]
  6. Pedersen, A. Managing Tourism at World Heritage Sites: A Practical Manual for World Heritage Site Managers; UNESCO: Paris, France, 2002. [Google Scholar]
  7. Webb, A.L. Energy Retrofits in Historic and Traditional Buildings: A Review of Problems and Methods. Renew. Sustain. Energy Rev. 2017, 77, 748–759. [Google Scholar] [CrossRef]
  8. Enteria, N.; Cuartero-Enteria, O.; Santamouris, M.; Eicker, U. Morphology of Buildings and Cities in Hot and Humid Regions. In Urban Heat Island (UHI) Mitigation: Hot and Humid Regions; Enteria, N., Santamouris, M., Eicker, U., Eds.; Springer: Singapore, 2021; pp. 1–13. ISBN 978-981-334-050-3. [Google Scholar]
  9. Giridharan, R.; Lau, S.S.Y.; Ganesan, S.; Givoni, B. Urban Design Factors Influencing Heat Island Intensity in High-Rise High-Density Environments of Hong Kong. Build. Environ. 2007, 42, 3669–3684. [Google Scholar] [CrossRef]
  10. Quah, A.K.L.; Roth, M. Diurnal and Weekly Variation of Anthropogenic Heat Emissions in a Tropical City, Singapore. Atmos. Environ. 2012, 46, 92–103. [Google Scholar] [CrossRef]
  11. Yuan, C.; Adelia, A.S.; Mei, S.; He, W.; Li, X.-X.; Norford, L. Mitigating Intensity of Urban Heat Island by Better Understanding on Urban Morphology and Anthropogenic Heat Dispersion. Build. Environ. 2020, 176, 106876. [Google Scholar] [CrossRef]
  12. Yuan, C.; Zhu, R.; Tong, S.; Mei, S.; Zhu, W. Impact of Anthropogenic Heat from Air-Conditioning on Air Temperature of Naturally Ventilated Apartments at High-Density Tropical Cities. Energy Build. 2022, 268, 112171. [Google Scholar] [CrossRef]
  13. Lan, H.; Lau, K.K.-L.; Shi, Y.; Ren, C. Improved Urban Heat Island Mitigation Using Bioclimatic Redevelopment along an Urban Waterfront at Victoria Dockside, Hong Kong. Sustain. Cities Soc. 2021, 74, 103172. [Google Scholar] [CrossRef]
  14. Lee, S.L. The Conservation of Singapore’s Chinatown. J. Archit. Conserv. 1997, 3, 43–57. [Google Scholar] [CrossRef]
  15. Bruelisauer, M.; Berthold, S. Reclaiming Backlanes: Design Vision for Increasing Building Performance and Reprogramming Common Spaces; World Scientific: Singapore, 2015; ISBN 981-4740-87-X. [Google Scholar]
  16. Kardinal Jusuf, S.; Wong, N.H.; Hagen, E.; Anggoro, R.; Hong, Y. The Influence of Land Use on the Urban Heat Island in Singapore. Habitat Int. 2007, 31, 232–242. [Google Scholar] [CrossRef]
  17. Priyadarsini, R.; Hien, W.N.; Wai David, C.K. Microclimatic Modeling of the Urban Thermal Environment of Singapore to Mitigate Urban Heat Island. Sol. Energy 2008, 82, 727–745. [Google Scholar] [CrossRef]
  18. Roth, M.; Chow, W.T.L. A Historical Review and Assessment of Urban Heat Island Research in Singapore. Singap. J. Trop. Geogr. 2012, 33, 381–397. [Google Scholar] [CrossRef]
  19. Aflaki, A.; Mirnezhad, M.; Ghaffarianhoseini, A.; Ghaffarianhoseini, A.; Omrany, H.; Wang, Z.-H.; Akbari, H. Urban Heat Island Mitigation Strategies: A State-of-the-Art Review on Kuala Lumpur, Singapore and Hong Kong. Cities 2017, 62, 131–145. [Google Scholar] [CrossRef]
  20. Liddle, B.; Loi, T.S.A.; Owen, A.D.; Tao, J. Evaluating Consumption and Cost Savings from New Air-Conditioner Purchases: The Case of Singapore. Energy Policy 2020, 145, 111722. [Google Scholar] [CrossRef]
  21. Santos, L.G.R.; Singh, V.K.; Mughal, M.O.; Riegelbauer, E.; Fonseca, J.A.; Norford, L.K.; Nevat, I. Building Anthropogenic Heat Flux in Singapore; ETH Zurich: Zurich, Switzerland, 2020. [Google Scholar]
  22. Adelia, A.S.; Yuan, C.; Liu, L.; Shan, R.Q. Effects of Urban Morphology on Anthropogenic Heat Dispersion in Tropical High-Density Residential Areas. Energy Build. 2019, 186, 368–383. [Google Scholar] [CrossRef]
  23. Oke, T.R.; Mills, G.; Christen, A.; Voogt, J.A. Urban Climates; Cambridge University Press: Cambridge, UK, 2017; ISBN 978-1-139-01647-6. [Google Scholar]
  24. Allegrini, J.; Dorer, V.; Carmeliet, J. Buoyant Flows in Street Canyons: Validation of CFD Simulations with Wind Tunnel Measurements. Build. Environ. 2014, 72, 63–74. [Google Scholar] [CrossRef]
  25. Andreou, E. The Effect of Urban Layout, Street Geometry and Orientation on Shading Conditions in Urban Canyons in the Mediterranean. Renew. Energy 2014, 63, 587–596. [Google Scholar] [CrossRef]
  26. Erell, E.; Williamson, T. Intra-urban Differences in Canopy Layer Air Temperature at a Mid-latitude City. Int. J. Climatol. A J. R. Meteorol. Soc. 2007, 27, 1243–1255. [Google Scholar] [CrossRef]
  27. Kondo, A.; Ueno, M.; Kaga, A.; Yamaguchi, K. The Influence of Urban Canopy Configuration on Urban Albedo. Bound.-Layer Meteorol. 2001, 100, 225–242. [Google Scholar] [CrossRef]
  28. Yuan, C.; Ng, E.; Norford, L.K. Improving Air Quality in High-Density Cities by Understanding the Relationship between Air Pollutant Dispersion and Urban Morphologies. Build. Environ. 2014, 71, 245–258. [Google Scholar] [CrossRef] [PubMed]
  29. Tominaga, Y.; Mochida, A.; Yoshie, R.; Kataoka, H.; Nozu, T.; Yoshikawa, M.; Shirasawa, T. AIJ Guidelines for Practical Applications of CFD to Pedestrian Wind Environment around Buildings. J. Wind. Eng. Ind. Aerodyn. 2008, 96, 1749–1761. [Google Scholar] [CrossRef]
  30. Meteorological Service Singapore. Climate of Singapore; Meteorological Service Singapore: Singapore, 2020.
  31. Richards, P.J.; Norris, S.E. Appropriate Boundary Conditions for Computational Wind Engineering Models Revisited. J. Wind. Eng. Ind. Aerodyn. 2011, 99, 257–266. [Google Scholar] [CrossRef]
  32. Parker, D.S.; Sherwin, J.R.; Hibbs, B. Development of High Efficiency Air Conditioner Condenser Fans. Trans.-Am. Soc. Heat. Refrig. Air Cond. Eng. 2005, 111, 511. [Google Scholar]
  33. Hsieh, C.-M.; Aramaki, T.; Hanaki, K. Managing Heat Rejected from Air Conditioning Systems to Save Energy and Improve the Microclimates of Residential Buildings. Comput. Environ. Urban Syst. 2011, 35, 358–367. [Google Scholar] [CrossRef]
  34. Bojic, M.; Yik, F.; Lee, M. Influence of Air-Conditioning Exhaust on Exterior Recessed Space. Build. Res. Inf. 2003, 31, 24–33. [Google Scholar] [CrossRef]
  35. Bruelisauer, M.; Meggers, F.; Saber, E.; Li, C.; Leibundgut, H. Stuck in a Stack—Temperature Measurements of the Microclimate around Split Type Condensing Units in a High Rise Building in Singapore. Energy Build. 2014, 71, 28–37. [Google Scholar] [CrossRef]
  36. Kikegawa, Y.; Genchi, Y.; Kondo, H.; Hanaki, K. Impacts of City-Block-Scale Countermeasures against Urban Heat-Island Phenomena upon a Building’s Energy-Consumption for Air-Conditioning. Appl. Energy 2006, 83, 649–668. [Google Scholar] [CrossRef]
  37. Stanford, H.W., III. HVAC Water Chillers and Cooling Towers: Fundamentals, Application, and Operation; CRC Press: Boca Raton, FL, USA, 2011; ISBN 1-4398-6202-8. [Google Scholar]
  38. Jones, W.P. The Rejection of Heat from Condensers and Cooling Towers. In Air Conditioning Engineering; Routledge: London, UK, 2007; pp. 325–339. [Google Scholar]
  39. Building and Construction Authority. Code for Environmental Sustainability of Buildings; BCA: Singapore, 2012.
  40. Building and Construction Authority; National Environment Agency. Benchmark Your Building’s Cooling Load; BCA: Singapore, 2018.
  41. National Environment Agency. Energy Label and Tick Rating Prior to 1 September 2014; NEA: Singapore, 2014.
  42. National Environment Agency; Energy Market Authority. Energy Efficient Singapore; NEA: Singapore, 2021.
  43. Yuan, C.; Ng, E. Building Porosity for Better Urban Ventilation in High-Density Cities–A Computational Parametric Study. Build. Environ. 2012, 50, 176–189. [Google Scholar] [CrossRef] [PubMed]
  44. Ng, E. Designing High-Density Cities: For Social and Environmental Sustainability; Earthscan: London, UK, 2009; ISBN 978-1-84977-444-4. [Google Scholar]
  45. Juan, Y.-H.; Yang, A.-S.; Wen, C.-Y.; Lee, Y.-T.; Wang, P.-C. Optimization Procedures for Enhancement of City Breathability Using Arcade Design in a Realistic High-Rise Urban Area. Build. Environ. 2017, 121, 247–261. [Google Scholar] [CrossRef]
  46. Yeh, A.G.; Yuen, B. Introduction: High-rise living in Asian cities. In High-Rise Living in Asian Cities; Springer: Dordrecht, The Netherlands, 2011; pp. 1–8. ISBN 978-90-481-9737-8. [Google Scholar]
Figure 1. Downtown area in Singapore, where modernity and history coexist.
Buildings 12 01311 g001
Figure 2. (a) Simulation scenarios of Case A and B to represent the urban geometry in the past (1960s) and the current (2020s). (b) (Left) Simulation scenarios of Case C–E to represent the impact of anthropogenic heat emitted from high-rise buildings, historic shophouses, and both. (c) (Right) Simulation scenarios of Case F–H to represent the developed mitigation strategies focusing on the historic shophouses, high-rise buildings, and both.
Buildings 12 01311 g002aBuildings 12 01311 g002b
Figure 3. Horizontal and vertical cross-sections of the computational domain of Case B as an example to present domain size, meshing, and input wind direction.
Buildings 12 01311 g003
Figure 4. Meshing for Case B as an example (Buildings highlighted as red are the historic shophouses conserved at the Chinatown area).
Buildings 12 01311 g004
Figure 5. Validation results [22].
Buildings 12 01311 g005
Figure 6. Examples of locations and geometries of heat sources regarding different AC types and building functions (AC—air conditioning).
Buildings 12 01311 g006
Figure 7. Locations of test lines for data analysis (RTL represents the test line on streets with both roadway and footway and FTL represents the test line on streets with only footway.).
Buildings 12 01311 g007
Figure 8. Wind speed contours of Case A (left) and Case B (right) at the study area (buildings highlighted as red are the historic shophouses conserved at the Chinatown area).
Buildings 12 01311 g008
Figure 9. (a) (Left). Air Temperature increment contours of Case C–E. (b) (Right) Air Temperature increment contours of Case F–H.
Buildings 12 01311 g009
Figure 10. Wind speed of Case A & B and the variance of Case (B−A) % of each test line and the average value. Variance of Case (B−A) was calculated with the equation Case   ( B A ) = v Case B v Case A v Case A % ( v Case A is the wind velocity of each test line in Case A and v Case B is the wind velocity of each test line in Case B).
Buildings 12 01311 g010
Figure 11. (a). Temperature increment of Case C & E and the variance of Case (C–E) % of each test line and the average value, Variance of Case (C–E) was calculated with the equation Case   ( C E ) = T Case C T Case E T Case E % ( T Case C is the temperature increment of each test line in Case C and T Case E is the temperature increment of each test line in Case E). (b). Temperature increment of Case D & E and the variance of Case (D–E) % of each test line and the average value, Variance of Case (D–E) was calculated with the equation Case   ( D E ) = T Case D T Case E T Case E % ( T Case D is the temperature increment of each test line in Case D and T Case E is the temperature increment of each test line in Case E).
Buildings 12 01311 g011
Figure 12. (a). Mitigation strategies description for historic shophouses in Chinatown. (b). Mitigation strategies description for surrounding high-rise buildings.
Buildings 12 01311 g012
Figure 13. (a). Temperature increment of Case F & E and the variance of Case (F–E) % of each test line and the average value, Variance of Case (F–E) was calculated with the equation Case   ( F E ) = T Case F T Case E T Case E % ( T Case F is the temperature increment of each test line in Case D and T Case E is the temperature increment of each test line in Case E). (b). Temperature increment of Case G & E and the variance of Case (G–E) % of each test line and the average value, Variance of Case (G–E) was calculated with the equation Case   ( G E ) = T Case G T Case E T Case G % ( T Case G is the temperature increment of each test line in Case D and T Case E is the temperature increment of each test line in Case E). (c). Temperature increment of Case H & E and the variance of Case (H–E) % of each test line and the average value, Variance of Case (H–E) was calculated with the equation Case   ( H E ) = T Case H T Case E T Case E % ( T Case H is the temperature increment of each test line in Case D and T Case E is the temperature increment of each test line in Case E).
Buildings 12 01311 g013
Table 1. Description of Case A-H and simulation aim of step 1–3.
CasesDescriptionAim
Case ARepresents urban geometry of the study area in 1960sStep 1: To clarity the impact of new development on pedestrian-level air flow
Case BRepresents urban geometry of the study area in 2020s
Case CThe urban geometry of 2020s and anthropogenic heat from the surrounding high-rise buildings are appliedStep 2: To assess the air temperature increment caused by anthropogenic heat emitted
Case DThe urban geometry of 2020s and anthropogenic heat from the historic shophouses are applied
Case EThe urban geometry of 2020s and anthropogenic heat from both high-rise buildings and the historic shophouses are applied
Case FThe mitigation strategy is to create horizontal porosity and open spaces by removing some shophousesStep 3: To develop the mitigation strategies based on the assessment from previous two steps
Case GThe mitigation strategy is to create both vertical and horizontal porosity by modifying the geometry of the surrounding high-rise buildings
Case HThe mitigation strategies in Case F and G are integrated in this case
Table 2. CFD simulation settings.
Turbulence Model SST k
Computational grid type Unstructured poly-hexcore meshes
Blockage ratio   <5%
Grid expansion ratio   1.2
Density Boussinesq
Solving algorithms SIMPLE
Input wind profile Power law equation
Inflow boundary condition Operating temperature: 27 °C
Incoming wind speed Power-law profile with the reference wind speed of 7.6 m/s at 300 m above the ground
Incoming wind directions northeast (the prevailing wind direction of Singapore)
Heat flow specification method Mass flow rate inlet: normal to boundary direction (Heat emission temperature: 40 °C)
Other boundary conditions Outflow: pressure outlet
Bottom and buildings: Wall
Top: Symmetry
Convergence criteria   1E-6 for all variables
Publisher’s Note: MDPI stays neutral with regard to jurisdictional claims in published maps and institutional affiliations.

