Abstract
This paper describes an extensive experimental study of the compressive failure of different types of aggregates and the influence of aggregate type on the interfacial properties of mortars. Interfacial debonding was the main failure mode of mortar rubbles. The interlocking strength of aggregate and mortar strongly affected the compressive strength of materials. When basalt was used as the aggregate, I-II composite failure of the deflection crack occurred as well as interfacial debonding. The highest instantaneous AE energy of the granite mortar rubble was 1349 mV·ms, which was 4.1 times greater than that of the basalt mortar rubble (326 mV·ms). Acoustic emissions of mortar rubble were strongest in the 150–220 kHz range and gave an early warning of the damage load at high frequencies (160–320 kHz). The C-S-H gel formed by the hydration reaction adhered to the aggregate pores and exhibited a “root pile” effect that improved the bonding performance of the interfacial zone. The interfacial porosity of the basalt, granite and limestone mortar rubble was 21.29%, 18.70% and 30.0%, respectively. The limestone interface has a large porosity, the fractal cones was small (1.19), and there was an obvious sidewall effect, but the interfacial strength was weak. The pore structure had a significant effect on the interfacial bond strength. This multi-faceted analysis truly reflected the state and evolution of the damage of mortar rubbles, and the results were very effective for determining the mechanical mode of damage of mortar rubbles.
1. Introduction
Grout rubble lattices are a common form of masonry structure for slope protection. Compared with other forms of slope protection, this kind of structure has good frost resistance and overall stability, and it has been widely used in subgrade engineering in cold regions [1]. Current research on this kind of slope protection mostly considers the overall analysis of the mechanical properties or the advantages of the durability of these structures. Some scholars have used numerical simulation software to establish slope models and analysed their mechanical properties [2,3,4]. Duan et al. [5] believe this kind of slope protection easily undergoes damage at the dry joint when it is under stress. Mortar rubble consists of a kind of masonry material mixed with mortar and rubble, and it is similar to coarse aggregate concrete. Compared with concrete, mortar rubble has a larger aggregate size (>15 mm) and aggregate volume fraction, and its fracture properties are different from those of ordinary concrete. The main contribution to the bonding strength of the interface between the schist aggregate and the cement is the interlocking force, while the chemical force is relatively small, and the locking effect refers to mechanical occlusion [6,7,8,9,10,11]. The interface between the mortar and the flake aggregate is often weak due to unstable bonding during construction. Some academics have carried out a number of tests to investigate the mechanical properties of concrete [12,13]. Ayaz et al. [14] used the application of supervised machine-learning (ML) algorithms, gene-expression programming (GEP), to predict the compressive strength of concrete containing RCA. It is necessary to further explore the location and mechanism of damage such as the cracking of mortar rubble used for slope protection.
The form of failure and fracturing of mortar rubble used for slope protection have not been fully determined. To determine a model for the mechanical damage of mortar rubble, it is necessary to understand the effect of material heterogeneity on the crack development process and crack morphology. In previous experimental work, mechanical tests were often used to provide the basis for the establishment of models of mortar rubble. Due to limitations of field test conditions and equipment, the traditional strength test cannot reflect the real damage characteristics of rubble masonry structures during the loading process. Under loading, damage and cracks often occur instantaneously, and the difference before and after failure is large. It is necessary to monitor deformation and damage during loading.
At present, some scholars conduct research on the damage mechanism of materials based on the commonly used nondestructive testing methods. Agata et al. [15] used computed tomography images to investigate the effect of particle arrangement and shape on the performance properties of preplaced concrete. Digital image correlation (DIC) and acoustic emission (AE) have been widely used in the monitoring of structural damage, deformation and cracks [16,17,18,19,20]. In the case of AE monitoring, large strains are generated by the development of cracks in brittle materials, the accumulated energy is released in the form of elastic waves, and the elastic wave signals are acquired by an AE receiver for processing. The AE system has the advantages of real-time monitoring and no external power supply. Some scholars have conducted nondestructive testing of concrete structures based on AE systems and obtained the damage characteristics of aggregate concrete under different conditions [21,22,23,24,25]. Liu et al. [26] used AE monitoring technology to obtain the evolution relationship of damage of samples of CSC cinder concrete material during uniaxial loading. Wang et al. [27] studied the damage evolution of high-performance concrete in tensile tests by the AE method. Li et al. [28] discussed the failure mechanism of recycled concrete using the ratio of rise time to peak amplitude–average frequency (RA-AF) correlation method based on AE eigenvalues.
The DIC method is a new digital method for the calculation of strain. Compared with other nondestructive testing techniques, DIC provides a more intuitive perspective and more accurate damage location, especially during the evolution of the failure mode of concrete and geotechnical composite materials, which has obvious utility for monitoring and gauging significance [29,30,31,32]. Pour et al. [33] used DIC to study the sub-macro-scale strain distribution and evolution of sandstone and concrete specimens. Li et al. [34] used DIC to study the difference between the cracking behavior of simulated recycled aggregate concrete (RAC) and finite aggregate concrete specimens under compressive loading. Fan Xiangqian et al. [35] used acoustic emission to evaluate the concrete damage process and verified the reliability of the evaluation method using DIC by comparison with strain test results. Liu et al. [36] combined DIC and AE to study the mechanical properties of lattice reinforced concrete.
Studies showed that there is an interfacial zone (ITZ) between mortar and aggregate in mortar screed. The properties of the structure in the interfacial region have a great influence on the overall strength of the structure [9,27,37,38]. Caliskan et al. [39] applied the aggregate push-out test and determined that the bonding strength of the ITZ is related to the surface roughness of the aggregate, the interfacial thickness and the amount of silica in the ITZ. Pan et al. [40] used scanning electron microscopy (SEM) technology to analyse sandstone and its interfaces and explored the freezing-thawing debonding mechanism of rock-concrete interfaces. Therefore, the use of SEM to observe the microstructure of the interface area and the use of principal component analysis (PCAS) technology to process SEM images to quantify the interfacial pore structure are of great significance for understanding the properties of the ITZ.
The AE and DIC method were combined to continuously monitor mortared rubble during uniaxial compressive tests. The DIC method, AE energy, RA-AF correlation method and frequency domain eigenvalues were applied to study the damage mechanism and evolutionary characteristics. Based on SEM images of the interfacial area, PCAS technology was used to analyse the pore structure, which further confirmed the conclusion of the analysis. The influence of the properties of aggregate structure on the damage mechanism of screed was investigated. The comprehensive detection technology of the AE and DIC methods were used to closely monitor the change in the interfacial strain field and the damage evolution of the polymer and crack surface. The results proved that this method accurately reflects the damage state of screed and can evaluate the crack resistance of mortared rubble.
2. Materials and Methods
2.1. Materials and Specimen Preparation
There were six groups of mortar rubble specimens, and each group was set with three nominally identical pieces. The cement was PO42.5 ordinary Portland cement produced by BBMG Company in Hebei Province. The cement parameters are shown in Table 1. The mortar rubble slope protection from Zhangjiakou City, Hebei Province was taken as a model. According to the principle of similar proportions, the mortar rubble material (600 mm × 600 mm) was reduced in size according to the proportion (1:4). According to the existing technical standards, the particle size in the mortar-rubble aggregate was about 160 mm in the actual project, so a large aggregate of 30–50 mm was taken as a test according to the scale. The graded proportions of the aggregates are shown in Table 2. Coarse aggregates were selected from three kinds of local unique crushed stones, basalt, granite and quartz sandstone. At the material selection stage, we selected long aggregates for the test pieces and tried to ensure that the different aggregates were as similar in shape as possible. The aim was to match the shape of the aggregates for the flaked stone as required in the actual project. The screened aggregates were mechanically cleaned in a washing unit and dried in an oven. The sand was taken from Zhangjiakou in North China. To improve the interface adhesion, 5% fumed silica was added in the interfaces. The physical and mechanical parameters of various aggregates are shown in Table 3. Mixtures were prepared according to the weight ratios shown in Table 4 and stirred uniformly. Each test piece was prepared by pouring mixture into a cubic mould with a side length 150 mm, then vibrated on a vibrating table and compacted. The surface of the test piece was smoothed, and the specimens were placed for 24 h before the mould was removed from the specimen. Then, specimens were cured under standard conditions (temperature 20 ± 2 °C, relative humidity 95%) in a standard curing box by Beijing Zhongke Luda for 28 d.

Table 1.
Basic performance parameters of cement.
Table 2.
Aggregate screening table.
Table 3.
Main physical and mechanical parameters of rock.
Table 4.
Design of cubic specimen mix ratio.
2.2. Test Method
To ensure the reliability of the data, a 5000 KN electro-hydraulic servo press produced by Shanghai Hualong Company was used for single-axis loading; the loading rate was set to 0.5 mm/min. During the test, the DIC three-dimensional strain measurement system produced by Xintuo 3D Co., Ltd. in Shenzhen, China was used to monitor the surface strain of the specimen. The AE signal was monitored using an 8-channel full-information acoustic emission instrument numbered DS-8 produced by Ruandao Times Technology Co., Ltd. in Beijing, China. The composition of the uniaxial compression test system is shown in Figure 1. The layout of the field test equipment is shown in Figure 2.
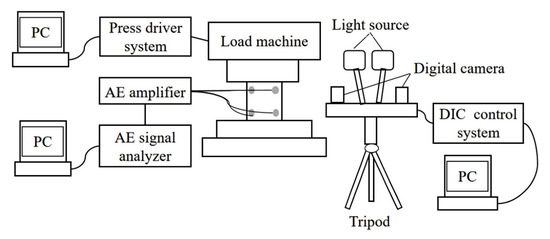
Figure 1.
Compression test device.
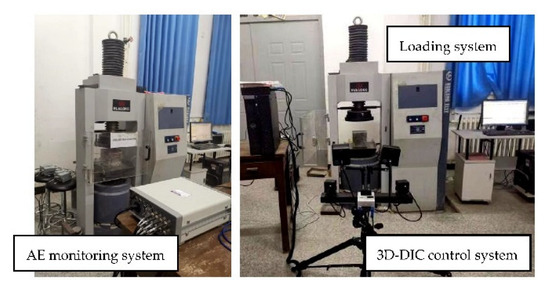
Figure 2.
Acoustic emission monitoring system and DIC strain monitoring system.
2.2.1. DIC Test Methods
The principle of DIC calculations is to reconstruct the three-dimensional coordinates of the calculated points on the surface of an object based on parallax data for each deformation of each characteristic point. Then, the changes in the three-dimensional coordinate points after the reconstruction are calculated to obtain the strain and displacement information for the specimen. The DIC device is mainly composed of a digital-image processing system, control box, lens, pan/tilt, tripod and light source. The parameter settings of the DIC strain test system are shown in Table 5. Before the test, to reduce the projection error, a pair of high-definition cameras were aligned on the fixed axis of the sample, and the light source was projected onto the detection area for aperture adjustment. After that, the camera was calibrated with the calibration plate to obtain the precise three-dimensional coordinates of the object. To make the calculation result accurate, the patch area required for the calculation of the strain of the specimen strain calculation was defined, and the seed points were set before calculation. A DIC camera was used to capture high-resolution images during inspection to monitor displacement and strain on the surface of each sample. To make the calculation results more reliable, the DIC method was used to evaluate the similarity of image subregions before and after deformation based on the correlation function. The standardized covariance cross-correlation function shown in Equation (1) was used,
where fm and gm are the grey average values of the reference subregion and the target subregion, respectively. When C = 1, the two subregions are completely correlated; when C = 0, the two subregions are not correlated.
Table 5.
Main parameters of the DIC full-field strain monitoring system.
2.2.2. Acoustic Emission Detection
The acoustic emission system consisted of a computer and a gainer, sensor and analysis system for acoustic emissions. The AE parameter settings are shown in Table 6. The least squares method was used to determine the accurate positioning of the equipment by solving Equation (2),
where v is the acoustic emission wave velocity, t0 is the initial time, and t is the time.
Table 6.
Main parameters of the acoustic emission monitoring system.
To reduce the acoustic impedance difference between the sensor and the detection surface, improve the accuracy of the compression test monitoring data, and enhance the positioning effect, Vaseline was used as the coupling agent, and the sensors were fixed to the specimen surface by adhesive tape ties. The acoustic emission sensors were arranged around the concrete specimen, and eight sensors were arranged on the cubic specimen for this test. The placement positions are shown in Figure 3.
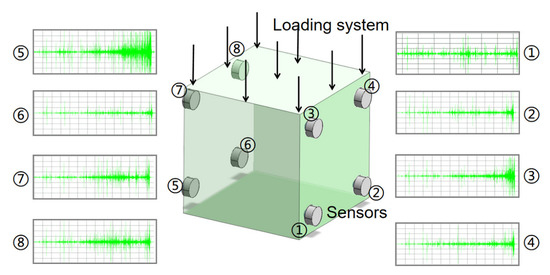
Figure 3.
AE sensor arrangement. (The serial numbers ①–⑧ are for the eight channels of the monitor).
3. Results and Discussion
3.1. Stress-Strain Relationship
The test results of the mortar rubble specimens under uniaxial compression loading are shown in Table 7. The load-deformation curves of the six groups of mortar rubble are shown in Figure 4. According to the slopes of the stress-strain curves, the loading process was divided into four stages, i.e., the initial stage, the crack growth stage, the peak stage, and the damage stage. In the initial stage of loading, the slope of the stress-strain curve of the mortar rubble was low. When the axial strain was greater than 0.5%, the loading rate increased rapidly, and the stress-strain curve of the mortar rubble exhibited an inflection point, then showed a linear relationship. When the axial strain was greater than 1.5%, the loading rate of the stress-strain curve was slower, and a second inflection point was observed. After the stress reached peak point C, it maintained a longer smooth shape after the load gradually decreased until damage occurred. Compared with the basalt and granite specimens, the peak strength of the limestone aggregate was the lowest, and the specimens reached the peak strength soonest. The strength of the mortar rubble was relatively low. The granite and basalt mortar rubble had stronger plastic breaking capacities. The comprehensive test results revealed that the compressive strength of mortar rubble was better when the ratio of aggregate in mortar rubble was 1:2.
Table 7.
Results of test.
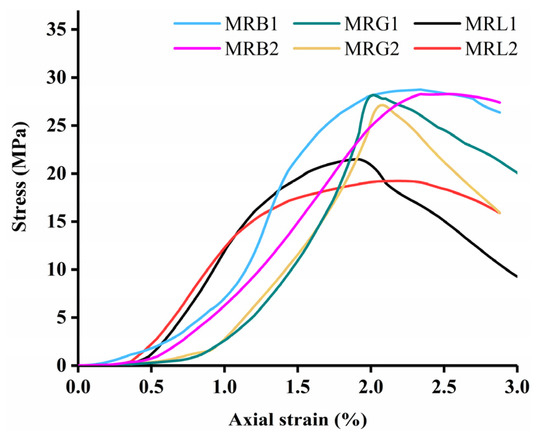
Figure 4.
Stress-strain analysis of mortar rubbles.
3.2. DIC-Based Fracture Evolution of Mortar Rubble
The evolution of the surface strain of three mortar rubble specimens under uniaxial compressive loading was monitored using a 3D-DIC full-field strain scanner. The maximum principal strains of the specimens were calculated from the measured strains based on the DIC strain test system according to Equation (3). It was also possible to obtain information on crack initiation and development by the strain distribution in the range.
Figure 5 shows the maximum principal stress cloud diagrams and damage patterns for specimens MRB-1, MRG-1 and MRL-1 at peak strengths of 1%, 50%, 75% and 100%. According to the observations (Figure 5), at the initial stage of 0.01 Pmax loading, multiple colours are present in the strain cloud diagram, part of the blue and red areas wrapped by the contour lines indicate the aggregate, and the green area indicates the mortar and interfacial area. The observation of Figure 5 shows that strain concentration occurred in a small area around the aggregate, especially for the limestone mortar rubble. This was caused by the presence of pore compression density generating strain due to the insufficient density of the matrix connecting the aggregate to the matrix. At this stage, a small number of microcracks were produced on the surface of the specimens, and the number of microcracks was small. When the load reached 50% Pmax and 75% Pmax, the specimens clearly showed visible cracks under the highlighted colour gradient in the maximum principal strain field. The microcracks extended longitudinally and appeared in areas in the larger strain range. Larger aggregates appeared along the crack development path, the interfacial cracks gradually developed and expanded, and the specimens appeared to be clearly cracked. When the load reached Pmax, the cracks extended further, and the strain increased significantly in some regions. As shown in Figure 5, the abrupt changes indicated that the interlocking effect of the aggregate disappeared, and some areas showed partial surface spalling and detachment.
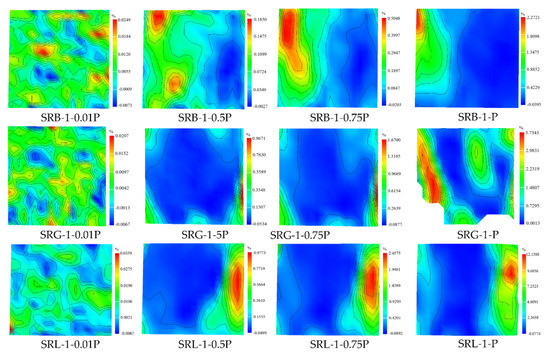
Figure 5.
Major strain cloud diagrams of the rock specimens.
As shown in Figure 6, the Z-directional displacement cloud diagrams for specimens MRB-1, MRG-1, and MRL-1 corresponded to peak strengths of 1%, 50%, 75%, and 100%. At the beginning of loading, microcracks appeared and then expanded continuously, and the development met the aggregate. The main crack stopped expanding, and the branched cracks started developing around the aggregate. The interlocking force between the aggregate and mortar resisted the development of cracks, and the accumulated energy destroyed other weak surfaces in the adjacent area so that the cracks eventually moved around the aggregate and started to develop towards the upper part and the cement matrix. When the peak load reached Pmax, the values of Z-directional displacements of the surfaces of the three groups of mortar rubble, MRB-1, MRG-1 and MRL-1, were 1.55 mm, 4.52 mm and 6.67 mm, respectively. The Z-directional displacement of limestone was the largest, which indicated the weak interfacial linkage of limestone mortar rubble. The test results showed that the mortar rubble was characterized by nonuniform deformation during loading due to the different sizes of the large aggregates in each direction. Under uniaxial loading, cracks appeared to surround the aggregate aggregates and propagated in the matrix parallel to the loading direction. The principal strain and displacement fields under DIC detection can accurately predict the damage mode of the slurry schist. The displacement and strain cloud diagrams measured by DIC indicated that interfacial debonding was the dominant damage mode for mortar rubble structures. The magnitude of the interlocking strength of the aggregate and mortar was the key factor affecting the compressive strength of the mortar rubbles.
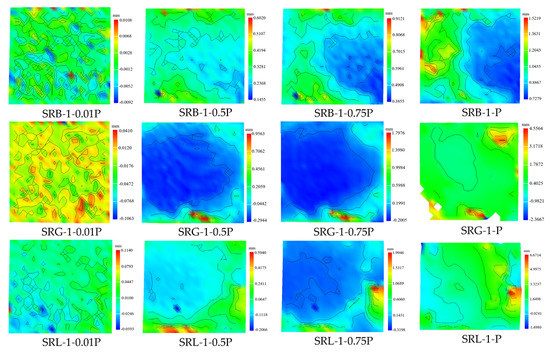
Figure 6.
Major strain cloud diagrams of rock specimens.
The next step was to clarify the width of the crack in the specimen. In the strain cloud diagrams, the direction along the length of the specimen was set as the X-direction, and the position of the peak strain was taken to set the measurement intercept line parallel along the X-direction. Thus, the selected horizontal segment was located at the tip of the crack-maturation notch, and the strain data on the intercept line were extracted. Figure 7 shows the strain distribution pattern along the intercept line in the same plane for the specimens of the SRB-1, SRG-1 and SRL-1 groups. The intercept line formed a peak region, and the peak indicated the cracking misalignment in the interfacial zone around the aggregate. In contrast, the displacement change in the interfacial zone around the aggregate on the left side was smaller, and the crack did not yet fully develop on the left side of the specimen compared with the right side. Comparing the cracking behavior of the three specimens, mortar rubble clearly showed that the limestone-mortar-rubble had the largest principal strain, which was 8.60% in the direction of the intercept line, and cracking was more obvious.
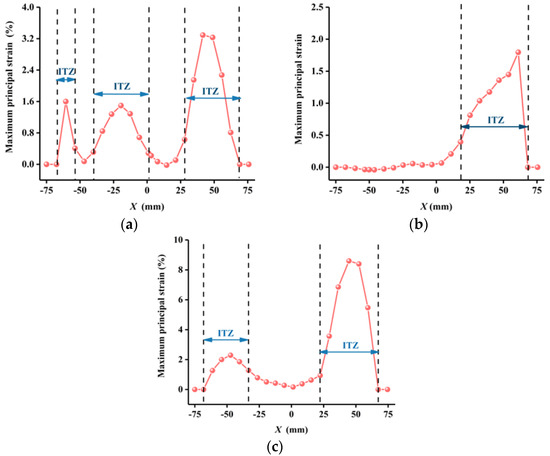
Figure 7.
Maximum principal strain on the horizontal section. (a) SRB-1. (b) SRG-1. (c) SRL-1.
3.3. Analysis of Characteristic Parameters of AE
3.3.1. Characteristic Curves of AE Energy vs. Time
All the characteristic parameters of AE energy are related to the signal energy. These parameters reflect information about the energy released by crack formation and expansion under loading. Figure 8 shows the AE energy curves vs. stress development for the SRB-1, SRG-1, and SRL-1 groups. Figure 8a,b show that the AE signal patterns of the basalt and granite mortar rubble specimens were similar. In the initial stage of damage, which is microfracture pressure-dense closure, and the AE activity energy was generally low. After reaching the crack growth stage, the value of the AE energy surged, the cracking became active, and a large amount of damage appeared. A longer time was required to maintain a high energy level. The cumulative AE energy curve and the stress-strain curve showed similar trends. The highest instantaneous energy of the granite mortar rubble was 1349 mV·ms, which was 4.1 times greater than that of the basalt mortar rubble (326 mV·ms). As shown in Figure 8c, the limestone mortar rubble had only a single energy peak, the accumulated energy was much smaller than that of the other specimens, and the energy of resistance to damage was relatively small. The resistance to damage was very brief, and brittle fracture occurred instantaneously.
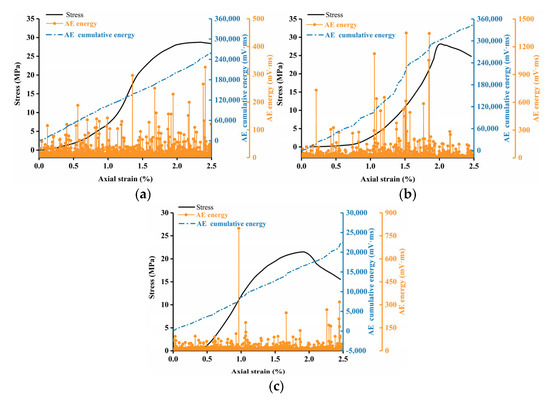
Figure 8.
Characteristics of AE energy-time evolution. (a) SRB-1. (b) SRG-1. (c) SRL-1.
3.3.2. RA-AF Analysis
As mortar is a mixture of aggregate and mortar, its mode of damage under compression includes tensile damage and shear damage. The damage type of cracking can be evaluated based on the correlation between RA and AF in the AE characteristic parameters. RA is the ratio of rise time to amplitude. AF is defined as the ratio of ringing count to duration in kHz. The energy of a longitudinal wave released by the damage under tension is large, and the AE waveform has a short rise time and high frequency. The energy released by a transverse wave caused by damage under shear is large, and its AE waveform has a long rise time and low frequency. The ratio of RA and AF, k, is affected by the nature of the test material. According to the empirical value, the value of k was taken as 30. The damage mode discrimination criteria based on the RA-AF value of acoustic emission are shown in Figure 9.
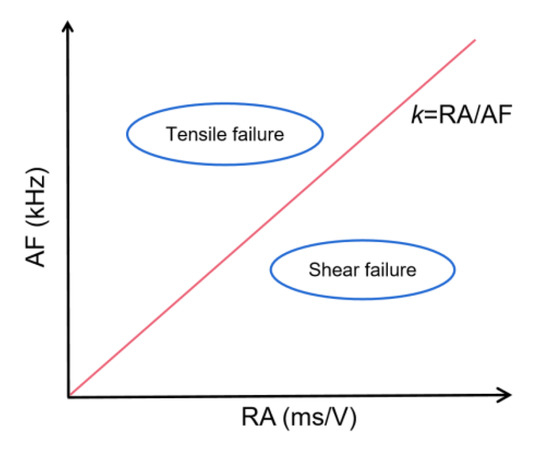
Figure 9.
Fracture mechanism analysis based on AF and RA.
Figure 10 shows the RA-AF relationships for the SRB-1, SRG-1, and SRL-1 groups. The test results for SRG-1 and SRL-1 exhibited relatively small RA values and large AF values, i.e., the rupture was mainly tensile rupture, and there was less shear damage than tensile damage. The interfacial damage was dominated by tensile cracking. Compared with the other two types of specimens, the basalt-mortar rubble had a higher ratio of shear damage to tensile damage (S/T) and was subject to a greater probability of shear cracking. The distribution range of the average frequency AF of basaltic mortar rubble were less variable. The basaltic mortar rubble showed shear damage biased in the horizontal direction in addition to interfacial damage, and I-II composite fracture occurred. The results indicated that the change in aggregate type caused the fracture pattern of mortar rubble to change as well. The fracture pattern of mortar rubble characterized by RA-AF was generally consistent with the DIC test results.
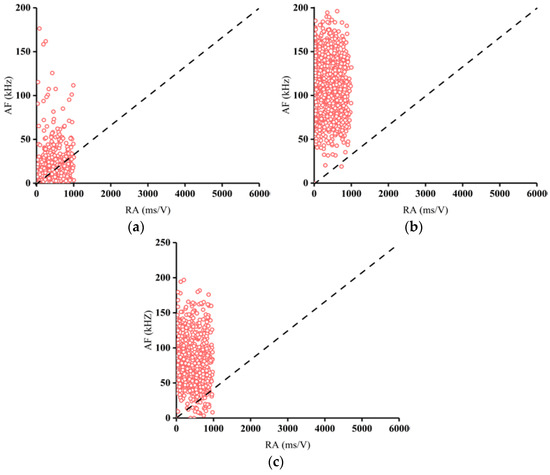
Figure 10.
Analysis of the fracture mechanism at the interface of mortar rubble. (a) SRB-1. (b) SRG-1. (c) SRL-1.
3.3.3. AE Duration vs. Ringing Count
Figure 11 represents the relationship between AE duration and ringing count for the 1 SRB-1, SRG-1, and SRL-1 groups. As shown in Figure 11, there was a positive correlation between the AE duration and the ringing count, i.e., the ringing count increased with increasing duration. The equation for the correlation was established according to the linear relationship, the fitting effect was good, and the correlation coefficient R2 of the three equations was greater than 0.8. The largest correlation coefficient (R2 = 0.852) was obtained for the AE count-duration equation of the specimen of mortar rubble SRG-1. The fitting results indicated that the model had explained the behavior of the granite mortar rubbles to a significant extent.
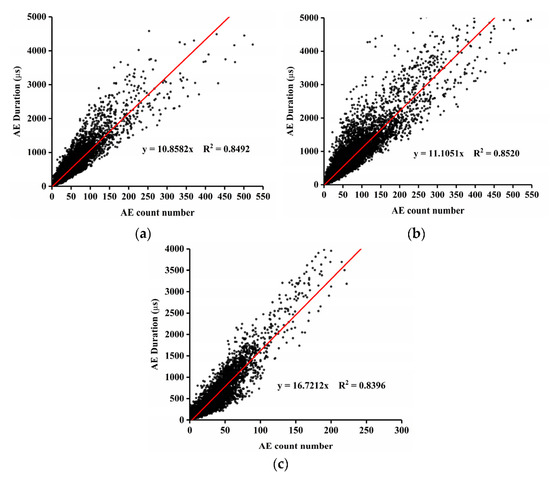
Figure 11.
Fracture mechanism analysis of mortar rubble. (a) SRB-1. (b) SRG-1. (c) SRL-1.
3.3.4. AE Frequency Domain Feature Analysis
The next step was to analyse the relationship between the frequency domain and amplitude of the AE signal segment by segment. The short-time Fourier transform (STFT) of the original waveform of the AE data in the uniaxial scaling test and the STFT expression of the AE signal f(t) are shown in Equation (6),
where h(τ − t) is the analysis window function; w is the signal frequency; A is the peak frequency; f is the time; and t is the 3-D time-frequency evolutionary relationship image.
Figure 12 shows the time evolution of the AE frequency and amplitude during the loading process for the SRB-1, SRG-1, and SRL-1 groups, where the amplitude A-time t evolution and the amplitude A-peak frequency f evolution are shown in the projection plane of each data point on both sides of the 3D coordinate axis. The distribution of frequency and amplitude before the peak of the AE signal is shown in Figure 12. In Figure 12, the spectral signal is divided into three signal bands, i.e., 0–100 kHz, 100–200 kHz, and 200–320 kHz. Each section has a signal concentration region in the range of 50 kHz, 160 kHz, and 260 kHz. Regions I and II have wider bands, while that of region III is narrower. The three regions show two different frequency concentration bands. When loaded up to 100 s, the high frequency signals were more abundant. The 100–320 kHz high-frequency signals came mainly from the interfacial slip of the mortar and aggregate; in addition, some of the aggregate spalled. The early-warning signal for determining the damage load was in the high frequency range of 160–320 kHz. With the increasing amplitude of AE, the interface peeled off, the bandwidth of the spectral signal band decreased, and the signal as a whole was in the shape of a spire. This indicated that the damage mode of mortar rubble mainly came from interfacial fracture, which was consistent with the results obtained by the DIC method. Comparing the three specimens, the SRG-1 specimen had the widest frequency band at 100–200 kHz, and the high frequency AE signal had greater amplitude and signal intensity.
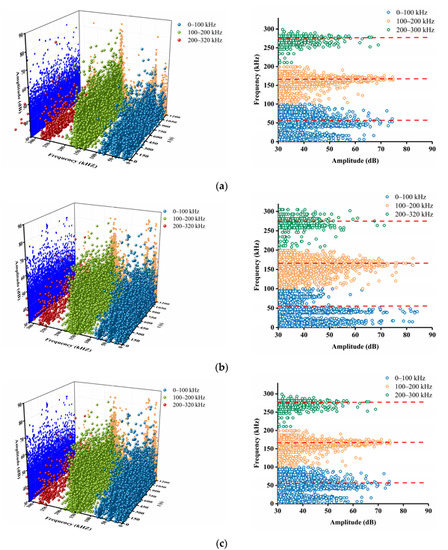
Figure 12.
Frequency domain characteristics of the bond interface. (a) SRB-1. (b) SRG-1. (c) SRL-1.
During the crack growth phase, the frequency bands of the SRB-1, SRG-1, and SRL-1 groups were dominant, as shown in Figure 13. In the current stage, the frequency band measured by AE was dominated by signals from 150 kHz to 225 kHz. The maximum limit of the frequency that corresponded to interfacial debonding of mortar rubble was 225–300 kHz, and interfacial damage occurred at frequencies that exceeded 300 kHz. The signals in the frequency band of 150–225 kHz were more predominant in the basalt-aggregate specimens than in the other specimens. This meant that when basalt was used as an aggregate, the signal frequency in the dominant band before specimen damage was relatively high, and the low-frequency acoustic emission signal was relatively weak. This result most likely indicated that the basalt-mortar rubble microjoints developed more slowly, the interfacial bond was strong, and the probability of destabilization damage of the specimen was relatively low.
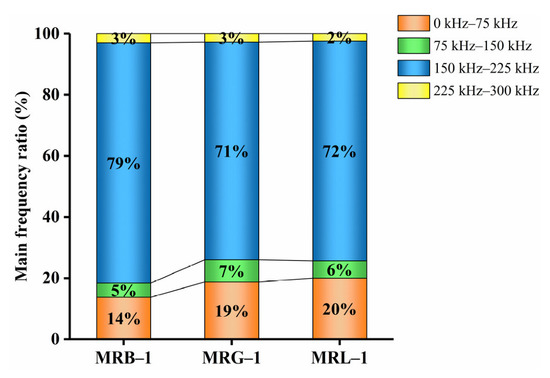
Figure 13.
Percentage of medium frequency bands in the crack growth phase.
3.3.5. Localization Point Analysis of Damage
The evolution of the acoustic emission locations at different stress stages for the three mortar rubble loadings until damage is shown in Figure 14. In the initial loading stage, the AE events tended to occur close to the fracture location. The microfractures of all three mortar-rubble specimens started at the interface and then extended to the mortar region with increasing stresses. At lower loads, the difference in AE locations of the three specimens was large, especially the basalt aggregate specimens, which had less acoustic emission information, indicating that the fracture damage occurred relatively late. In the preloading period, the AE signals indicated the gradual tightening of the mortar aggregate interface. When the observed loading reached 50% Pmax, the AE events clustered near the macroscopic fracture zone of the mortar rubble, and many AE signals appeared at the aggregate mortar interface with coherent and dense emission signals. This behavior was consistent with that observed in Figure 5 and Figure 6. Upon reaching the peak load Pmax, AE signal cracks were observed to develop to full interface penetration, and they formed a clear damage zone along the loading direction. The results for the localization of the damage source under uniaxial loading revealed the mechanism of the development of interfacial cracks in the mortar rubble and the damage mechanism of the specimens. The overall analysis showed that overall, the AE events were distributed primarily at both ends.
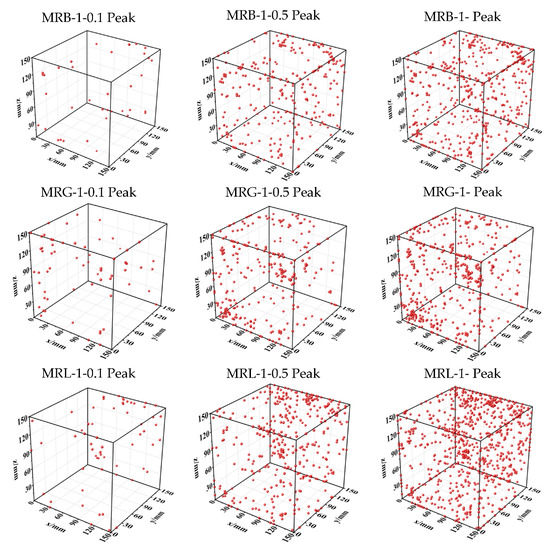
Figure 14.
Location of the AE signal source.
3.4. Microscopic Analysis of Mortar–Rubble Interfacial Zone
The SEM results for interfaces in mortar rubble made of three crushed aggregates, basalt, granite and limestone, are shown in Figure 15. The SEM magnification was 30,000 times. The high-resolution SEM images confirmed that the pore structure of the ITZ of mortar rubble differed according to aggregate type. Figure 15 shows the aggregation of mortar-hydration products on the bonded interface between mortar and aggregate, with interlocking hydration products, including calcium silicate hydrate (C-S-H) and Ca(OH)2 on the hexahedron. It is obvious that the C-S-H gel on the surface of the mortar rubble ITZ had a slender fibrous structure and was bonded by a network structure (Figure 15a). The C-S-H gel formed by the hydration reaction of the cement slurry adhering to the pores of the aggregate exhibited a “root pile” effect, which improved the bonding performance of the ITZ. Figure 15 shows that the strength between the mortar and aggregate was mainly derived from the strength of the ITZ strength. The SEM results were consistent with the conclusions obtained from 3D-DIC and AE monitoring.
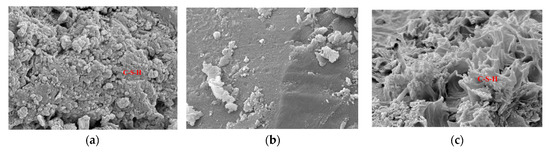
Figure 15.
SEM image of mortar rubble ITZ. (a) SRB-1. (b) SRG-1. (c) SRL-1.
Figure 16 shows the 3D intensity maps of the three mortar rubbles after ITZ treatment. In Figure 16, the blue pixels represent the defects of the samples, and the red pixels represent the pores and cracks on the surfaces of the specimens. During loading, more microcracks appeared around the aggregate, especially in the interfacial area, which was the most prominent. The granite mortar rubble specimens had less area in the red part of the interfacial zone and fewer pores than the other specimens. Because of the lower porosity of the granite aggregate, the integrity of the interfacial zone was much greater than that of the basalt and limestone specimens.
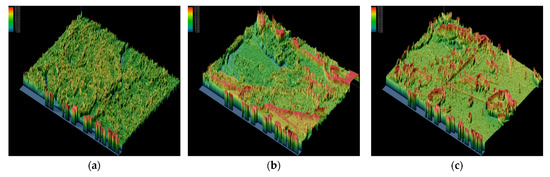
Figure 16.
3D image of mortar rubble ITZ. (a) SRB-1. (b) SRG-1. (c) SRL-1.
To obtain accurate information about the ITZ, SEM photographs were processed using Image-ProPlus software, which quickly and accurately processed the microfracture morphological characteristics of the interfacial zone of the mortar rubble. To make the microscopic-analysis results accurate, the SEM images shown in Figure 15 were binarized. The processed image was clearly compared with the original image shown in Figure 17. This image-processing method accurately identified the microcrack segments in the SEM image. After processing, the pores in the ITZ were quantitatively analysed and spatially calibrated, a scale bar of 1 µm was created, and information was extracted about the pixel information of the pores and cracks. The pores were classified as gel pores (<10 nm), transition pores (from 10 to 100 nm), capillary pores (from 100 to 1000 nm) and large pores (>1000 nm), according to the Butte model. The pore number distributions of three groups of aggregate mortar rubble, SRB-1, SRG-1 and SRL-1, were plotted, as shown in Figure 18. According to the pore size statistics of the Butte model, the pore sizes of the mortar rubbles were concentrated in the ranges of 2–10 nm and 10–100 nm, i.e., mainly gel pores and transition pores. For granite mortar rubble, the gel pores accounted for 78% of the pores, and the transition pores were the fewest. This indicated that the macroscopic mechanical properties of granite mortar rubble were better than those of the other mortar rubbles.
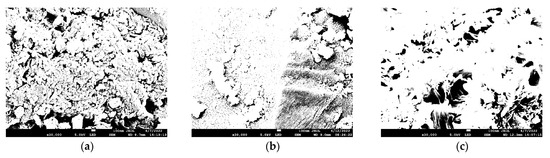
Figure 17.
Microstructure diagram after the binarization process. (a) SRB-1. (b) SRG-1. (c) SRL-1.
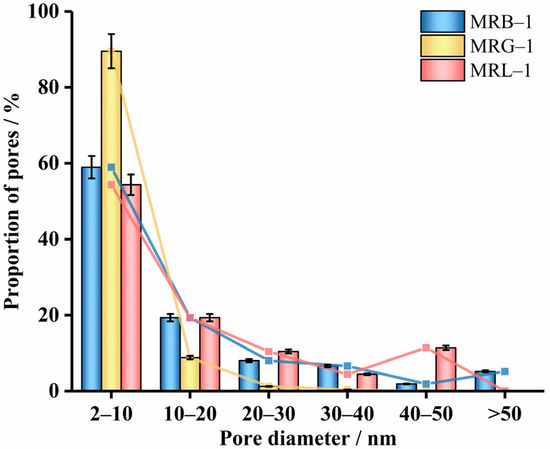
Figure 18.
Pore distributions of the mortar rubble ITZs.
The PCAS technique and fractal theory were used to evaluate the microstructure of the ITZs of the mortar rubbles, the results were statistically analysed, and the results are shown in Table 8. The pore area and average perimeter were based on the relative length of a given homogeneous scale picture. The fractal dimension, called the inhomogeneity of the data, is mostly used to describe the degree of homogeneity of the data variation within a certain range. Often, the larger the number of fractal cones, the stronger the inhomogeneity [41]. The reciprocal shape factor of roundness was used to characterize the roughness of the edges of the ITZ pores. The smaller the value of the shape factor is, the rougher the pore edge and the more complex the structure. The shape factor is calculated as shown in Equation (7),
where A is the pixel area and Pi is the pixel perimeter.
Table 8.
ITZ microanalysis parameter statistics.
According to Table 8, the interfacial porosity of limestone was larger (30.00%) and the maximum direct and average perimeters were larger compared with basalt and granite mortar rubbles. The larger interfacial porosity led to insufficient strength of the aggregate-to-mortar joint and, thus, lower strength. While granite mortar rubble had a smaller shape factor and larger fractal cone number, its pore structure became complex, and the pores developed in random directions. This indicated that granite-mortar rubble had better interfacial connection ability than the other mortars. The results of this analysis results were consistent with the above inferred situation. Figure 19 illustrates the characteristics of the porosity and reasons for damage to the ITZ. Combined with the analysis in Table 6, Figure 19 clearly shows that the proportion of cement particles in the ITZ was relatively small, while the proportions of water molecules and pores were significantly larger, around the aggregate than in the rest of the mortar. According to Branch et al. [42], the porosity of mortar tended to be only 8%. In contrast, this experimental study found that the porosities of the surfaces of the ITZs in the three mortar rubble aggregates were as high as 18.70–30.00% and far exceeded that of the mortar matrix. This phenomenon is referred to as the sidewall effect by scholars [43,44]. That is, excessive porosity weakens the association between the aggregate and matrix, which decreases the integrity of the structural linkage and consequently, the damage. This phenomenon is consistent with the results of macroscopic tests in which cracking in the interfacial zone was detected using DIC in this study. In summary, the extent and degree of the mortar-rubble edge wall effect was clearly influenced by microscopic coefficients such as aggregate porosity, size, shape and fractal cone number. There was a strong relationship between the strength and damage mode of mortar rubble and microscopic pore structure parameters.
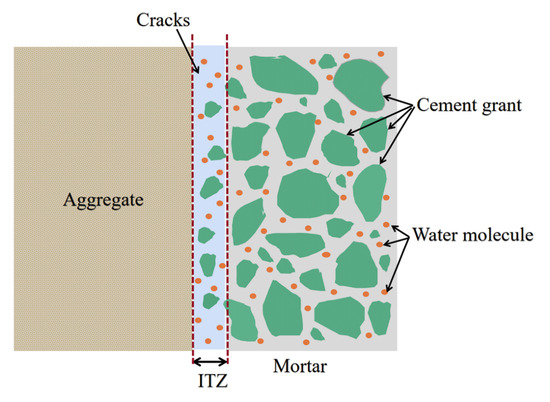
Figure 19.
The failure mechanism of the mortar-rubble interfacial zone.
4. Conclusions
In this study, the process of damage under axial compression was investigated for mortar rubbles that contained different aggregate types. Various testing techniques combining DIC, AE and SEM were used. Based on the data analysis and discussion of the results, the following conclusions were drawn:
The loading process was divided into four stages, i.e., the initial stage, the crack growth stage, the peak stage, and the damage stage. The AE energy analysis shows that the limestone shows the earliest energy peak at the crack growth stage, and the duration of the peak is very short, indicating that the limestone is relatively weak against compression damage.
Additionally, the results show that interfacial debonding was the main damage mode of the mortar rubble structures. The magnitude of the strength of the interlocking of the aggregate and mortar was the key factor that affected the compressive strength of the materials.
Granite- and limestone-mortar rubble underwent predominantly tensile damage. In addition to interfacial damage, basaltic mortar rubble underwent shear damage biased to the horizontal direction, and I-II composite fracture occurred. This indicated that the fracture mode of the mortar rubbles differed according to the aggregate types.
There were three concentrated regions of values in the ranges of 50 kHz, 160 kHz, and 260 kHz in the frequency domain. Acoustic emissions of mortar rubble were strongest in the 150–220 kHz range and gave an early warning of the damage load at high frequencies (160–320 kHz).
Limestone-mortar rubble had the highest interfacial porosity, largest fractal cone number and worst inhomogeneity among the three aggregates, and there was an obvious sidewall effect, but the interfacial strength was weak. The pore structure had a significant effect on the interfacial bond strength.
The C-S-H gel formed by the hydration reaction of the cement slurry adhered to the pores of the aggregate and exhibited a “root pile” effect that improved the bonding performance of the ITZ. The microscopic results were consistent with the damage characteristics monitored by 3D-DIC and AE. This multi-faceted analysis truly reflected the state and evolution of the damage of mortar rubbles, and the results were very effective for determining the mechanical mode of damage of mortar rubbles.
Author Contributions
Conceptualization, Z.-Q.L.; methodology, Z.-Q.L. and H.C.; validation, H.C. and J.D.; formal analysis, Z.-Q.L. and H.C.; investigation, J.D. and H.C.; resources, Z.-Q.L. and H.C.; data curation, Z.-Q.L., X.Y. and S.-R.Z.; writing—original draft preparation, Z.-Q.L. and Y.-H.Z.; writing—review and editing, Y.-H.Z. and Y.L.; funding acquisition, J.D. All authors have read and agreed to the published version of the manuscript.
Funding
The research described in this paper was financially supported by the Natural Science Foundation of China (NO. 51878242), the Natural Science Foundation of Hebei Province of China (NO. E2020404007), the Doctoral Research Start-up Fund Project (B-202101), the Research Project of Basic Scientific Research Business Fund for Higher Education Institutions in Hebei Province (2021QNJS07), the Research Project on Basic Research Funds for Higher Education Institutions in Hebei Province (2021QNJS02).
Institutional Review Board Statement
Not applicable.
Informed Consent Statement
Not applicable.
Data Availability Statement
The data presented in this study are available on request from the corresponding author.
Conflicts of Interest
The authors declare no conflict of interest.
Abbreviations
| AE | acoustic emission |
| AF | counts/duration |
| CSC | coal–fired slag concrete |
| DIC | digital image correlation |
| GEP | gene expression programming |
| HDT | hit definition time |
| HLT | hit Lockout time |
| ITZ | interfacial transition zones |
| ML | machine learning, |
| STFT | short-time Fourier transform |
| PCAS | principal component analysis system |
| PDT | peak definition time |
| RA | risetime/amplitude |
| SEM | scanning electron microscopy |
References
- Zhizhong, S.; Wei, M.; Dongqing, L. In situ test on cooling effectiveness of air convection embankment with crushed rock slope protection in permafrost regions. J. Cold Reg. Eng. 2005, 19, 38–51. [Google Scholar] [CrossRef]
- Nie, Y.; Tang, S.; Xu, Y.; Mao, K. Numerical analysis and comparison of three types of herringbone frame structure for highway subgrade slopes protection. AIP Conf. Proc. 2018, 1955, 030013. [Google Scholar] [CrossRef]
- Zhang, Y.Q.; Mi, Y.N.; Wang, L.; Zhao, J.T.; Wang, Z.G.; Shao, X. Studies on the changes in the parameters stability of hinge joint concrete block slope. Appl. Mech. Mater. 2012, 166–169, 1639–1643. [Google Scholar]
- Xu, Y.; Li, D.L.; Peng, L.; Xiao, Y.; Nie, Y.H. The mechanical mechanism analysis for mortar arch framework slope protection structure. Adv. Mater. Res. 2013, 859, 143–148. [Google Scholar]
- Duan, J.; Xu, L.X.; Li, D.L.; Xu, Y. The monitoring research of stress and displacement about arch framework with flush joint precast. Appl. Mech. Mater. 2014, 638–640, 875–879. [Google Scholar]
- Gao, S.; Jin, J.; Hu, G.; Qi, L. Experimental investigation of the interface bond properties between SHCC and concrete under sulfate attack. Constr. Build. Mater. 2019, 217, 651–663. [Google Scholar] [CrossRef]
- Júlio, E.N.B.S.; Branco, F.A.B.; Silva, V.T.D. Concrete-to-concrete bond strength. Influence of the roughness of the substrate surface. Constr. Build. Mater. 2004, 18, 675–681. [Google Scholar] [CrossRef]
- Costa, H.; Carmo, R.N.F.; Júlio, E. Influence of lightweight aggregates concrete on the bond strength of concrete-to-concrete interfaces. Constr. Build. Mater. 2018, 180, 519–530. [Google Scholar] [CrossRef]
- Jia, J.Y.; Gu, X.L. Effects of coarse aggregate surface morphology on aggregate-mortar interface strength and mechanical properties of concrete. Constr. Build. Mater. 2021, 294, 123515. [Google Scholar] [CrossRef]
- Mazzucco, G.; Salomoni, V.A.; Majorana, C. A cohesive contact algorithm to evaluate the mechanical behaviour of concrete ITZ at different roughness conditions. Constr. Build. Mater. 2021, 294, 123479. [Google Scholar] [CrossRef]
- Thongchom, C.; Lenwari, A.; Aboutaha, R.S. Bond properties between carbon fibre-reinforced polymer plate and fire-damaged concrete. Int. J. Adhes. Adhes. 2020, 97, 102485. [Google Scholar] [CrossRef]
- Abdel-Jaber, M.; Abdel-Jaber, M.; Katkhuda, H.; Shatarat, N.; El-Nimri, R. Influence of Compressive Strength of Concrete on Shear Strengthening of Reinforced Concrete Beams with Near Surface Mounted Carbon Fiber-Reinforced Polymer. Buildings 2021, 11, 563. [Google Scholar] [CrossRef]
- Grinys, A.; Balamurugan, M.; Augonis, A.; Ivanauskas, E. Mechanical Properties and Durability of Rubberized and Glass Powder Modified Rubberized Concrete for Whitetopping Structures. Materials 2021, 14, 2321. [Google Scholar] [CrossRef]
- Ahmad, A.; Chaiyasarn, K.; Farooq, F.; Ahmad, W.; Suparp, S.; Aslam, F. Compressive Strength Prediction Via Gene Expression Programming (GEP) and Artificial Neural Network (ANN) for Concrete Containing RCA. Buildings 2021, 11, 324. [Google Scholar] [CrossRef]
- Stempkowska, A.; Gawenda, T.; Naziemiec, Z.; Adam Ostrowski, K.; Saramak, D.; Surowiak, A. Impact of the Geometrical Parameters of Dolomite Coarse Aggregate on the Thermal and Mechanic Properties of Preplaced Aggregate Concrete. Materials 2020, 13, 4358. [Google Scholar] [CrossRef]
- Aggelis, D.G.; De Sutter, S.; Verbruggen, S.; Tsangouri, E.; Tysmans, T. Acoustic emission characterization of damage sources of lightweight hybrid concrete beams. Eng. Fract. Mech. 2019, 210, 181–188. [Google Scholar] [CrossRef]
- Becker, T.H.; Mostafavi, M.; Tait, R.B.; Marrow, T.J. An approach to calculate the J-integral by digital image correlation displacement field measurement. Fatigue Fract. Eng. Mater. Struct. 2012, 35, 971–984. [Google Scholar] [CrossRef]
- Mokhtarishirazabad, M.; Lopez-Crespo, P.; Zanganeh, M. Stress intensity factor monitoring under cyclic loading by digital image correlation. Fatigue Fract. Eng. Mater. Struct. 2018, 41, 2162–2171. [Google Scholar] [CrossRef]
- Venkatachalam, S.; Mohiddin, S.M.K.; Murthy, H. Determination of damage evolution in CFRP subjected to cyclic loading using DIC. Fatigue Fract. Eng. Mater. Struct. 2018, 41, 1412–1425. [Google Scholar] [CrossRef]
- Song, H.; Zhang, H.; Fu, D.; Kang, Y.; Huang, G.; Qu, C.; Cai, Z. Experimental study on damage evolution of rock under uniform and concentrated loading conditions using digital image correlation. Fatigue Fract. Eng. Mater. Struct. 2013, 36, 760–768. [Google Scholar] [CrossRef]
- Watanabe, T.; Nishibata, S.; Hashimoto, C.; Ohtsu, M. Compressive failure in concrete of recycled aggregate by acoustic emission. Constr. Build. Mater. 2007, 21, 470–476. [Google Scholar] [CrossRef]
- Abouhussien, A.A.; Hassan, A.A.A. Acoustic emission monitoring for bond integrity evaluation of reinforced concrete under pull-out tests. Adv. Struct. Eng. 2016, 20, 1390–1405. [Google Scholar] [CrossRef]
- Sagar, R.V. Acoustic emission characteristics of reinforced concrete beams with varying percentage of tension steel reinforcement under flexural loading. Case Stud. Constr. Mater. 2017, 6, 162–176. [Google Scholar] [CrossRef]
- Farhidzadeh, A.; Mpalaskas, A.C.; Matikas, T.E.; Farhidzadeh, H.; Aggelis, D.G. Fracture mode identification in cementitious materials using supervised pattern recognition of acoustic emission features. Constr. Build. Mater. 2014, 67, 129–138. [Google Scholar] [CrossRef]
- Wu, K.; Chen, B.; Yao, W. Study of the influence of aggregate size distribution on mechanical properties of concrete by acoustic emission technique. Cem. Concr. Res. 2001, 31, 919–923. [Google Scholar] [CrossRef]
- Liu, W.; Guo, Z.; Niu, S.; Hou, J.; Zhang, F.; He, C. Mechanical properties and damage evolution behavior of coal–fired slag concrete under uniaxial compression based on acoustic emission monitoring technology. J. Mater. Res. Technol. 2020, 9, 9537–9549. [Google Scholar] [CrossRef]
- Wang, J.Y.; Chen, Z.Z.; Wu, K. Properties of calcium sulfoaluminate cement made ultra-high performance concrete: Tensile performance, acoustic emission monitoring of damage evolution and microstructure. Constr. Build. Mater. 2019, 208, 767–779. [Google Scholar] [CrossRef]
- Li, G.; Zhang, L.; Zhao, F.; Tang, J. Acoustic emission characteristics and damage mechanisms investigation of basalt fiber concrete with recycled aggregate. Materials 2020, 13, 4009. [Google Scholar] [CrossRef]
- Peng, Y.; Ying, L.; Kamel, M.M.A.; Wang, Y. Mesoscale fracture analysis of recycled aggregate concrete based on digital image processing technique. Struct. Concr. 2020, 22, E33–E47. [Google Scholar] [CrossRef]
- Meng, S.; Li, J.; Liu, Z.; Wang, W.; Niu, Y.; Ouyang, X. Study of flexural and crack propagation behavior of layered fiber-reinforced cementitious mortar using the digital image correlation (DIC) technique. Materials 2021, 14, 4700. [Google Scholar] [CrossRef]
- Yuan, Y.; Li, M.; Alquraishi, A.S.S.; Sun, H. Experimental study on the novel interface bond behavior between fiber-reinforced concrete and common concrete through 3D-DIC. Adv. Mater. Sci. Eng. 2021, 2021, 9090348. [Google Scholar] [CrossRef]
- Tang, Z.; Li, W.; Peng, Q.; Tam, V.W.Y.; Wang, K. Study on the failure mechanism of geopolymeric recycled concrete using digital image correlation method. J. Sustain. Cem. Based Mater. 2021, 11, 113–126. [Google Scholar] [CrossRef]
- Pour, A.F.; Verma, R.K.; Nguyen, G.D.; Bui, H.H. Analysis of transition from diffuse to localized failure in sandstone and concrete using Digital Image correlation. Eng. Fract. Mech. 2022, 267, 108465. [Google Scholar] [CrossRef]
- Li, W.; Xiao, J.; Sun, Z.; Shah, S.P. Failure processes of modeled recycled aggregate concrete under uniaxial compression. Cem. Concr. Compos. 2012, 34, 1149–1158. [Google Scholar] [CrossRef]
- Xiangqian, F.; Shengtao, L.; Xudong, C.; Saisai, L.; Yuzhu, G. Fracture behaviour analysis of the full-graded concrete based on digital image correlation and acoustic emission technique. Fatigue Fract. Eng. Mater. Struct. 2020, 43, 1274–1289. [Google Scholar] [CrossRef]
- Liu, J.; Kanwal, H.; Tang, C.; Hao, W. Study on flexural properties of 3D printed lattice-reinforced concrete structures using acoustic emission and digital image correlation. Constr. Build. Mater. 2022, 333, 127418. [Google Scholar] [CrossRef]
- Luo, L.; Li, X.; Tao, M.; Dong, L. Mechanical behavior of rock-shotcrete interface under static and dynamic tensile loads. Tunn. Undergr. Space Technol. 2017, 65, 215–224. [Google Scholar] [CrossRef]
- Moradian, Z.A.; Ballivy, G.; Rivard, P. Application of acoustic emission for monitoring shear behavior of bonded concrete–rock joints under direct shear test. Can. J. Civ. Eng. 2012, 39, 887–896. [Google Scholar] [CrossRef]
- Caliskan, S.; Karihaloo, B.L.; Barr, B.I.G. Study of rock–mortar interfaces. Part II: Strength of interface. Mag. Concr. Res. 2002, 54, 463–472. [Google Scholar] [CrossRef]
- Pan, J.; Shen, Y.; Yang, G.; Zhang, H.; Yang, H.; Zhou, Z. Debonding behaviors and micro-mechanism of the interface transition zone in sandstone-concrete interface in response to freeze-thaw conditions. Cold Reg. Sci. Technol. 2021, 191, 103359. [Google Scholar] [CrossRef]
- Liu, C.; Shi, B.; Zhou, J.; Tang, C. Quantification and characterization of microporosity by image processing, geometric measurement and statistical methods: Application on SEM images of clay materials. Appl. Clay Sci. 2011, 54, 97–106. [Google Scholar] [CrossRef]
- Branch, J.L.; Epps, R.; Kosson, D.S. The impact of carbonation on bulk and ITZ porosity in microconcrete materials with fly ash replacement. Cem. Concr. Res. 2018, 103, 170–178. [Google Scholar] [CrossRef]
- Elsharief, A.; Cohen, M.D.; Olek, J. Influence of aggregate size, water cement ratio and age on the microstructure of the interfacial transition zone. Cem. Concr. Res. 2003, 33, 1837–1849. [Google Scholar] [CrossRef]
- Wang, B.; Yan, L.; Fu, Q.; Kasal, B. A comprehensive review on recycled aggregate and recycled aggregate concrete. Resour. Conserv. Recycl. 2021, 171, 105565. [Google Scholar] [CrossRef]
Publisher’s Note: MDPI stays neutral with regard to jurisdictional claims in published maps and institutional affiliations. |
© 2022 by the authors. Licensee MDPI, Basel, Switzerland. This article is an open access article distributed under the terms and conditions of the Creative Commons Attribution (CC BY) license (https://creativecommons.org/licenses/by/4.0/).