Article

Transit-Oriented Development in New Towns: Identifying Its Association with Urban Function in Shanghai, China

1
College of Architecture and Urban Planning, Tongji University, Shanghai 200092, China
2
Key Laboratory of Ecology and Energy-Saving Study of Dense Habitat, Tongji University, Shanghai 200092, China
*
Author to whom correspondence should be addressed.
Buildings 2022, 12(9), 1394; https://doi.org/10.3390/buildings12091394
Submission received: 26 July 2022 / Revised: 27 August 2022 / Accepted: 1 September 2022 / Published: 6 September 2022

Abstract

:
Transit-oriented development (TOD) construction is considered critical for economic growth and the population’s daily well-being in suburban development. However, there are few empirical evaluations of TOD performance and typology in suburban areas of high-density cities. In this study, we selected 23 metro stations in the five new towns in Shanghai as research objects to understand their TOD characteristics. By proposing a data-driven framework built on points of interest (PoIs) to characterize urban functions of metro stations in new towns, four thematic topic functions were extracted by implementing Latent Dirichlet Allocation (LDA) topic modeling. Five types of stations were revealed through a hierarchical cluster analysis based on their main functions. Then, an extended “Node-Place” model with a third “design” dimension was applied to classify TOD typologies. After establishing an evaluation framework by calculating the results of 15 indicators, five TOD topologies were identified through hierarchical cluster analysis. In addition, results from the ANOVA analysis showed that the classification according to thematic topics changes according to the “place” dimension indicators. Ultimately, the identified urban thematic function types and TOD types provide a useful tool for planners and governors to diagnose common problems and design targeted strategies in new towns.

1. Introduction

Chinese cities have experienced unprecedented suburban growth since 2000. New town development has been adopted as an important means to optimize the urban spatial structure of large cities and cope with urban growth. In Shanghai, there is a decreasing difference in population density between the inner city and the suburbs, and a growing trend in the multi-center population patterns [1]. Although the suburban new towns in Shanghai have become the main clusters for economic activities, the scope of employment in each new town is still concentrated, and the single-centered expansion remains the city’s dominant spatial pattern [2]. Accordingly, rail transit has been adopted as an instrument for financing suburban development to facilitate growth, and a transit-oriented development (TOD) strategy has been proposed as an efficient approach to concentrate jobs, housing, and services around metro stations [3].
In Shanghai, the government has promoted the development of new towns to alleviate the pressure on the urban core. The strategy evolved from the “One City, Nine Towns Development Plan” of 2001 to the development of the “Seven New Cities” during the 12th Five-year Plan and the plan to build the “Five New Cities” in suburban Jiading, Qingpu, Songjiang, and Fengxian districts as well as Nanhui in the Pudong New Area during the 14th Five-Year Plan (2021–2025). The development of Shanghai’s new towns is closely related to its urban railway development. In 2007, Songjiang New City was connected to the central urban area by metro line 9, becoming the first of the five new towns to operationalize the metro. Jiading was connected to Central Shanghai by Metro line 11 at the end of 2009. Metro line 9 benefited Songjiang, and line 11 promoted Jiading and Lingang [4]. In Shanghai’s strategic plan for future development, the “Five New Cities” are the top priority. In addition, the TOD community and 15-min community life circles are expected to be the focus of metro construction in new towns with major developments planned for rail transit projects [5]. By 2035, each new town with over 100,000 residents is expected to have its metro stations. The catchment areas of the metro stations with a radius of 600 m covers 30% of the area of the new city, and the resident population and employment coverage ratios within a 600 m radius of the metro station in five new towns will reach 40%.
In this context, it is imperative to examine the TOD performance of metro station areas in new towns and to discuss how TOD should be adapted to suburban Shanghai. The rapid growth of multi-source geospatial big data and new technologies provides novel analysis methods for quantifying the characteristics of transit station areas [6,7,8,9,10]. Nevertheless, previous studies using non-traditional data have seldom investigated the existing urban functions and how they interact with built environments to shape vibrant metro stations areas and achieve their planning objectives [7]. By 2035, each new town is expected to have over one million people, which is comparable to most second-and third-tier cities in China. From this perspective, the TOD research on new towns is more universal than that on the metropolis. It is imperative to examine the TOD performance of metro station areas for new towns and to discuss how TOD should be adapted to suburban Shanghai. However, few such studies have examined TOD performance and typology for suburban cities. Accordingly, we attempt to address existing research gaps by exploring the following research questions:
By identifying the most prototypical thematic topics of urban functions for catchment areas, how do such thematic topics depict a metro station and each new town?
  • To what extent do existing conditions of TOD sites meet TOD standards?
  • Can TOD performance be measured and determined via thematic urban functions?
To answer the research questions, 23 metro station catchment areas of 600 m radius around 23 metro stations in the five new towns in Shanghai, China were examined in this study. All the stations are located 30–60 km from Shanghai’s city center. This study aimed to investigate whether the implementation of TOD of metro stations in new towns aligns with their planning objectives, to quantitatively explore their TOD performance using multi-source urban data, and to observe their TOD typology classification by extending the classic “node-place” model with a third “design” dimension. These can capture the TOD characteristics of metro station areas, thus providing an efficient method for planners and governors to diagnose common problems. The analysis also generates discussions concerning how TOD should be adapted to new towns in a large and growing metropolis.
The remainder of the article is organized as follows. Section 2 reviews the literature on the development of TOD in China and the extension of the node-place model. Section 3 introduces the data and methodology. Section 4 presents the results of the thematic urban functions and TOD performances. Finally, Section 5 provides a discussion on urban planning implications and limitations.

2. Literature Review

2.1. The Growth of TOD in China

Since Calthorpe introduced the TOD concept [11], considerable research related to this subject has been conducted in the West. Although China has a relatively short history regarding this topic [12], extensive research has investigated how TOD has unfolded over time in China’s metropolises. This is because urbanization in China has been increasing exponentially, with the urban population rising from 80 million in 1978 to 901.99 million in 2021 [13],; consequently, there were serious problems related to automobiles, pollution, and congestion [14]. TOD is one of the most appropriate strategies for sustainable land use, urban form, and transit [15]. Moreover, given that the Chinese urban periphery takes the form of high-density apartment buildings compared to the USA’s low-density houses, the potential for TOD implementation in China is extremely high [16].
Therefore, scholars are committed to adapting TOD principles to the Chinese context. Considering the overall prospect of the TOD strategy in China, Yanping Chen stated that the development of transport-oriented land use forms is the key to solving urban traffic problems in the country [17]. Scholars in China and abroad have published various influential articles focusing on large Chinese cities with developed metro networks, such as Hong Kong, Taipei, Beijing, Shanghai, and Shenzhen. For example, Alice Chow believes Tseung Kwan O new town in Hong Kong achieved transport and urban sustainability through the TOD concept [18]. Kheir Al-Kodmany identified four types of Tall Buildings and Transit-Oriented Development (TB-TOD) models within different areas in Hong Kong, from the old city and city edge to the suburban and new areas [19]. Zidong Yu proposed a framework to describe four thematic urban functions of metro stations through points of interest (PoIs) in Hong Kong [7]. Additionally, Pengjun Zhao investigated the lifestyle, shopping, and entertainment choices of passengers around Beijing subway station areas, believing that in the process of suburbanization, land-use planning based on the TOD model can help shape sustainable mobility [20]. Moreover, taking Shanghai as an example, Bindong Sun analyzed the built environment’s impact on commuting behavior and concluded that the TOD model can help shorten travel distances [21]. Some researchers explored variations and typology of TOD in Shanghai: Yao Chen [22] categorized them into five types with different degrees of congestion, putting forward optimizing suggestions for high congestion stations; Zekun Li [23] clustered them into four types based on the “node-place” model, offering optimization plan for the stations with low TOD index values. Furthermore, Jiawen Yang took Shenzhen as an example to analyze the impact of location selection on TOD planning [24]. Ming Zhang proposed a practical TOD model to build a sustainable transportation system that combined the experiences of Hong Kong, Taipei, and mainland Chinese cities [25].
TOD has been widely adopted in Chinese cities, and the local government has realized the importance of applying this concept. Nevertheless, studies exploring TOD areas around suburban metro stations remain scarce. This is because of China’s unbalanced urban and rural development and the lack of access to detailed data [26]. Although Chinese urban planners typically prefer to adopt the TOD model when planning new neighborhoods, the current TOD implementation practices are still at a nascent stage. Many new towns in Hong Kong, acknowledged as the most successful TOD cases in China, are highlighted as the benchmark for implementing TOD in mainland China, even more widely in Asia [12,18]. Consequently, an increasing number of scholars have recognized the importance of metro stations in the urban periphery to conduct studies in megacities such as Beijing [20,27,28] and Nanjing [12], and uncover the logic of the TOD framework in small cities [29]. However, the existing investigations in Shanghai from this perspective were surprisingly limited. Haixiao Pan [30] examined two station areas in Songjiang, Shanghai, to assess the effectiveness of their TOD application and Jie Shen [3] examined the same cases to understand the social relations and processes of suburban infrastructures. However, these studies relied on traditional manually collected data, making it difficult to provide large-scale feedback on current planning practice. Thus, China still has a long way to go in this direction.
In short, though there have been numerous studies about TOD classification and evaluation in China, there is little quantitative evidence on estimating new town TOD. Although TOD has been proposed to serve Chinese new metro projects on the edges of cities, they have not been designed as vectors to shape new towns’ urbanization [31]. Strategies and suggestions for the construction of TOD in new towns generally focus on features, such as scale, facilities, position and classification, and mainly include qualitative elaboration, they lack refined quantitative measurement. Furthermore, most research has barely combined new towns’ comprehensive plans with TOD implementation on a large and fine scale. Therefore, this study considers all 23 metro stations in five new towns of Shanghai utilizing multi-source urban data and natural language processing techniques to define their main functions and more accurately explore their TOD performance.

2.2. Extension of “Node-Place” Model

The “node-place” model, typically used to classify TOD typologies, was established by Bertolini to describe various TOD forms in cities [32]. It focuses on the integration of nodes (the stations) and places (the catchment areas), projecting these two dimensions on a 2D coordinate system and further dividing five representative TOD typologies to depict the different combinations of development levels of one “node” and its surrounding “place”. The simple equation line in the coordinate system is divided into three parts (Dependence, Balance, and Stress), leaving the other two areas (Unbalanced node and Unbalanced place) outside the spindle-shaped outline. The node and place values are both weak in the “dependent” areas, the bottom of the line. The “balanced” areas are found along the middle of the line, where the relative positions on nodes and places are almost equal. The “stressed” areas at the top of the line can become problematic as both the node and the place are overused. Moreover, the rest areas are two unbalanced conditions. The “unbalanced node” sets above the spindle, where the transport dimension is more advanced than the urban development. By contrast, the “unbalanced place” is located below the spindle, where the situation is the opposite. Accordingly, massive research has been conducted to identify thorough and accurate indicators to describe the performance of TOD projects more precisely. Features related to traffic, station, and road/lines are usually assigned to the “node” dimension, whereas those that reveal density, development, and population are considered part of the “place” dimension [33,34,35]. This framework presents an effective way to reveal the relative position of one metro station within an urban network.
Some researchers noticed limitations of the classical “node-place” theory when it was widespread [15,36]. They pointed out that the two-dimensional model was insufficient to capture diverse TOD manifestations [37,38]. Consequently, various three-dimensional extended node-place models were constructed to better measure and describe the existing characteristics of TOD. As for the third dimension, some scholars emphasized walking friendliness and corresponding indicators at an early stage; lately, others combined and discussed various aspects in the extended dimension (Table 1).
In previous years, researchers argued that evaluating walkability can assess the built environment dimensions which that influence traffic, as it greatly impacts the accessibility of TOD’s catchment areas [39,40]. In the beginning, several elementary indices were chosen to depict walkability. Kamruzzaman [41] and Singh [42] tried to apply the “3 Ds” [43] theory (Density, Diversity, Design) to establish criteria. Both proposed using intersection density. However, Singh considered the streetscape quality for walking/cycling more important than Kamruzzaman’s cul-de-sac density, which is similar to intersection density. Additionally, Monajem and Nosratian [44] utilized closeness and betweenness calculated by space syntax tools to measure pedestrian friendliness, whereas Vale [38] introduced “pedshed ratios,” calculated by dividing pedestrian catchment areas with a circle with the same distance radius. Before long, Lyu [37] and Nigro [45] tried to add assorted indicators to the extended dimension. Nigro’s research concentrated on TOD strategies in the context of low-density areas, whereas Lyu focused more attention on Chinese high-density areas, which are more relevant to our study.
More recently, “5 Ds” [46] (Density, Diversity, Design, Destination accessibility, and Distance to transit) or “3 Ds + A” [47] (Density, Diversity, Design, and Accessibility) have become increasingly popular in the extended node-place model. Researchers have begun to use a more comprehensive framework to amend the node-place model. For example, Loo and Verle [48] completely implied the 3Ds framework and selected 6–7 variables for each “D”, where factors such as income, retail, road connectivity/density, covered walkways, and open spaces can represent the economy, walkability, and space quality. In contrast, other experts chose the indicators in a more unfettered way, even though they also considered the 3Ds theory as standard. Singh [49] used eight separate criteria, including walkability and cyclability, economic development, and user-friendliness of transit systems, to estimate TOD with different weights. Going one step further Zhou goes much further. It is worth mentioning that Zhou [9] exploits big and open data to examine 16 indicators of regional accessibility/centrality, density and diversity, and design. Furthermore, many scholars flexibly applied the 5Ds theory to improve the node-place model by adding a third dimension: design, functionality, orientation, or tie [8,23,50,51,52].
One of the newest and most representative studies in this approach considered serviceability, accessibility, and walkability in the extended dimension to compare TOD in five typical Chinese megacities and offer more targeted strategies [52]. Therefore, the current study chooses indicators based on this cutting-edge research. However, unlike [52], we combined local planning indicators into the framework, making it more comprehensive and in accord with the local context. Only in this way can the framework be truly practical when urban planners use it to verify whether the planning objectives are met. The details of how we add some of the new towns’ planning guidelines to our extended “node-place” model is explained in Section 3.5.
Concerning the datasets, except for Zhou [9], Vale [50], and Qiang [8], most of the aforementioned studies used entropy or proportion of traditional land use data rather than PoIs to calculate land/functional mix. Nevertheless, only Vale [38,50] Nigro [45], Singh [49], and Qiang [8] utilized pedestrian network distance catchment areas; others used straight-line radius. Accordingly, this research used multi-sourced data to develop a 3D node-place model focusing on the TOD in Shanghai’s five new towns.
Table 1. Indicators of various extended dimensions.
Extended DimensionNameYearSubject/TitleIndicators of the
Extended Dimension
Walking/Pedestrian OrientedKamruzzaman, Md. et al. [41]2014Advance TOD typology in BrisbaneIntersection density; Cul-de-sac density
Singh Y.J. et al. [42]2014Measuring TOD for Arnhem and NijmegenQuality and suitability of
Streetscape; Density of controlled intersections/street crossings
Monajem, S. & Ekram Nosratian, F [44]2015The evaluation of the spatial integration via the node-place modelTwo spatial indices (To-movement and through-movement)
Vale, D.S. [38]2015Evaluating and classifying station areas in LisbonThe pedestrian shed ratio (Pedshed ratio)
Lyu, G. et al. [37]2016TOD typology for Beijing metro station areasBlock size; Distance from the station to jobs/residents; Length of paved footpath per acre; Intersection density; Walk scores
Nigro, A et al. [45]2019Land use and public transport integration in small cities and townsFeeder transport (Walking; Bike lanes; Expected traffic intensity.
Road size/slope et al.)
Design/Tie
(Function, Walking and economy et al.)
Loo, B.P.Y. & Verle, F. du [48]2017TOD toward a two-level sustainable mobility strategyDiversity of land uses; Convenience of public transit; Retail; Road connectivity/density; Open space; Covered walkway; Exit system
Singh Y.J. et al. [49]2017Measuring TOD around transit nodesLand use diversity; Economic development; Walkability and Cyclability; User-friendliness of the transit system
Vale, D.S. et al. [50]2018The extended node-place model at the local scaleVariety/Number of PoIs; Degree of the functional mix; Pedshed ratio; Intersection density; Accessible network length
Li Z. et al. [23]2019Typology, Optimization, and implicationsAccessibility; Walkability
Pezeshknejad, P. et al. [51]2020Evaluating BRT via extended node-place modelFunctional mix; Streets integration/choice; Streets connectivity; Street density
Zhou, J. et al. [9]2020Using Big and Open Data to Analyze TODDestination intensity of retail/entertainment/restaurant/residence; Simpson index; Walkability; Bikeability
Su S. et al. [52]2021TOD typologies in ChinaServiceability; Accessibility; Walkability
Qiang, D. et al. [8]2022Evaluation of TOD Based on Multi-Source Data in ShanghaiDensity of PoIs; Function mix; Density of road/pedestrian network; Accessibility of pedestrian network; Intersection density; Entrance

3. Data and Methodology

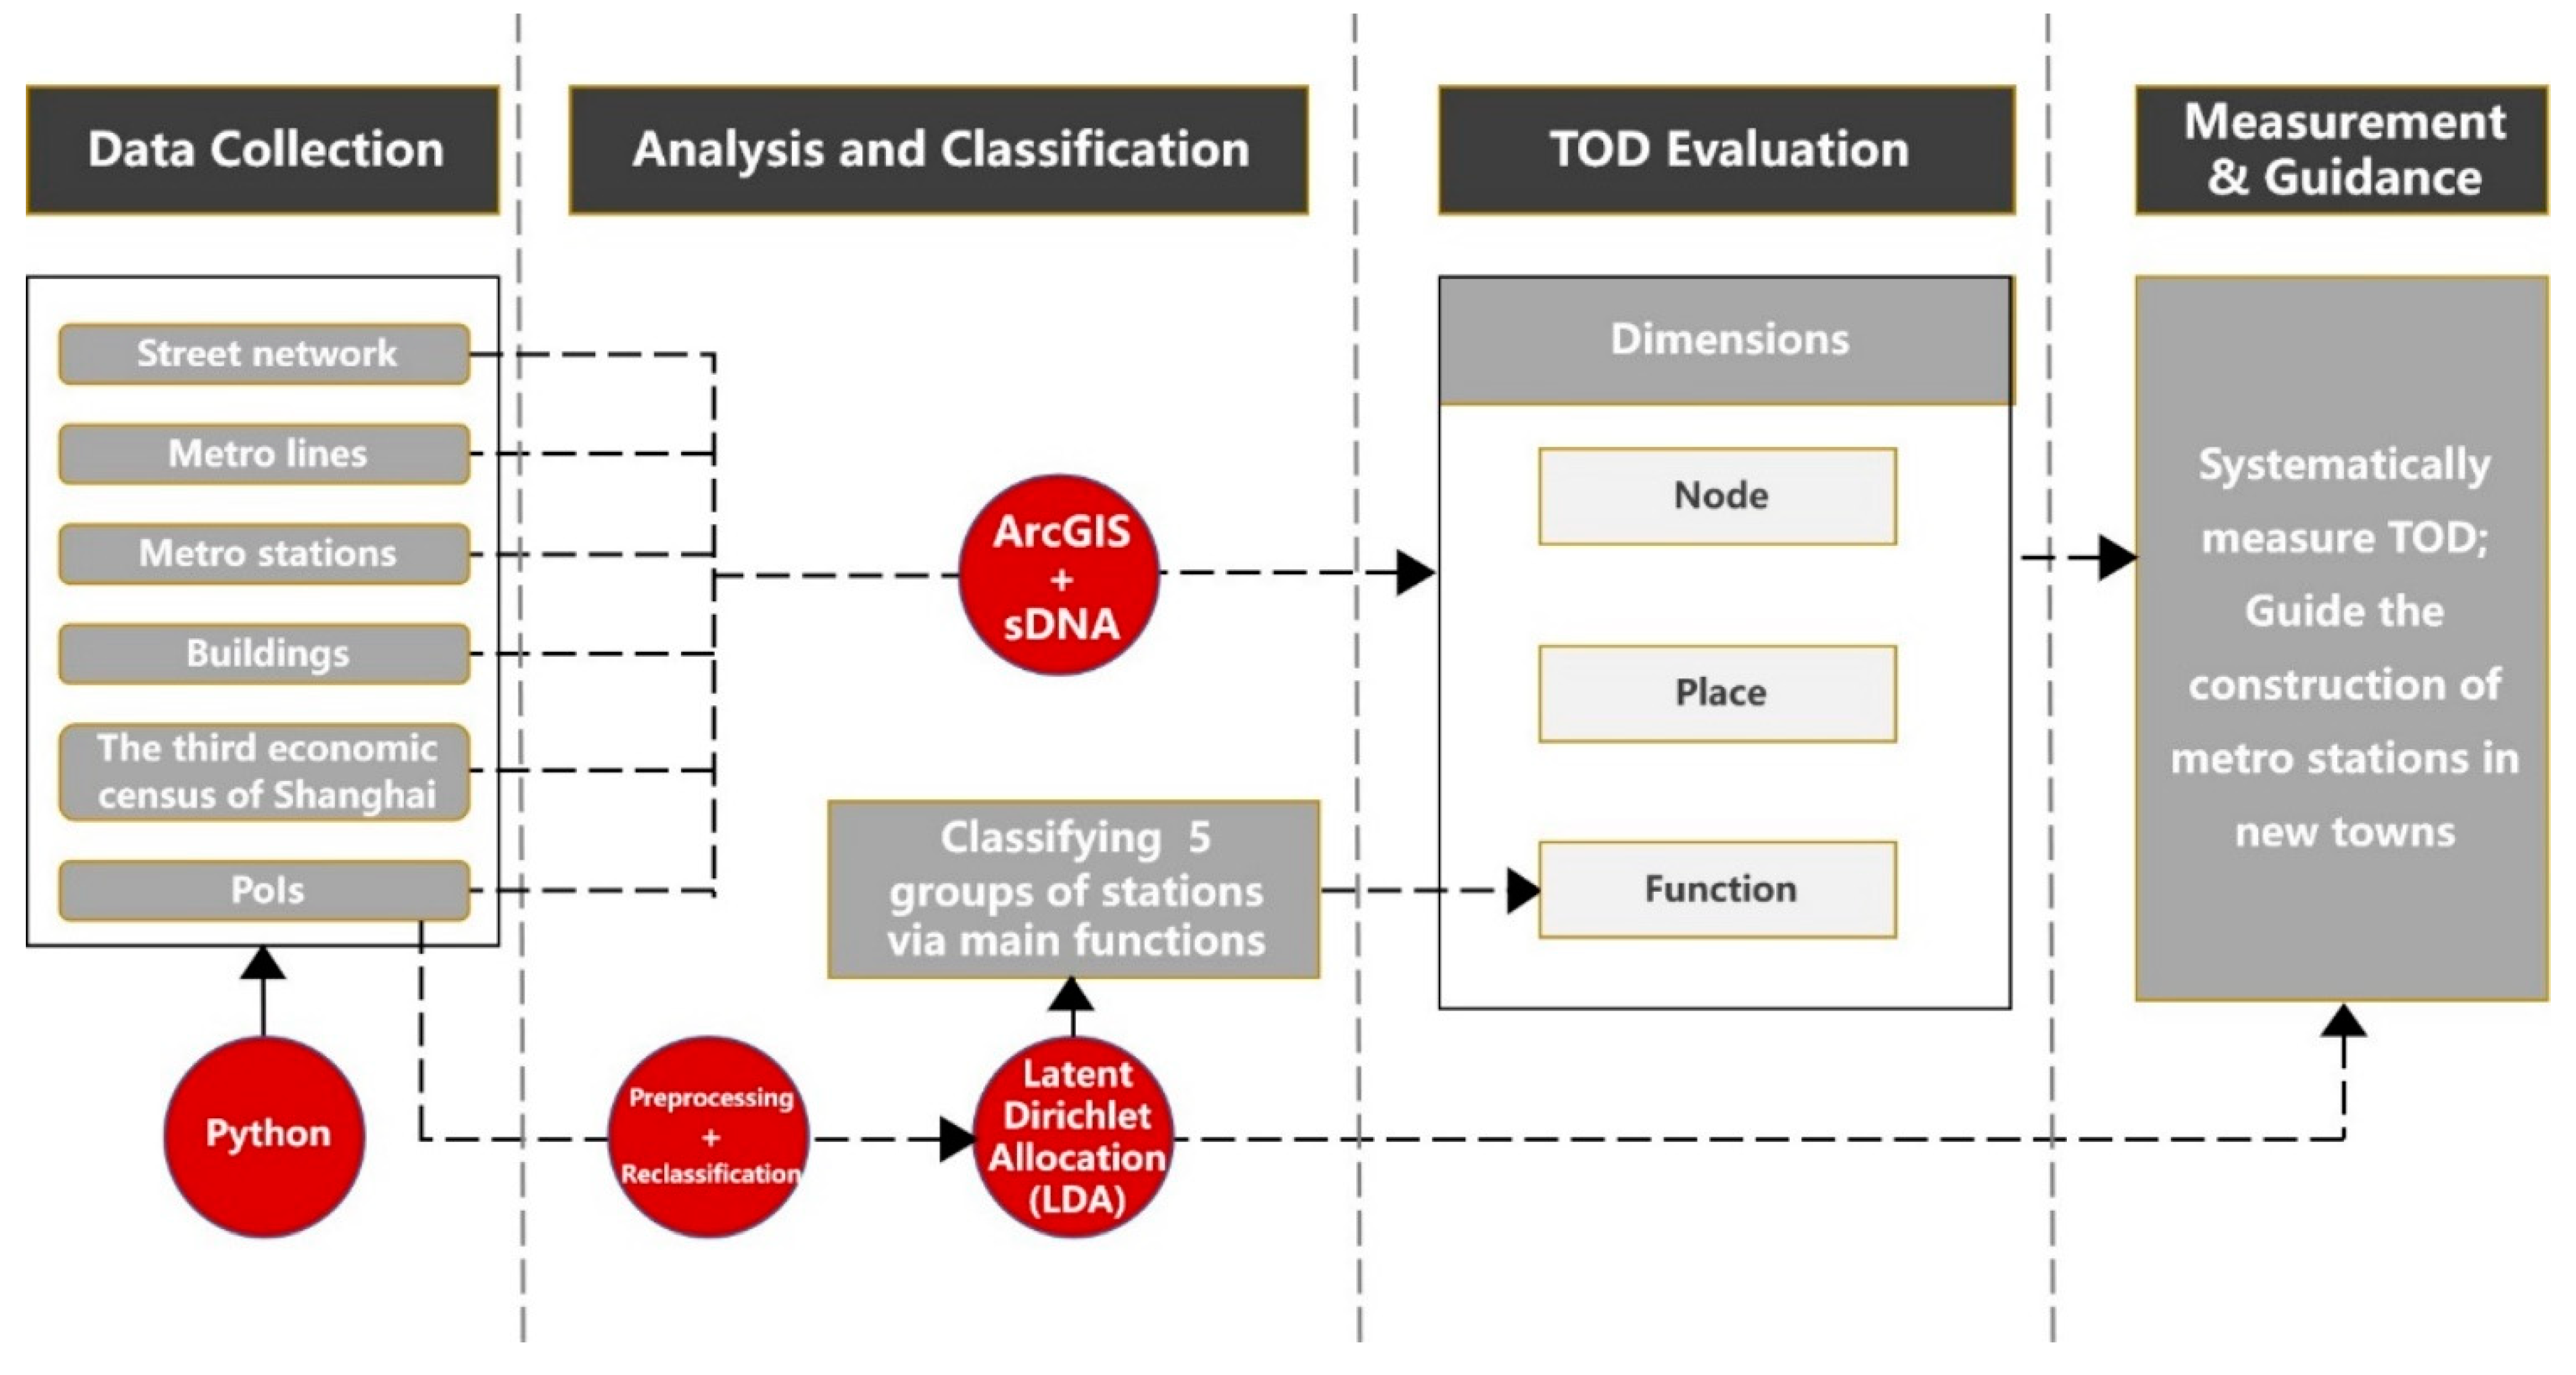
3.1. Analytical Framework
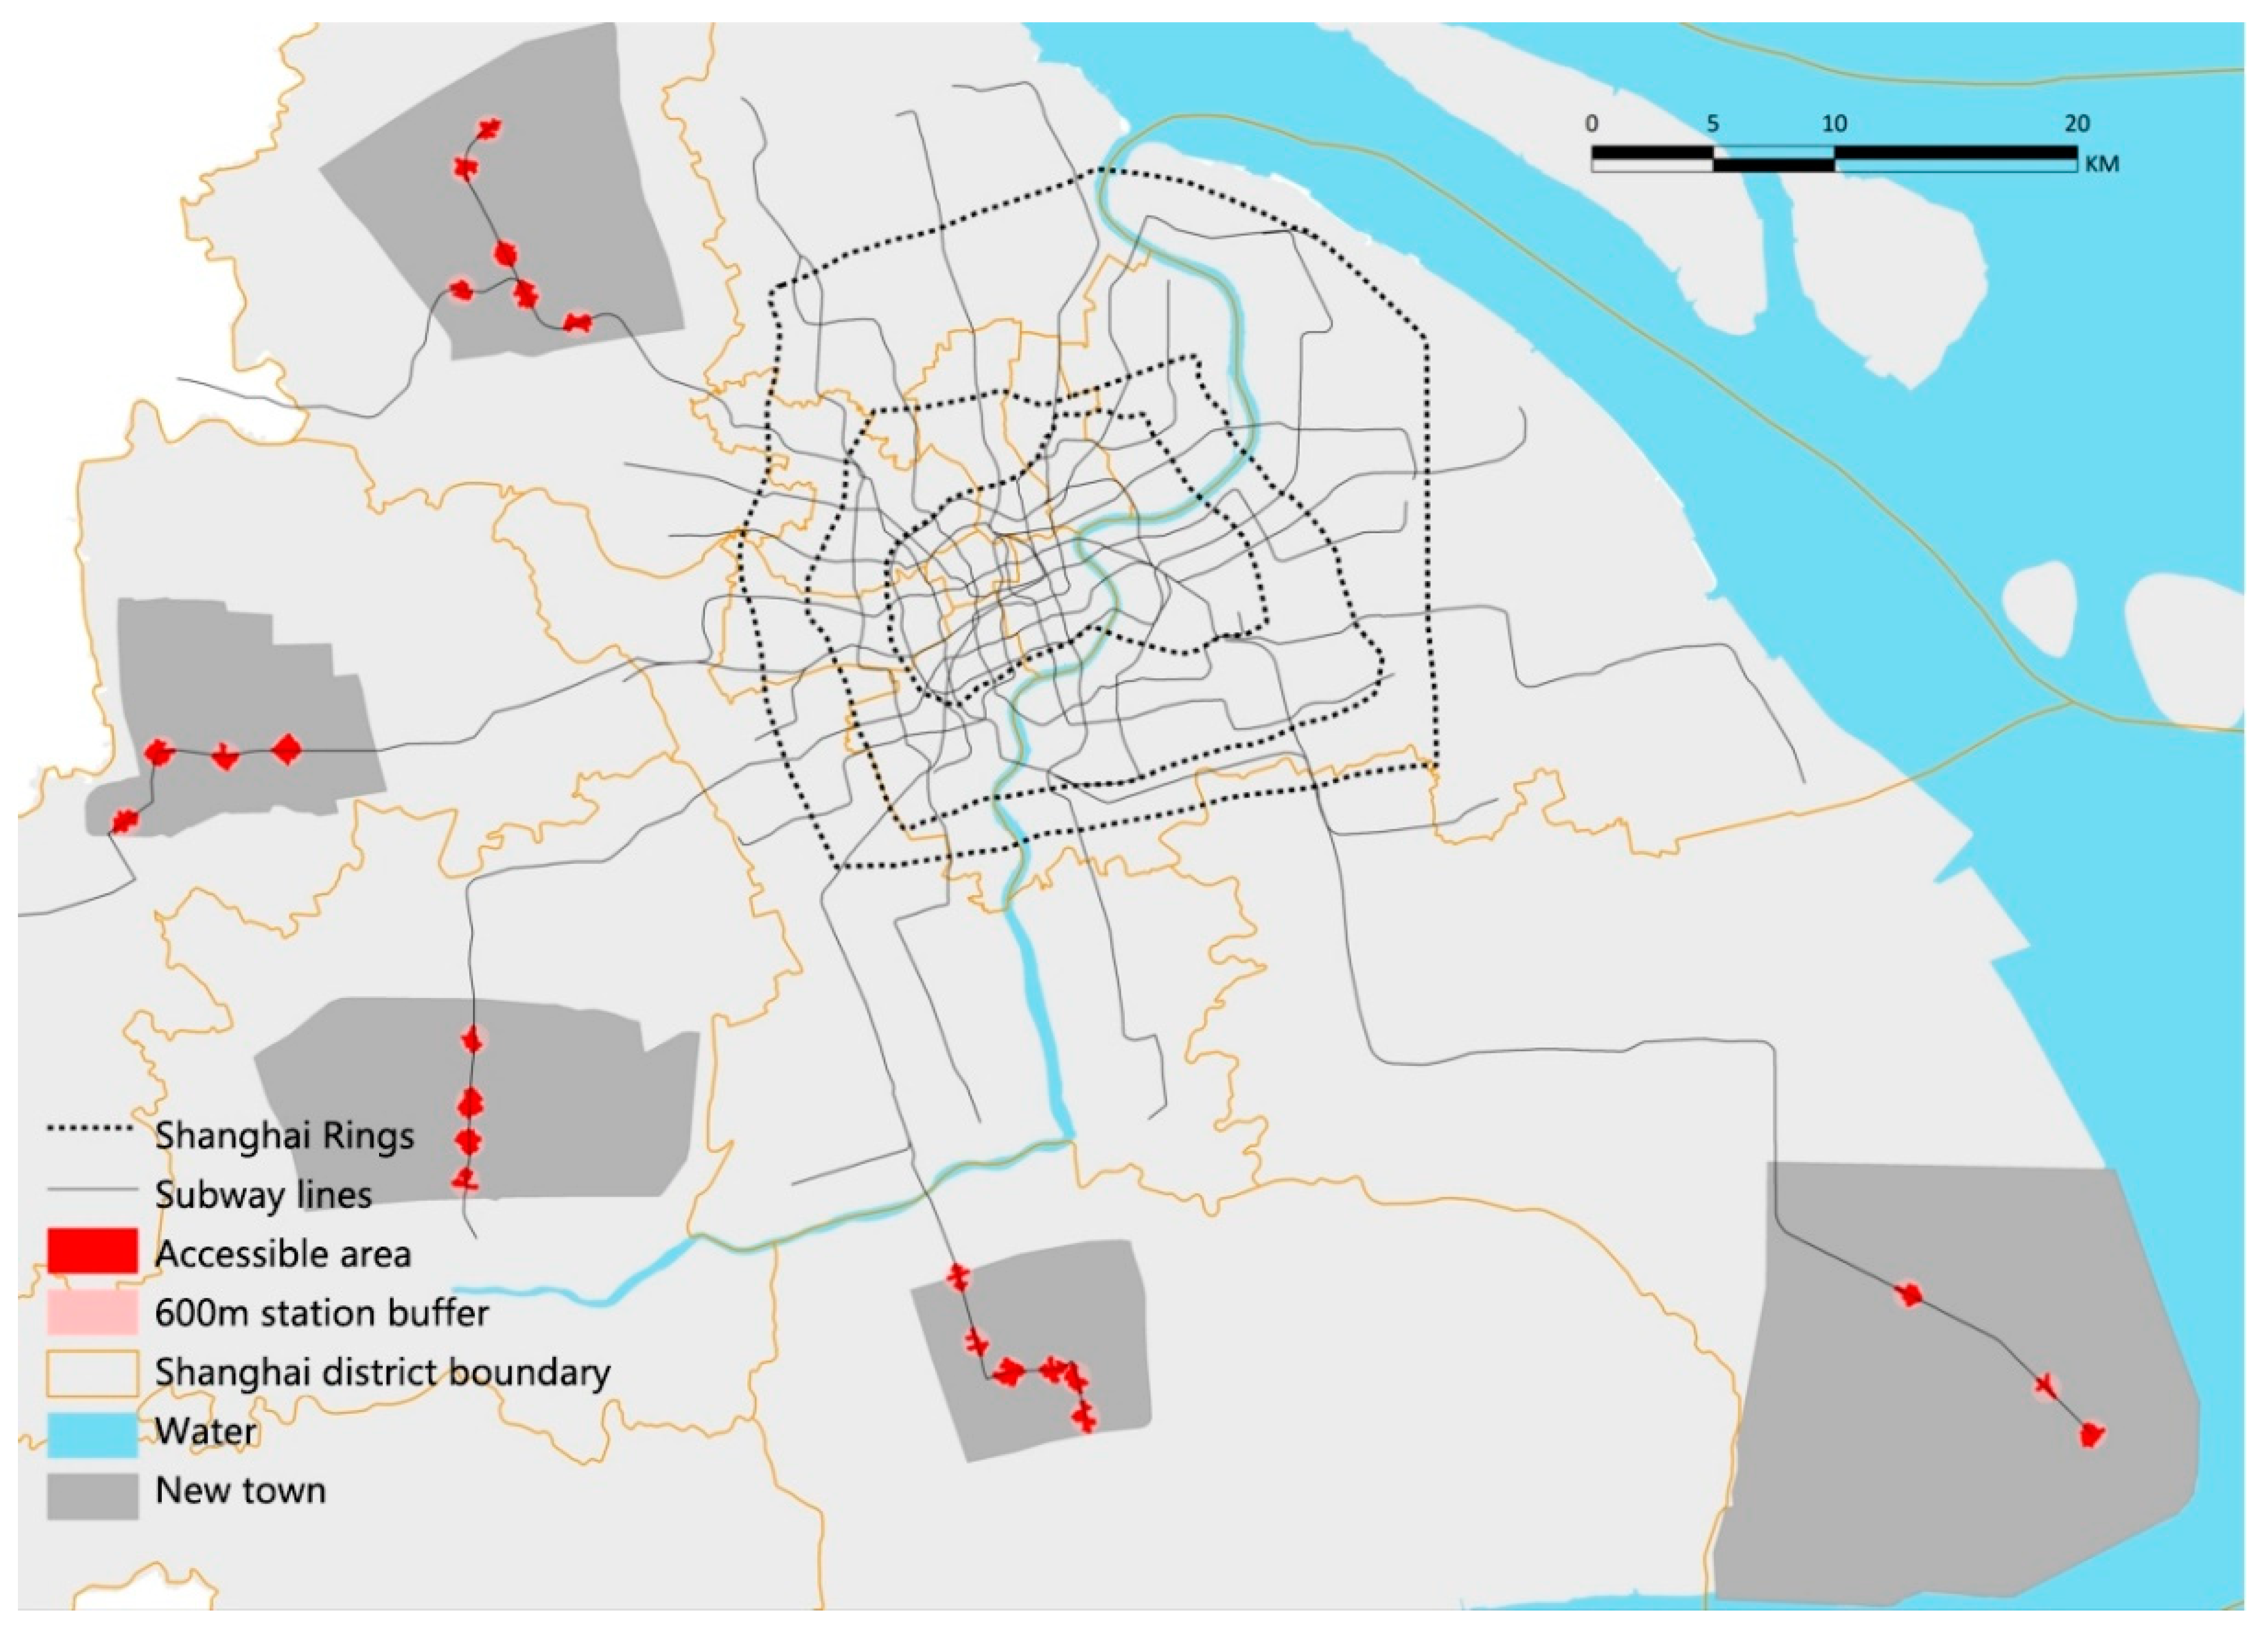
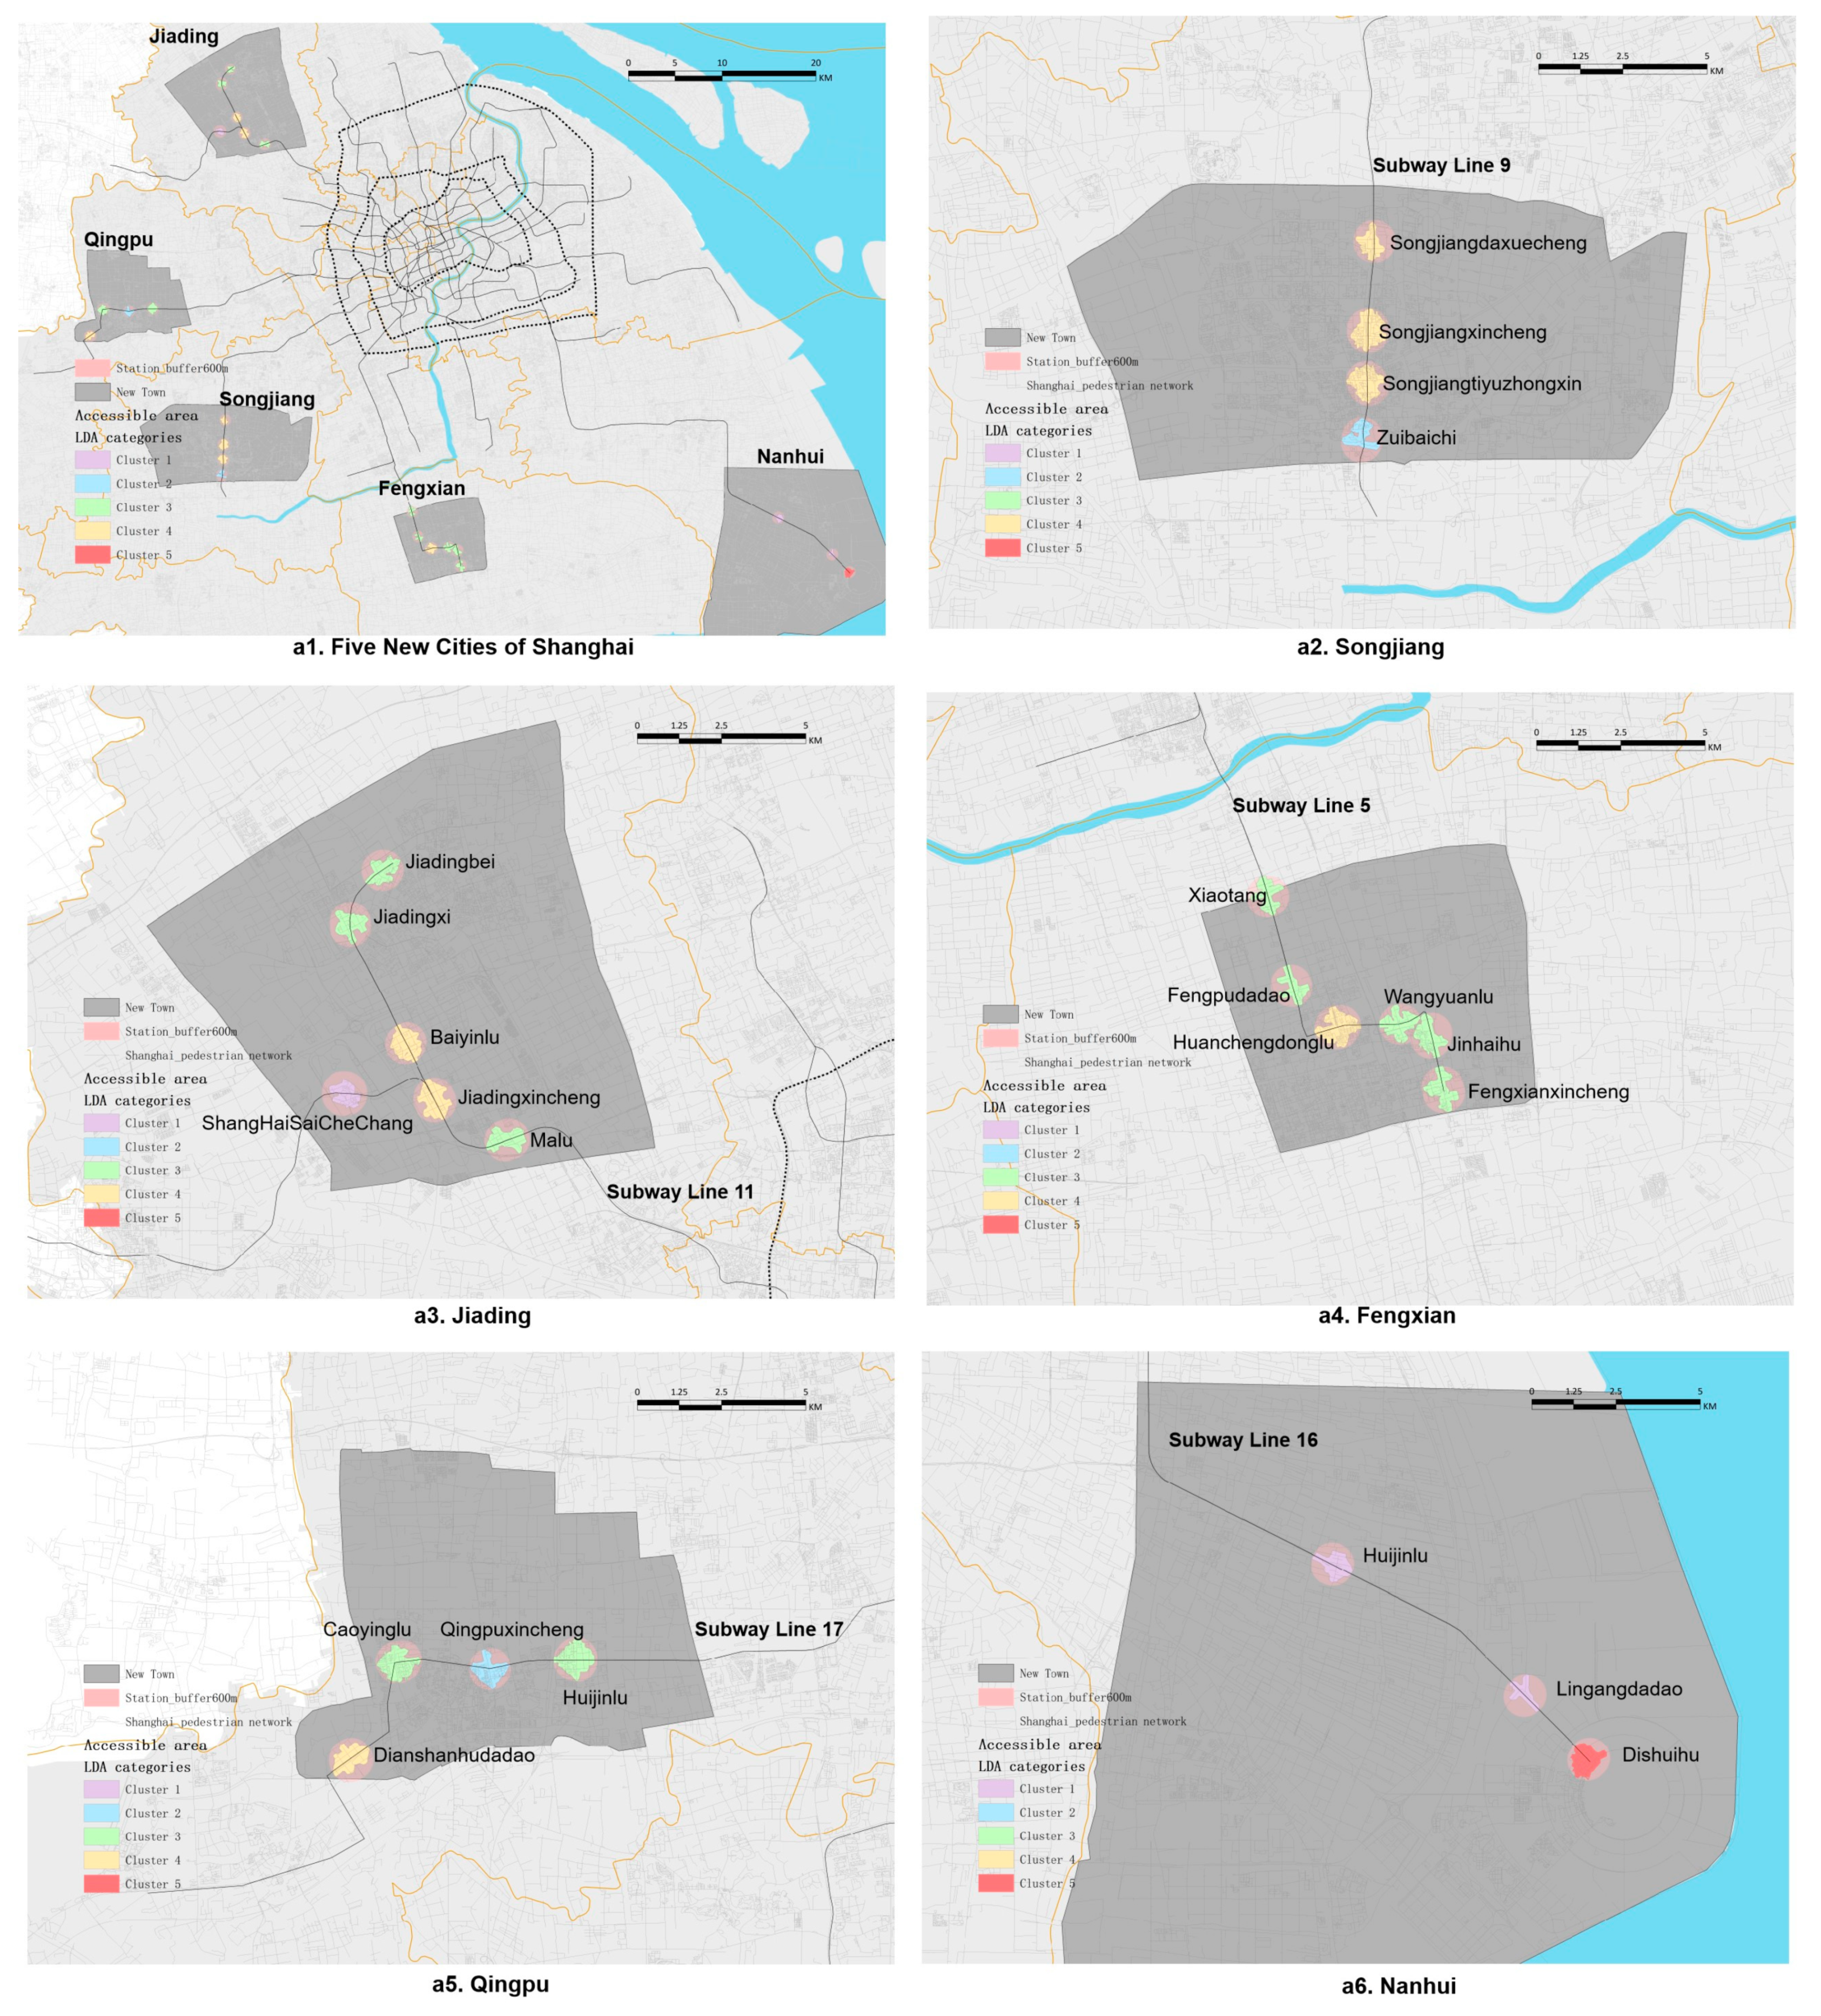
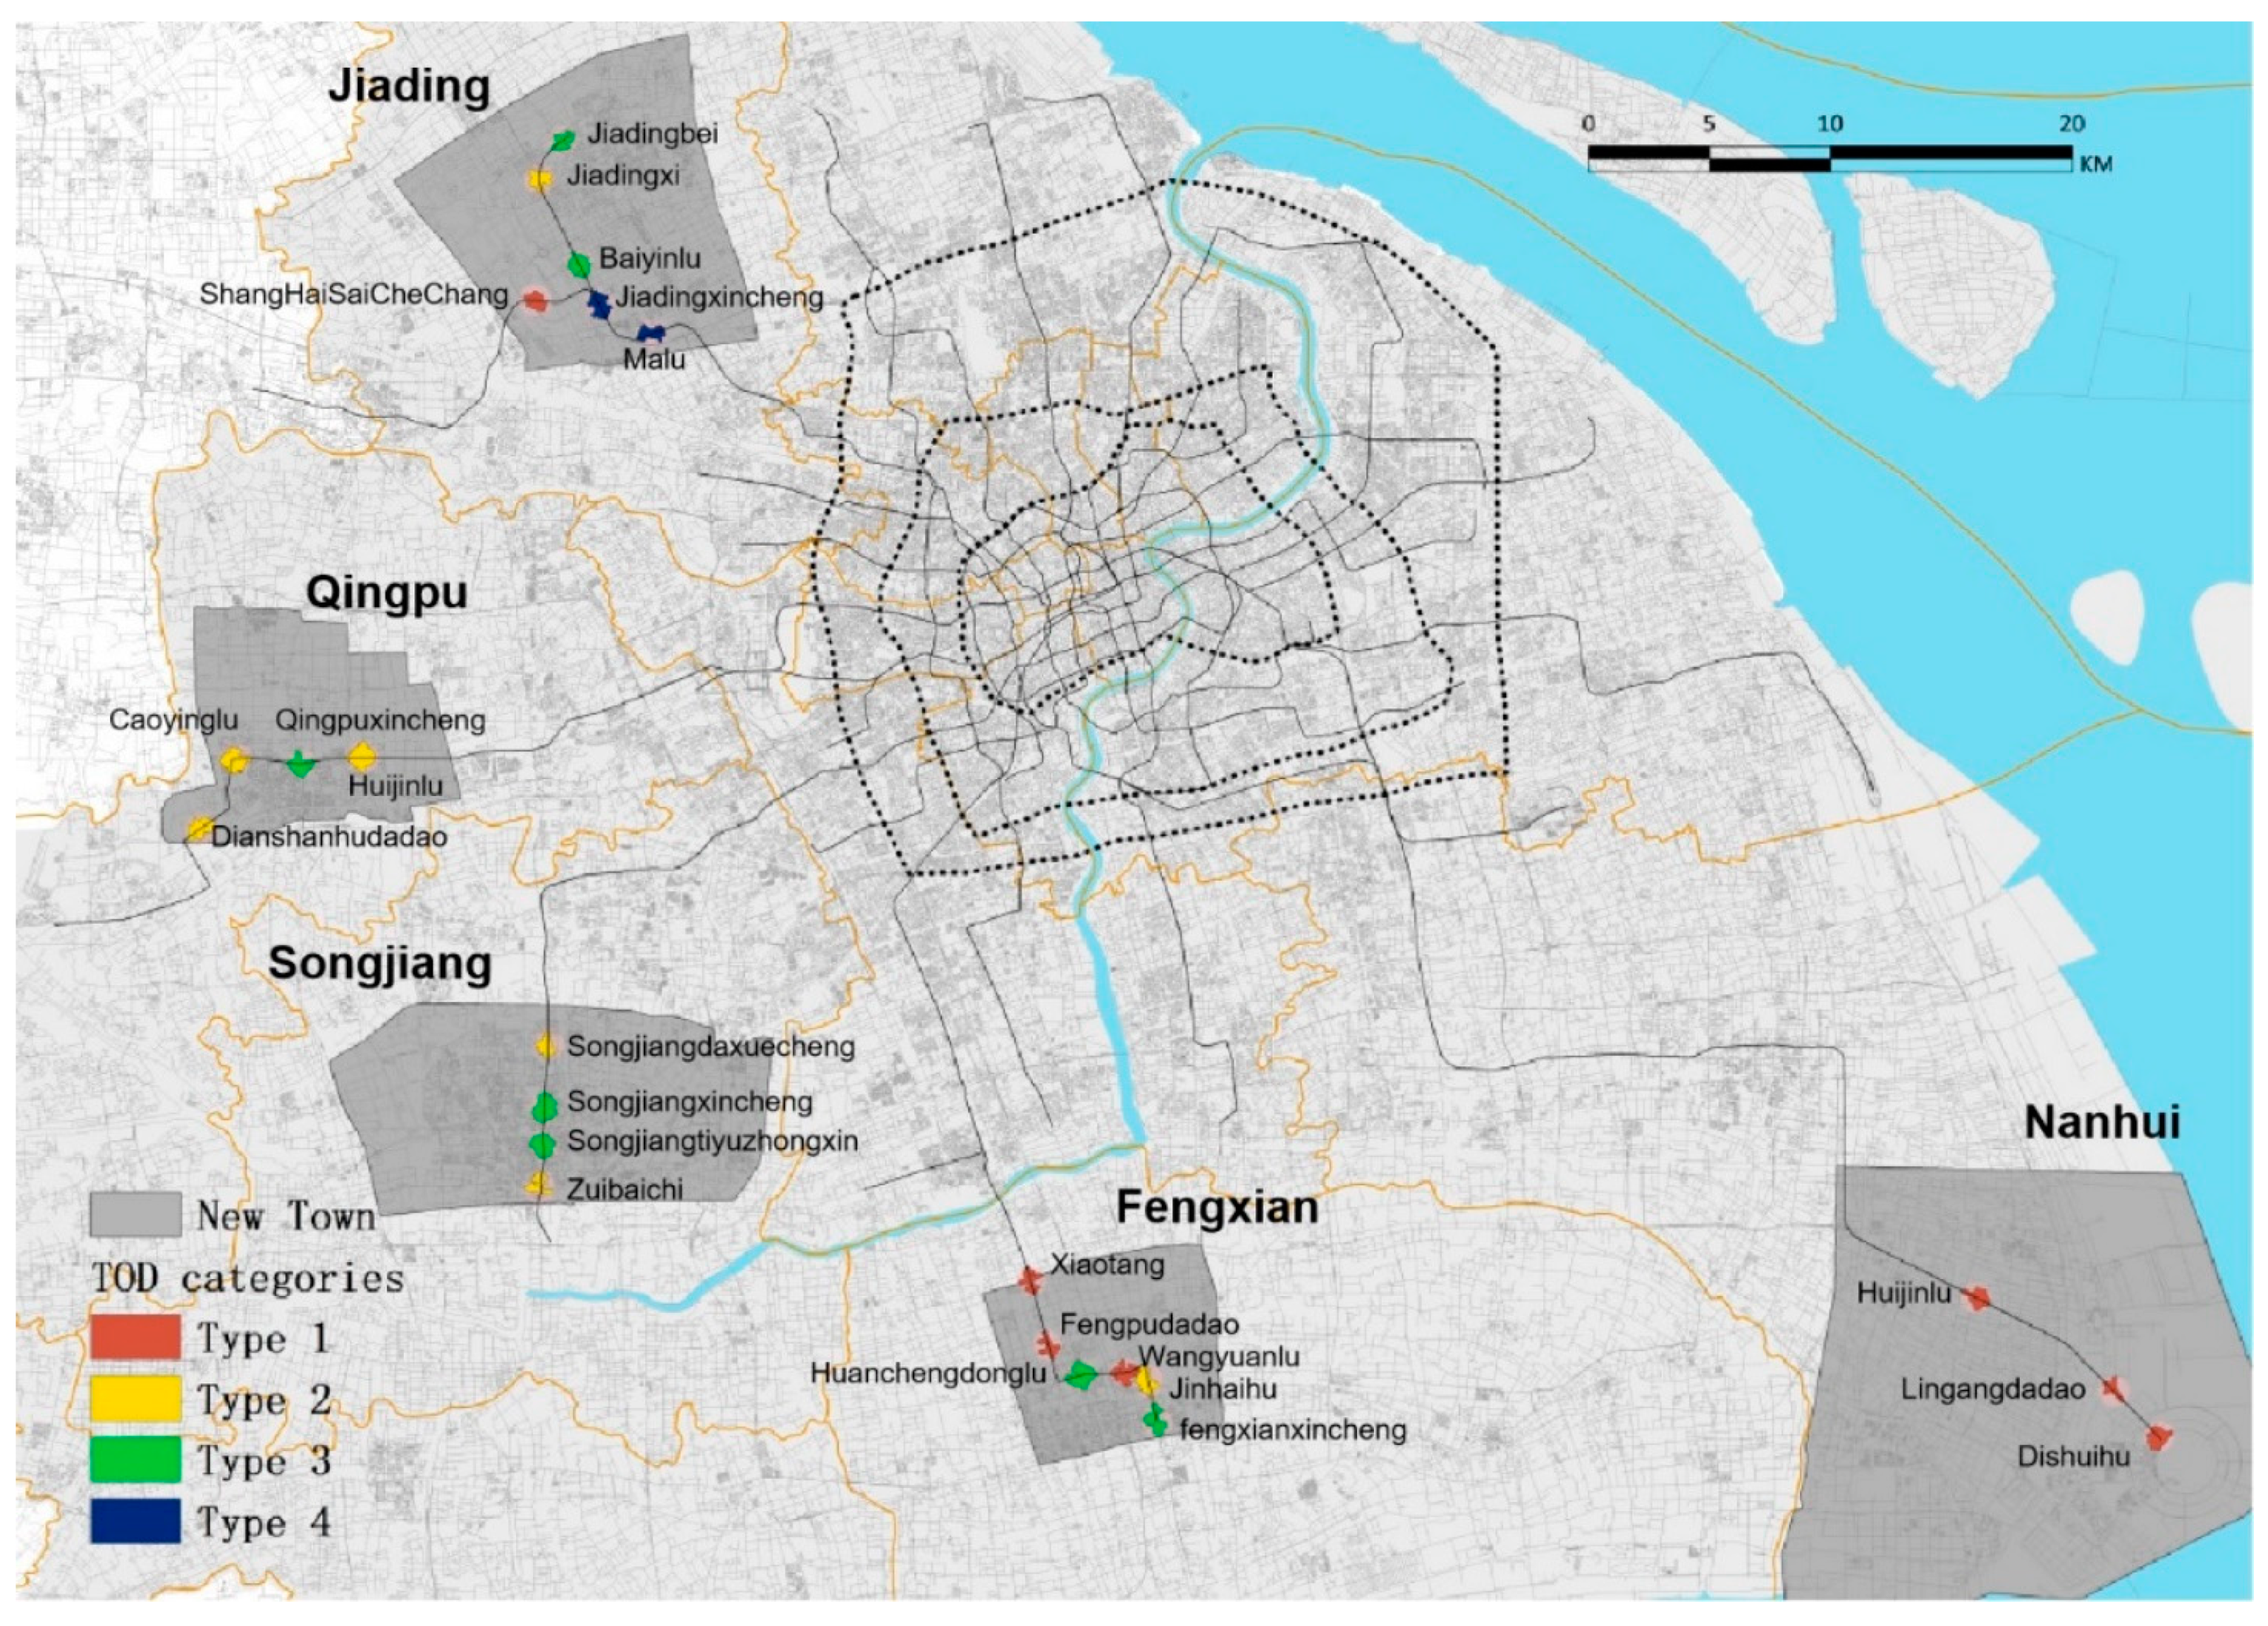
The four key steps of the present study were data collection, analysis, and classification, TOD evaluation, measurement, and guidance (Figure 1). First, information on metro lines and stations, 3D building information and PoIs, the third economic census, and the street network of Shanghai were gathered. The second step has two parts: (1) After cleaning, processing, and recategorizing the PoIs, we used Latent Dirichlet Allocation (LDA) and hierarchical cluster analysis to classify five groups of stations based on their main functions. (2) Other data types of data were imported to ArcGIS to be analyzed using sDNA(a spatial network analysis software) [53] and other toolsets. Moreover, the results in step one, key references for D1 indicators, were integrated into the “design” dimensions to calculate the weighted average walking route distance from the metro station to its representatively functional quarters. Third, three critical dimensions—node, place, and design—were presented to rate the TOD performances in new towns. Each dimension was evaluated by five sub-indicators, which were then summed to obtain the degree of every metro station’s TOD performance; this was displayed in radar charts to show the main differences. The calculation details are discussed later. Finally, a few optimizing guidance points are provided to help TOD construction in Shanghai’s new towns, according to their diverse TOD characteristics. This framework can diagnose problems, help determine whether the TOD development matches its new town policy and prospects, and more importantly, guide the future metro construction in new towns.

3.2. Study Area

This study applied the extended framework to the five new towns of Shanghai. The centers of these new towns cover a total area of 748 km2, accounting for 11.8% of Shanghai’s total area. These five sub-centers of Shanghai were chosen as the research area for two reasons. First, the metro railway system in Shanghai was established in 1993; As of December 2021, it had 508 metro stations (including two maglev stations) and 20 operating lines (including maglev lines), with a total operational mileage length of 831 km (including 29 km of maglev lines). Second, massive, solid evidence was presented to support the appearance of a typical TOD mode in Shanghai [8,22,54]. Nevertheless, there is little quantitative evidence on the relationship between the development of new towns in Shanghai and the development of their local TOD. However, according to the latest Shanghai Comprehensive Plan 2017–2035 (hereafter referred to as the 2035 Plan), the surrounding areas of new towns’ metro stations should and will represent the new towns’ characteristics. Although most stations on one suburb subway line were constructed simultaneously, the new towns are developing in stages. The catchments of some stations could not present their thematic function, except for the stations located in sub-centers. Therefore, we only used 23 stations in the core districts of five new towns as examples, as specified in the 2035 Plan.
Next, we used a 600 m walking distance based on a real pedestrian network to define the catchment area of each metro station. Previous investigations have suggested a radius of 400–600 m as the most appropriate distance for the catchment area of TOD precincts [37,38]. In our case, a catchment area with a 600 m walking distance was selected as the analysis boundary of each site, as this distance can cover more population and PoIs and better reflect the identical functions of each site; this is because the distance between two suburb stations is longer and the surrounding density is lower compared to stations in the city center. Nevertheless, the circular catchment calculated by a Euclidean-based measurement method cannot simulate real-world walking scenarios. Therefore, we calculated the 600 m service area of every station’s exit using the Network Analyst Toolbox on ArcGIS. The final catchment area of a metro station consists of overlapping service areas of the station’s exits (Figure 2).

3.3. Raw Data Pre-Processing

Multi-sourced urban data, including traditional and non-traditional data, were collected to represent the aforementioned indicators. For example, for non-traditional data, 77,724 street polylines from OpenStreetMap (OSM) (2019), 559,777 street polylines, 754,607 building plots data from Baidu Map API and Python (2019), and over 2.7 million PoI data from Gaode Maps (2019) were collected. Then, traditional data obtained from the Shanghai metro official website and the Shanghai census were used to represent the physical characteristics of metro stations and social attributes of surrounding neighborhoods.
The PoI data used in this study were provided by AutoNavi Map, a platform that has collected over 270,000 records of Shanghai. Three pre-processing steps were performed before PoI analysis:
First, we used Python to grab PoI data from the AutoNavi Map and imported it into ArcGIS for coordinate system transformation. The obtained PoI data included the coordinates, names, and three classification types: major class, medium class, and small class. In the subsequent analysis, “major class” was used as the analysis sample.
Second, abnormal PoI records with incomplete information were removed from the dataset, and PoI data of the type “auto repair, car sales, motorcycle repair” were merged into the “Life Services” category. A total of 15 major types of PoIs were obtained: catering, scenic spots, public facilities, corporate enterprises, shopping, transportation facilities services, financial insurance services, science, education and cultural services, commercial residences, life services, sports and leisure services, healthcare services, government agencies and social groups, and accommodation services.
Finally, the PoIs within the pre-defined TOD area were extracted on the ArcGIS platform and approximately 7500 pieces of data were obtained, providing a basis for classifying metro stations and measuring functional diversity for subsequent research.

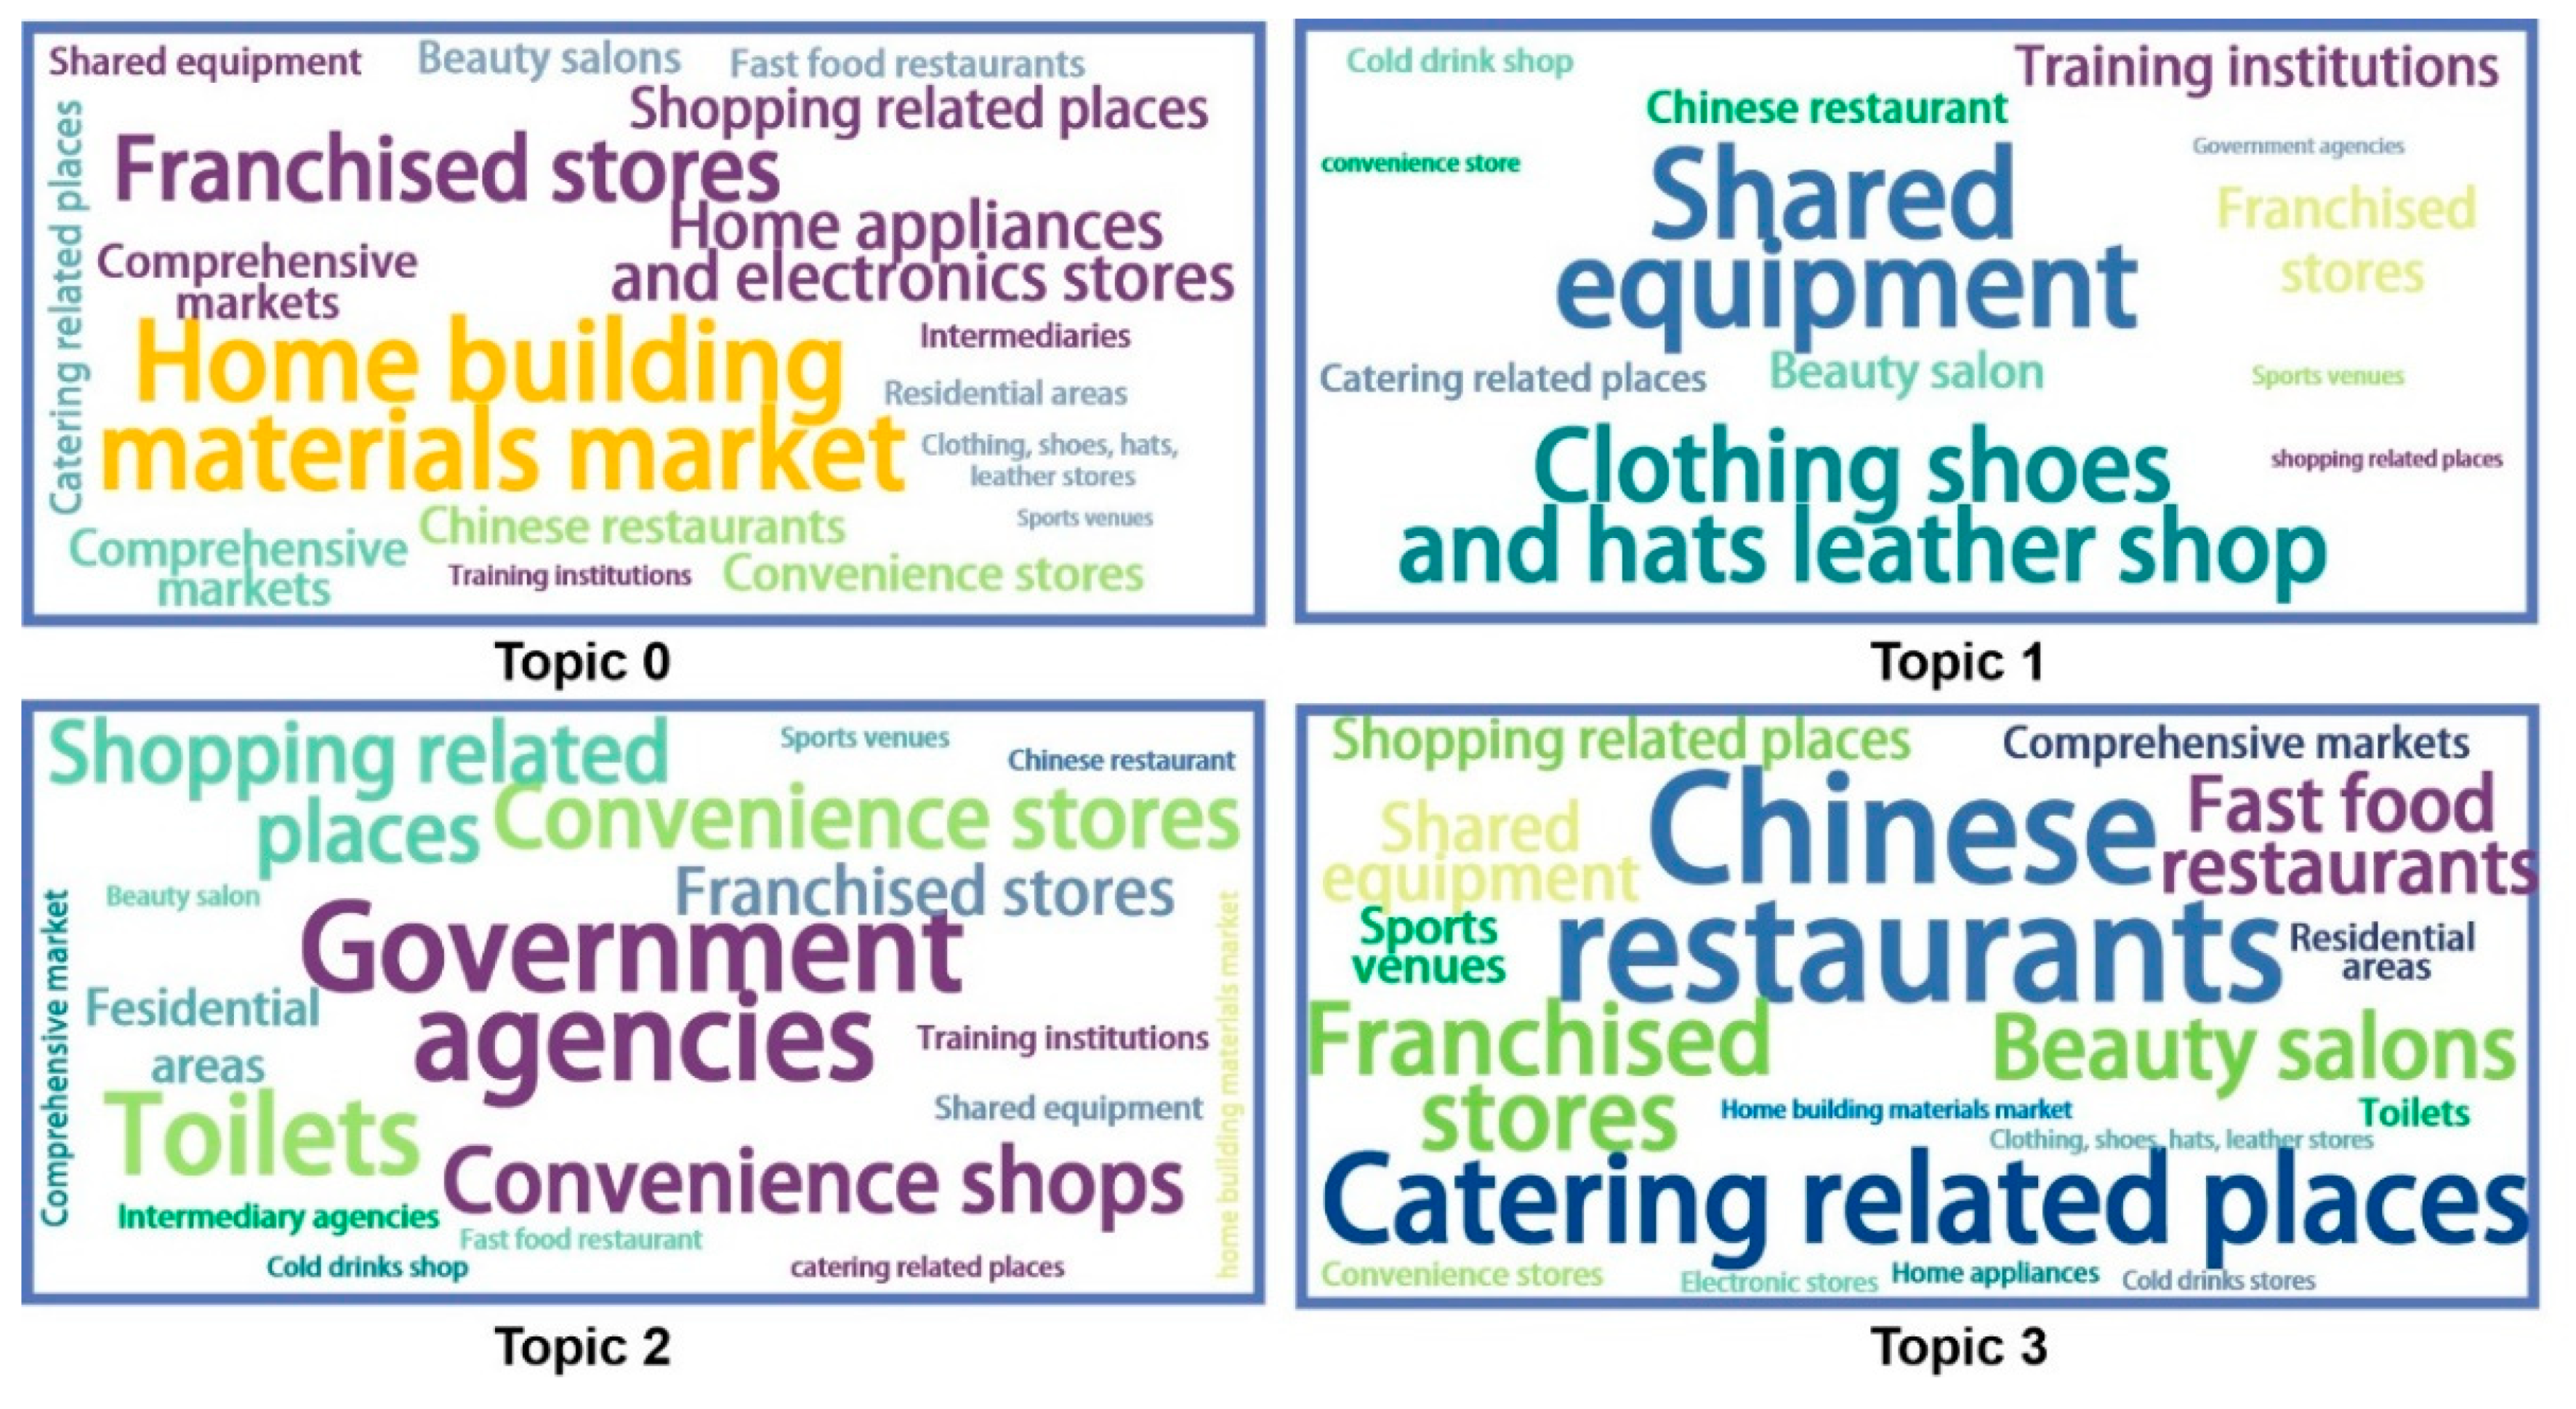
3.4. Evaluating Thematic Functions via LDA Topic Modeling

Thematic functions of metro stations can be characterized by the abundance of urban functions in their catchment areas. First, 15 major types of PoIs were analyzed by LDA topic modeling to extract the functional topics of the metro station areas. Second, metro station areas were clustered by agglomerative hierarchical clustering according to the importance weights of thematic functional topics, such that the metro station areas with similar topics belong to the same type. The specific steps are as follows:
  • Establish two analysis matrices: PoI data were used as analysis keywords to form a thesaurus of each station catchment area. Two matrices for extracting topics were established, namely topic-to-PoIs and catchment-to-topic matrices. In the former, each PoI type was assigned a probability within each latent topic, and the semantic features corresponding to the topic were obtained. The latter represents the probability of each topic corresponding to different station areas.
  • Determine the analysis parameters: The number of potential topics n, Max_df, and Min_df are key parameters in the LDA model and need to be pre-defined. Here, we employed the perplexity score metric to determine the optimal number of topics. The smaller the value, the better the quality of the topic results. According to the semantic features corresponding to the topic, whether this parameter was reasonable could be determined. After the analysis, the number of potential topics was determined to be 4, the value of Max_df as 0.95, and the value of Min_df as 4. The semantic results generated by the topic reflected the characteristics of the site area function.
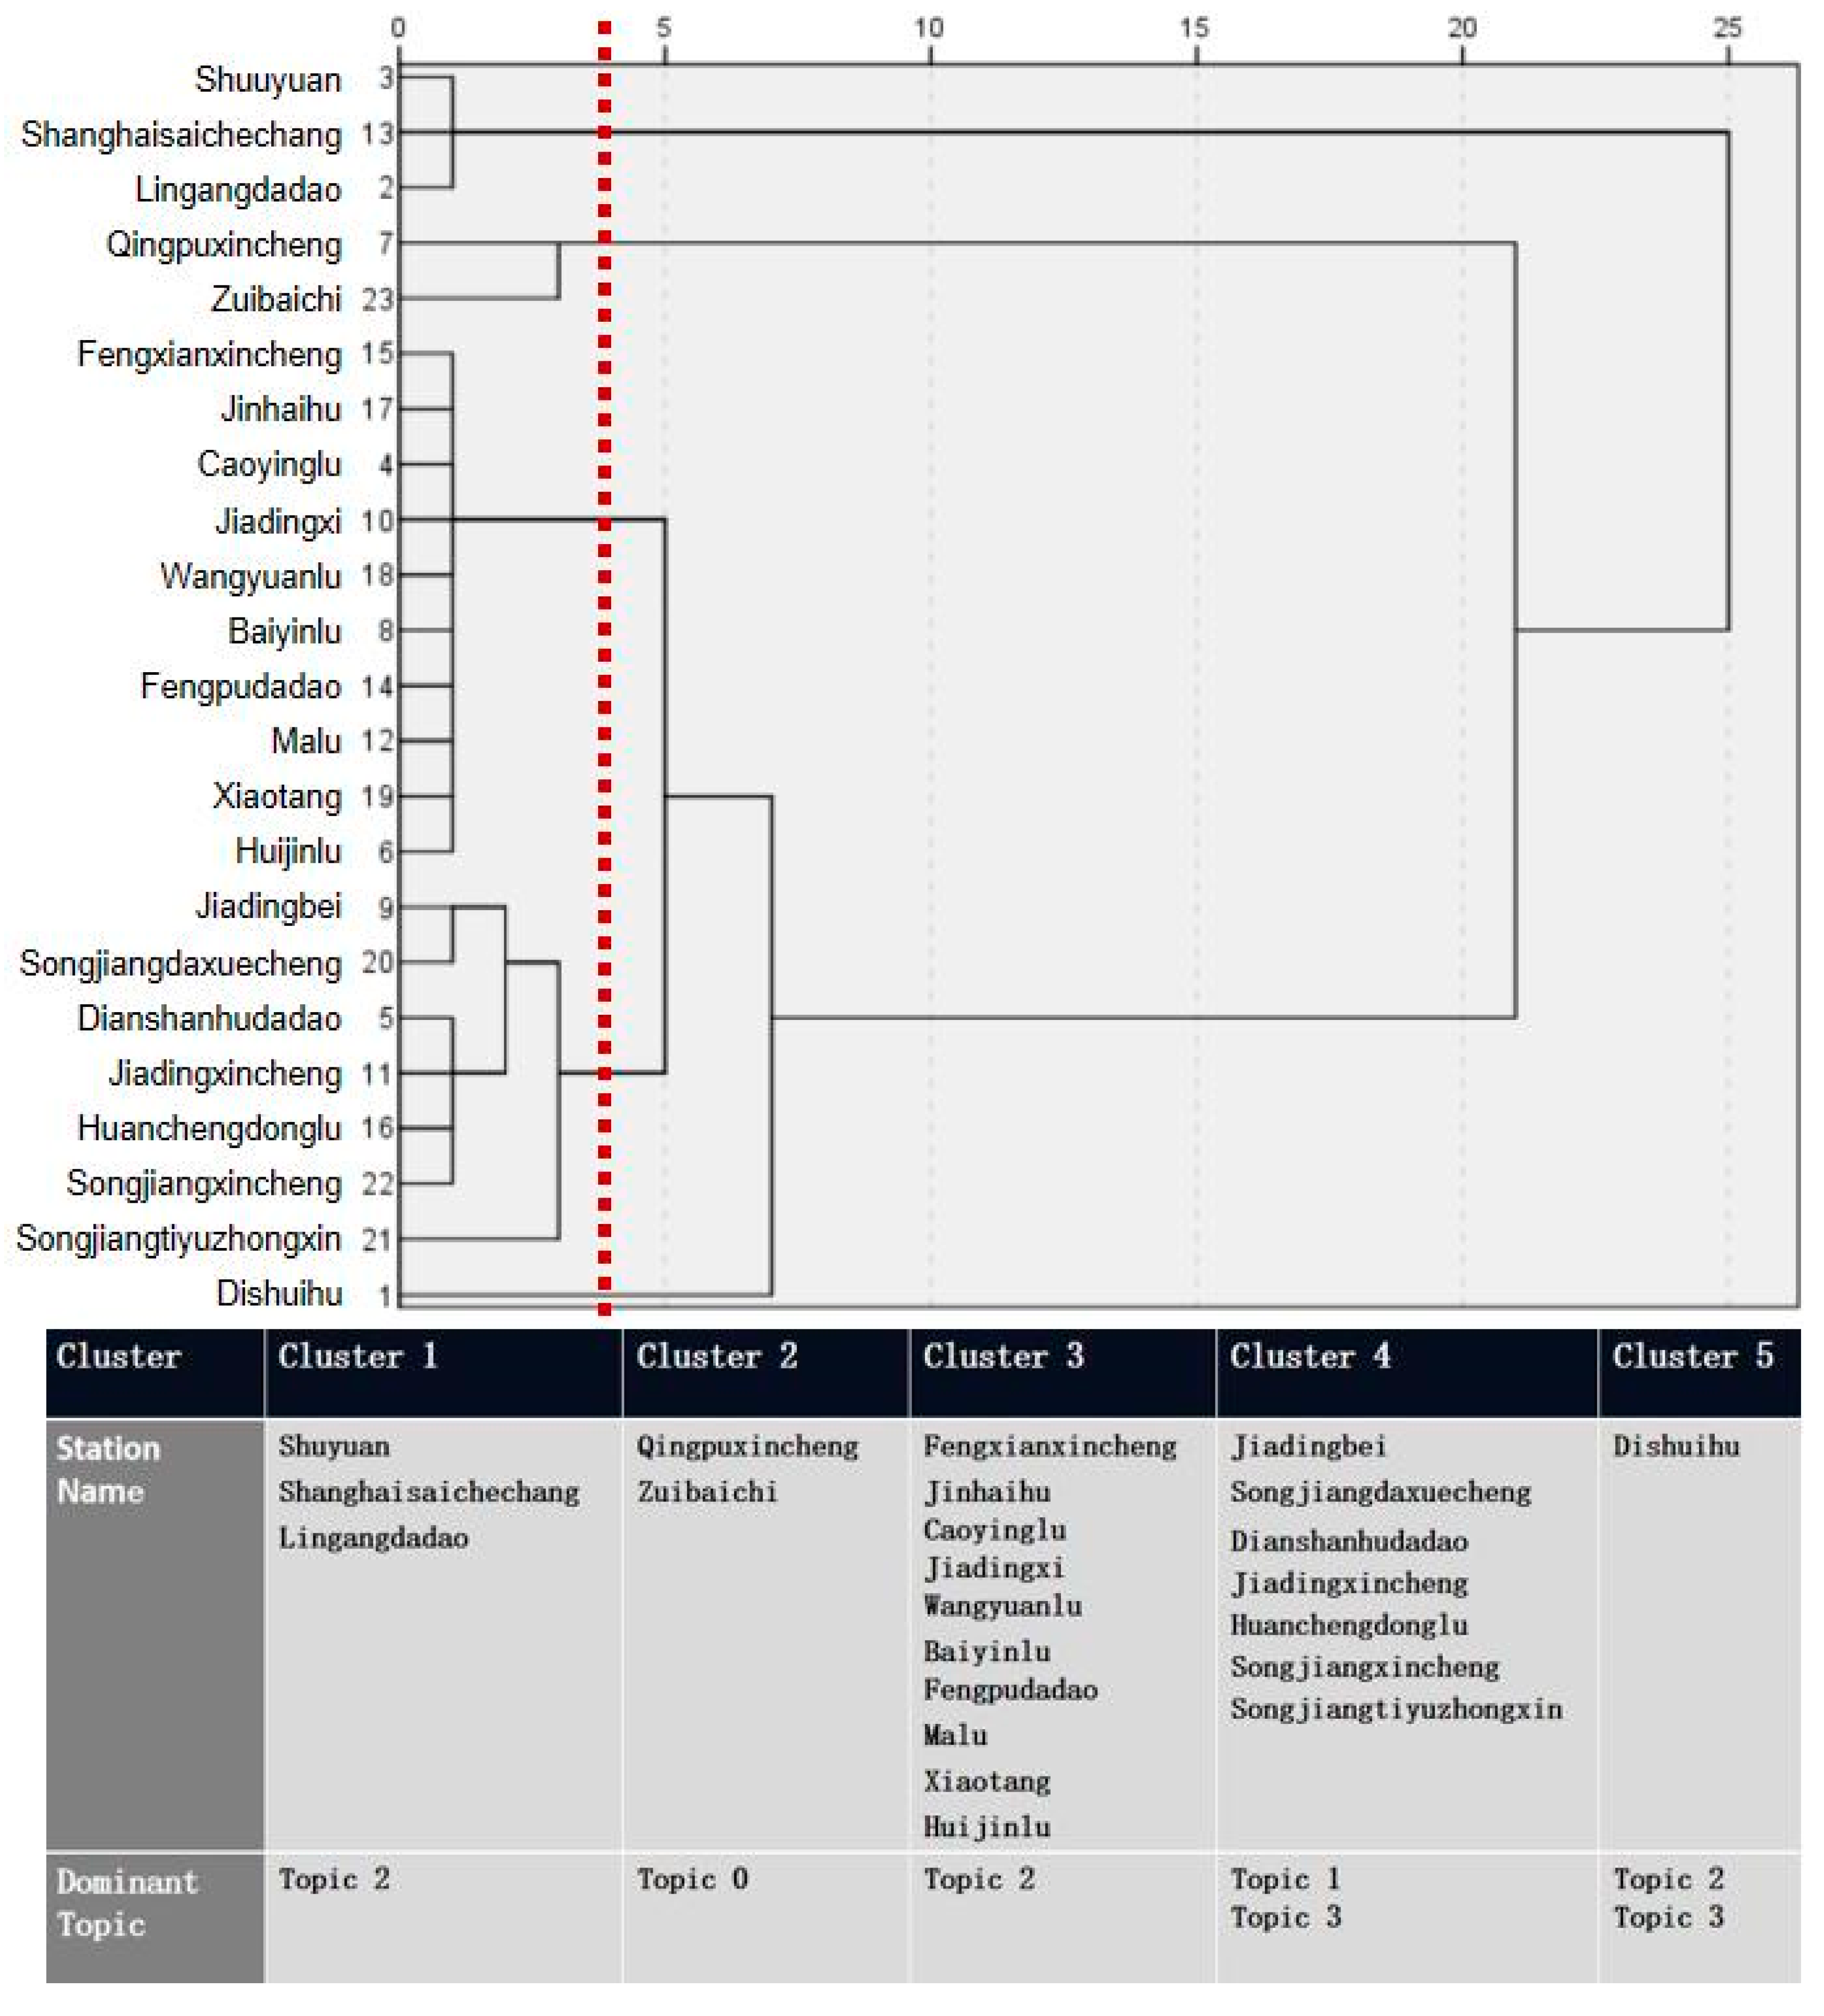
  • Based on the corresponding probabilities of topics within the metro station areas, we used a standard deviation measure to calculate the uniqueness of topics. The clusters with the most similar attributes were merged into a new cluster using the agglomerative hierarchical clustering method, and through multiple iterations, the classification results of metro stations that conform to the actual situation were finally obtained.

3.5. Measuring TOD Performance of Five New Towns in Shanghai

An extended “node-place” model, with the third dimension of “design”, was used to measure Shanghai’s five new towns’ TOD performance. Each of these three dimensions has a different significant value: the “Node” dimension describes the transportation capacity of the metro station itself, while the “Place” dimension represents the degree of urban development, dynamics, and diversity of the surrounding area of the station. Meanwhile, the “Design” dimension identifies the quality of the environment and convenience of the whole network within the catchment area.
We selected indicators in accordance with: the logic of Su’s “node-place–functionality” model [52] and Qiang’s “Transportation (T)–Pedestrian–oriented (O)–Development (D)” framework [8]; the concrete TOD characteristics of Shanghai; the official reports of Comprehensive Plan and General Land-Use Plan, 2017–2035 of Five New Cities in Shanghai; data availability; and previous cases.
Each dimension was evaluated by five sub-indicators. Specific indicator descriptions, calculation methods, and data sources are listed in Table 2. The “node” dimension is portrayed by indicators of carrying capacity (metro frequency (N4) and passenger flow (N5)) and transit connectivity (accessibility of the metro station (N1), reachable metro stations within 20 min (N2) and accessible bus station number (N3)). The local metro company provided the original data on the metro network, metro frequency, and passenger flow. To describe the accessibility of metro stations, we referred to the betweenness centrality variable, a measure that reflects the through-movement potential of each link, calculated by sDNA [53] based on the official metro network. Reachable metro stations within 20 min were automatically measured via Baidu Map’s API. The number of bus stops which are reachable in the catchment can be indicated by the corresponding PoIs from the AutoNavi’s Map.
The “place” dimension was constructed from two aspects: multi-function degree and density. The former aspect includes indicators of the Density of PoIs (P1) and functional mixture (P2); the latter includes the floor area ratio (FAR) (P3), employment density (P4), and population density (P5). The calculation methods of P1, P3, and P4, provided in Table 2, are clear and uncomplicated. P2 was quantified by the Shannon entropy [55] of the 15 categories of PoIs obtained from Section 3.4. More importantly, P5 was the standard of both the 2035 Plan and the construction strength around TOD. It can represent the guideline of “the coverage rate of permanent residents within 600 m of metro stations” in “the 2035 Plan” of Five New Cities [56,57,58,59,60,61].
Concerning the “design” dimension, we established most of the indicators from the main indicator table in “the 2035 Plan” of Five New Cities in Shanghai [56,57,58,59,60,61]. All the new towns’ 2035 plans have set regulations on the 15-min walk accessibility rate of comprehensive service facilities, per capita parks and green space, pedestrian network density (D3), and job–housing balance (D4). We retained the last two indicators and transformed the first two into the distance to representative function (D1) and green public area (D2) based on the data availability. Moreover, we added accessibility of the pedestrian network (D5), calculated by sDNA [53], to describe the pedestrian network topological connectivity. When calculating D1, we evaluated the average distance from each PoI that belongs to the station’s dominant topics to the nearest station exit. The larger the D1 value, the farther the subway station was from the leading function, which meant more inconvenience. The accessible area of green public space within the catchment was obtained from areas of interest (AoIs) from the AutoNavi Map, while the original data for D3 were from a pedestrian network on the Baidu Map. However, the job–housing balance was a little perplexing. First, we generated a ratio of the number of jobs to the number of households. Then, we took the absolute value of the difference between one and this ratio, as job–housing is the most balanced when the ratio reaches one. Lastly, the final value negatively correlated with the state of the job–housing balance. The equation to calculate the value is as follows:
J H R = | 1 J i H i |
where Ji = number of jobs of catchment i, Hi = number of households in the catchment i. The number of households is obtained by dividing the population by the average household size of Shanghai (Average Household Size: Shanghai data was reported at 2.32 Person in the Seventh National Population Census in May 2021. http://tjj.sh.gov.cn/, accessed on 12 July 2022).
The abovementioned subindices were given equal weight to join these 15 indicators into a final TOD index. Before integrating all indicators, they were separately normalized and standardized using the formula below:
X _ index = ( X Min ( X ) ) / ( Max ( X ) Min ( X ) )  
Except for D1 and D4, other indicators positively correlated with the TOD index. Therefore, D1 and D4 must be subtracted from 1 before adding up to obtain the “design” or TOD index.

4. Results

4.1. Thematic Topics of Urban Functions in Catchment Areas

Four thematic topics were extracted by implementing LDA topic modeling, indicating the characteristics of the urban function in rail transit station areas. Figure 3 shows the results of LDA topic modeling and the frequency of each keyword under each topic, showing that each topic had good independence. The main keywords of each topic were then displayed by using a comparison word cloud, as shown in Figure 4.
The standard deviation measure of each topic generated by LDA topic modeling results represented the different strengths of each catchment on different topics. As a complex and dense urban space, a catchment cannot be simply defined by a single urban function type. Thus, railway stations were divided into different clusters to study their corresponding urban functions. As shown in Figure 5, all metro stations were classified into five groups through hierarchical clustering. The dominant topic of cluster one was Topic 2, due to the low development degree of these three stations and because their functions were mainly public facilities built prior to urban development. Only two stations from group 2 showed a predominant interest in Topic zero. This revealed that many building material stores were in the catchment areas of the Zuibaichi and Qingpuxincheng stations. Stations from group 3 show strong interest in Topic 2, which is relevant to daily residential activities and accounts for 43% of metro stations in the five new towns. Notably, clusters four and five showed more than one interest in urban functions. Stations from group 4 showed relatively strong interest in Topics 1 and 3, because large businesses and residential areas surrounded such stations; thus, they showed the compound property of shopping and catering. Dishuihu station was the only station in cluster 5 and its leading topics were Topics 2 and 3, which were related to the goal of building a world-class cultural and sports tourism destination that combines business, culture, sports, tourism, and residence. Based on the LDA topic modeling results, the station catchment classification had a strong coupling relationship with the built environment, which matched the development objectives of the new towns.
From a geospatial perspective, we discovered the clustering patterns shown in Figure 6, using distinct colors to label stations from different groups. We found that although the same new town often included different clusters, the dominant topics of stations in Nanhui, Fengxian, Songjiang, and Jiading New City were relatively uninformed. By contrast, the dominant topics of Qingpu New City were more diversified, which is related to the functional positioning of innovation research, business trade, and tourism.

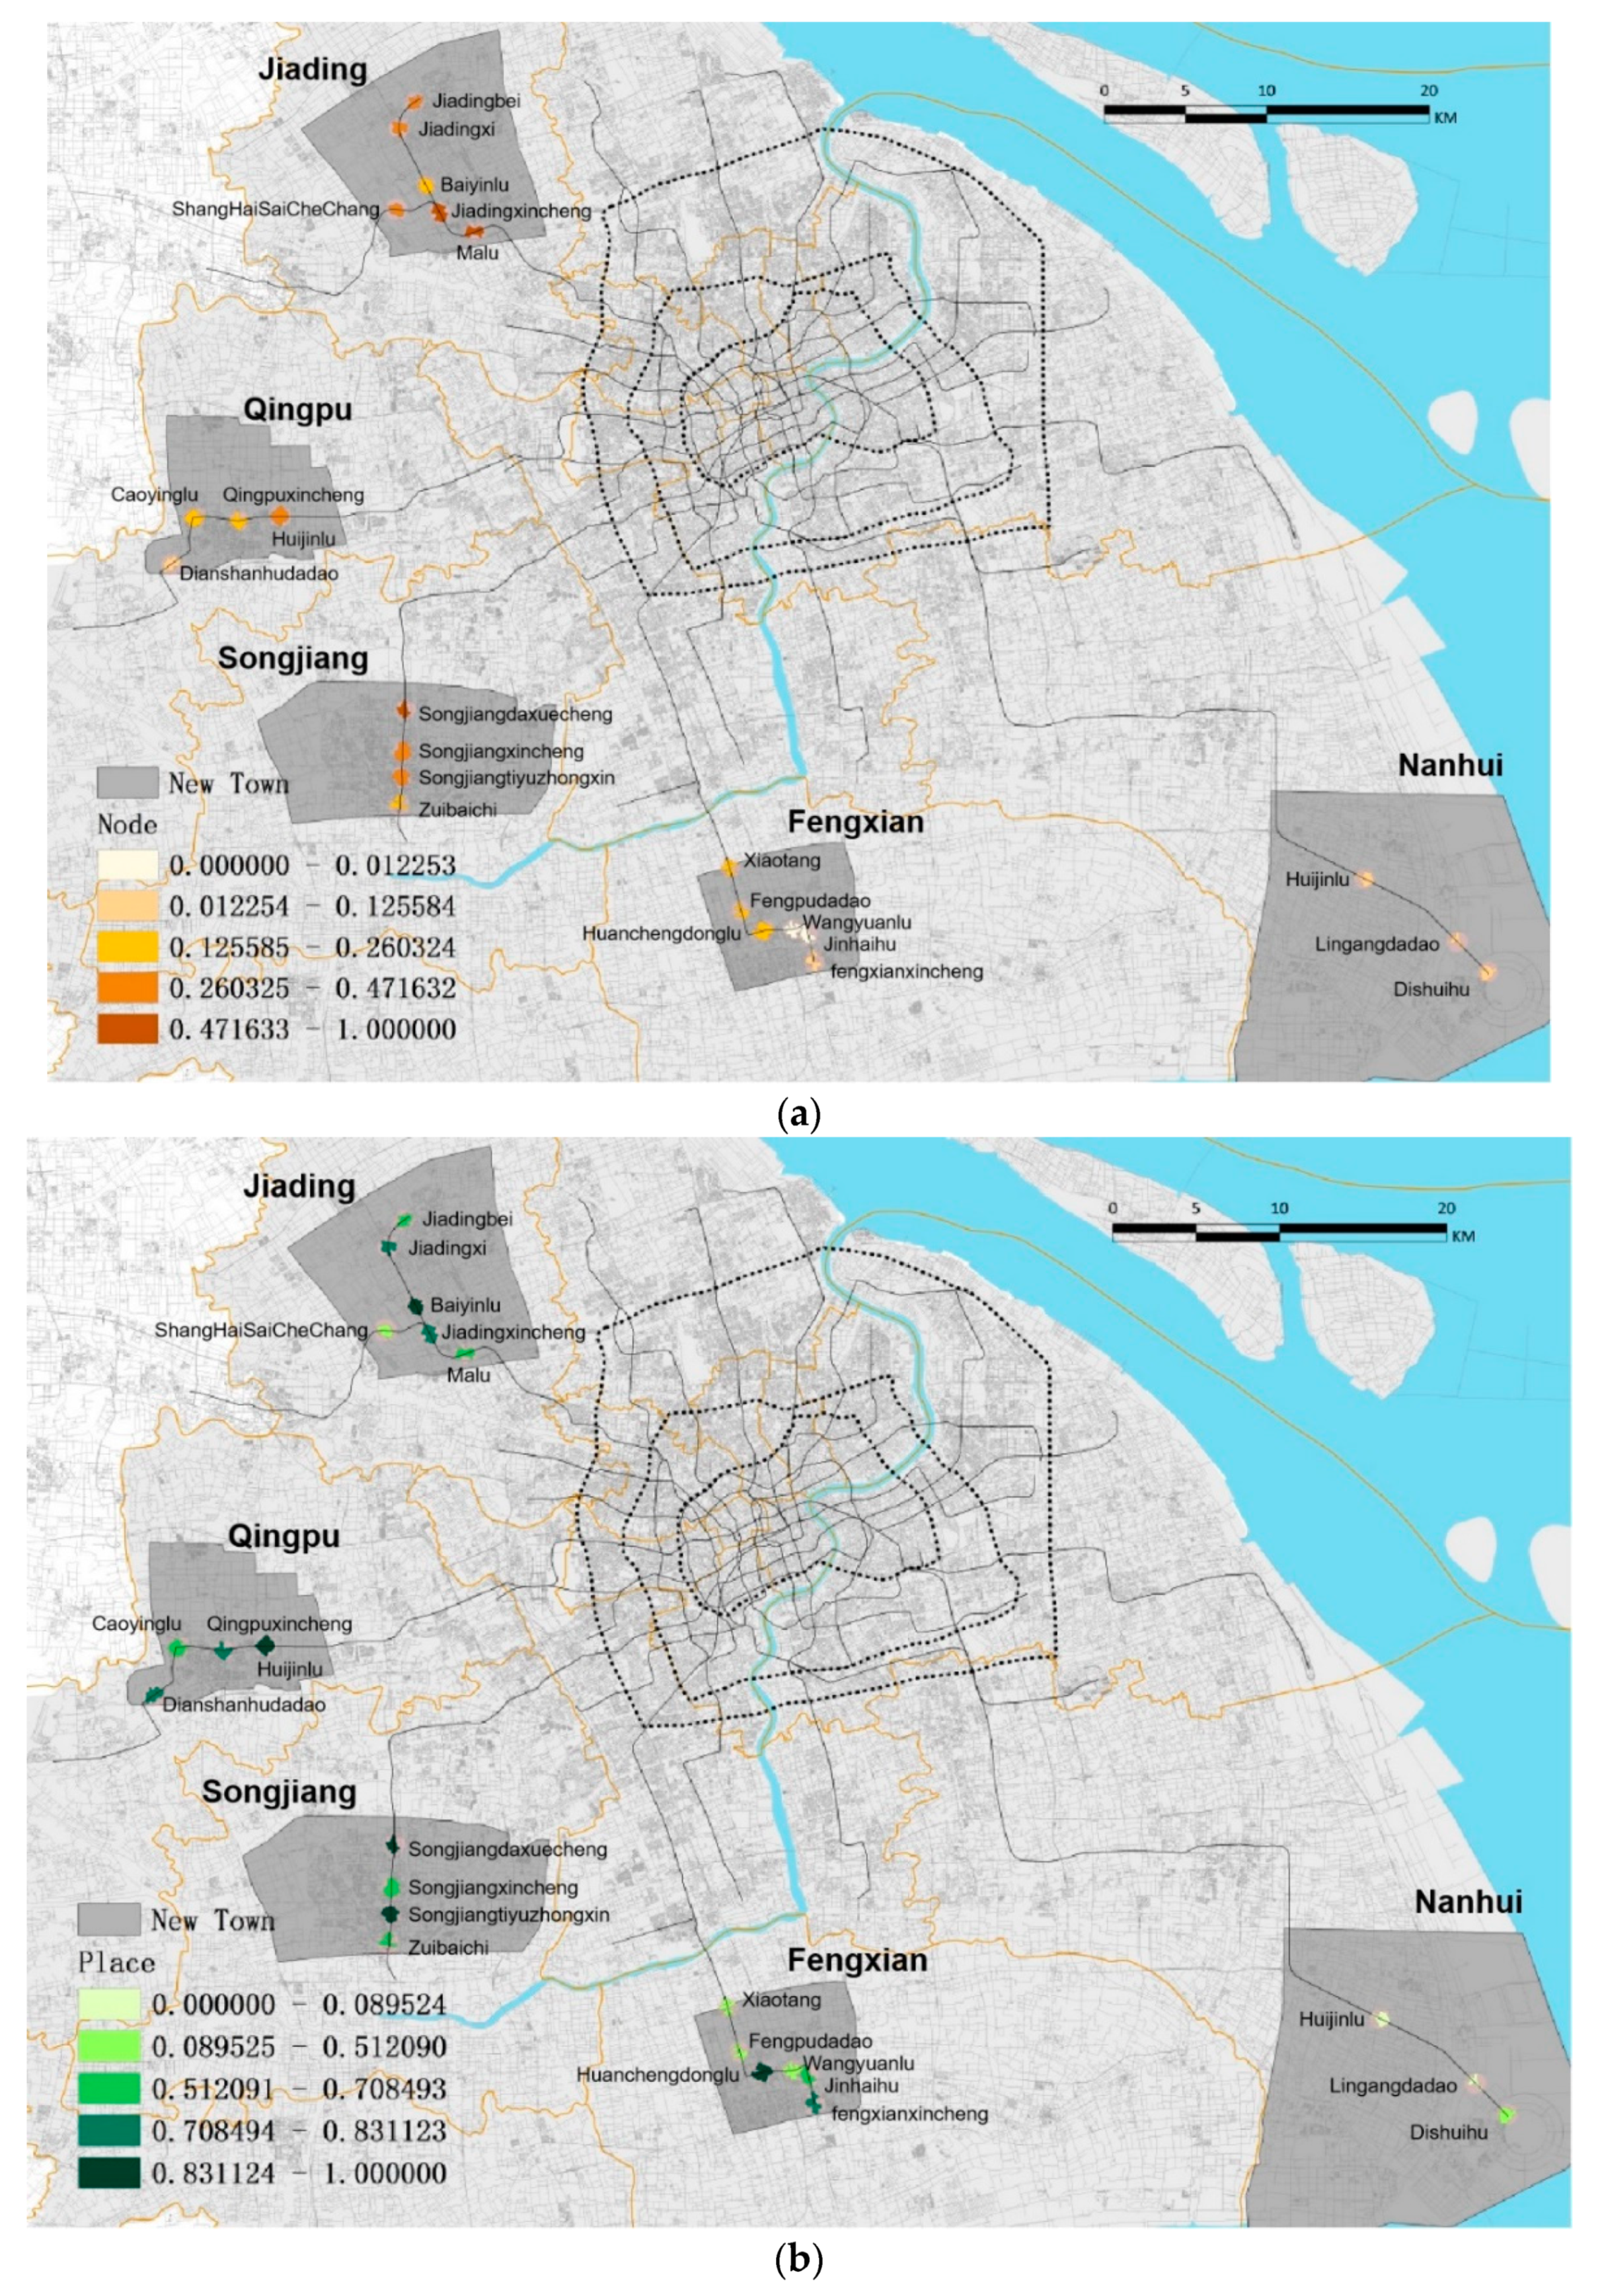
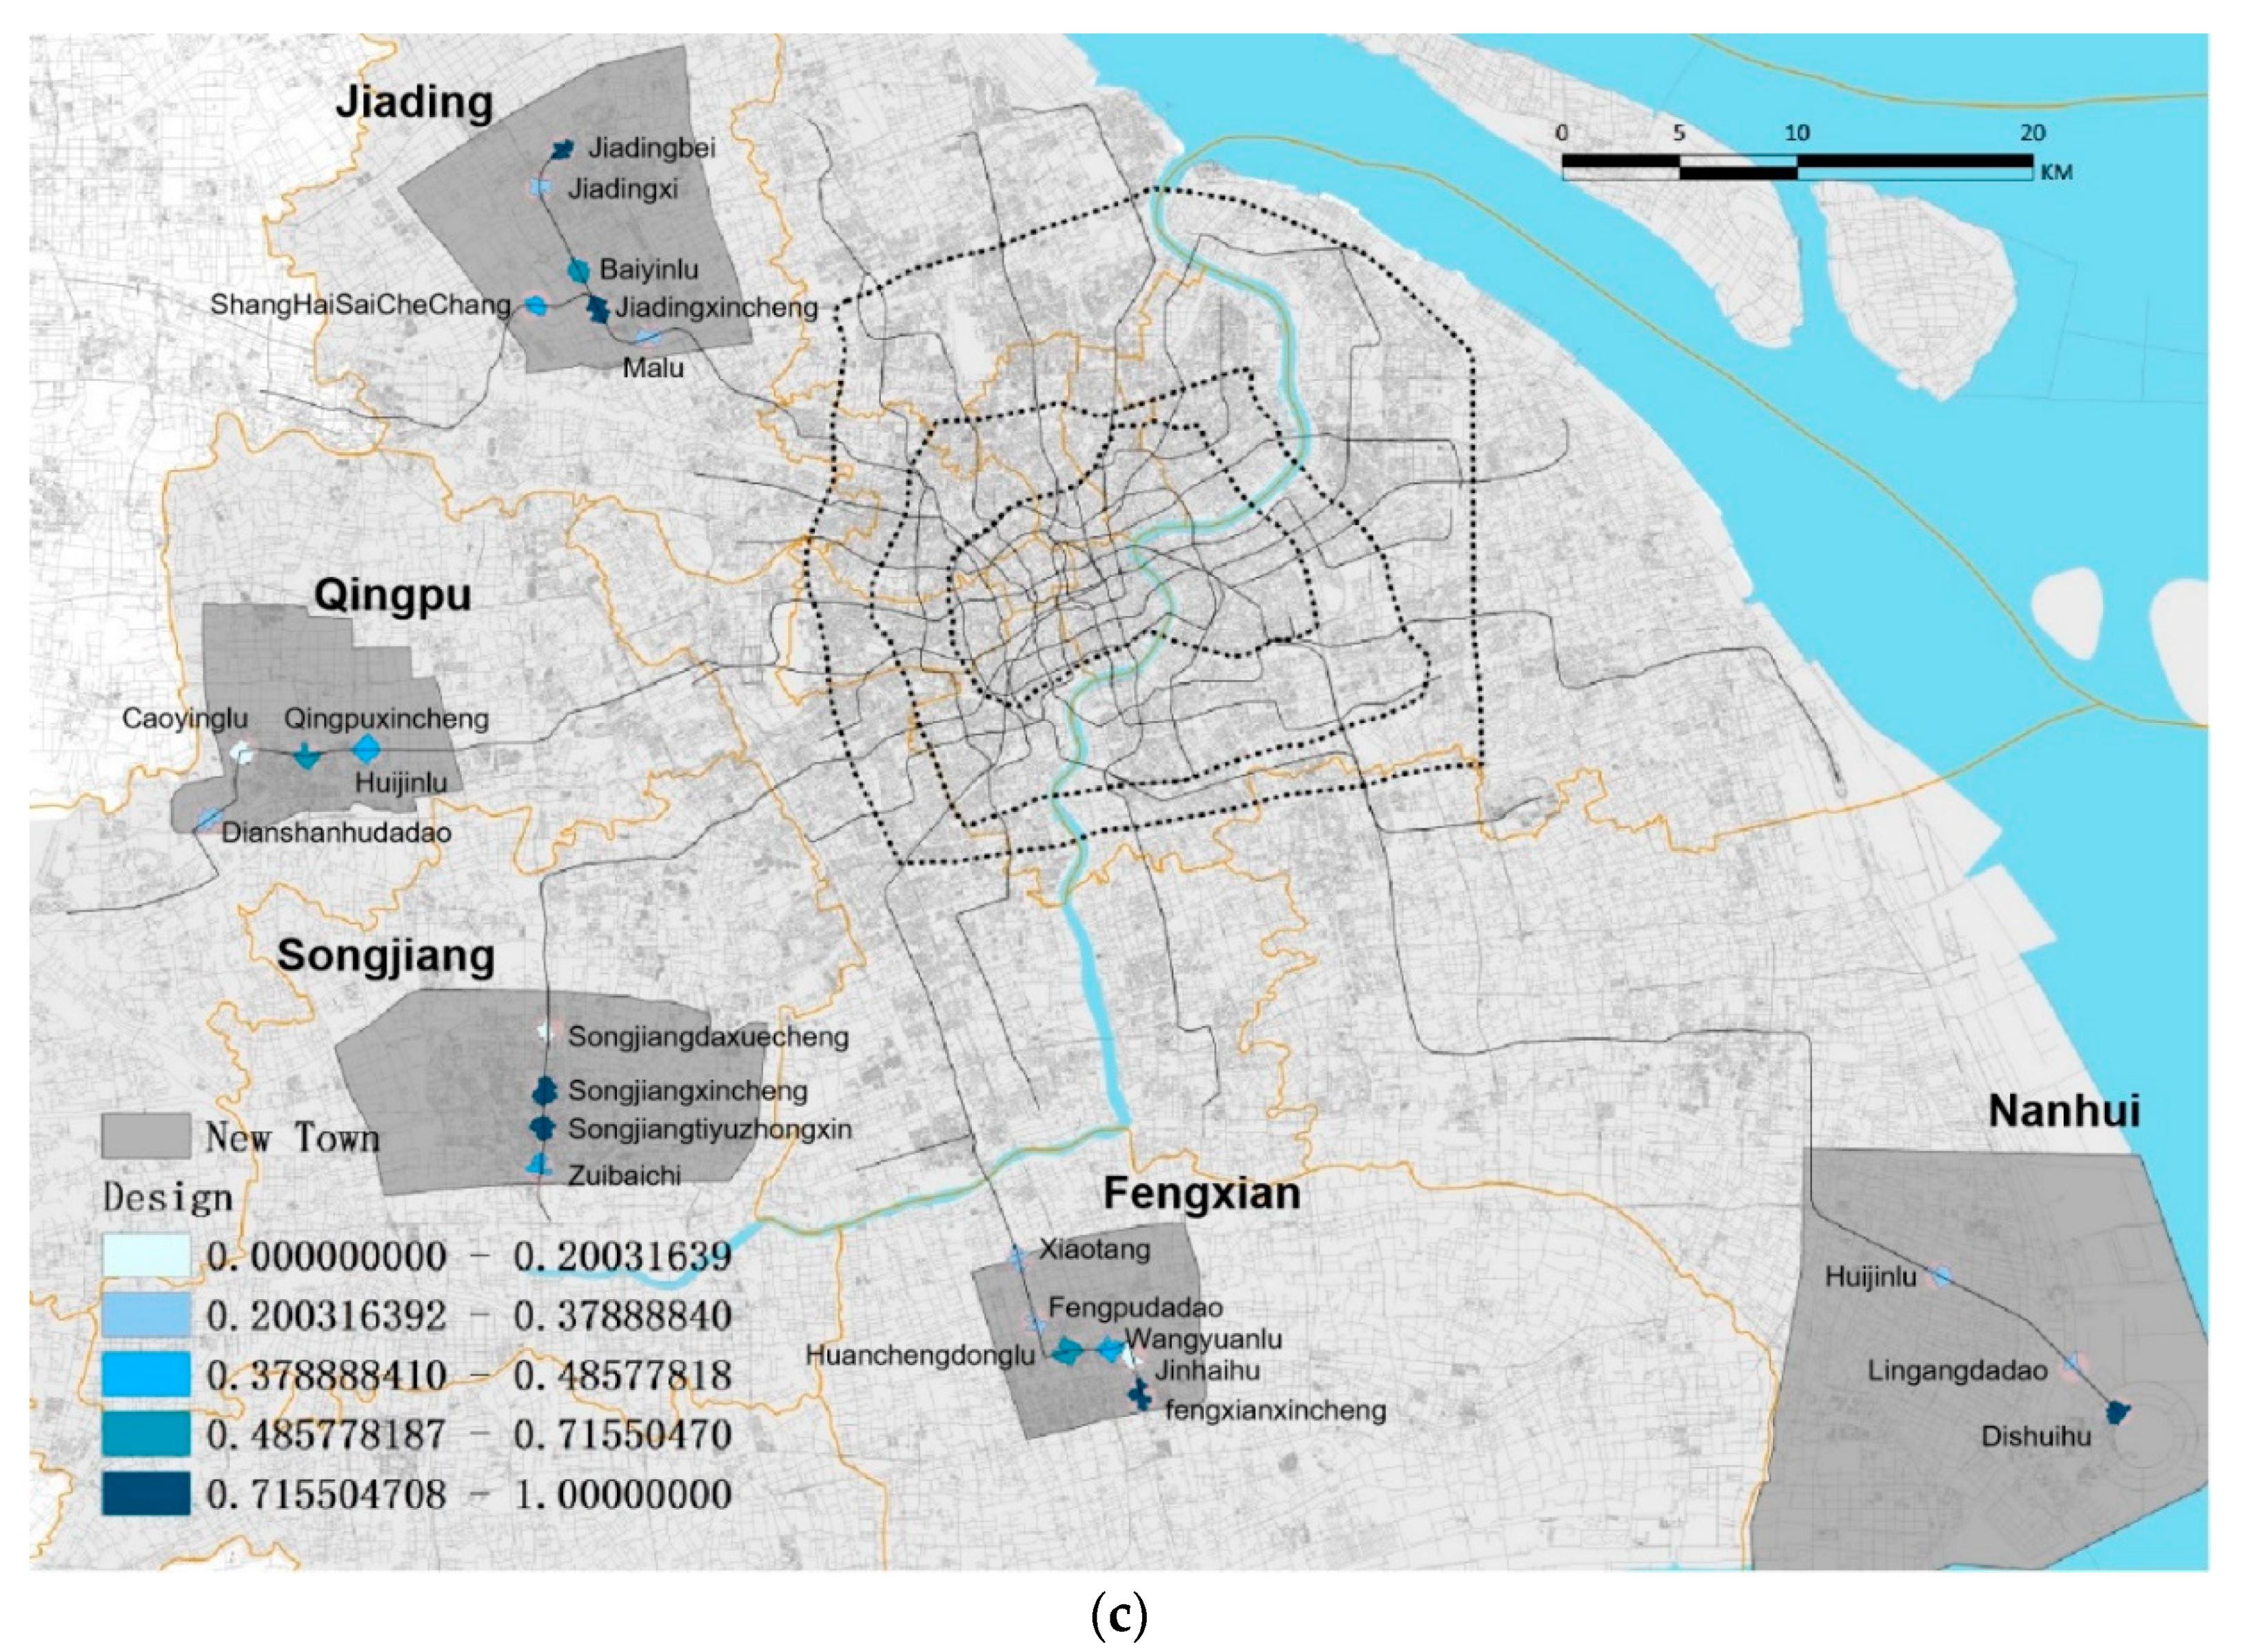
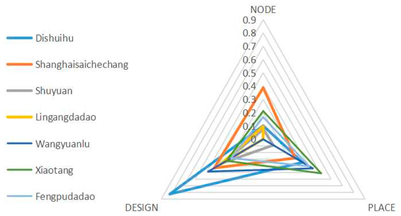
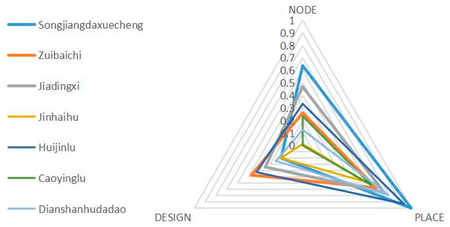
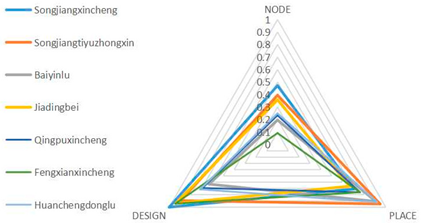
4.2. Node, Place, and Design Indices and TOD Performance in Catchment Areas

Figure 7 shows that the combined TOD indices in Songjiang New City rank the highest, and those of Nanhui New City stand the lowest. The TOD in Jiading New City has the largest variation, accounting for four out of five types, with a high degree of inconsistency. The TOD indices of Qingpu New City and Fengxian New City were relatively close, with only two types. Moreover, except for Fengxian and Nanhui New Cities, the closer the metro station was to downtown Shanghai, the higher the TOD index. This could be because Fengxian New City has the Huangpu river as a natural barrier, and Nanhui New City is far from the central area.
We performed a separate diagnosis of each dimension of metro stations in the Five New Cities (Figure 8). First, the overall performance of the three dimensions of Songjiang and Jiangding New Cities looked excellent but deeply uncoordinated. For example, Songjiangdaxuecheng station in the north of Songjiang New City featured the highest “node” and “place” degree, but the lowest “design” index. This was similar to the Malu station in Jiading New City. By contrast, Songjiangxincheng and Songjiangtiyuzhongxin stations in the center of Songjiang New City had the highest “place” and “design” and the lowest “node” scores. Additionally, Jiadingxincheng station had superior scores in all three dimensions, whereas Shanghaisaichechang was far from satisfactory. Therefore, the two new towns had various problems with different metro stations. The government should take appropriate action in response to these concerns. Second, the TOD area of Qingpu New City had issues of high density and functional mixture, but there were fewer people and employment positions. This indicates that the real estate in Qingpu New City was over-developed, and the surrounding supporting greening and public facilities were insufficient, resulting in problems such as an insufficient permanent resident population. Third, the “place” and “design” were fairly good in stations of Fengxian New City, but the “node” was surprisingly unacceptable, especially in the nearest two stations closest to Fengxianxincheng station. In this case, the core area could not promote a synergy effect between the regions to enhance its sub-center status. Hence, they urgently needed to increase the capacity and connectivity of the stations. Lastly, the stations in Nanhui New City had the worst “node” and “place” degrees. Only the “design” index of Dishuihu station made people comfortable, as it is close to a huge lake and many museums, parks, and hotels. Therefore, Nanhui New City, has a long way to go in applying TOD.
Additionally, most of the indicators of “design” were abstracted from “the 2035 Plan”. For the “design” aspect (Figure 8c), the overall values were considerably high in Jiading and Songjiang New Cities; however, but the values of the stations in each new town varied greatly. The “design” values in other new towns were fairly low, although they were all equipped with one or two stations with high “design” values. Interestingly, the stations with the highest degree of “design” were the central stations of the five new towns, namely Songjiangxincheng, Songjiangtiyuzhongxin, Jiadingxincheng, Fengxianxincheng, and Dishuihu (Dishuihu station was formerly known as Lingangxincheng Station in planning guidance in 2009, and Lingang New City was formerly known as Nanhui New City). Furthermore, the station with the highest “design” index in Qingpu New City was also Qingpuxincheng station, although its score only ranked second. As can be observed, the “design” score supported the planning guidance well. The construction of the central areas of new towns led to the implementation of the planning indicators, which meant that the goal of developing Five New Cities to become sub-centers of Shanghai in “the 2035 Plan” took a huge step forward. However, the stations with the highest “design” values did not have very high “node” or “place” indices, indicating that the TOD concept is still not well-integrated with planning objectives. Urban planners and policymakers should thus focus on combining TOD and comprehensive urban planning.

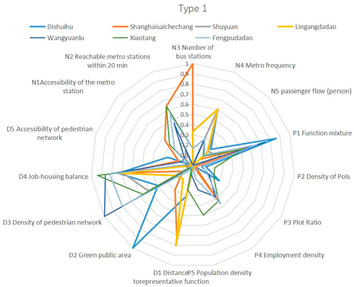
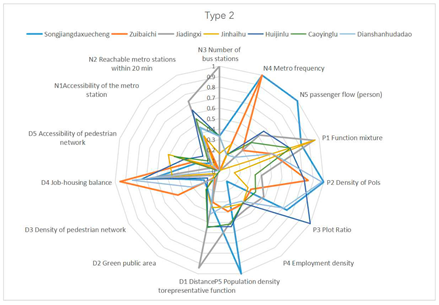
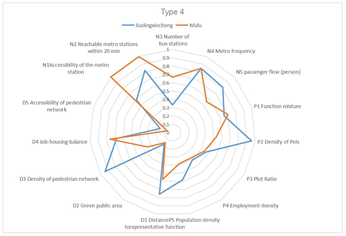
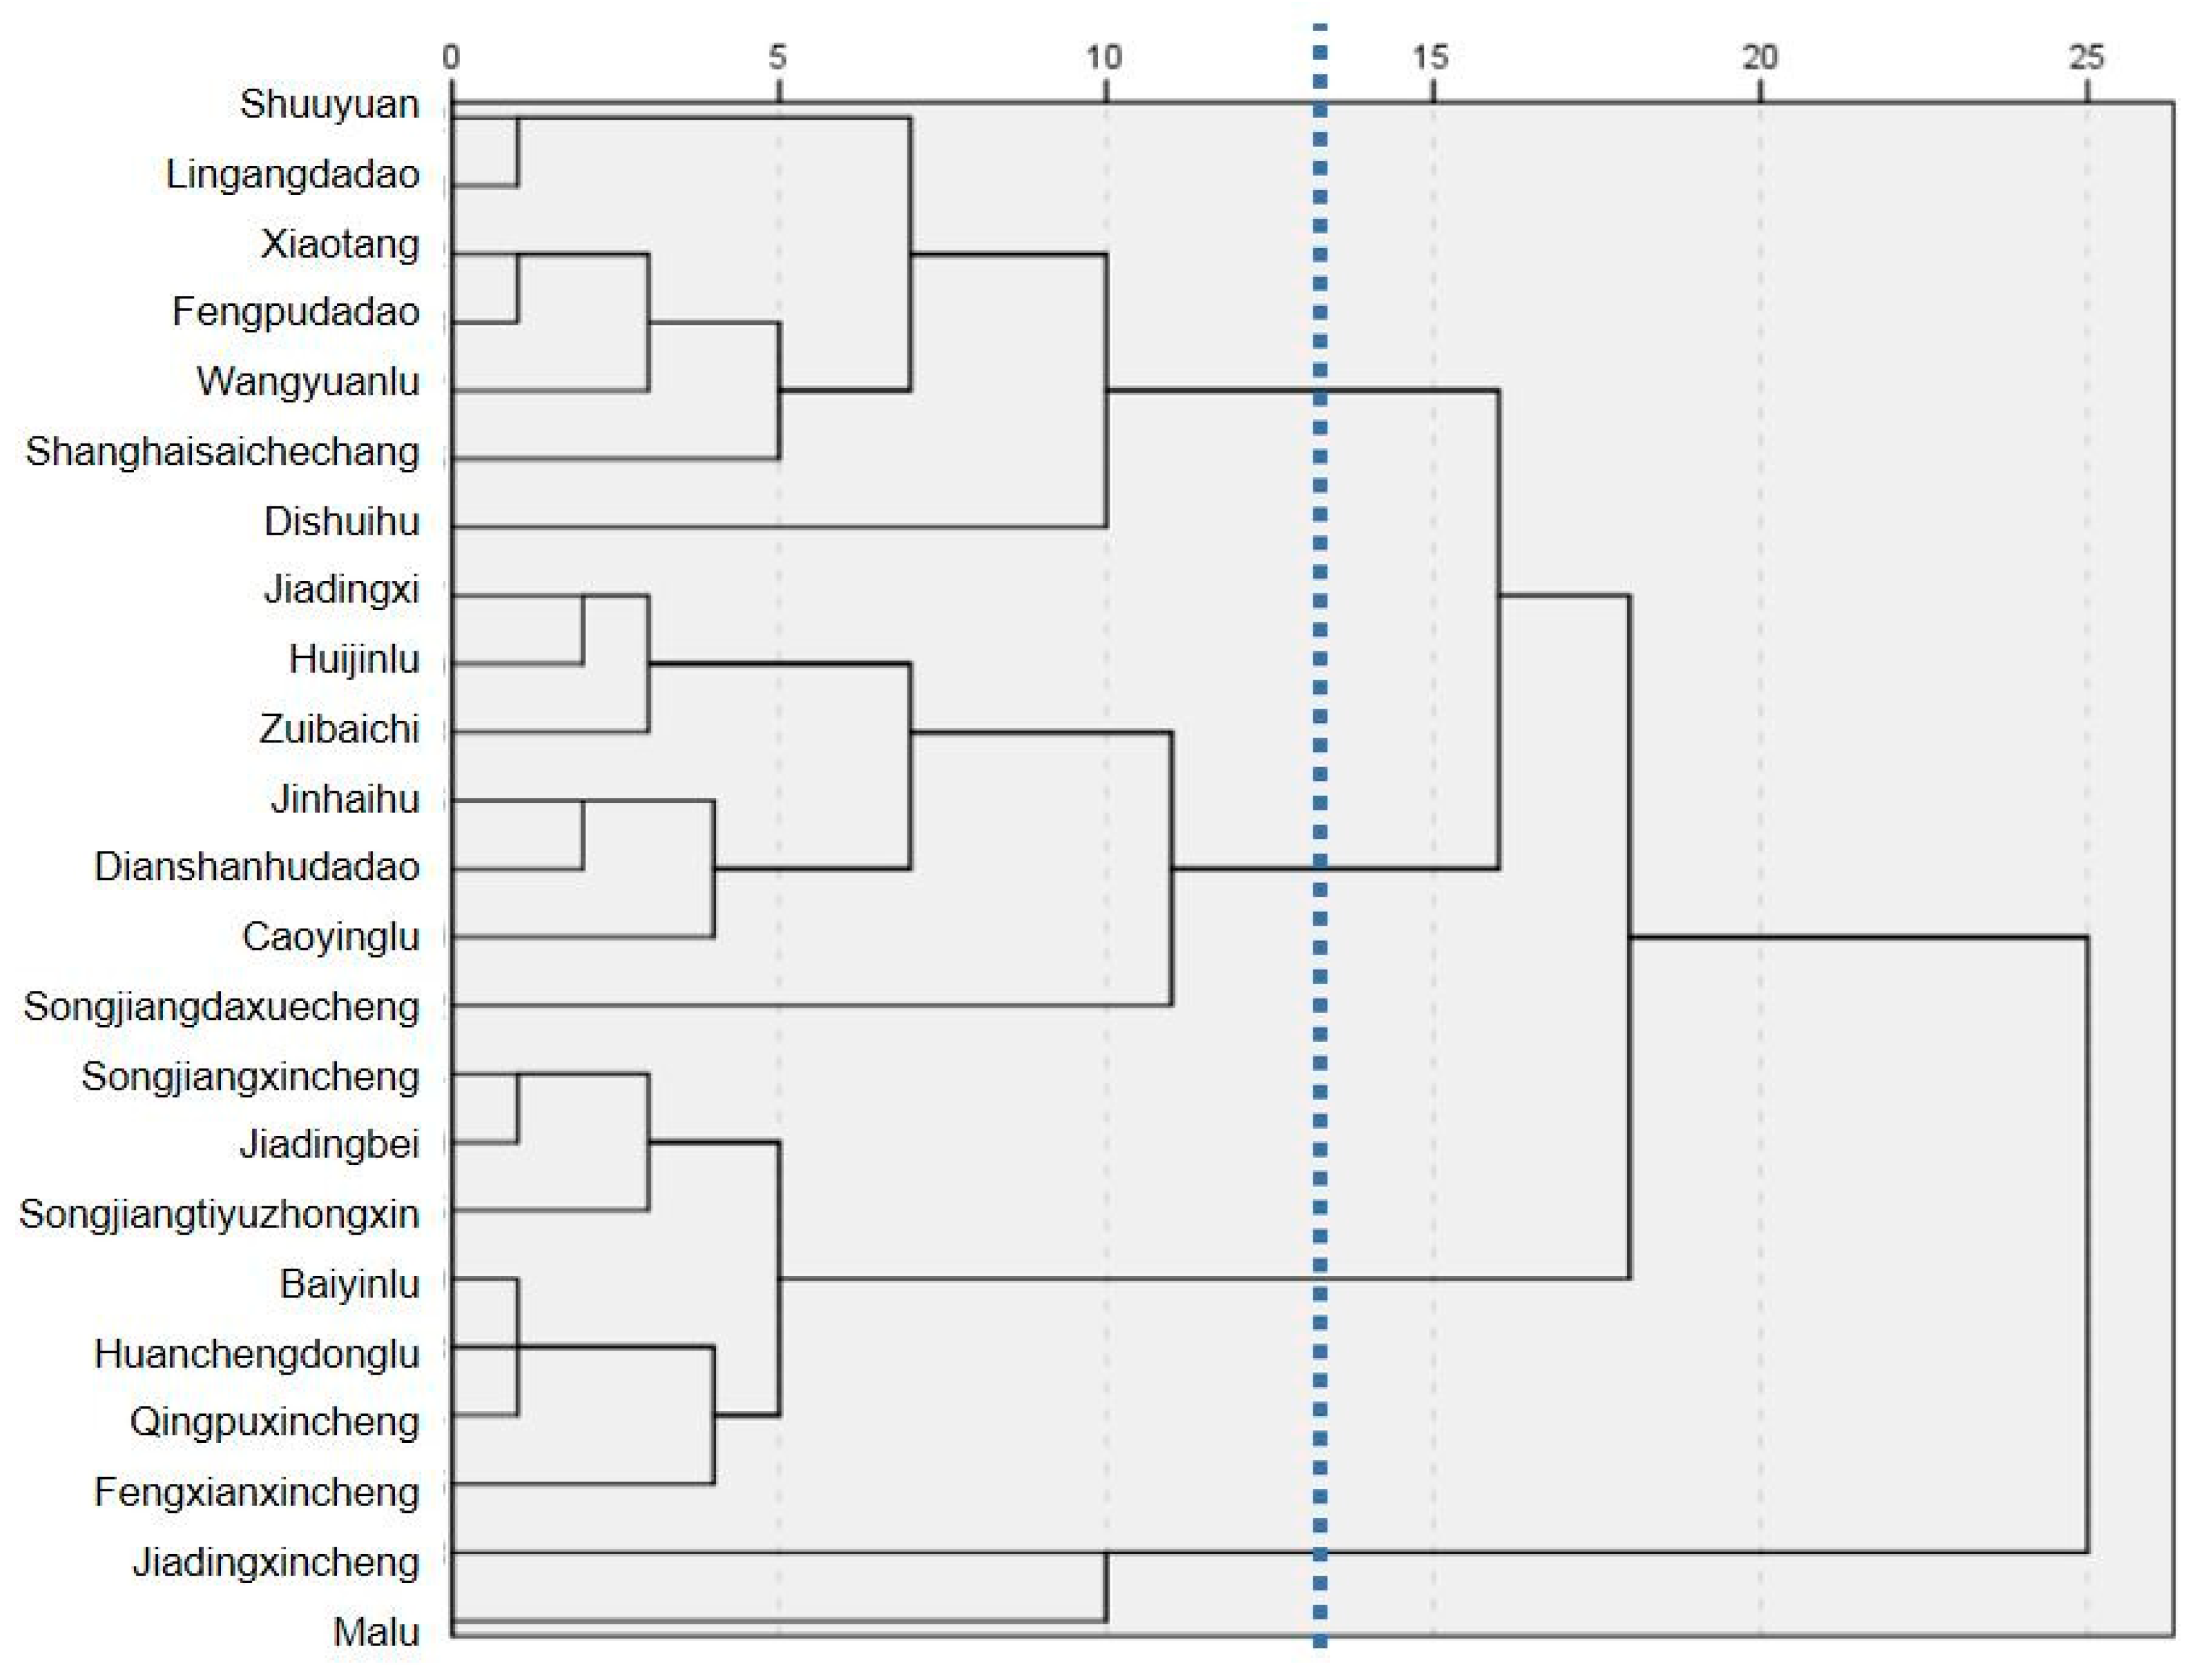
4.3. TOD Typologies in Catchment Areas

We used a hierarchical cluster analysis method to classify 23 metro stations into four categories based on three dimensions (Figure 9), focusing on the geographical distribution and characteristics of each type. The radar charts in Table 3 visualized every dimension of each type for easy comparison. Figure 10 shows the spatial location distribution of the four types. Some conclusions can be drawn when we combine Figure 10 and Table 3:
Type 1—Unsustained: The implementation of TOD in this type of station is at a very early stage. All dimension values of the stations belonging to this type were below 0.5, except for the “design” variable of the Dishuihu station. Nevertheless, despite the unsatisfactory performance, the three indicators of these stations were relatively balanced. Most stations were concentrated in Nanhui and Fengxian New Cities, suggesting that the development of TOD in these areas is very slow. For this type of metro station, the priority of the local government is improving the urban development to attract more citizens to settle down in the new town.
Type 2—Unbalanced place: This type of station’s performance is extremely poor in living quality. Their environments cannot support the overcrowded density. This type was characterized by extremely high “place” values but relatively low “node” and “design” values. This suggested that the population density and land use development around metro stations far outweighed the potential demand created by transportation. Most stations of this type were around the central areas of Qingpu, Songjiang, and Jiading New Cities. The density of real estate development near these stations was similar to that in the new town centers; however, but the quality of transport services and the environment was lower. This can lead to an unbalanced place for such stations. All of them happen to be close to the central station. Consequently, strengthening their “node” and “design” dimensions can help the Five New Cities achieve the goals of “the 2035 Plan” faster and more thoroughly.
Type 3—Unbalanced, lack of nodes: The transportation capability of stations in the third cluster is far from enough. They comprised a comparable balance between “design” and “place” and intermediate “node”. This indicated that urban design and development provided a well-equipped and highly accessible neighborhood to satisfy the needs of an important transportation hub. The only problem is that the operational attributes of the stations were too moderate to match the first two features. The vast majority of Type 3 stations are located in the center of new towns, such as Qingpuxincheng, Songjiangxincheng, and Fengxianxincheng stations, as well as their adjacency, such as Baiyinglu and Songjiangtiyuzhongxin stations. Practically, all of them were built before “the 2035 Plan” was proposed. Therefore, the design of these stations cannot fully meet the rapid development of the surrounding area and needs to be optimized in the future. Local planners need to concentrate more on renovating and upgrading the outmoded stations.
Type 4—Balanced: This type includes two metro stations, Jiangdingxincheng and Malu stations, which can be considered the highest standard of TOD in Shanghai’s new towns, both of which belong to Jiading New City. Malu station was quite balanced but was under stress threat since the “node” was slightly superior to the “place” and the “node” dimensions. By contrast, Jiadingxincheng station was the most balanced station among the 23 new town stations. As shown in Table A1, only the bus station number, green public areas, and accessibility of the pedestrian network were weak and needed to be optimized. Nevertheless, it should be a role model for other stations in developing an outstanding TOD project. For them, further optimization is the punctual enhancement of targeted indicators.

4.4. Analysis of Variance

A one-way analysis of variance (ANOVA) was conducted to evaluate the relationship between the TOD indicators and urban functional topics. We see that the significance value for the five place dimension variables was 0.002, 0.000, 0.035, 0.065, and 0.001, respectively (Table A2), revealing a statistically significant difference in indicators of the “place” dimension in the classification of thematic topics. That is, the classification according to thematic topics changes according to the Density of PoIs, Population Density, Function Mixture, and Plot Ratio. Furthermore, except for the green public area (D2, with a p-value of 0.05), the remaining indicators did not statistically significantly affect the thematic topics’ classification.

5. Discussion and Conclusions

Many cities in China have adopted TOD planning around metro stations. TOD construction is considered critical for economic growth and the population’s daily well-being in suburban developments. By 2035, each new town in Shanghai is expected to have a population of over one million people. From this point of view, the TOD research on new towns is more comprehensive than that on the metropolis. It is imperative to examine the TOD performance of metro station areas for new towns and to discuss how TOD should be adapted to suburban Shanghai. Several studies have attempted to investigate the effectiveness of the TOD application at the urban peripheral locations in a large metropolitan region [3,30]. However, few such studies have quantitatively examined TOD performance and TOD typology for suburban areas.
This research aimed to investigate the TOD implementation of the catchment areas of metro stations in new towns and examine how the TOD typology can be used as a decision-support tool for planners by introducing a data-driven analytical framework. Unlike prior research, this study provides a comprehensive and realistic evaluation approach for measuring TOD performance by incorporating the “design” dimension in an extended “node–design–place” framework and employing relevant indicators supporting planning objectives.
The differences in the thematic topic were visualized by identifying the most prototypical thematic topics of urban functions for catchment areas. Five types of stations were identified via hierarchy clustering. We observed that most metro stations only had one thematic topic. In contrast, eight of the 23 metro stations studied were labeled with multiple thematic topics, revealing that these station areas have started to develop a multifunctional system. Additionally, the TOD index of each catchment area is based on an extended “node-place” model. The study revealed that there is uneven development of new towns in Shanghai. The TOD typologies further distinguished in this study can provide valuable insights for TOD planning. Planners should design individualized strategies for each TOD type based on their function and planning targets.
A few limitations need to be pointed out. First, a set of indicators was selected based on a literature review, five new towns’ comprehensive plans, and data availability. This procedure can cause limitations in subjective bias and knowledge scope. In the future, planners and governors should verify the validity of the chosen indicators and determine their proportions. Second, although PoIs are positively correlated with urban vitality, it is worthwhile to collect and analyze more user-generated datasets to provide a more accurate and comprehensive insight into local activities. Third, this study focuses on the current conditions of TOD sites. Finally, there is an absence of planning data for estimating the future condition of TOD sites. Follow-up research should further explore information such as projected or assumed population and employment density in 2035. An evaluation of TOD performance based on more in-depth information and planning guidelines could help planners and governors to diagnose and correct problems in the planning stage, and to guide the planning process.

Author Contributions

Conceptualization, L.Z. and D.Q.; methodology, L.Z. and D.Q.; formal analysis, P.H. and D.Q.; writing—review and editing, DQ., L.Z. and P.H.; funding acquisition, L.Z. All authors have read and agreed to the published version of the manuscript.

Funding

This research was funded by the National Natural Science Foundation of China (52008297); Shanghai Pujiang Program (21PJC114).

Institutional Review Board Statement

Not applicable.

Informed Consent Statement

Not applicable.

Data Availability Statement

The datasets analyzed for this study are included in the article/table, further inquiries can be directed to the corresponding authors.

Conflicts of Interest

The authors declare no conflict of interest.

Appendix A

Table A1. Rader charts for each indicator by types.
Type 1Type 2
Buildings 12 01394 i005 Buildings 12 01394 i006
Type 3Type 4
Buildings 12 01394 i007 Buildings 12 01394 i008
Table A2. One-way ANOVA result.
Sum of SquaresDfMean SquaresFp
N1Accessibility of the metro stationBetween groups0.06540.0160.2840.885
Within groups1.035180.057
Total1.10022
N2 Reachable metro stations within 20 minBetween groups0.50240.1252.8770.053
Within groups0.785180.044
Total1.28722
N3 Number of bus stationsBetween groups0.12040.0300.3610.833
Within groups1.492180.083
Total1.61122
N4 Metro frequencyBetween groups0.60840.1521.2040.343
Within groups2.272180.126
Total2.88022
N5 passenger flow (person)Between groups0.33440.0841.2120.340
Within groups1.240180.069
Total1.57522
P1 Function mixtureBetween groups0.70640.1776.3150.002
Within groups0.503180.028
Total1.20922
P2 Density of PoIsBetween groups1.92940.48211.6140.000
Within groups0.748180.042
Total2.67722
P3 Plot RatioBetween groups0.66140.1653.2850.035
Within groups0.905180.050
Total1.56622
P4 Employment densityBetween groups0.34440.0862.6830.065
Within groups0.577180.032
Total0.92022
P5 Population densityBetween groups0.80540.2017.6550.001
Within groups0.473180.026
Total1.27922
D1 Distance to representative functionBetween groups0.24240.0610.9460.460
Within groups1.152180.064
Total1.39422
D2 Green public areaBetween groups0.80040.2005.4980.005
Within groups0.655180.036
Total1.45522
D3 Density of pedestrian networkBetween groups0.13340.0330.3050.871
Within groups1.970180.109
Total2.10322
D4 Job-housing balanceBetween groups0.11340.0280.5590.695
Within groups0.906180.050
Total1.01822
D5 Accessibility of pedestrian networkBetween groups0.47940.1202.1950.111
Within groups0.983180.055
Total1.46222

References

  1. Wang, C.; Yang, S. Dynamic Analysis on Population Suburbanization and New Town Development in Shanghai. City Plan. Rev. 2016, 25, 70–75. [Google Scholar]
  2. Niu, X.; Ding, L.; Song, X. Analyzing Suburban New Town Development in Shanghai from the Perspective of Jobs-Housing Spatial Relationship. City Plan. Rev. 2017, 41, 47–53. [Google Scholar]
  3. Shen, J.; Wu, F. Paving the Way to Growth: Transit-Oriented Development as a Financing Instrument for Shanghai’s Post-Suburbanization. Urban Geogr. 2020, 41, 1010–1032. [Google Scholar] [CrossRef]
  4. Ximing, L.; Xiang, W. Regional Rapid Rail Transit Planning in Shanghai Metropolitan Area. Urban Transp. China 2014, 6, 8–17. [Google Scholar]
  5. Shanghai Municipal People’s Government. Shanghai Urban Master Plan. Available online: https://www.supdri.com/2035/public/ebook07.pdf (accessed on 12 July 2022).
  6. Zhou, J.; Yang, Y.; Gu, P.; Yin, L.; Zhang, F.; Zhang, F.; Li, D. Can TODness Improve (Expected) Performances of TODs? An Exploration Facilitated by Non-Traditional Data. Transp. Res. Part D Transp. Environ. 2019, 74, 28–47. [Google Scholar] [CrossRef]
  7. Yu, Z.; Zhu, X.; Liu, X. Characterizing Metro Stations via Urban Function: Thematic Evidence from Transit-Oriented Development (TOD) in Hong Kong. J. Transp. Geogr. 2022, 99, 103299. [Google Scholar] [CrossRef]
  8. Qiang, D.; Zhang, L.; Huang, X. Quantitative Evaluation of TOD Performance Based on Multi-Source Data: A Case Study of Shanghai. Front. Public Health 2022, 10, 820694. [Google Scholar] [CrossRef]
  9. Zhou, J.; Yang, Y.; Webster, C. Using Big and Open Data to Analyze Transit-Oriented Development. J. Am. Plan. Assoc. 2020, 86, 364–376. [Google Scholar] [CrossRef]
  10. Gu, P.; He, D.; Chen, Y.; Christopher Zegras, P.; Jiang, Y. Transit-Oriented Development and Air Quality in Chinese Cities: A City-Level Examination. Transp. Res. Part D Transp. Environ. 2019, 68, 10–25. [Google Scholar] [CrossRef]
  11. Calthorpe, P. The Next American Metropolis: Ecology, Community, and the American Dream; Princeton Architectural Press: New York, NY, USA, 1993; ISBN 978-1-878271-68-6. [Google Scholar]
  12. Bruce, C. Transit Oriented Development in China: Designing a New Transit Oriented Neighbourhood in Hexi New Town, Nanjing, Based on Hong Kong Case Studies; Blekinge Institute of Technology & Nanjing Forestry University: Nanjing, China, 2012. [Google Scholar]
  13. National Bureau of Statistics of China. The Main Data of the Seventh National Census. Available online: http://www.stats.gov.cn/tjsj/zxfb/202105/t20210510_1817176.html (accessed on 10 July 2022).
  14. Campanella, T.J. The Concrete Dragon: China’s Urban Revolution and What It Means for the World; Princeton Architectural Press: New York, NY, USA, 2008; ISBN 978-1-56898-627-2. [Google Scholar]
  15. Ibraeva, A.; de Almeida Correia, G.H.; Silva, C.; Antunes, A.P. Transit-Oriented Development: A Review of Research Achievements and Challenges. Transp. Res. Part A Policy Pract. 2020, 132, 110–130. [Google Scholar] [CrossRef]
  16. Cervero, R.; Murakami, J. Rail and Property Development in Hong Kong: Experiences and Extensions. Urban Stud. 2009, 46, 2019–2043. [Google Scholar] [CrossRef]
  17. Chen, Y. The Public Transport Community and The Urban Land Use Form Guided by The Public Transport. City Plan. Rev. 2000, 3, 10–14+64. [Google Scholar]
  18. Chow, A.S.Y. Urban Design, Transport Sustainability and Residents’ Perceived Sustainability: A Case Study of Transit-Oriented Development in Hong Kong. J. Comp. Asian Dev. 2014, 13, 73–104. [Google Scholar] [CrossRef]
  19. Al-Kodmany, K.; Xue, Q.; Sun, C. Reconfiguring Vertical Urbanism: The Example of Tall Buildings and Transit-Oriented Development (TB-TOD) in Hong Kong. Buildings 2022, 12, 197. [Google Scholar] [CrossRef]
  20. Zhao, P.; Li, S. Suburbanization, Land Use of TOD and Lifestyle Mobility in the Suburbs: An Examination of Passengers’ Choice to Live, Shop and Entertain in the Metro Station Areas of Beijing. J. Transp. Land Use 2018, 11, 195–215. [Google Scholar]
  21. Sun, B.; Ermagun, A.; Dan, B. Built Environmental Impacts on Commuting Mode Choice and Distance: Evidence from Shanghai. Transp. Res. Part D Transp. Environ. 2017, 52, 441–453. [Google Scholar] [CrossRef]
  22. Chen, Y.; Yao, M.; Cai, Z. Research on the Classification of Urban Rail Transit Stations—Taking Shanghai Metro as an Example. In Proceedings of the 2018 15th International Conference on Service Systems and Service Management (ICSSSM), Hangzhou, China, 21–22 July 2018; pp. 1–6. [Google Scholar]
  23. Li, Z.; Han, Z.; Xin, J.; Luo, X.; Su, S.; Weng, M. Transit Oriented Development among Metro Station Areas in Shanghai, China: Variations, Typology, Optimization and Implications for Land Use Planning. Land Use Policy 2019, 82, 269–282. [Google Scholar] [CrossRef]
  24. Yang, J.; Chen, J.; Le, X.; Zhang, Q. Density-Oriented versus Development-Oriented Transit Investment: Decoding Metro Station Location Selection in Shenzhen. Transp. Policy 2016, 51, 93–102. [Google Scholar] [CrossRef]
  25. Zhang, M. Chinese Edition of Transit-Oriented Development. Transp. Res. Rec. 2007, 2038, 120–127. [Google Scholar] [CrossRef]
  26. Spear, J. Urban Transport Themes in China and Lessons from International Experience. In Proceedings of the European Transport Conference, Strasbourg, France, 18–20 September 2006; pp. 1–23. [Google Scholar]
  27. Gu, Y.; Zheng, S. The Impacts of Rail Transit on Housing Prices and Land Development Intensity: The Case of No.13 Line of Beijing. SSRN Electron. J. 2008, 40, 124–133. [Google Scholar] [CrossRef]
  28. Deng, T.; Nelson, J.D. The Impact of Bus Rapid Transit on Land Development: A Case Study of Beijing, China. Int. J. Humanit. Soc. Sci. 2010, 4, 1169–1179. [Google Scholar]
  29. Liang, Y.; Du, M.; Wang, X.; Xu, X. Planning for Urban Life: A New Approach of Sustainable Land Use Plan Based on Transit-Oriented Development. Eval. Program Plan. 2020, 80, 101811. [Google Scholar] [CrossRef] [PubMed]
  30. Pan, H.; Shen, Q.; Liu, C. Transit-Oriented Development at the Urban Periphery: Insights from a Case Study in Shanghai, China. Transp. Res. Rec. 2011, 2245, 95–102. [Google Scholar] [CrossRef]
  31. Doulet, J.-F.; Delpirou, A.; Delaunay, T. Taking Advantage of a Historic Opportunity? A Critical Review of the Literature on TOD in China. J. Transp. Land Use 2017, 10, 77–92. [Google Scholar]
  32. Bertolini, L. Spatial Development Patterns and Public Transport: The Application of an Analytical Model in the Netherlands. Plan. Pract. Res. 1999, 14, 199–210. [Google Scholar] [CrossRef]
  33. Reusser, D.E.; Loukopoulos, P.; Stauffacher, M.; Scholz, R.W. Classifying Railway Stations for Sustainable Transitions—Balancing Node and Place Functions. J. Transp. Geogr. 2008, 16, 191–202. [Google Scholar] [CrossRef]
  34. Chorus, P.; Bertolini, L. An Application of the Node Place Model to Explore the Spatial Development Dynamics of Station Areas in Tokyo. J. Transp. Land Use 2011, 4, 45–58. [Google Scholar]
  35. Zemp, S.; Stauffacher, M.; Lang, D.J.; Scholz, R.W. Classifying Railway Stations for Strategic Transport and Land Use Planning: Context Matters! J. Transp. Geogr. 2011, 19, 670–679. [Google Scholar] [CrossRef]
  36. Phani Kumar, P.; Ravi Sekhar, C.; Parida, M. Identification of Neighborhood Typology for Potential Transit-Oriented Development. Transp. Res. Part D Transp. Environ. 2020, 78, 102186. [Google Scholar] [CrossRef]
  37. Lyu, G.; Bertolini, L.; Pfeffer, K. Developing a TOD Typology for Beijing Metro Station Areas. J. Transp. Geogr. 2016, 55, 40–50. [Google Scholar] [CrossRef]
  38. Vale, D.S. Transit-Oriented Development, Integration of Land Use and Transport, and Pedestrian Accessibility: Combining Node-Place Model with Pedestrian Shed Ratio to Evaluate and Classify Station Areas in Lisbon. J. Transp. Geogr. 2015, 45, 70–80. [Google Scholar] [CrossRef]
  39. Park, S.; Choi, K.; Lee, J.S. To Walk or Not to Walk: Testing the Effect of Path Walkability on Transit Users’ Access Mode Choices to the Station. Int. J. Sustain. Transp. 2015, 9, 529–541. [Google Scholar] [CrossRef]
  40. Nawrocki, J.; Nakagawa, D.; Matsunaka, R.; Oba, T. Measuring Walkability and Its Effect on Light Rail Usage: A Comparative Study of the USA and Japan. Urban Transp. XX 2014, 138, 10–2495. [Google Scholar]
  41. Kamruzzaman, M.; Baker, D.; Washington, S.; Turrell, G. Advance Transit Oriented Development Typology: Case Study in Brisbane, Australia. J. Transp. Geogr. 2014, 34, 54–70. [Google Scholar] [CrossRef]
  42. Singh, Y.J.; Fard, P.; Zuidgeest, M.; Brussel, M.; van Maarseveen, M. Measuring Transit Oriented Development: A Spatial Multi Criteria Assessment Approach for the City Region Arnhem and Nijmegen. J. Transp. Geogr. 2014, 35, 130–143. [Google Scholar] [CrossRef]
  43. Cervero, R.; Kockelman, K. Travel Demand and the 3Ds: Density, Diversity, and Design. Transp. Res. Part D Transp. Environ. 1997, 2, 199–219. [Google Scholar] [CrossRef]
  44. Monajem, S.; Ekram Nosratian, F. The Evaluation of the Spatial Integration of Station Areas via the Node Place Model; an Application to Subway Station Areas in Tehran. Transp. Res. Part D Transp. Environ. 2015, 40, 14–27. [Google Scholar] [CrossRef]
  45. Nigro, A.; Bertolini, L.; Moccia, F.D. Land Use and Public Transport Integration in Small Cities and Towns: Assessment Methodology and Application. J. Transp. Geogr. 2019, 74, 110–124. [Google Scholar] [CrossRef]
  46. Ewing, R.; Cervero, R. Travel and the Built Environment: A Meta-Analysis. J. Am. Plan. Assoc. 2010, 76, 265–294. [Google Scholar] [CrossRef]
  47. Vale, D.S.; Pereira, M. Influence on Pedestrian Commuting Behavior of the Built Environment Surrounding Destinations: A Structural Equations Modeling Approach. Int. J. Sustain. Transp. 2016, 10, 730–741. [Google Scholar] [CrossRef]
  48. Loo, B.P.Y.; Verle, F. du Transit-Oriented Development in Future Cities: Towards a Two-Level Sustainable Mobility Strategy. Int. J. Urban Sci. 2017, 21, 54–67. [Google Scholar] [CrossRef]
  49. Singh, Y.J.; Lukman, A.; Flacke, J.; Zuidgeest, M.; Van Maarseveen, M.F.A.M. Measuring TOD around Transit Nodes—Towards TOD Policy. Transp. Policy 2017, 56, 96–111. [Google Scholar] [CrossRef]
  50. Vale, D.S.; Viana, C.M.; Pereira, M. The Extended Node-Place Model at the Local Scale: Evaluating the Integration of Land Use and Transport for Lisbon’s Subway Network. J. Transp. Geogr. 2018, 69, 282–293. [Google Scholar] [CrossRef]
  51. Pezeshknejad, P.; Monajem, S.; Mozafari, H. Evaluating Sustainability and Land Use Integration of BRT Stations via Extended Node Place Model, an Application on BRT Stations of Tehran. J. Transp. Geogr. 2020, 82, 102626. [Google Scholar] [CrossRef]
  52. Su, S.; Zhang, H.; Wang, M.; Weng, M.; Kang, M. Transit-Oriented Development (TOD) Typologies around Metro Station Areas in Urban China: A Comparative Analysis of Five Typical Megacities for Planning Implications. J. Transp. Geogr. 2021, 90, 102939. [Google Scholar] [CrossRef]
  53. Cooper, C.H.; Chiaradia, A.J. SDNA: 3-d Spatial Network Analysis for GIS, CAD, Command Line & Python. SoftwareX 2020, 12, 100525. [Google Scholar]
  54. Dou, M.; Wang, Y.; Dong, S. Integrating Network Centrality and Node-Place Model to Evaluate and Classify Station Areas in Shanghai. ISPRS Int. J. Geo-Inf. 2021, 10, 414. [Google Scholar] [CrossRef]
  55. van Eggermond, M.A.B.; Erath, A.L. Quantifying Diversity: An Assessment of Diversity Indices and an Application to Singapore. FCL Mag. Spec. Issue—Urban Breed. Grounds 2016, 30–37. [Google Scholar] [CrossRef]
  56. Shanghai Pingpu District People’s Government. Comprehensive Plan and General Land-Use Plan of Qingpu District, Shanghai, 2017–2035; Shanghai Pingpu District People’s Government: Shanghai, China, 2019.
  57. Shanghai Songjiang District People’s Government. Shanghai Municipal Bureau of Planning and Natural Resources, Comprehensive Plan and General Land-Use Plan of Songjiang District, Shanghai, 2017–2035; Shanghai Songjiang District People’s Government: Shanghai, China, 2019.
  58. Shanghai Fengxian District People’s Government. Shanghai Municipal Bureau of Planning and Natural Resources, Comprehensive Plan and General Land-Use Plan of Fengxian District, Shanghai, 2017–2035; Shanghai Fengxian District People’s Government: Shanghai, China, 2019.
  59. Shanghai Jiading District People’s Government. Shanghai Municipal Bureau of Planning and Natural Resources, Comprehensive Plan and General Land-Use Plan of Jiading District, Shanghai, 2017–2035; Shanghai Jiading District People’s Government: Shanghai, China, 2019.
  60. Shanghai Pudong New Area People’s Government. Shanghai Municipal Bureau of Planning and Natural Resources, Comprehensive Plan and General Land-Use Plan of Pudong New Area, Shanghai, 2017–2035; Shanghai Pudong New Area People’s Government: Shanghai, China, 2018.
  61. Shanghai Municipal People’s Government. Territory Spatial Master Plan of China (Shanghai) Pilot Free Trade Zone Lin-Gang Special Area (2019–2035); Shanghai Municipal People’s Government: Shanghai, China, 2020.
Figure 1. Analytic framework.
Buildings 12 01394 g001
Figure 2. Study area.
Buildings 12 01394 g002
Figure 3. LDA results of LDA topic modeling.
Buildings 12 01394 g003
Figure 4. LDA comparison word cloud.
Buildings 12 01394 g004
Figure 5. Hierarchical clustering results of station based on standard deviation metric.
Buildings 12 01394 g005
Figure 6. The spatial distribution of aggregated metro stations regarding their thematic topic compositions.
Buildings 12 01394 g006
Figure 7. The spatial distribution of metro stations regarding their TOD indices.
Buildings 12 01394 g007
Figure 8. The spatial distribution of metro stations regarding Node, Place, and Design indices. (a): The spatial distribution of metro stations regarding the Node index. (b): The spatial distribution of metro stations regarding the Place index. (c): The spatial distribution of metro stations regarding the Design index.
Buildings 12 01394 g008aBuildings 12 01394 g008b
Figure 9. Hierarchical cluster analysis based on three dimensions.
Buildings 12 01394 g009
Figure 10. The spatial distribution of clustered metro stations regarding their TOD typologies.
Buildings 12 01394 g010
Table 2. Overview of TOD indicators.
DimensionIndicatorDescription/CalculationData Sources
NodeN1 Accessibility of the metro stationThe average betweenness centrality value of the lines connecting to the stationShanghai metro’s official website
N2 Reachable metro stations within 20 minThe number of metro stations that one station can reach within 20 minCalculated on Baidu Map
N3 Accessible bus station numberNumber of bus stops within the catchment areaPoIs from AutoNavi’s Map
N4 Metro frequencyTrain frequency during non-peak hours at the station on weekdaysShanghai metro’s official website
N5 Passenger flowThe passenger flow on July 18 (weekday) and July 20 (weekend), 2019 Shanghai Shentong Metro Group Co., Ltd.
PlaceP1 Density of PoIsThe Density of PoIs within the catchmentPoIs from AutoNavi’s Map
P2 Functional mixtureShannon entropy of various categories of PoIs within the catchment areaPoIs from AutoNavi’s Map
P3 Floor area ratio (FAR)The ratio of the gross floor area of buildings and the total buildable areaMap World (National Platform for Common Geospatial Information Services)
https://www.tianditu.gov.cn/ (accessed on 12 July 2022)
P4 Employment densityEmployment density within the catchmentThird Economic Census in 2013
P5 Population densityResident population density within the catchment area of the stationhttps://www.swguancha.com/ (accessed on 12 July 2022)
DesignD1 Distance to representative functionThe average walking distance from the nearest metro station exits to certain PoIs, which belonging to the station’s representative functions obtained from LDA modeling analysisCalculated on ArcGIS based on LDA results.
D2 Green public areaArea of green space within the catchment of the stationAoIs from the AutoNavi Map
D3 Density of pedestrian networkPedestrian road network density within the catchmentBaidu network
D4 Job-housing balanceThe absolute value of the difference between the ratio of standardized population density against employment density and 1https://www.swguancha.com/ (accessed on 12 July 2022)
D5 Accessibility of pedestrian networkAverage betweenness centrality value within the catchmentBaidu network
Table 3. Rader charts for each dimension by types.
Type 1Type 2
Buildings 12 01394 i001 Buildings 12 01394 i002
Type 3Type 4
Buildings 12 01394 i003 Buildings 12 01394 i004
Publisher’s Note: MDPI stays neutral with regard to jurisdictional claims in published maps and institutional affiliations.

