Article

Development of Self-Compacting Concrete Incorporating Rice Husk Ash with Waste Galvanized Copper Wire Fiber

by
Md. Habibur Rahman Sobuz
1,*,
Ayan Saha
1,
Jannatul Ferdous Anamika
1,
Moustafa Houda
2,*,
Marc Azab
2,
Abu Sayed Mohammad Akid
3 and
Md. Jewel Rana
1
1
Department of Building Engineering and Construction Management, Khulna University of Engineering and Technology, Khulna 9203, Bangladesh
2
College of Engineering and Technology, American University of the Middle East, Kuwait
3
Graduate Research Assistant, Civil Engineering, Arkansas State University, Jonesboro, AR 72467, USA
*
Authors to whom correspondence should be addressed.
Buildings 2022, 12(7), 1024; https://doi.org/10.3390/buildings12071024
Submission received: 1 June 2022 / Revised: 3 July 2022 / Accepted: 8 July 2022 / Published: 15 July 2022
(This article belongs to the Collection Sustainable Building Materials: Design and Digitization)

Abstract

:
This research work is devoted to the experimental investigation of both rheological and mechanical properties of self-compacting concrete (SCC) produced with waste galvanized copper wire fiber and rice husk ash (RHA). In the study, three different volume fractions of 0.5 p to 0.75 percent, 1 percent of scrap copper wire fiber as reinforcing material, and 2 percent RHA as cement replacement were used. To evaluate the fresh characteristics of SCC, the slump flow, J-ring, and V-funnel experiments were conducted for this investigation. Compressive strength, splitting tensile strength, and flexural strength of the concrete were conducted to assess the hardened properties. The test was carried out to compare each characteristic of plain SCC with this modified SCC mixture, containing RHA as pozzolanic materials and copper fiber as reinforcing material. Incorporating copper fiber in the SCC leads to a drop in fresh properties compared to plain SCC but remains within an acceptable range. On the other hand, the inclusion of 2% RHA makes the SCC more viscous. Although adding 2% RHA and 1% copper wire in SCC provide the highest strength, this mix has an unacceptable passing ability. The SCC mix prepared with 2% RHA and 0.75% copper fiber is suggested to be optimum in terms of the overall performance. According to this study, adding metallic fiber reinforcement like copper wire and mineral admixture like RHA can improve the mechanical properties of SCC up to a certain level.

1. Introduction

Self-compacting concrete (SCC) is unique from traditional concrete because it can be laid and compacted due to its own weight without causing any vibration or with minimal vibration. In addition, SCC has the tendency to segregate and bleed due to its enough cohesive nature. The most influential characteristics of SCC are good passing ability, high flowability, and high segregation resistance [1]. There are many advantages of utilizing SCC, such as the reduction of labor cost and time of construction, elimination of the requirement for vibration, noise pollution reduction, enhancing the filling capacity of narrow spacing of structural members, and obtaining good structural performance. A stabilizer (viscosity-changing admixture) was utilized to strengthen the segregation resistance of SCC in order to achieve the desired paste content [2]. Chemical admixtures, on the other hand, are costly, and their usage may raise the material cost. Labor cost savings may be enough to cover the higher admixture cost. Alternatively, the utilization of mineral additives like marble powder (MP), limestone powder, fly ash, natural pozzolan, slag, and rice husk ash (RHA) can reduce the cost of SCC [3]. Previous studies showed that incorporating RHA into the SCC mixture positively affected flowability and plastic viscosity, as well as significantly reduced bleeding [1,4].
Since 1938, scientists have known that rice husk ash contains silica [5]. RHA can provide similar benefits to silica fume in terms of better-hardened characteristics and concrete durability if treated and applied appropriately [6,7,8]. Rice husk accounts for about one-fifth of the total weight of dry rice [9]. Recent estimates have the annual global output of rice at roughly 742 million tons, whereas the amount of rice husk produced is approximately 148 million tons [10]. By utilizing RHA in concrete manufacturing, the environmental effect of this waste can be minimized. Utilizing RHA decreases the need for cement in the construction industry, reducing the cost of concrete production and reducing the pollution caused by CO2 emissions from cement factories.
The RHA content substantially impacted fresh concrete characteristics, reducing the SCC workability. According to Chopra and Siddique [11], the lowest workability was obtained by the mix containing 20% RHA as cement replacement. On another side, the slump flow for SCC by incorporating RHA content of 5% and 10% and content of superplasticizer 3.5–4.5%, was found within the EFNARC [12] range (650–800 mm); in contrast, the majority of the V funnel test values were less than 6 s [13], showing that the increase of RHA (10%) enhances the viscosity of SCC mix.
The pozzolanic and micro-filling effects of RHA on concrete’s microstructure and pore structure increased its hardened characteristics dramatically, resulting in a boost in compressive strength of up to 56 days [14]. RHA substitution in the matrix has a bigger impact on normal strength concrete compressive strength than SCC mixes [15]. Increases of roughly 25%, 33%, and 36% in 7, 28, and 56-day tensile strength were seen when RHA content was increased from the control mix to 15 percent cement replacement [13].
The fiber incorporation enhances the overall performance of non-structural and structural properties of concrete, such as ductility, more crack resistance, and toughness, tensile strength, fatigue, and abrasion resistance [16]. The presence of microcracks at the interface between mortar and aggregate is the source of plain concrete inherent weakness, which may be mitigated by adding fibers to the mix. Thus, several authors have already pointed out that incorporating fibers in concrete can dramatically enhance the toughness of high-strength concrete [17,18]. The fibers may be considered as aggregates with an extreme deviation in shape from the rounded smooth one. The fundamental benefit of incorporating fibers into self-compacting concrete is to get a more uniform distribution of fibers throughout structural elements [19,20,21]. Moreover, using fibers in SCC mixes helps eliminate low tensile strength problems, which is one of the most significant concrete disadvantages [22]. Hence, fiber-reinforced self-compacting concrete (FRSCC) is considered an improved building material that merges the advantages of the SCC with the toughness of fiber.
Steel fibers have been investigated in combination with SCC and have shown to be feasible [23,24]. The increase in the fiber content adversely affected the results of fresh concrete tests, e.g., flow time T50 and J-ring flow diameter. The flow characteristics of the slump flow test results were reduced correspondingly with the increment of the RSF (recycled steel fiber) content [25]. If RSF is present, this behavior could be explained by an increase in internal friction between the aggregate particles and fibers, according to El-Dieb and Taha [26]. Another study revealed that the workability of SCC decreased slightly after adding fibers. The main factor influencing the workability and flowability is the shape of long fibers rather than their strength [27]. On the other hand, the RSF material increased the V-funnel time over time. The increase in internal friction between RSF and aggregate particles, which results in high viscosity, is the primary cause of the V-funnel phenomenon [16].
Steel fibers can increase the mechanical and ductility characteristics of SCC in the same way as vibrated concrete [28]. To improve the compressive strength of SCC mixes, steel fiber can be incorporated. Even while the modulus of elasticity and compressive strength enhanced with age, these properties became less impressive when the quantity of steel fibers in the material increased from 30 kg/m3 to 45 kg/m3 [29]. In the same context, it was noted that straight and small size steel fibers are more effective for raising the compressive strength, whereas long fibers with hooked ends are more useful for increasing the splitting tensile strength of SCC [30]. All mixes of SCC with steel fiber have a higher flexural strength than plain SCC, regardless of the fiber quantity. According to the results, concrete’s tensile strength increases significantly as fiber content increases [31]. In addition, the increase in entrapped air voids, considered a concrete defect, could increase the porosity of concrete if RSF is used [25].
Although many researchers developed the SCC incorporating RHA, limited studies have been performed in producing the SCC with both RHA and a reinforcing material, such as waste galvanized copper wire fiber. As previously mentioned, self-compacting concrete (SCC) has a high production cost due to the use of chemical admixtures, such as viscosity modifiers, SPs, and high cement content. For these reasons, it is worth looking into other substitution materials that perform similarly. Rice husk ash, which is high in silica, can be a cheap solution for the necessity of high cement content and chemical additives for SCC preparation. The use of steel fiber is becoming popular worldwide for improving the mechanical properties of concrete especially tensile strength, but it is a little bit expensive from the perspective of many economically developing nations. The production of self-compacting concrete using waste copper wire fiber has not drawn enough attention in the past. RHA and waste copper wire is cheap as they are waste material in respective fields. Adding metallic fiber reinforcement like copper wire and mineral admixture like RHA to the concrete can modify the fresh and mechanical properties of SCC. Large-scale investigation is missing in the literature to jointly assess the rheological and mechanical properties of SCC with RHA and copper wire fiber. Thus, waste copper wire has been used as SCC reinforcement and RHA as a binder material to replace OPC in this research work. These waste materials can be a promising solution and alternative to steel fiber and cement, respectively. This self-compacting concrete is economical and sustainable for constructing structures in developing countries. The study aimed to investigate the effects of SCC incorporating rice husk ash with waste galvanized copper wire by ignoring more costly mineral additives and steel fibers. This study aims to investigate the fresh properties of SCC like flowability, passing ability, and viscosity by conducting slump flow, J-ring and V-funnel test. In contrast, the mechanical properties of SCC are evaluated by some strength tests, e.g., compressive strength, tensile and flexural strength test. In addition, the comparison of modified SCC with the control mix and statistical regression analysis are determined based on the results of strength tests of SCC with ACI codes of practice.

2. Materials and Methods
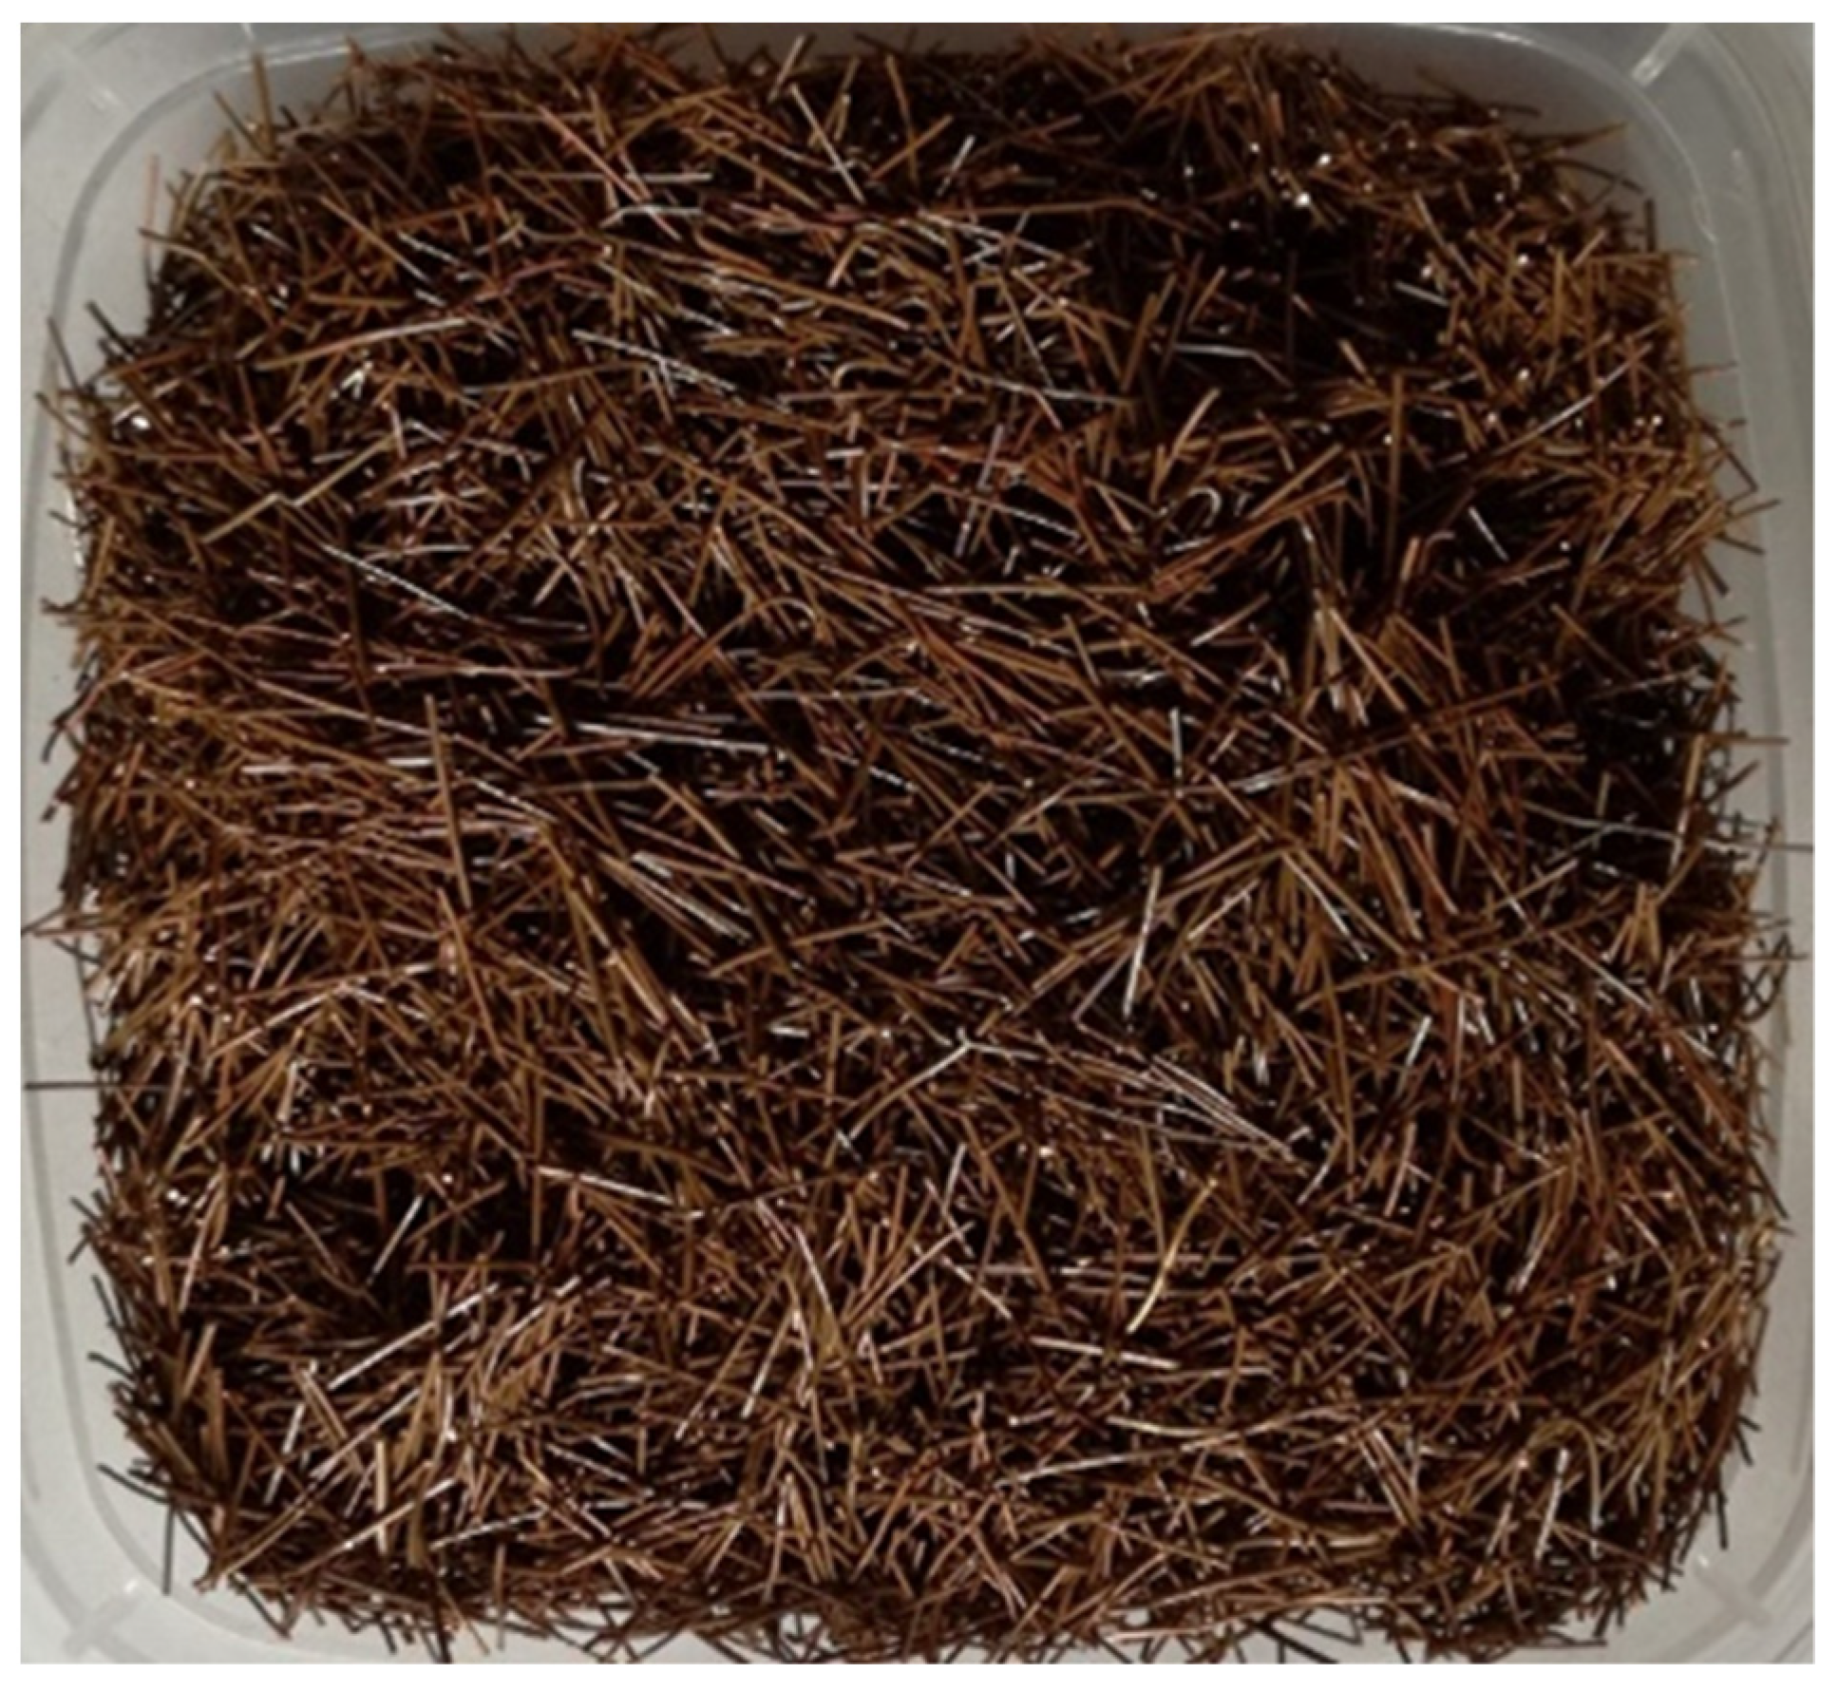
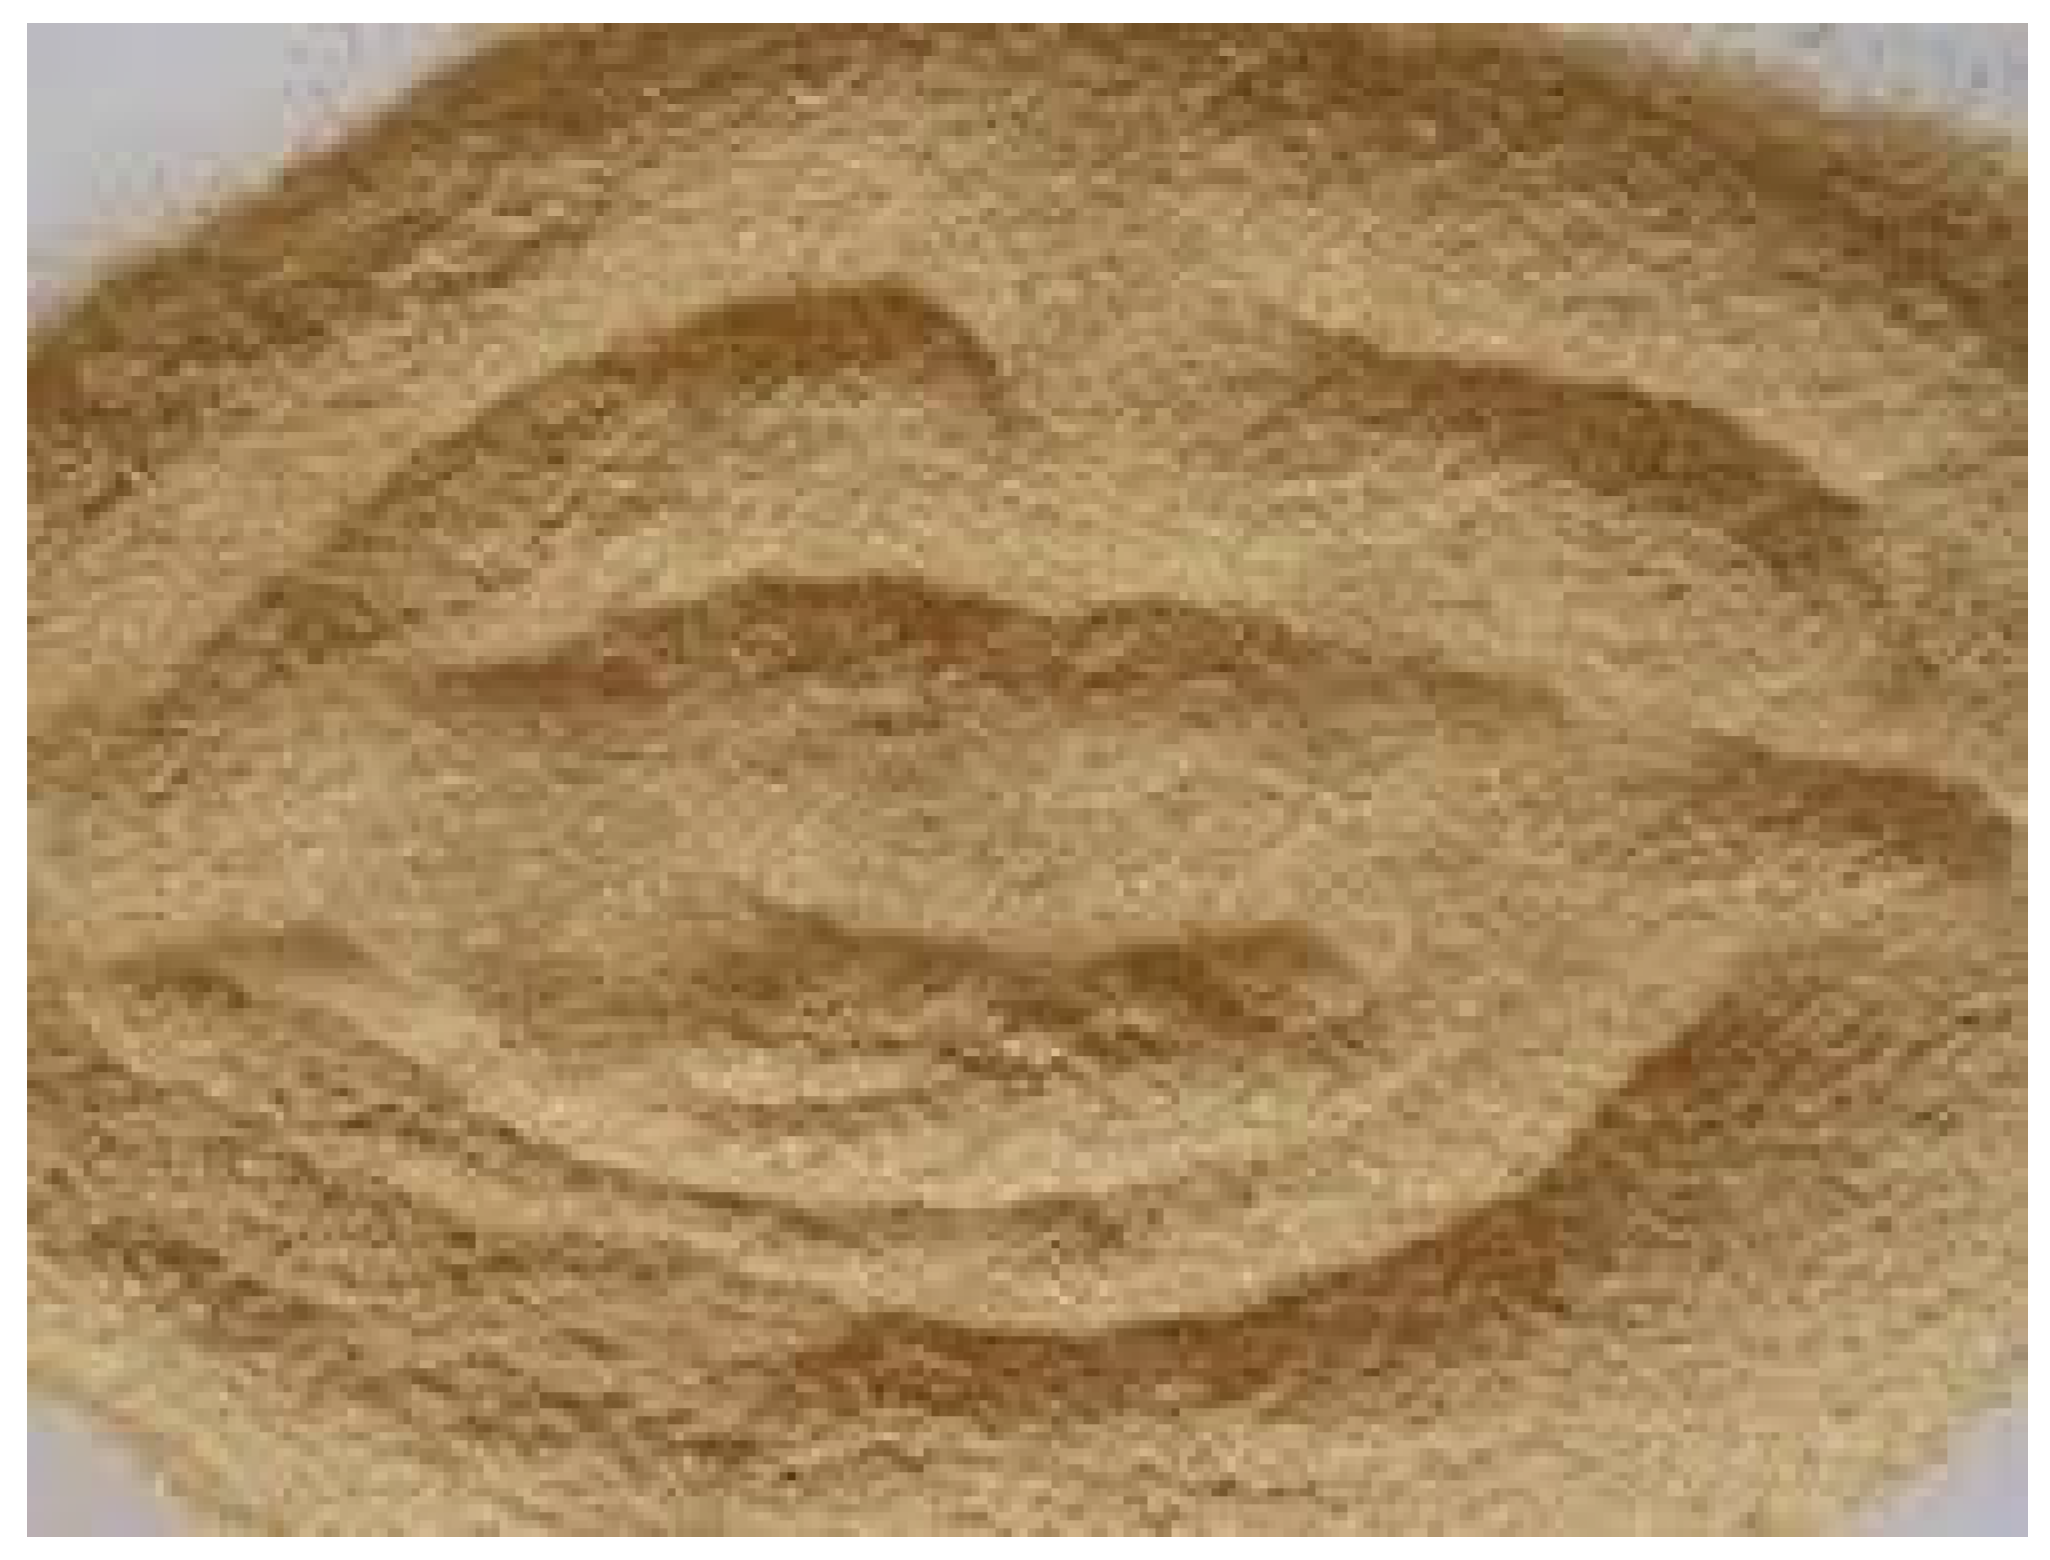
2.1. Materials

Ordinary Portland cement (OPC), natural coarse aggregate, fly ash river sand, waste copper wire, rice husk ash (RHA), super plasticizer, and potable water were used to prepare the concrete samples. This experimental study has utilized the chemical composition of OPC, as described in Table 1. Fly ash of the class F variety was obtained from the nearby port. The chemical properties of the utilized Class F fly ash are also presented in Table 1. The coarse aggregate employed in this investigation was stone chips, ranging in size from 4.75 mm to 25 mm. This research used locally sourced river-washed sand with a fineness modulus of 2.98 and a maximum particle size of 4.75 mm as fine aggregate. Table 2 shows the physical characteristics of coarse and fine aggregates based on a number of tests. Figure 1 represents the sieve analysis test data and the grading curve of fine and coarse aggregates.
Waste galvanized copper wire fiber contents of 0%, 0.5%, 0.75%, and 1% of concrete weight were used, as depicted in Figure 2. The physical characteristics of waste galvanized copper wire fiber are shown in Table 3. This wire fiber was collected from BRB Cable Industries Ltd. Khulna, Bangladesh.
Rice husk was gathered from a local seller of Teligati, Khulna, Bangladesh, as shown in Figure 3. The rice husk ash is produced by carefully selecting, drying, burning, wet grinding, and sieving rice husk. In this experiment, RHA samples were produced by burning rice husk at 700° Celsius for 6 h and wet-grinding for about 80 min using the same preparation method followed by Della et al. [32]. This preparation method reduced particle size and obtained grey color due to the lower carbon amount. Table 1 and Table 4 detail the rice husk ash physical and chemical properties. In this experiment, a substance called a superplasticizer was employed, which is also known as a high-range water reducer.

2.2. Mix Proportion

Cement, fine aggregate, and coarse aggregate were mixed in a typical volumetric mix ratio of 1:2:2.25 for the concrete. The ratio of cement to fly ash was 1:0.25. With the use of super plasticizer, the water–binder ratio of 0.32 was chosen, increasing workability and keeping constant for all concrete mixes. The concrete sample was developed by mixing all the raw materials within their calculated proportion using the mixing machine in the structural and materials laboratory of the BECM department, KUET, Khulna, Bangladesh. There were four separate batches of concrete mix created for the research purposes. M0 denotes the control batch without any RHA and copper fiber. Another three mixes were produced by adding copper fibers in three percentages: 0.5%, 0.75%, and 1% of the concrete weight. These mixes were noted by M0.5, M0.75, and M1, respectively. In these later three mixes, 2% RHA was added as a replacement for OPC. Table 5 details the materials proportion of each concrete mixture.

2.3. Specimens Preparation and Curing

Total specimens preparation included 42 number 100 mm in diameter by 200 mm in height cylinders for compressive strength [33] and splitting tensile strength [34], and 24 number prisms of 100 × 100 × 500 mm for flexural strength tests [35] were prepared. After finishing the fresh testes, molds were filled with concrete a single time without any temping. A water curing period of 7 and 28 days followed. The room temperature was 28 °C with a relative humidity of 82%.

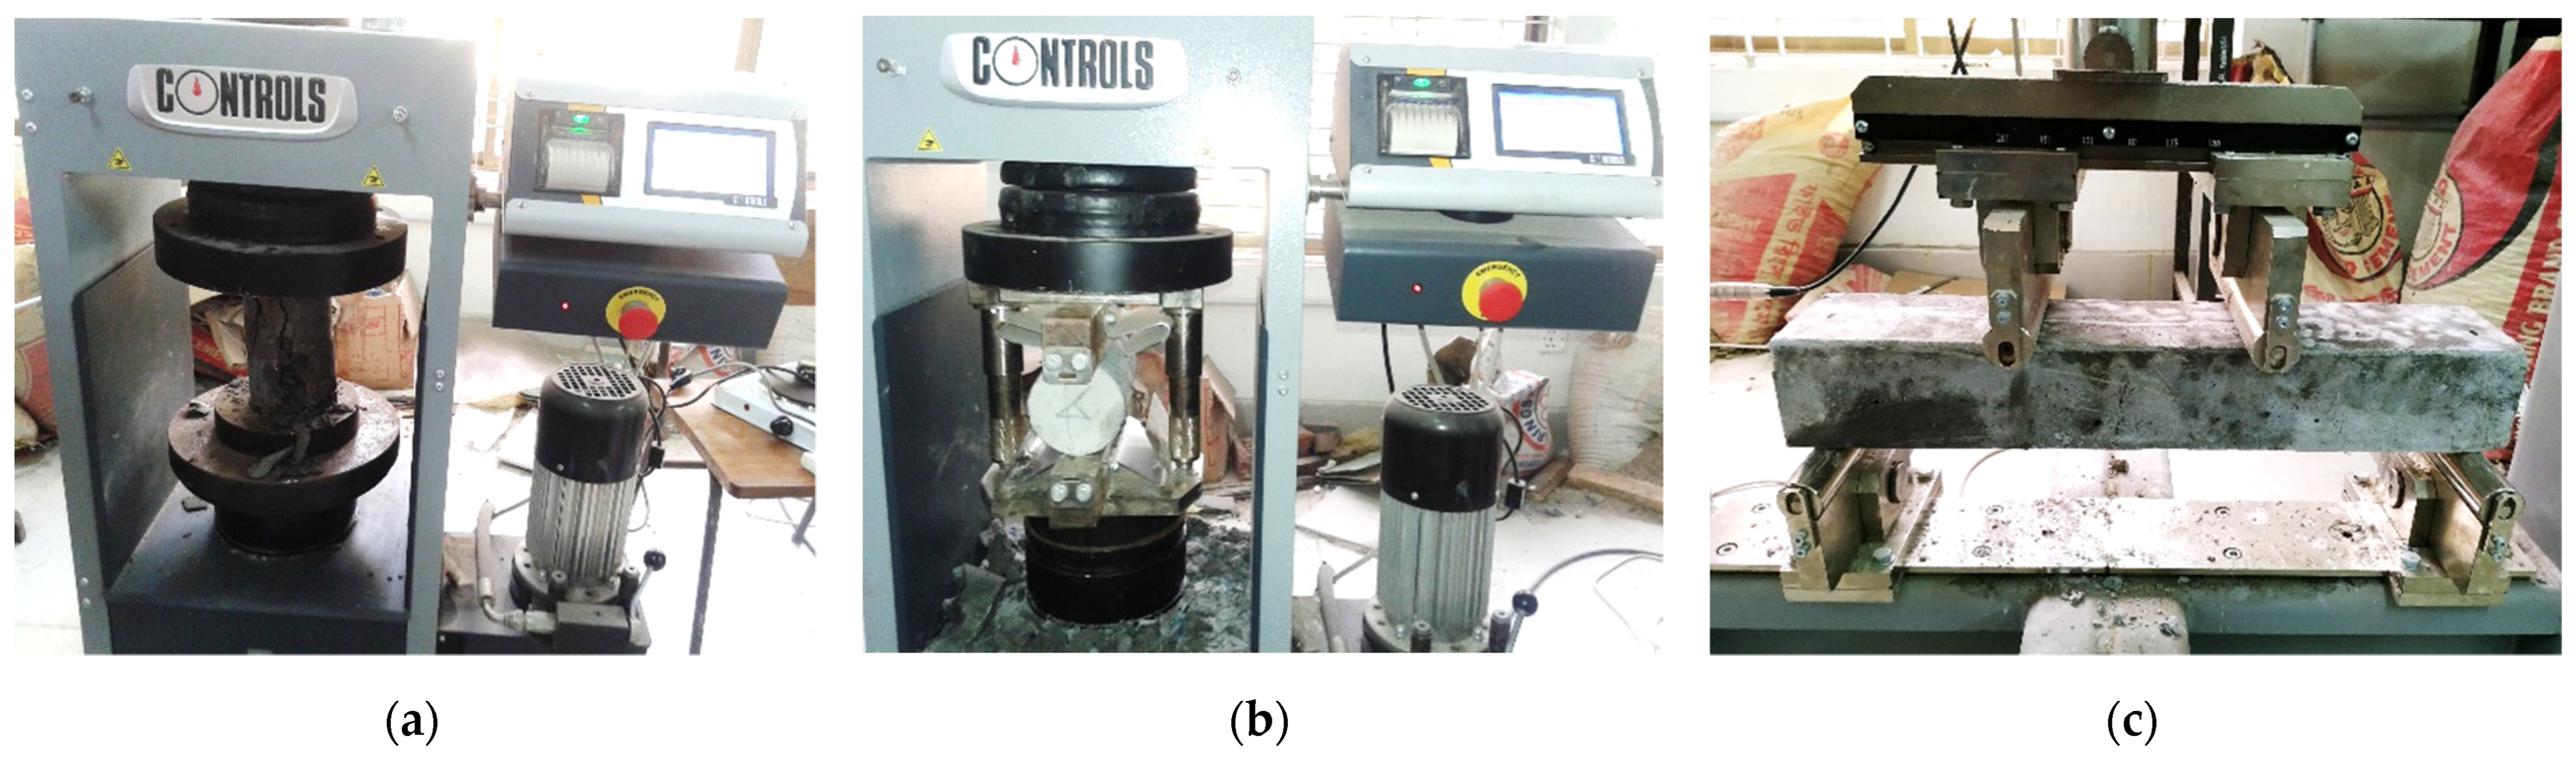
2.4. Test Setup and Instrumentation

In this experimental study, the fresh concrete test was conducted by the slump flow, J-ring flow and V-funnel tests. Compressive, flexural, and splitting tensile tests were performed to determine the hardened characteristics of SCC. All these fresh and hardened tests were performed on the structural and materials laboratory of the BECM Department, KUET, Khulna, Bangladesh.

2.4.1. Slump Flow Test

The slump flow test evaluated the deformability properties of SCC without obstacles, as illustrated in Figure 4a. The British standard BS EN 12350-Part 8 was utilized to test the slump flow [36]. A stopwatch was used to record the required time to reach the concrete 500 mm circle and denoted as T50. When the mix completely stopped flowing, the largest diameter of flow was measured nearest to the 10 mm (d1) and right angle (d2).

2.4.2. J-Ring Flow Test

The J-ring test was evaluated to check both the flowability and passing ability of SCC. As specified by BS EN 12350-Part 8, the J-ring flow test was conducted [36] in this research work and is shown in Figure 4b. Additional blocking index BJ can be obtained from J-ring flow test in association with the previous slump cone test parameters. There were no major differences between this test and the slump flow test, except that a J-ring was placed around the cone instead of the cone itself. When the SCC stops spreading, a straight rod and the concrete surface are measured at a center point (∆h0) and at four other locations on its perimeter. Next, the blocking index was calculated. This blocking index is a representation of the SCC mixes’ passing ability phenomenon.

2.4.3. V-Funnel Test

To measure the fluidity and segregation resistance of SCC, V-Funnel test was performed in this study. It was conducted by following the standard procedures of BS EN 12350-Part 9 [37]. A precise stopwatch was operated to record the time the concrete took to flow from opening the funnel gate until the container was visible through the funnel. This V-funnel time “Tv” expressed the viscosity of the SSC mixes. The graphical presentation of V-funnel test is in Figure 4c.

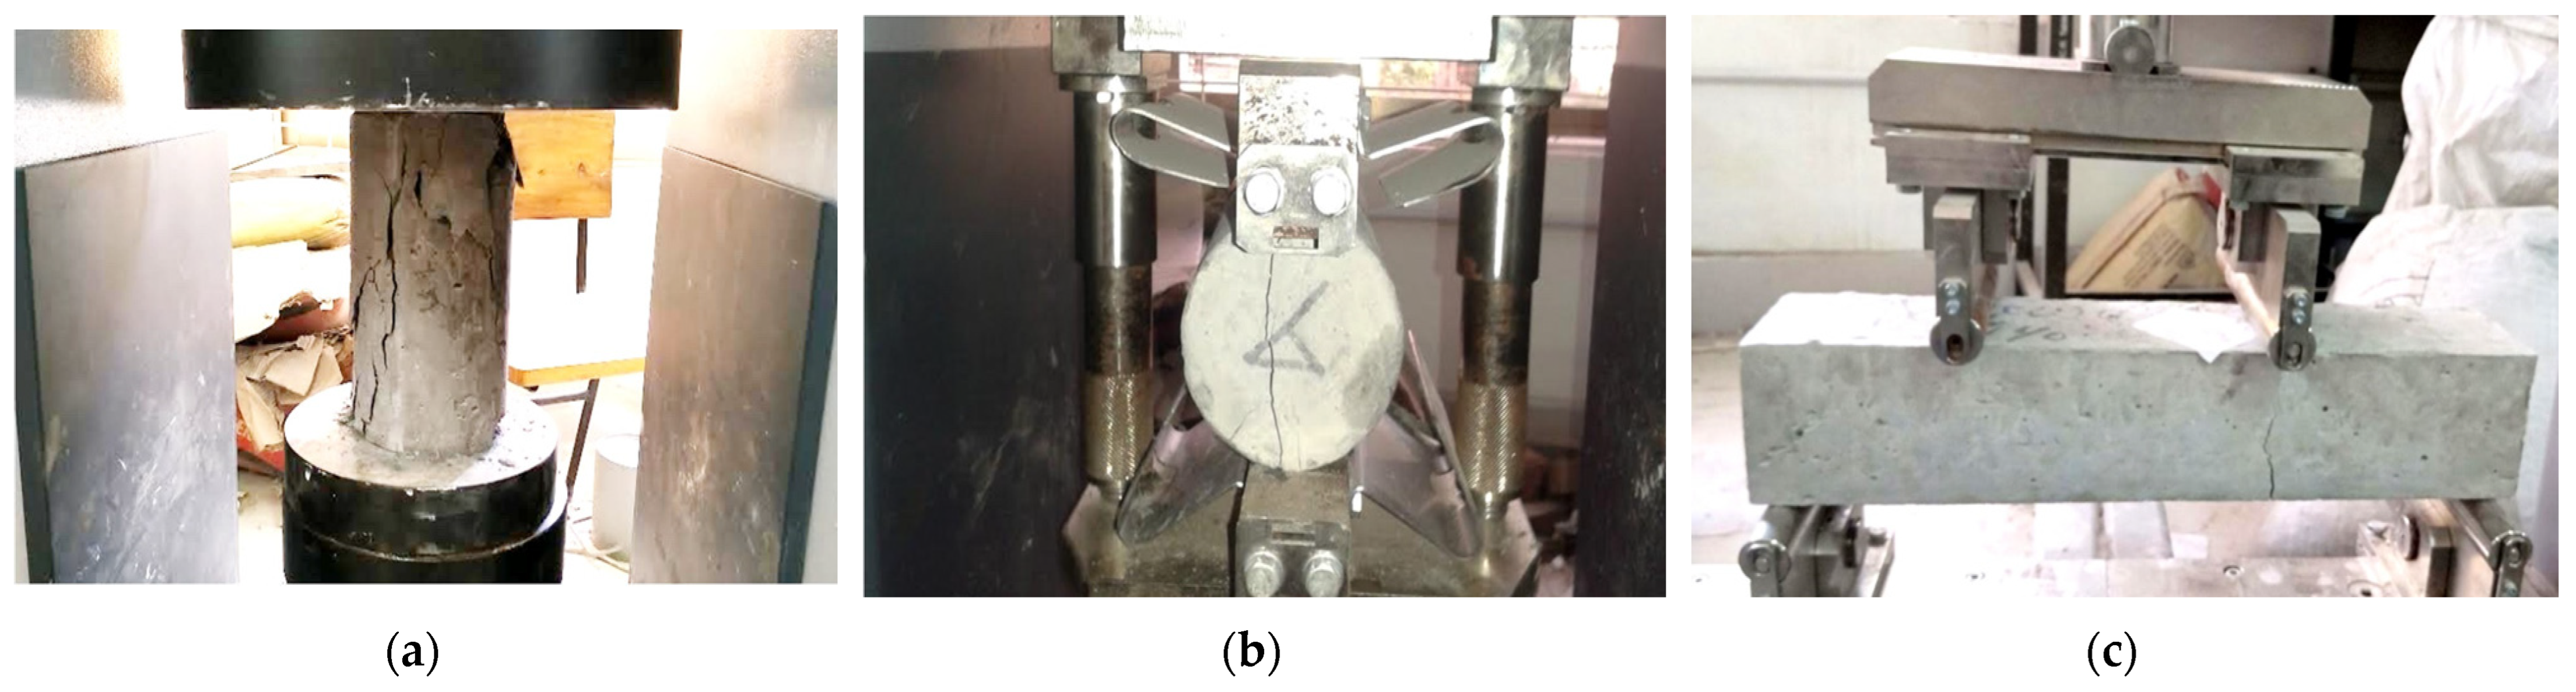
2.4.4. Compressive Strength Test

Compressive strength test of concrete was performed on the cylindrical specimens, followed by ASTM C39/C39M-18 [33]. A compression testing machine was used to provide load rates from 0.15 to 0.35 MPa/s and is displayed in Figure 5a. After properly placing the cylindrical specimens, a compressive axial load was applied to the specimens with a constant rate of 0.2 MPa/s until failure. This ultimate maximum load was noted and utilized to determine the compressive strength.

2.4.5. Splitting Tensile Strength Test

Splitting tensile strength test was conducted on the concrete cylinder followed by ASTM C496/C496M–17 [34]. The specimen was placed between two plywood strips. The test setup is portrayed in Figure 5b. A steady load of 0.7 to 1.4 MPa/min was applied without shock throughout the length of the cylindrical concrete specimen until the force indicator showed that the load was progressively decreasing and the specimen had a well-defined fracture pattern. The maximum load and strength carried by the specimen were recorded, and the fracture pattern was observed.

2.4.6. Flexural Strength Test

Flexural (modulus of rupture) strength was determined by following the standard test procedures ASTM C78/ C78M-18 [35]. The bottom support of the beam was placed 25 mm far from both edges, and the distance between the loading and support was 150 mm, which can be observed as the sample test setup presented in Figure 5c. The load was applied to the specimen continuously at a constant loading rate of 0.86 to 1.21 MPa/min without any sudden shock until the failure point. The prism fracture pattern and the highest load handled by the prism during the test were reported.

3. Results and Discussion

3.1. Fresh Properties

Three rheological parameters were tested to investigate the passing ability, filling ability, and viscosity in this investigation. Table 6 represents the test results of fresh properties of various SCC mixes.

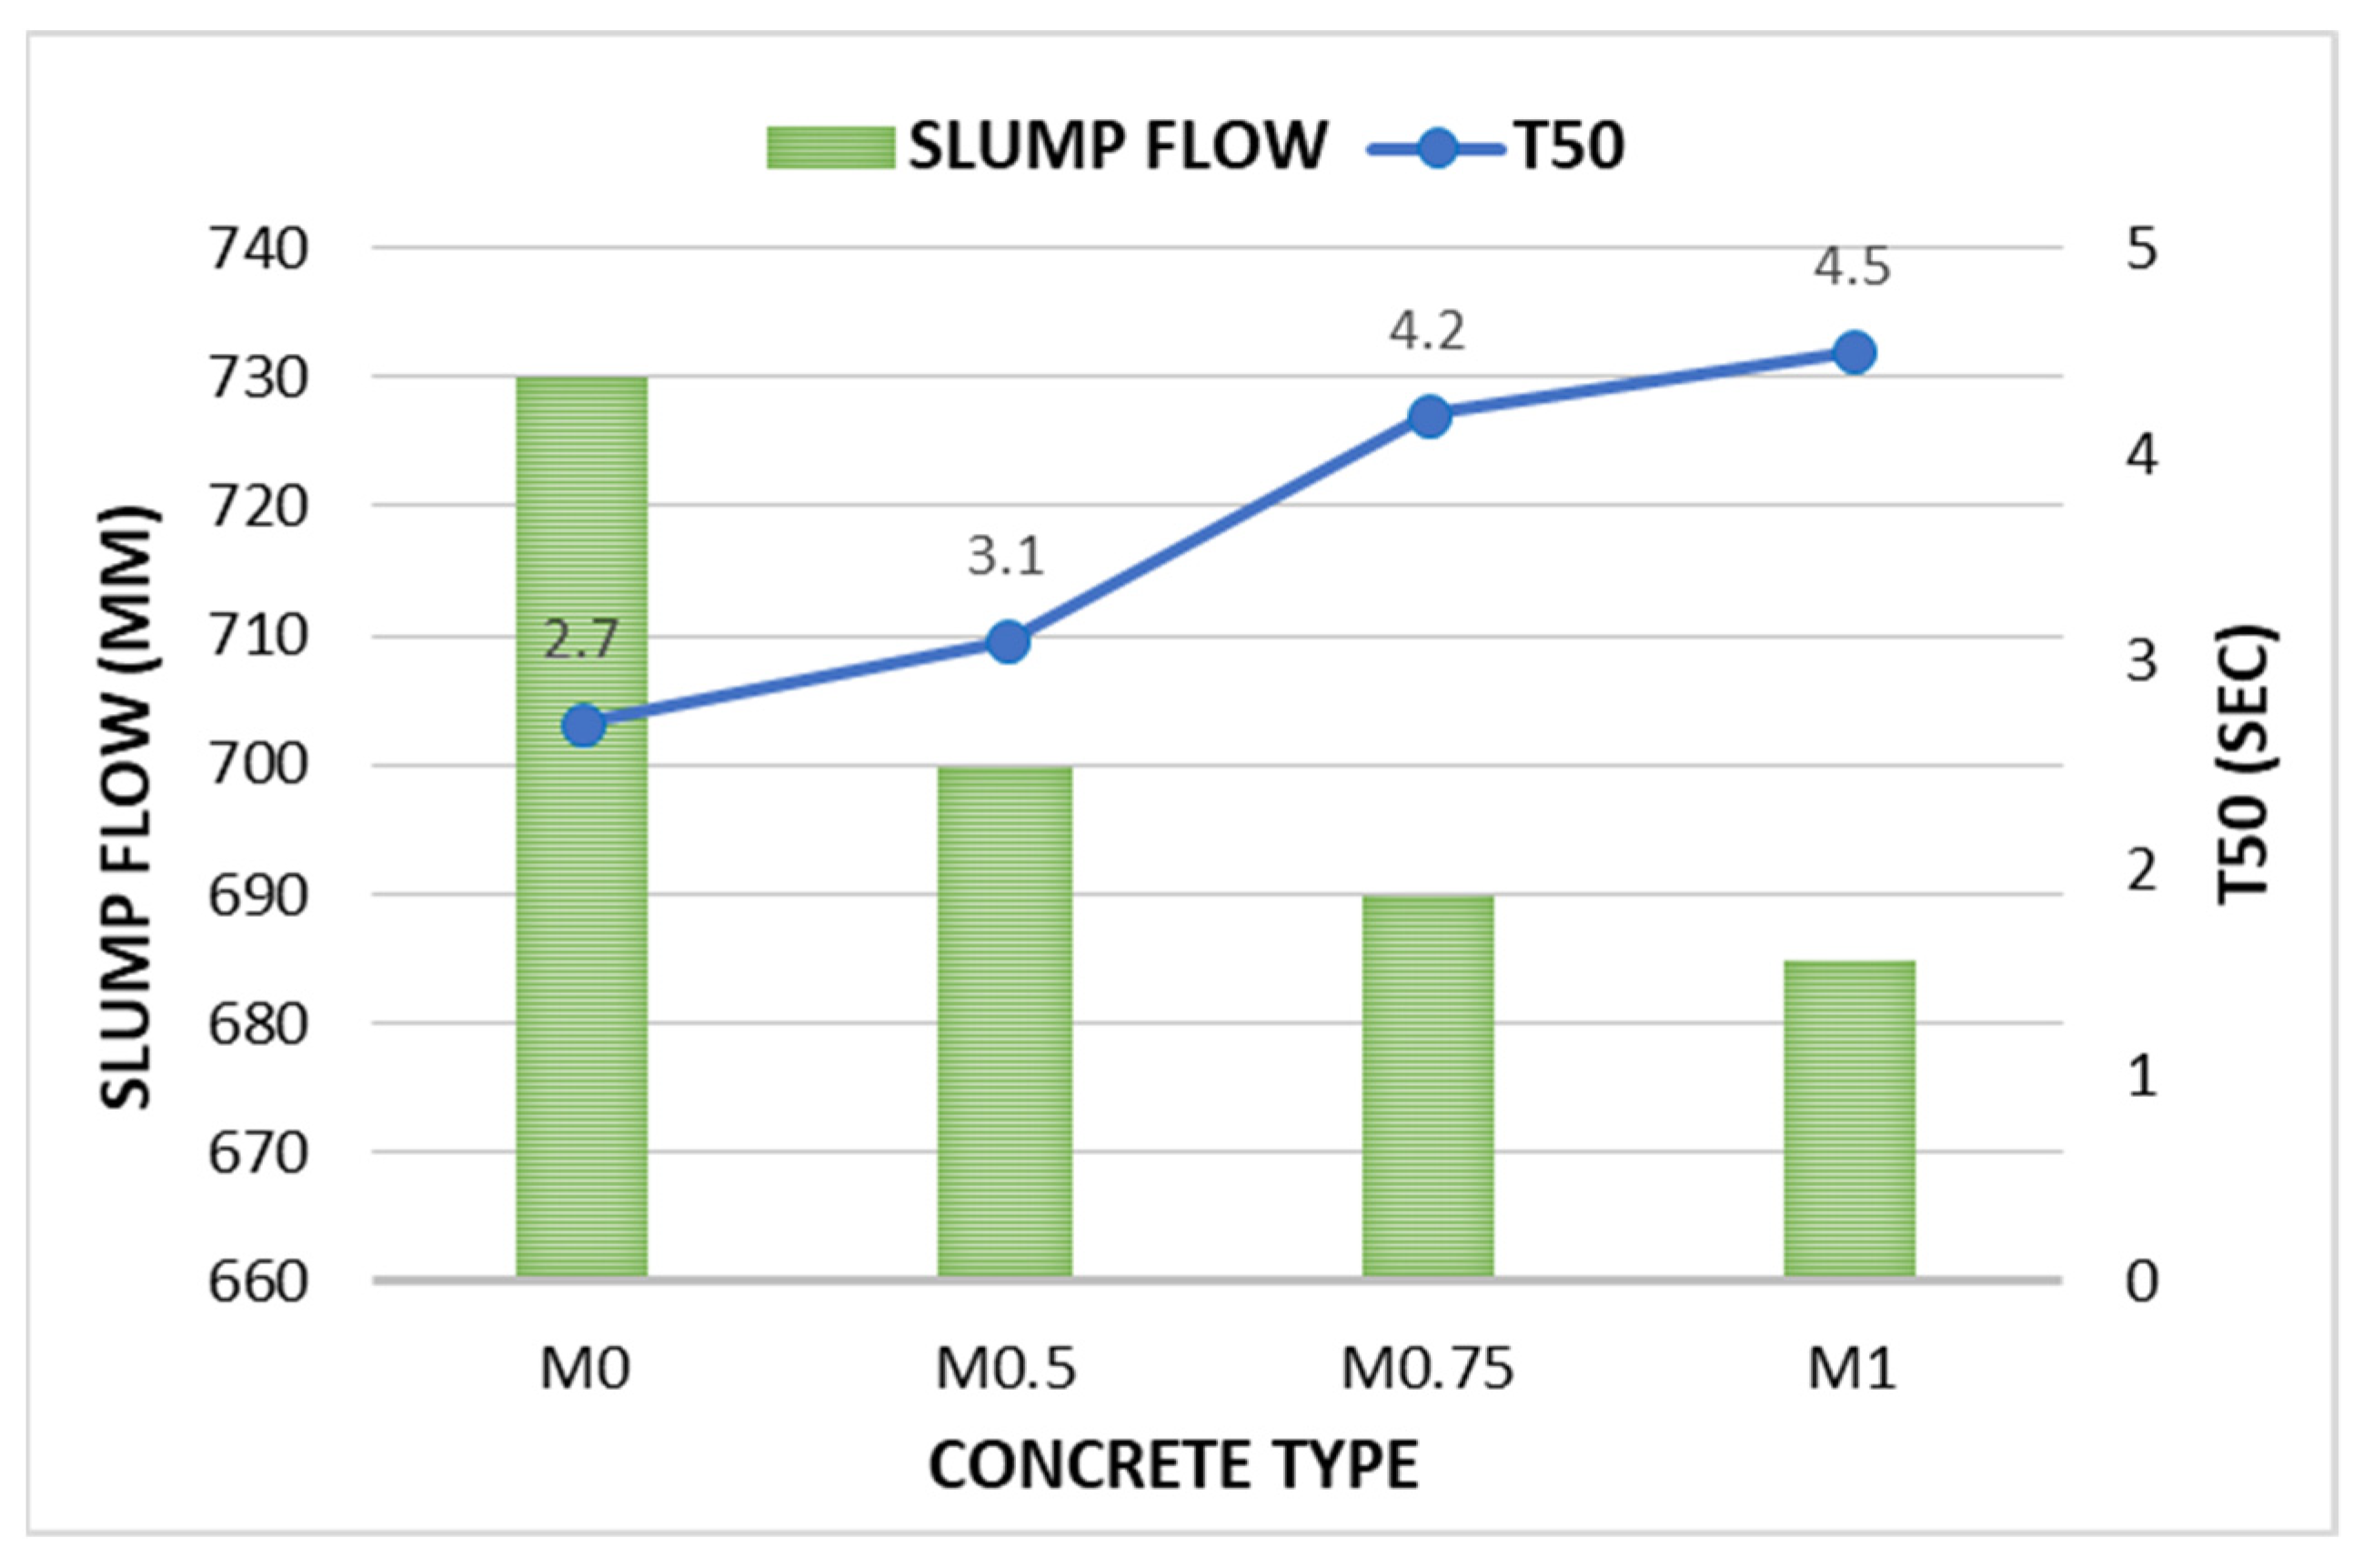
3.1.1. Effect on Cone Slump Flow

The results of the cone slump flow exhibited that the flow characteristics decrease proportionally with the increment of waste copper wire content, as represented in Figure 6. The control mix displayed the maximum value of flow: 730 mm. The mix M1 with additional 1% waste copper wire displayed the minimum flow value of 685 mm. This indicates the decreasing workability with changes in concrete composition, but the flow is within the acceptable limit of 650–800 mm [12]. Previous researchers have discovered a similar loss in workability properties with steel fibers [11,15,24,38,39,40]. According to the results of the slump flow test, the incorporation of RHA into SCC led to a reduction in the workability. This is because when the OPC is partially replaced by RHA, the surface area and volume fraction of the binder increase. Because of the increased surface area, the water absorption increased [14,41,42]. More superplasticizer was used to obtain acceptable workability. Slump flow value decreases approximately 4%, 5%, and 6% from the control mix as the copper wire added 0.5%, 0.75%, and 1%, respectively. These percentage changes in slump values are illustrated in Figure 8.
On another side, the required time for the slump for reaching the 500 mm diameter “T50” increases with the increase of the RHA and waste copper wire added. These consequences of the cone test are illustrated in Figure 6. The value of the flow time will generally display the opposite result of slum flow because as the workability of concrete decreases it will take more time to flow. The “T50” flow time was obtained between 2.7 s to 4.5 s from 0% to 1% of fiber addition, which satisfies the EFNARC [12] range of 2–5 s. A similar observation was found by Raisi et al. [42], and their findings concluded that the “T50” time was between 2.3 and 5.2 s for varying content of RHA. The percentage change in flow time “T50” is also illustrated in Figure 10, which represents an increment of the flow time of about 15%, 56%, and 67%, respectively, for mix M0.5, M0.75, and M1 from control mix M0. Akcay and Tasdemir [27] also discovered that time of flow has risen with increasing fiber volume. They also highlighted that adding 0.75% fibers had no noticeable effect on the “T50” values of the reference SCC, while adding 1.5% significantly raised the “T50” values. According to our observations, the SCC flow rate decreased as the fiber content increased.

3.1.2. Effect on J-Ring Flow

It is found that the J-ring slump values a decreasing tendency similar to the cone test with the incorporation of waste copper wire. The reduction in J-ring flow indicates the low filling ability, low passing ability, and high viscosity. These results of J-ring flow for different SCC mixes are presented in Figure 7. The mix obtained the lowest J-ring slump value, e.g., 580 mm with RHA and 1% copper fiber, and the maximum from the mix without RHA and copper fiber e.g., 650 mm. Mix M1 have shown a lower passing ability than the standard value. This occurred due to the absorptive properties of RHA, which makes the SCC more viscous, and the copper wire length obstructed the mix’s flow and pass via the ring. The percentage changes in J-ring flow value compared to the control mix M0 are represented in Figure 8. The J-ring flow value decreased approximately 5%, 8%, and 11% for the addition of 0.5%, 0.75%, and 1% waste copper wire, respectively. The J-ring flow value was also found to be decreased with fiber addition by Ackay and Tasdemir [27], who found that the geometry of fibers, rather than their strength, has the greatest influence on flowability. Their observation also noted that, in alignment with the results of this study, the J-ring flow radius for each concrete mix obtained a lower flow radius from the slump flow test (see Table 6).
Another term that represents the passing ability of the SCC mixes is blocking index “BJ”, which is also calculated from J-ring test parameters. This property is interpreted oppositely to the J-ring flow value, as the greater the “BJ” value, the lesser the passing ability. Figure 7 shows the blocking index “BJ” for different SCC mixes. It was found that the maximum index, e.g., 12 obtained for the mix M1 and the lowest index, e.g., 7.25, for the mix M0. SCC mix with RHA and 1% copper fiber obtained a blocking index value beyond the standard. Hence, the passing ability of the SCC mixes decreases as the blocking index “BJ” value increases, but the SCC mixes except M1 are able to gain acceptable passing ability according to EFNARC [12]. In brief, the results of these tests show a decrease in filling ability and passing ability of the SCC with the increase in the copper fiber content.

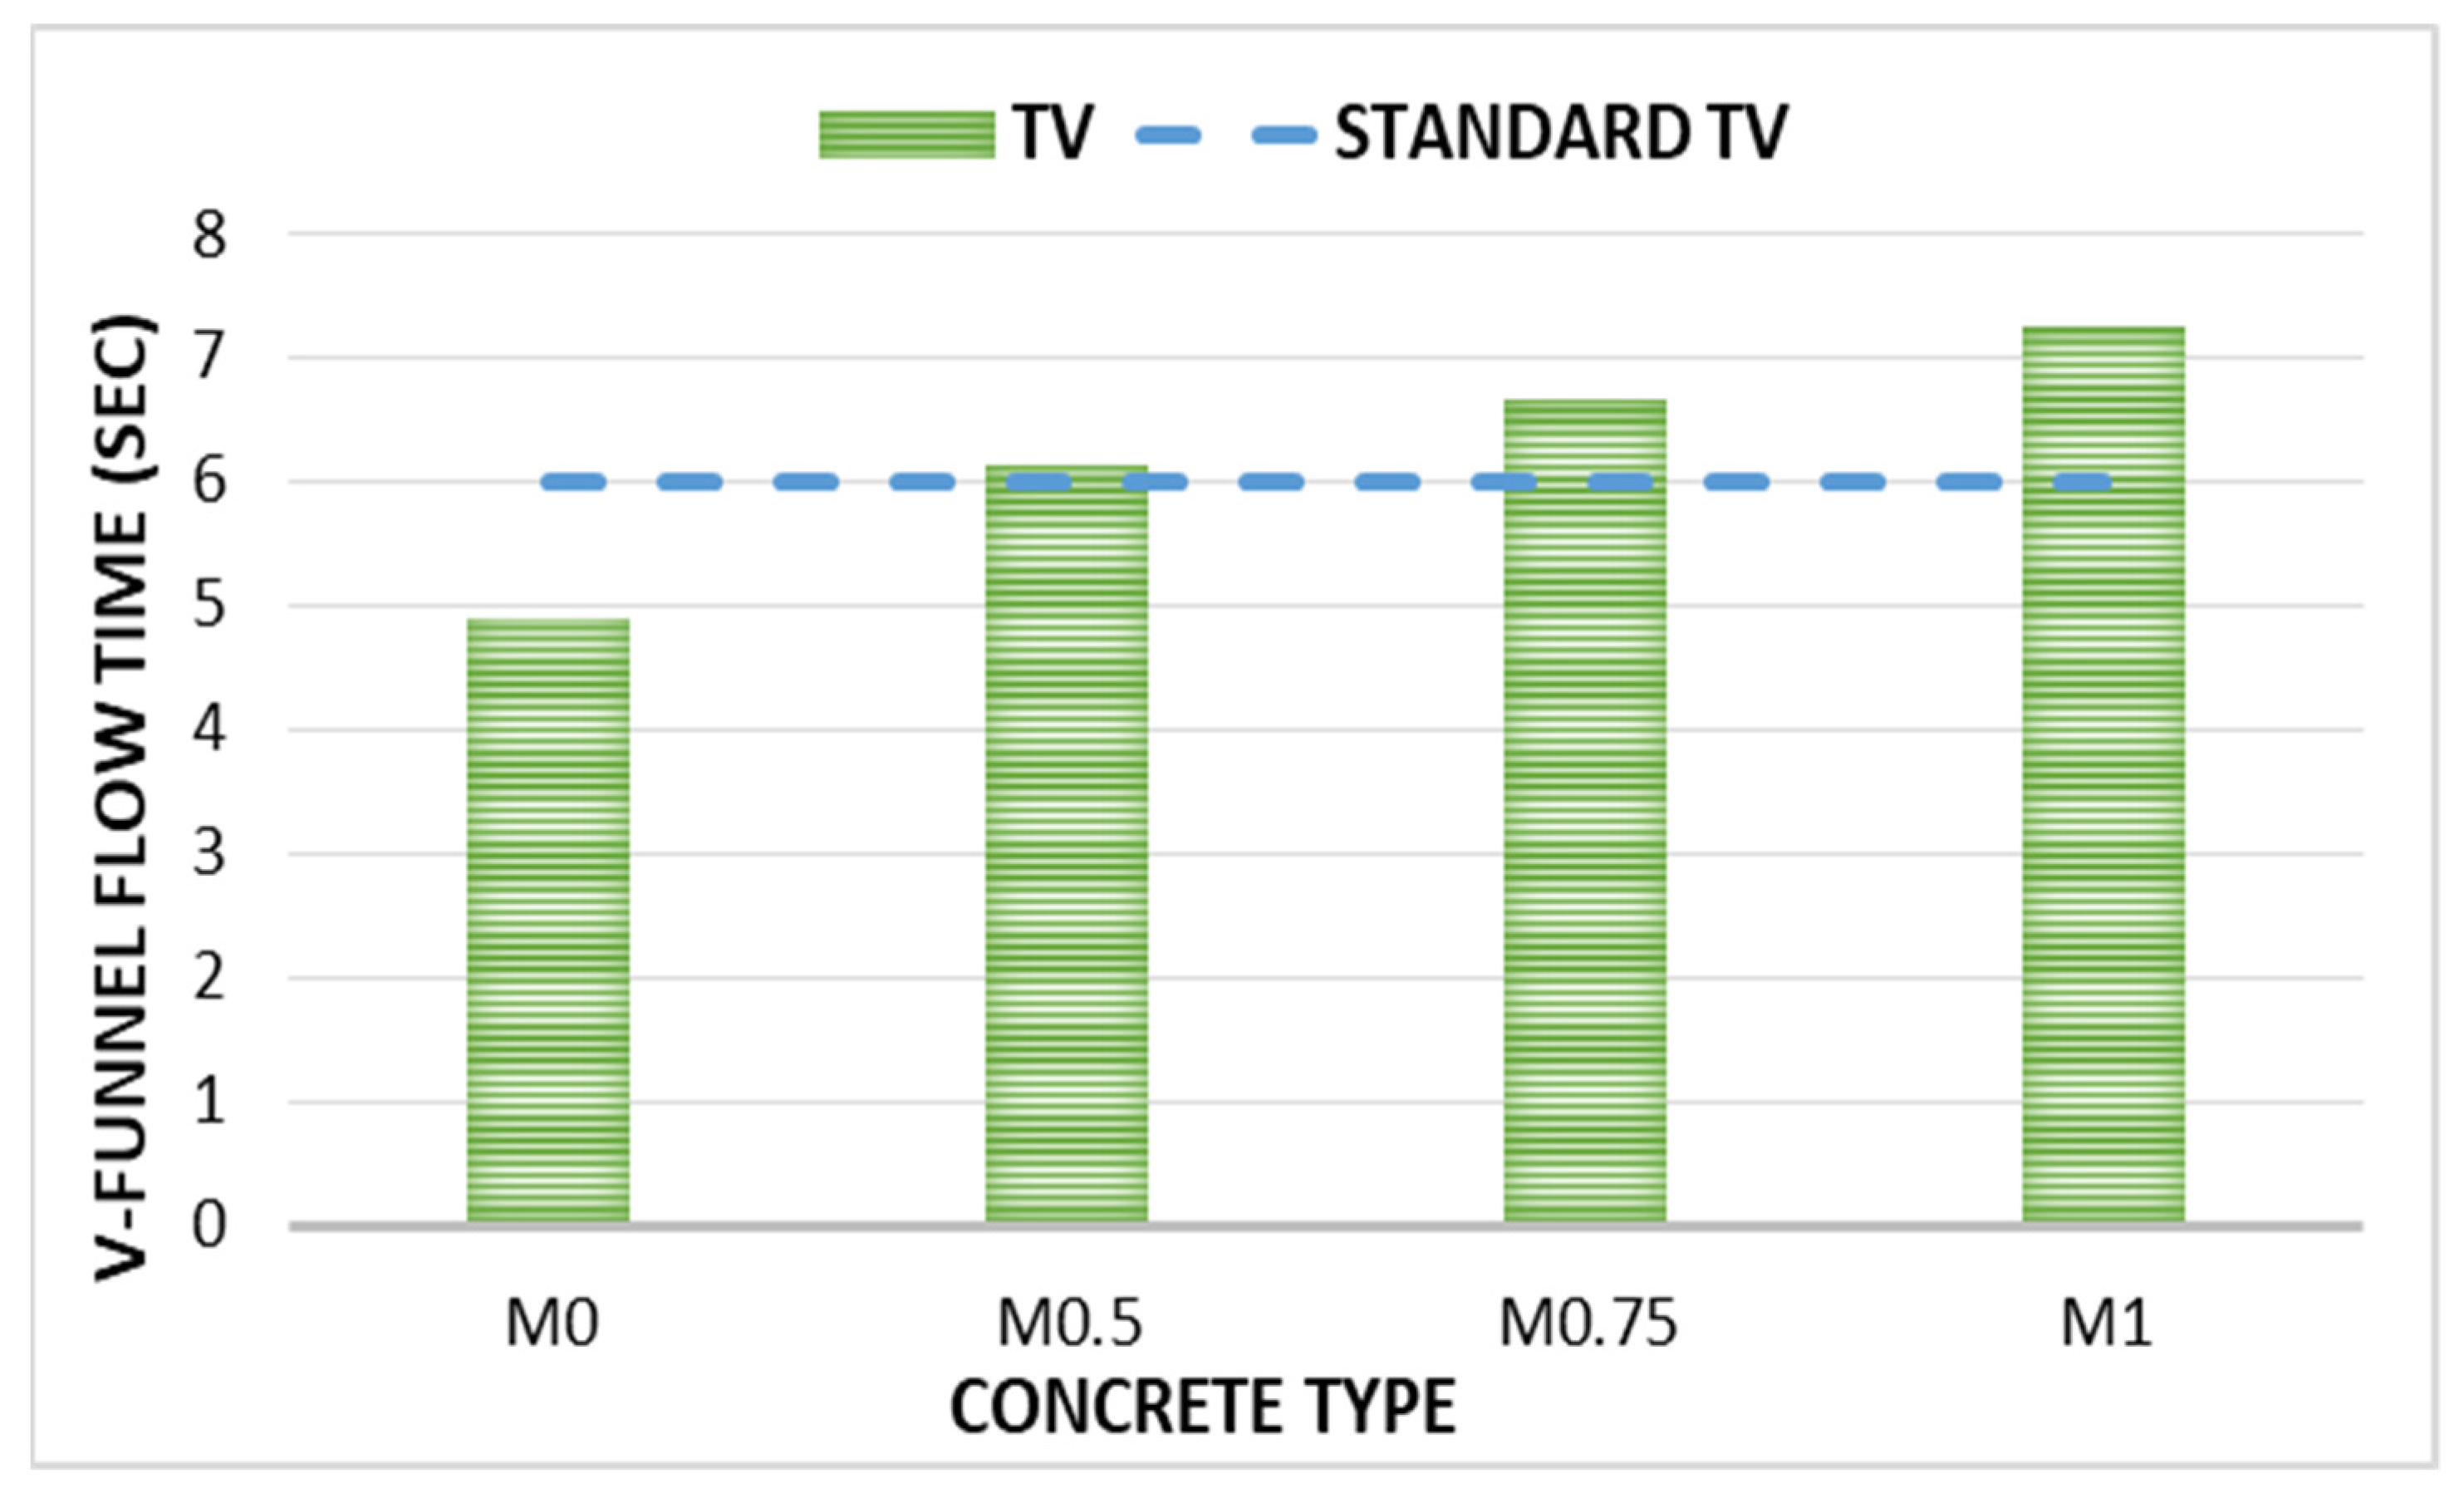
3.1.3. Effect on V-Funnel Flow

It was found that with the increase of waste copper wire content, the flow time of V-funnel, “Tv”, tends to increase. As previously indicated, this could be due to increased internal friction between aggregate particles and copper wire, resulting in high viscosity and prolonged flow durations via the V-funnel. In addition, the RHA turns the SCC mix more viscous due to the absorptive properties. Copper fibers raise the “Tv” of V-funnel flow by preventing the aggregate particle from moving freely. Therefore, the maximum V-funnel flow time, e.g., 7.25 s obtained by the SCC mix M1 with RHA and 1% of copper fiber. The other mixes with RHA and 0.5% and 0.75% fiber obtained a “Tv” of 6.12 s and 6.65 s, respectively. This result is quite similar to the experimental outcomes by other researchers [27,40,43], who found that V-funnel flow times increase as the RHA and steel fiber are incorporated. According to them, EFNARC’s specifications for fresh properties, including V-funnel flow duration and slump flow diameter, have been reached. [12]. We expected the control mix and other concrete mixes to obtain satisfactory viscosity prescribed for SCC by EFNARC [12]. A standard limit of EFNARC [12] for different SCC mixtures is depicted in Figure 9. The value of “Tv” increased by about 25%, 36%, and 48% for the addition of 0.5%, 0.75%, and 1% of waste copper wire compared to the control mix (see Figure 10). This behavior is quite similar to the observation by Akcay and Tasdemir [27], who reported that at low fiber content, the V-funnel time did not change, but the addition of 1.5% fibers dramatically enhanced the flow time.

3.2. Hardened Concrete Test

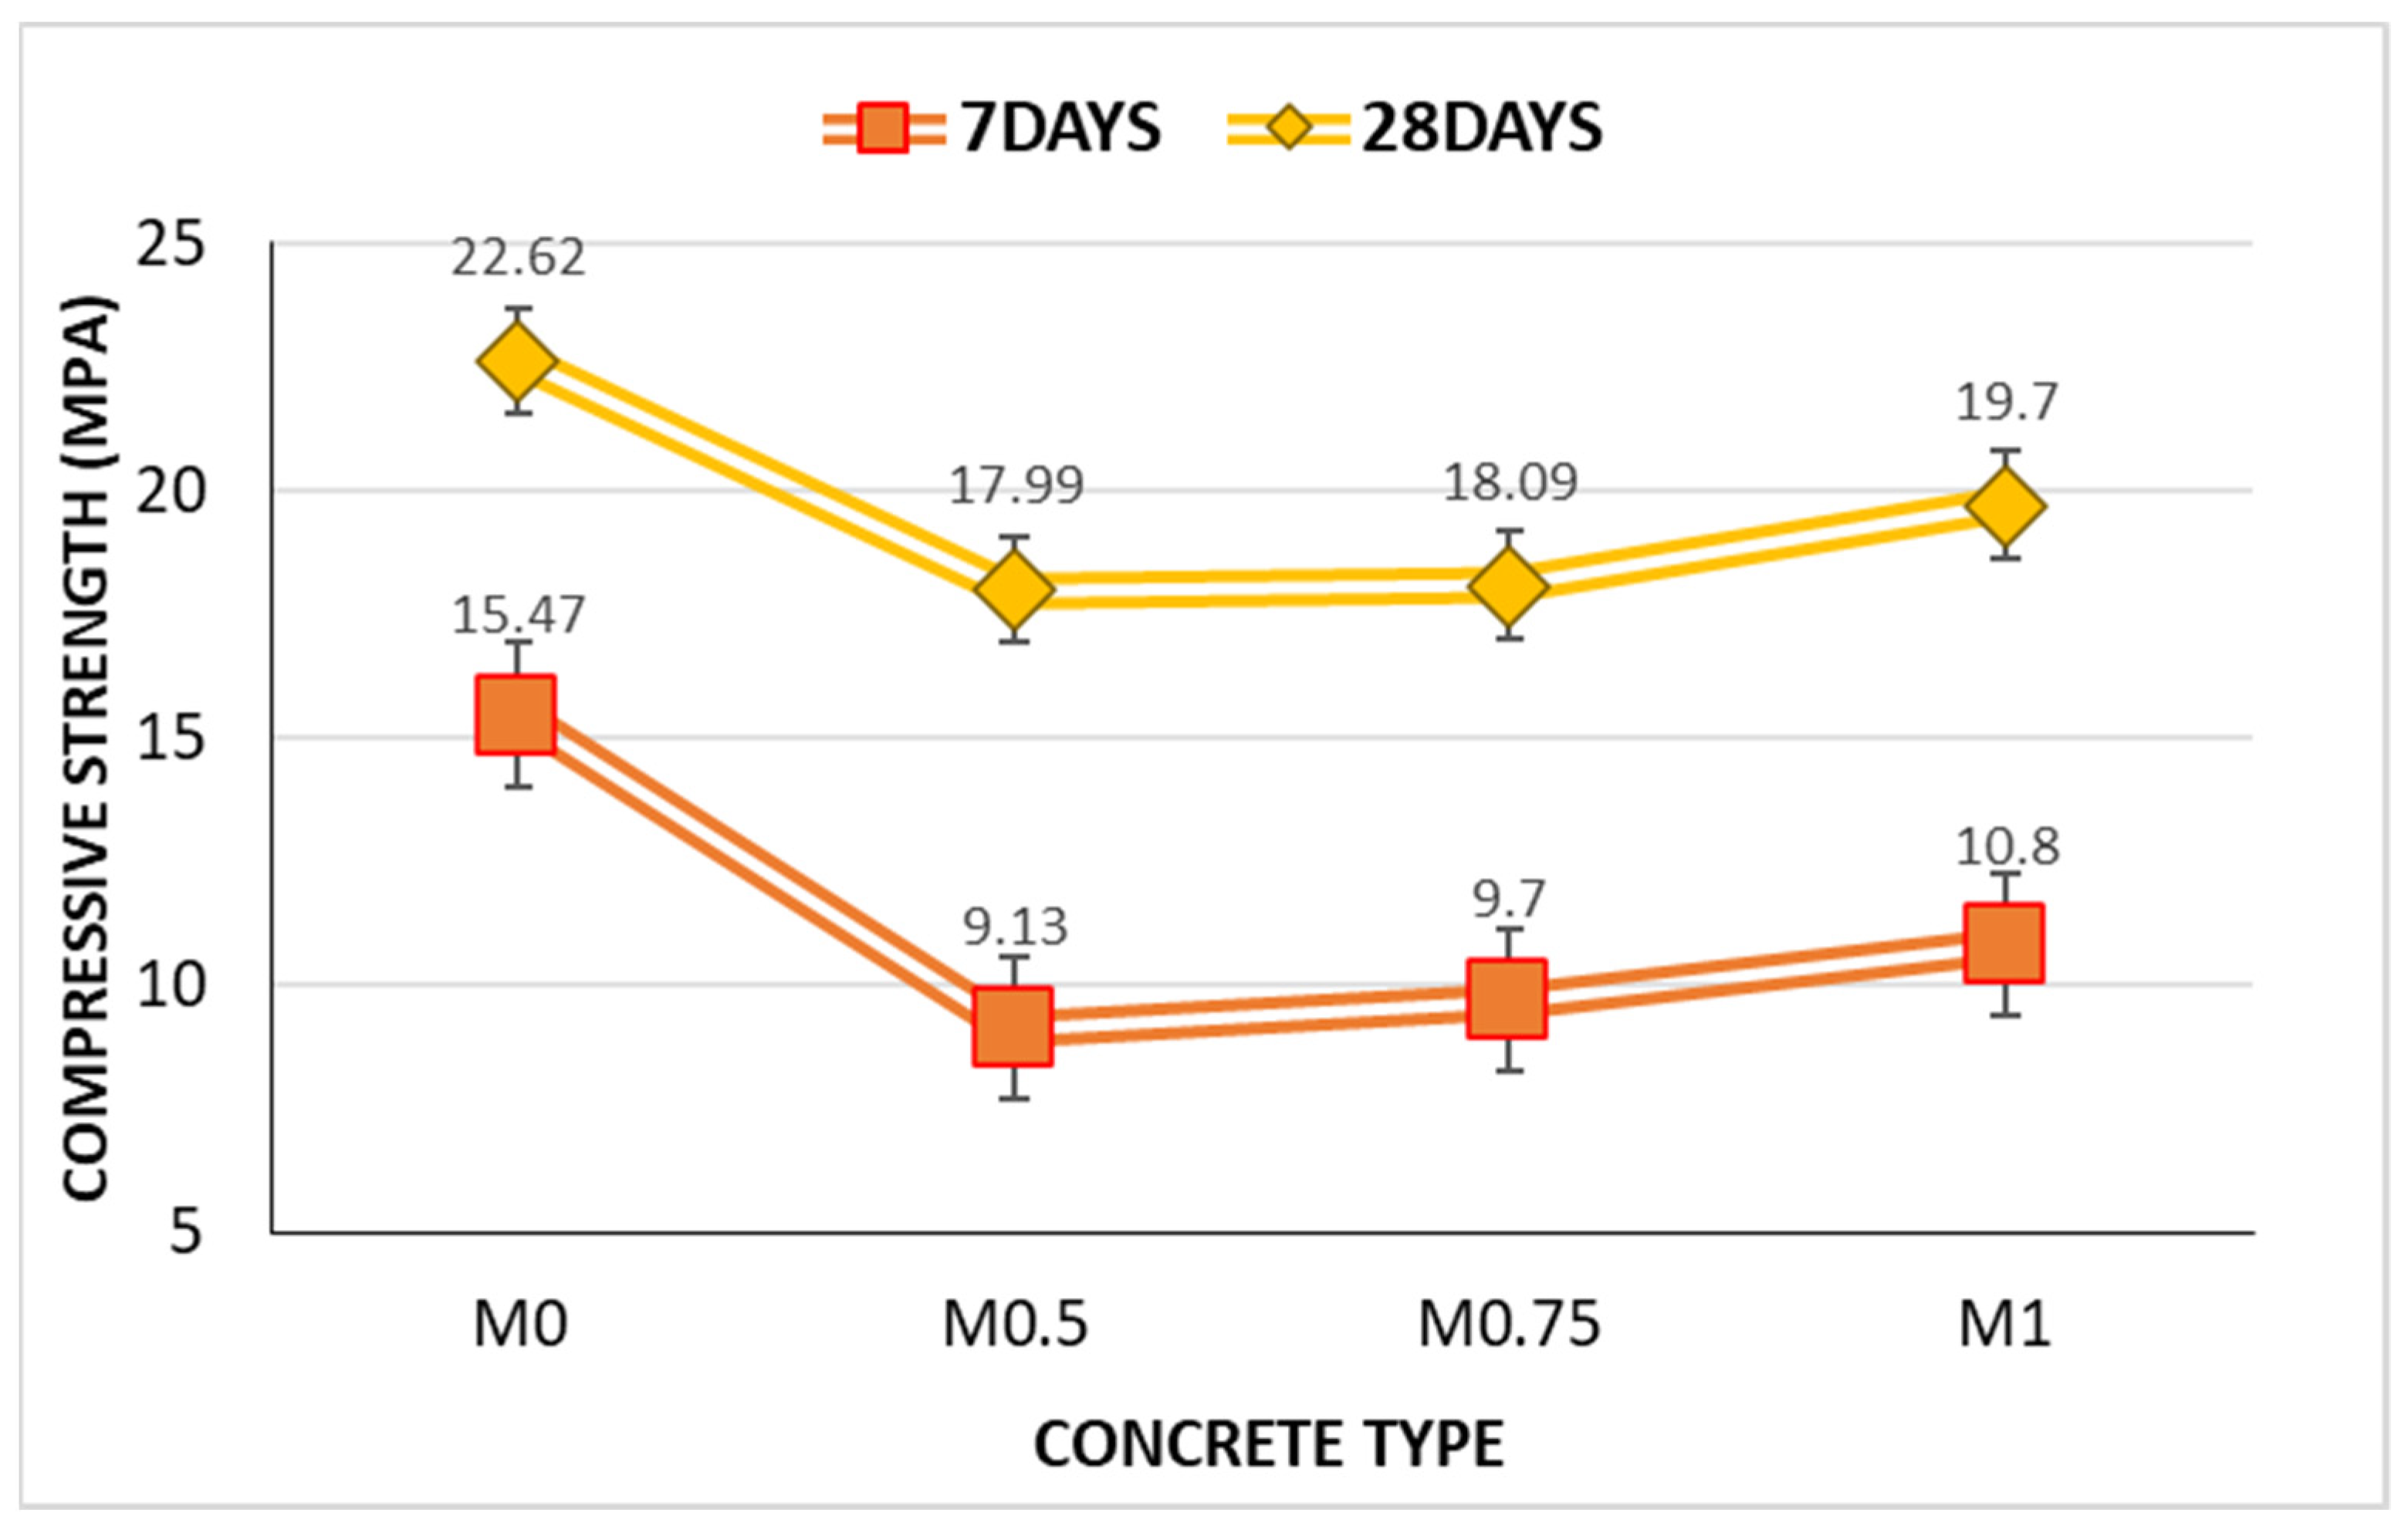
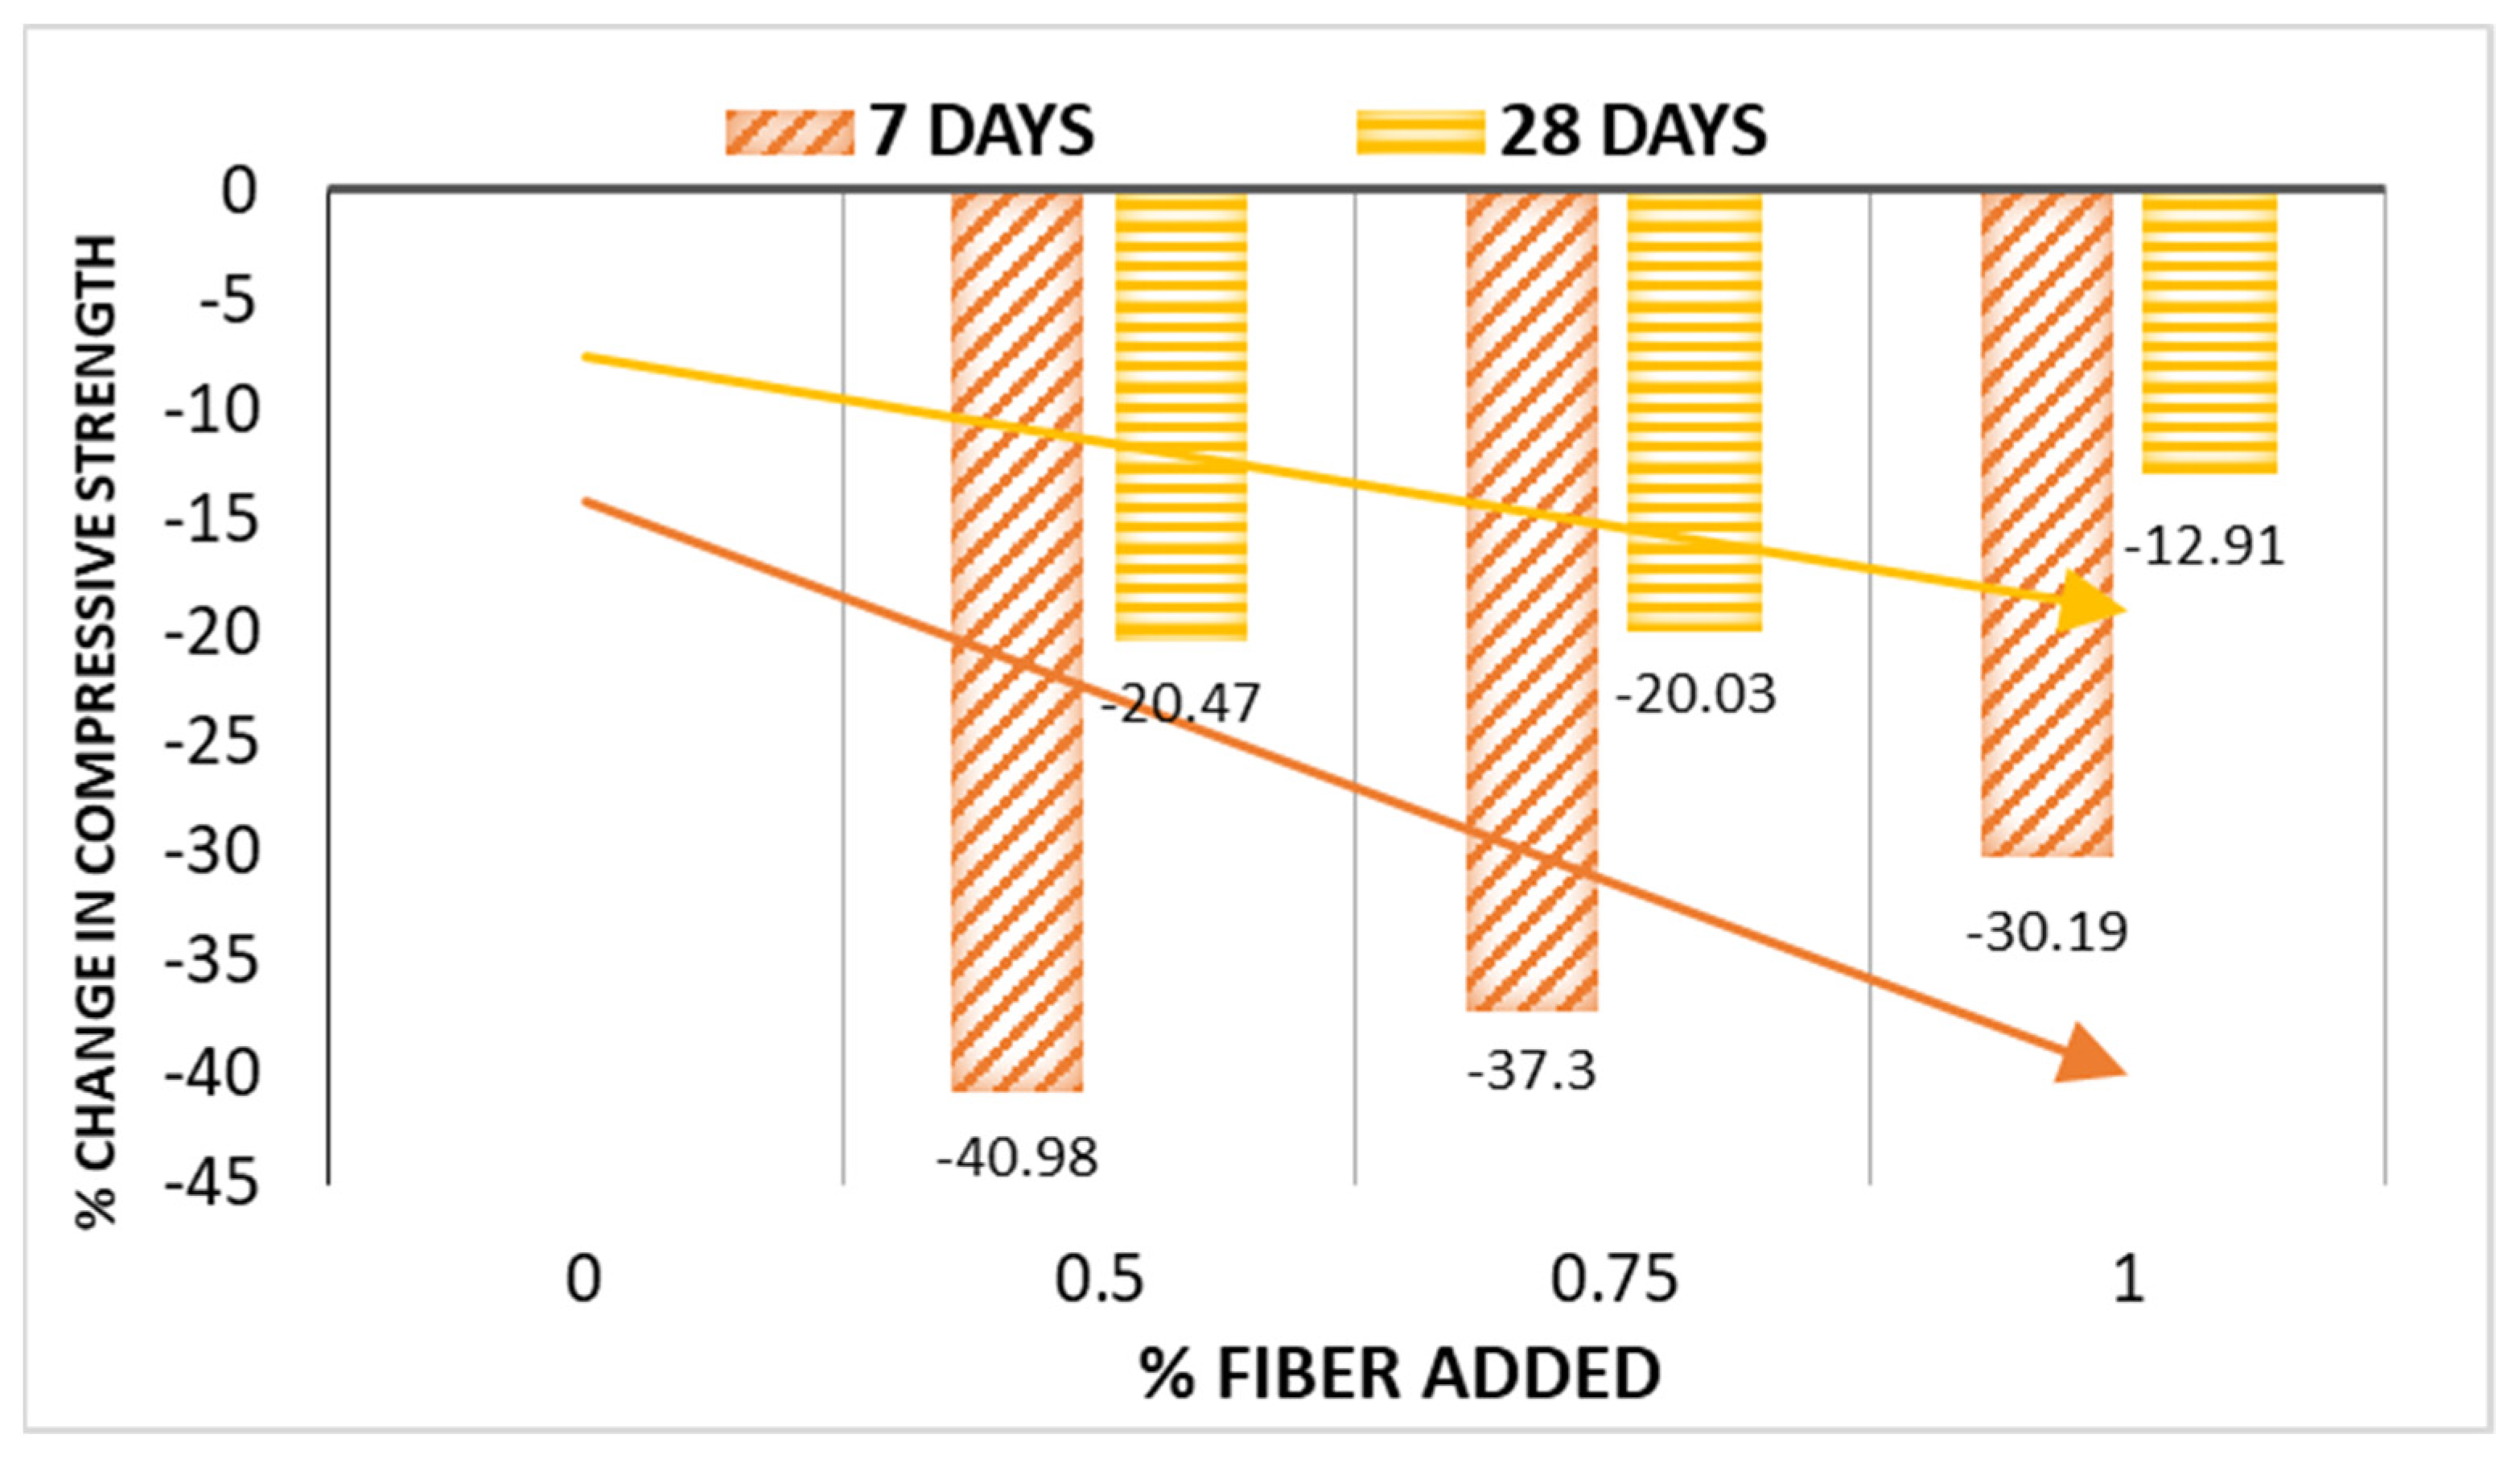
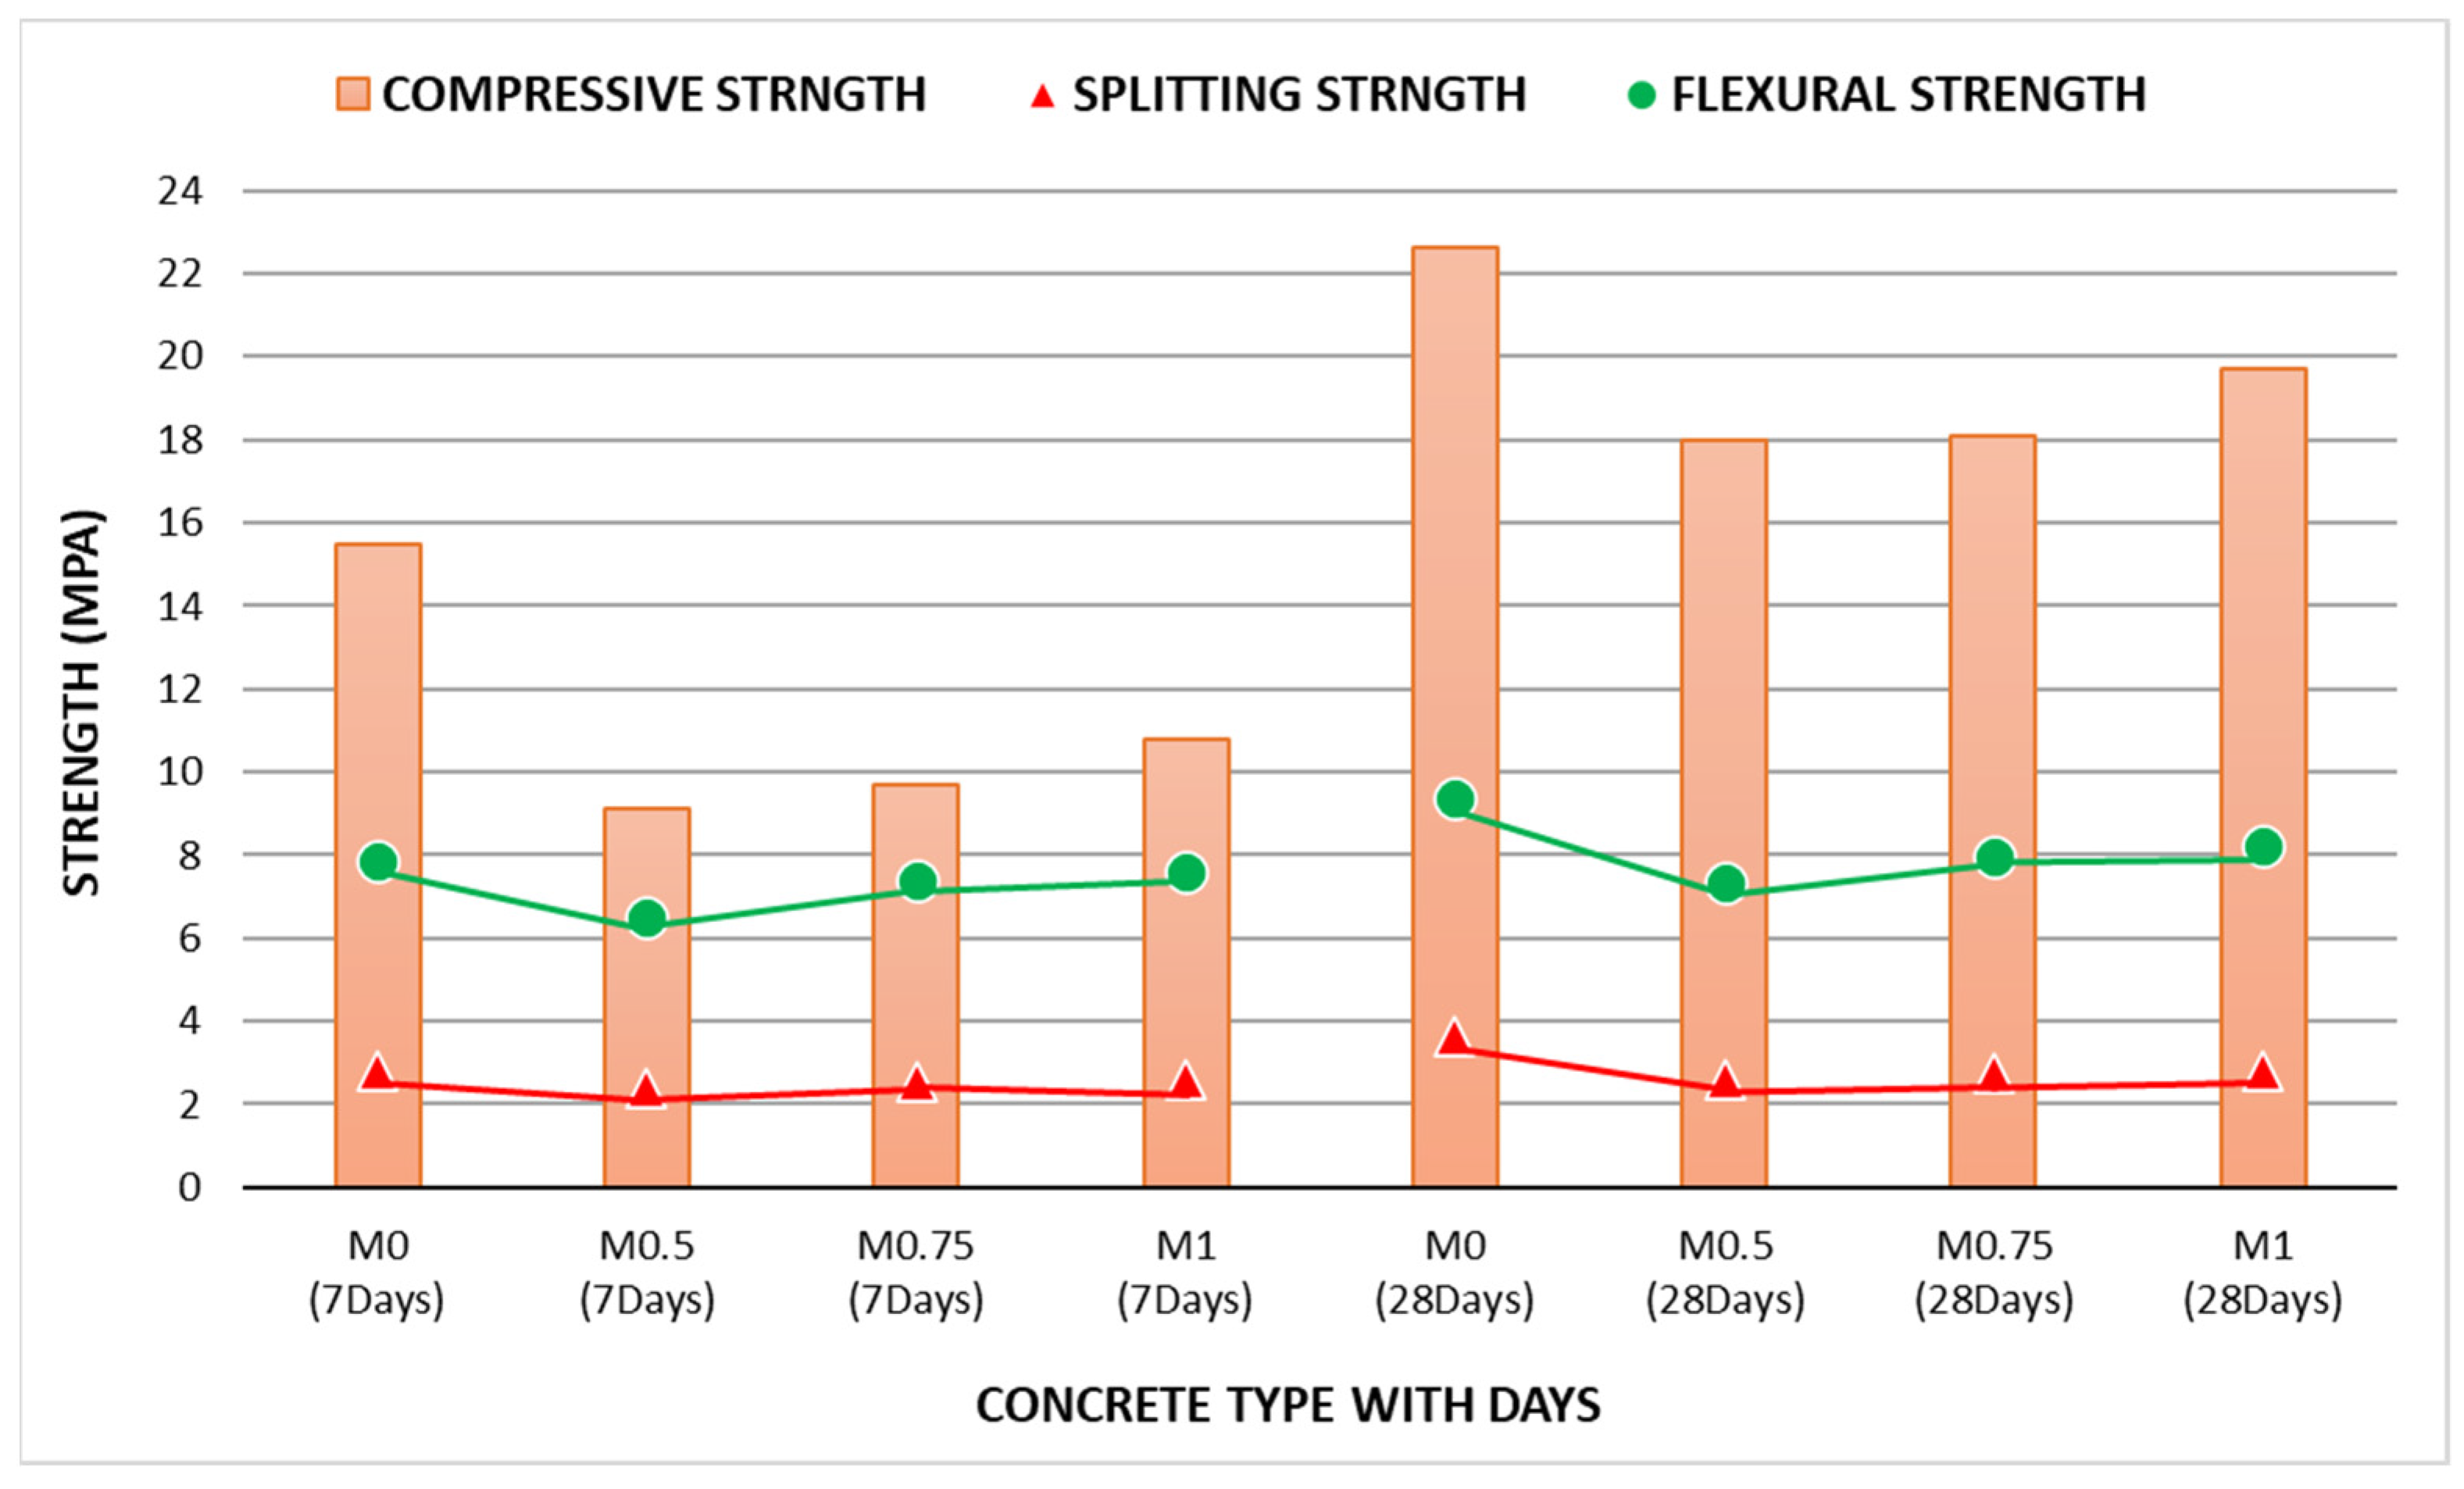
3.2.1. Effect of Fiber on Compressive Strength Test

Table 7 shows the compressive strength behavior of all SCC mixes with respect to mean compressive strength, coefficient of variation, standard deviation, standard error, and 95% confidence interval.
It can be stated from Table 7 that the compressive strength value for the SCC with RHA and waste copper wire ranges from 9.13 MPa to 22.62 MPa, with a standard error range from 0.124 to 2.48. The strength among the three specimens deviated from one to another, ranging from 0.22 MPa to 4.3 MPa with a relative coefficient of variation 0.022 to 0.19. At 7 days, the final lowest compressive strength for the mix with RHA and 0.5 percent copper wire was 9.13 MPa, with a 95 percent confidence interval of 8.27 MPa to 10 MPa. In contrast, the extreme compressive strength for this experimental study was recorded for the control mix SCC, which is 22.62 MPa with a 95% confidence interval between 12 MPa to 33.29 MPa.
Tests on the compressive strength of the SCC combination revealed that as the amount of waste copper wire increased, the compressive strength increased but did not surpass the strength of the control mix. This phenomenon can be described by the improper mixing of aggregates, the friction between plates by copper wire, and the high absorption capacity of RHA.
Figure 11 shows the 7- and 28-day compressive strength data for all SCC mixes in a line diagram. The acceptable compressive strength at 28 days will be in the specified range of 17–31 MPa based on the guideline ACI [44]. Figure 12 illustrates the changing percentage of compressive strength with varying copper wire addition, showing that the compressive strength for mix M0.5, M0.75, and M1 decreased 40.98%, 37.30%, and 30.19%, respectively, at 7 days, whereas these rates at 28 days are 20.47%, 20.23%, and 12.91%, respectively. According to Raisi et al. [42], RHA compressive strength rose by 8 percent and 2.6 percent at a water–binder ratio of 0.50 at 28 days, respectively, with regard to the control concrete when RHA was added from 5% to 20%. According to Ali et al., the compressive strength increases up to 10 percent of RHA and starts to decrease at 12.5 percent [45]. Chopra and Siddique [11] stated that the hydrated cement reduced compressive strength was caused by a reaction between the calcium hydroxide generated and the high concentration of available silica [13]. Other researchers like Rahman et al. [46] and Suaiam and Makul [47] found that the compressive strength of SCC mixes containing RHA reduced with the increment of the RHA concentration at 3 and 28 days. The strength of composite mixes increase after 60 days due to increasing the pozzolanic reactions rate of RHA in the matrix and a denser internal structure. Due to fibers’ capability to prevent the spread and development of microcracks, concrete failure is delayed. The specimens show columnar fracture failure due to the internal friction between coarse aggregate and copper wire fibers. Figure 17a shows a crack on the specimen.

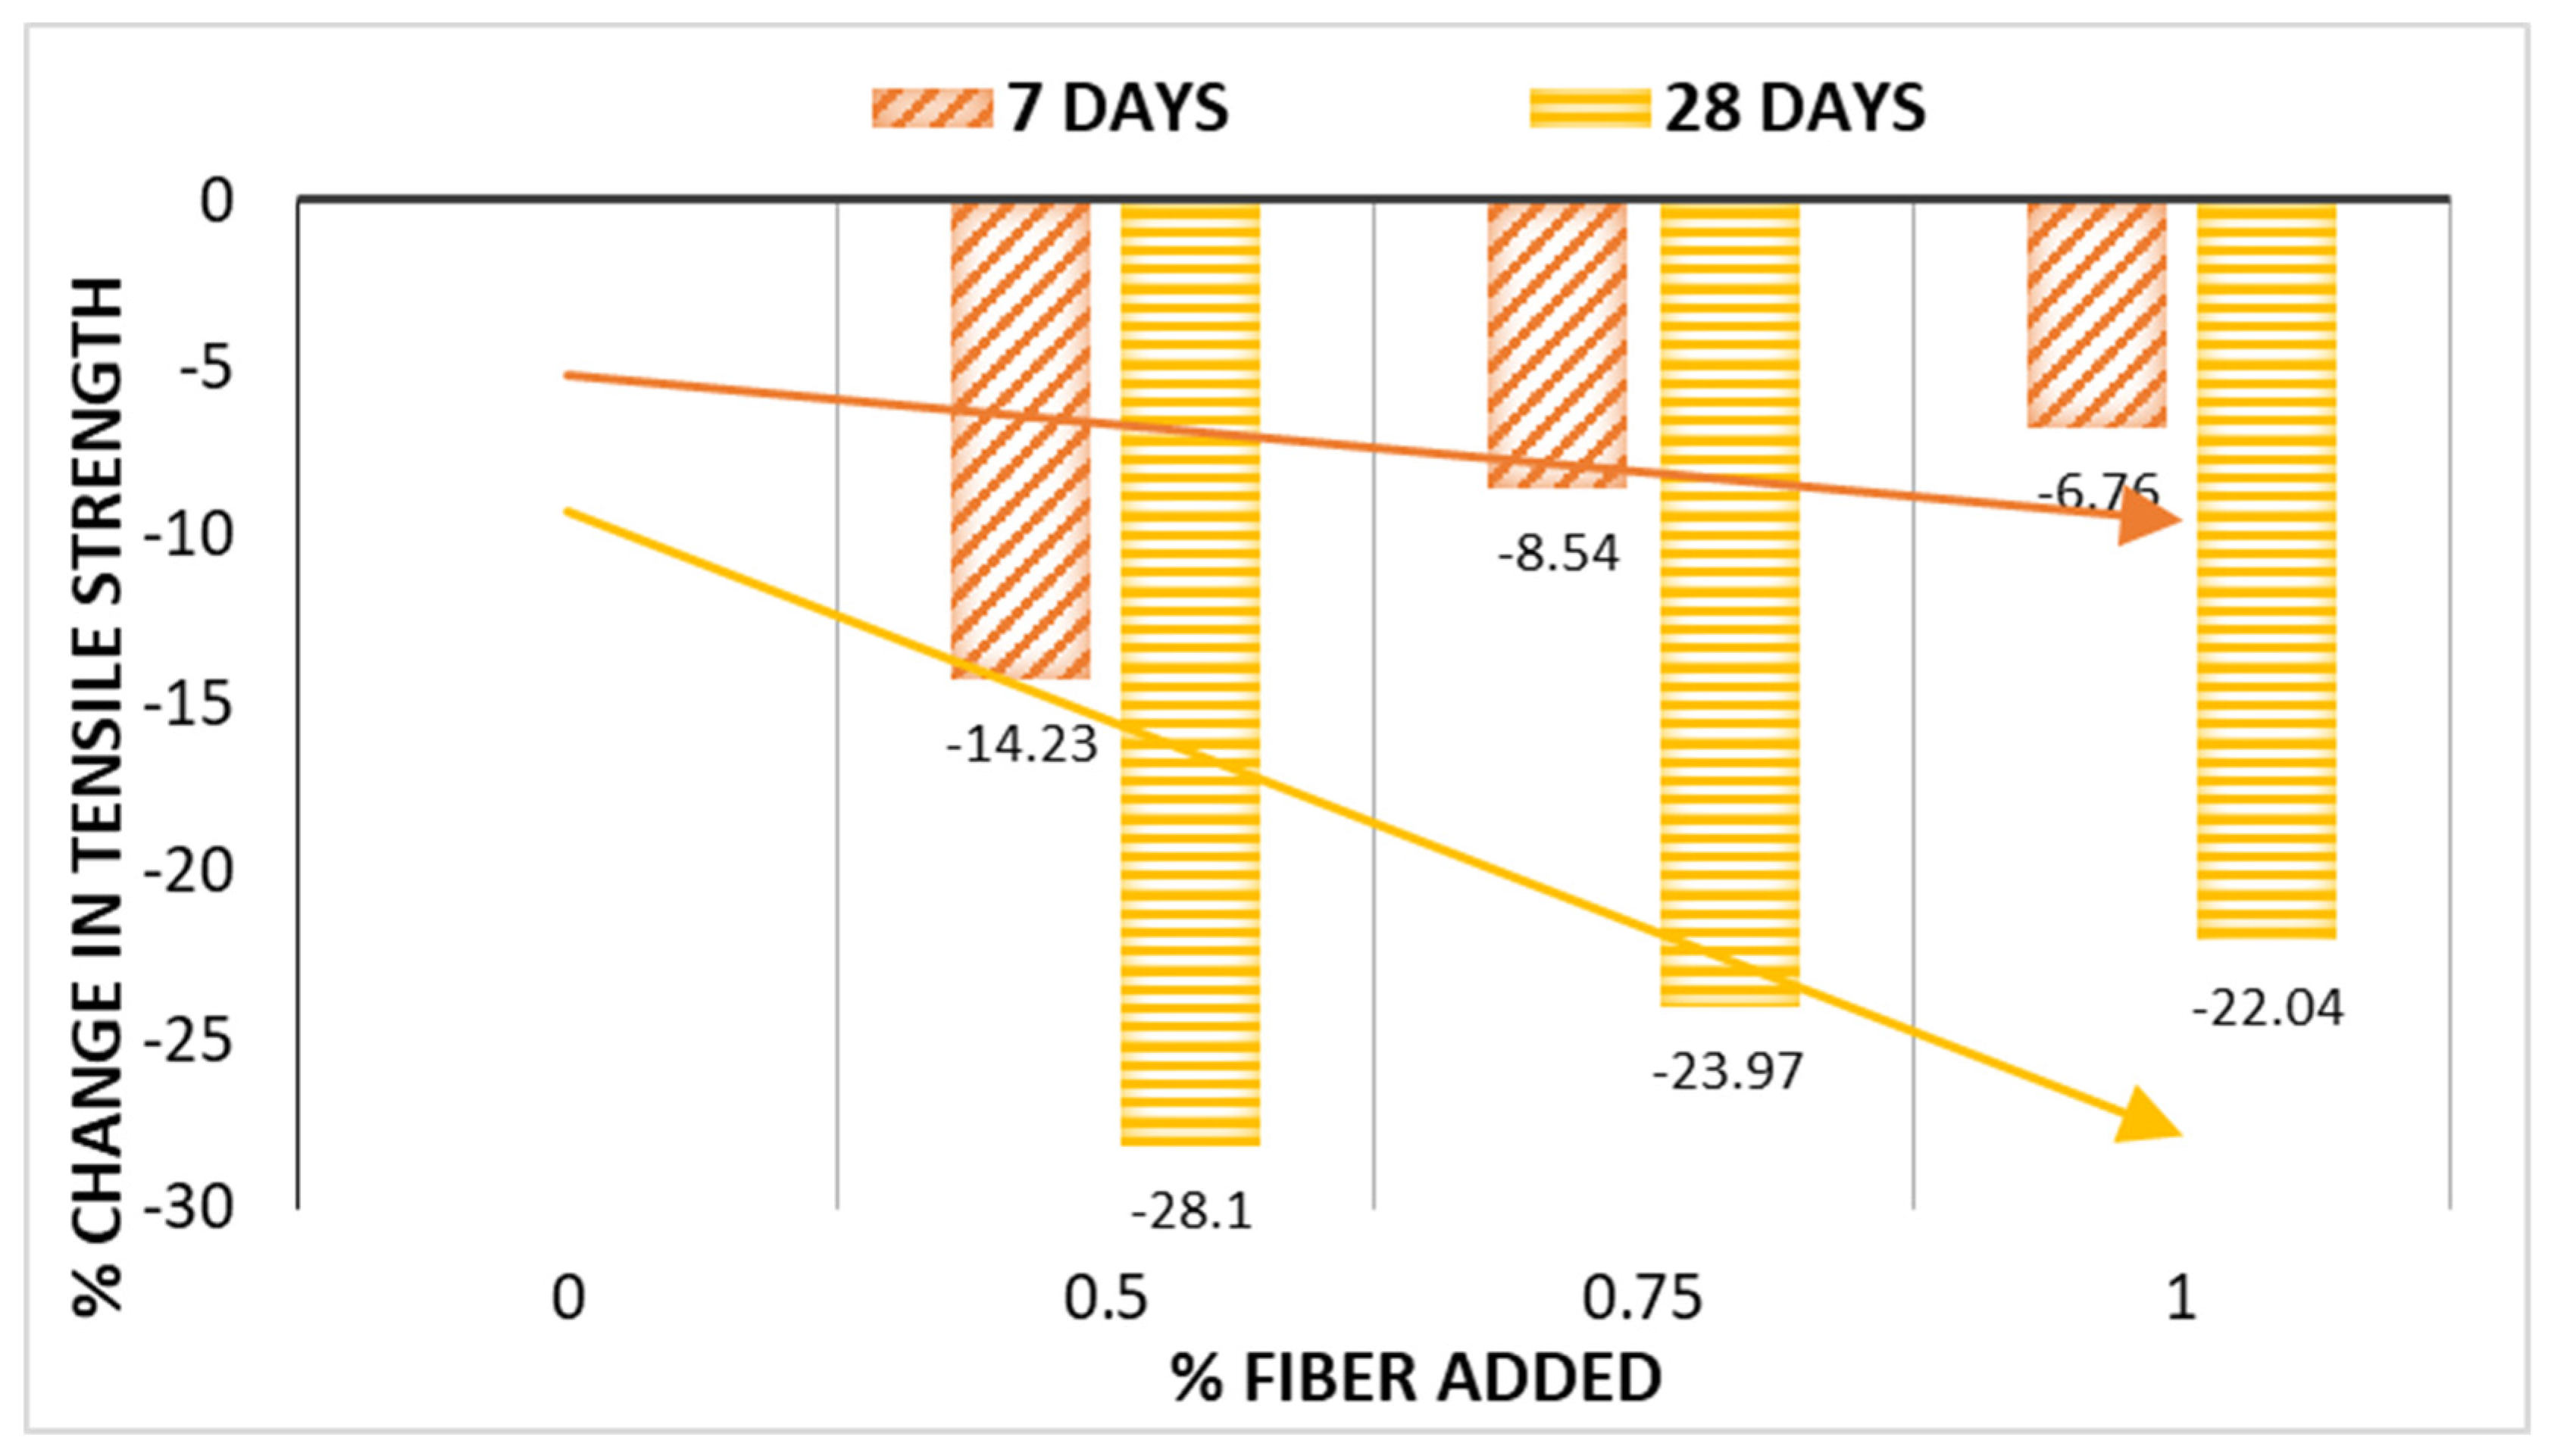
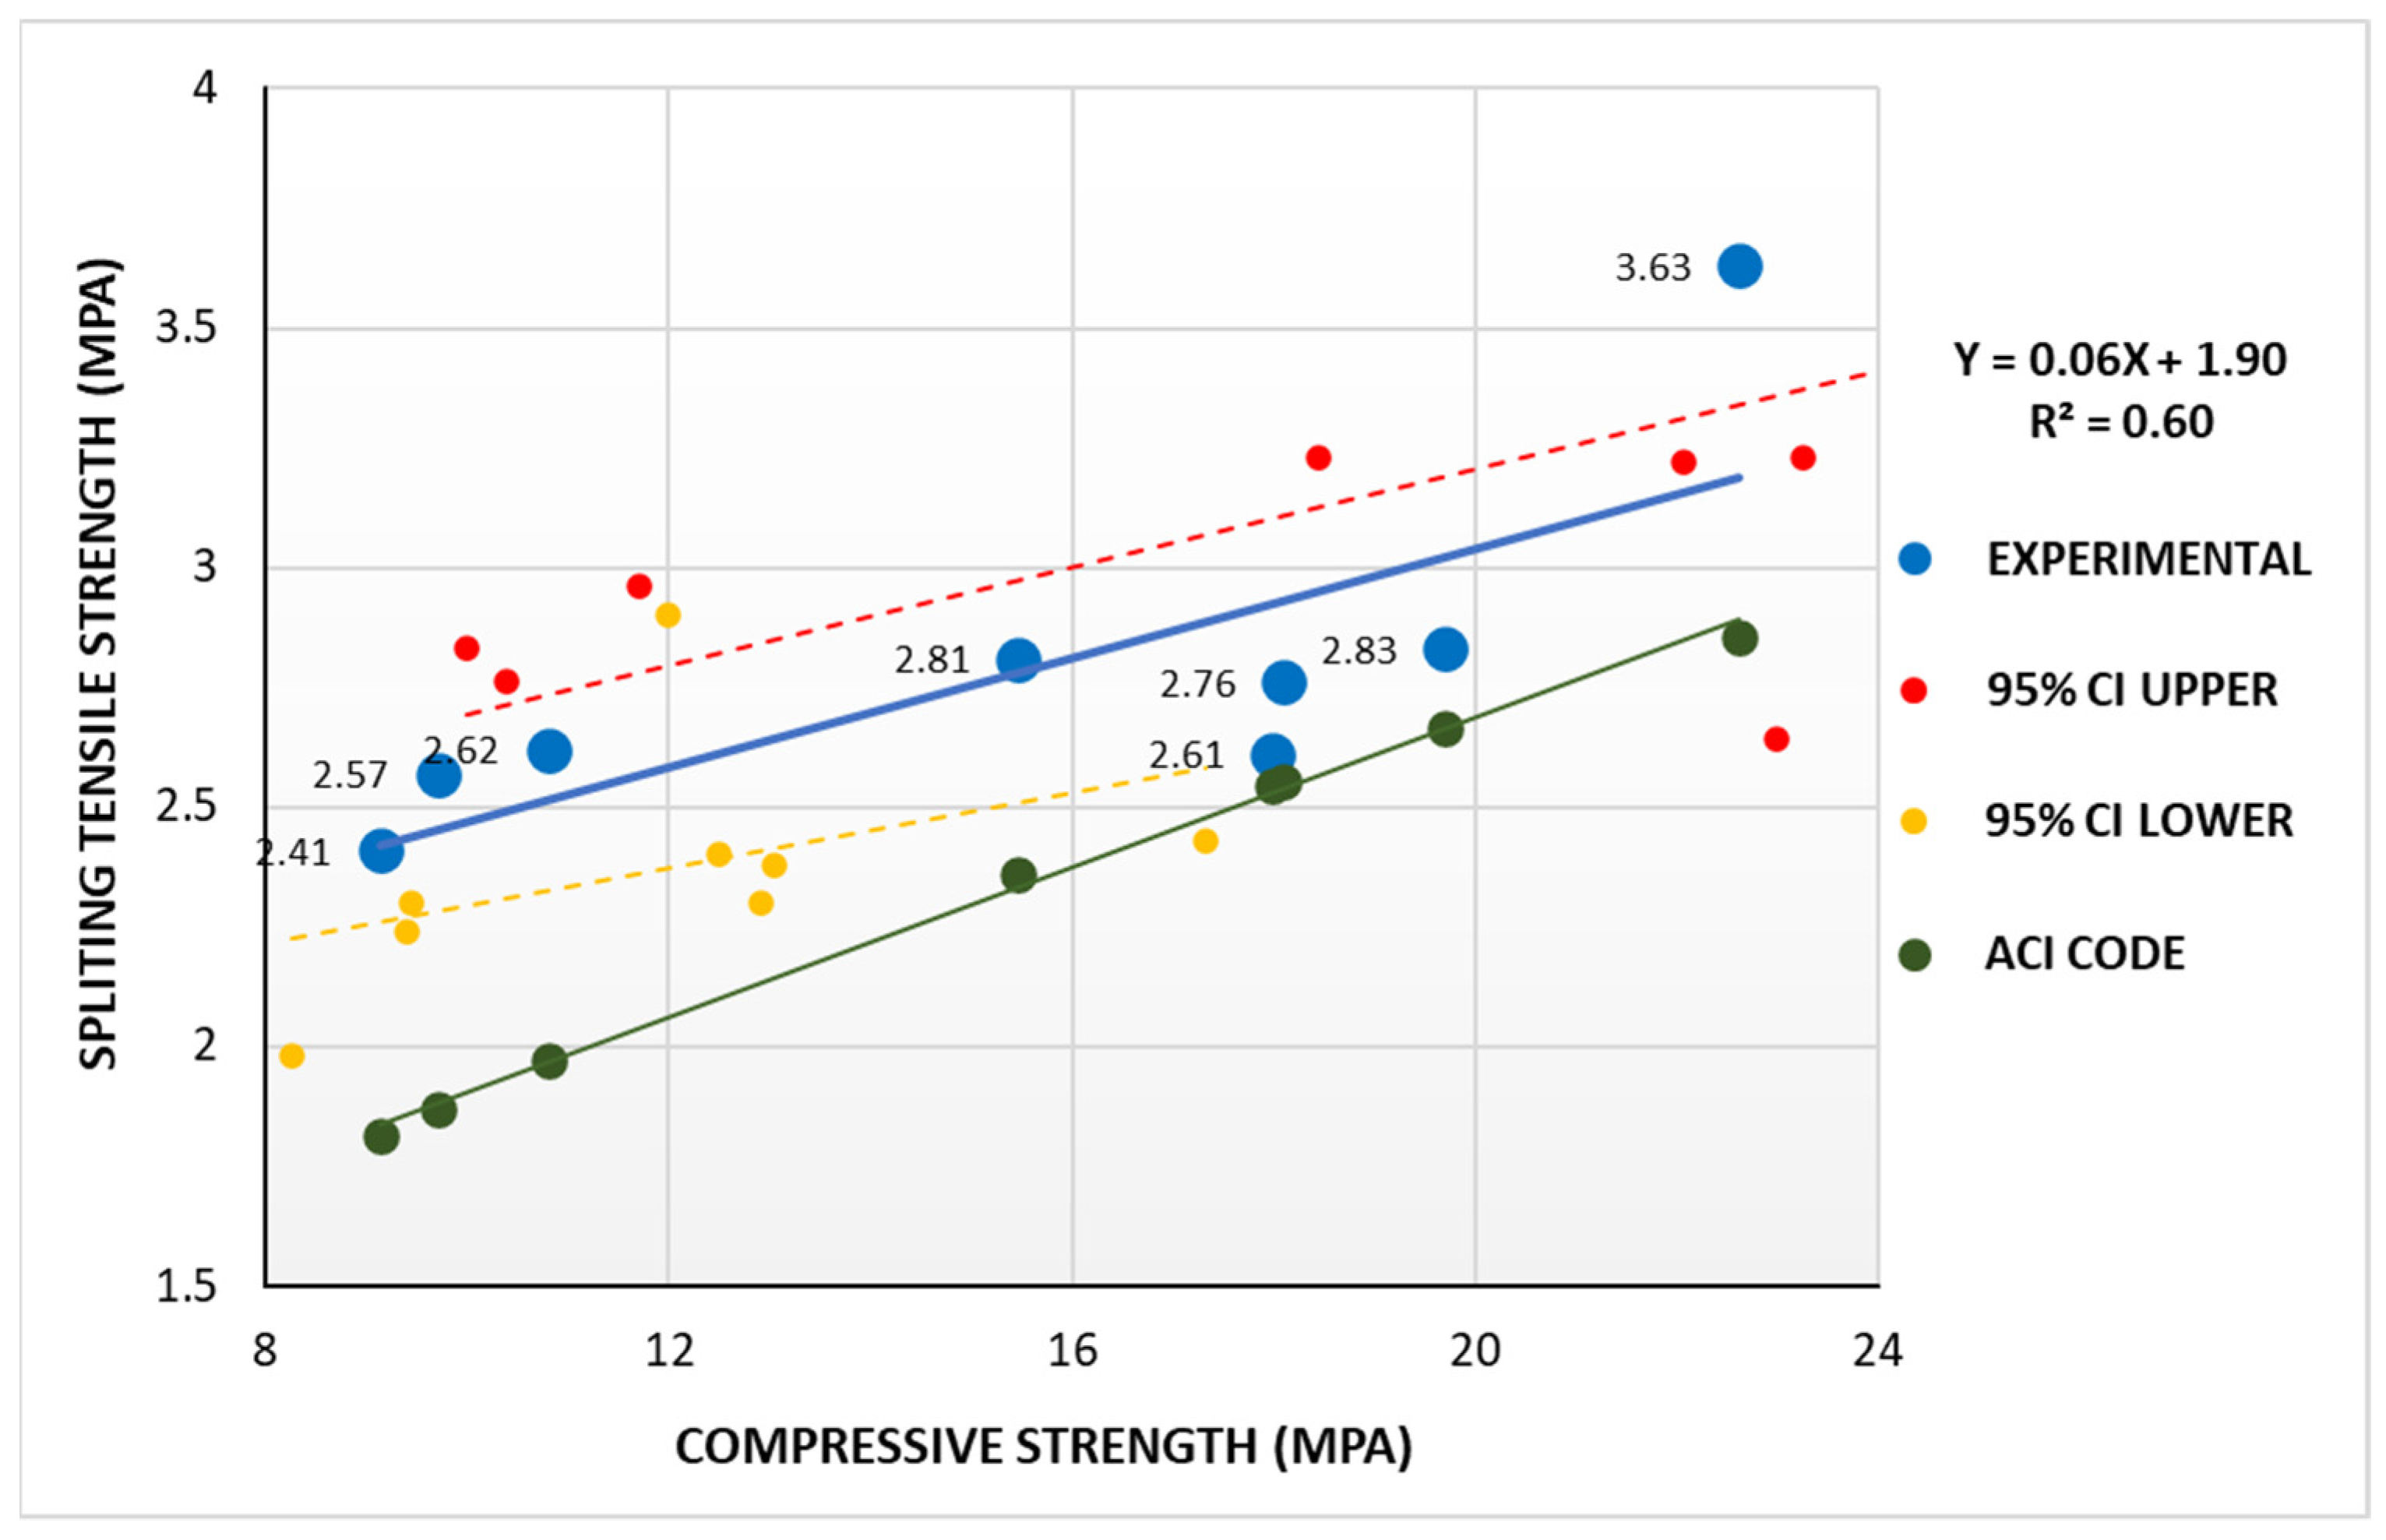
3.2.2. Effect of Fiber on Splitting Tensile Strength Test

Splitting tensile strength was used to quantify the tensile properties of the SCC mixtures. It is shown in Table 8 with the mean, standard deviation, standard error, covariance coefficient of variation, and 95 percent confidence interval.
Table 8 represents the splitting strength of SCC with RHA and waste copper wire ranging from 2.41 MPa to 3.63 MPa, with the standard error percentage ranging from 0.03 to 0.17. The 95% confidence interval for the least tensile strength was between 1.98 MPa to 2.83 MPa, and the extreme tensile strength was recorded at 2.9 MPa to 4.36 MPa. The mean strength is calculated by taking the average of three specimens, and the value deviated from one another ranges between 0.05 MPa to 0.30 MPa, with the respective coefficient of variation 0.02 to 0.083. The uppermost tensile strength for 28 days was recorded 3.63 MPa for the control mix with no RHA and copper wire, and the lowermost strength was recorded for the mix M0.5 incorporating RHA and 0.5% copper wire, which is 2.61 MPa.
After analyzing the splitting strength results of the different categories of SCC mixes, it was observed that the tensile strength of the SCC mixes tended to increase with the addition of waste copper wire but is not greater than the control mix. The test results show that 1% replacement gives the highest tensile strength, which is 2.83 MPa at 28 days and below the control mix strength of 3.63 MPa. For 0.5% and 0.75% replacement, the splitting strength was 2.61 and 2.76 MPa, respectively, at 28 days. This phenomenon can be described due to improper mixing of aggregates, friction between plates by copper wire, w/c ratio, and high absorption capacity of RHA. The acceptable splitting strength at 28 days will be in the range of 2–5 MPa according to ACI [44], and the outcomes for all conditions satisfied this margin. Figure 13 depicts the values of splitting strength for different SCC types in the linear graph for both 7 and 28 days. Chopra and Siddique [13] found that the splitting tensile strengths of SCC containing 0%, 10%, 15%, and 20% RHA at 7 and 28 days were in the ranges of 2–2.8 and 2.5–3.7 MPa, respectively. In this experiment, the splitting tensile strength reduces a maximum of 14.23% with respect to the control mix by incorporating RHA and waste copper wire in SCC at 7 days and 28.1% at 28 days. Figure 14 illustrates the percentage change of tensile strength values compared to the percent of fiber added. To compare with plain concrete, Raisi et al. [42] observed comparable results—that adding RHA at concentrations ranging from 5% to 20% enhanced the splitting tensile strength of water–binder ratios of 0.50 at 28 days by 4.8%, 4.2%, and 2.5%, before lowering it by 16.9%. Ali et al. [45] reported that split tensile strength results increase up to 10 percent of RHA and start to decrease at 12.5 percent. Similar results were also reported by Rahman et al. [46], who discovered a drop in split tensile strength as RHA % increased, which is consistent with our findings. The cylinder crack from the splitting tensile strength test was carefully checked and inspected. This crack is a columnar fracture. The specimens show failure due to the internal friction between coarse aggregate and copper wire fibers. Both primary and secondary cracks were observed. Figure 17b shows the failure pattern of the concrete specimens.

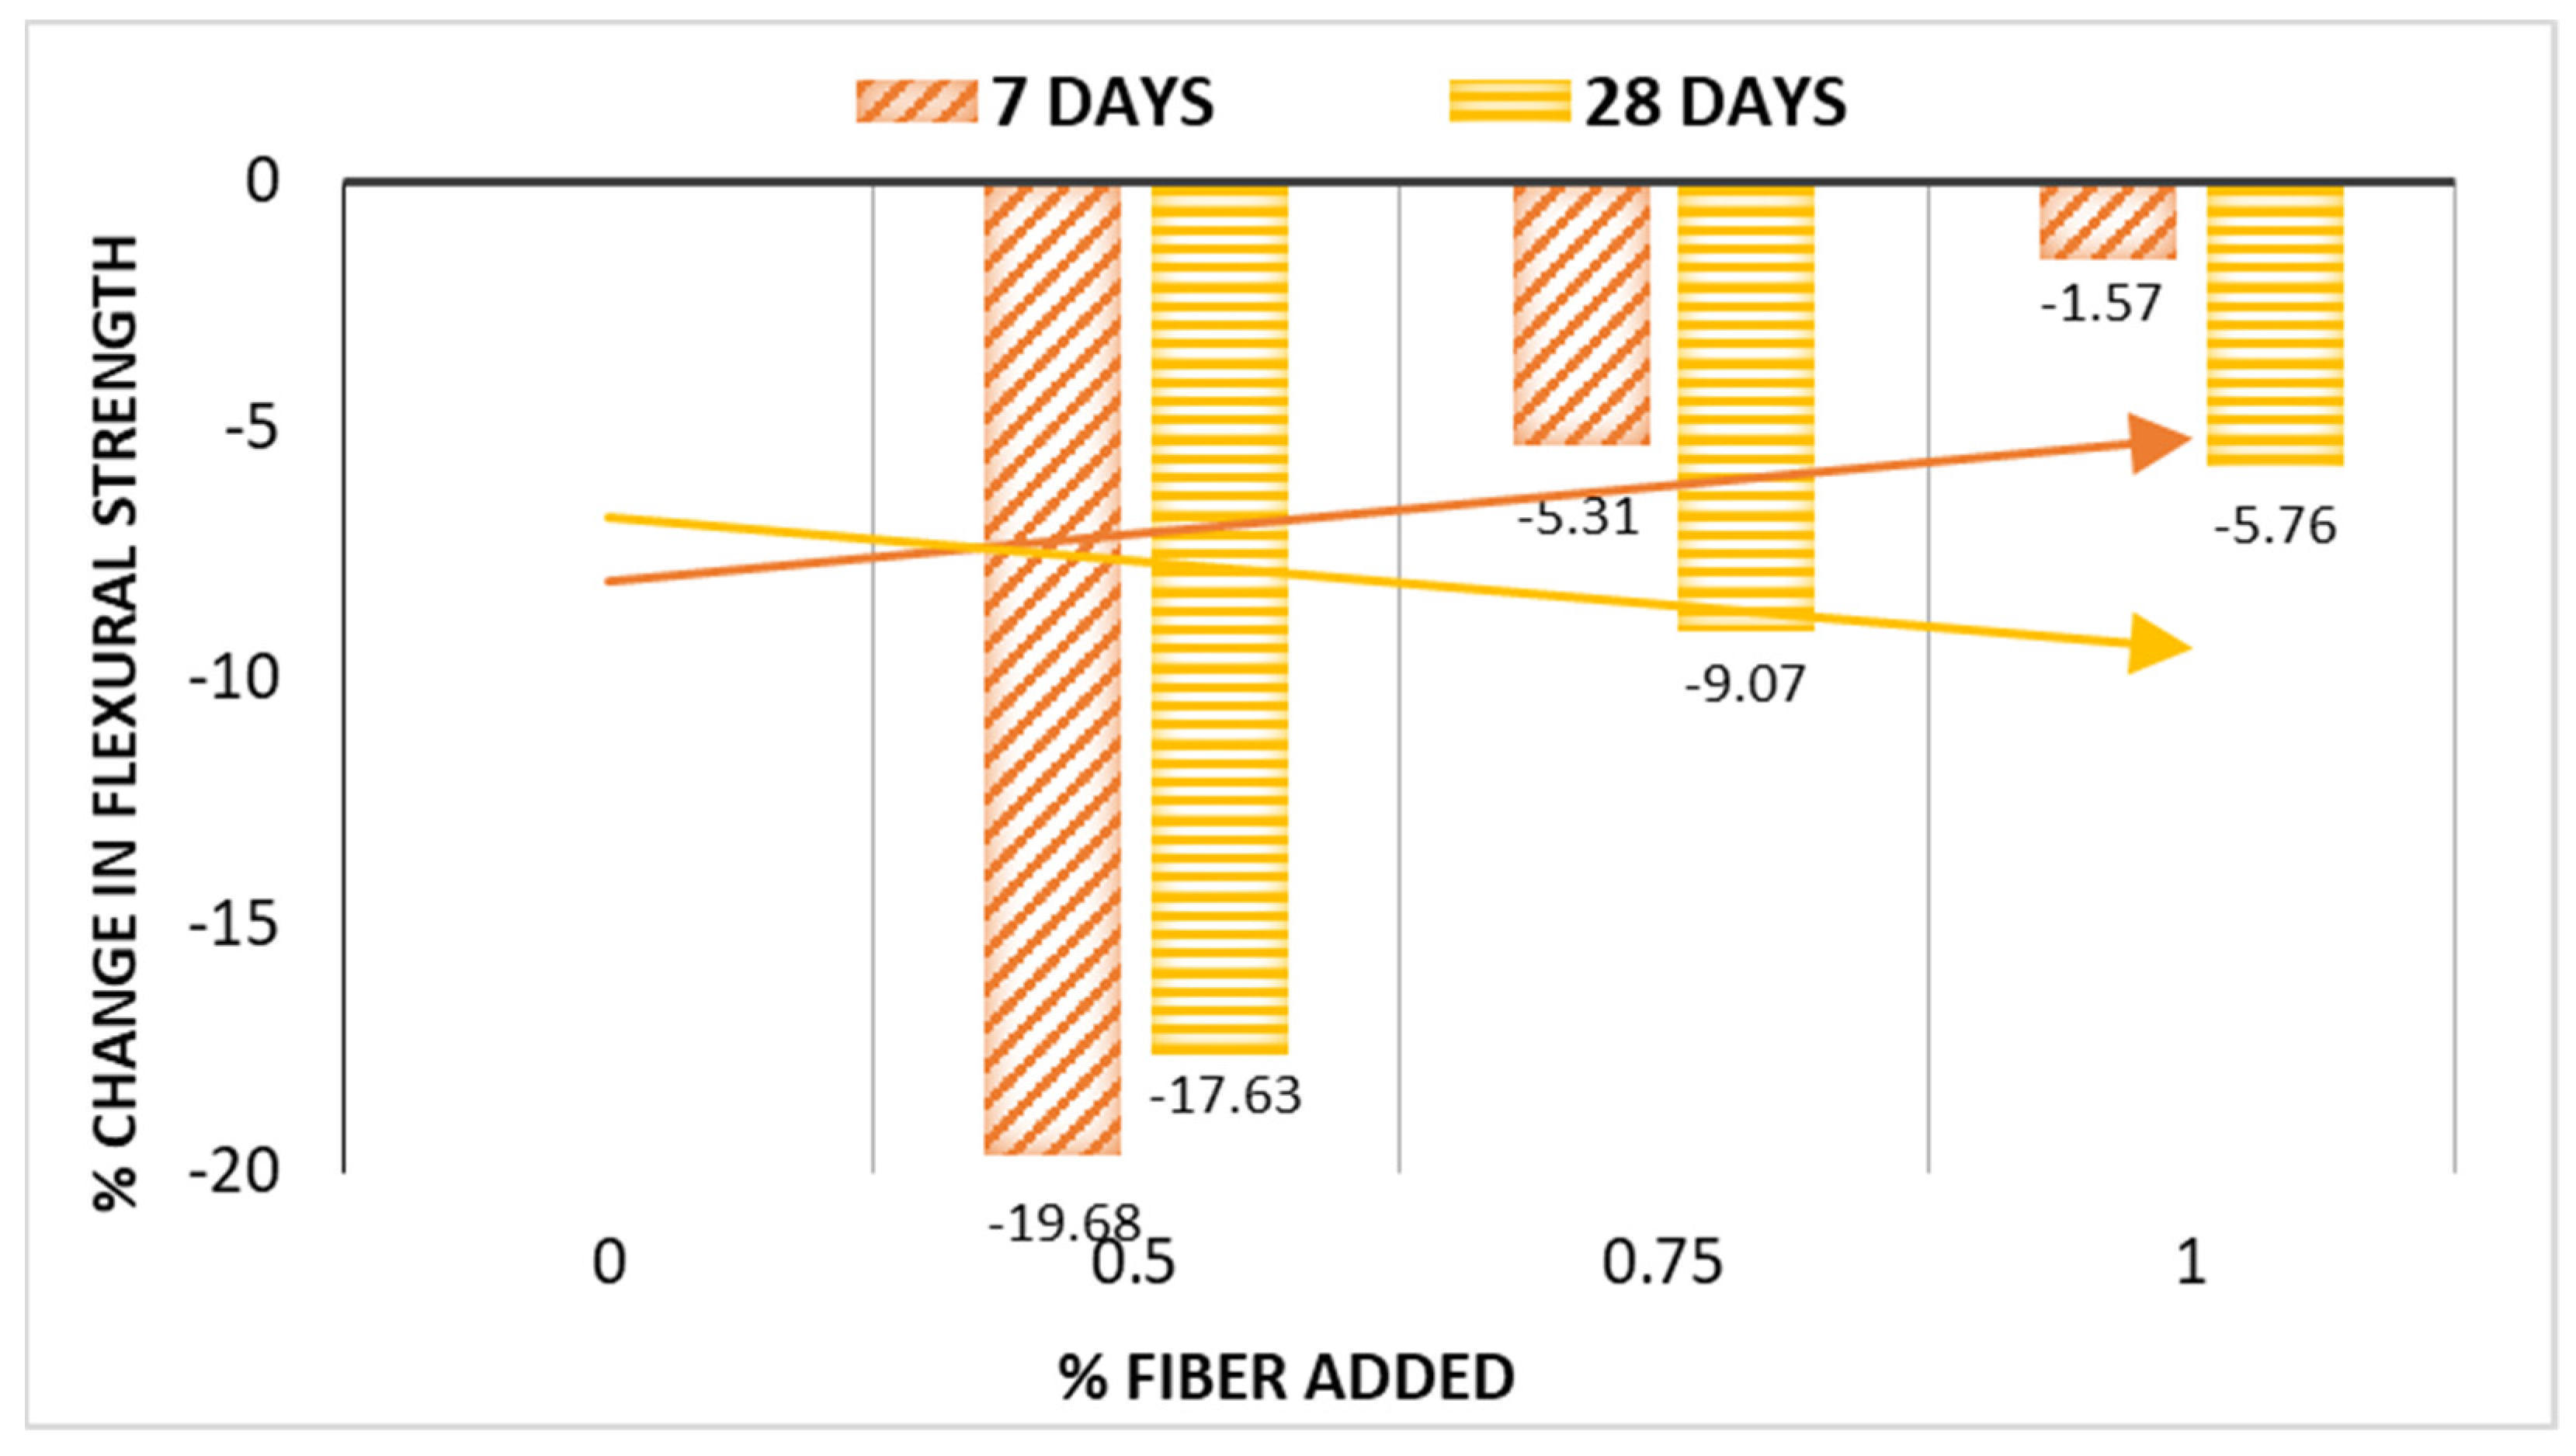
3.2.3. Effect of Fiber on Flexural Strength Test

The third point loading test technique was used in the lab to measure the flexural strength of scrap copper wire SCC. These findings are described in Table 9, which includes mean flexure strength and 95% confidence intervals for these variables as well as other key statistics.
The Table 9 shows that the flexural strength for the SCC with RHA and waste copper wire ranges from 4.08 MPa to 5.73 MPa, with the standard error percentage from 1.2% to 24%. The mean flexural strength is determined by averaging the values of the three specimens, and the values deviated from one to another from 0.022 MPa to 0.42 MPa with the relative coefficient of variation 0.0043 to 0.08. The extreme flexural strength was recorded for the control mix M0 at 28 days, which was equal to 5.73 MPa with a confidence interval between 5 MPa to 6.46 MPa. In contrast, the least flexural strength was evaluated for the mix with RHA and the 0.5% copper wire at 7 days which is 4.08 MPa, having the confidence band between 3.7 MPa to 4.47 MPa.
By performing the flexural strength test on the different SCC mixtures, it was discovered that with the increment of waste copper wire, the flexural strength tends to increase but is not greater than the control mix. After replacement, the test results show that 1% replacement gives the highest tensile strength, which is 5.4 MPa at 28 days than 0.5% and 0.75% replacement (4.72 MPa and 5.21 MPa), which is below the control mix strength 5.73 MPa. This phenomenon can be explained, as previously mentioned by tensile strength. A similar observation was made by Ali et al., who reported that flexural strength results increase up to 10 percent of RHA and start to decrease at 12.5 percent. The minimum acceptable flexural strength at 28 days will be in the range of 3–5 MPa followed by the ACI code [44], which completely satisfied all compositions of SCC tested in this experiment. Figure 15 illustrates the flexural strength values of all the SCC mixes for the curing 7 and 28 days. At 7 days curing, flexural strength reduces by a maximum 19.68% to a minimum 1.57% from the control mix M0 with the addition of RHA and waste copper wire in self-compacting concrete. On the other hand, the strengths decreased by a maximum of 17.63% for 2% RHA and 0.5% copper wire addition and a minimum of 5.76% for 2% RHA and 1% wire addition at 28 days. Figure 16 depicts the changing percentage of flexural strength with respect to wire addition. Atan and Awang [48] concluded that the incorporation of mineral admixtures (FA and SF) in SCC mixing RHA led to lower flexural strengths than the control mix. Pai et al. [49] also found that a considerable quantity of RHA in SCC significantly influenced the concrete flexural strength. Different type of cracking on the specimens were noted, and the distance of the fracture was measured. The observed failure modes in the beam are inclined flexural shear crack. The main reason for this type of crack is the inadequate flexural capacity of the beam and the insufficient cross section. It was a single crack. The maximum width of the crack was observed at the bottom of the beam (see Figure 17c).

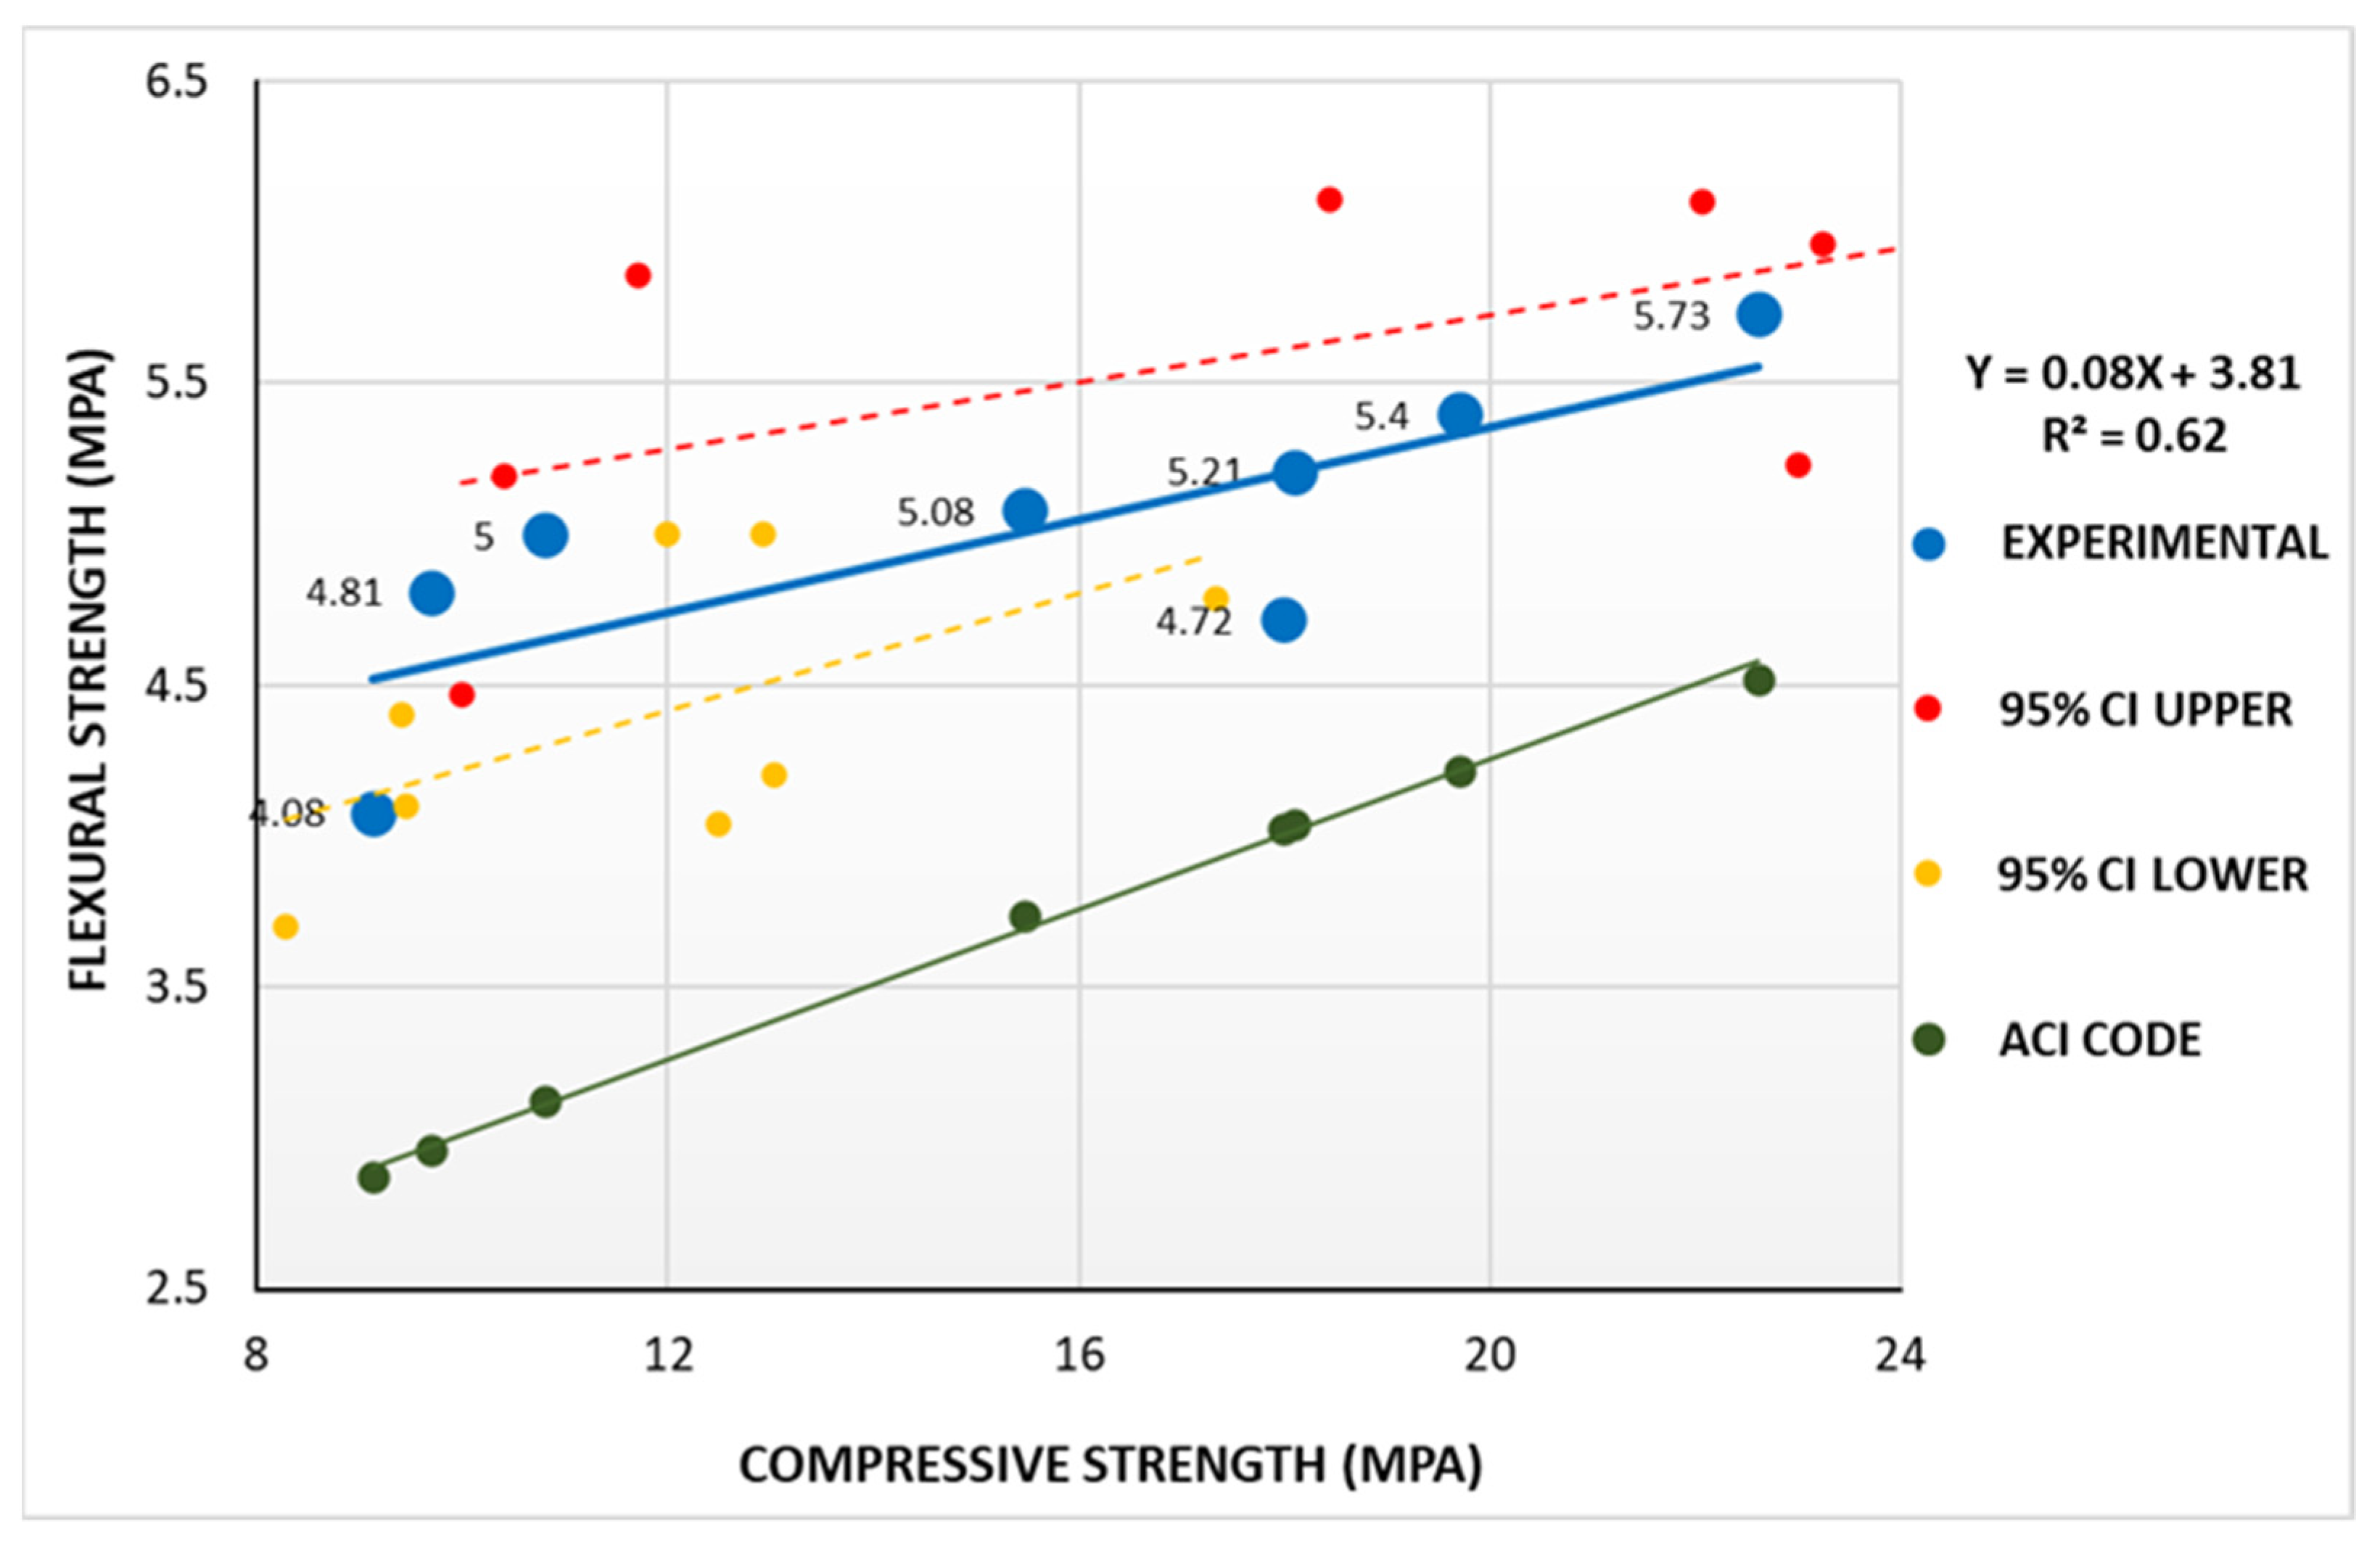
3.2.4. Relation between Mechanical Properties

The mechanical properties of waste copper wire SCC, such as compressive strength, tensile strength, and flexural strength, all behave and alter in a similar way. For comparison of various mechanical properties, all the results of tested properties are placed in a single graph presented in Figure 18. The graph shows clearly that as the RHA is added and the copper wire percentage increases, all the strength properties increase to curing days. Nevertheless, none of the strength values of waste copper SCC are greater than the control SCC mix. From Figure 18, it is also clear that the compressive strengths of concrete mixtures at 28 days become almost double from 7 days. Compressive strength values at 28 days increased about 82–97% from 7 days for different mixes with RHA and copper fiber. While the tensile strength and flexural strength of SCC mixed with RHA and copper fiber, at 28 days it had increased 7–15% from the strength at 7 days.
The correlation between compressive and tensile strength developed by regression analysis is presented in Figure 19. The proposed model displayed a linear relationship between these two parameters where the coefficient of determination value R2 is 0.60. This resulting relation could be used to quantify the splitting tensile or compressive strength from each other point without laboratory experimentation for the SCC with RHA and copper fiber. The established linear equation proposed an above-average relation with 60% of reliability. The equation to get splitting tensile strength, ƒst for any value of compressive strength, f c is presented in Equation (1)
f s t = 0.06 f c + 1.90
The 95% confidence interval band presented in Table 7 and Table 8 is also plotted in the relation graph. This experimental relation of the SCC values also satisfied the ACI 318 [44] code recommended relation, ƒst = 0.5√ f c to 0.6√ f c and the experimental values lie above the highest code suggested range (see Figure 19).
Figure 20 illustrates the relationship between compressive and flexural strength derived from an experimental regression analysis. The projected model exhibited a linear behavior between these influencing parameters where the coefficient of determination value R2 is 0.62. This outcome ensures an average relation between these two parameters with 62% dependability. The developed relation could be used to quantify the flexural strength or compressive strength from each other point without the need to perform any experimentation in the laboratory for the waste copper wire self-compacting concrete. The equation to get flexural strength, ƒr for any compressive strength value, f c is presented in Equation (2).
f r = 0.08 f c + 3.81
The 95% confidence interval band calculated in Table 7 and Table 9 is also plotted in the relation graph. This relation of the waste copper SCC values also satisfied the ACI 318 [42] code recommended relation, ƒr = 0.65√ f c to 0.95√ f c , and the experimental values lie above the highest code suggested range (see Figure 20).

4. Conclusions

The following conclusions can be drawn from the test results and discussion of this experimental study:
  • Waste copper fiber makes SCC less workable as the control mix obtains the highest slump 730 mm and the least time to flow 2.7 s.
  • The shape and texture of waste copper fiber slightly increase the chance of blockage. The maximum blocking index, 12 was obtained for mix M1, indicating unacceptable passing criteria for SCC.
  • The addition of 2% rice husk ash as a substitution for cement makes the SCC more viscous.
  • The compressive, flexural, and splitting strength increases among themselves with increasing the percentage of waste copper fiber, but they remain below the control SCC mix.
  • The compressive strength decreased 12.91% at 28 days from the control mix due to a maximum 1% of waste copper fiber addition. This decreasing rate for splitting and flexural strength obtained 22.04% and 5.76%, respectively, for the same condition.
  • The test results show that 2% RHA as a substitution of OPC and adding 1% copper wire gives the highest strength but has an unacceptable passing ability. Therefore, the SCC mix M0.75 with 2% RHA and 0.75% copper fiber is said to be optimum for this study.
  • According to the above study, adding waste copper fiber reinforcement and mineral admixture like RHA to the SCC can achieve adequate rheological and mechanical properties to use in real life construction.

5. Future Recommendations

From the literature review, it can be found that RHA significantly influences mechanical characteristics at delayed age of concrete. Therefore, the authors would like to recommend continuing this experiment for more curing days, e.g., 56 days and 90 days, to assess the behavior of SCC with RHA and waste copper fiber.

Author Contributions

Conceptualization, M.H.R.S., A.S. and J.F.A.; methodology, M.H.R.S., A.S. and J.F.A.; software, A.S. and J.F.A.; validation, M.H.R.S., M.H., M.A. and M.J.R.; formal analysis, M.H.R.S. and J.F.A.; investigation, A.S. and J.F.A.; resources, M.H.R.S., A.S., J.F.A., M.H., M.A., A.S.M.A. and M.J.R.; data curation, A.S. and J.F.A.; writing—original draft preparation, A.S.; writing—review and editing, M.H.R.S., M.H., M.A., A.S.M.A. and M.J.R.; visualization, M.H.R.S., A.S. and J.F.A.; supervision, M.H.R.S.; project administration, M.H.R.S., M.H. and M.A.; funding acquisition, M.H. and M.A. All authors have read and agreed to the published version of the manuscript.

Funding

This research received no external funding.

Data Availability Statement

Data will be available on suitable demand.

Acknowledgments

It is with deep gratitude that the authors express their gratitude to all the laboratory personnel at Khulna University of Engineering and Technology (KUET), Khulna 9203, Bangladesh, for providing the necessary resources to conduct this research.

Conflicts of Interest

The authors declare no conflict of interest.

References

  1. Safari, J.; Mirzaei, M.; Rooholamini, H.; Hassani, A. Effect of rice husk ash and macro-synthetic fibre on the properties of self-compacting concrete. Constr. Build. Mater. 2018, 175, 371–380. [Google Scholar] [CrossRef]
  2. Lachemi, M.; Baskar, I.; Muthupriya, P.; Venkatasubramani, R. Development of cost-effective self-consolidating concrete incorporating fly ash, slag cement, or viscosity-modifying admixtures. Mater. J. 2003, 100, 419–425. [Google Scholar]
  3. Şahmaran, M.; Christianto, H.A.; Yaman, İ.Ö. The effect of chemical admixtures and mineral additives on the properties of self-compacting mortars. Cem. Concr. Compos. 2006, 28, 432–440. [Google Scholar] [CrossRef]
  4. Sua Iam, G.; Makul, N. The use of residual rice husk ash from thermal power plant as cement replacement material in producing self-compacting concrete. In Advanced Materials Research; Trans Tech Publications Ltd.: Stafa-Zurich, Switzerland, 2012. [Google Scholar]
  5. Barach, A.L.; Martin, J.; Eckman, M. Positive pressure respiration and its application to the treatment of acute pulmonary edema. Ann. Intern. Med. 1938, 12, 754–795. [Google Scholar]
  6. Salas, A.; Delvasto, S.; de Gutierrez, R.M.; Lange, D. Comparison of two processes for treating rice husk ash for use in high performance concrete. Cem. Concr. Res. 2009, 39, 773–778. [Google Scholar] [CrossRef]
  7. Zhang, M.-H.; Malhotra, V.M. High-performance concrete incorporating rice husk ash as a supplementary cementing material. ACI Mater. J. 1996, 93, 629–636. [Google Scholar]
  8. Zhu, W.; Bartos, P.J. Permeation properties of self-compacting concrete. Cem. Concr. Res. 2003, 33, 921–926. [Google Scholar] [CrossRef]
  9. Mehta, P.K.; Folliard, K.J. Rice Hush Ash-A unique supplementary cementing material. Adv. Concr. Technol. 1995, 154, 531–542. [Google Scholar]
  10. FAO. Rice Market Monitor; Food and Agriculture Organization of the United Nations: Rome, Italy, 2015. [Google Scholar]
  11. Chopra, D.; Siddique, R. Strength, permeability and microstructure of self-compacting concrete containing rice husk ash. Biosyst. Eng. 2015, 130, 72–80. [Google Scholar] [CrossRef]
  12. Guidelines for Self-Consolidating Concrete. 2005. Available online: https://anfah.org/wp-content/uploads/pdf/articulo-tecnico-scc-guidelines-may-2005.pdf (accessed on 30 May 2022).
  13. Memon, S.A.; Shaikh, M.A.; Akbar, H. Utilization of rice husk ash as viscosity modifying agent in self compacting concrete. Constr. Build. Mater. 2011, 25, 1044–1048. [Google Scholar] [CrossRef]
  14. Safiuddin, M.; West, J.S.; Soudki, K.A. Hardened properties of self-consolidating high performance concrete including rice husk ash. Cem. Concr. Compos. 2010, 32, 708–717. [Google Scholar] [CrossRef]
  15. Ahmadi, M.A.; Alidoust, O.; Sadrinejad, I.; Nayeri, M. Development of mechanical properties of self compacting concrete contain rice husk ash. Int. J. Comput. Inf. Syst. Sci. Eng. 2007, 1, 259–262. [Google Scholar]
  16. Khayat, K.H.; Roussel, Y. Testing and performance of fiber-reinforced, self-consolidating concrete. Mater. Struct. 2000, 33, 391–397. [Google Scholar] [CrossRef]
  17. Balaguru, P.; Narahari, R.; Patel, M. Flexural toughness of steel fiber reinforced concrete. Mater. J. 1992, 89, 541–546. [Google Scholar]
  18. Richard, P.; Cheyrezy, M. Composition of reactive powder concretes. Cem. Concr. Res. 1995, 25, 1501–1511. [Google Scholar] [CrossRef]
  19. Ferrara, L.; Meda, A. Relationships between fibre distribution, workability and the mechanical properties of SFRC applied to precast roof elements. Mater. Struct. 2006, 39, 411–420. [Google Scholar] [CrossRef]
  20. FERRARA, L. The use of viscosity enhancing admixtures to improve the homogeneity of fibre distribution in steel fibre reinforced concretes. In Brittle Matrix Composites 7; Elsevier: Amsterdam, The Netherlands, 2003; pp. 287–300. [Google Scholar]
  21. Ozyurt, N.; Mason, T.O.; Shah, S.P. Correlation of fiber dispersion, rheology and mechanical performance of FRCs. Cem. Concr. Compos. 2007, 29, 70–79. [Google Scholar] [CrossRef]
  22. Lehner, P.; Konečný, P.; Ponikiewski, T. Comparison of material properties of SCC concrete with steel fibres related to ingress of chlorides. Crystals 2020, 10, 220. [Google Scholar] [CrossRef] [Green Version]
  23. Ding, Y.; You, Z.; Jalali, S. Hybrid fiber influence on strength and toughness of RC beams. Compos. Struct. 2010, 92, 2083–2089. [Google Scholar] [CrossRef]
  24. Ding, Y.; You, Z.; Jalali, S. The composite effect of steel fibres and stirrups on the shear behaviour of beams using self-consolidating concrete. Eng. Struct. 2011, 33, 107–117. [Google Scholar] [CrossRef]
  25. Ahmad, S.; Umar, A. Rheological and mechanical properties of self-compacting concrete with glass and polyvinyl alcohol fibres. J. Build. Eng. 2018, 17, 65–74. [Google Scholar] [CrossRef]
  26. El-Dieb, A.S.; Taha, M.R. Flow characteristics and acceptance criteria of fiber-reinforced self-compacted concrete (FR-SCC). Constr. Build. Mater. 2012, 27, 585–596. [Google Scholar] [CrossRef]
  27. Akcay, B.; Tasdemir, M.A. Mechanical behaviour and fibre dispersion of hybrid steel fibre reinforced self-compacting concrete. Constr. Build. Mater. 2012, 28, 287–293. [Google Scholar] [CrossRef]
  28. Haddadou, N.; Chaid, R.; Ghernouti, Y. Experimental study on steel fibre reinforced self-compacting concrete incorporating high volume of marble powder. Eur. J. Environ. Civ. Eng. 2015, 19, 48–64. [Google Scholar] [CrossRef]
  29. Cunha, V.M.; Barros, J.A.; Sena-Cruz, J. Compression Behaviour of Steel Fibre Reinforced Self-Compacting Concrete: Age Influence and Modeling. 2006. Available online: https://www.academia.edu/5625765/Compression_behaviour_of_steel_fibre_reinforced_self_compacting_concrete_age_influence_and_modeling (accessed on 30 May 2022).
  30. Ahmad, S.; Umar, A. Fibre-reinforced self-compacting concrete: A review. In IOP Conference Series: Materials Science and Engineering; IOP Publishing: Bristol, UK, 2018. [Google Scholar]
  31. Pająk, M.; Ponikiewski, T. Experimental investigation on hybrid steel fibers reinforced self-compacting concrete under flexure. Procedia Eng. 2017, 193, 218–225. [Google Scholar] [CrossRef]
  32. Della, V.P.; Kühn, I.; Hotza, D. Rice husk ash as an alternate source for active silica production. Mater. Lett. 2002, 57, 818–821. [Google Scholar] [CrossRef]
  33. ASTM-C39/C39M-18; Standard Test Method for Compressive Strength of Cylindrical Concrete Specimens. ASTM International: West Conshohocken, PA, USA, 2018.
  34. ASTM-C496/C496M-17; Standard Test Method for Splitting Tensile Strength of Cylindrical Concrete Specimens. ASTM International: West Conshohocken, PA, USA, 2017.
  35. ASTM-C78/C78M-18; Standard Test Method for Flexural Strength of Concrete (Using Simple Beam with Third-Point Loading). ASTM International: West Conshohocken, PA, USA, 2018.
  36. BS-EN-12350–8; Testing Fresh Self-Compacting Concrete. Slump Flow Test. British Standards Institution: London, UK, 2010.
  37. BS-EN-12350–9; Testing Fresh Self-Compacting Concrete. V-Funnel Test. British Standards Institution: London, UK, 2010.
  38. Cunha, V.M.; Barros, J.A.; Sena-Cruz, J. Pullout behavior of steel fibers in self-compacting concrete. J. Mater. Civ. Eng. 2010, 22, 1–9. [Google Scholar] [CrossRef] [Green Version]
  39. Greenough, T.; Nehdi, M. Shear behavior of fiber-reinforced self-consolidating concrete slender beams. ACI Mater. J. 2008, 105, 468. [Google Scholar]
  40. Mehdizadeh, B.; Jahandari, S.; Vessalas, K.; Miraki, H.; Rasekh, H.; Samali, B. Fresh, Mechanical, and Durability Properties of Self-Compacting Mortar Incorporating Alumina Nanoparticles and Rice Husk Ash. Materials 2021, 14, 6778. [Google Scholar] [CrossRef]
  41. Safiuddin, M.; West, J.S.; Soudki, K.A. Properties of freshly mixed self-consolidating concretes incorporating rice husk ash as a supplementary cementing material. Constr. Build. Mater. 2012, 30, 833–842. [Google Scholar] [CrossRef]
  42. Raisi, E.M.; Amiri, J.V.; Davoodi, M.R. Mechanical performance of self-compacting concrete incorporating rice husk ash. Constr. Build. Mater. 2018, 177, 148–157. [Google Scholar] [CrossRef]
  43. Muhammad, A.; Thienel, K.-C.; Sposito, R. Suitability of Blending Rice Husk Ash and Calcined Clay for the Production of Self-Compacting Concrete: A Review. Materials 2021, 14, 6252. [Google Scholar] [CrossRef] [PubMed]
  44. ACI-318–19; Building Code Requirements for Structural Concrete and Commentary. American Concrete Institute: Farmington Hills, MI, USA, 2019.
  45. Ali, T.; Saand, A.; Bangwar, D.K.; Buller, A.S.; Ahmed, Z. Mechanical and Durability Properties of Aerated Concrete Incorporating Rice Husk Ash (RHA) as Partial Replacement of Cement. Crystals 2021, 11, 604. [Google Scholar] [CrossRef]
  46. Rahman, M.E.; Muntohar, A.S.; Pakrashi, V.; Nagaratnam, B.H.; Sujan, D. Self compacting concrete from uncontrolled burning of rice husk and blended fine aggregate. Mater. Des. 2014, 55, 410–415. [Google Scholar] [CrossRef]
  47. Sua-Iam, G.; Makul, N. Utilization of limestone powder to improve the properties of self-compacting concrete incorporating high volumes of untreated rice husk ash as fine aggregate. Constr. Build. Mater. 2013, 38, 455–464. [Google Scholar] [CrossRef]
  48. Atan, M.N.; Awang, H. The compressive and flexural strengths of self-compacting concrete using raw rice husk ash. J. Eng. Sci. Technol. 2011, 6, 720–732. [Google Scholar]
  49. Pai, B.H.V.; Nandy, M.; Krishnamoorthy, A.; Sarkar, P.K.; George, P. Comparative study of self compacting concrete mixes containing fly ash and rice husk ash. Am. J. Eng. Res. 2014, 3, 150–154. [Google Scholar]
Figure 1. Grading curve of fine and coarse aggregate used in this study.
Buildings 12 01024 g001
Figure 2. Waste galvanized copper wire fibers.
Buildings 12 01024 g002
Figure 3. Rice husk powder (before processing into RHA).
Buildings 12 01024 g003
Figure 4. Experimental setup of fresh concrete test, (a) slump flow test, (b) J-ring test, (c) V-funnel test.
Buildings 12 01024 g004
Figure 5. Experimental setup of the hardened concrete test, (a) compressive strength test, (b) splitting tensile strength test, (c) flexural strength test.
Buildings 12 01024 g005
Figure 6. Slump flow value and T50 time period for different type of SCC mix.
Buildings 12 01024 g006
Figure 7. J-ring flow and blocking index parameter for various types of SCC mixes.
Buildings 12 01024 g007
Figure 8. Percentage changes in flow values for different SCC types.
Buildings 12 01024 g008
Figure 9. Increasing viscosity with the standard limit of different SCC mixes.
Buildings 12 01024 g009
Figure 10. Percentage changes in both flow time parameters, TV and T50.
Buildings 12 01024 g010
Figure 11. Compressive strength results for various types of SCC mixes.
Buildings 12 01024 g011
Figure 12. Percentage changes of compressive strength with varying wire percentage.
Buildings 12 01024 g012
Figure 13. Splitting tensile strength value of different types of SCC mixes.
Buildings 12 01024 g013
Figure 14. Percentage changes of tensile strength with varying wire percentage.
Buildings 12 01024 g014
Figure 15. Flexural strength value of different types of SCC mixes.
Buildings 12 01024 g015
Figure 16. Percentage changes of flexural strength with varying wire percentage.
Buildings 12 01024 g016
Figure 17. Crack on the specimens from various test, (a) compressive strength, (b) split-tensile strength, (c) flexural strength.
Buildings 12 01024 g017
Figure 18. The mechanical properties of several SCC mixes comparison at 7 and 28 days.
Buildings 12 01024 g018
Figure 19. Relation between compressive and splitting tensile strength.
Buildings 12 01024 g019
Figure 20. The relationship between flexural and compressive strength.
Buildings 12 01024 g020
Table 1. Chemical Composition of RHA, OPC, and Fly Ash (FA).
ConstituentsWeight, %
RHAOPCFA
Silica (SiO2)75.2421.561.31
Alumina (Al2O3)2.184.7430.39
Ferric oxide (Fe2O3)2.244.301.24
Calcium oxide (CaO)2.4263.491.31
Magnesium oxide (MgO)2.281.020.89
Sulfur trioxide (SO3)0.122.930.31
Sodium oxide (Na2O)0.860.300.39
Potassium oxide (K2O)1.720.780.42
Loss of ignition (LOI)12.99---3.27
Table 2. Physical properties of aggregates.
PropertiesSandStone Chips
Moisture content19.4%14.7%
Specific gravity2.432.65
Void ratio44.97%33.98%
Fineness modulus2.985.56
Loose bulk density (kg/m3)12001575.6
Compacted bulk density (kg/m3)1353.51780.4
Table 3. Physical properties of waste galvanized copper wire fibers.
PropertiesValue Obtained
Length of fiber0.5–1.0 inch
Diameter0.016 inch (0.40 mm)
Average aspect ratio50
Tensile strength400 MPa
Appearance formBrown, bright, undulated along length
Modulus of elasticity110 GPa
Table 4. Physical properties of rice hush ash.
PropertiesValue Obtained
Mean particle size (µm)6.27
ColorGrey
Specific surface area (m2/g)36.47
Fineness: passing 45 µm (%)91
Specific gravity2.08
Table 5. Mixing proportion of material.
MixCement
(kg/m3)
FA
(kg/m3)
Sand
(kg/m3)
CA
(kg/m3)
Wire Fiber
(%)
Wire Fiber
(kg/m3)
RHA
(%)
RHA
(kg/m3)
W/BWater
(kg/m3)
SP
(%)
M040010080090000000.321601.63
M0.53921008009000.5012280.321601.63
M0.753921008009000.7518280.321601.63
M13921008009001.0024280.321601.63
FA = Fly Ash, CA = Coarse aggregate, RHA = Rice husk ash, W/B = Water to binder ratio, SP = Super plasticizer (percent to cement weight).
Table 6. Fresh properties’ results of all SCC mixes.
MixSlump Flow
(650–800 mm)
T500
(2–5 s)
J-Ring Slump Flow
(600–750 mm)
Blocking Index,
BJ (0–10)
V-Funnel Time, TV
(6–12 s)
Remarks
M07302.76507.254.9Low viscosity
M0.57003.16208.276.12Result satisfied
M0.756904.26009.56.65Result satisfied
M16854.5580127.25Low passing ability
Table 7. Compressive strength test results summary.
MixDayMean Strength (MPa)Standard DeviationCoefficient of VariationStandard Error95% Confidence Interval
Lower limit (MPa)Upper limit (MPa)
M0715.471.200.0770.6912.5018.44
2822.624.300.192.4812.0033.29
M0.579.130.350.0380.208.2710.00
2817.992.000.111.1513.0423.00
M0.7579.700.2150.02170.129.4010.40
2818.092.100.121.2012.9223.25
M1710.800.2550.0250.159.4511.70
2819.700.9510.0480.5517.3322.07
Table 8. Tensile strength test results summary.
MixDayMean Strength (MPa)Standard DeviationCoefficient of VariationStandard Error95% Confidence Interval
Lower Limit (MPa)Upper Limit (MPa)
M072.810.170.060.0982.403.23
283.630.300.0830.172.904.36
M0.572.410.170.070.0981.982.83
282.610.050.020.032.382.64
M0.7572.570.110.0440.062.242.76
282.760.200.0720.112.303.23
M172.620.140.0530.082.302.96
282.830.160.050.0922.433.22
Table 9. Flexural strength test results summary.
MixDayMean Strength (MPa)Standard DeviationCoefficient of VariationStandard Error95% Confidence Interval
Lower Limit (MPa)Upper Limit (MPa)
M075.080.420.080.244.046.11
285.730.300.0520.175.006.46
M0.574.080.150.040.093.704.47
284.720.200.0420.124.205.23
M0.7574.810.150.030.094.405.19
285.210.0220.00430.0125.005.96
M175.000.350.070.204.105.86
285.400.250.050.144.796.10
Publisher’s Note: MDPI stays neutral with regard to jurisdictional claims in published maps and institutional affiliations.

