
Research on Thermal Response Behavior of the Intumescent Coating at High Temperature: An Experimental and Numerical Study

Abstract
:1. Introduction
2. Experiments
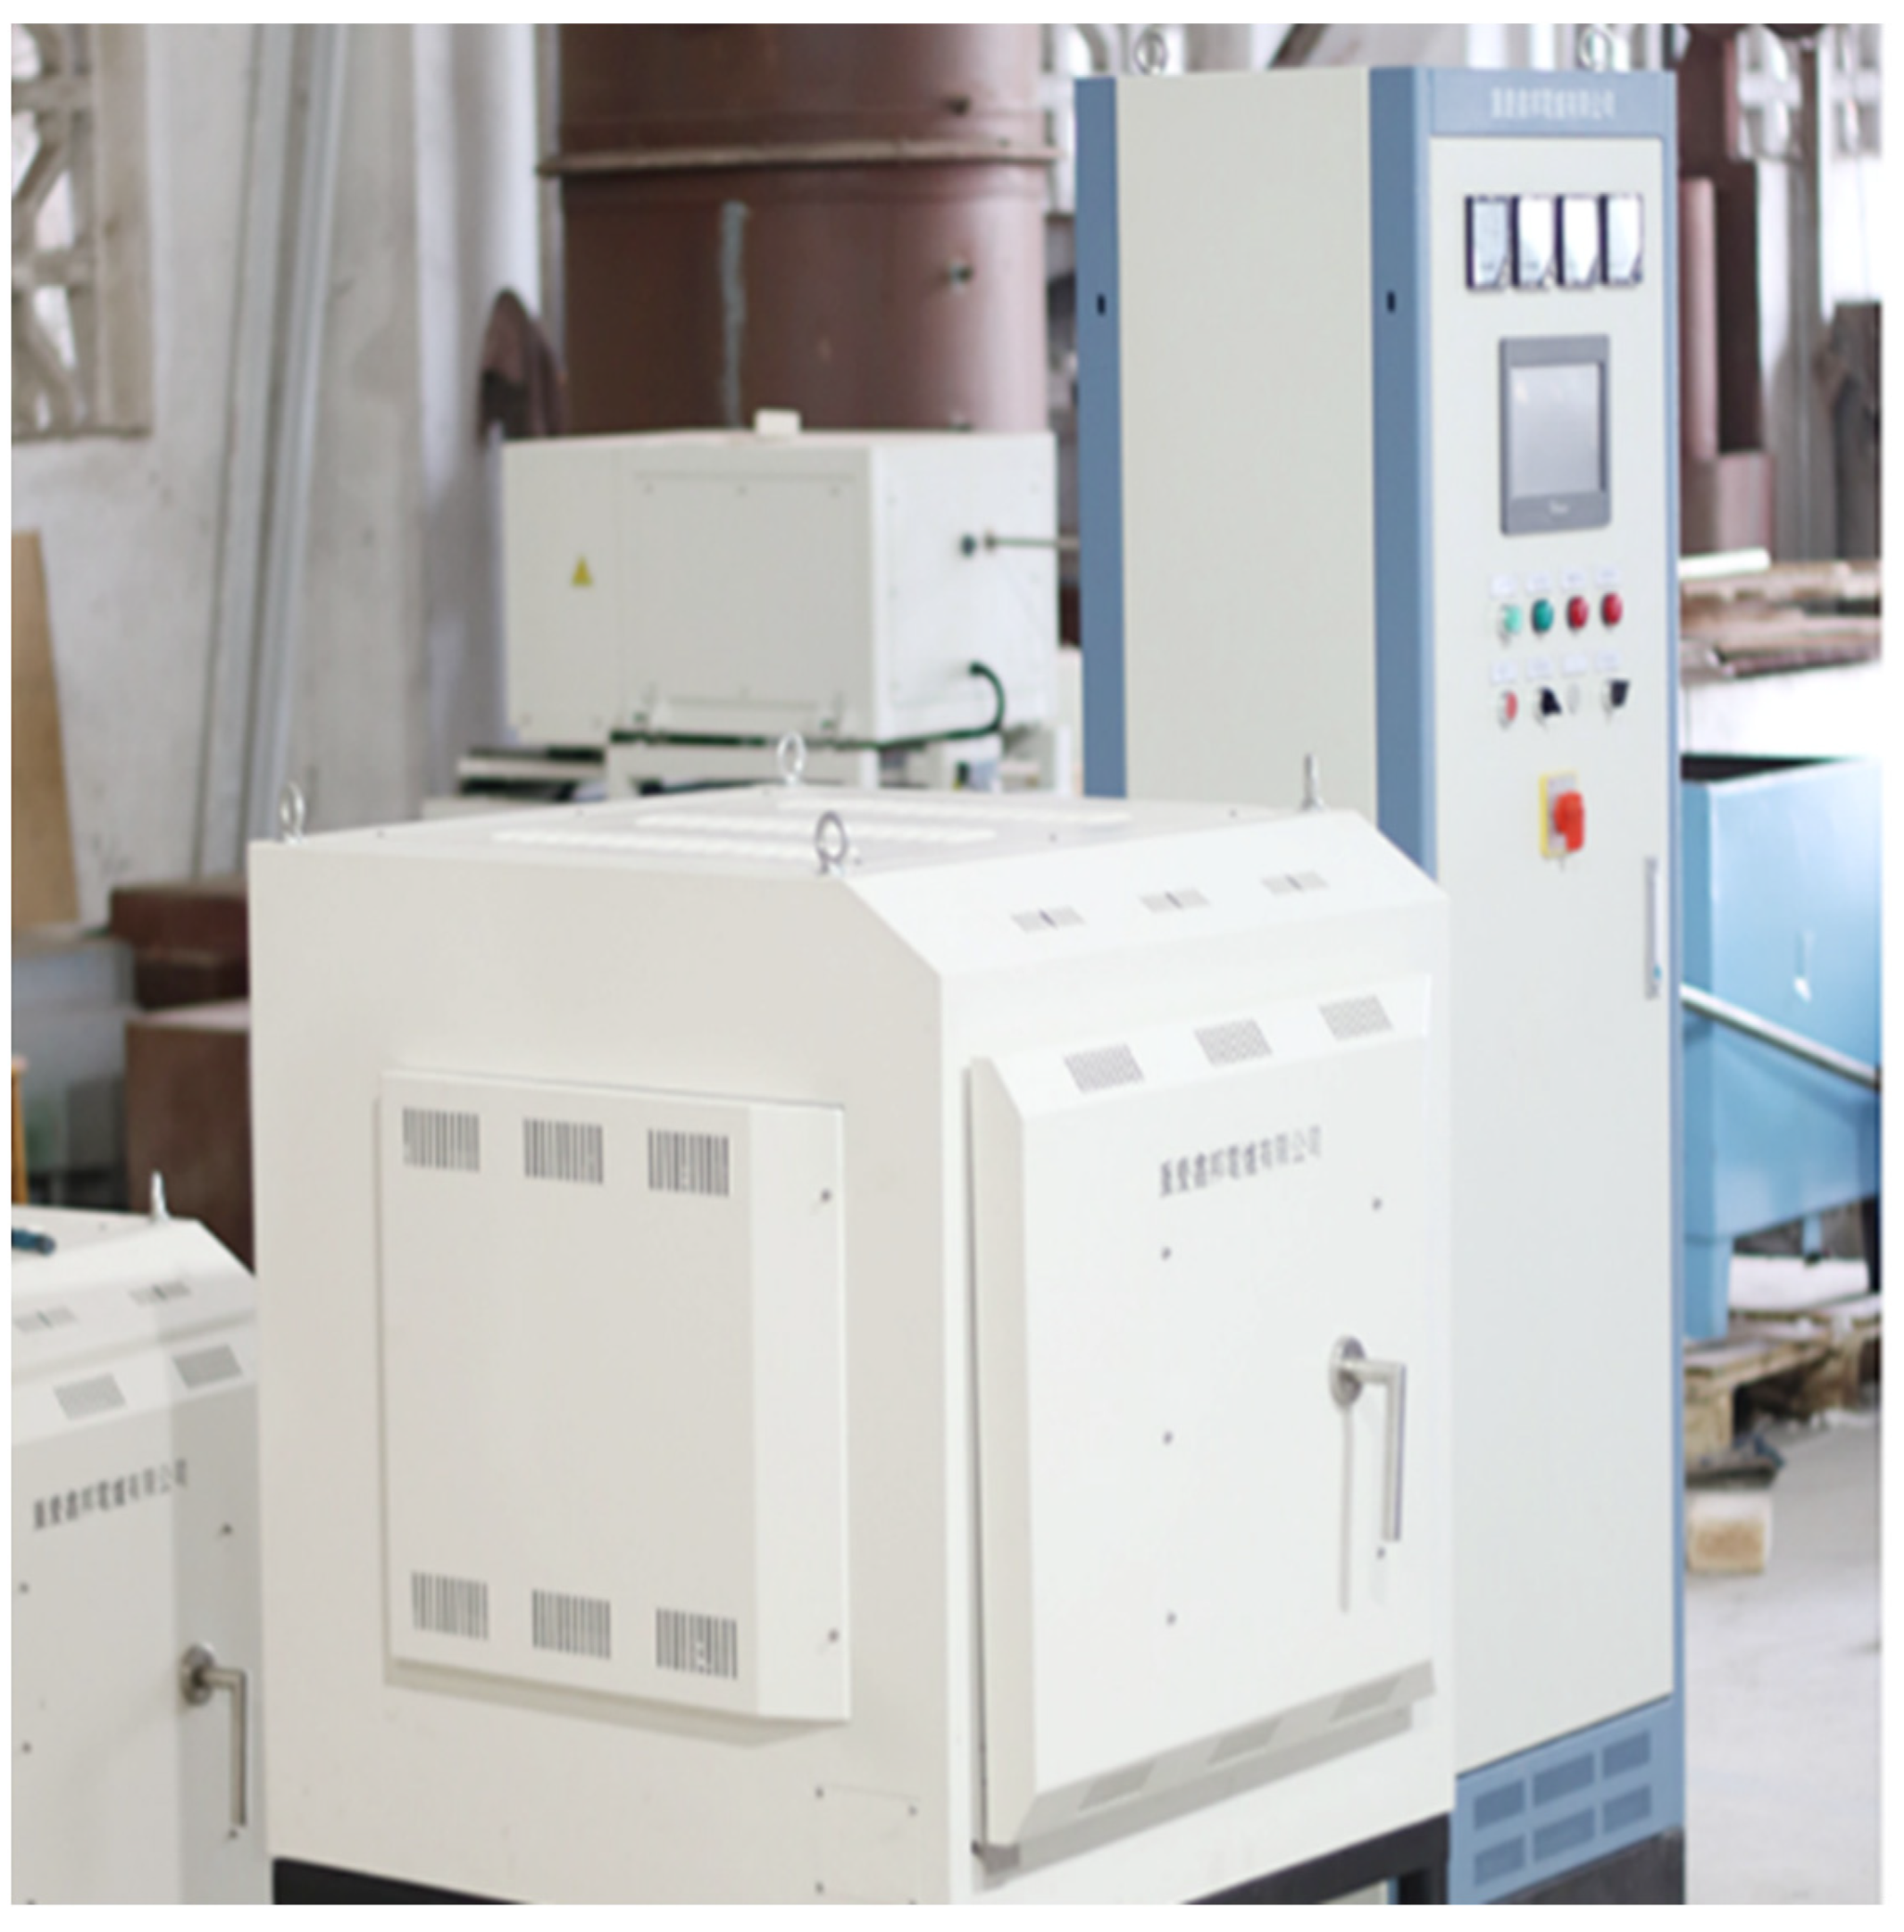
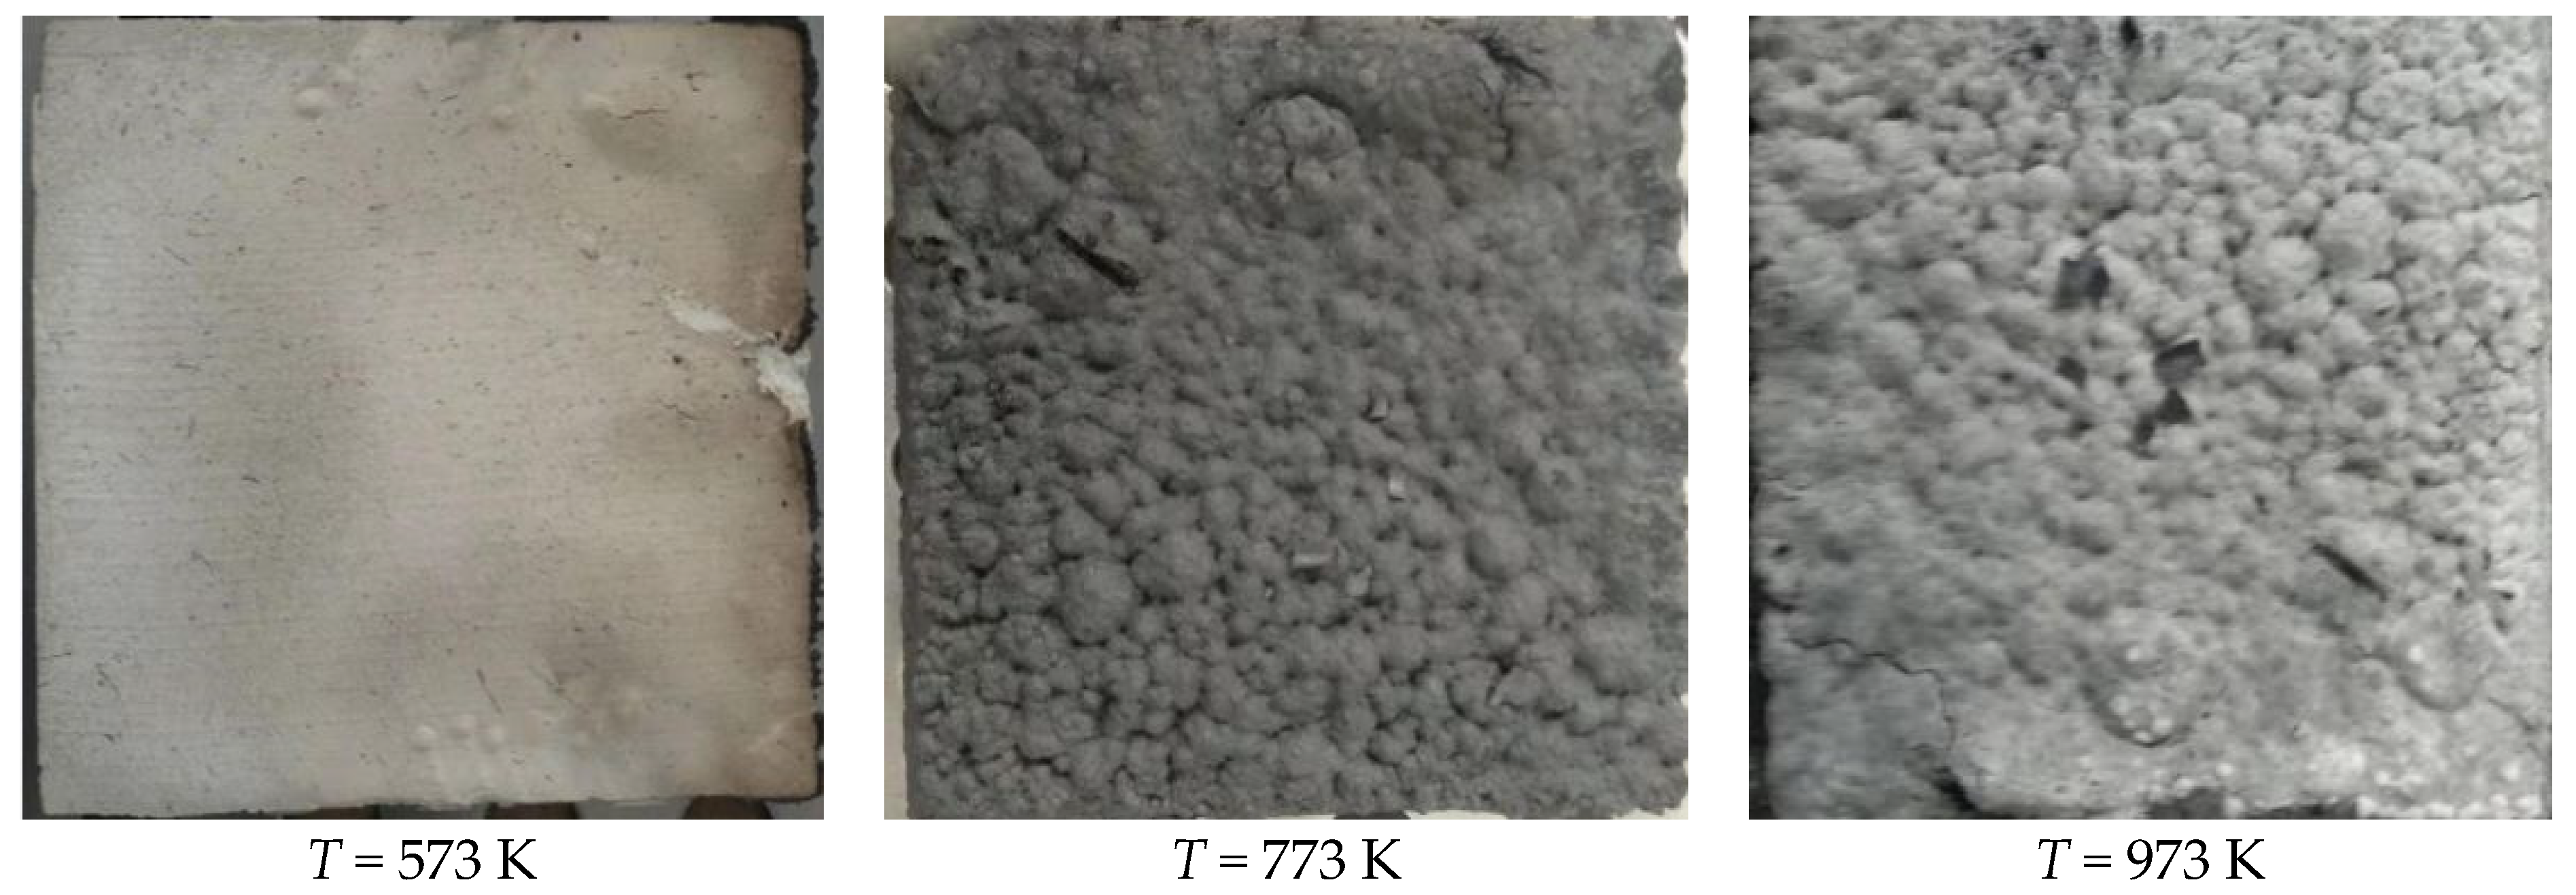
2.1. High-Temperature Expansion Performance Experiment
- (a)
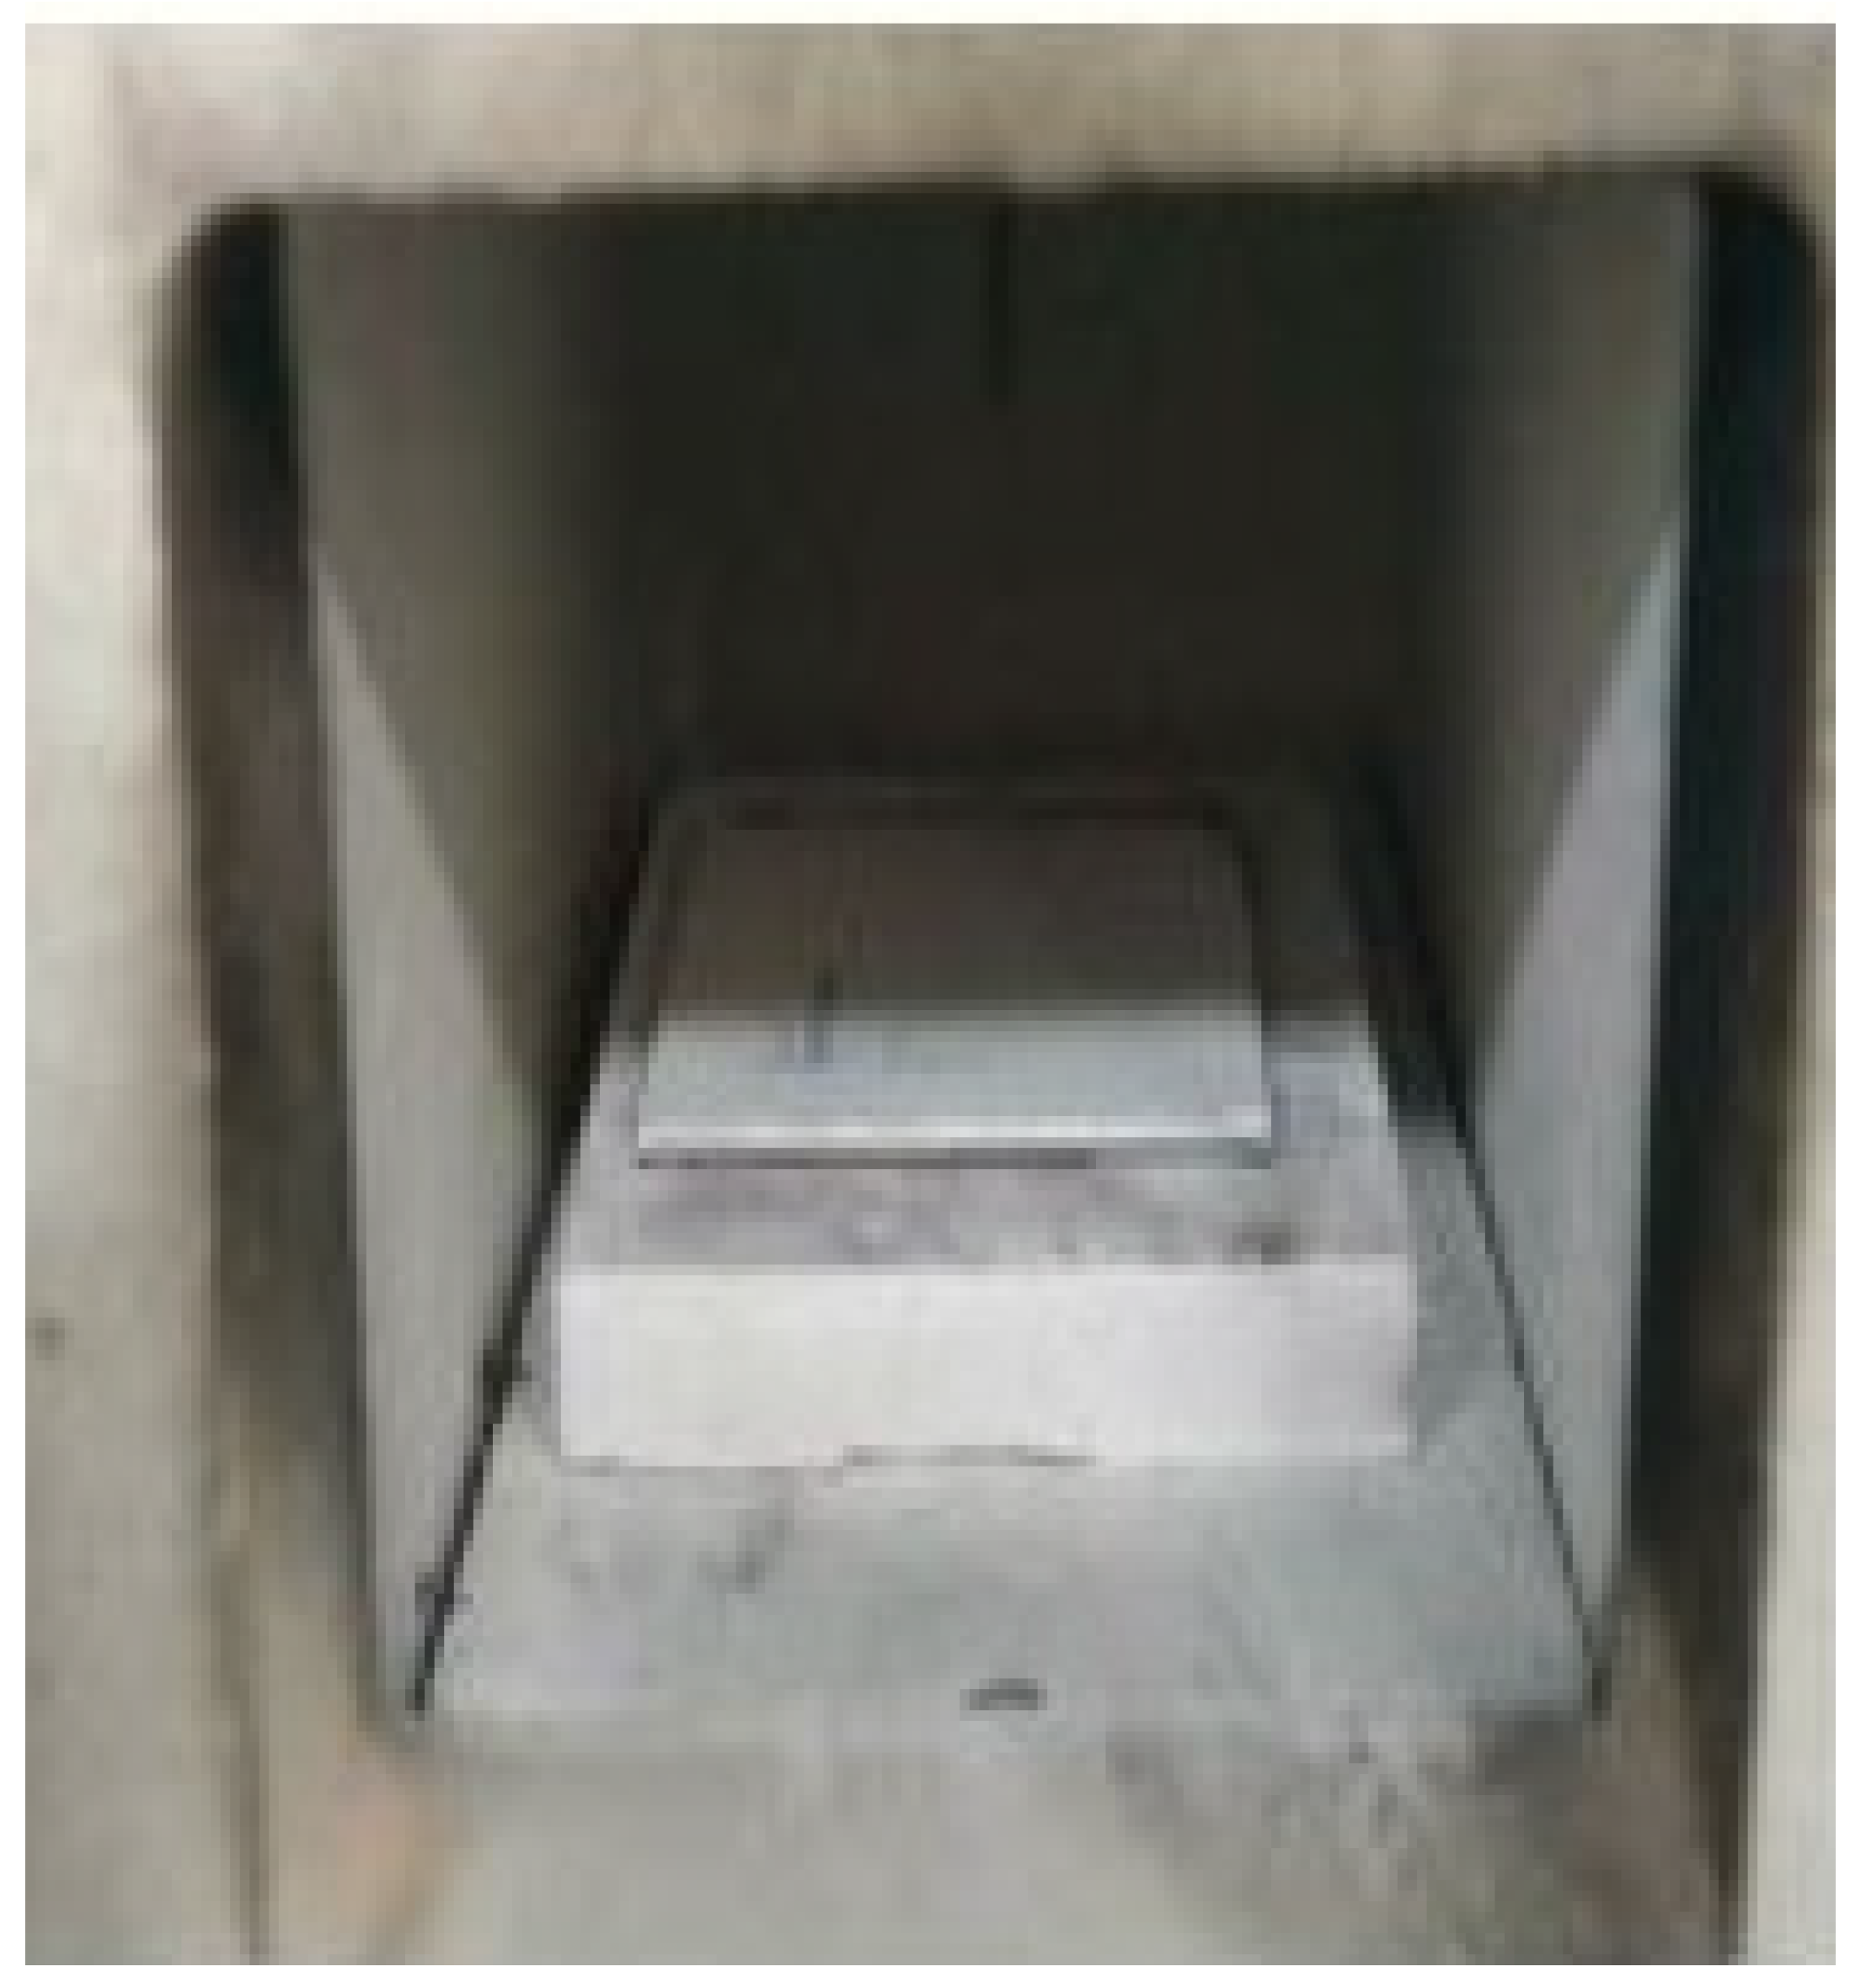
- The specimen is placed on the refractory brick and surrounded by a certain amount of sponge to prevent heat dissipation, as shown in Figure 2.
- (b)
- The temperature of the furnace is set according to the working conditions and maintained for 1800 s to ensure full expansion at this temperature.
- (c)
- After cooling, the expanded specimen is taken out and the thickness is measured by vernier caliper.
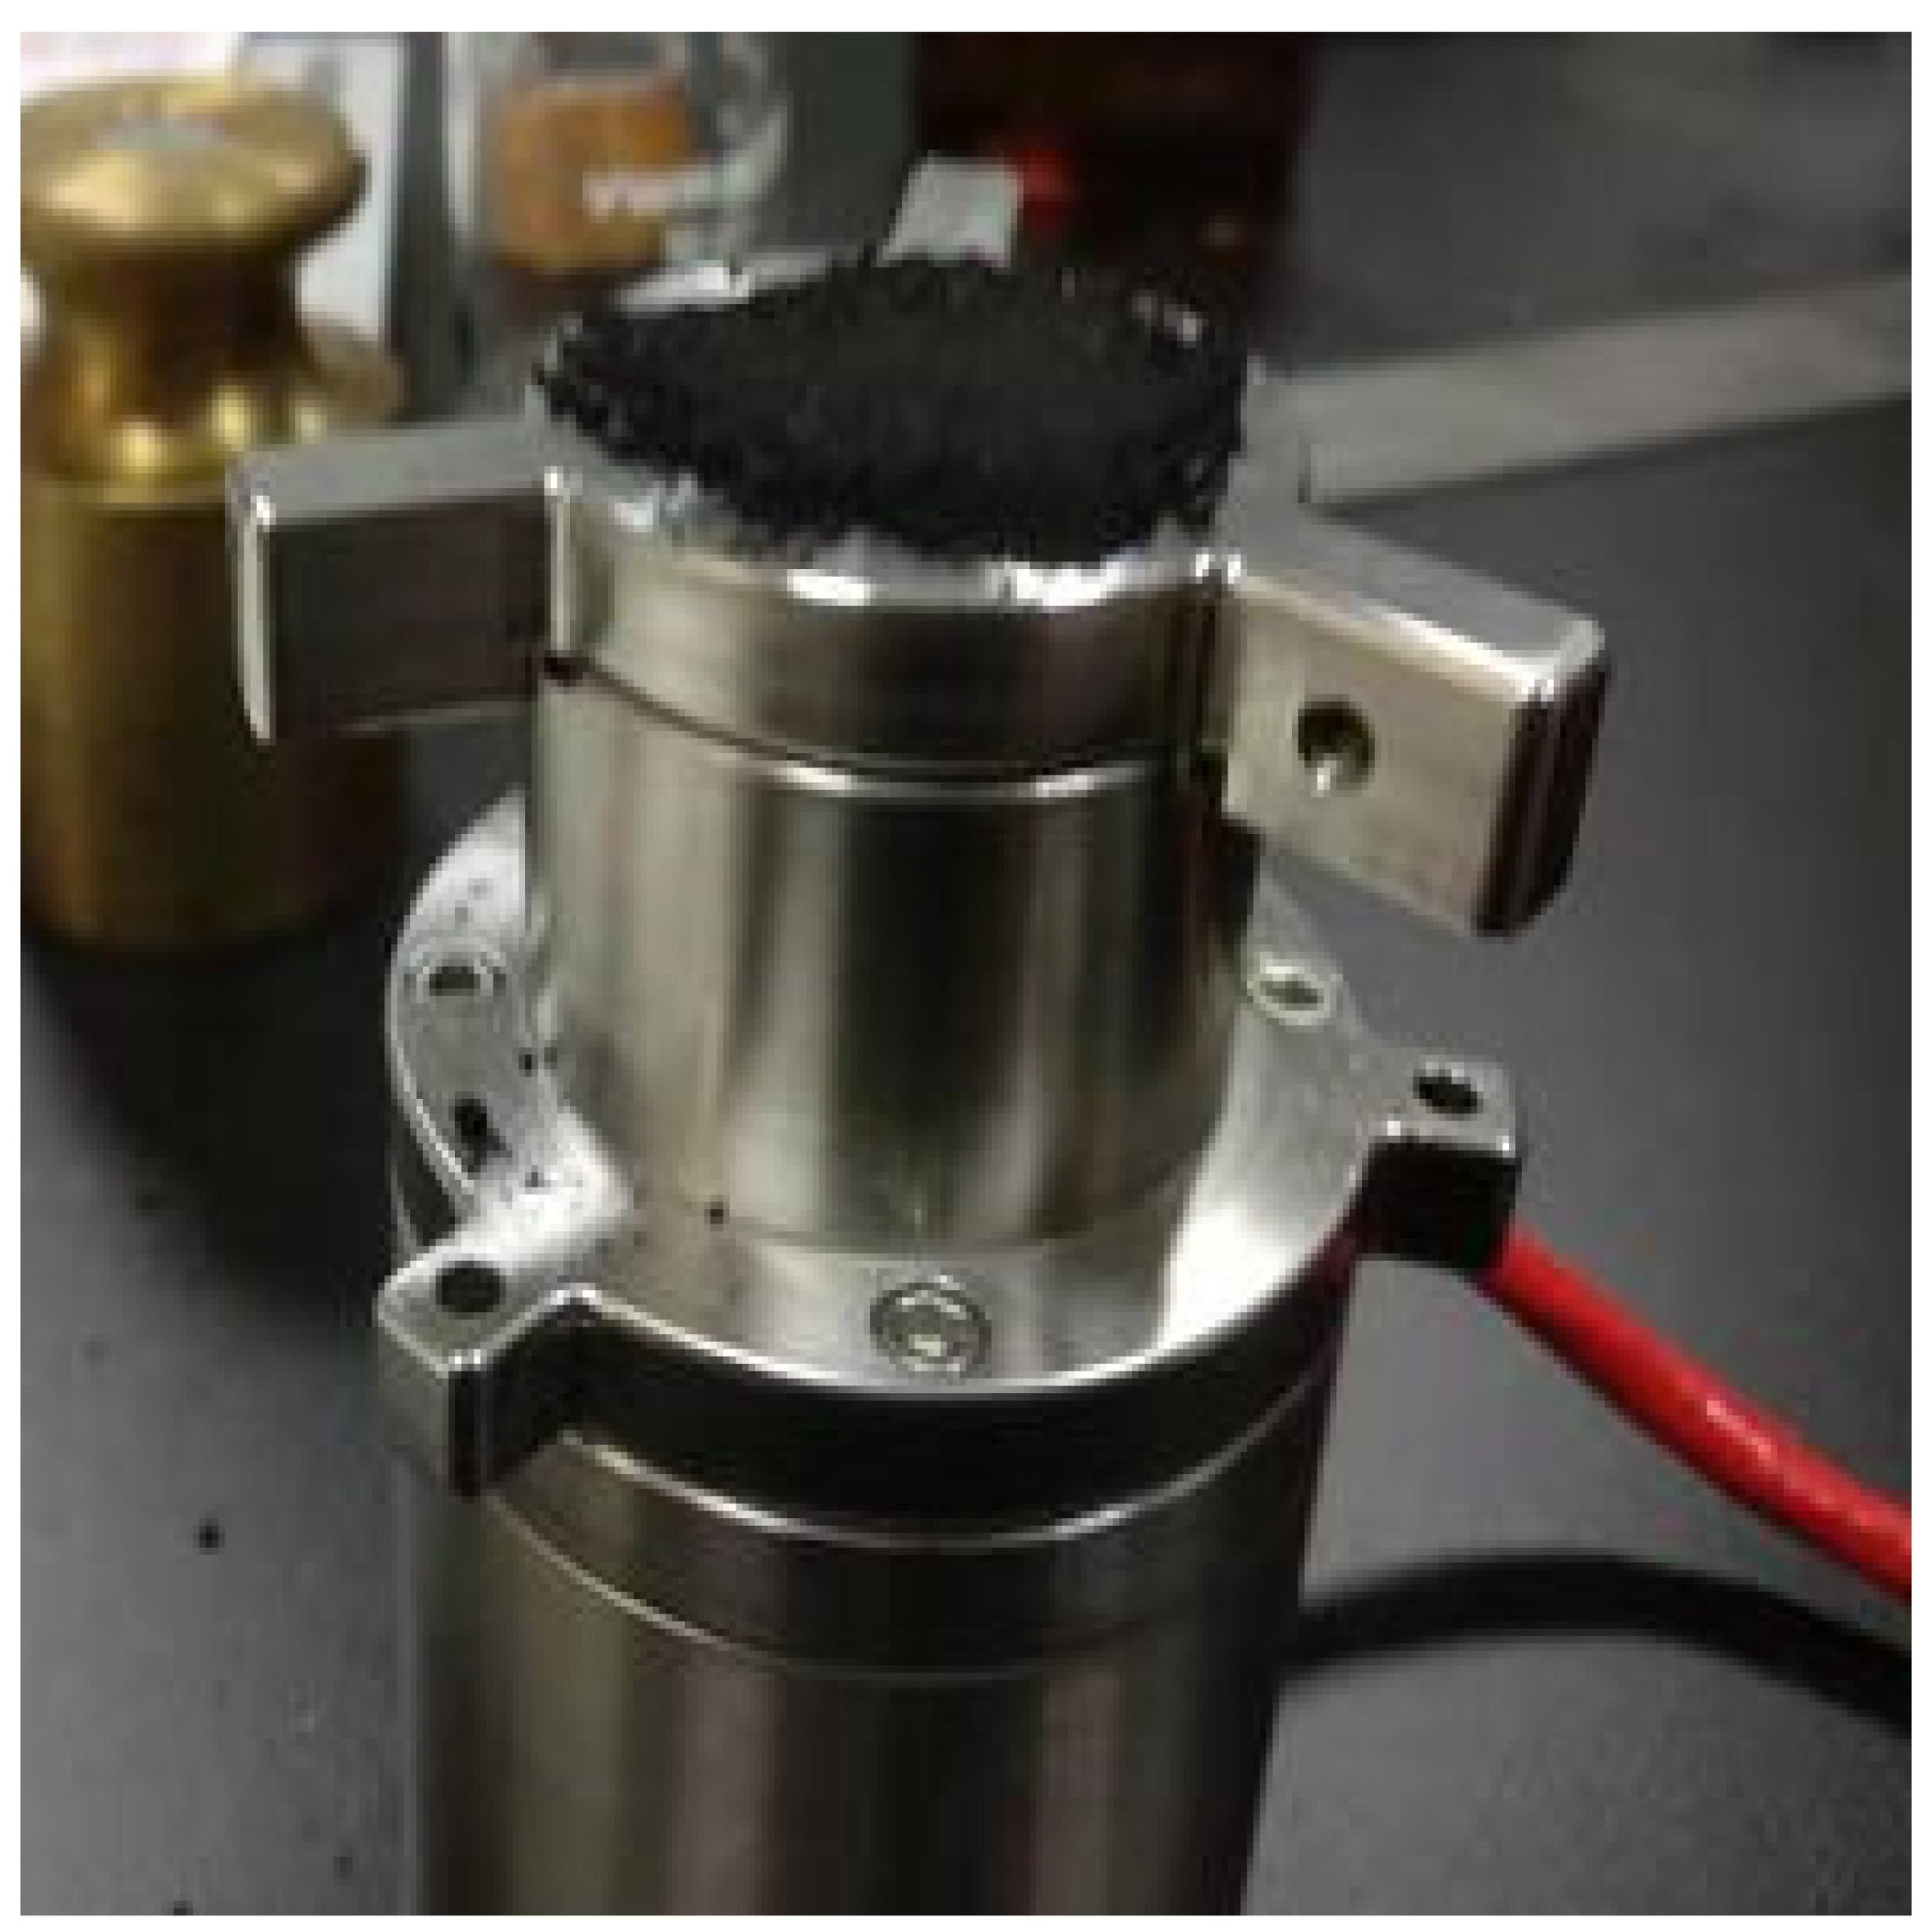
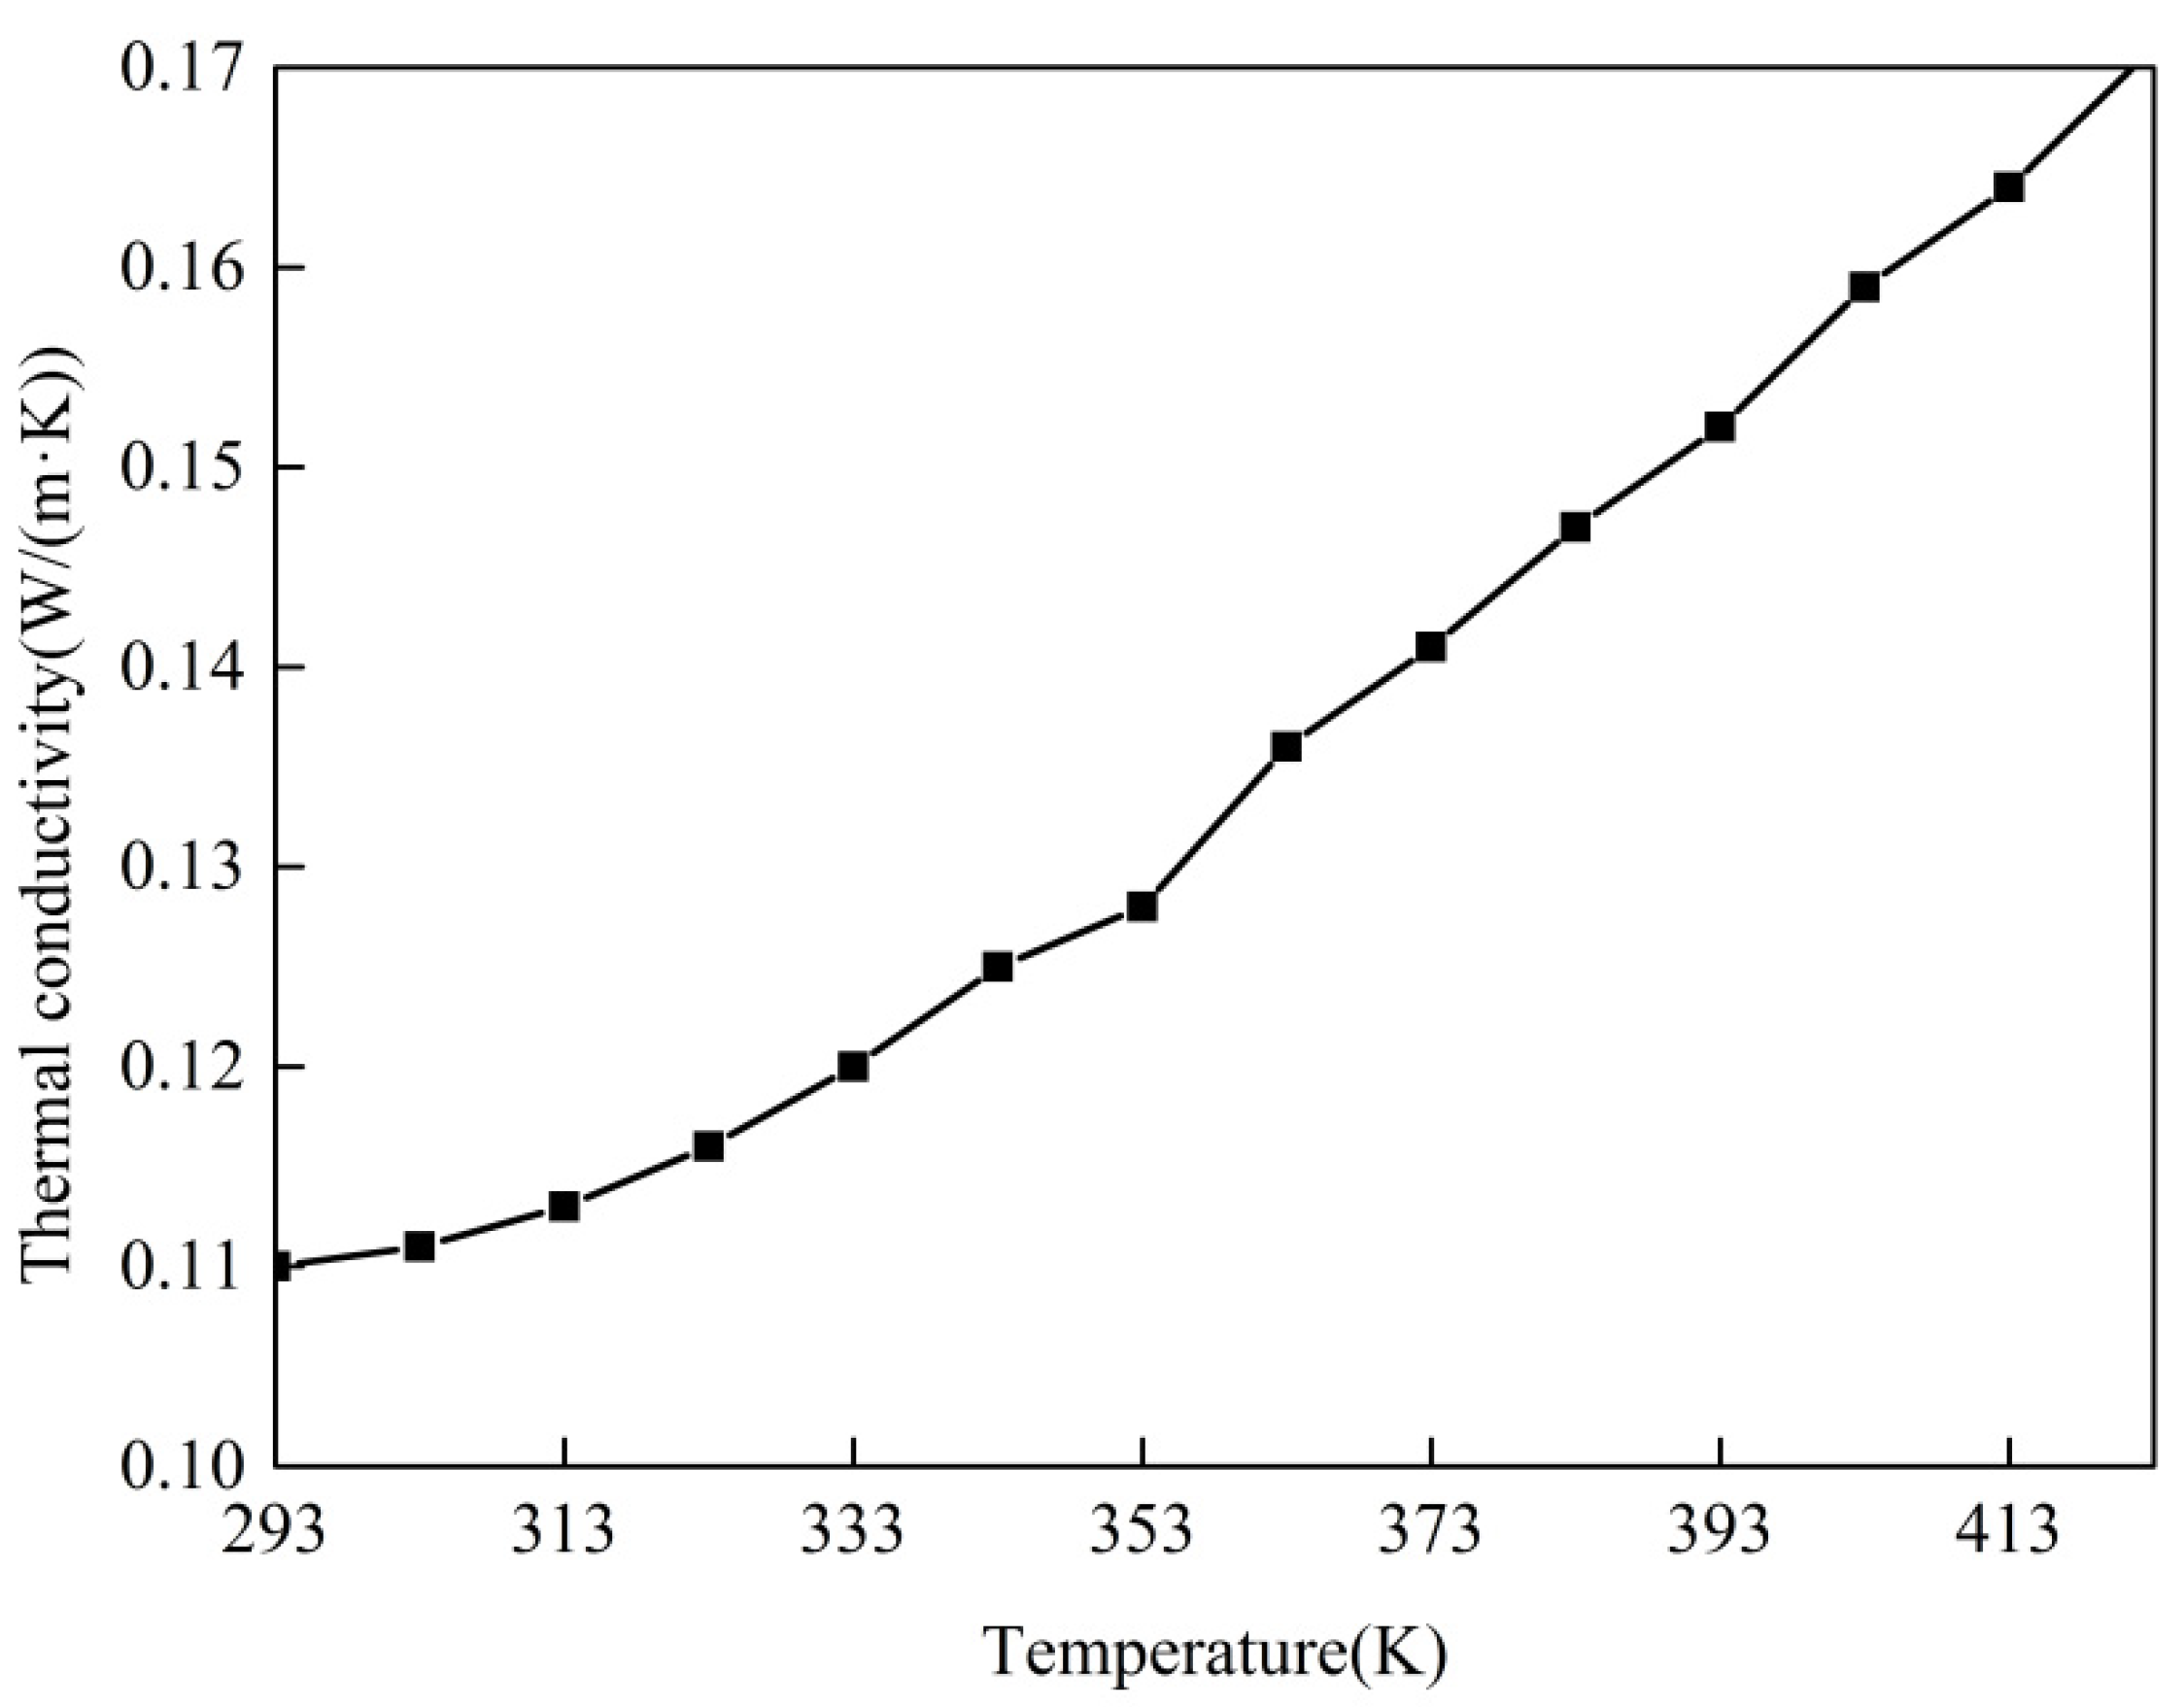
2.2. Thermal Conductivity Experiment
2.3. Density and Porosity Experiment
3. Numerical Simulation
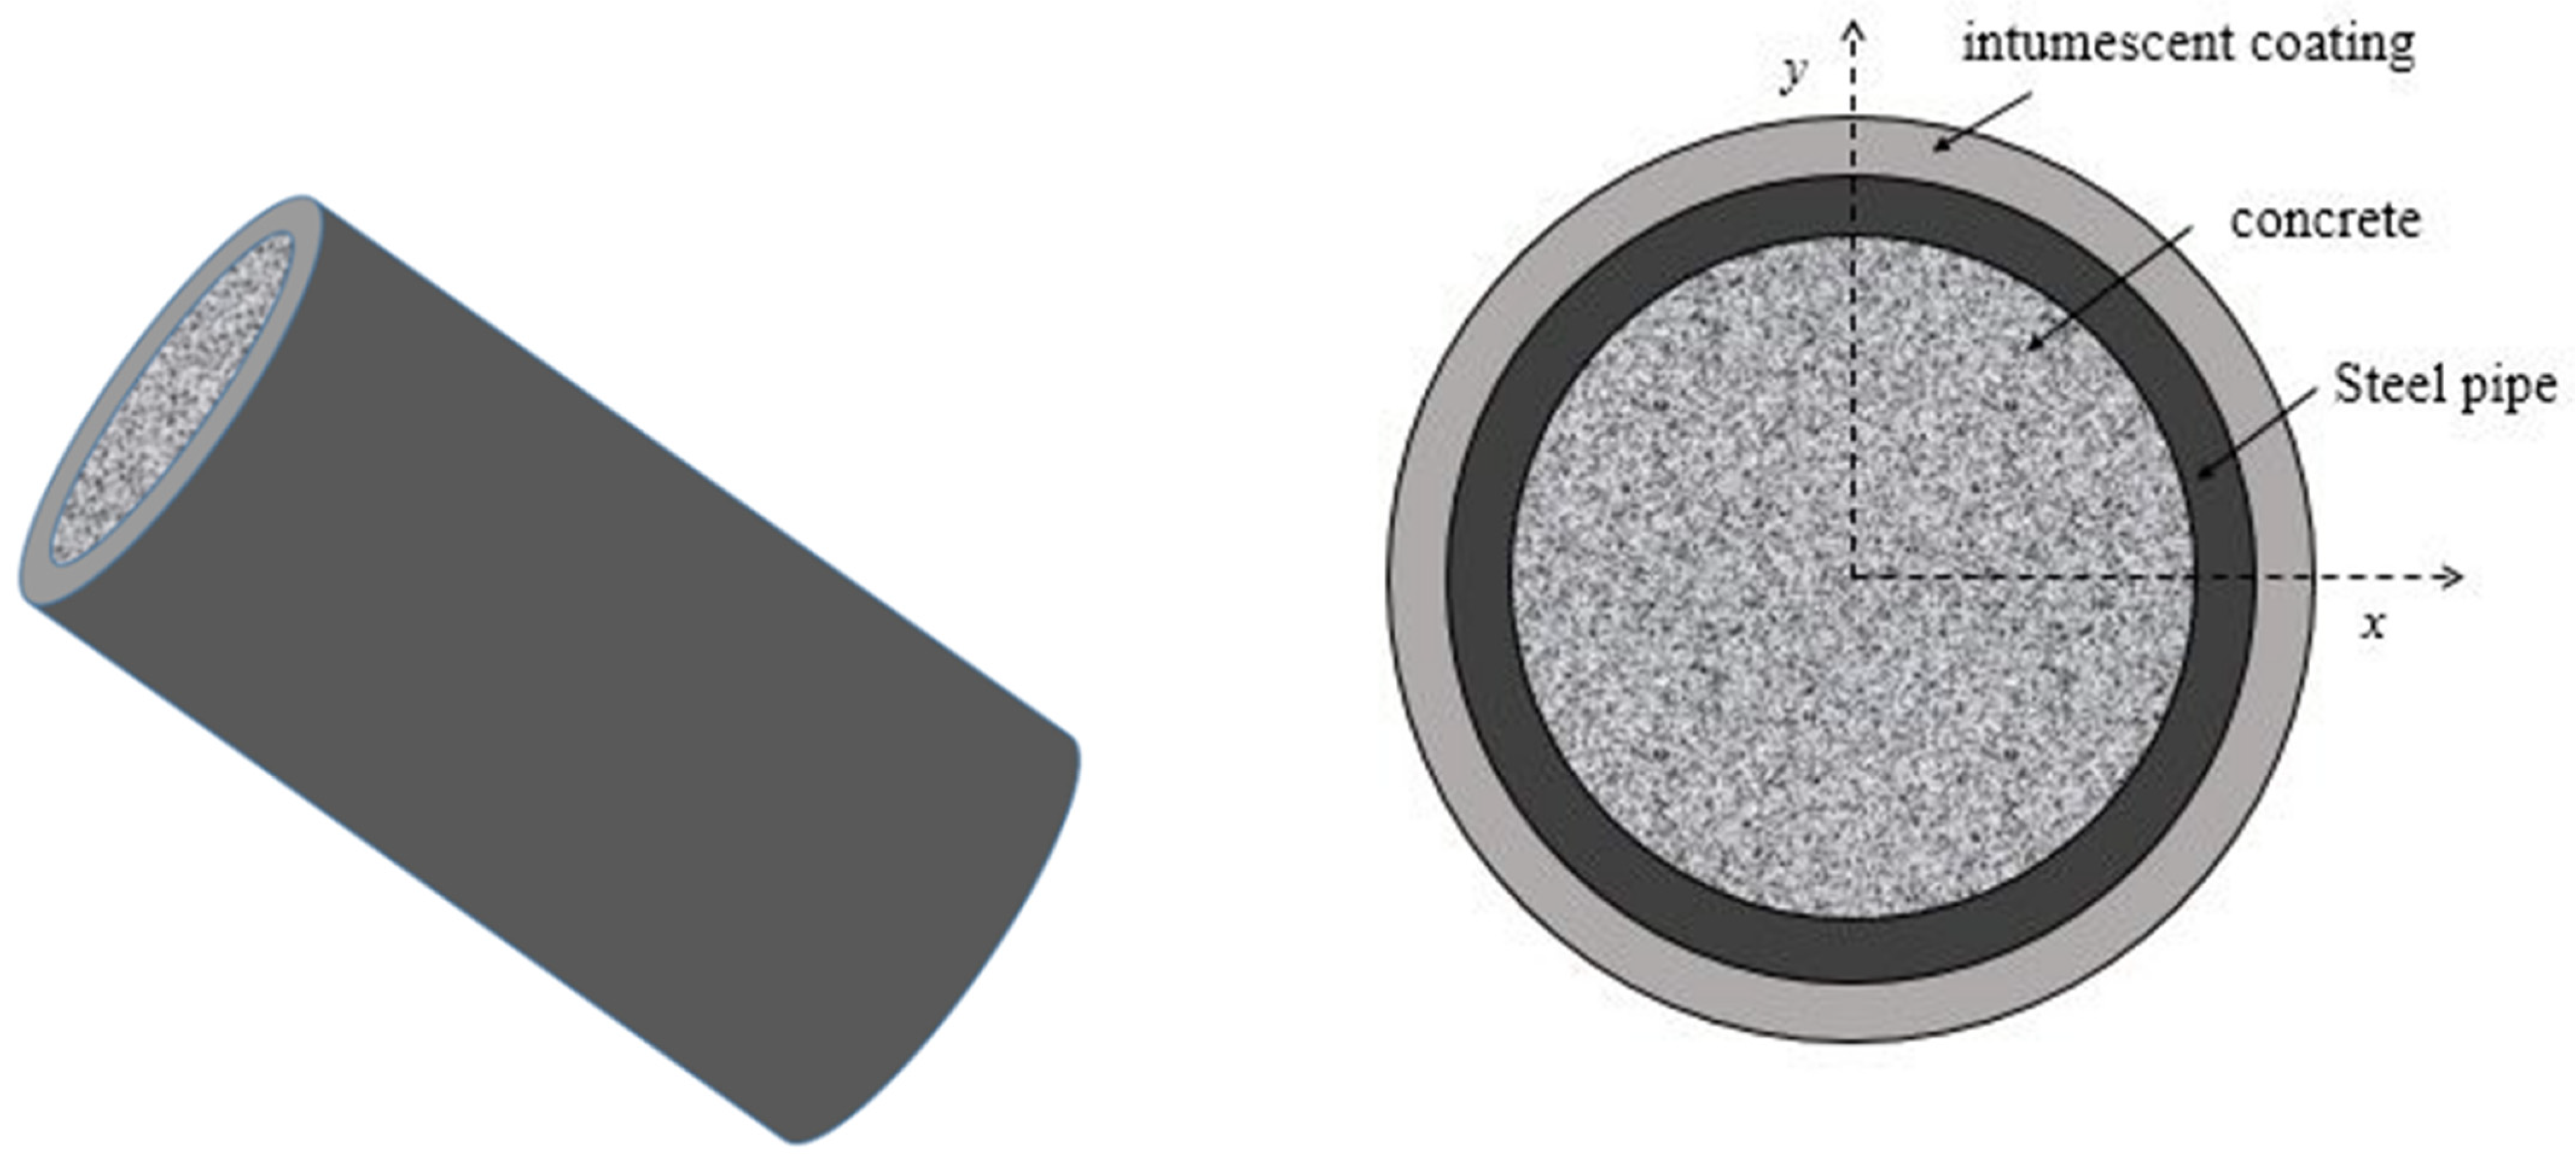
3.1. Physical Model
3.2. Governing Equation
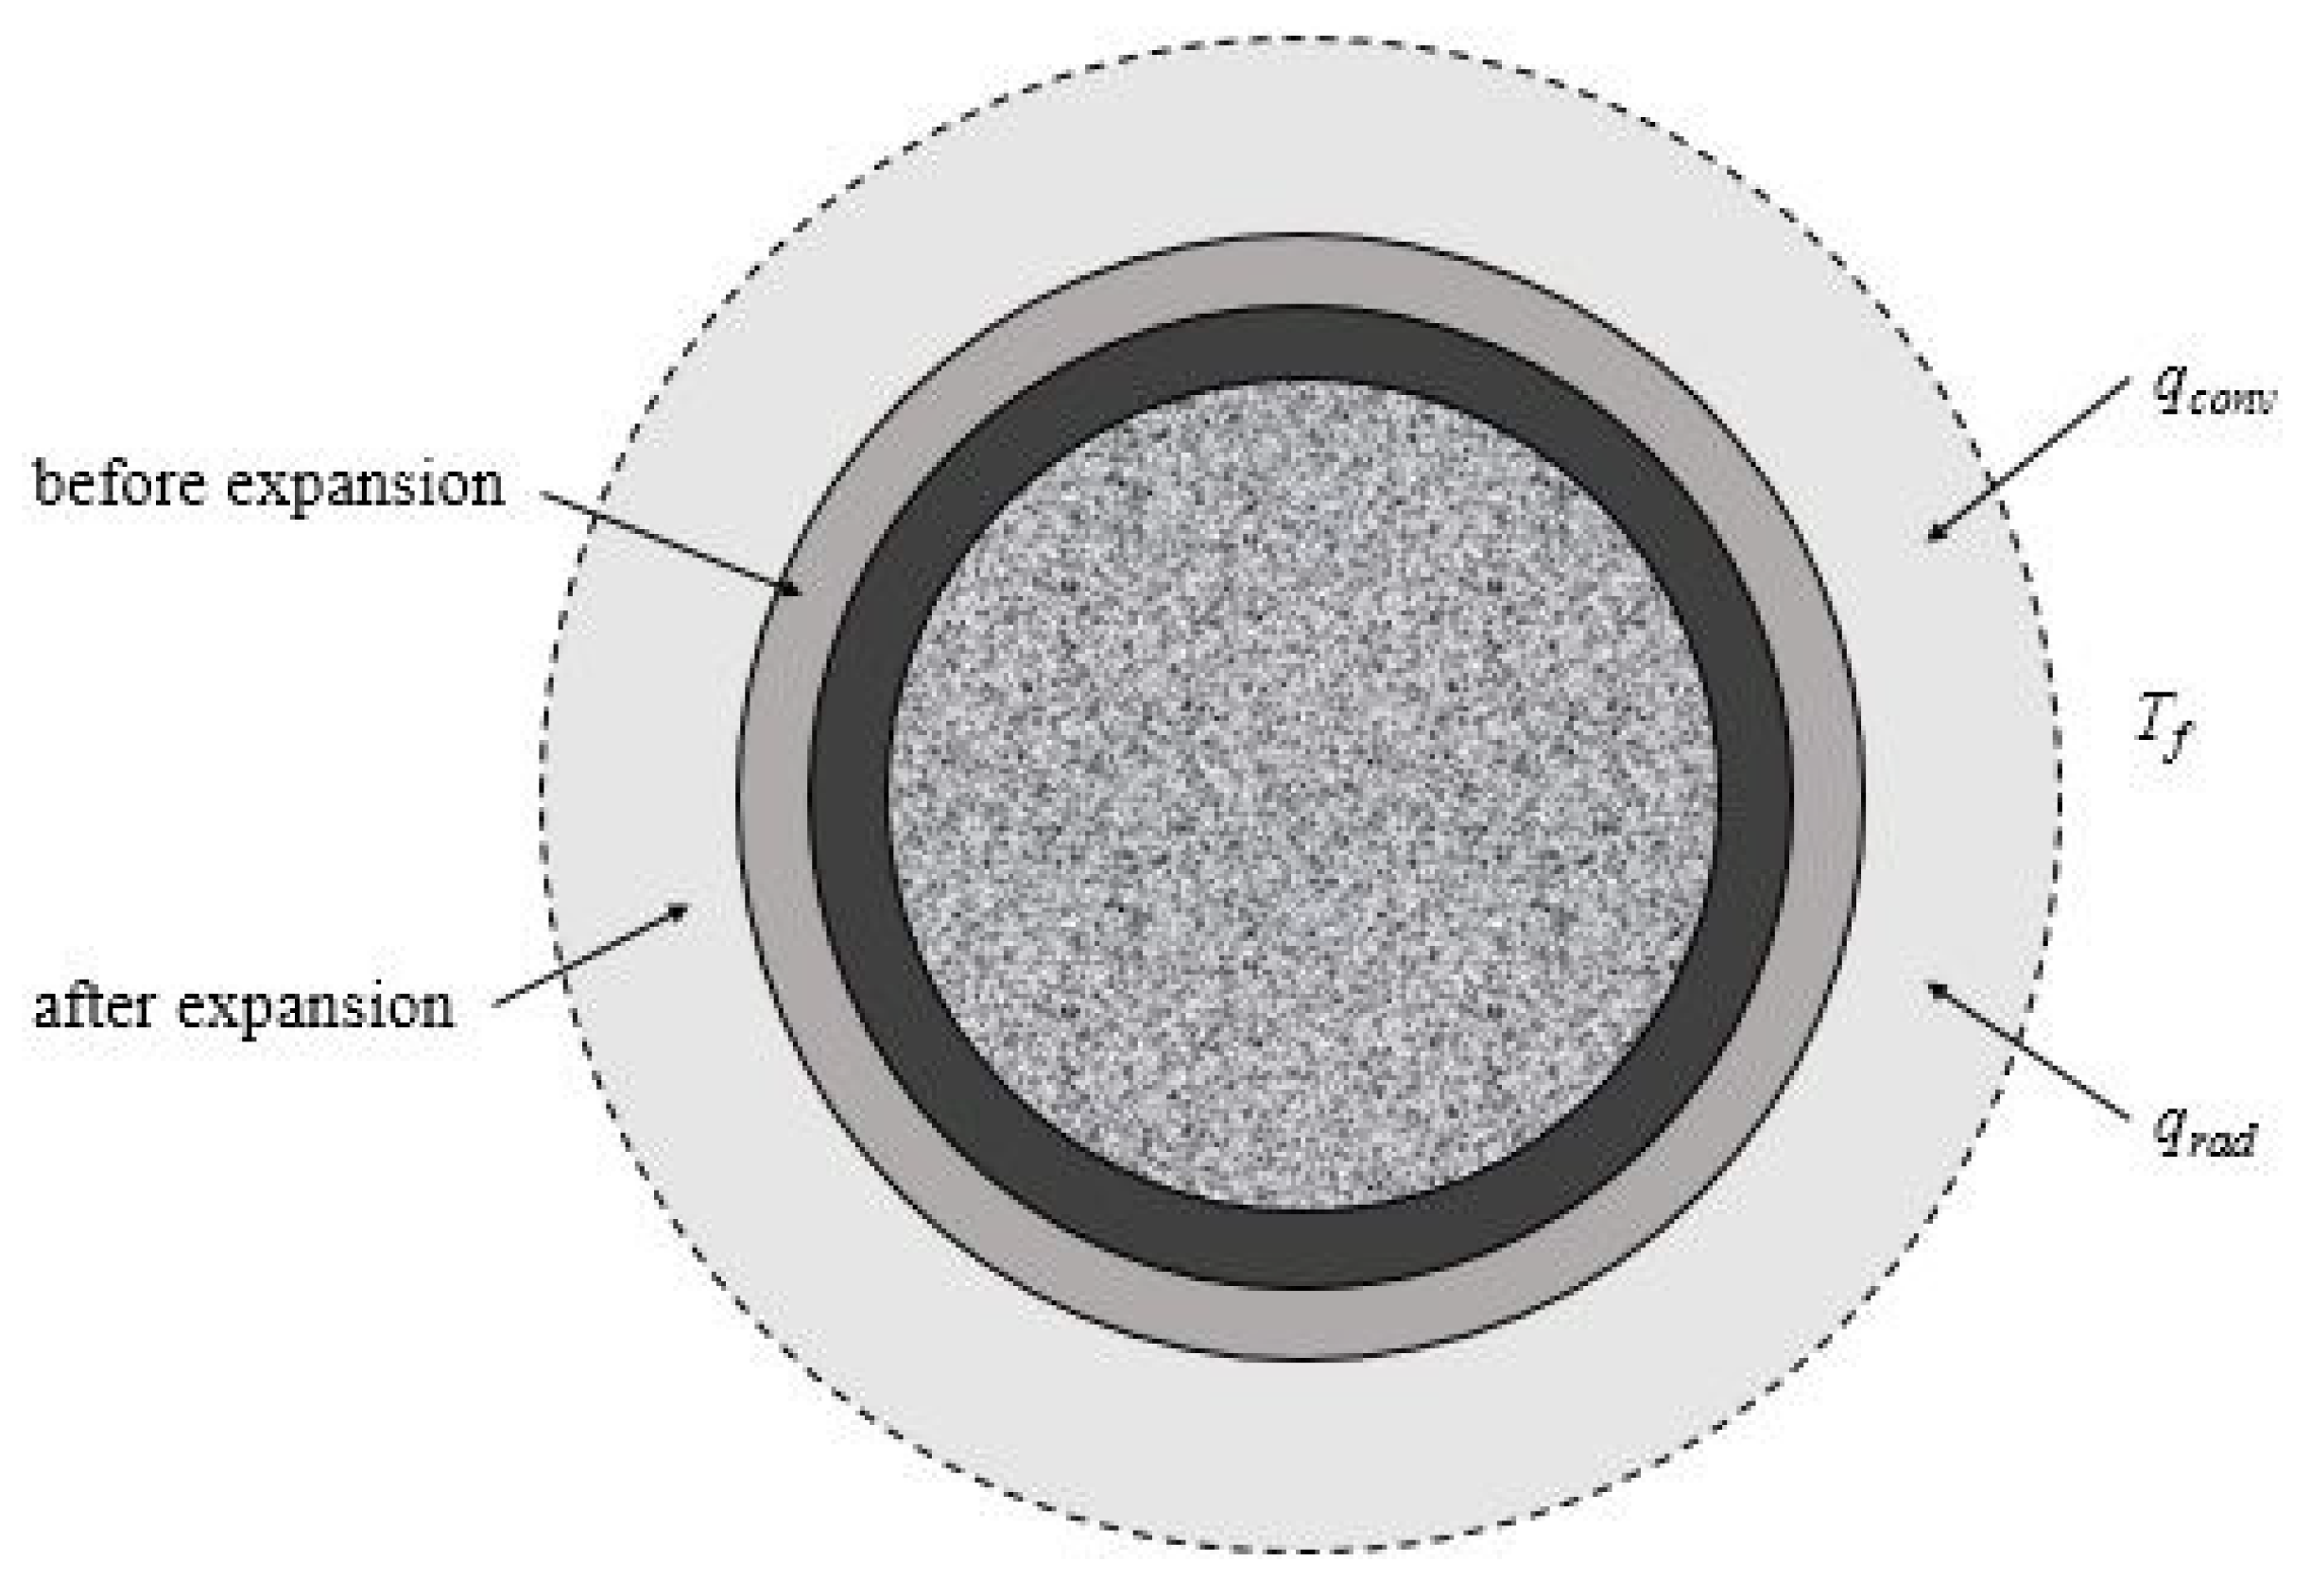
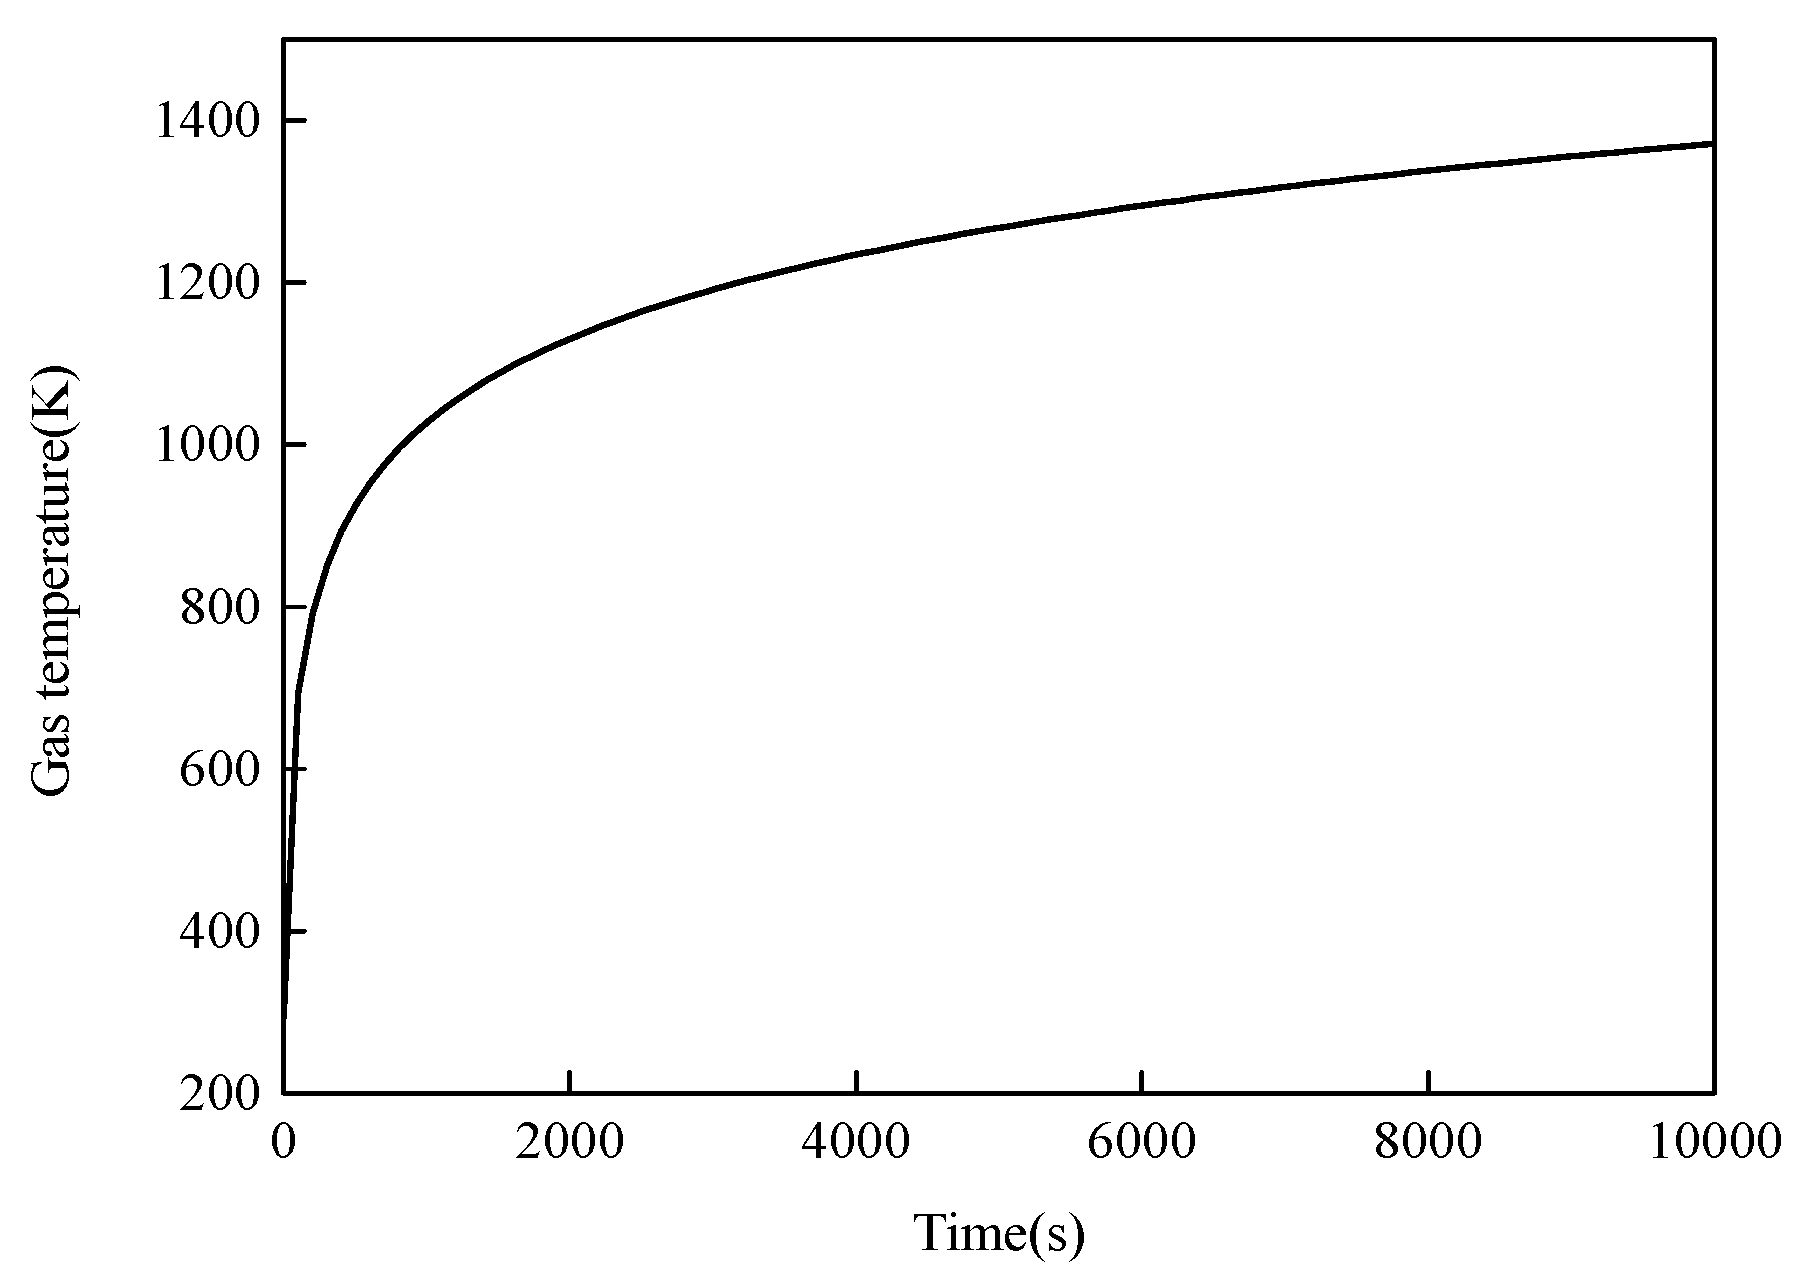
3.3. Initial and Boundary Conditions
3.4. Treatments of the Nonlinear Problem in the Numerical Simulation
3.4.1. Heat-Absorption Effect in the Pyrolysis
3.4.2. Nonlinear Size Effect in the Expansion
- (a)
- Using Equation (1) to calculate the thermal conductivity before expansion and using Equations (2)–(6) to calculate the thermal conductivity after expansion, the results are shown in Table 3.
- (b)
- An equivalent thermal conductivity model of the intumescent coatings is adopted to calculate the thermal conductivity [44]:
- (c)
- Assuming that the thickness of the intumescent coating remains unchanged, the thickness change is equivalently converted into the thermal conductivity change by Equation (18). As a result, the input values in the simulation calculation are obtained, which can be seen in Table 5:
3.5. Results and Discussion
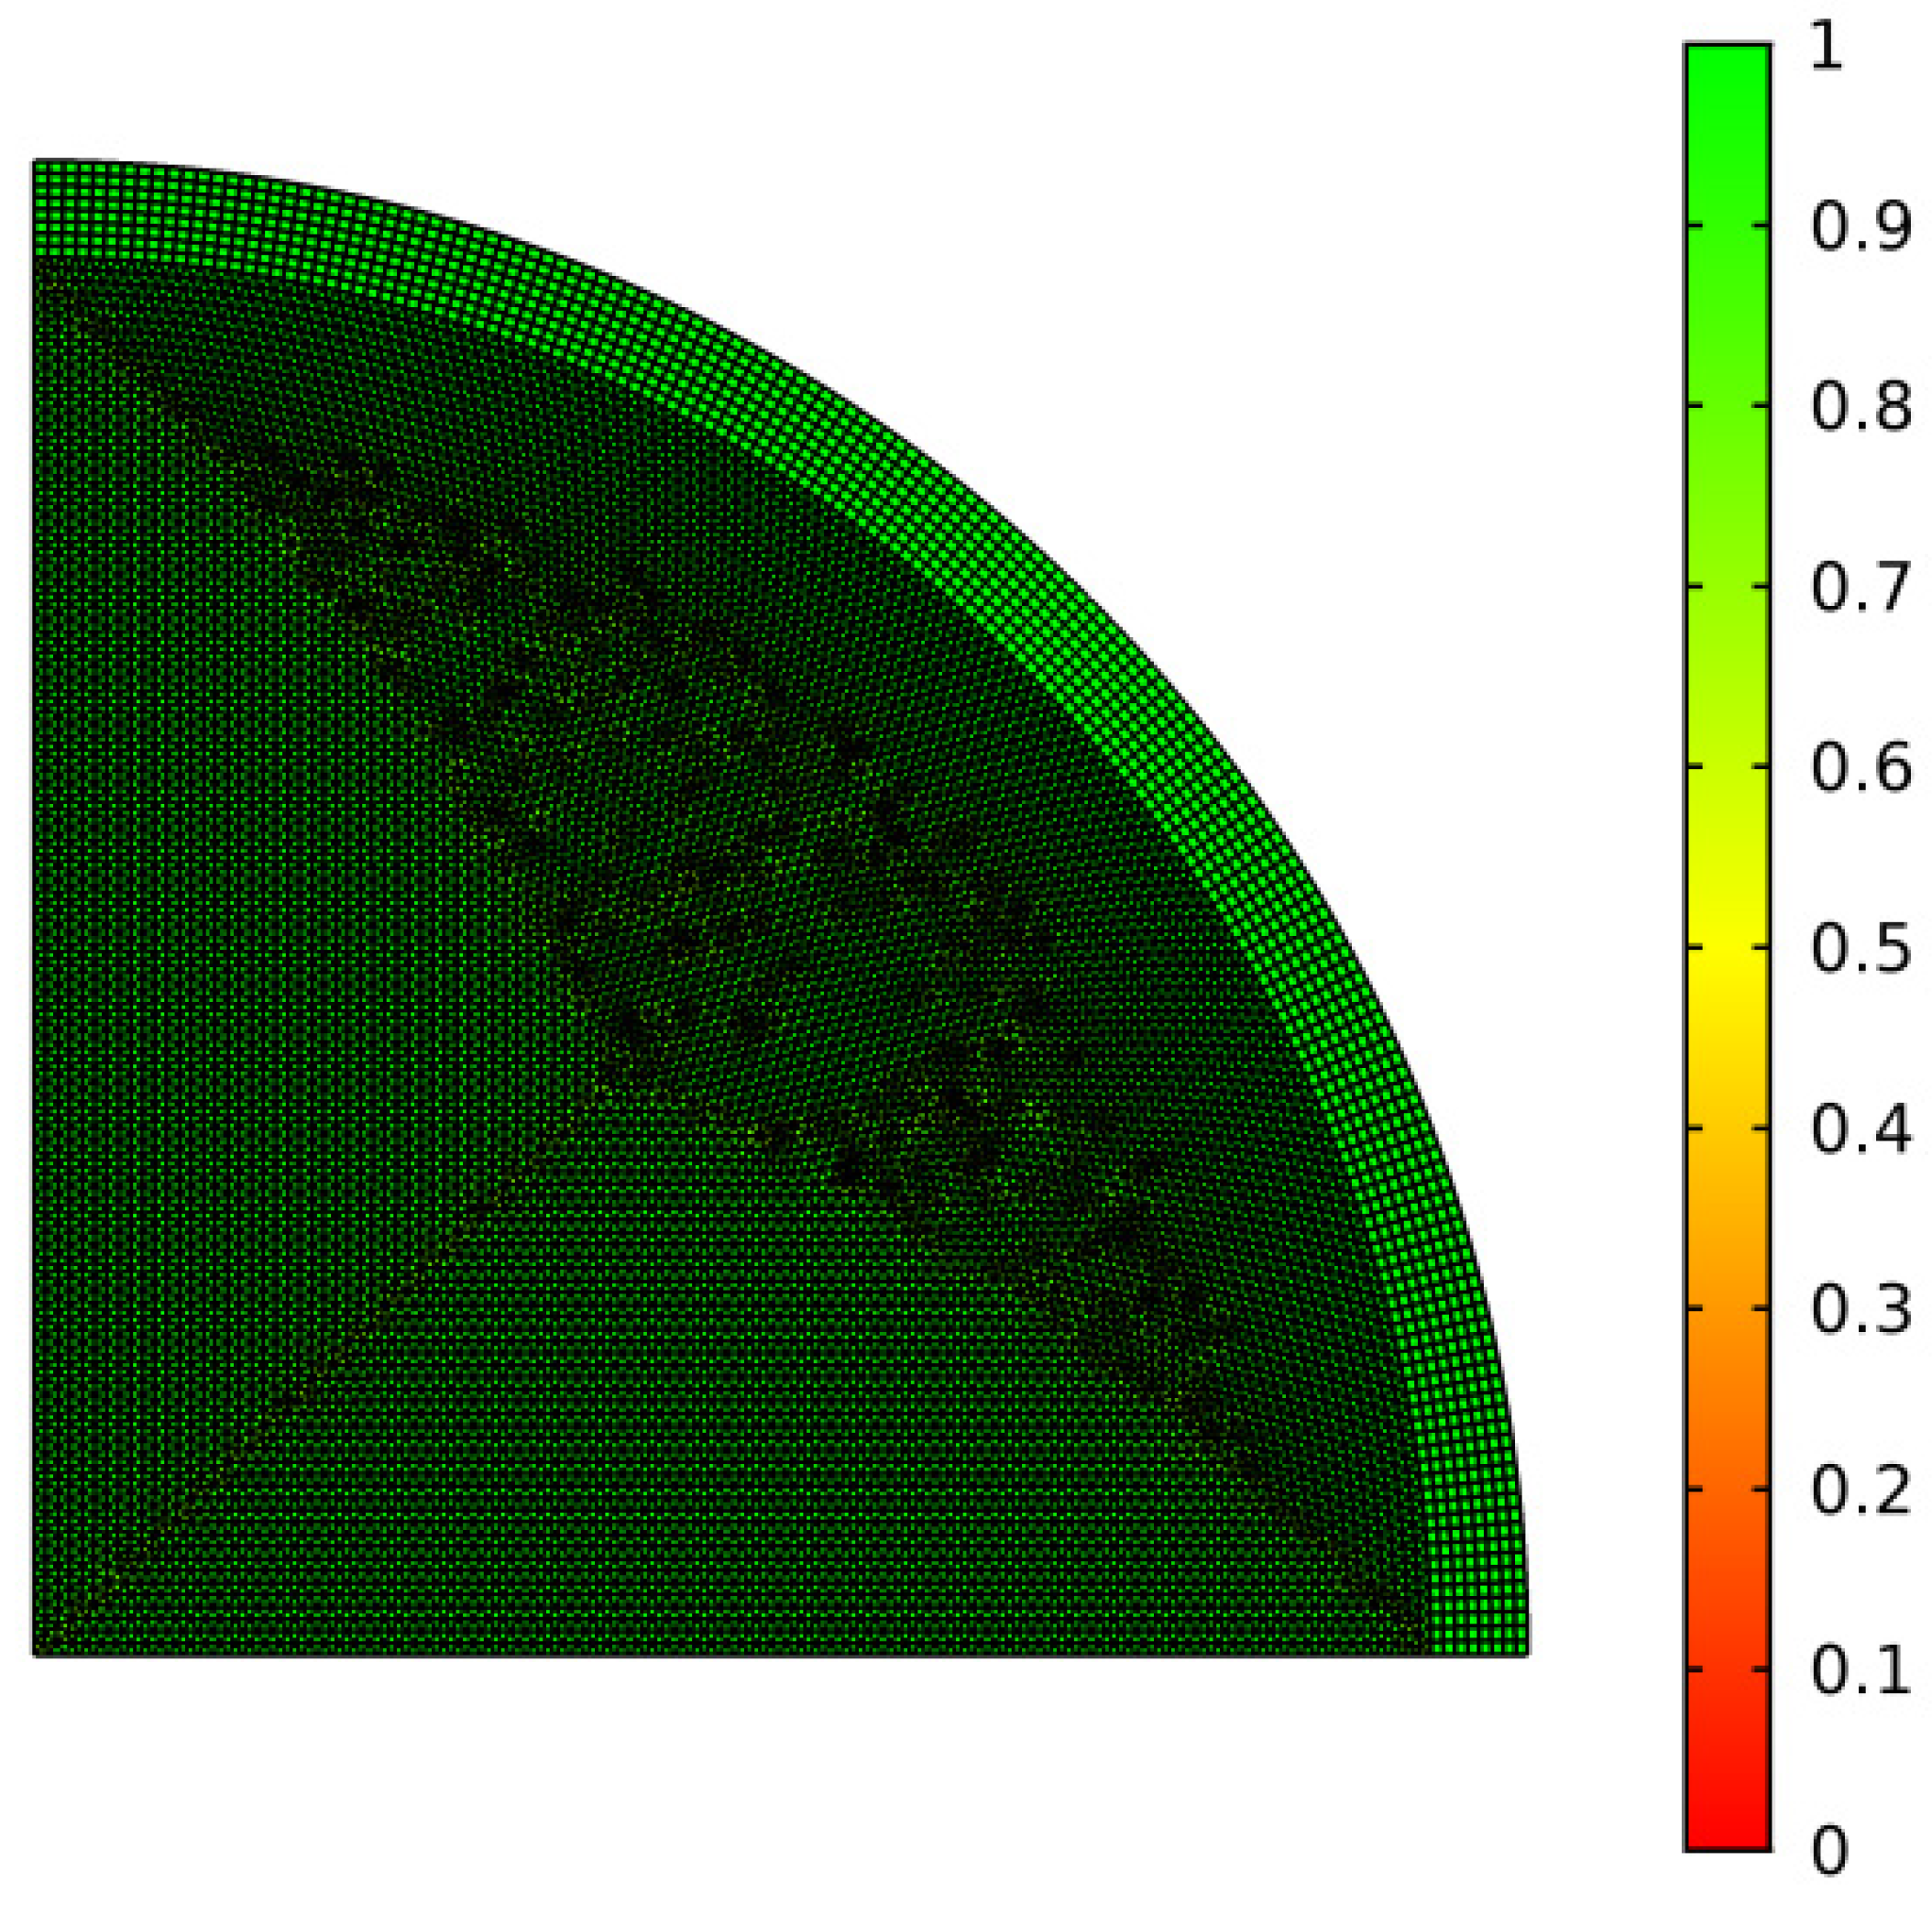
3.5.1. Finite Element Model and Feature Point
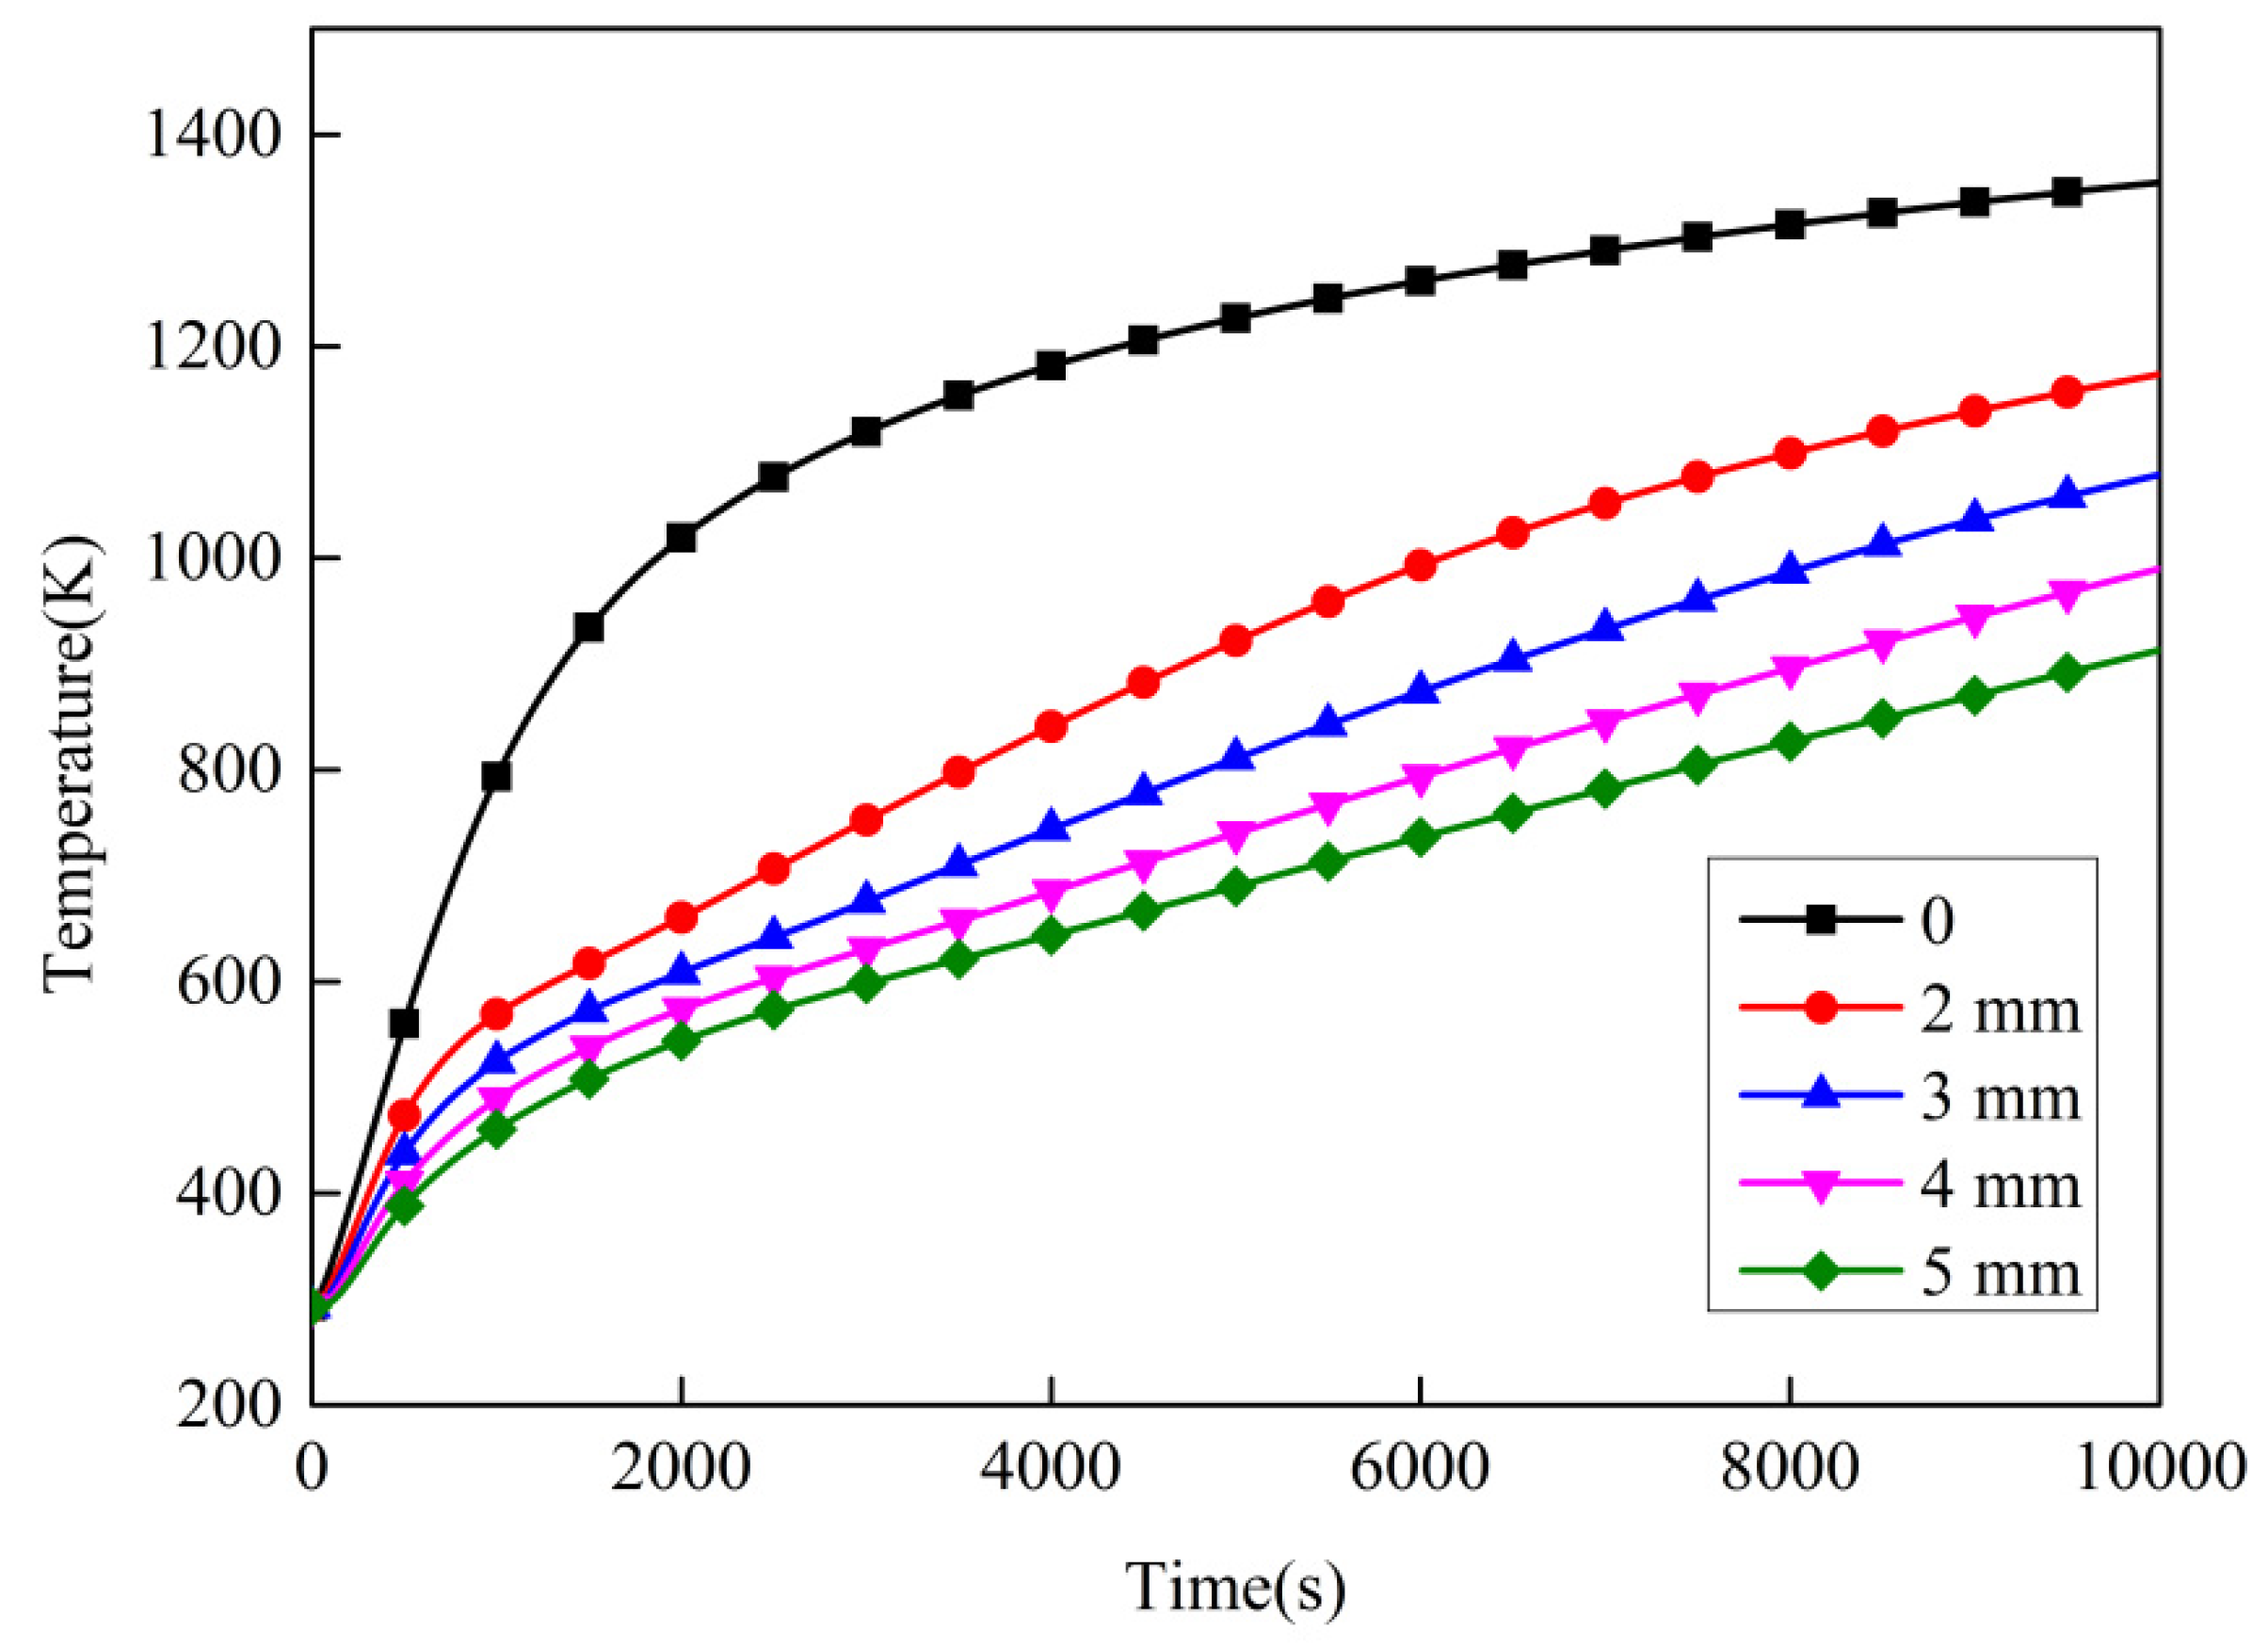
3.5.2. The Effect of Initial Thickness
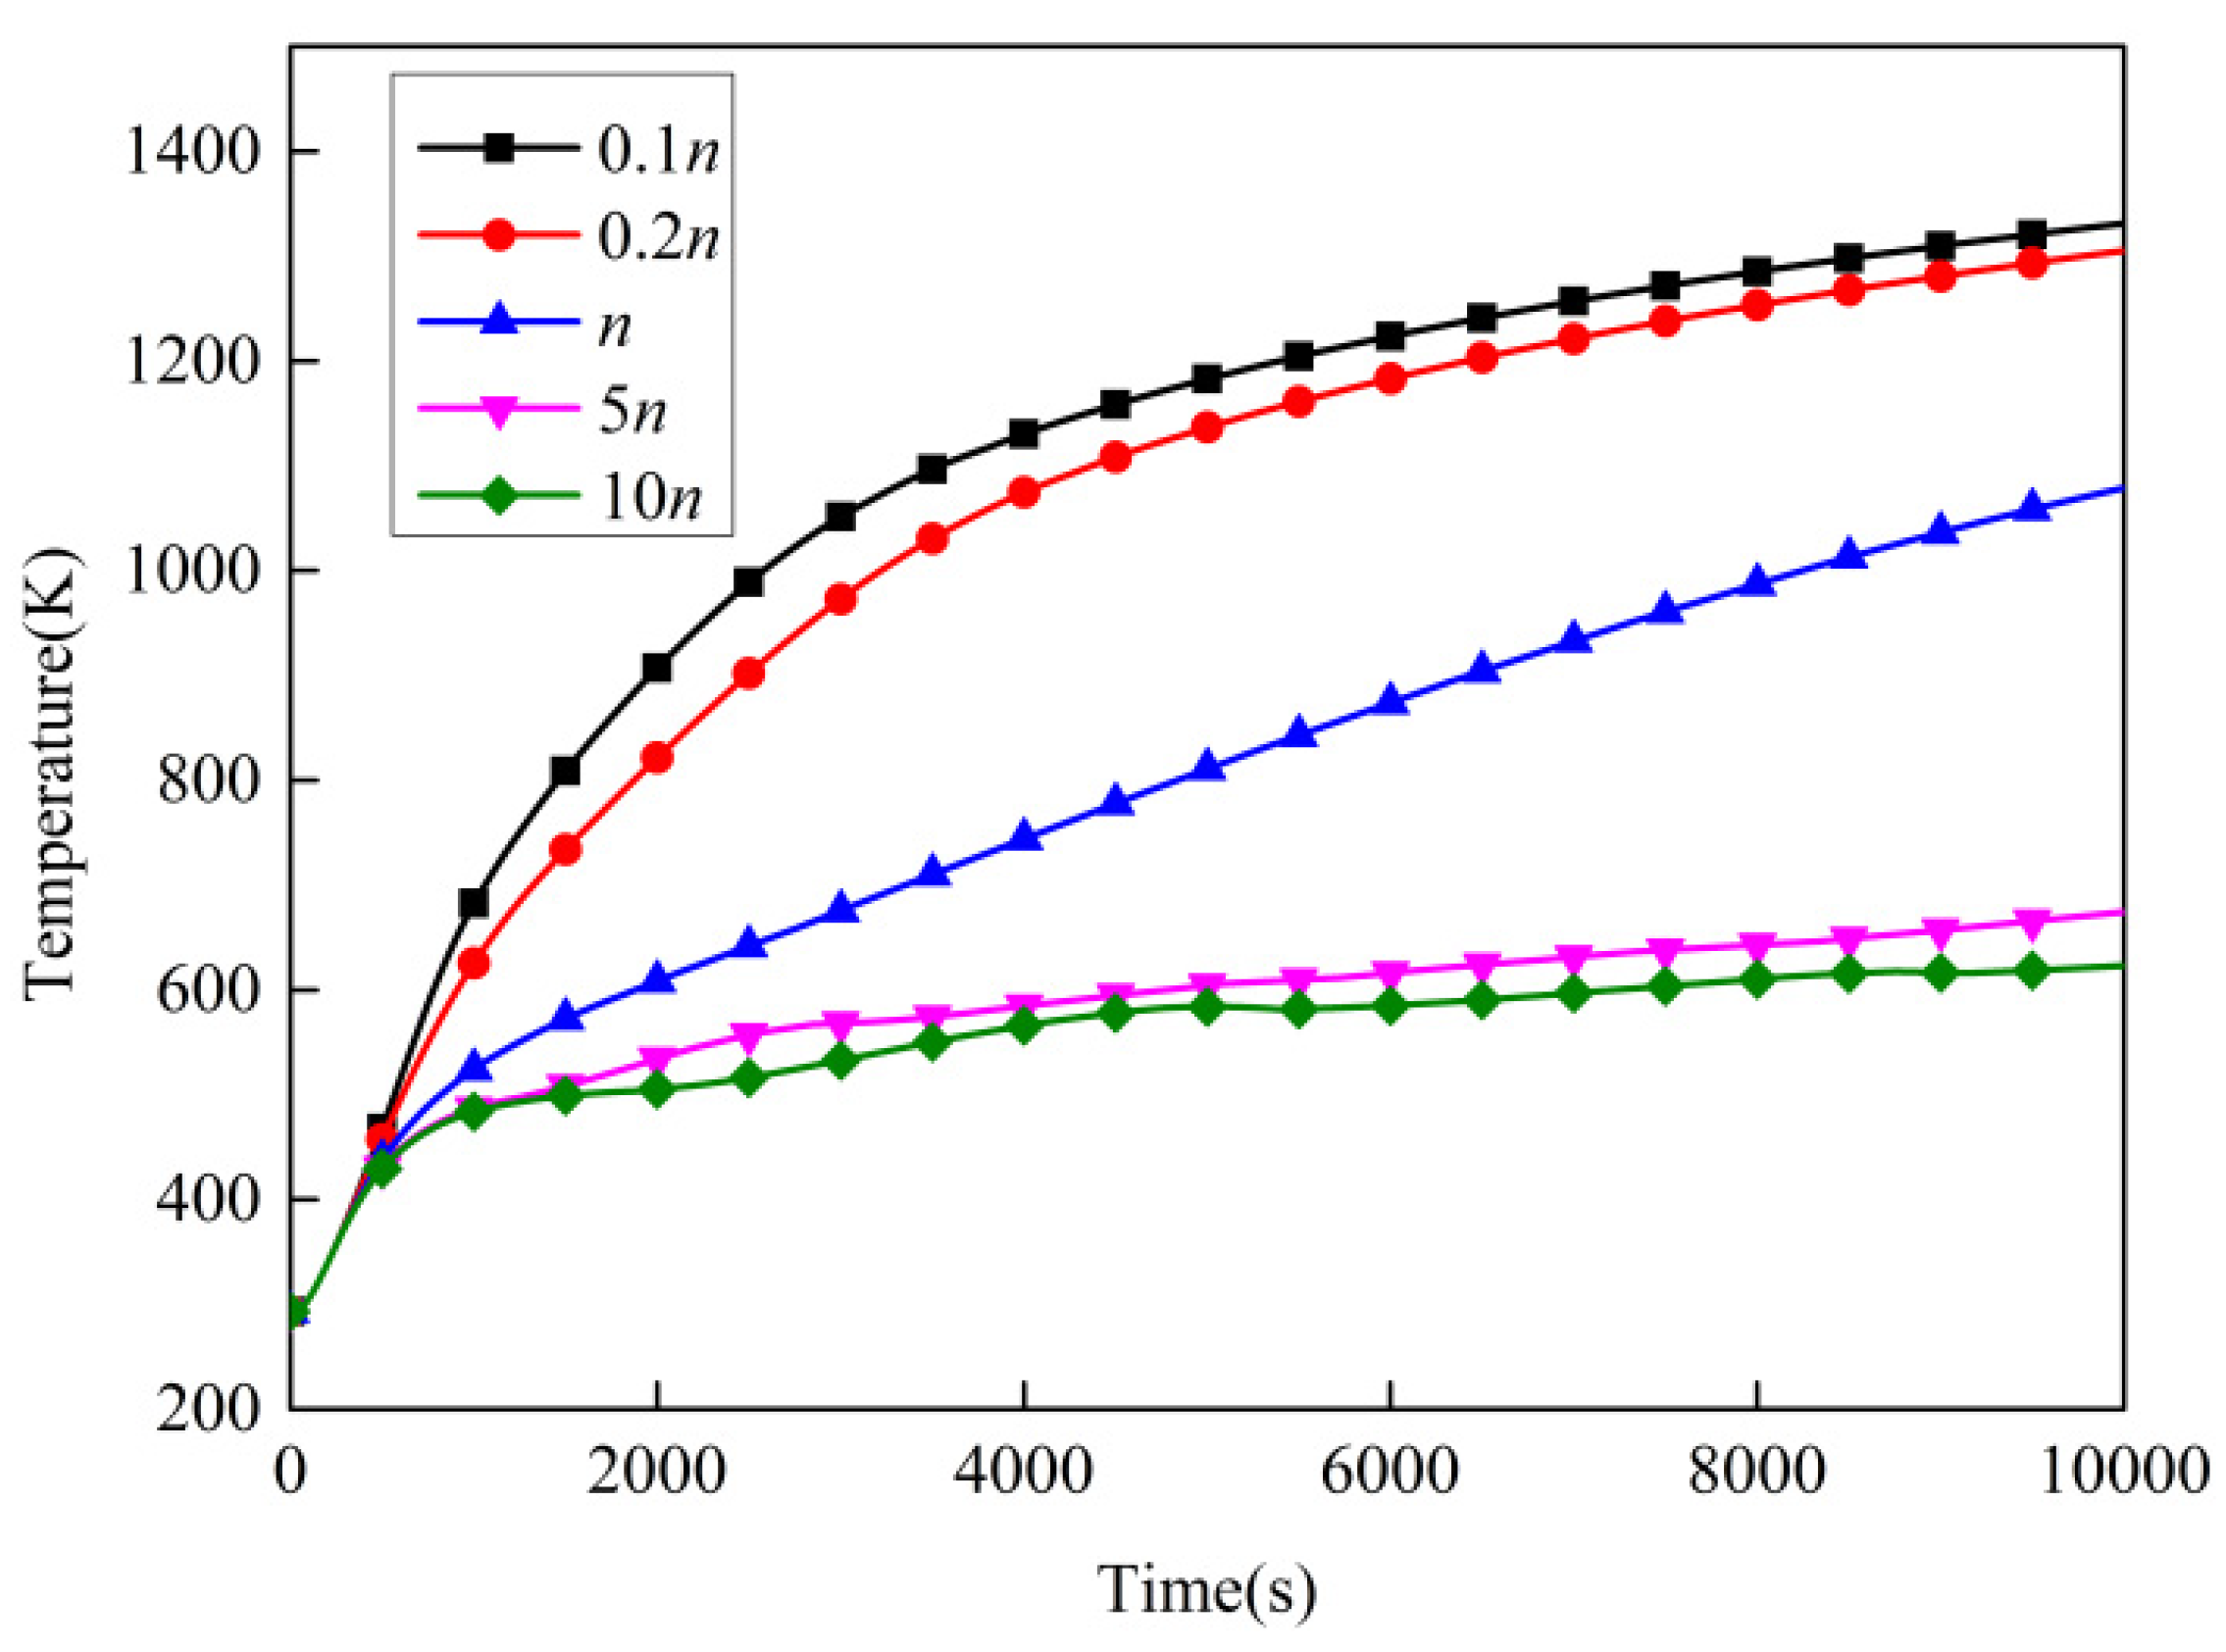
3.5.3. The Effect of Expansion Rate
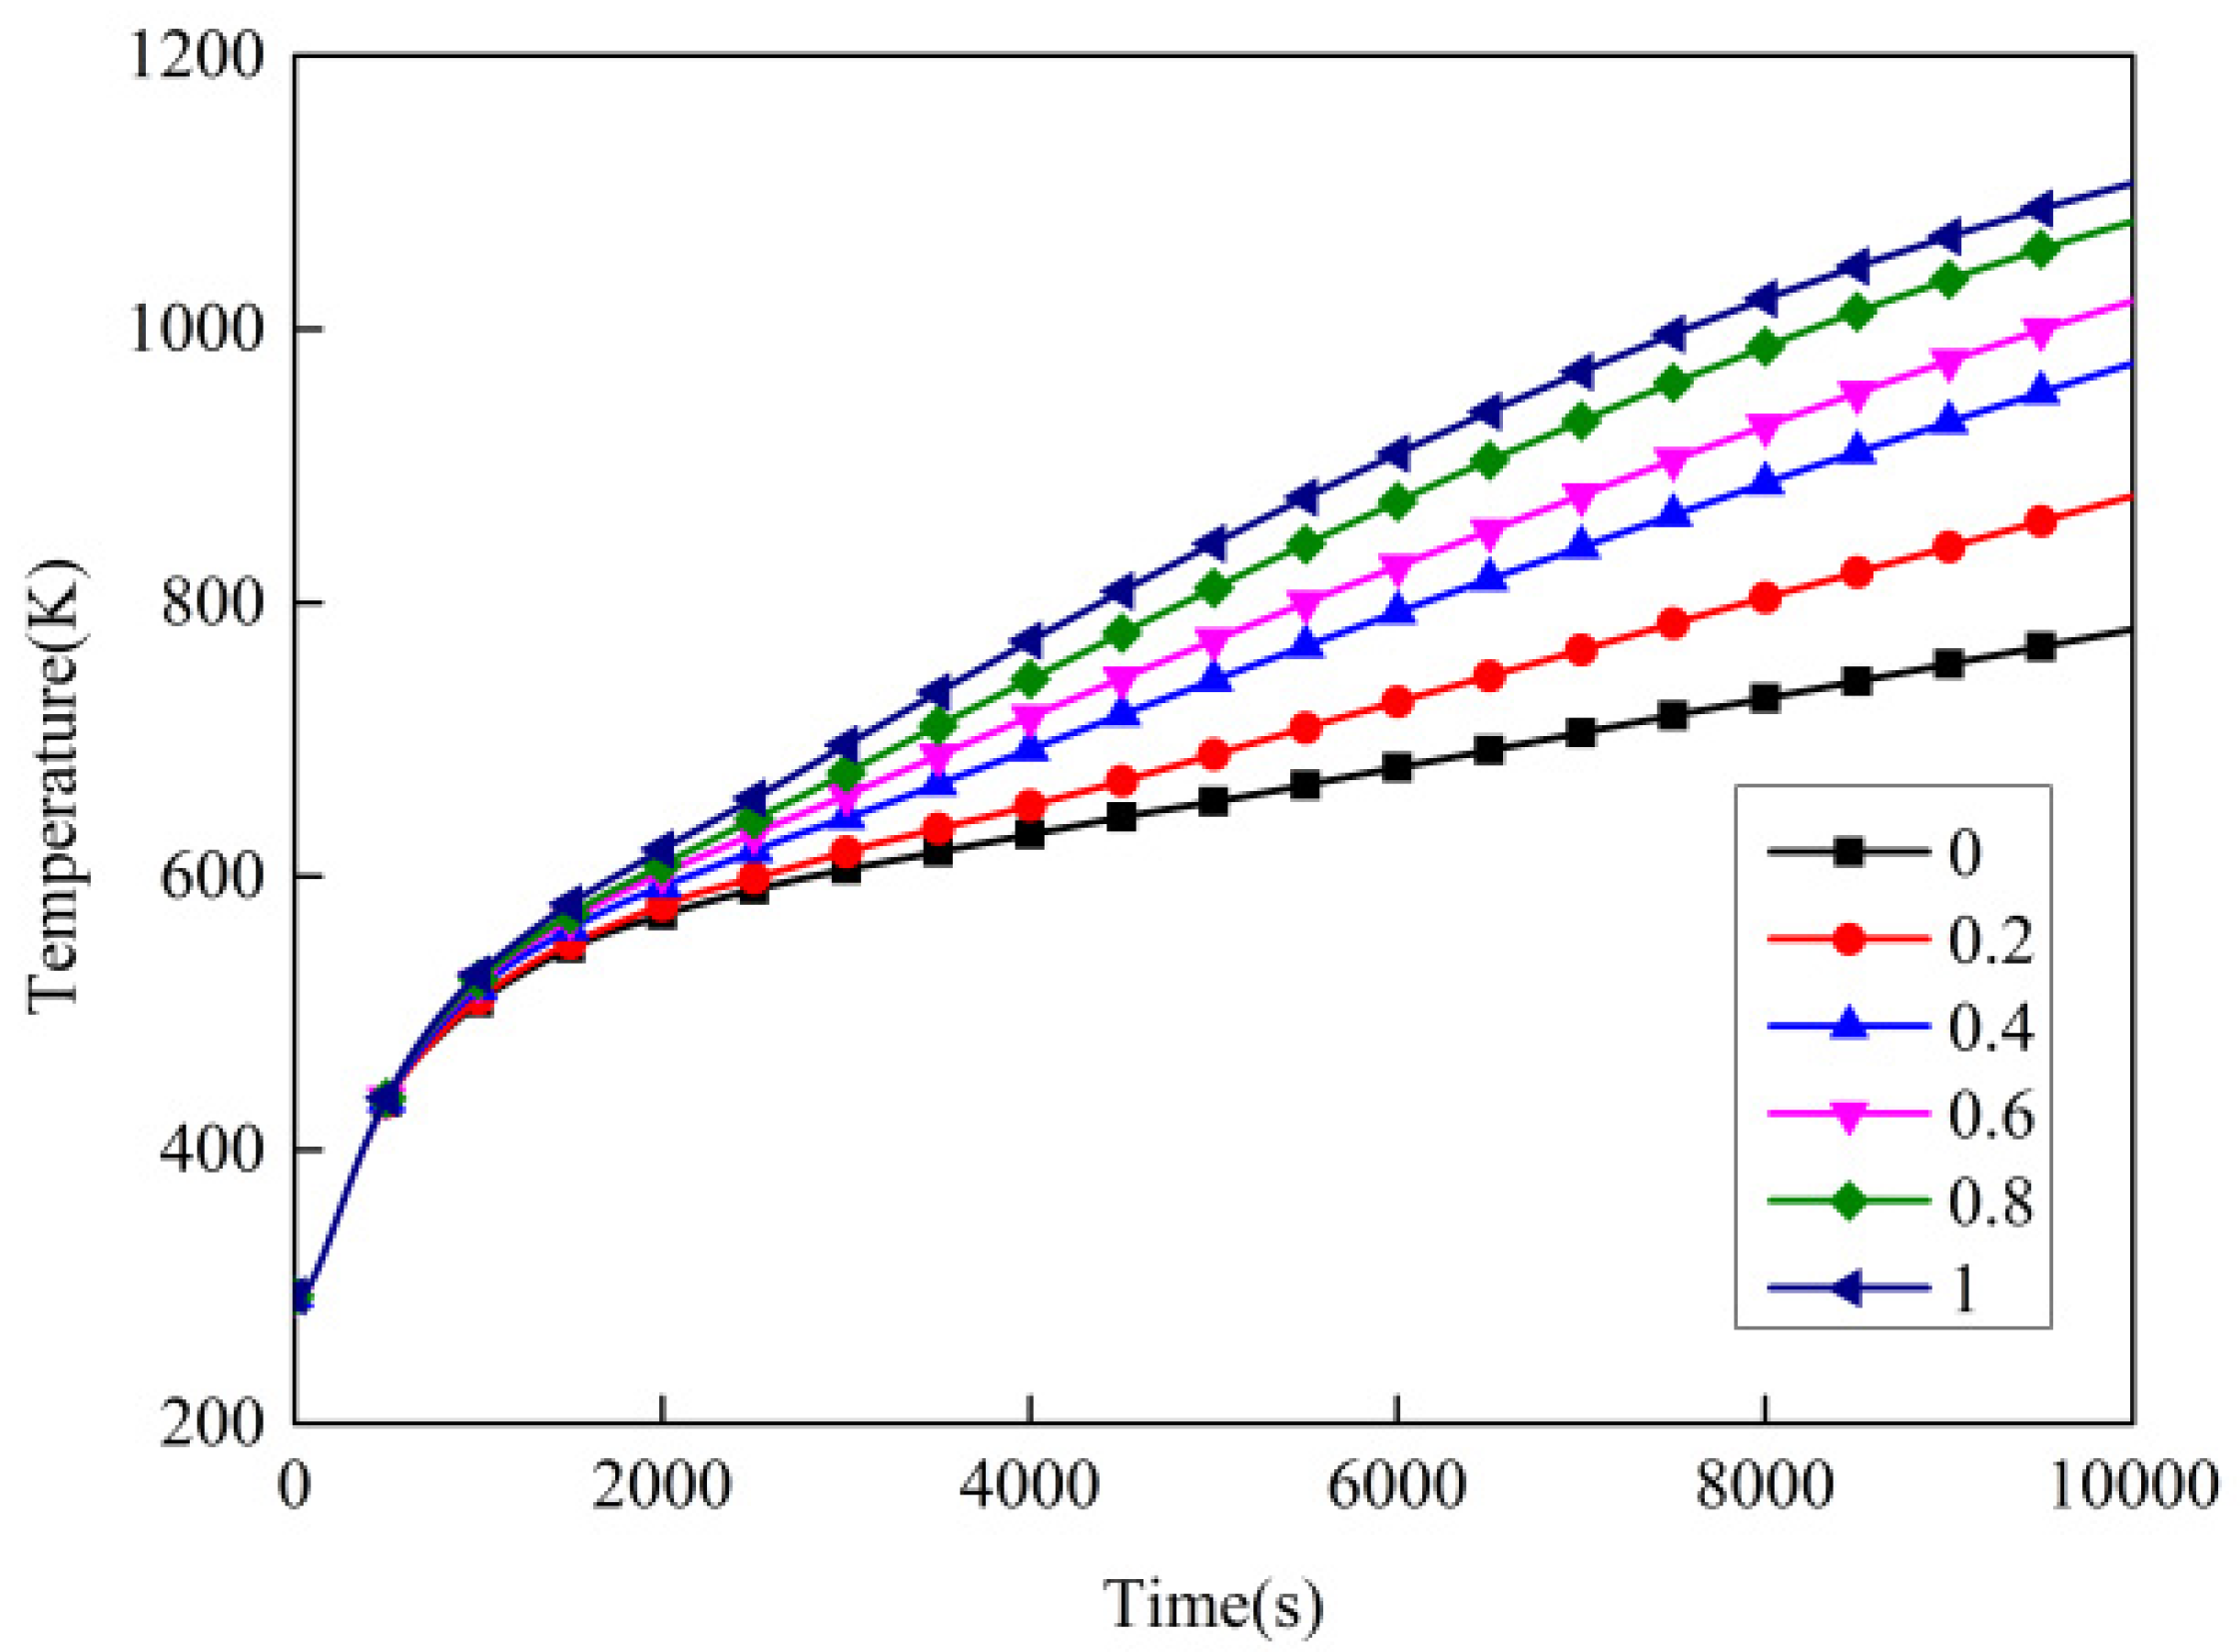
3.5.4. The Effect of Intra-Pore Emissivity
3.5.5. The Effect of Reaction Heat
4. Conclusions
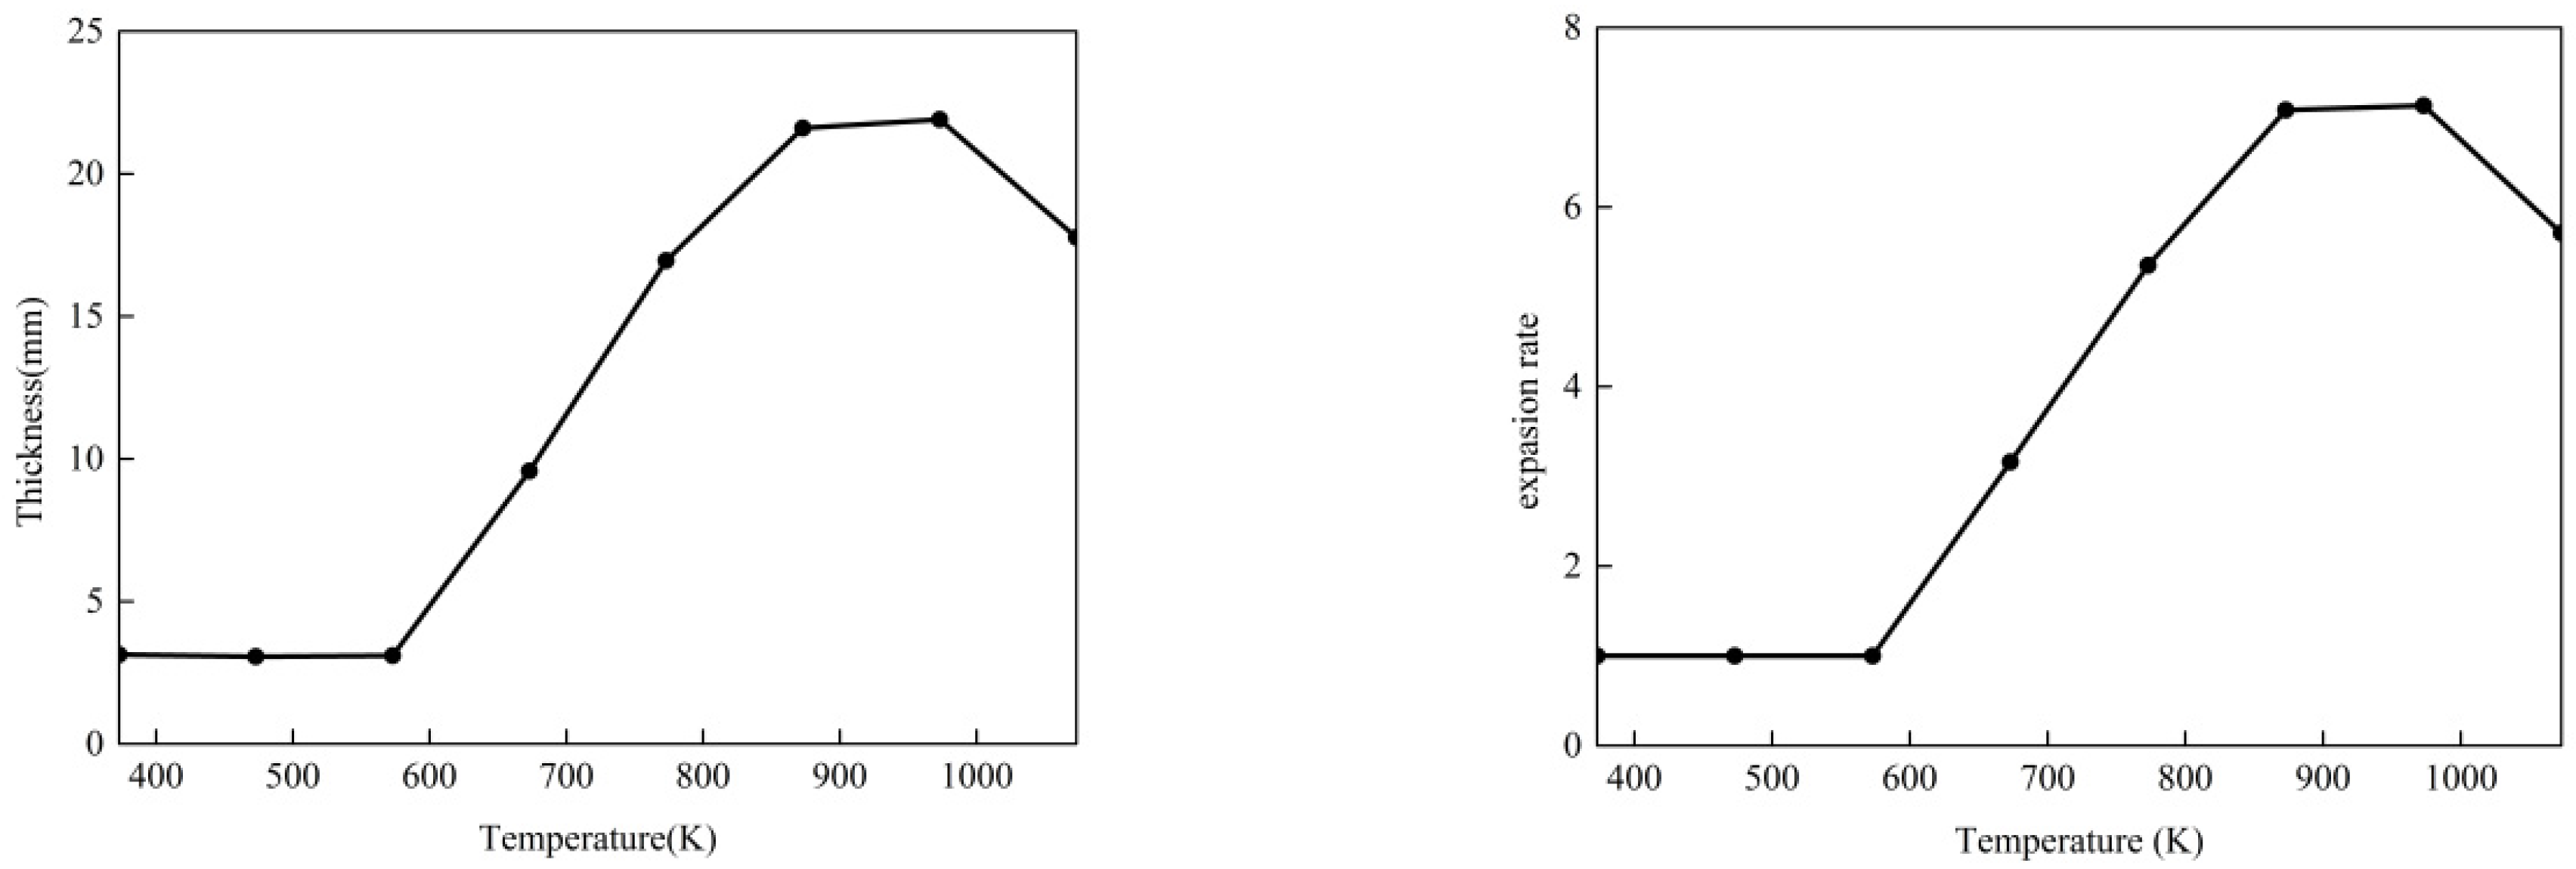
- (1)
- The thickness of the intumescent coating stayed the same at low temperatures, then increased rapidly with the increasing temperature, finally decreasing due to oxidation at high temperatures. The thermal conductivity increased with the increasing temperature, and the calculation equations at different temperature were obtained.
- (2)
- The initial thickness had a positive effect on the intumescent coating’s thermal insulation performance. As the initial thickness increased, the thermal insulation performance improved.
- (3)
- The expansion rate had a remarkable effect on the intumescent coating’s thermal insulation performance, but the effect was limited when the expansion rate increased to a certain level. In the material formulation design, appropriately increasing the quantity of the foaming agent could effectively improve the thermal insulation performance.
- (4)
- The intra-pore emissivity had a negative effect on the intumescent coating’s thermal insulation performance. Thermal radiation in the porous carbon layer strengthened the coupled heat transfer. In the material-formulation design, specific fillers could be used to decrease the intra-pore emissivity, thereby improving the thermal insulation performance.
- (5)
- The reaction heat hd a slightly positive effect on the intumescent coating’s thermal insulation performance. In the material formulation design, modifying the components could strengthen the heat-absorption effect, thus improving the thermal insulation’s performance.
Author Contributions
Funding
Conflicts of Interest
References
- Wang, X.; Fan, F.; Lai, J. Strength behavior of circular concrete-filled steel tube stub columns under axial compression: A review. Constr. Build. Mater. 2022, 322, 126144. [Google Scholar] [CrossRef]
- Le, K.B.; Cao, V.V. Numerical Study of Circular Concrete Filled Steel Tubes Subjected to Pure Torsion. Buildings 2021, 11, 397. [Google Scholar]
- Shao, Z.; Zha, X.; Wan, C. Design method of fire-resistance capacity of reinforced-concrete-filled steel tube column under axial compression. Fire Saf. J. 2022, 129, 103572. [Google Scholar] [CrossRef]
- Eremina, T.; Korolchenko, D. Fire Protection of Building Constructions with the Use of Fire-Retardant Intumescent Compositions. Buildings 2020, 10, 185. [Google Scholar] [CrossRef]
- de Silva, D.; Nuzzo, I.; Nigro, E.; Occhiuzzi, A. Intumescent Coatings for Fire Resistance of Steel Structures: Current Approaches for Qualification and Design. Coatings 2022, 12, 696. [Google Scholar] [CrossRef]
- Anees, S.M.; Dasari, A. A review on the environmental durability of intumescent coatings for steels. J. Mater. Sci. 2018, 53, 124–145. [Google Scholar]
- Griffin, G.J.; Bicknell, A.D.; Brown, T.J. Studies on the Effect of Atmospheric Oxygen Content on the Thermal Resistance of Intumescent, Fire-Retardant Coatings. J. Fire Sci. 2005, 23, 303–328. [Google Scholar] [CrossRef]
- Yasir, M.; Ahmad, F.; Yusoff PS, M.M.; Ullah, S.; Jimenez, M. Latest trends for structural steel protection by using intumescent fire protective coatings: A review. Surf. Eng. 2019, 36, 334–363. [Google Scholar] [CrossRef]
- Lucherini, A.; Maluk, C. Intumescent coatings used for the fire-safe design of steel structures: A review. J. Constr. Steel Res. 2019, 162, 105712. [Google Scholar] [CrossRef]
- Puri, R.G.; Khanna, A.S. Intumescent coatings: A review on recent progress. J. Coat. Technol. Res. 2017, 14, 1–20. [Google Scholar]
- Vandersall, H.L. Intumescent coating systems, their development and chemistry. J. Fire Flammabl. 1971, 2, 97–140. [Google Scholar]
- Reshetnikov, I.; Antonov, A.; Rudakova, T.; Aleksjuk, G.; Khalturinskij, N. Some aspects of intumescent fire retardant systems. Polym. Degrad. Stab. 1996, 54, 137–141. [Google Scholar]
- Reshetnikov, I.S.; Garashchenko, A.N.; Strakhov, V.L. Experimental investigation into mechanical destruction of intumescent chars. Polym. Adv. Technol. 2000, 11, 392–397. [Google Scholar] [CrossRef]
- Reshetnikov, I.S.; Yablokova, M.Y.; Potapova, E.V.; Khalturinskij, N.A.; Chernyh, V.Y.; Mashlyakovskii, L.N. Mechanical stability of intumescent chars. J. Appl. Polym. Sci. 1998, 67, 1827–1830. [Google Scholar] [CrossRef]
- Wang, G.; Yang, J. Influences of expandable graphite modified by polyethylene glycol on fire protection of waterborne intumescent fire resistive coating. Surf. Coat. Technol. 2010, 204, 3599–3605. [Google Scholar] [CrossRef]
- Wang, Z.; Han, E.; Ke, W. Influence of expandable graphite on fire resistance and water resistance of flame-retardant coatings. Corros. Sci. 2007, 49, 2237–2253. [Google Scholar] [CrossRef]
- Ullah, S.; Ahmad, F. Effects of zirconium silicate reinforcement on expandable graphite based intumescent fire retardant coating. Polym. Degrad. Stab. 2014, 103, 49–62. [Google Scholar] [CrossRef]
- Weihua, F.; Yufei, W.; Bo, T.; Sheng, Z.; Xiaoyu, G.; Hongfei, L.; Jun, S. Suppression on heat and smoke diffusion by zirconium nitride (ZrN) in intumescent flame retardant epoxy coatings. Prog. Org. Coat. 2020, 146, 105714. [Google Scholar]
- Yew, M.C.; Sulong, N.R.; Yew, M.K.; Amalina, M.A.; Johan, M.R. Influences of flame-retardant fillers on fire protection and mechanical properties of intumescent coatings. Prog. Org. Coat. 2015, 78, 59–66. [Google Scholar]
- Yang, Z.; Xiao, G.; Chen, C.; Chen, C.; Wang, M.; Zhong, F.; Zeng, S.; Lin, L. Synergistic decoration of organic titanium and polydopamine on boron nitride to enhance fire resistance of intumescent waterborne epoxy coating. Colloids Surf. A Physicochem. Eng. Asp. 2021, 621, 126561. [Google Scholar] [CrossRef]
- Puri, R.G.; Khanna, A.S. Effect of cenospheres on the char formation and fire protective performance of water-based intumescent coatings on structural steel. Prog. Org. Coat. 2016, 92, 8–15. [Google Scholar] [CrossRef]
- Yasir, M.; Amir, N.; Ahmad, F.; Ullah, S.; Jimenez, M. Effect of basalt fibers dispersion on steel fire protection performance of epoxy-based intumescent coatings. Prog. Org. Coat. 2018, 122, 229–238. [Google Scholar] [CrossRef]
- Ahmad, F.; Zulkurnain, E.S.B.; Ullah, S.; Al-Sehemi, A.G.; Raza, M.R. Improved fire resistance of boron nitride/epoxy intumescent coating upon minor addition of nano-alumina. Mater. Chem. Phys. 2020, 256, 123634. [Google Scholar] [CrossRef]
- Chaisaenrith, P.; Taksakulvith, P.; Pavasupree, S. Effect of nano titanium dioxide in intumescent fireproof coating on thermal performance and char morphology. Mater. Today Proc. 2021, 47, 3462–3467. [Google Scholar] [CrossRef]
- Yew, M.C.; Yew, M.K.; Saw, L.H.; Ng, T.C.; Durairaj, R.; Beh, J.H. Influences of nano bio-filler on the fire-resistive and mechanical properties of water-based intumescent coatings. Prog. Org. Coat. 2018, 124, 33–40. [Google Scholar] [CrossRef]
- Cagliostro, D.E.; Riccitiello, S.R.; Clark, K.J.; Shimizu, A.B. Intumescent coating modeling. J. Fire Flammabl. 1975, 6, 205–221. [Google Scholar]
- Anderson, C.E.; Wauters, D.K. A thermodynamic heat transfer model for intumescent systems. Int. J. Eng. Sci. 1984, 22, 881–889. [Google Scholar] [CrossRef]
- Charles, E.; Anderson, J.R.; Dziuk, J.R.; Mallow, W.A.; Buckmaster, J. Intumescent Reaction Mechanisms. J. Fire Sci. 1985, 3, 161–194. [Google Scholar]
- Anderson, C.E.; Ketchum, D.E.; Mountain, W.P. Thermal Conductivity of Intumescent Chars. J. Fire Sci. 1988, 6, 390–410. [Google Scholar] [CrossRef]
- Buckmaster, J.; Anderson, C.; Nachman, A. A model for intumescent paints. Int. J. Eng. Sci. 1986, 24, 263–276. [Google Scholar] [CrossRef]
- Di Blasi, C.; Branca, C. Mathematical model for the nonsteady decomposition of intumescent coatings. AIChE J. 2001, 47, 2359–2370. [Google Scholar]
- Di Blasi, C. Modeling the effects of high radiative heat fluxes on intumescent material decomposition. J. Anal. Appl. Pyrolysis 2004, 71, 721–737. [Google Scholar] [CrossRef]
- Zhang, Y.; Wang, Y.C.; Bailey, C.; Taylor, A.P. Global modelling of fire protection performance of intumescent coating under different cone calorimeter heating conditions. Fire Saf. J. 2012, 50, 51–62. [Google Scholar] [CrossRef]
- Zhang, Y.; Wang, Y.C.; Bailey, C.G.; Taylor, A.P. Global modelling of fire protection performance of an intumescent coating under different furnace fire conditions. J. Fire Sci. 2013, 31, 51–72. [Google Scholar] [CrossRef]
- Staggs, J.E.J.; Crewe, R.J.; Butler, R. A theoretical and experimental investigation of intumescent behaviour in protective coatings for structural steel. Chem. Eng. Sci. 2012, 71, 239–251. [Google Scholar] [CrossRef]
- Li, G.Q.; Zhang, C.; Lou, G.B.; Wang, Y.C.; Wang, L.L. Assess the Fire Resistance of Intumescent Coatings by Equivalent Constant Thermal Resistance. Fire Technol. 2012, 48, 529–546. [Google Scholar] [CrossRef]
- Li, G.Q.; Han, J.; Lou, G.B.; Wang, Y.C. Predicting intumescent coating protected steel temperature in fire using constant thermal conductivity. Thin-Walled Struct. 2016, 98, 177–184. [Google Scholar] [CrossRef]
- Cirpici, B.K.; Wang, Y.C.; Rogers, B.D.; Bourbigot, S. A theoretical model for quantifying expansion of intumescent coating under different heating conditions. Polym. Eng. Sci. 2016, 56, 798–809. [Google Scholar] [CrossRef]
- Zhang, L.; Hu, Y.; Li, M. Combined Heat Transfer Mechanisms in the Porous Char Layer Formed from the Intumescent Coatings under Fire. Coatings 2021, 11, 200. [Google Scholar] [CrossRef]
- GB 50936-2014; Technical Code for Concrete-Filled Steel Tubular Structures. Architecture &. Building Press: Beijing, China, 2014. (In Chinese)
- GB 14907-2018; Fire Resistive Coating for Steel Structure. Standards Press of China: Beijing, China, 2018. (In Chinese)
- Gillet, M.; Autrique, L.; Perez, L. Mathematical model for intumescent coatings growth: Application to fire retardant systems evaluation. J. Phys. D Appl. Phys. 2007, 40, 883. [Google Scholar]
- Wu, S. Numerical Simulation Research on Thermal Response of Structure with Explosive under Fire Circumanstance. China Acad. Eng. Phys. 2014. Available online: https://wenku.baidu.com/view/5263ad978f9951e79b89680203d8ce2f006665a0?fr=xueshu_top (accessed on 31 May 2022).
- Carson, J.K.; Lovatt, S.J.; Tanner, D.J.; Cleland, A.C. Thermal conductivity bounds for isotropic, porous materials. Int. J. Heat Mass Transf. 2005, 48, 2150–2158. [Google Scholar] [CrossRef]


| Specimen | Initial Thickness | Test Thickness | Expansion Rate |
|---|---|---|---|
| d3-373 K | 3.13 mm | 3.13 mm | 1 |
| d3-473 K | 3.06 mm | 3.06 mm | 1 |
| d3-573 K | 3.10 mm | 3.10 mm | 1 |
| d3-673 K | 3.02 mm | 9.57 mm | 3.16 |
| d3-773 K | 3.17 mm | 16.95 mm | 5.35 |
| d3-873 K | 3.05 mm | 21.60 mm | 7.08 |
| d3-973 K | 3.07 mm | 21.90 mm | 7.13 |
| d3-1073 K | 3.11 mm | 17.77 mm | 5.71 |
| T (K) | Apparent Density (g/cm3) | True Density (g/cm3) | Porosity | ||||||
|---|---|---|---|---|---|---|---|---|---|
| 1st | 2nd | 3rd | Avg. | 1st | 2nd | 3rd | Avg. | ||
| 373 | 0.792 | 0.791 | 0.789 | 0.791 | |||||
| 473 | 0.758 | 0.761 | 0.762 | 0.760 | |||||
| 573 | 0.723 | 0.715 | 0.732 | 0.723 | |||||
| 673 | 0.296 | 0.298 | 0.296 | 0.297 | 0.610 | 0.609 | 0.613 | 0.611 | 0.514 |
| 773 | 0.149 | 0.150 | 0.153 | 0.151 | 0.439 | 0.436 | 0.438 | 0.438 | 0.655 |
| 873 | 0.081 | 0.084 | 0.082 | 0.082 | 0.276 | 0.279 | 0.279 | 0.278 | 0.705 |
| 973 | 0.070 | 0.071 | 0.071 | 0.071 | 0.254 | 0.253 | 0.257 | 0.255 | 0.722 |
| 1073 | 0.075 | 0.074 | 0.074 | 0.074 | 0.242 | 0.240 | 0.239 | 0.240 | 0.692 |
| T (K) | 293 | 373 | 473 | 573 | 673 | 773 | 873 | 973 | 1073 |
| λs (W/(m⋅K)) | 0.10 | 0.14 | 0.19 | 0.24 | 0.29 | 0.34 | 0.39 | 0.44 | 0.49 |
| T (K) | 293 | 373 | 473 | 573 | 673 | 773 | 873 | 973 | 1073 |
| λs (W/(m·K)) | 0.10 | 0.14 | 0.19 | 0.24 | 0.29 | 0.34 | 0.39 | 0.44 | 0.49 |
| λg (W/(m·K)) | 0.04 | 0.06 | 0.08 | 0.12 | 0.18 | 0.25 | 0.34 | 0.45 | 0.59 |
| ϕ | 0.514 | 0.655 | 0.705 | 0.722 | 0.692 | ||||
| λeq (W/(m·K)) | 0.10 | 0.14 | 0.19 | 0.24 | 0.23 | 0.28 | 0.35 | 0.44 | 0.56 |
| T (K) | 293 | 373 | 437 | 573 | 673 | 773 | 873 | 973 | 1073 |
| n | 1 | 1 | 1 | 1 | 3.16 | 5.35 | 7.08 | 7.13 | 5.71 |
| (W/(m⋅K)) | 0.10 | 0.14 | 0.19 | 0.24 | 0.07 | 0.05 | 0.05 | 0.06 | 0.10 |
| Time (s) | Temperature of Point 1 (K) | ||||
|---|---|---|---|---|---|
| 0 | 2 mm | 3 mm | 4 mm | 5 mm | |
| 500 | 593.3 | 473.2 | 437.4 | 409.7 | 387.9 |
| 1000 | 793.1 | 569.1 | 524.3 | 488.7 | 460.3 |
| 2000 | 1019.0 | 660.5 | 608.3 | 573.5 | 543.9 |
| 4000 | 1181.7 | 840.9 | 744.0 | 684.8 | 643.7 |
| 10,000 | 1354.6 | 1173.5 | 1078.7 | 989.9 | 913.1 |
| Time Interval (s) | Temperature-Rise Rate of Point 1 (K/s) | ||||
|---|---|---|---|---|---|
| 0 | 2 mm | 3 mm | 4 mm | 5 mm | |
| 0–500 | 0.60 | 0.36 | 0.29 | 0.23 | 0.19 |
| 500–1000 | 0.47 | 0.19 | 0.17 | 0.16 | 0.14 |
| 1000–2000 | 0.23 | 0.09 | 0.08 | 0.08 | 0.08 |
| 2000–4000 | 0.08 | 0.09 | 0.07 | 0.06 | 0.05 |
| 4000–10,000 | 0.03 | 0.06 | 0.06 | 0.05 | 0.04 |
| Time (s) | Temperature of Point 1 (K) | ||||
|---|---|---|---|---|---|
| 0.1 n | 0.2 n | n | 5 n | 10 n | |
| 500 | 467.3 | 456.9 | 437.4 | 430.0 | 429.0 |
| 1000 | 682.0 | 625.3 | 524.3 | 486.7 | 483.6 |
| 2000 | 906.7 | 821.3 | 608.3 | 534.0 | 505.1 |
| 4000 | 1130.1 | 1074.4 | 744.0 | 584.5 | 565.7 |
| 10,000 | 1330.9 | 1304.5 | 1078.7 | 674.2 | 622.9 |
| Time Interval (s) | Temperature-Rise Rate of Point 1 (K/s) | ||||
|---|---|---|---|---|---|
| 0.1 n | 0.2 n | n | 5 n | 10 n | |
| 0–500 | 0.35 | 0.32 | 0.29 | 0.27 | 0.27 |
| 500–1000 | 0.43 | 0.34 | 0.17 | 0.11 | 0.11 |
| 1000–2000 | 0.22 | 0.20 | 0.08 | 0.05 | 0.02 |
| 2000–4000 | 0.11 | 0.13 | 0.07 | 0.03 | 0.03 |
| 4000–10,000 | 0.03 | 0.04 | 0.06 | 0.01 | 0.01 |
| Time (s) | Temperature of Point 1 (K) | |||||
|---|---|---|---|---|---|---|
| 0 | 0.2 | 0.4 | 0.6 | 0.8 | 1 | |
| 1000 | 507.3 | 510.2 | 517.6 | 522.5 | 524.3 | 527.9 |
| 2000 | 571.5 | 578.6 | 592.7 | 602.1 | 608.3 | 610.6 |
| 4000 | 630.5 | 651.6 | 692.7 | 716.6 | 744.0 | 772.3 |
| 10,000 | 780.4 | 878.0 | 975.1 | 1020.6 | 1078.7 | 1106.7 |
| Time Interval (s) | Temperature-Rise Rate of Point 1 (K/s) | |||||
|---|---|---|---|---|---|---|
| 0 | 0.2 | 0.4 | 0.6 | 0.8 | 1 | |
| 0–1000 | 0.21 | 0.22 | 0.22 | 0.23 | 0.23 | 0.23 |
| 1000–2000 | 0.06 | 0.07 | 0.08 | 0.08 | 0.08 | 0.09 |
| 2000–4000 | 0.03 | 0.04 | 0.05 | 0.06 | 0.07 | 0.08 |
| 4000–10,000 | 0.02 | 0.04 | 0.05 | 0.05 | 0.06 | 0.06 |
| Time (s) | Temperature of Point 1 (K) | ||||
|---|---|---|---|---|---|
| 10 kJ/kg | 100 kJ/kg | 1000 kJ/kg | 5000 kJ/kg | 10,000 kJ/kg | |
| 1000 | 525.3 | 524.3 | 515.7 | 481.5 | 456.6 |
| 2000 | 610.2 | 608.3 | 603.1 | 577.3 | 546.1 |
| 10,000 | 1080.16 | 1078.7 | 1077.7 | 1074.2 | 1066.2 |
| Time Interval (s) | Temperature-Rise Rate of Point 1 (K/s) | ||||
|---|---|---|---|---|---|
| 10 kJ/kg | 100 kJ/kg | 1000 kJ/kg | 5000 kJ/kg | 10,000 kJ/kg | |
| 0~1000 | 0.23 | 0.23 | 0.22 | 0.19 | 0.16 |
| 1000~2000 | 0.08 | 0.08 | 0.09 | 0.10 | 0.09 |
| 2000~10,000 | 0.06 | 0.06 | 0.06 | 0.06 | 0.07 |
Publisher’s Note: MDPI stays neutral with regard to jurisdictional claims in published maps and institutional affiliations. |
© 2022 by the authors. Licensee MDPI, Basel, Switzerland. This article is an open access article distributed under the terms and conditions of the Creative Commons Attribution (CC BY) license (https://creativecommons.org/licenses/by/4.0/).
Share and Cite
Zhang, L.; Hu, Y.; Li, M. Research on Thermal Response Behavior of the Intumescent Coating at High Temperature: An Experimental and Numerical Study. Buildings 2022, 12, 1014. https://doi.org/10.3390/buildings12071014
Zhang L, Hu Y, Li M. Research on Thermal Response Behavior of the Intumescent Coating at High Temperature: An Experimental and Numerical Study. Buildings. 2022; 12(7):1014. https://doi.org/10.3390/buildings12071014
Chicago/Turabian StyleZhang, Lingyun, Yupeng Hu, and Minghai Li. 2022. "Research on Thermal Response Behavior of the Intumescent Coating at High Temperature: An Experimental and Numerical Study" Buildings 12, no. 7: 1014. https://doi.org/10.3390/buildings12071014
APA StyleZhang, L., Hu, Y., & Li, M. (2022). Research on Thermal Response Behavior of the Intumescent Coating at High Temperature: An Experimental and Numerical Study. Buildings, 12(7), 1014. https://doi.org/10.3390/buildings12071014