
Visual Relationship-Based Identification of Key Construction Scenes on Highway Bridges


Abstract
:1. Introduction
2. Proposed Method
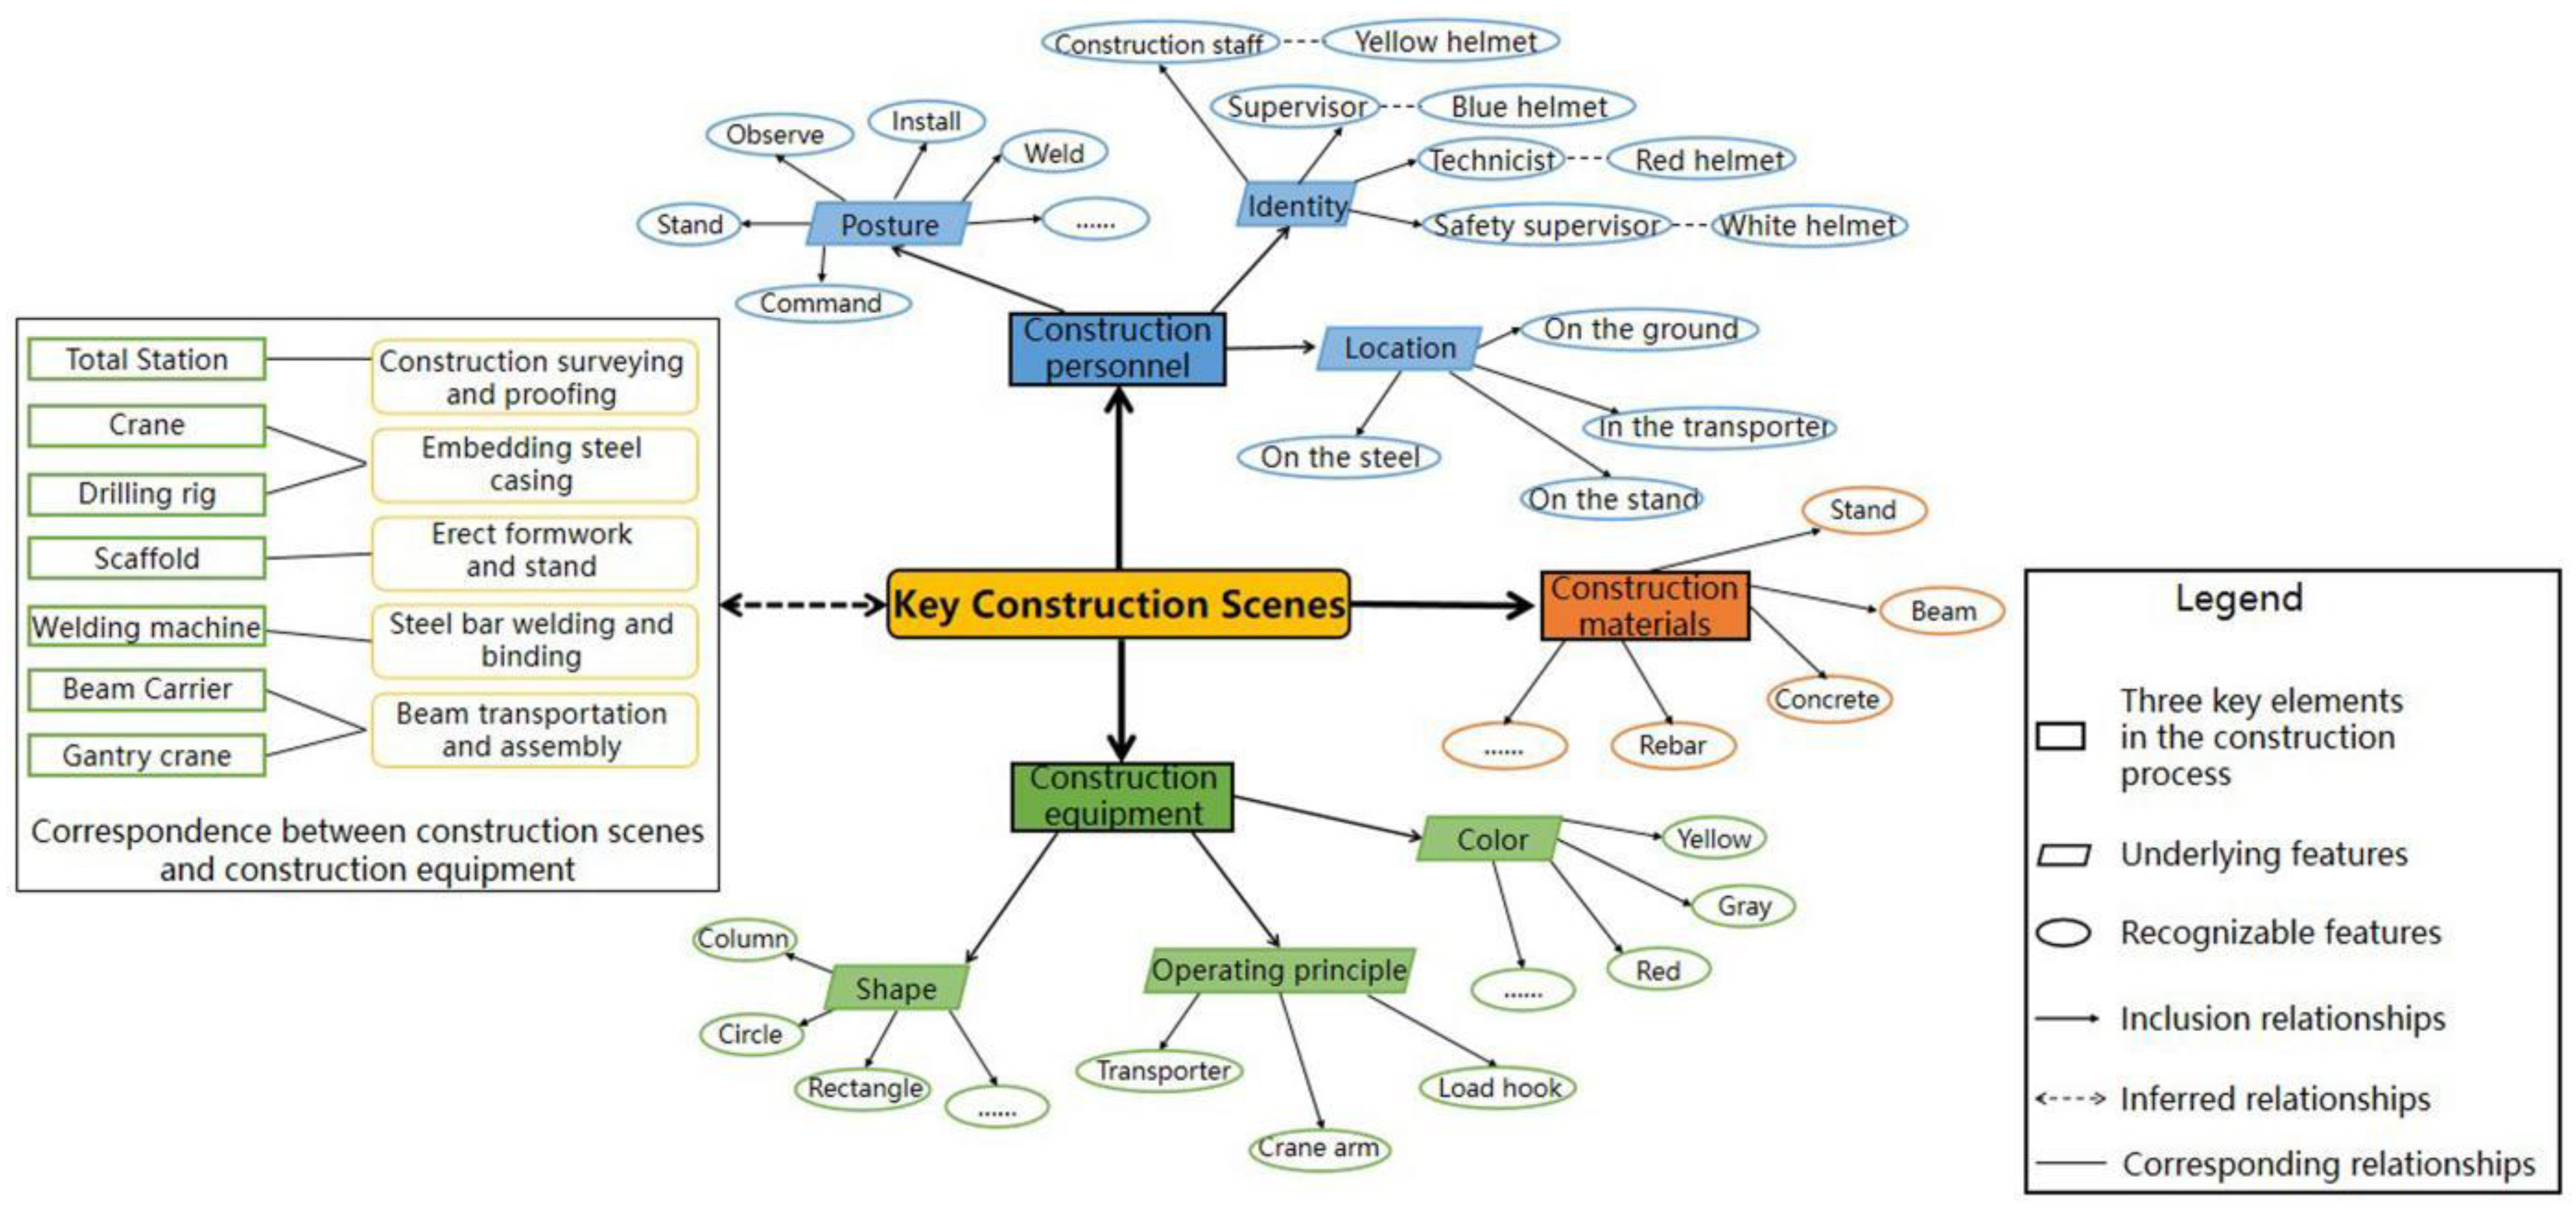
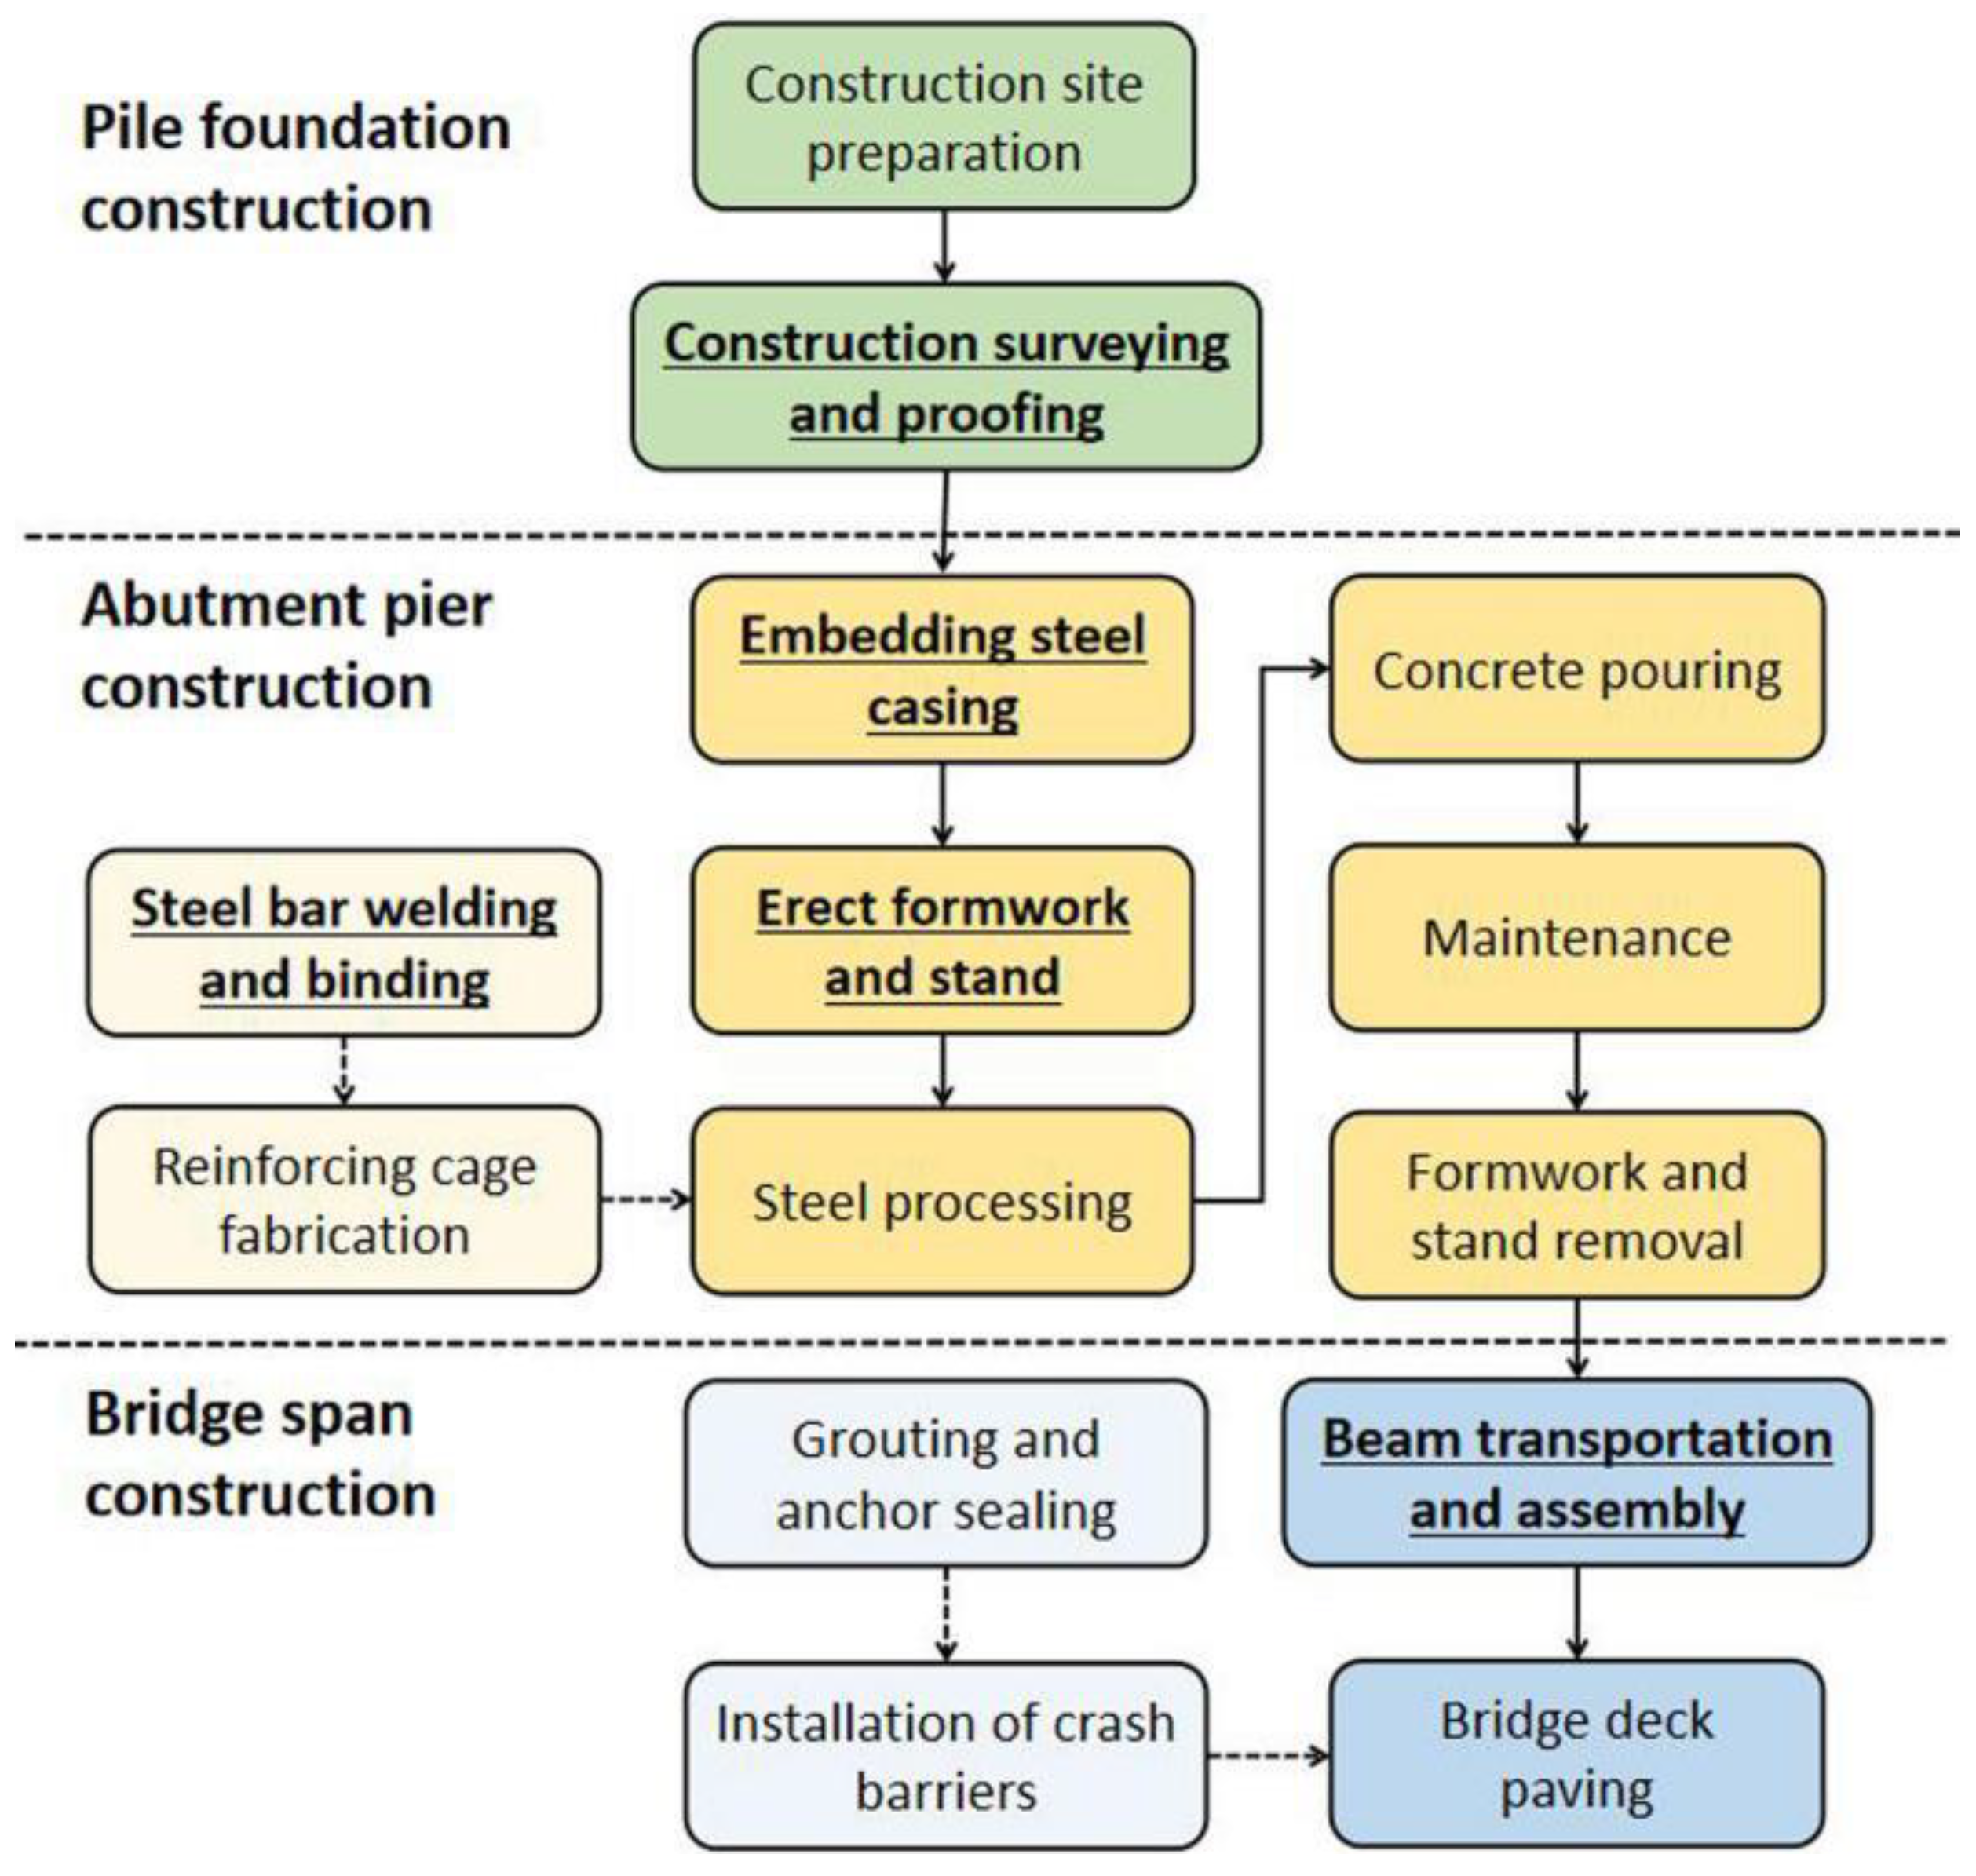
2.1. Selection of Key Construction Scenes on Bridges
2.1.1. Analysis of Bridge Construction Characteristics
2.1.2. Key Construction Scenes on Bridges
2.2. Formulation of Identification Rules for Key Construction Scenes on Bridges
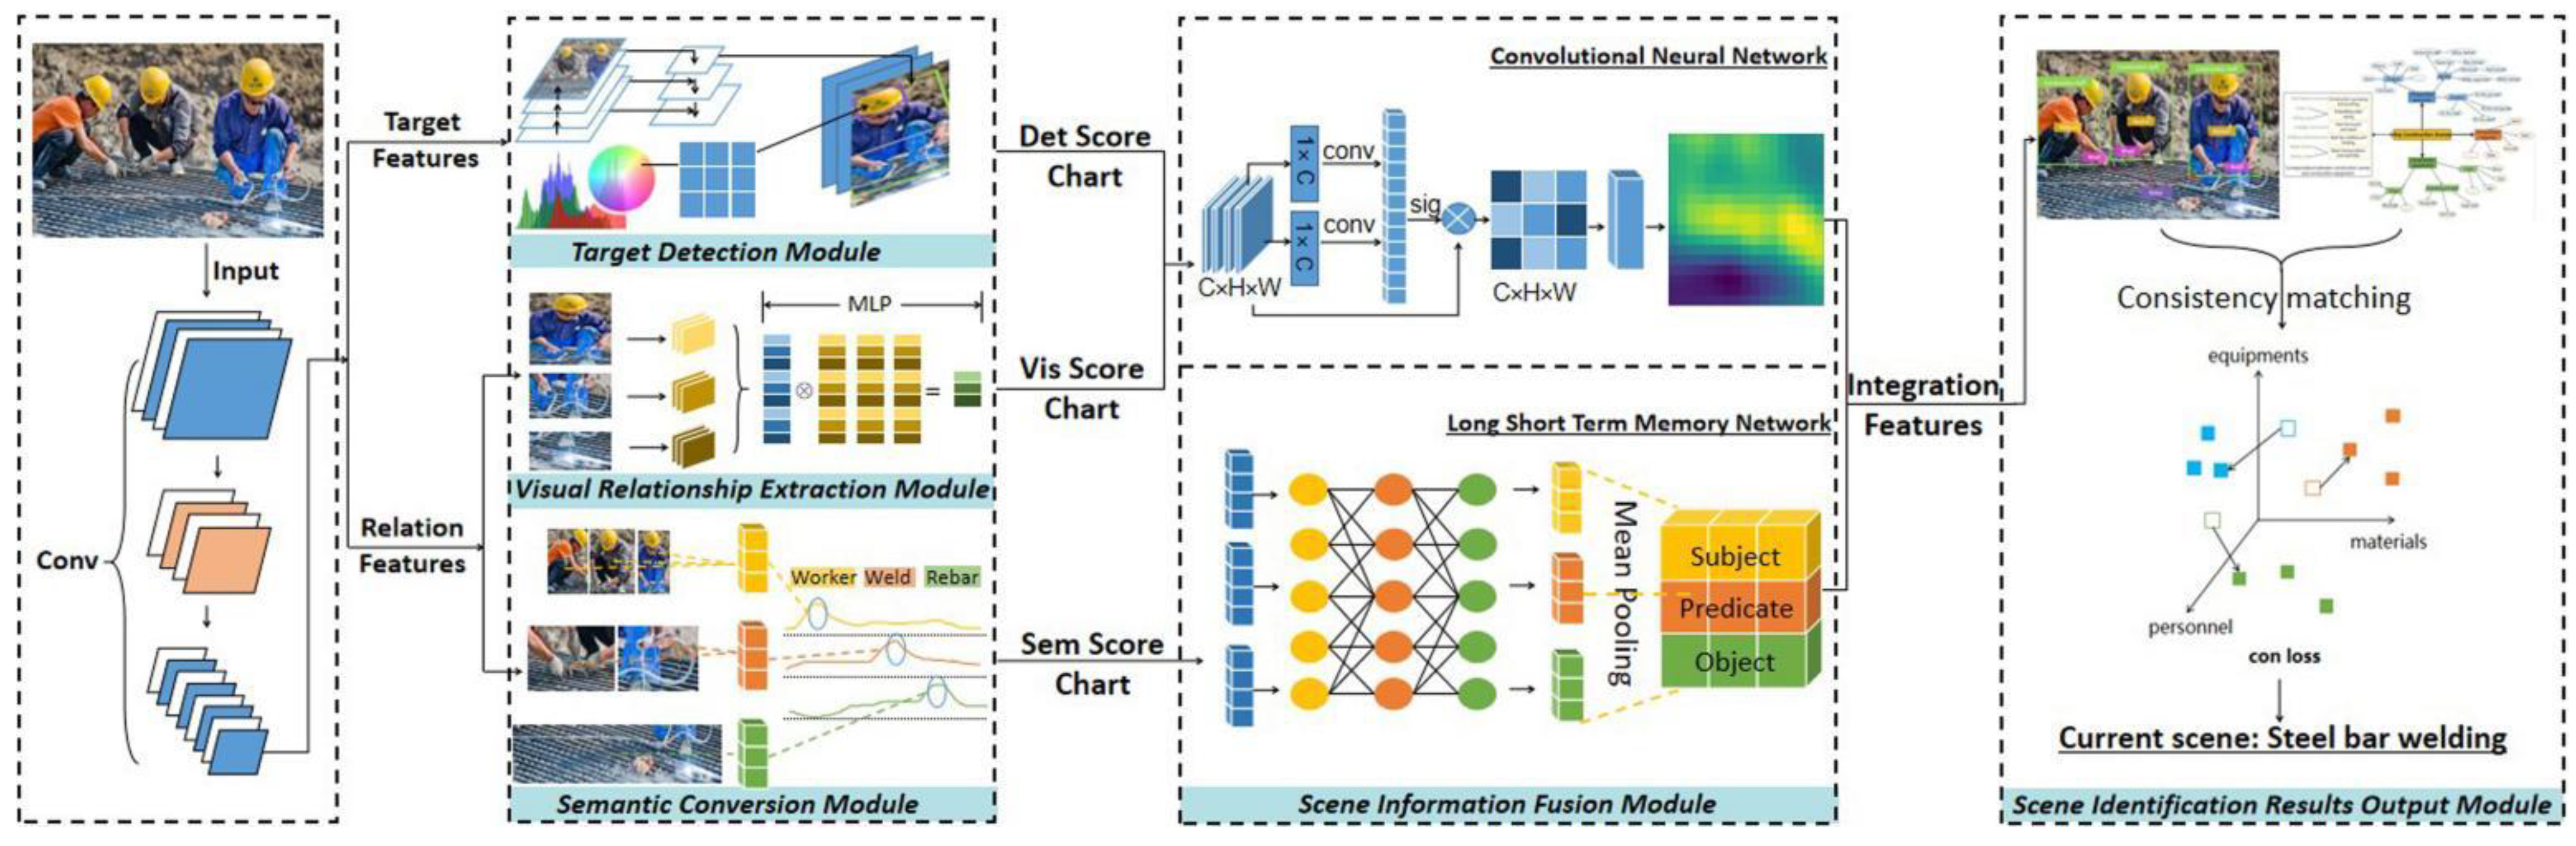
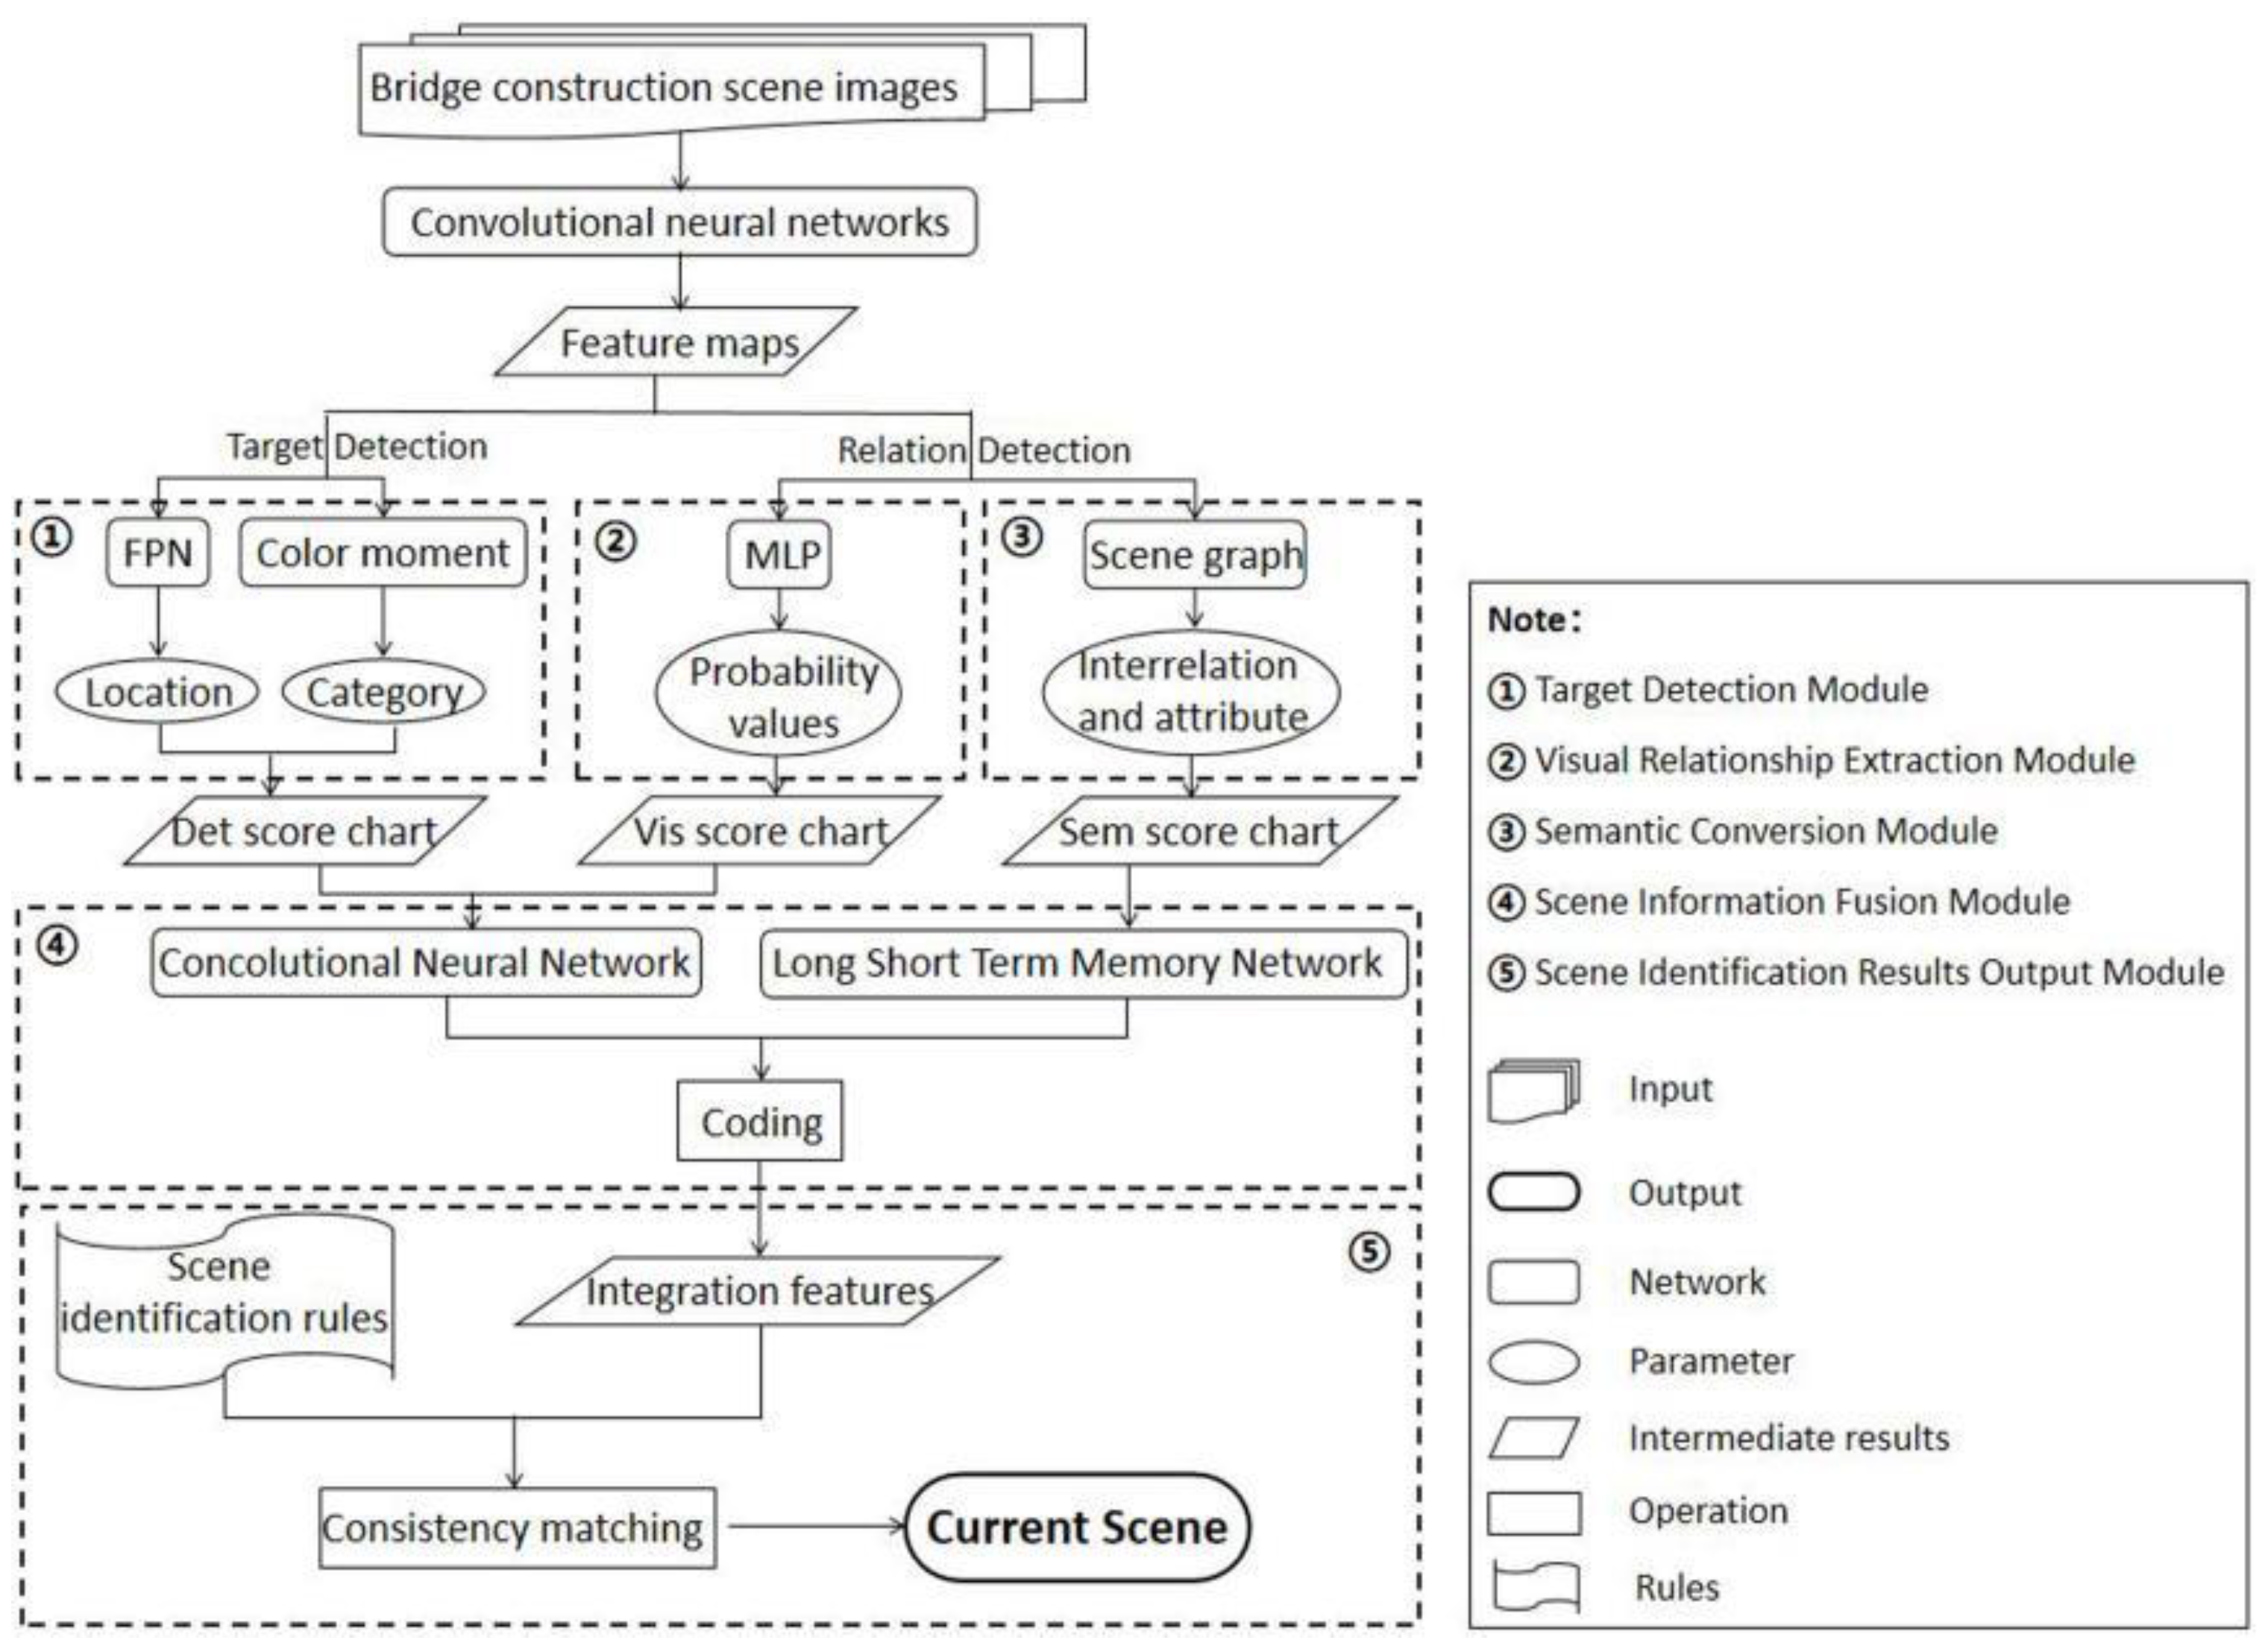
2.3. Building of Identification Model for Key Construction Scenes on Bridges
2.3.1. FPN-Based Target Detection Module
2.3.2. Visual Relationship Extraction Module Based on Feature Vectors
2.3.3. Semantic Conversion Module Based on Frequency Baseline
2.3.4. Scene Information Fusion Module Based on Image-Text Encoder
2.3.5. Scene Identification Results Output Module Based on Rule Consistency Matching
2.3.6. Method Flow-Chart
3. Experiment
3.1. Experimental Configuration
3.1.1. Dataset
3.1.2. Evaluation Indicators
3.1.3. Implementation Details
3.2. Identification Results and Accuracy Analysis for Key Construction Scenes on Bridges
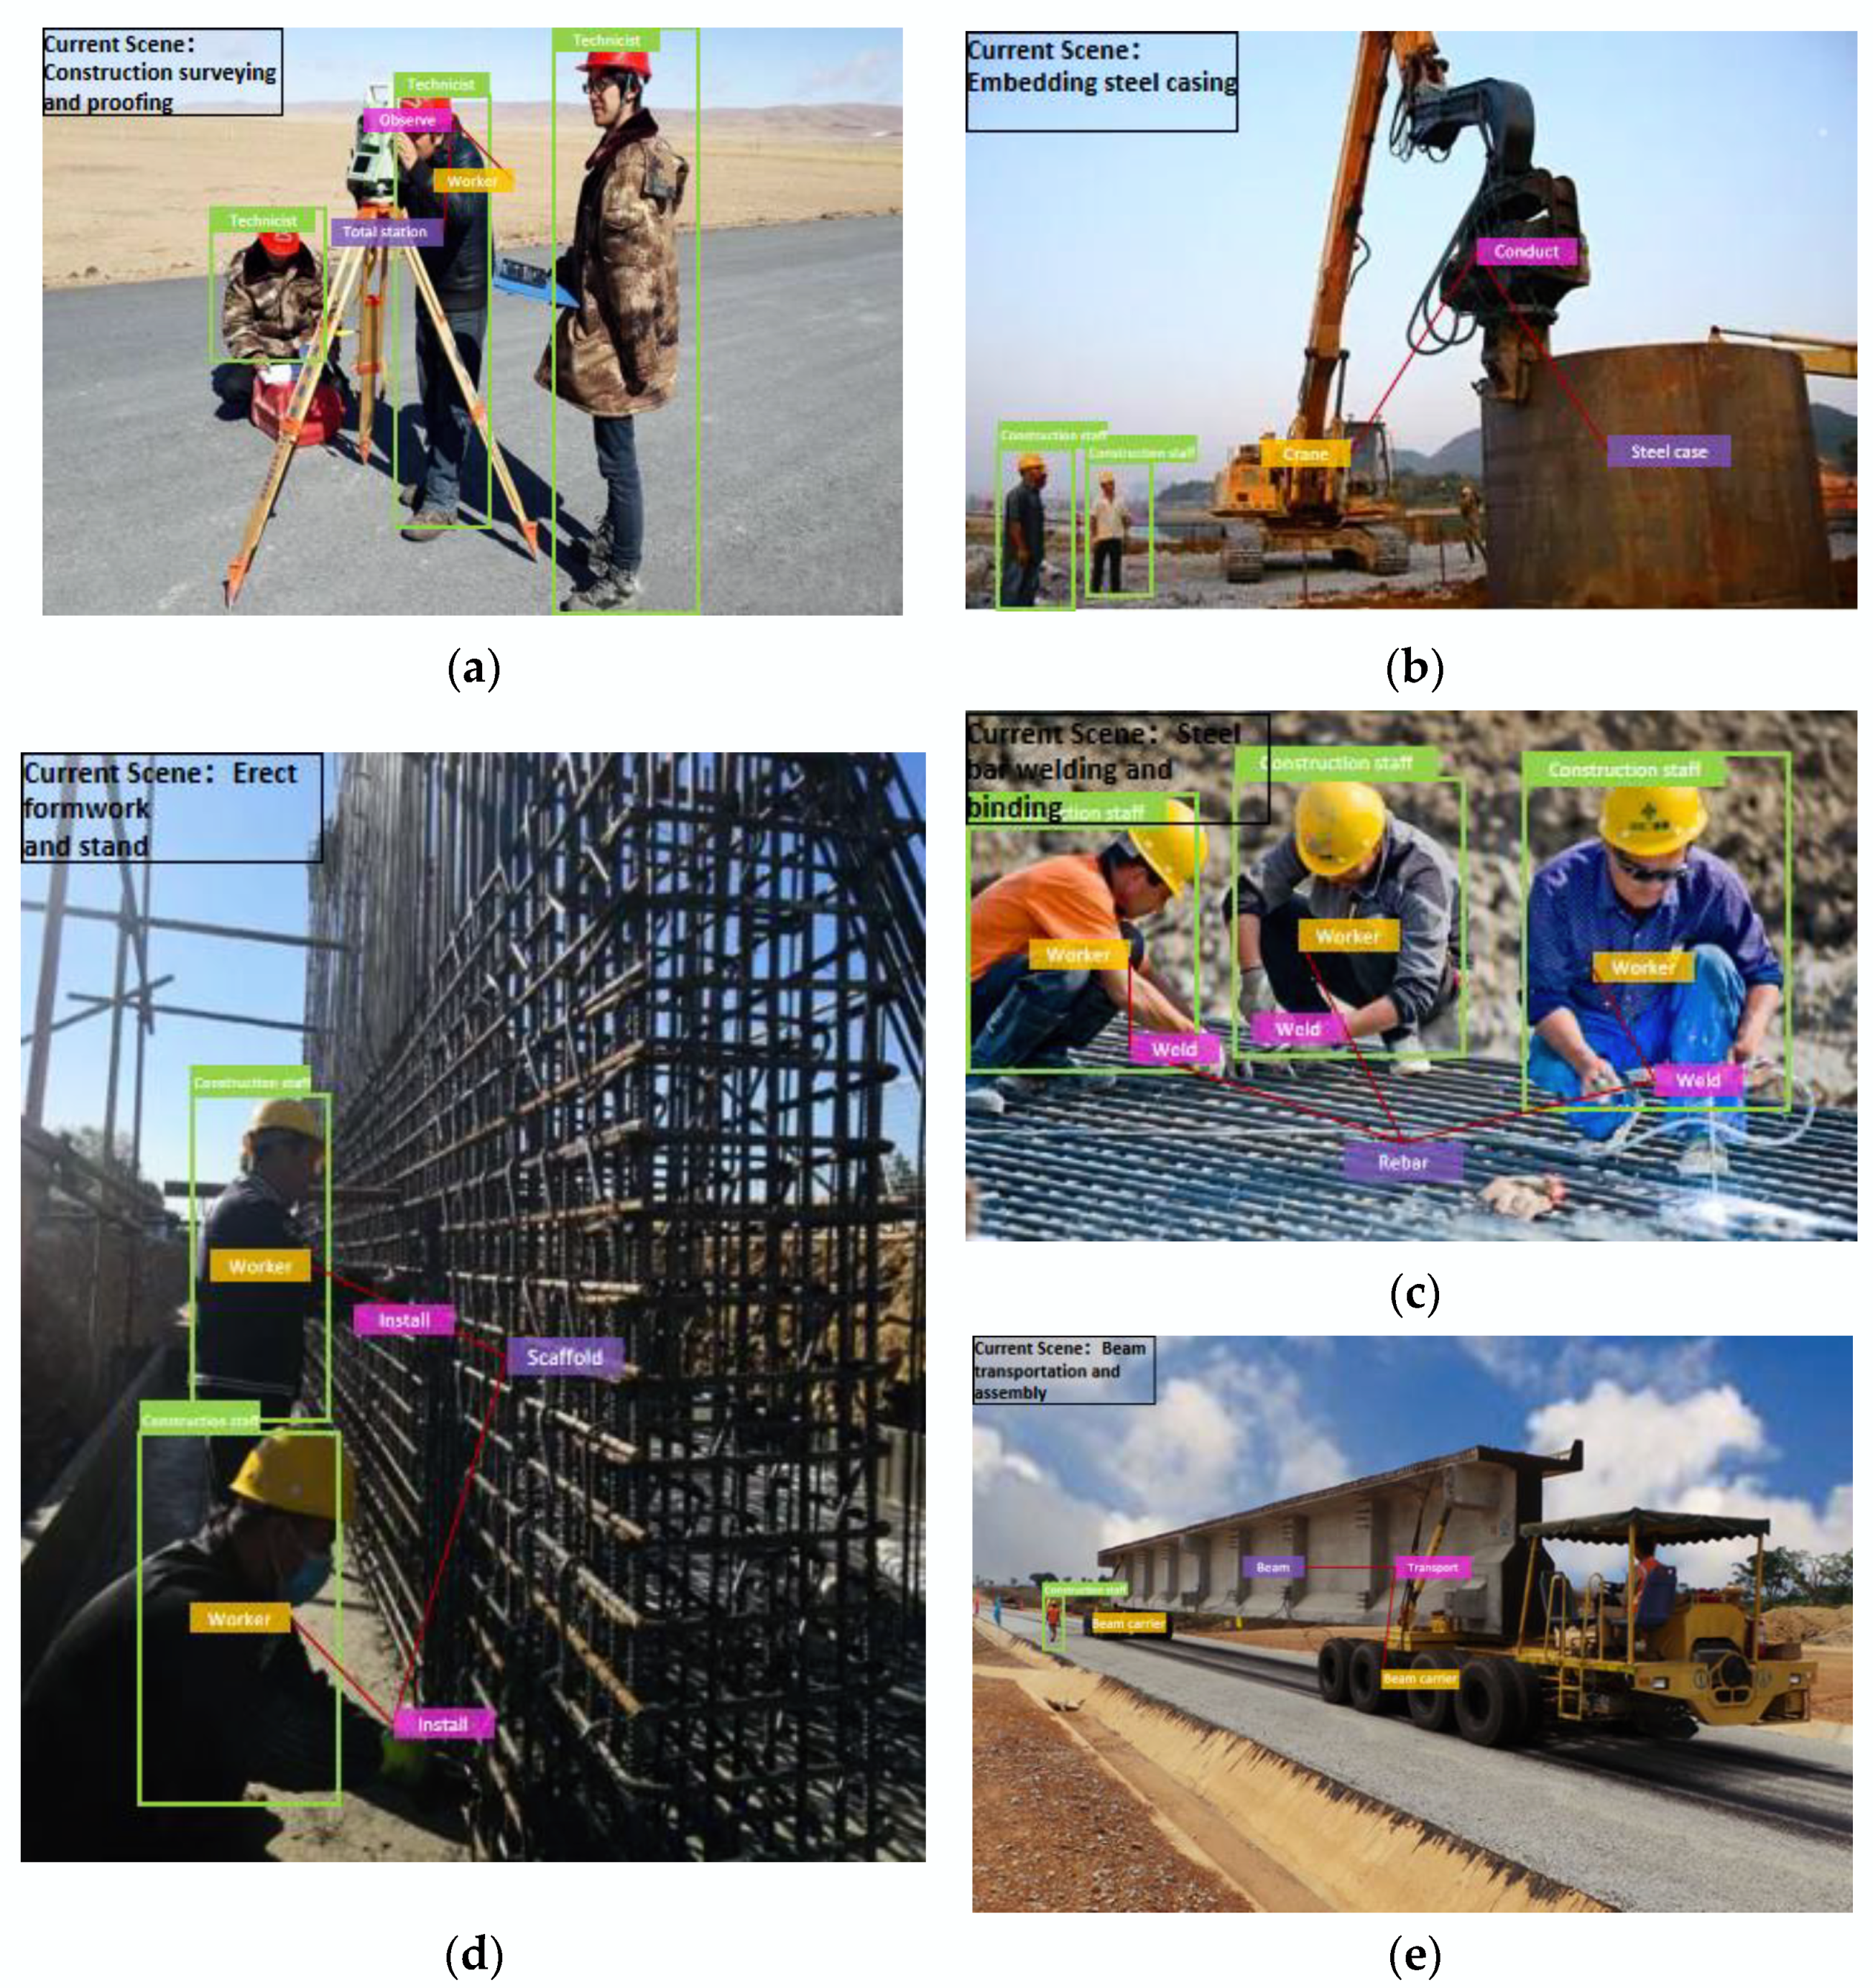
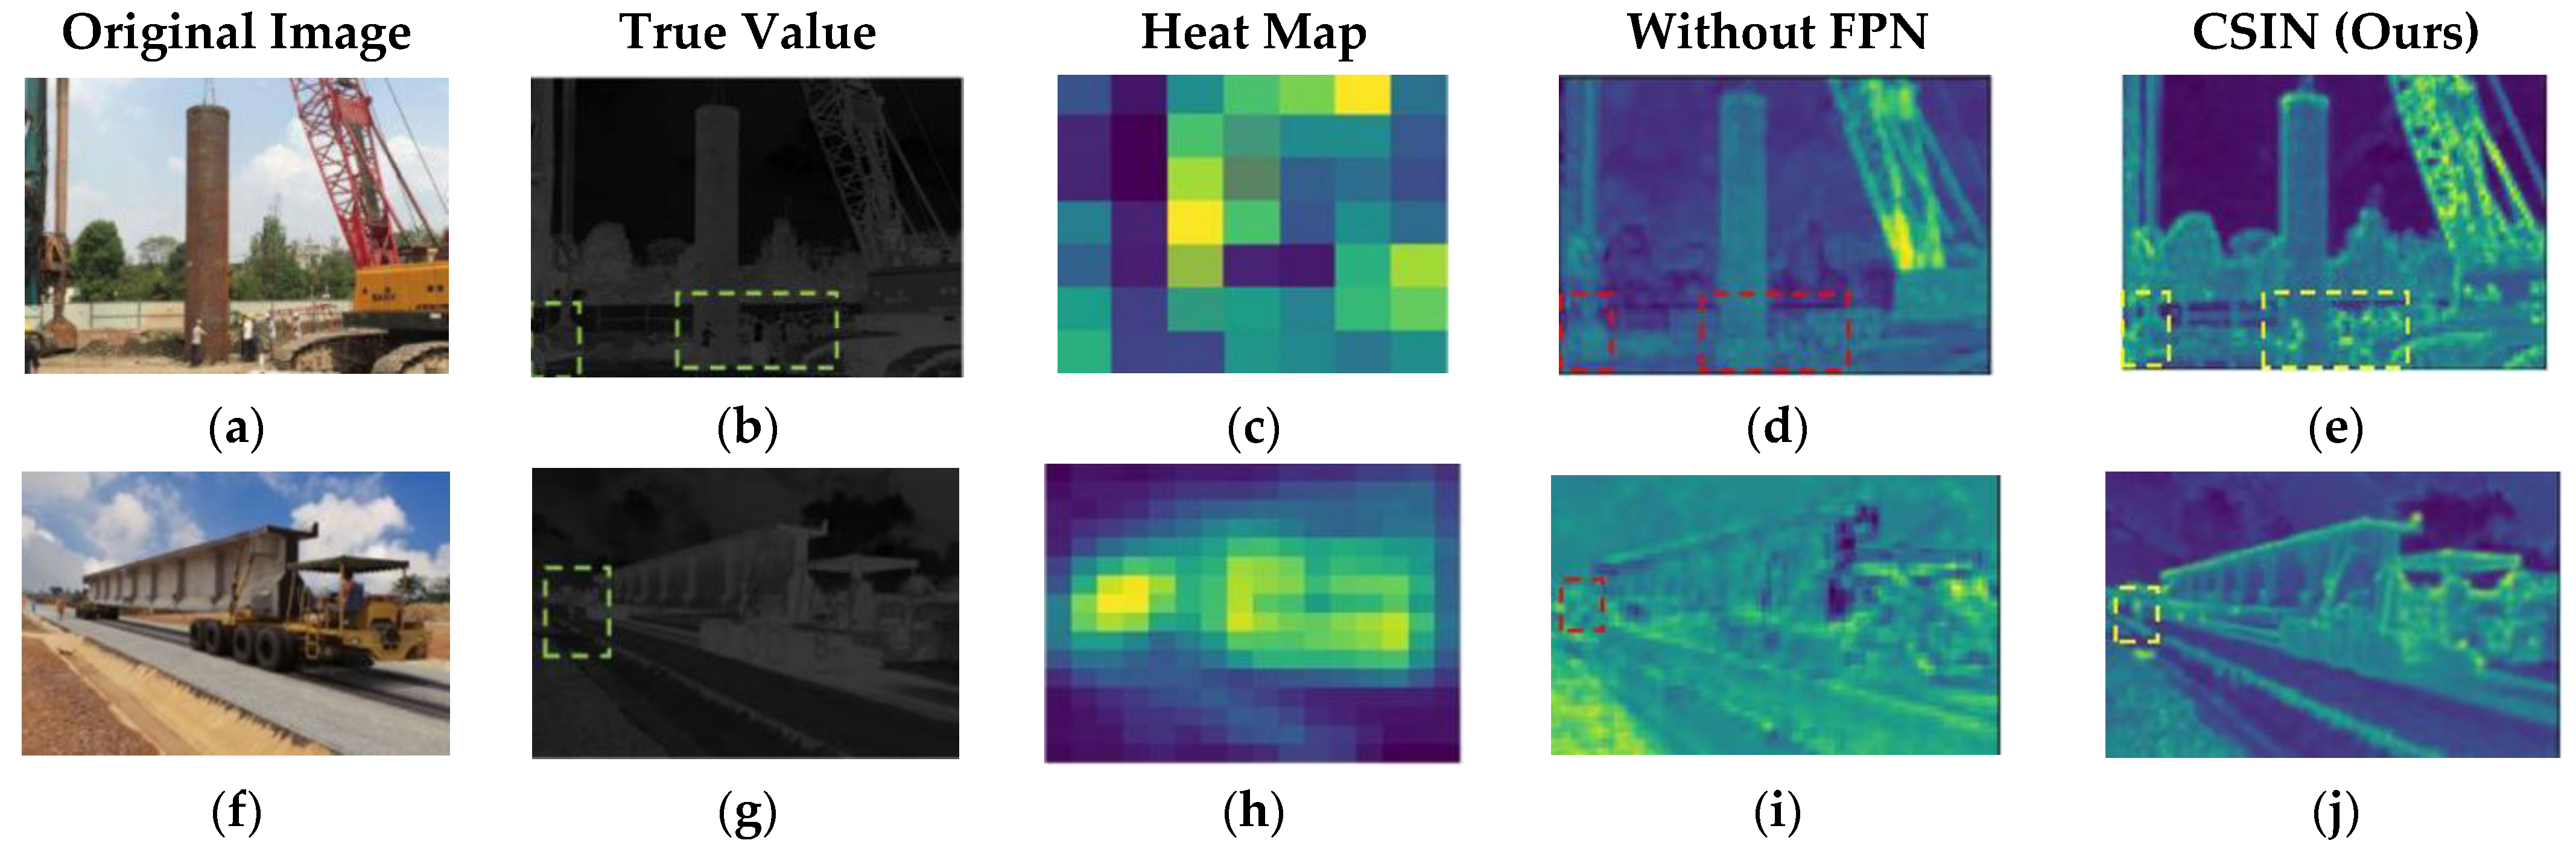
3.2.1. Scene Identification Results and Analysis
3.2.2. Scene Identification Accuracy and Analysis
3.3. Experimental Results and Analysis of Identification Model CSIN for Key Construction Scenes on Bridges
3.3.1. Experimental Results and Analysis of the Performance for the Scene Identification Model
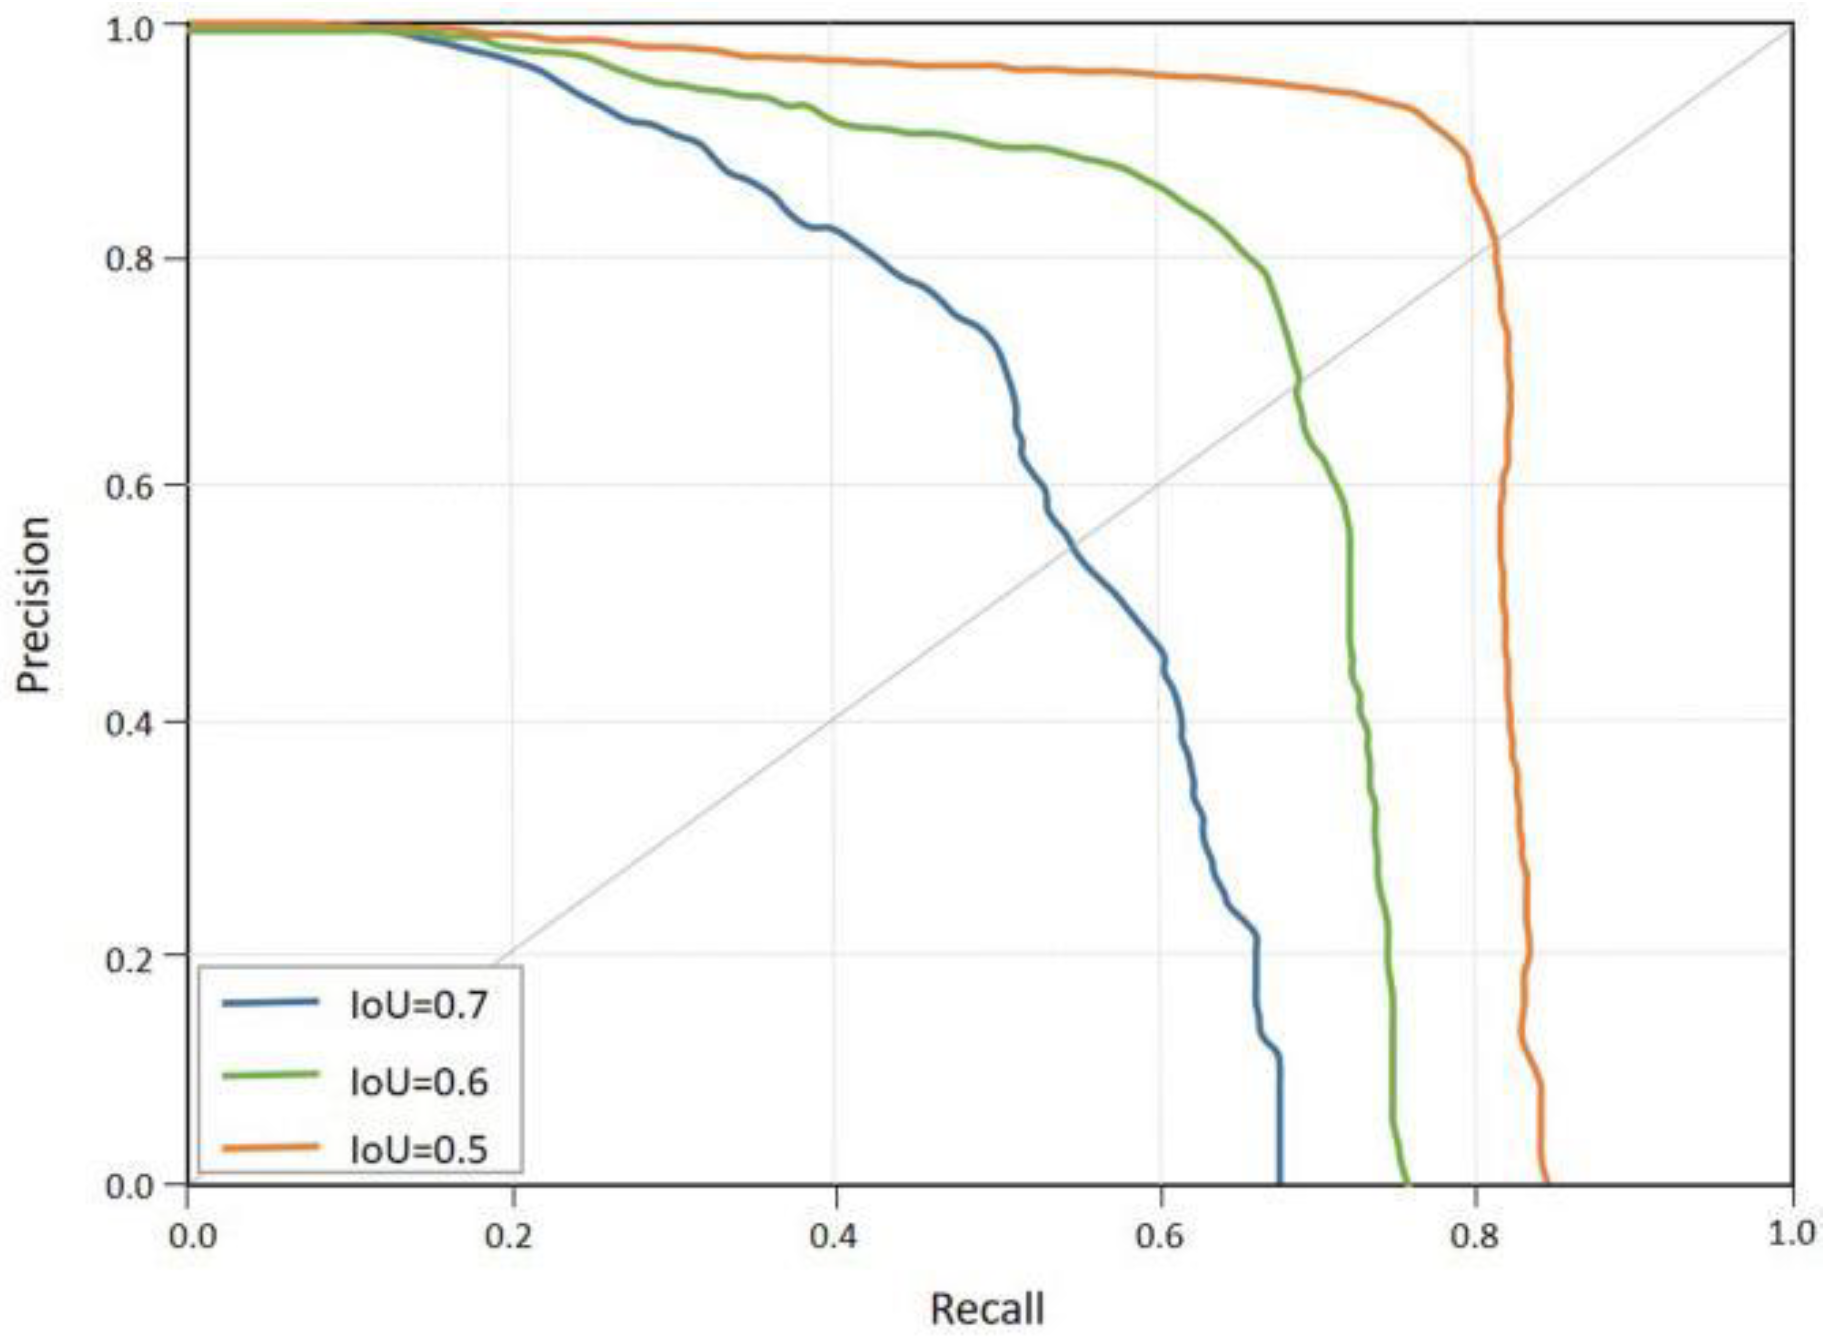
3.3.2. Comparative Experimental Results and Analysis of Specific Modules
Comparison Results and Analysis of Target Detection Module
Comparison Results and Analysis of the Visual Relationship Detection Module
4. Discussion
4.1. Robustness of Bridge Construction Scene Identification Rules
4.2. Stability of the CSIN Model Detection Frame
4.3. Generalization Capabilities of the CSIN Model
5. Conclusions
Supplementary Materials
Author Contributions
Funding
Institutional Review Board Statement
Informed Consent Statement
Data Availability Statement
Acknowledgments
Conflicts of Interest
References
- Ramos-Hurtado, J.; Rivera, M.-L.; Mora-Serrano, J.; Deraemaeker, A.; Valero, I. Proposal for the Deployment of an Augmented Reality Tool for Construction Safety Inspection. Buildings 2022, 12, 500. [Google Scholar] [CrossRef]
- Vasavi, S.; Sravanthi, G.L.; Ram, B.S.; Gokhale, A.A. Predictive analytics of bridge safety for intelligent transportation system using ensemble model. Mater. Today Proc. 2021, 45, 5608–5616. [Google Scholar] [CrossRef]
- Zhou, J.; Li, X.; Xia, R.; Yang, J.; Zhang, H. Health monitoring and evaluation of long-span bridges based on sensing and data analysis: A survey. Sensors 2017, 17, 603. [Google Scholar] [CrossRef] [PubMed] [Green Version]
- Munawar, H.S.; Ullah, F.; Shahzad, D.; Heravi, A.; Qayyum, S.; Akram, J. Civil Infrastructure Damage and Corrosion Detection: An Application of Machine Learning. Buildings 2022, 12, 156. [Google Scholar] [CrossRef]
- Wu, J.; Cai, N.; Chen, W.; Wang, H.; Wang, G. Automatic detection of hardhats worn by construction personnel: A deep learning approach and benchmark dataset. Autom. Constr. 2019, 106, 102894. [Google Scholar] [CrossRef]
- Lee, S.; Kim, H.; Lieu, Q.X.; Lee, J. CNN-based image recognition for topology optimization. Knowl. Based Syst. 2020, 198, 105887. [Google Scholar] [CrossRef]
- Zhang, L.; Wang, Y.; Chen, H.; Li, J.; Zhang, Z. Visual relationship detection with region topology structure. Inf. Sci. 2021, 564, 384–395. [Google Scholar] [CrossRef]
- Girshick, R.; Donahue, J.; Darrell, T.; Malik, J. Rich feature hierarchies for accurate object detection and semantic segmentation. In Proceedings of the IEEE Conference on Computer Vision and Pattern Recognition, Columbus, OH, USA, 23–28 June 2014; pp. 580–587. [Google Scholar]
- Lu, C.; Krishna, R.; Bernstein, M.; Fei-Fei, L. Visual relationship detection with language priors. In Proceedings of the European Conference on Computer Vision, Amsterdam, The Netherlands, 11–14 October 2016; Springer: Berlin/Heidelberg, Germany, 2016; pp. 852–869. [Google Scholar]
- Zhang, H.; Kyaw, Z.; Chang, S.-F.; Chua, T.-S. Visual translation embedding network for visual relation detection. In Proceedings of the IEEE Conference on Computer Vision and Pattern Recognition, Honolulu, HI, USA, 21–26 July 2017; pp. 5532–5540. [Google Scholar]
- Zhuang, B.; Liu, L.; Shen, C.; Reid, I. Towards context-aware interaction recognition for visual relationship detection. In Proceedings of the IEEE International Conference on Computer Vision, Venice, Italy, 22–29 October 2017; pp. 589–598. [Google Scholar]
- Dai, B.; Zhang, Y.; Lin, D. Detecting visual relationships with deep relational networks. In Proceedings of the IEEE Conference on Computer Vision and Pattern Recognition, Honolulu, HI, USA, 21–26 July 2017; pp. 3076–3086. [Google Scholar]
- Li, Y.; Ouyang, W.; Wang, X.; Tang, X. Vip-cnn: Visual phrase guided convolutional neural network. In Proceedings of the IEEE Conference on Computer Vision and Pattern Recognition, Honolulu, HI, USA, 21–26 July 2017; pp. 1347–1356. [Google Scholar]
- Yin, G.; Sheng, L.; Liu, B.; Yu, N.; Wang, X.; Shao, J.; Loy, C.C. Zoom-net: Mining deep feature interactions for visual relationship recognition. In Proceedings of the European Conference on Computer Vision (ECCV), Munich, Germany, 8–14 September 2018; pp. 322–338. [Google Scholar]
- Kim, J.; Chi, S.; Seo, J. Interaction analysis for vision-based activity identification of earthmoving excavators and dump trucks. Autom. Constr. 2018, 87, 297–308. [Google Scholar] [CrossRef]
- Xiong, R.; Song, Y.; Li, H.; Wang, Y. Onsite video mining for construction hazards identification with visual relationships. Adv. Eng. Inform. 2019, 42, 100966. [Google Scholar] [CrossRef]
- Zhang, J.; Shih, K.J.; Elgammal, A.; Tao, A.; Catanzaro, B. Graphical contrastive losses for scene graph parsing. In Proceedings of the IEEE/CVF Conference on Computer Vision and Pattern Recognition, Long Beach, CA, USA, 15–20 June 2019; pp. 11535–11543. [Google Scholar]
- Albawi, S.; Mohammed, T.A.; Al-Zawi, S. Understanding of a convolutional neural network. In Proceedings of the 2017 International Conference on Engineering and Technology (ICET), Antalya, Turkey, 21–23 August 2017; pp. 1–6. [Google Scholar]
- Peng, Y.; Chen, D.Z.; Lin, L. Visual Relationship Detection with A Deep Convolutional Relationship Network. In Proceedings of the 2020 IEEE International Conference on Image Processing (ICIP), Abu Dhabi, United Arab Emirates, 25–28 October 2020; pp. 1461–1465. [Google Scholar]
- Lin, T.-Y.; Dollár, P.; Girshick, R.; He, K.; Hariharan, B.; Belongie, S. Feature pyramid networks for object detection. In Proceedings of the IEEE Conference on Computer Vision and Pattern Recognition, Honolulu, HI, USA, 21–26 July 2017; pp. 2117–2125. [Google Scholar]
- Keen, N. Color moments. Sch. Inform. Univ. Edinb. 2005, 3–6. Available online: https://homepages.inf.ed.ac.uk/rbf/CVonline/LOCAL_COPIES/AV0405/KEEN/av_as2_nkeen.pdf (accessed on 28 April 2022).
- He, K.; Zhang, X.; Ren, S.; Sun, J. Deep residual learning for image recognition. In Proceedings of the IEEE Conference on Computer Vision and Pattern Recognition, Las Vegas, NV, USA, 27–30 June 2016; pp. 770–778. [Google Scholar]
- Zuo, G.; Tong, J.; Liu, H.; Chen, W.; Li, J. Graph-Based Visual Manipulation Relationship Reasoning Network for Robotic Grasping. Front. Neurorobotics 2021, 15, 719731. [Google Scholar] [CrossRef] [PubMed]
- Kuznetsova, P.; Ordonez, V.; Berg, A.; Berg, T.; Choi, Y. Collective generation of natural image descriptions. In Proceedings of the 50th Annual Meeting of the Association for Computational Linguistics: Long Papers, Jeju Island, Korea, 8–14 July 2012; Volume 1, pp. 359–368. [Google Scholar]
- Kuznetsova, P.; Ordonez, V.; Berg, T.L.; Choi, Y. Treetalk: Composition and compression of trees for image descriptions. Trans. Assoc. Comput. Linguist. 2014, 2, 351–362. [Google Scholar] [CrossRef]
- Zellers, R.; Yatskar, M.; Thomson, S.; Choi, Y. Neural motifs: Scene graph parsing with global context. In Proceedings of the IEEE Conference on Computer Vision and Pattern Recognition, Salt Lake City, UT, USA, 18–23 June 2018; pp. 5831–5840. [Google Scholar]
- Li, W.; Duan, L.; Xu, D.; Tsang, I.W.-H. Text-based image retrieval using progressive multi-instance learning. In Proceedings of the 2011 International Conference on Computer Vision, Barcelona, Spain, 6–13 November 2011; pp. 2049–2055. [Google Scholar]
- Gupta, D. Architecture of Convolutional Neural Networks (cnns) Demystified. Anal. Vidhya 2017. Available online: https://www.analyticsvidhya.com/blog/2017/06/architecture-ofconvolutional-neural-networks-simplified-demystified/ (accessed on 28 April 2022).
- Vinyals, O.; Toshev, A.; Bengio, S.; Erhan, D. Show and tell: Lessons learned from the 2015 mscoco image captioning challenge. IEEE Trans. Pattern Anal. Mach. Intell. 2016, 39, 652–663. [Google Scholar] [CrossRef] [PubMed] [Green Version]
- Chen, H.; Ding, G.; Lin, Z.; Zhao, S.; Han, J. Cross-modal image-text retrieval with semantic consistency. In Proceedings of the 27th ACM International Conference on Multimedia, New York, NY, USA, 21–25 October 2019; pp. 1749–1757. [Google Scholar]
- Zhang, J.; Kalantidis, Y.; Rohrbach, M.; Paluri, M.; Elgammal, A.; Elhoseiny, M. Large-scale visual relationship understanding. Proc. AAAI Conf. Artif. Intell. 2019, 33, 9185–9194. [Google Scholar] [CrossRef] [Green Version]
- Yang, J.; Lu, J.; Lee, S.; Batra, D.; Parikh, D. Graph r-cnn for scene graph generation. In Proceedings of the European Conference on Computer Vision (ECCV), Munich, Germany, 8–14 September 2018; pp. 670–685. [Google Scholar]
- Thagard, P. Naturalizing logic: How knowledge of mechanisms enhances inductive inference. Philosophies 2021, 6, 52. [Google Scholar] [CrossRef]
- Brisson, J.; Markovits, H. Reasoning strategies and semantic memory effects in deductive reasoning. Mem. Cogn. 2020, 48, 920–930. [Google Scholar] [CrossRef] [PubMed]
- Weldu, Y.W.; Knapp, G.M. Automated generation of 4D building information models through spatial reasoning. In Proceedings of the Construction Research Congress 2012: Construction Challenges in a Flat World, West Lafayette, Indiana, 21–23 May 2012; pp. 612–621. [Google Scholar]
- de Soto, B.G.; Rosarius, A.; Rieger, J.; Chen, Q.; Adey, B.T. Using a Tabu-search algorithm and 4D models to improve construction project schedules. Procedia Eng. 2017, 196, 698–705. [Google Scholar] [CrossRef]
- Zhang, L.; Long, C.; Zhang, X.; Xiao, C. Ris-gan: Explore residual and illumination with generative adversarial networks for shadow removal. Proc. AAAI Conf. Artif. Intell. 2020, 34, 12829–12836. [Google Scholar] [CrossRef]
- Wu, M.; Chen, R.; Tong, Y. Shadow elimination algorithm using color and texture features. Comput. Intell. Neurosci. 2020, 2020, 2075781. [Google Scholar] [CrossRef] [PubMed]
- Sandhya, N.; Marathe, A.; Ahmed, J.D.; Kumar, A.; Harshith, R. Convolutional Neural Network Based Approach to Detect Pedestrians in Real-Time videos. Int. J. Innov. Technol. Explor. Eng. 2020, 10, 303–308. [Google Scholar]
- Yan, H.; Song, C. Multi-scale deep relational reasoning for facial kinship verification. Pattern Recognit. 2021, 110, 107541. [Google Scholar] [CrossRef]


| (A) | |||||||||||||||||||
| Scenes | Construction Equipment | ||||||||||||||||||
| Name | Shape | Color | Principle | ||||||||||||||||
| Total Station | Crane | Drilling Rig | Scaffold | Welding Machine | Beam Carrier | Gantry Crane | Column | Circle | Rectangle | Red | Yellow | Gray | Transporter | Crane Arm | Load Hook | ||||
| ① | √ | √ | |||||||||||||||||
| ② | √ | √ | √ | ||||||||||||||||
| ③ | √ | √ | |||||||||||||||||
| ④ | √ | √ | √ | ||||||||||||||||
| ⑤ | √ | √ | √ | √ | |||||||||||||||
| (B) | |||||||||||||||||||
| Scenes | Construction Personnel | Construction Materials | |||||||||||||||||
| Posture | Identity | Location | |||||||||||||||||
| Observe | Command | Stand | Install | Weld | Transport | Yellow Helmet | Blue Helmet | Red Helmet | White Helmet | On the Ground | In the Transporter | On the Stand | On the Steel | Rebar | Stand | Beam | Concrete | ||
| ① | √ | √ | √ | √ | |||||||||||||||
| ② | √ | √ | √ | ||||||||||||||||
| ③ | √ | √ | √ | √ | √ | ||||||||||||||
| ④ | √ | √ | √ | √ | |||||||||||||||
| ⑤ | √ | √ | √ | √ | |||||||||||||||
| Color Classification | Red Helmet | Yellow Helmet | Blue Helmet | White Helmet |
|---|---|---|---|---|
| Worker status | Technicist | Construction staff | Supervisor | Safety supervisor |
| Bridge Construction Scene | Number of Images | Visual Relationship | ||
|---|---|---|---|---|
| Subject | Predicate | Object | ||
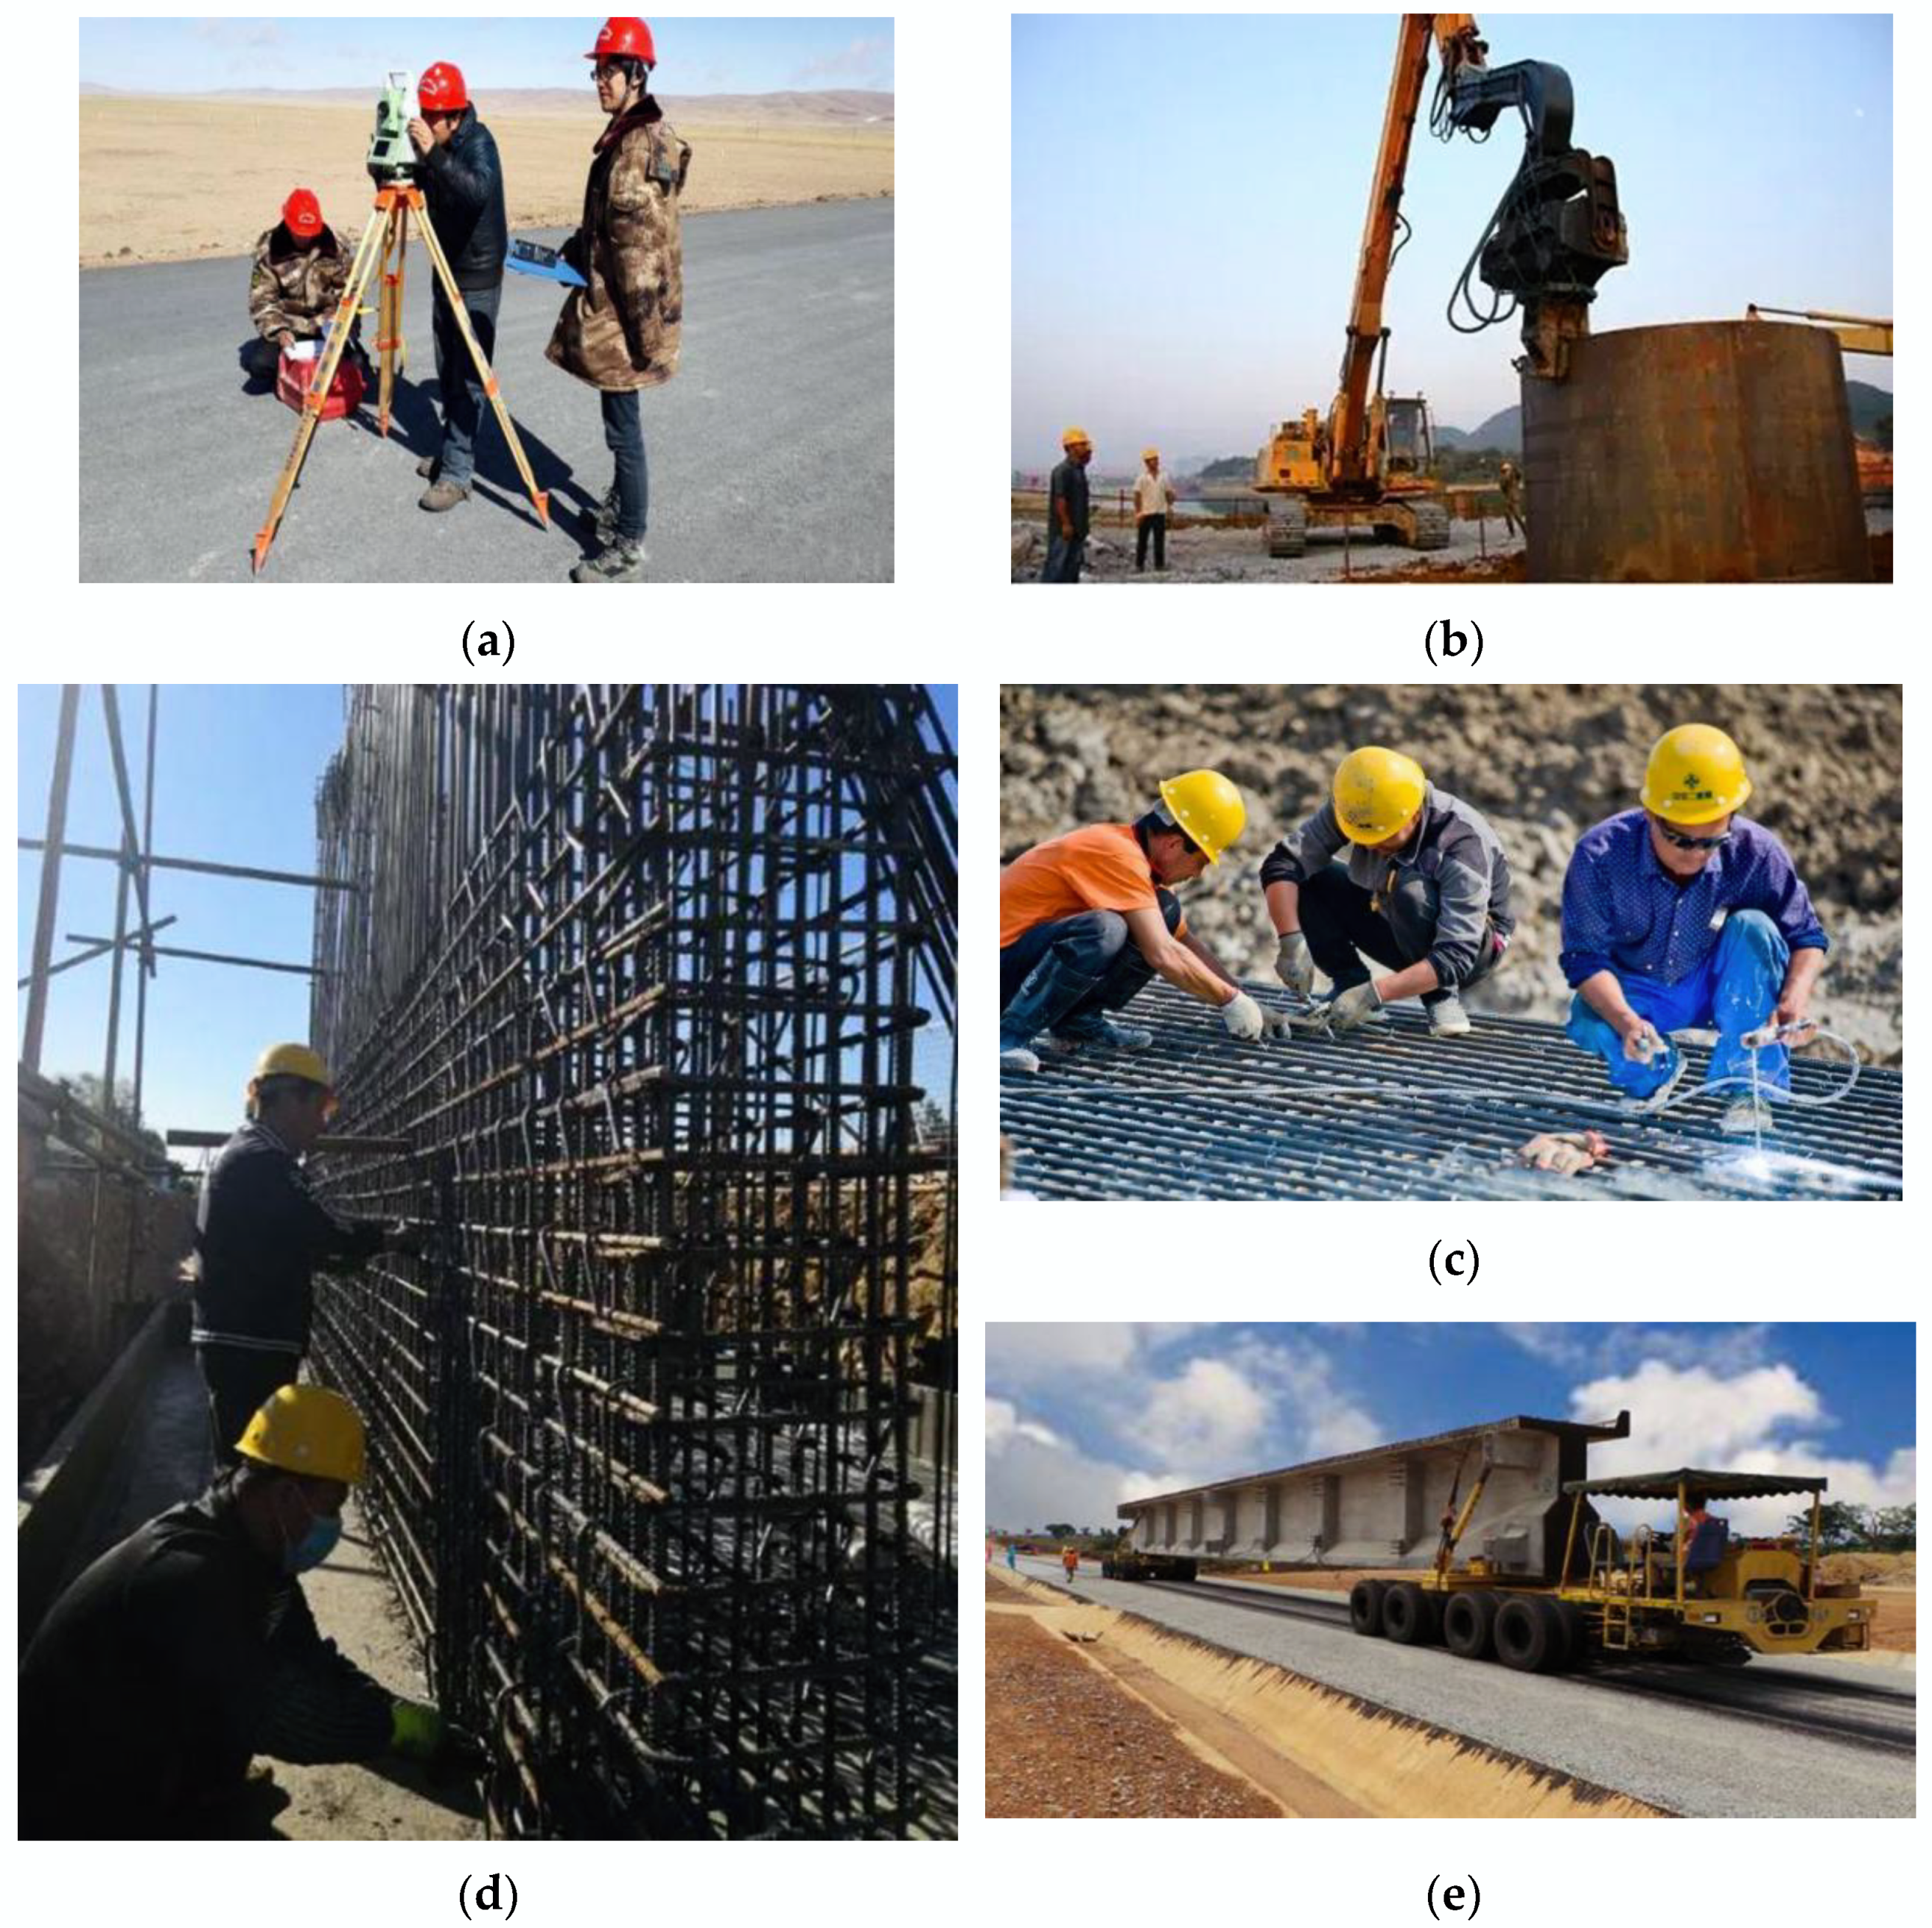
| Construction surveying and proofing | 95 | Worker | Observe | Total station |
| Embedding steel casing | 90 | Crane | Conduct | Steel case |
| Erect formwork and stand | 90 | Worker | Install | Scaffold |
| Steel bar welding and binding | 100 | Worker | Weld | Rebar |
| Beam transportation and assembly | 90 | Beam carrier | Transport | Beam |
| Intermediate Results | Final Results | ||||
|---|---|---|---|---|---|
| Figure | Target Detection Results | Visual Relationship Detection Results | Construction Scene Category Information | ||
| Subject | Predicate | Object | |||
| A | Technicist | Worker | Observe | Total station | Construction surveying and proofing |
| B | Construction staff | Crane | Conduct | Steel case | Embedding steel casing |
| C | Construction staff | Worker | Weld | Rebar | Erect formwork and stand |
| D | Construction staff | Worker | Install | Stand | Steel bar welding and binding |
| E | Construction staff | Beam carrier | Transport | Beam | Beam transportation and assembly |
| True Value | Precision (%) | ||||||
| Predicted Value | ① | ② | ③ | ④ | ⑤ | ||
| ① | 37 | 100 | |||||
| ② | 35 | 100 | |||||
| ③ | 31 | 3 | 91.2 | ||||
| ④ | 6 | 34 | 85.0 | ||||
| ⑤ | 2 | 37 | 94.9 | ||||
| Recall (%) | 100 | 94.6 | 83.8 | 91.9 | 100 | ||
| Accuracy (%) = 94 | |||||||
| Subject Detection | Object Detection | Predicate Detection | |||||||
|---|---|---|---|---|---|---|---|---|---|
| Recall at (%) | 20 | 50 | 100 | 20 | 50 | 100 | 20 | 50 | 100 |
| Large-Scale | 20.7 | 27.9 | 32.5 | 36.0 | 36.7 | 36.7 | 66.8 | 68.4 | 68.4 |
| Motifs | 21.4 | 27.2 | 30.3 | 32.9 | 35.8 | 36.5 | 58.5 | 65.2 | 67.1 |
| VRD | - | 0.3 | 0.5 | - | 11.8 | 14.1 | - | 27.9 | 35.0 |
| Graph R-CNN | - | 28.5 | 35.9 | - | 29.6 | 31.6 | - | 54.2 | 59.1 |
| CSIN (ours) | 35.9 | 37.8 | 42.4 | 36.1 | 36.7 | 37.0 | 65.3 | 67.9 | 69.3 |
Publisher’s Note: MDPI stays neutral with regard to jurisdictional claims in published maps and institutional affiliations. |
© 2022 by the authors. Licensee MDPI, Basel, Switzerland. This article is an open access article distributed under the terms and conditions of the Creative Commons Attribution (CC BY) license (https://creativecommons.org/licenses/by/4.0/).
Share and Cite
Wang, C.; Lv, J.; Geng, Y.; Liu, Y. Visual Relationship-Based Identification of Key Construction Scenes on Highway Bridges. Buildings 2022, 12, 827. https://doi.org/10.3390/buildings12060827
Wang C, Lv J, Geng Y, Liu Y. Visual Relationship-Based Identification of Key Construction Scenes on Highway Bridges. Buildings. 2022; 12(6):827. https://doi.org/10.3390/buildings12060827
Chicago/Turabian StyleWang, Chen, Jingguo Lv, Yu Geng, and Yiting Liu. 2022. "Visual Relationship-Based Identification of Key Construction Scenes on Highway Bridges" Buildings 12, no. 6: 827. https://doi.org/10.3390/buildings12060827
APA StyleWang, C., Lv, J., Geng, Y., & Liu, Y. (2022). Visual Relationship-Based Identification of Key Construction Scenes on Highway Bridges. Buildings, 12(6), 827. https://doi.org/10.3390/buildings12060827