
Dynamic Network Analysis of the Risks of Mega Infrastructure Projects from a Sustainable Development Perspective


Abstract
:1. Introduction
2. Literature Review
2.1. Risks of MIPs
2.2. Analysis of MIPs’ Risk Relationship
3. Methods and Data
3.1. Research Process
3.2. Step 1: Identify MIPs’ Risks
3.3. Step 2: Establish Risk Network
3.4. Step 3: Network Analysis
4. Results
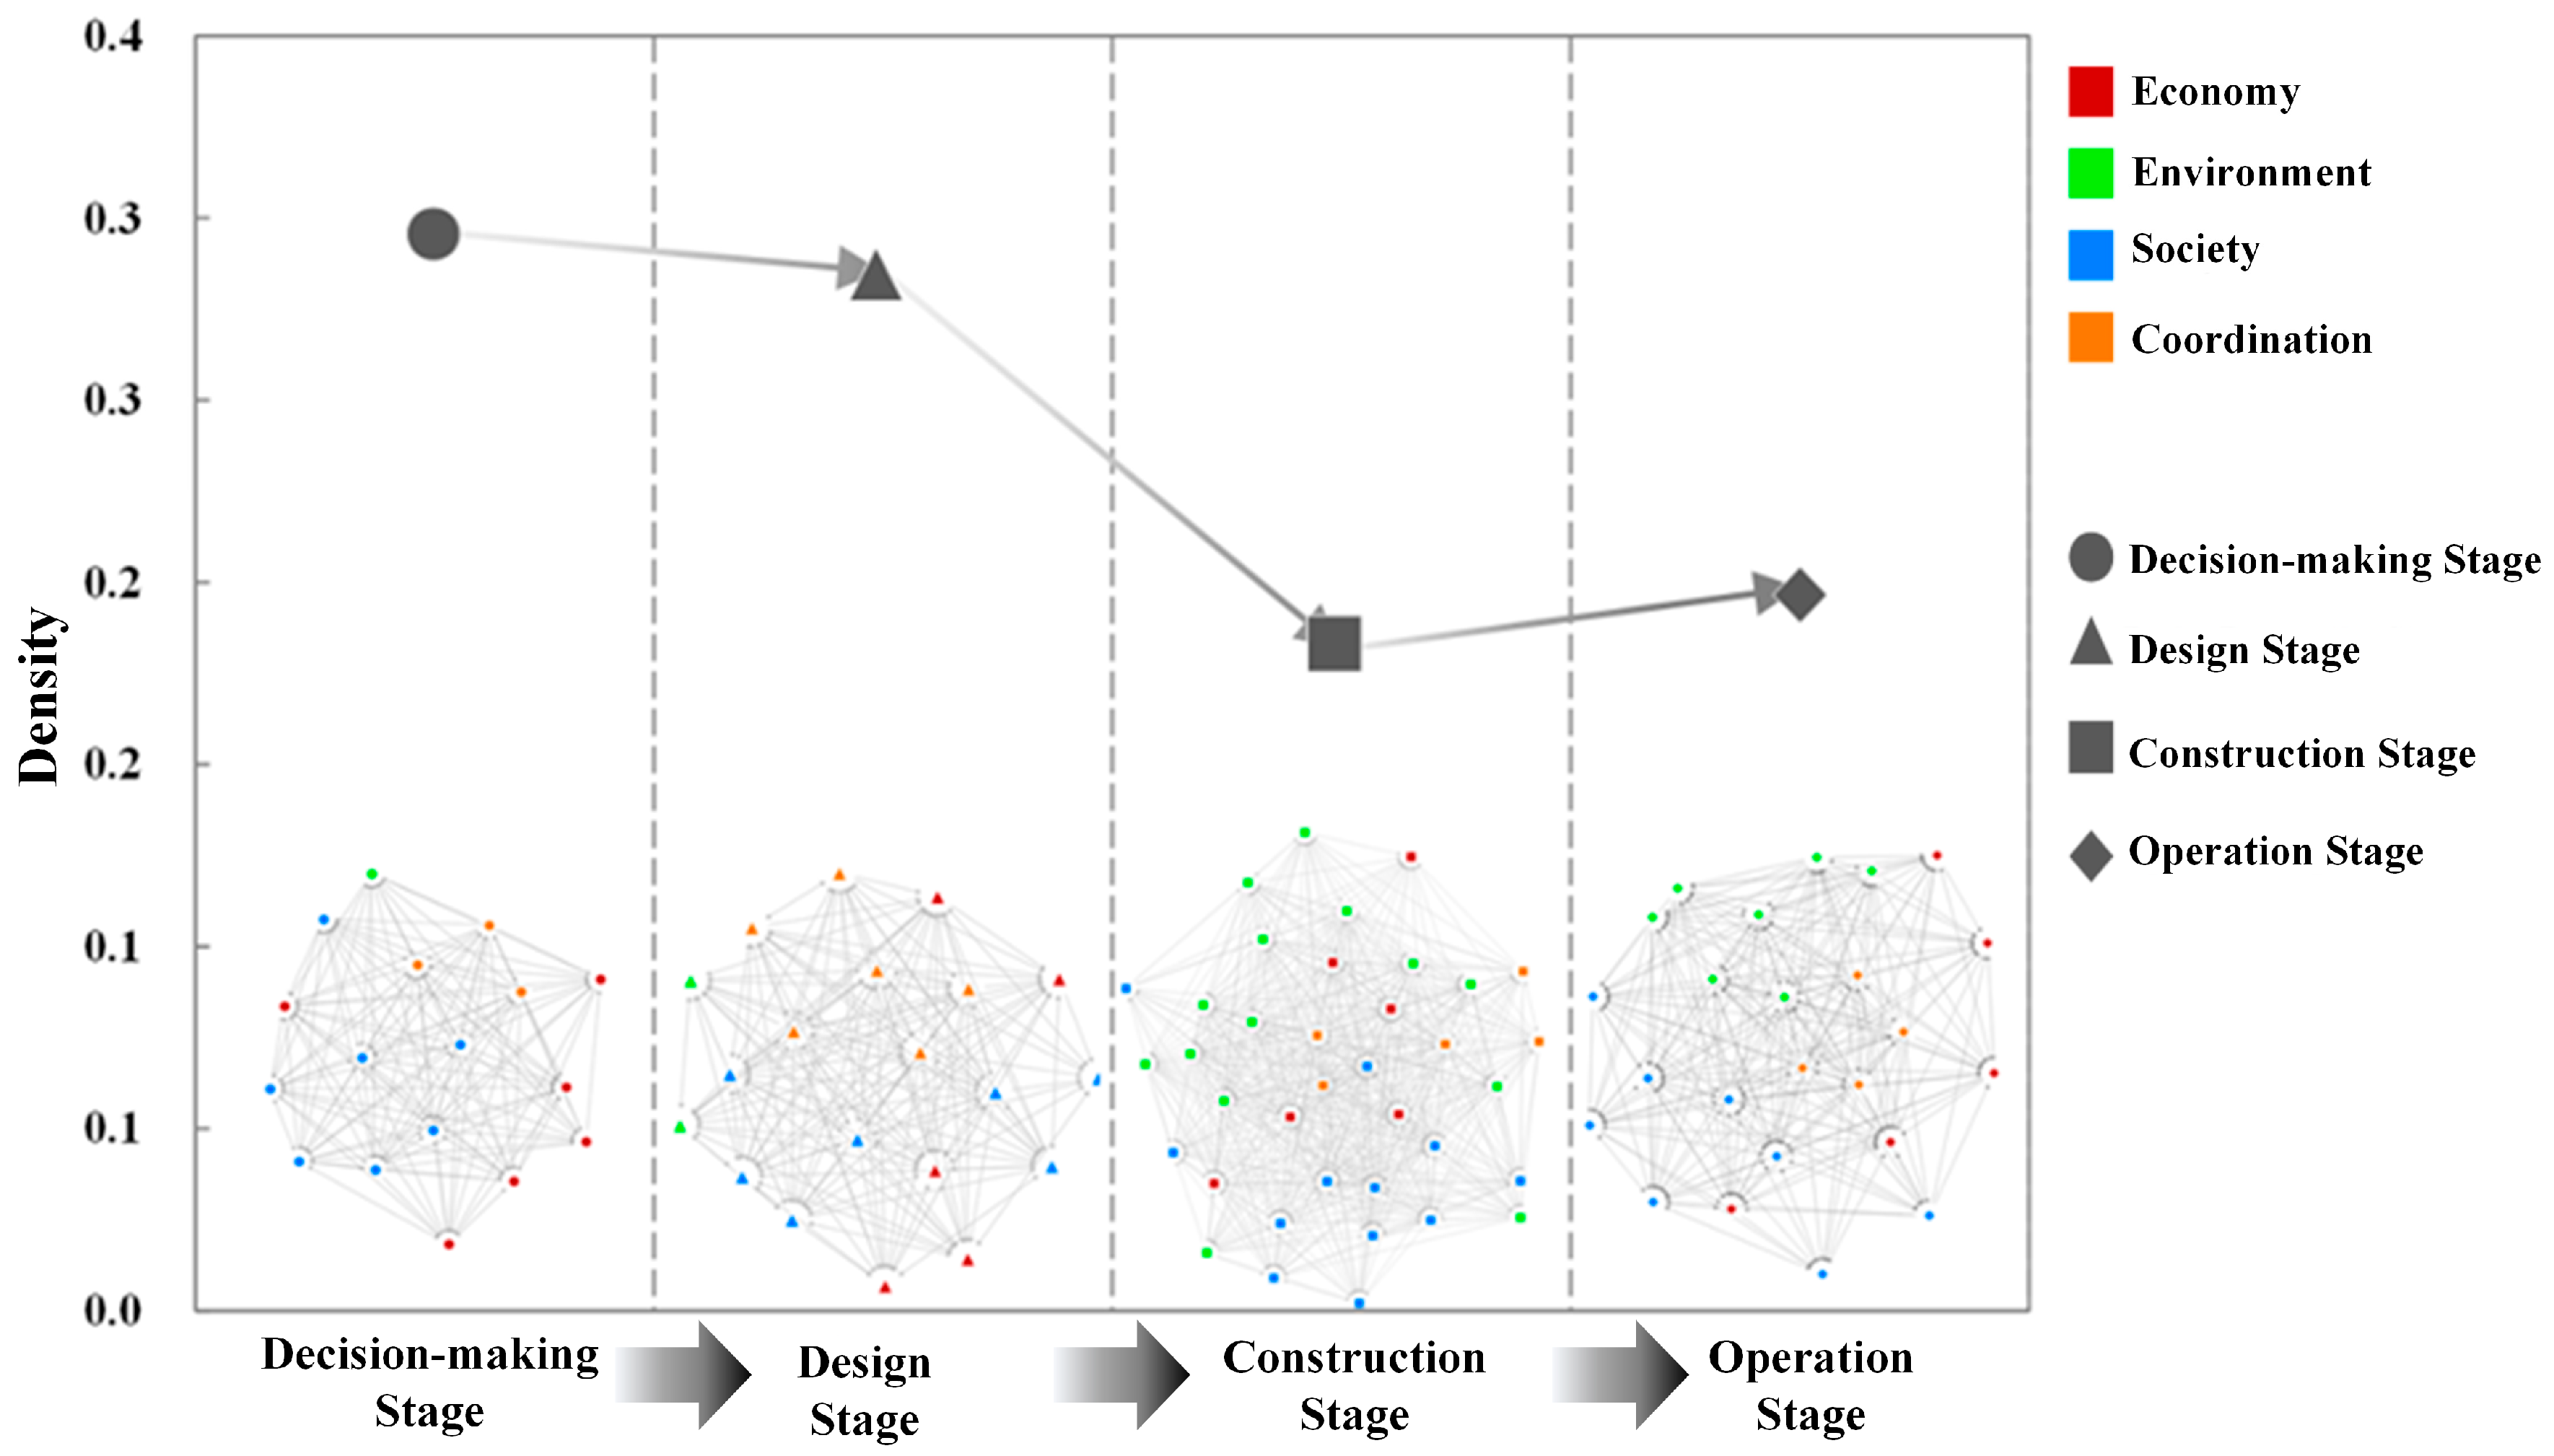
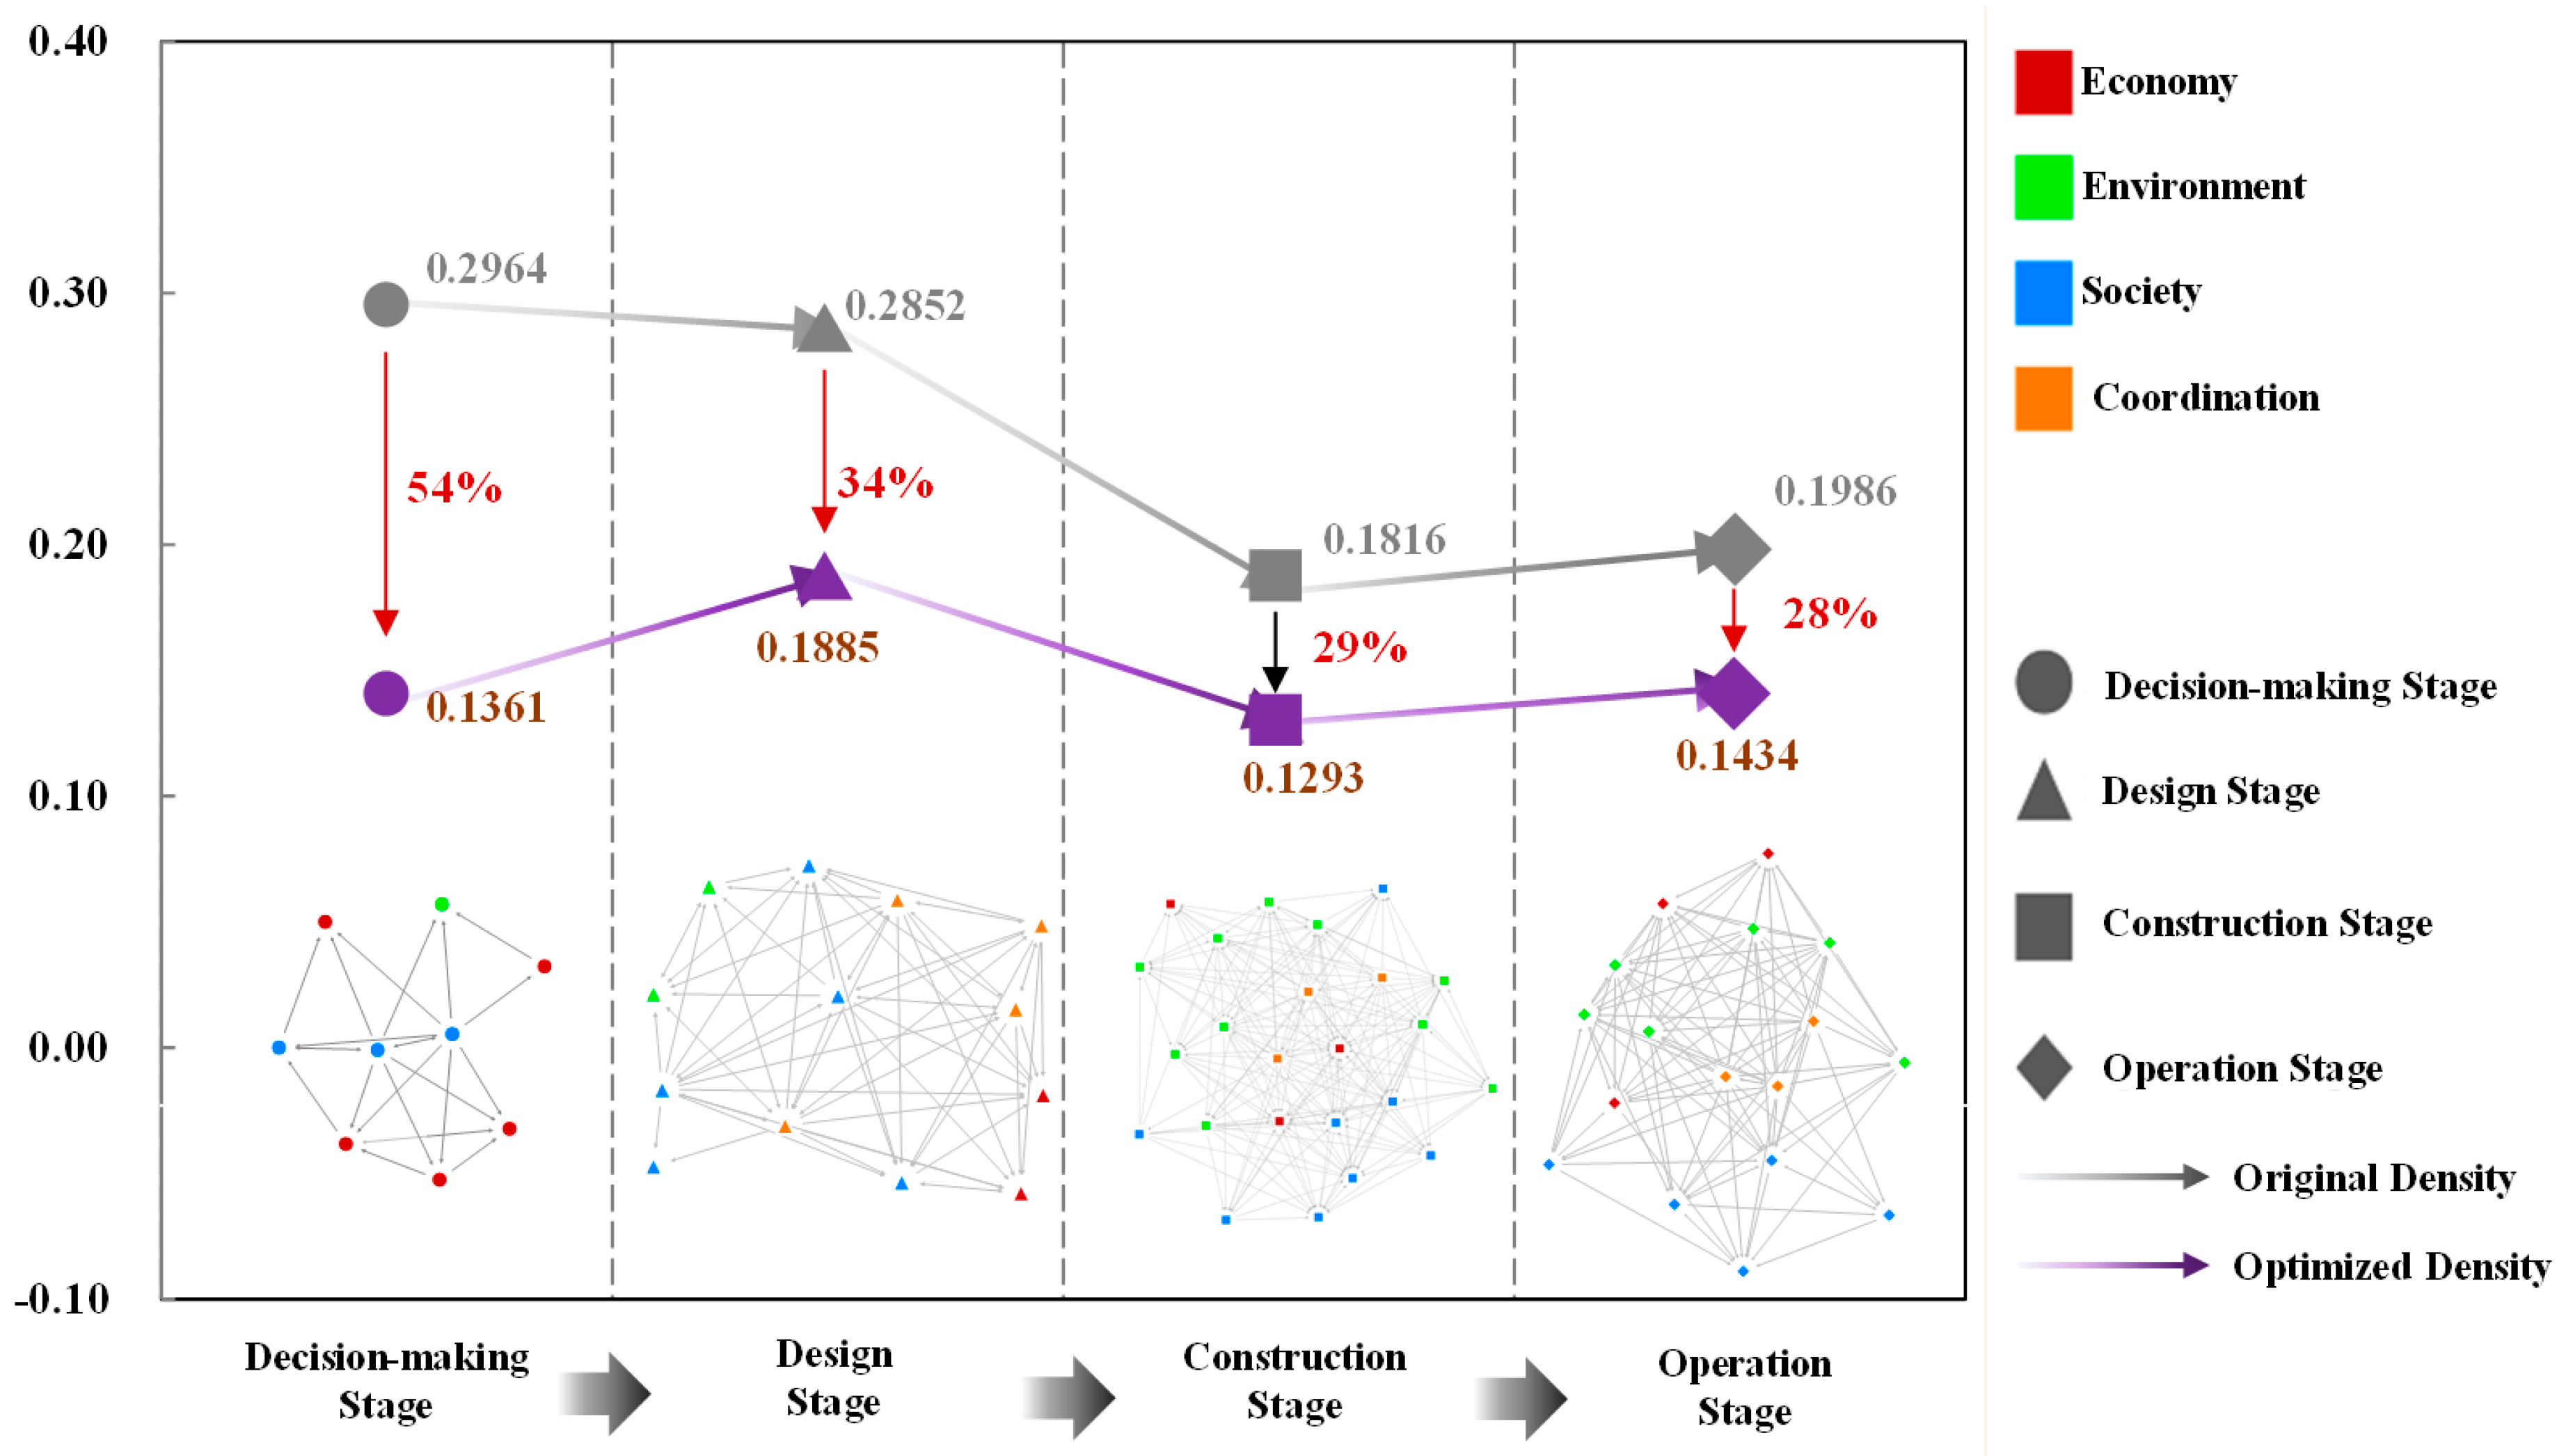
4.1. Network Level Results
4.2. Node Level Results
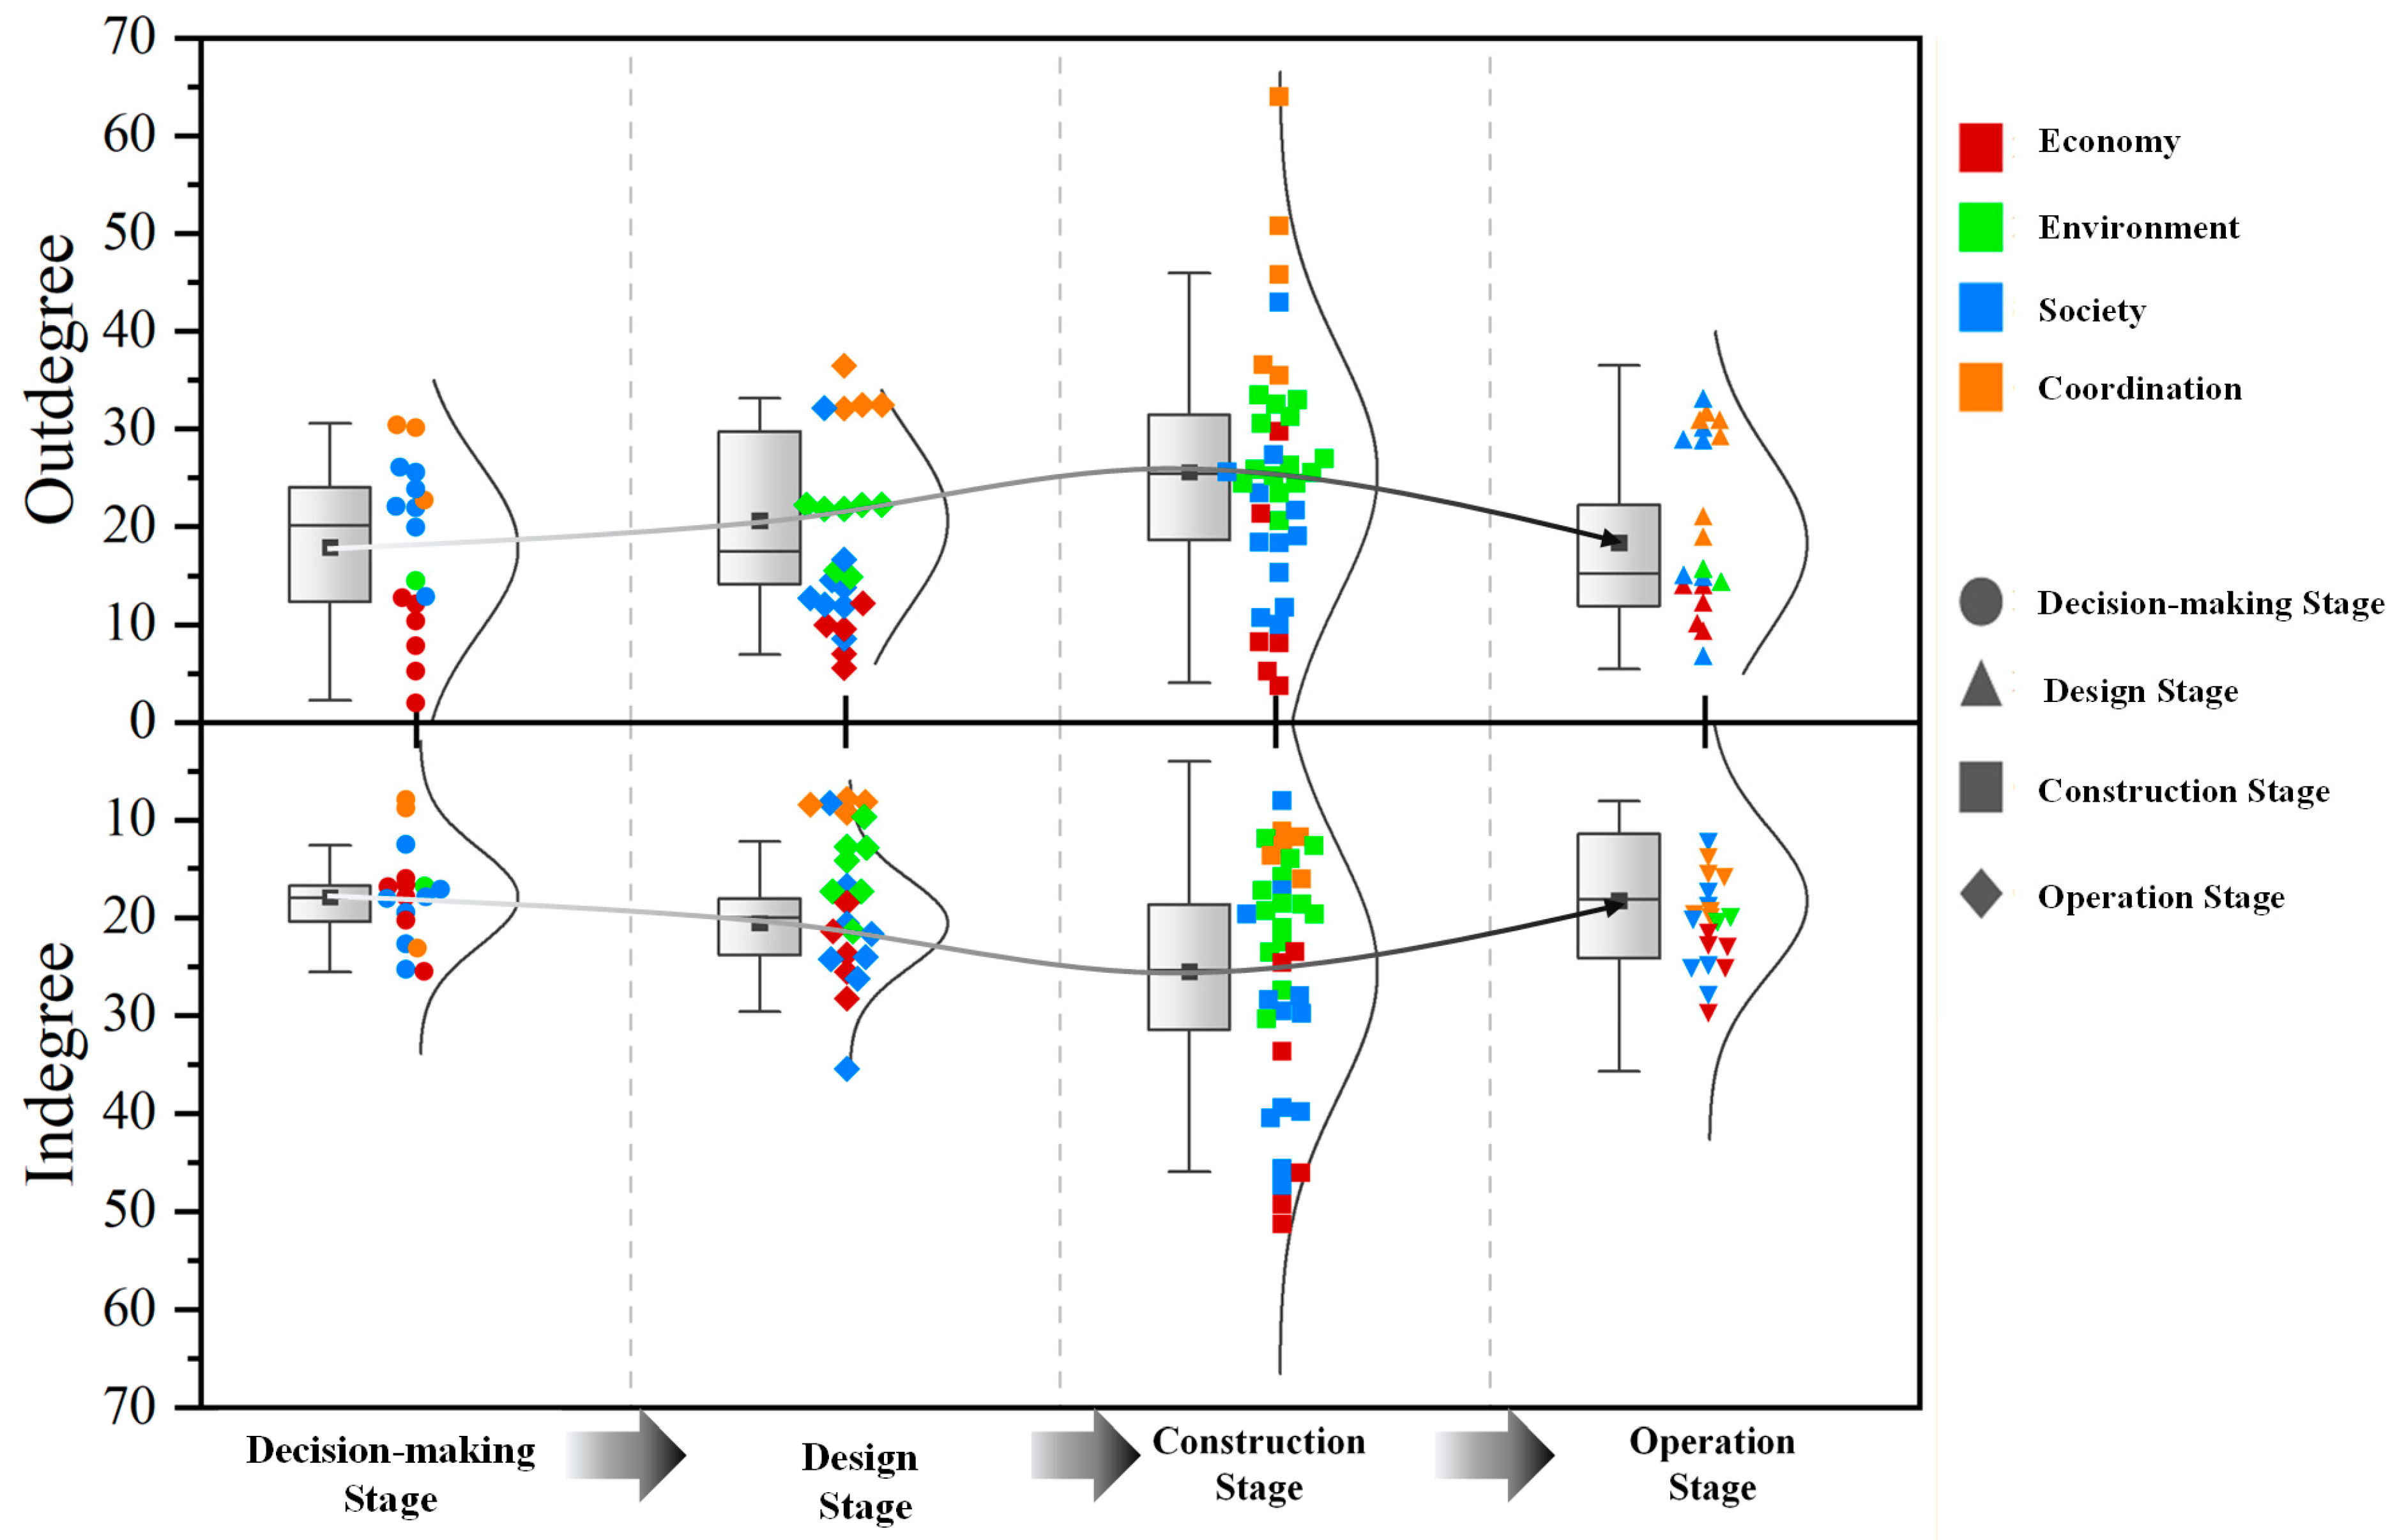
4.2.1. NDE
4.2.2. RRGD
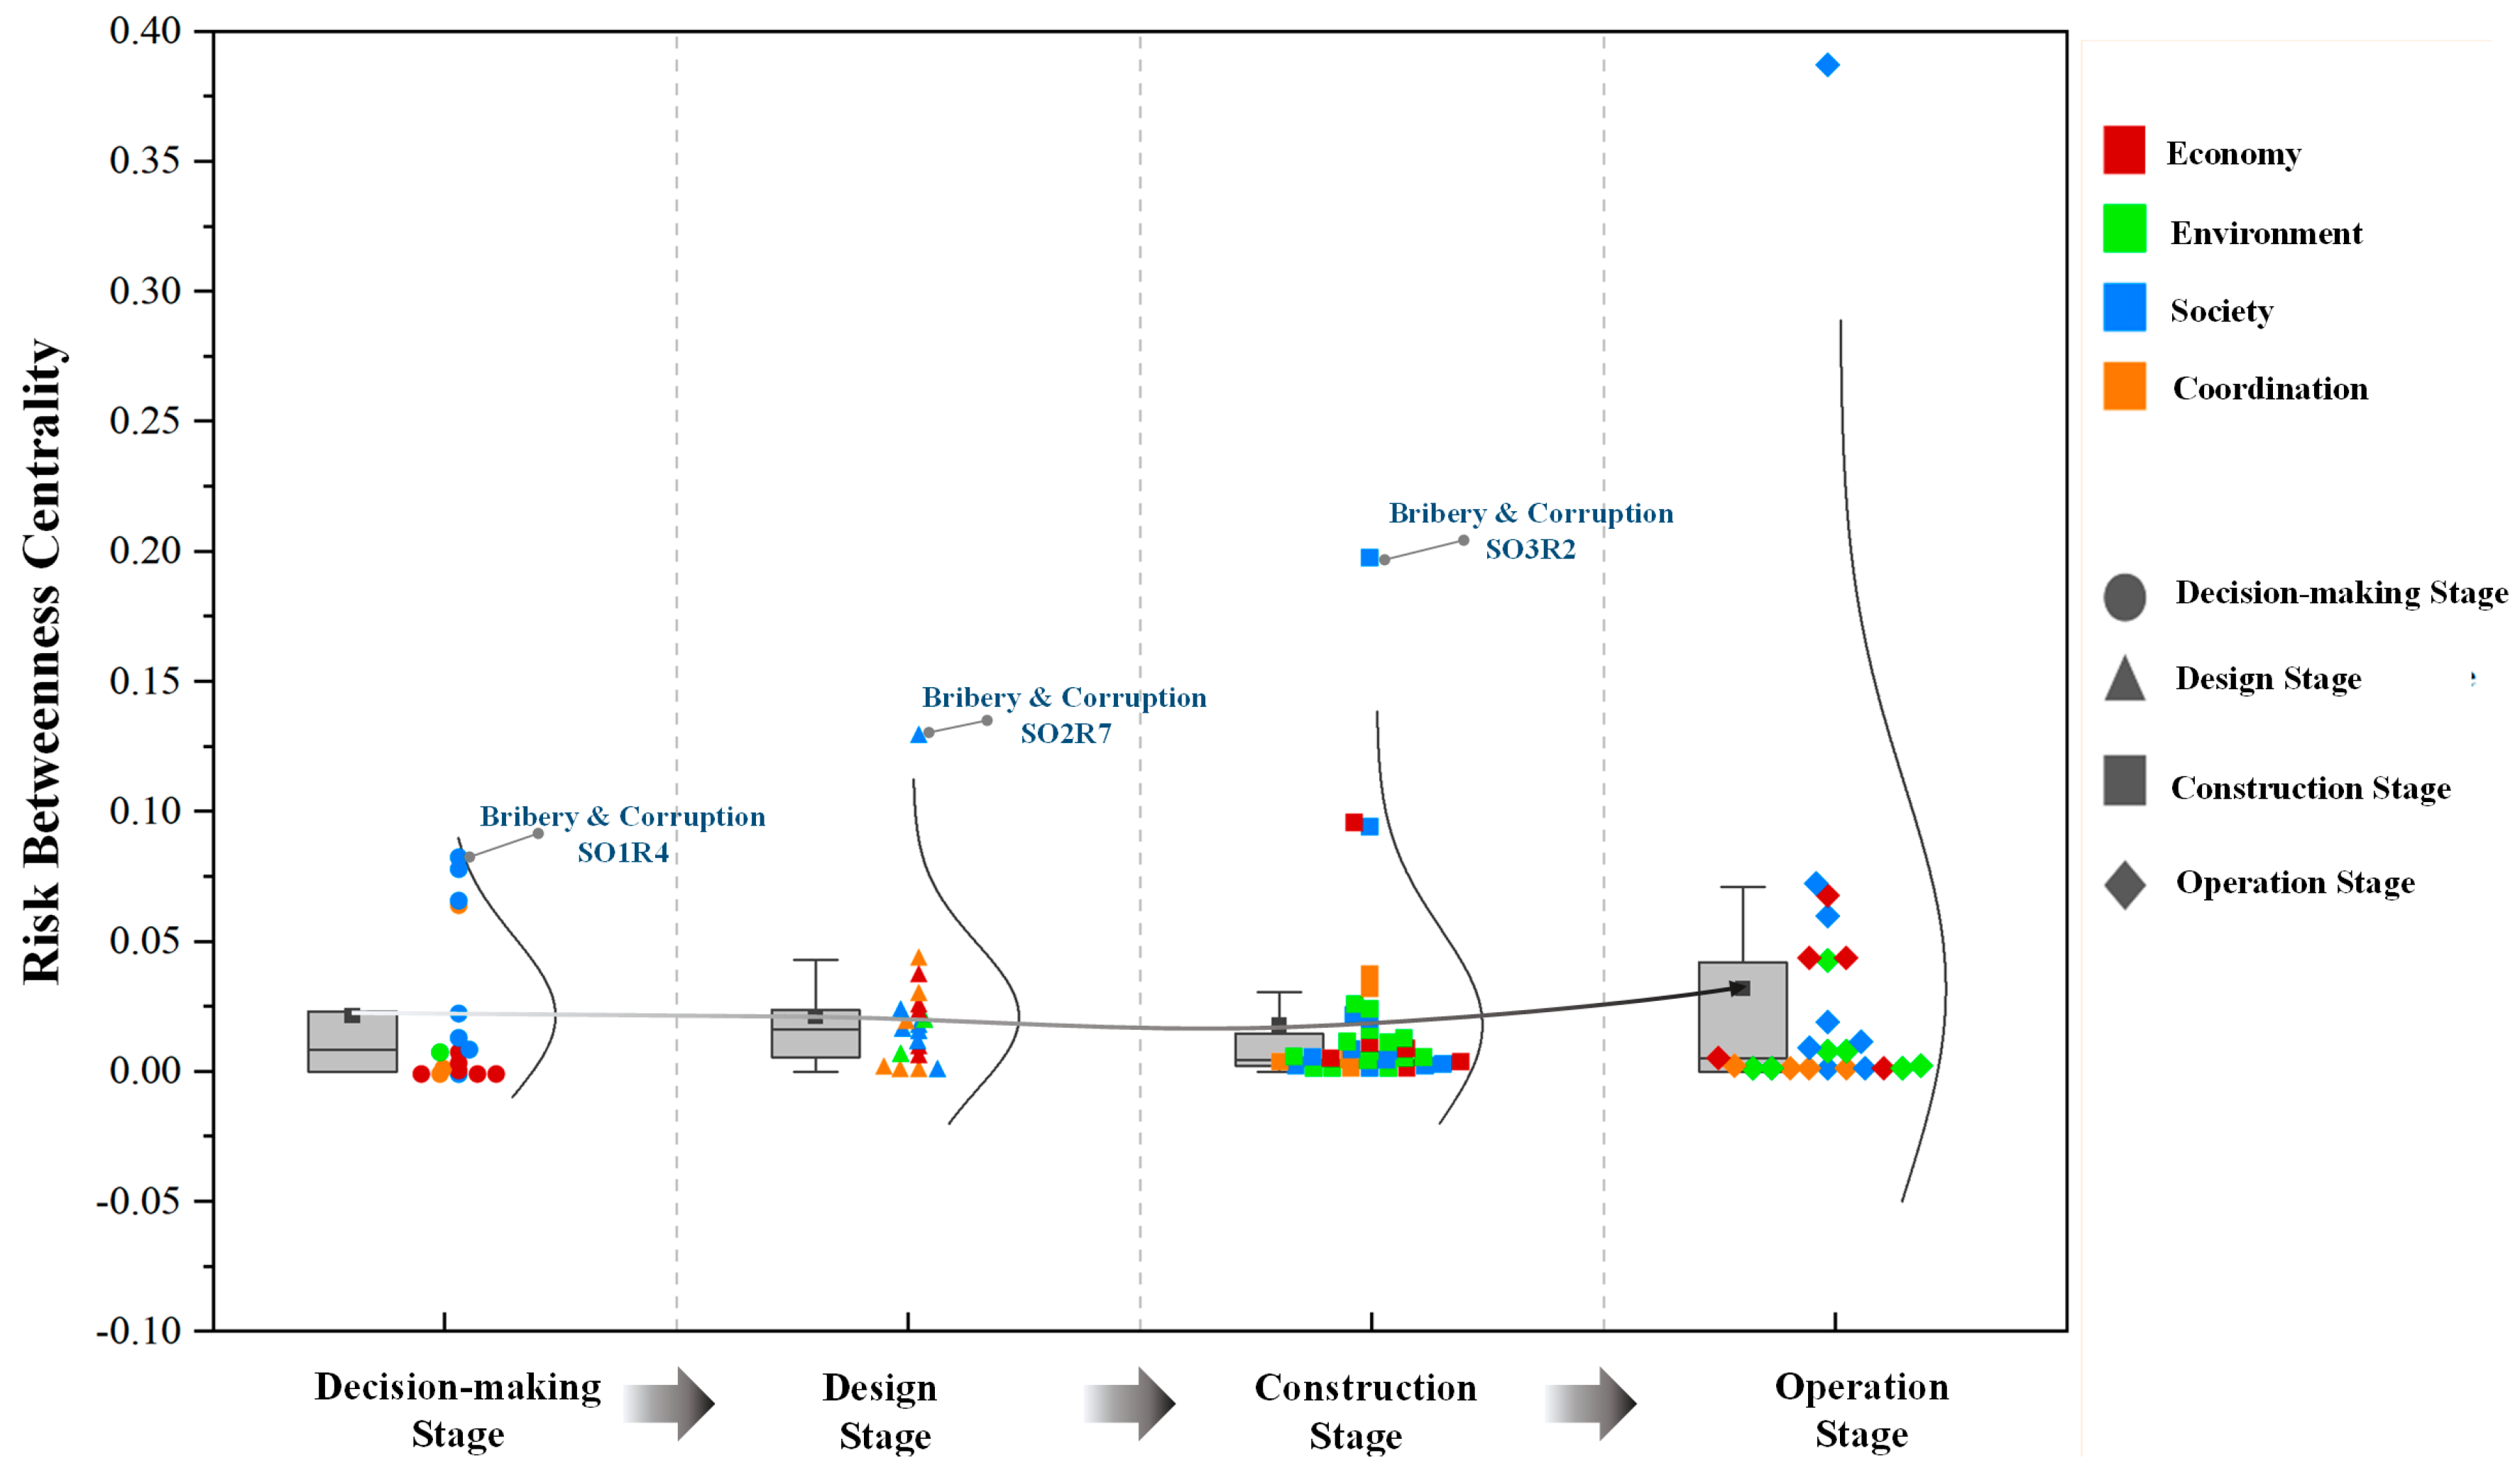
4.2.3. NBC
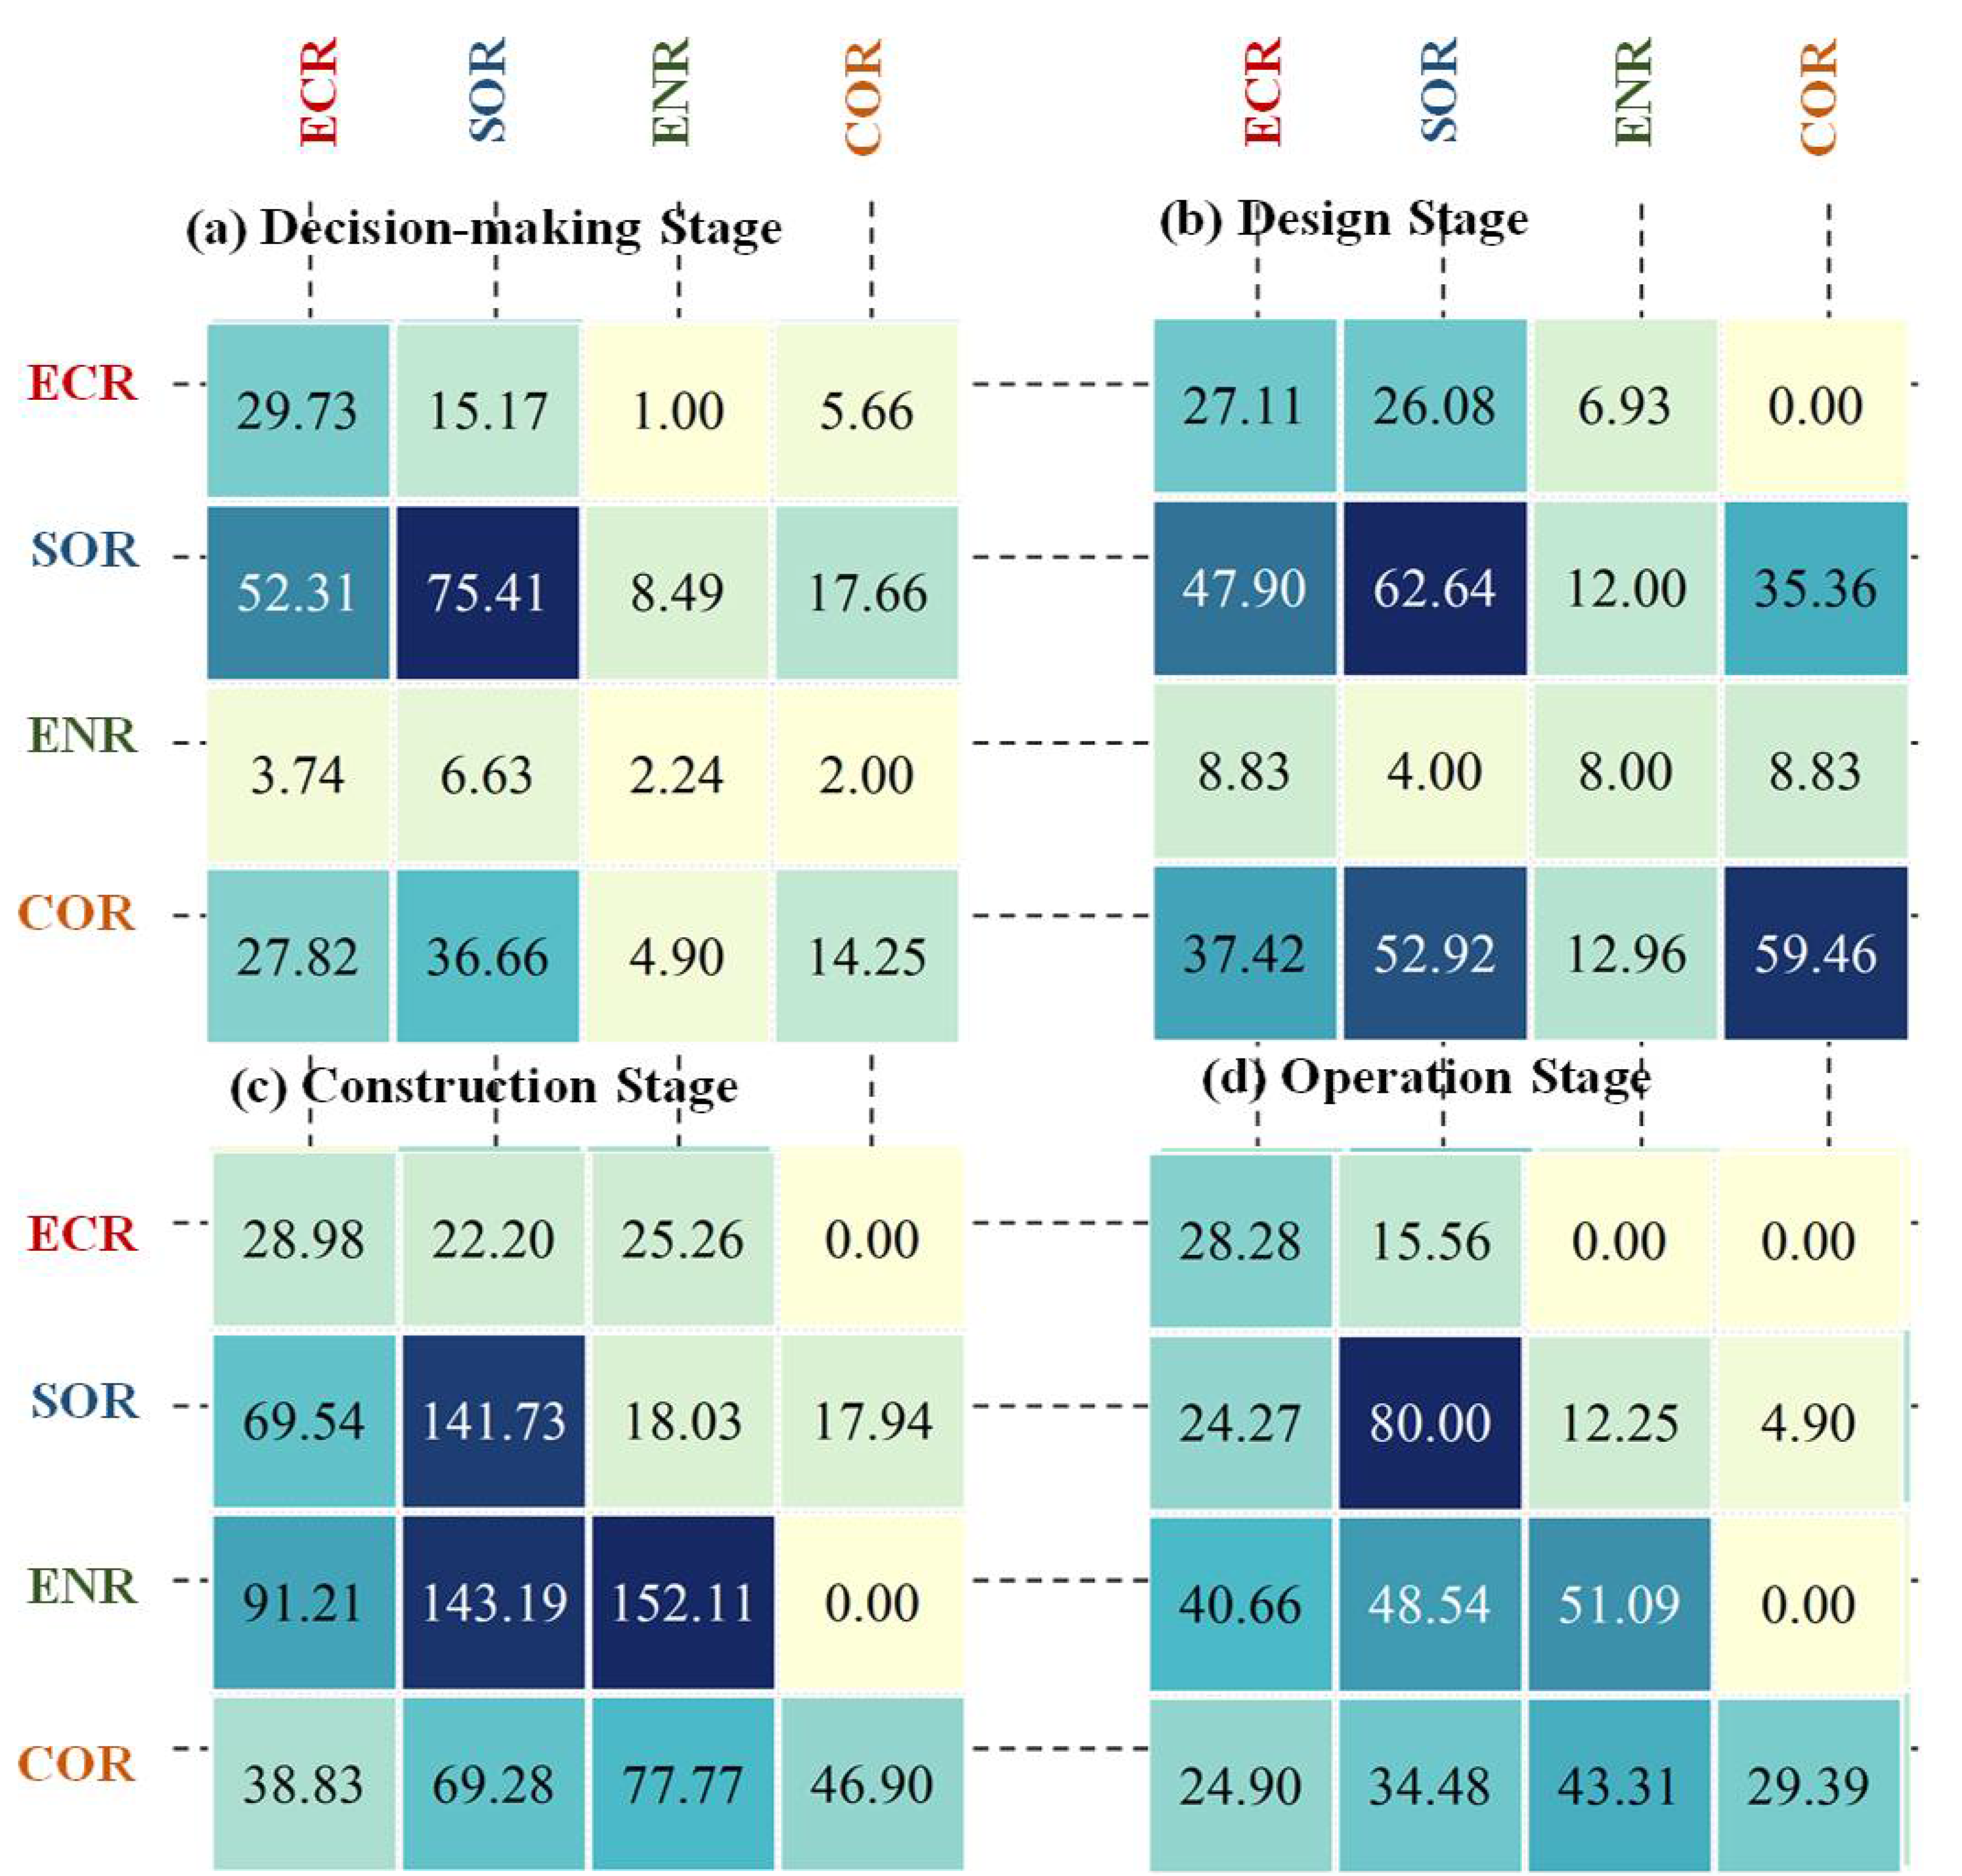
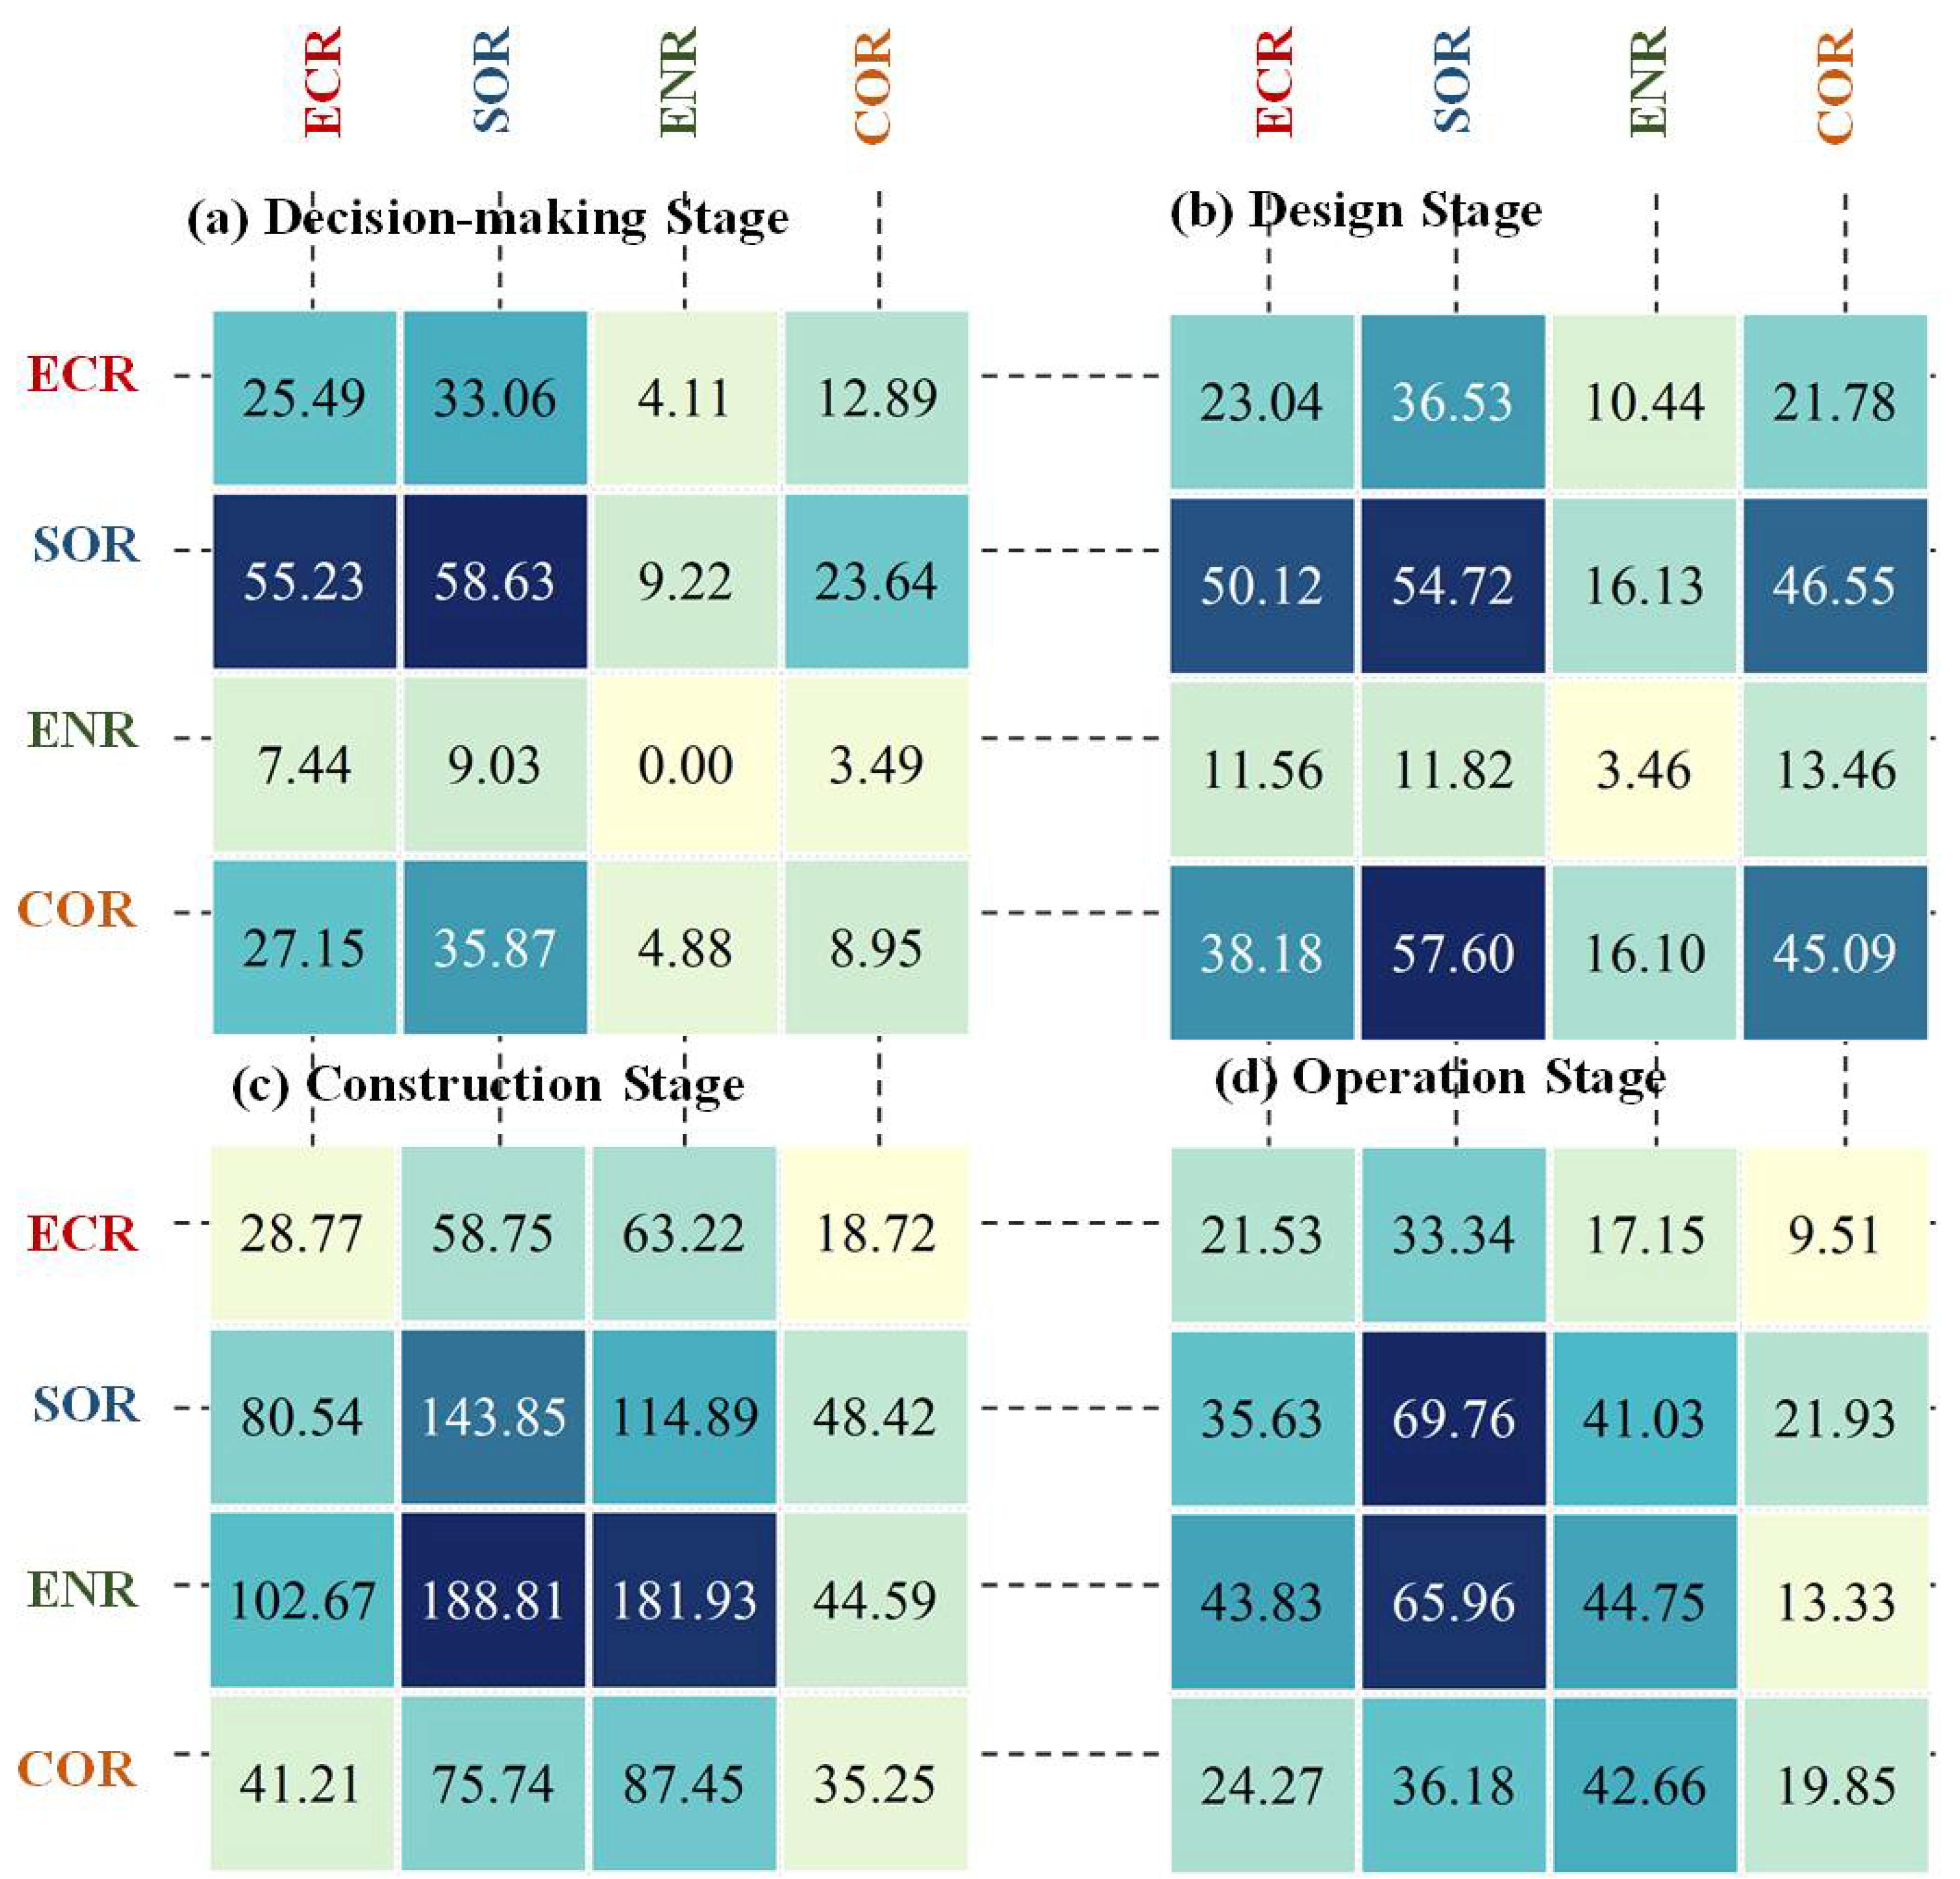
4.3. Link Level Results
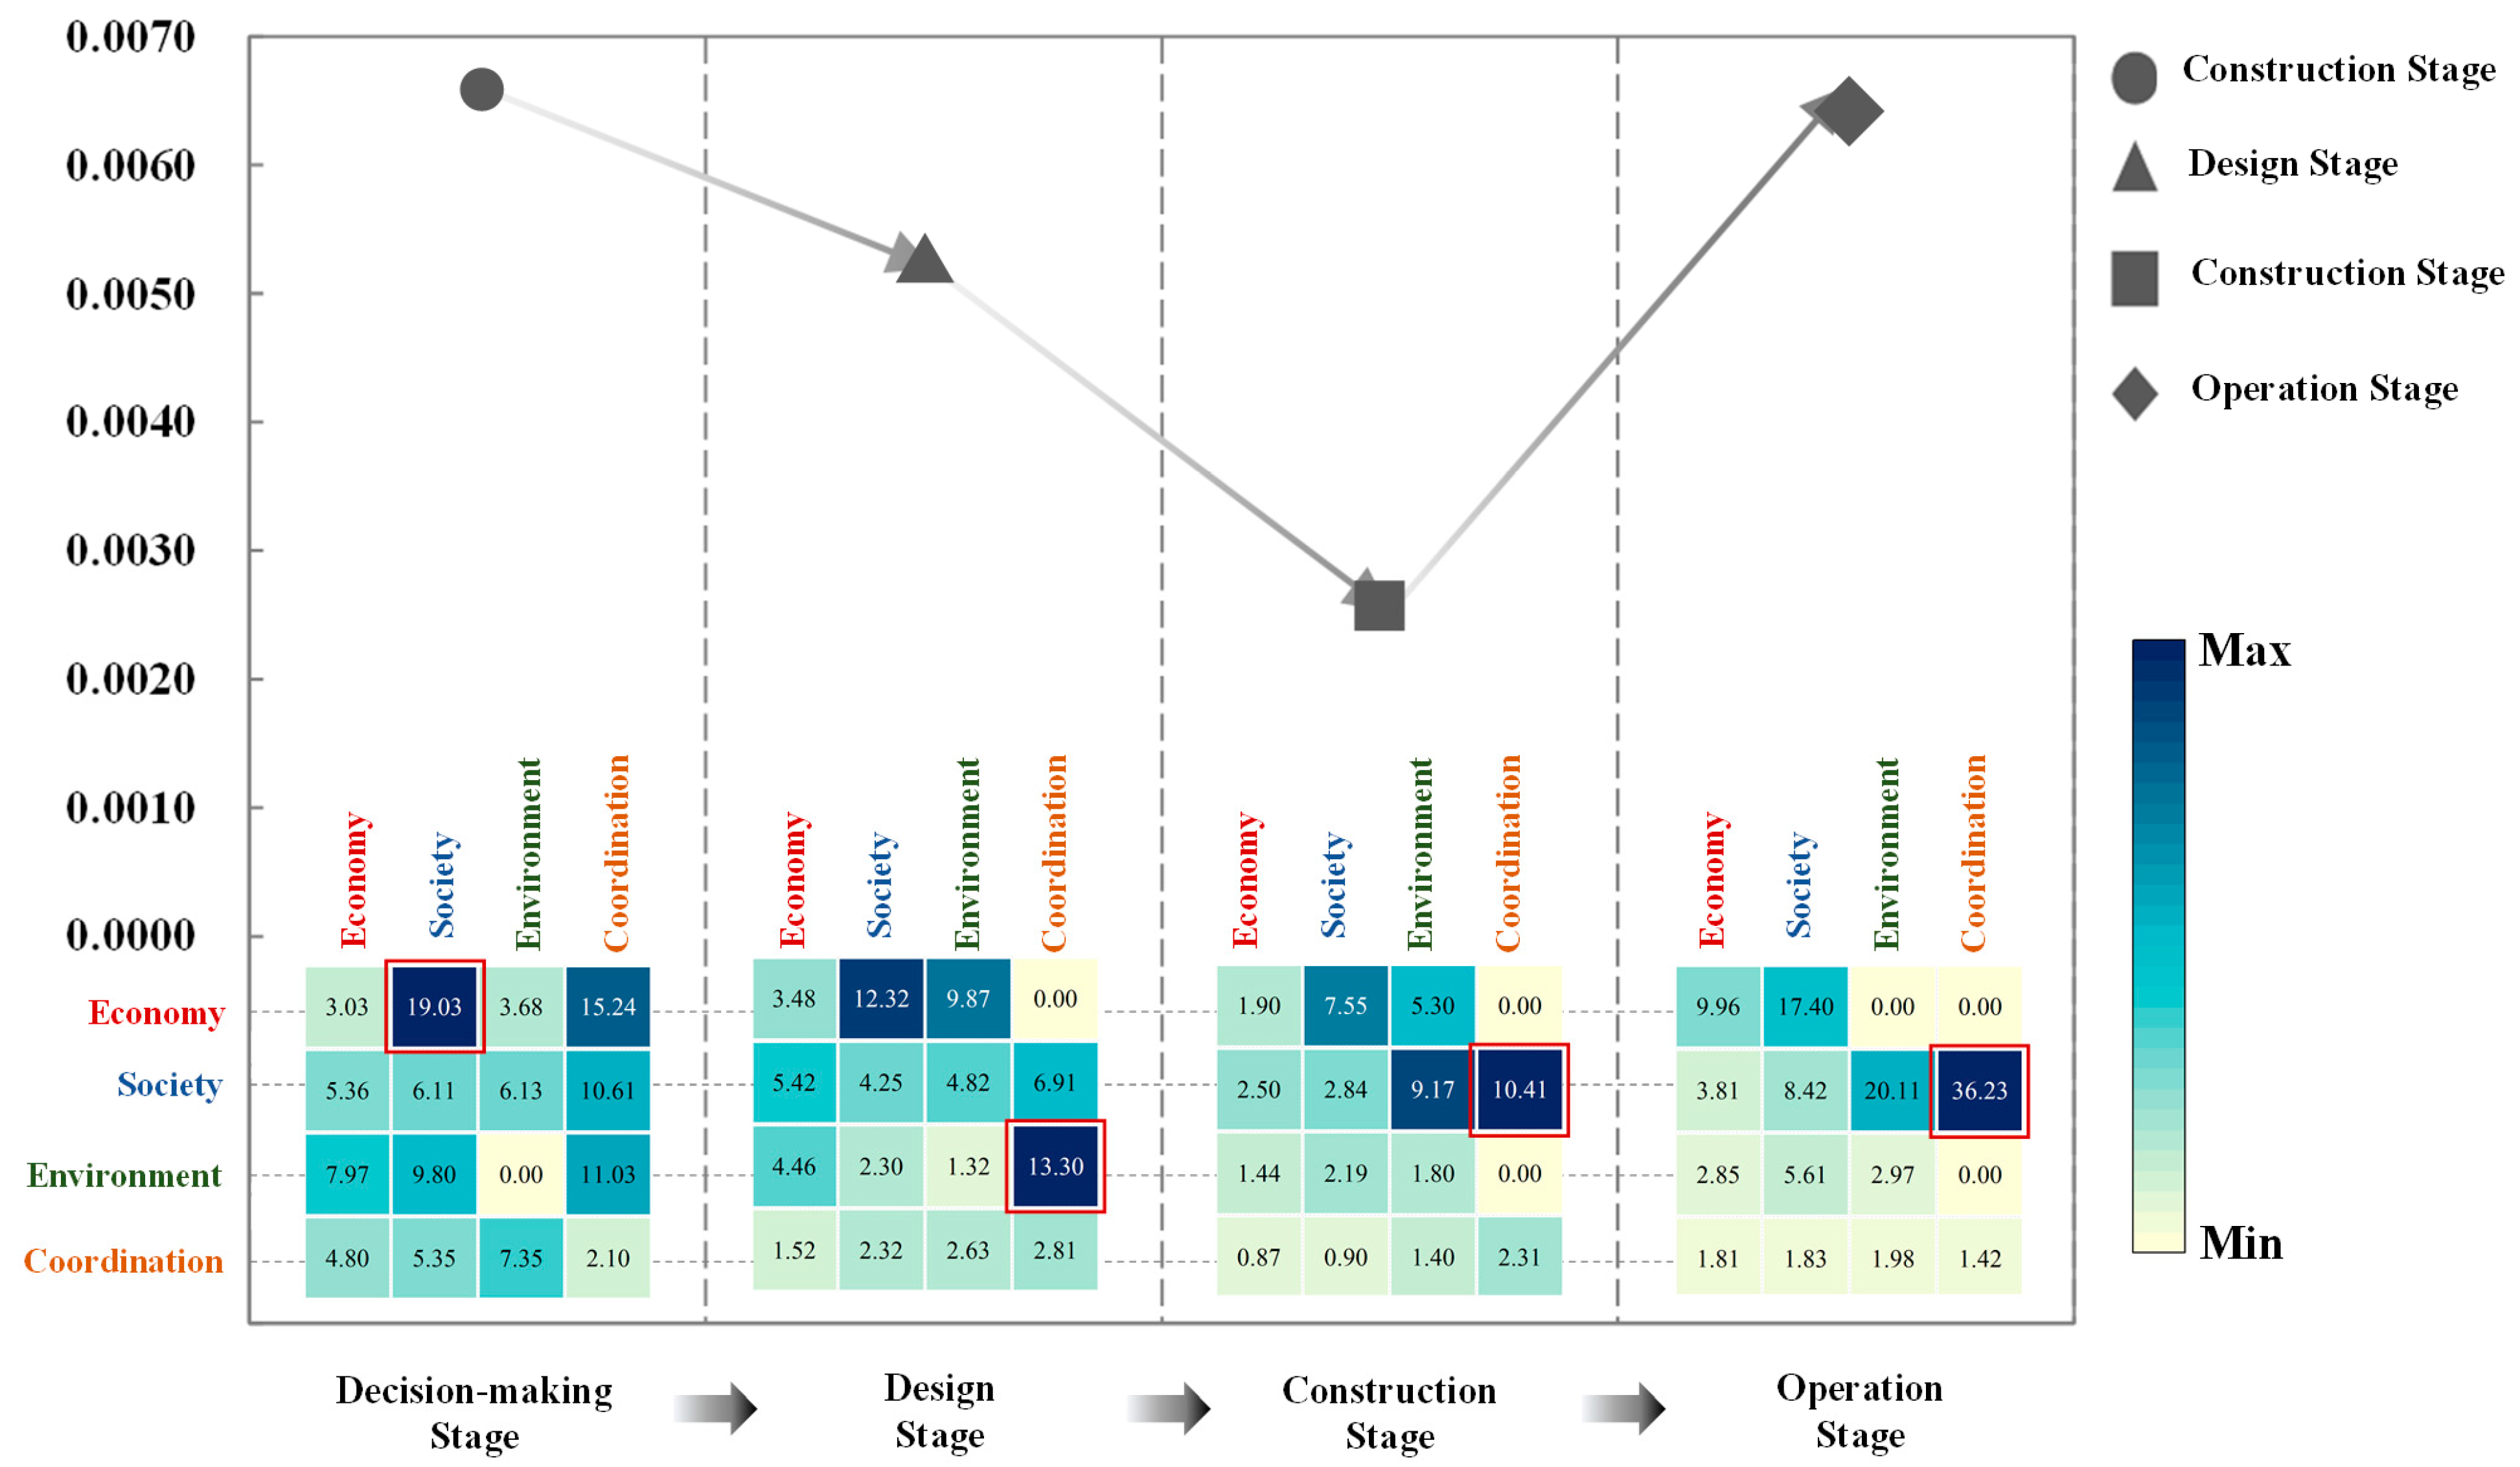
4.4. Risk Groups Results
4.4.1. DIGI
4.4.2. GIGI
5. Discussion
5.1. Dynamic Risk-Response Strategies According to Key Risks
5.2. Dynamic Risk-Response Strategies According to Critical Risk Interactions
5.3. Validation of the Effectiveness of the Strategies
6. Conclusions
Author Contributions
Funding
Institutional Review Board Statement
Informed Consent Statement
Conflicts of Interest
References
- Kardes, I.; Ozturk, A.; Cavusgil, S.T.; Cavusgil, E. Managing global megaprojects: Complexity and risk management. Int. Bus. Rev. 2013, 22, 905–917. [Google Scholar] [CrossRef]
- Flyvbjerg, B. What you should know about megaprojects and why: An overview. Proj. Manag. J. 2014, 45, 6–19. [Google Scholar] [CrossRef] [Green Version]
- Flyvbjerg, B. The Oxford Handbook of Megaproject Management; Oxford University Press: Oxford, UK, 2017. [Google Scholar]
- Fang, C.; Marle, F.; Zio, E.; Bocquet, J.-C. Network theory-based analysis of risk interactions in large engineering projects. Reliab. Eng. Syst. Saf. 2012, 106, 1–10. [Google Scholar] [CrossRef]
- Wang, L.; Sun, T.; Qian, C.; Goh, M.; Mishra, V.K. Applying social network analysis to genetic algorithm in optimizing project risk response decisions. Inf. Sci. 2020, 512, 1024–1042. [Google Scholar] [CrossRef]
- Wang, L.; Goh, M.; Ding, R.; Pretorius, L. Improved simulated annealing based risk interaction network model for project risk response decisions. Decis. Support Syst. 2019, 122, 113062. [Google Scholar] [CrossRef]
- Guan, L.; Abbasi, A.; Ryan, M.J. A simulation-based risk interdependency network model for project risk assessment. Decis. Support. Syst. 2021, 148, 113602. [Google Scholar] [CrossRef]
- Zhang, Y.; Tsai, C.-H.; Liao, P.-C. Rethinking risk propagation mechanism in public–private partnership projects: Network perspective. J. Infrastruct. Syst. 2020, 26, 04020011. [Google Scholar] [CrossRef]
- Chang, T.; Deng, X.; Hwang, B.-G. Investigating political risk paths in international high-speed railway projects: The case of Chinese international contractors. Sustainability 2019, 11, 4157. [Google Scholar] [CrossRef] [Green Version]
- Lu, Y.; Zhang, Y. Toward a Stakeholder Perspective on Safety Risk Factors of Metro Construction: A Social Network Analysis. Complexity 2020, 2020, 8884304. [Google Scholar] [CrossRef]
- Chen, L.; Lu, Q.; Li, S.; He, W.; Yang, J. Bayesian Monte Carlo Simulation–Driven Approach for Construction Schedule Risk Inference. J. Manag. Eng. 2021, 37, 04020115. [Google Scholar] [CrossRef]
- Etemadinia, H.; Tavakolan, M. Using a hybrid system dynamics and interpretive structural modeling for risk analysis of design phase of the construction projects. Int. J. Constr. Manag. 2021, 21, 93–112. [Google Scholar] [CrossRef]
- Shrestha, A.; Chan, T.-K.; Aibinu, A.A.; Chen, C.; Martek, I. Risks in PPP water projects in China: Perspective of local governments. J. Constr. Eng.Manag. 2017, 143, 05017006. [Google Scholar] [CrossRef]
- Tang, H.; Wang, G.; Miao, Y.; Zhang, P. Managing Cost-Based Risks in Construction Supply Chains: A Stakeholder-Based Dynamic Social Network Perspective. Complexity 2020, 2020, 8545839. [Google Scholar] [CrossRef]
- Shen, L.; Tam, V.W.Y.; Gan, L.; Ye, K.; Zhao, Z. Improving sustainability performance for public-private-partnership (PPP) projects. Sustainability 2016, 8, 289. [Google Scholar] [CrossRef] [Green Version]
- Tao, K.; Guo, D.; Wang, Y.; Wang, X. Study on risk conduction coupling mechanism and measure of building energy conservation Renovation Project. J. Eng. Manag. 2017, 31, 6. [Google Scholar] [CrossRef]
- Project Management Institute. The Project Management Body of Knowledge (PMBOK Guide), 5th ed.; Project Management Institute: Newtown Square, PA, USA, 2013. [Google Scholar]
- Ongkowijoyo, C.S.; Gurmu, A.; Andi, A. Investigating risk of bridge construction project: Exploring Suramadu strait-crossing cable-stayed bridge in Indonesia. Int. J. Disaster Resil. Built Environ. 2020, 12, 127–142. [Google Scholar] [CrossRef]
- Thamhain, H. Managing risks in complex projects. Proj. Manag. J. 2013, 44, 20–35. [Google Scholar] [CrossRef]
- Gijzel, D.; Bosch-Rekveldt, M.; Schraven, D.; Hertogh, M. Integrating Sustainability into Major Infrastructure Projects: Four Perspectives on Sustainable Tunnel Development. Sustainability 2020, 12, 6. [Google Scholar] [CrossRef] [Green Version]
- Yuan, J.; Li, W.; Guo, J.; Zhao, X.; Skibniewski, M.J. Social risk factors of transportation PPP projects in China: A sustainable development perspective. Int. J. Environ. Res. Public Health 2018, 15, 1323. [Google Scholar] [CrossRef] [Green Version]
- Malik, S.; Fatima, F.; Imran, A.; Chuah, L.F.; Klemeš, J.J.; Khaliq, I.H.; Asif, S.; Aslam, M.; Jamil, F.; Durrani, A.K. Improved project control for sustainable development of construction sector to reduce environment risks. J. Clean. Product. 2019, 240, 118214. [Google Scholar] [CrossRef]
- Hueskes, M.; Verhoest, K.; Block, T. Governing public–private partnerships for sustainability: An analysis of procurement and governance practices of PPP infrastructure projects. Int. J. Proj. Manag. 2017, 35, 1184–1195. [Google Scholar] [CrossRef]
- Liu, B.; Xue, B.; Chen, X. Development of a metric system measuring infrastructure sustainability: Empirical studies of Hong Kong. J. Clean. Product. 2021, 278, 123904. [Google Scholar] [CrossRef]
- The IS Rating Scheme, Version 2.0; Infrastructure Sustainability Council of Australia: Sydney, Australia, 2018.
- ISI Envision, Version 3; Institute for Sustainable Infrastructure: Washington, DC, USA, 2018.
- Inter-American Development Bank. What Is Sustainable Infrastructure: A Framework to Guide Sustainability across the Project Cycle; Inter-American Development Bank: New York, NY, USA, 2018. [Google Scholar]
- KKordi, N.E.; Belayutham, S.; Che Ibrahim, C.K.I. Mapping of social sustainability attributes to stakeholders’ involvement in construction project life cycle. Constr. Manag. Econ. 2021, 39, 513–532. [Google Scholar] [CrossRef]
- Li, Y.; Xiang, P.; You, K.; Guo, J.; Liu, Z.; Ren, H. Identifying the key risk factors of mega infrastructure projects from an extended sustainable development perspective. Int. J. Environ. Res. Public Health 2021, 18, 7515. [Google Scholar] [CrossRef]
- Yucelgazi, F.; Yitmen, İ. An ANP Model for Risk Assessment in Large-Scale Transport Infrastructure Projects. Arab. J. Sci. Eng. 2019, 44, 4257–4275. [Google Scholar] [CrossRef]
- Afzal, F.; Yunfei, S.; Junaid, D.; Hanif, M.S. Cost-risk contingency framework for managing cost overrun in metropolitan projects: Using fuzzy-AHP and simulation. Int. J. Manag. Proj. Bus. 2020, 13, 1121–1139. [Google Scholar] [CrossRef]
- Tavakolan, M.; Etemadinia, H. Fuzzy weighted interpretive structural modeling: Improved method for identification of risk interactions in construction projects. J. Constr. Eng. Manag. 2017, 143, 04017084. [Google Scholar] [CrossRef]
- Xu, H.; Zhang, Y.; Li, H.; Skitmore, M.; Yang, J.; Yu, F. Safety risks in rail stations: An interactive approach. J. Rail Transp. Plan. Manag. 2019, 11, 100148. [Google Scholar] [CrossRef]
- Cao, D.; Shao, S. Towards Complexity and Dynamics: A Bibliometric-Qualitative Review of Network Research in Construction. Complexity 2020, 2020, 8812466. [Google Scholar] [CrossRef]
- Ongkowijoyo, C.S.; Doloi, H.; Mills, A. Participatory-based risk impact propagation and interaction pattern analysis using social network analysis. Int. J. Disaster Resil. Built Environ. 2019, 10, 363–378. [Google Scholar] [CrossRef]
- Yu, L.; Liu, Q.; Hua, R.; Fu, Y. Risk Analysis of Cash on Delivery Payment Method by Social Network Analysis and Fuzzy Petri Net. IEEE Access 2020, 8, 174160–174168. [Google Scholar] [CrossRef]
- Opsahl, T.; Agneessens, F.; Skvoretz, J. Node centrality in weighted networks: Generalizing degree and shortest paths. Soc. Netw. 2010, 32, 245–251. [Google Scholar] [CrossRef]
- Wang, X.; Xia, N.; Zhang, Z.; Wu, C.; Liu, B. Human safety risks and their interactions in China’s subways: Stakeholder perspectives. J. Manag. Eng. 2017, 33, 05017004. [Google Scholar] [CrossRef]
- Babatunde, S.O.; Ekundayo, D.; Udeaja, C.; Abubakar, U.O. An investigation into the sustainability practices in PPP infrastructure projects: A case of Nigeria. Smart Sustain. Built Environ. 2020, 11, 110–125. [Google Scholar] [CrossRef]
- Reeves-Latour, M.; Morselli, C. Bid-rigging networks and state-corporate crime in the construction industry. Soc. Netw. 2017, 51, 158–170. [Google Scholar] [CrossRef]
- Dadpour, M.; Shakeri, E.; Nazari, A. Analysis of stakeholder concerns at different times of construction projects using Social network Analysis (SNA). Int. J. Civ. Eng. 2019, 17, 1715–1727. [Google Scholar] [CrossRef]
- Li, W.; Yuan, J.; Ji, C.; Wei, S.; Li, Q. Agent-Based Simulation Model for Investigating the Evolution of Social Risk in Infrastructure Projects in China: A Social Network Perspective. Sustain. Cities Soc. 2021, 73, 103112. [Google Scholar] [CrossRef]
- Kivilä, J.; Martinsuo, M.; Vuorinen, L. Sustainable project management through project control in infrastructure projects. Int. J. Proj. Manag. 2017, 35, 1167–1183. [Google Scholar] [CrossRef]
- Wan, X.; Wang, R.; Wang, M.; Deng, J.; Zhou, Z.; Yi, X.; Pan, J.; Du, Y. Online Public Opinion Mining for Large Cross-Regional Projects: Case Study of the South-to-North Water Diversion Project in China. J. Manag. Eng. 2022, 38, 05021011. [Google Scholar] [CrossRef]
- Banihashemi, S.; Hosseini, M.R.; Golizadeh, H.; Sankaran, S. Critical success factors (CSFs) for integration of sustainability into construction project management practices in developing countries. Int. J. Proj. Manag. 2017, 35, 1103–1119. [Google Scholar] [CrossRef]
- Sierra, L.A.; Yepes, V.; Pellicer, E. A review of multi-criteria assessment of the social sustainability of infrastructures. J. Clean. Product. 2018, 187, 496–513. [Google Scholar] [CrossRef]
- Yuan, H. Achieving sustainability in railway projects: Major stakeholder concerns. Proj. Manag. J. 2017, 48, 115–132. [Google Scholar] [CrossRef] [Green Version]
- Yu, T.; Shen, G.Q.; Shi, Q.; Lai, X.; Li, C.Z.; Xu, K. Managing social risks at the housing demolition stage of urban redevelopment projects: A stakeholder-oriented study using social network analysis. Int. J. Proj. Manag. 2017, 35, 925–941. [Google Scholar] [CrossRef]


| ID | Experience (Year) | Role | Organisation | Participation Stages |
|---|---|---|---|---|
| Expert 1 | 12 | Scholar | University | Decision-making, Design, Construction, Operation stages |
| Expert 2 | 19 | Project participant | Construction contractor | Construction, Operation stages |
| Expert 3 | 15 | Project participant | Operator | Construction, Operation stages |
| Expert 4 | 19 | Project participant | Designer | Design |
| Expert 5 | 20 | Project participant | Construction contractor | Design, Construction, Operation stages |
| Expert 6 | 10 | Government | Government | Decision-making, Construction, Operation stages |
| Expert 7 | 11 | Scholar | University | Decision-making, Design, Construction, Operation stages |
| Expert 8 | 9 | Scholar | University | Decision-making, Design, Construction, Operation stages |
| Dimension | Risk | MIP Life Cycle | |||
|---|---|---|---|---|---|
| Decision-Making Stage | Design Stage | Construction Stage | Operation Stage | ||
| Economy | Wrong market demand forecasts (overrate) | EC1R1 | |||
| Negative effect on the local industrial structure (tourism, agriculture, etc.) | EC1R2 | ||||
| Negative effect on the spatial layout of local industries | EC1R3 | ||||
| Costs caused by disputes with the community | EC1R4 | ||||
| Delay in project approval | EC1R5 | ||||
| Technical feasibility decision failure | EC1R6 | ||||
| Difficult financing | EC2R1 | ||||
| Misestimate in time and cost | EC2R2 | ||||
| Design deficiency | EC2R3 | ||||
| Land acquisition and resettling cost overruns | EC2R4 | ||||
| Designing cost overrun | EC2R5 | ||||
| Construction and installation cost overruns | EC3R1 | ||||
| Construction delay | EC3R2 | ||||
| Substandard quality | EC3R3 | ||||
| Disposal of construction waste cost overruns | EC3R4 | ||||
| Negative effect on local enterprises | EC3R5 | ||||
| Compensate for not meeting the Sustainable Development Goals | EC3R6 | ||||
| Ecological remediation cost overruns | EC4R1 | ||||
| Devaluation of residents’ assets (decrease in residents’ income) | EC4R2 | ||||
| Operation and maintain cost overruns | EC4R3 | ||||
| Weak solvency ability | EC4R4 | ||||
| Weak contribution on local economy | EC4R5 | ||||
| Society | Opaque project information (Closed design information) | SO1R1 | SO2R5 | ||
| Damages on participation of local residents and community | SO1R2 | SO2R6 | SO3R11 | SO4R4 | |
| Excessive government intervention | SO1R3 | SO2R4 | SO3R3 | ||
| Bribery and corruption | SO1R4 | SO2R7 | SO3R2 | ||
| Opportunism decision making | SO1R5 | ||||
| Damages on connectivity among communities | SO1R6 | ||||
| Difficulty of coordinating interest demand | SO1R7 | ||||
| Unreasonable resettlement | SO2R1 | ||||
| Non-matching with local culture | SO2R2 | ||||
| No access of the disabled | SO2R3 | ||||
| Damages of cultural heritage | SO3R1 | ||||
| Construction safety and accidents | SO3R4 | ||||
| Damages on employees’ health | SO3R5 | ||||
| Damages on residents’ safety (personal or property) | SO3R6 | SO4R1 | |||
| Damages on residents’ health | SO3R7 | SO4R2 | |||
| Negative effect on employment(unemployment, underutilisation of local labour force) | SO3R8 | SO4R6 | |||
| Negative impact on residents’ life quality | SO3R9 | SO4R8 | |||
| Inadequate facilities surrounding the projects | SO3R10 | SO4R7 | |||
| Discoordination between contractor and public | SO3R12 | ||||
| Widen the gap between rich and poor | SO4R3 | ||||
| No access to public resources to local residents | SO4R5 | ||||
| Environment | Inadequate environmental effect assessment | EN1R1 | |||
| Lack of environmental protection measures | EN2R1 | ||||
| Non-matching with natural environment | EN2R2 | ||||
| Air pollutant (greenhouse gases, toxic gases, dust) | EN3R1 | EN4R1 | |||
| Water pollution | EN3R2 | EN4R2 | |||
| Lights pollution | EN3R3 | EN4R4 | |||
| Noises pollution | EN3R4 | EN4R3 | |||
| Construction waste pollution (solid waste pollution) | EN3R5 | ||||
| Usage of not environmental-friendly construction materials | EN3R6 | ||||
| Overuse of construction materials | EN3R7 | ||||
| Overuse of energy | EN3R8 | EN4R5 | |||
| Excessive consumption of non-renewable energy | EN3R9 | EN4R6 | |||
| Soil health degradation (salinization, swamping, etc.) | EN3R10 | ||||
| Damages to natural heritage | EN3R11 | ||||
| Damages to the ecological balance | EN3R12 | EN4R7 | |||
| Causing geological hazards (landslide, collapse, slope instability, soil erosion, etc.) | EN3R13 | ||||
| Occupy a lot of non-construction land (green land, agricultural land, animal habitat) | EN3R14 | ||||
| Coordination | Unsatisfying national or local legislation | CO1R1 | |||
| Decision-making mechanisms not involving all stakeholders | CO1R2 | ||||
| Weak and opaque decision-making process | CO1R3 | ||||
| Ambiguous responsibility and right sharing clauses | CO2R1 | ||||
| Inadequate investment and source sharing clauses | CO2R2 | ||||
| Lack of sustainable clauses in contract | CO2R3 | ||||
| Ambiguous sustainable management program | CO2R4 | ||||
| Lack of organisation culture on sustainability | CO2R5 | ||||
| Incomplete communication and coordination procedures | CO2R6 | ||||
| Inadequate communication and coordination among stakeholders | CO3R1 | ||||
| Non-complementary employee ability | CO3R2 | ||||
| Weak sustainability awareness | CO3R3 | ||||
| Inadequate experience | CO3R4 | ||||
| Team conflict(non-cooperation) | CO3R5 | ||||
| Unclear maintenance subjects of project sustainability | CO4R1 | ||||
| Unclear monitor system of project sustainability | CO4R2 | ||||
| Unclear monitor and maintenance organization of project sustainability | CO4R3 | ||||
| Weak monitor and maintenance platform of project sustainability | CO4R4 | ||||
| Level | Metric | Formula | Notation | |
|---|---|---|---|---|
| Network | ND | (3) | : the maximum weight of all links. | |
| Node/Link | NDE | (4) | :the number of links originating from risk . : the total weight of the links originating from risk . : number of links directly toward risk . : total weight of links directly toward risk . | |
| (5) | ||||
| NBC/LBC | (6) | : the total number of shortest paths from risk to risk and and : the number of shortest paths that pass through risk and link . | ||
| (7) | ||||
| RRGD | (8) | : the shortest paths from risk to risk . . | ||
| Group | DIGI | (9) | ||
| GIGI | (10) | |||
| Stage | Decision-Making Stage | Design Stage | Construction Stage | Operation Stage | ||||
|---|---|---|---|---|---|---|---|---|
| In-degree | Code | Value | Code | Value | Code | Value | Code | Value |
| EC1R5 | 25.6125 | EC2R2 | 29.6648 | EC3R1 | 51.4975 | SO4R8 | 35.7211 | |
| SO1R5 | 25.3969 | SO2R7 | 27.8209 | EC3R6 | 49.4874 | EC4R5 | 28.5307 | |
| CO1R1 | 23.2379 | EC2R5 | 25.0799 | SO3R12 | 47.7494 | SO4R6 | 26.4953 | |
| SO1R7 | 22.8035 | SO2R2 | 25.0799 | EC3R2 | 46.2493 | EC4R2 | 25.7876 | |
| EC1R4 | 20.3961 | SO2R1 | 24.7992 | SO3R9 | 45.8258 | SO4R2 | 24.4949 | |
| SO1R4 | 19.5959 | EC2R1 | 22.9129 | SO3R6 | 40.6448 | SO4R5 | 24.2693 | |
| SO1R2 | 18.1659 | EC2R3 | 22.7596 | SO3R2 | 40.0000 | EC4R3 | 24.0000 | |
| EC2R4 | 21.4942 | SO3R7 | 39.5727 | SO4R1 | 21.9089 | |||
| EC3R5 | 33.8231 | EC4R1 | 21.6333 | |||||
| EN3R12 | 30.5123 | EN4R7 | 21.6333 | |||||
| SO3R8 | 29.9500 | |||||||
| SO3R11 | 29.6985 | |||||||
| SO3R3 | 28.5307 | |||||||
| SO3R5 | 28.1425 | |||||||
| EN3R11 | 27.5681 | |||||||
| Out-degree | Code | Value | Code | Value | Code | Value | Code | Value |
| CO1R2 | 30.5778 | SO2R5 | 33.1663 | CO3R3 | 64.0859 | CO4R4 | 36.5240 | |
| CO1R3 | 30.2985 | CO2R6 | 31.7333 | CO3R4 | 50.9117 | CO4R2 | 32.4962 | |
| SO1R1 | 26.2679 | CO2R3 | 30.9839 | CO3R2 | 45.9565 | CO4R3 | 32.4962 | |
| SO1R3 | 25.7488 | CO2R4 | 30.9839 | SO3R2 | 43.1277 | SO4R4 | 32.1714 | |
| SO1R4 | 24.0416 | SO2R4 | 30.1993 | CO3R5 | 36.7424 | CO4R1 | 32.1248 | |
| CO1R1 | 22.9129 | CO2R5 | 29.3258 | CO3R1 | 35.6651 | EN4R7 | 22.2486 | |
| SO1R5 | 22.2711 | SO2R6 | 28.9828 | EN3R1 | 33.6749 | EN4R1 | 22.2261 | |
| SO1R2 | 22.1359 | SO2R7 | 28.9137 | EN3R6 | 33.1663 | EN4R2 | 22.2261 | |
| SO1R7 | 20.1494 | CO2R1 | 21.1660 | EN3R2 | 32.7261 | EN4R5 | 21.8174 | |
| CO2R2 | 19.0788 | EN3R9 | 31.4643 | EN4R6 | 21.81742 | |||
| EN3R5 | 30.7571 | SO4R7 | 16.6133 | |||||
| EC3R3 | 29.9500 | EN4R3 | 15.4919 | |||||
| SO3R3 | 27.5681 | |||||||
| EN3R13 | 27.1662 | |||||||
| EN3R11 | 26.4953 | |||||||
| EN3R4 | 26.0768 | |||||||
| SO3R11 | 25.8070 | |||||||
| EN3R10 | 25.7488 | |||||||
| EN3R14 | 25.4165 | |||||||
| Stage | Decision-Making Stage | Design Stage | Construction Stage | Operation Stage | ||||
|---|---|---|---|---|---|---|---|---|
| RRGD-In | Code | Value | Code | Value | Code | Value | Code | Value |
| SO1R5 | 23.5597 | EC2R2 | 26.8024 | EC3R6 | 51.4976 | SO4R8 | 33.7081 | |
| EC1R5 | 23.3229 | SO2R7 | 26.3228 | SO3R12 | 49.4874 | SO4R6 | 28.4022 | |
| SO1R7 | 22.7525 | SO2R1 | 26.1773 | SO3R9 | 47.7493 | SO4R2 | 28.0602 | |
| CO1R1 | 21.0475 | EC2R5 | 24.6650 | EC3R1 | 46.2493 | EC4R2 | 26.8667 | |
| SO1R4 | 20.1544 | EC2R3 | 24.6151 | EC3R2 | 45.8258 | EC4R5 | 26.5318 | |
| EC1R4 | 19.4155 | SO2R2 | 24.5475 | SO3R6 | 40.6448 | EN4R7 | 26.3771 | |
| EC1R1 | 18.9989 | EC2R1 | 23.9579 | SO3R7 | 40.0000 | SO4R1 | 25.5366 | |
| CO2R3 | 23.4609 | SO3R2 | 39.5727 | EC4R3 | 25.4781 | |||
| SO3R11 | 33.8231 | SO4R4 | 25.3722 | |||||
| SO3R5 | 30.5123 | EC4R1 | 24.7975 | |||||
| EC3R5 | 29.9500 | |||||||
| EN3R12 | 29.6985 | |||||||
| SO3R8 | 28.5307 | |||||||
| SO3R3 | 28.1425 | |||||||
| EC3R3 | 35.0955 | |||||||
| RRGD-Out | Code | Value | Code | Value | Code | Value | Code | Value |
| CO1R3 | 30.5778 | SO2R5 | 30.1489 | CO3R3 | 60.8803 | CO4R4 | 34.2699 | |
| CO1R2 | 30.2985 | CO2R6 | 29.7060 | CO3R4 | 48.0197 | CO4R2 | 30.6223 | |
| SO1R1 | 26.2679 | SO2R4 | 28.2880 | CO3R2 | 45.5057 | SO4R4 | 29.8868 | |
| SO1R3 | 25.7488 | CO2R4 | 28.2665 | SO3R2 | 45.4927 | CO4R3 | 29.1920 | |
| SO1R2 | 24.0416 | CO2R3 | 27.9740 | CO3R1 | 43.3313 | CO4R1 | 28.8742 | |
| CO1R1 | 22.9129 | SO2R7 | 26.8024 | CO3R5 | 41.9137 | EN4R1 | 26.0308 | |
| SO1R4 | 22.2711 | CO2R5 | 26.0956 | EN3R1 | 41.1415 | EN4R2 | 26.0308 | |
| SO2R6 | 25.8277 | EN3R6 | 40.9073 | EN4R5 | 25.3554 | |||
| CO2R1 | 23.2812 | EN3R2 | 40.1097 | EN4R6 | 24.9171 | |||
| EN3R9 | 39.0641 | EN4R7 | 24.1085 | |||||
| SO3R3 | 37.7851 | SO4R7 | 22.6697 | |||||
| EN3R11 | 37.4009 | |||||||
| EN3R12 | 37.2099 | |||||||
| EN3R5 | 37.1311 | |||||||
| EN3R13 | 37.0631 | |||||||
| SO3R11 | 36.7901 | |||||||
| EC3R3 | 36.5868 | |||||||
| Stage | Decision-Making Stage | Design Stage | Construction Stage | Operation Stage | ||||
|---|---|---|---|---|---|---|---|---|
| NBC | Code | Value | Code | Value | Code | Value | Code | Value |
| SO1R4 | 0.0833 | SO2R7 | 0.1287 | SO3R2 | 0.1970 | SO4R4 | 0.3864 | |
| SO1R5 | 0.0788 | CO2R3 | 0.0429 | EC3R2 | 0.0947 | SO4R2 | 0.0711 | |
| SO1R2 | 0.0667 | EC2R3 | 0.0365 | SO3R12 | 0.0930 | EC4R2 | 0.0665 | |
| CO1R1 | 0.0649 | CO2R4 | 0.0292 | CO3R3 | 0.0360 | SO4R8 | 0.0586 | |
| EC2R5 | 0.0249 | CO3R1 | 0.0306 | EC4R4 | 0.0425 | |||
| EN3R1 | 0.0246 | EC4R5 | 0.0425 | |||||
| EN3R2 | 0.0228 | |||||||
| SO3R11 | 0.0204 | |||||||
| SO3R3 | 0.0189 | |||||||
| Stage | No. | ||||||||||
|---|---|---|---|---|---|---|---|---|---|---|---|
| 1 | 2 | 3 | 4 | 5 | 6 | 7 | 8 | 9 | 10 | ||
| Decision-making Stage | Start | EC1R4 | EC1R1 | SO1R4 | SO1R4 | SO1R2 | SO1R5 | SO1R6 | EC1R2 | SO1R6 | EC1R6 |
| End | SO1R2 | SO1R5 | CO1R2 | CO1R3 | SO1R4 | CO1R3 | SO1R7 | SO1R5 | SO1R4 | SO1R4 | |
| Value | 0.0625 | 0.0349 | 0.0331 | 0.0276 | 0.0221 | 0.0221 | 0.0202 | 0.0196 | 0.0193 | 0.0184 | |
| Design Stage | Start | EC2R4 | SO2R3 | EN2R2 | SO2R2 | EC2R3 | EC2R1 | EN2R1 | EC2R5 | EC2R5 | EC2R2 |
| End | SO2R7 | EC2R3 | CO2R3 | CO2R5 | SO2R2 | SO2R7 | CO2R3 | SO2R3 | SO2R7 | SO2R7 | |
| Value | 0.0390 | 0.0342 | 0.0303 | 0.0259 | 0.0250 | 0.0232 | 0.0215 | 0.0211 | 0.0211 | 0.0197 | |
| Construction Stage | Start | SO3R12 | EC3R1 | SO3R12 | EC3R4 | EC3R2 | SO3R2 | EC3R2 | EC3R5 | SO3R2 | EN3R12 |
| End | CO3R1 | SO3R2 | CO3R3 | SO3R2 | EN3R2 | EN3R9 | EN3R1 | SO3R2 | EN3R6 | SO3R2 | |
| Value | 0.0436 | 0.0293 | 0.0271 | 0.0263 | 0.0243 | 0.0236 | 0.0203 | 0.0197 | 0.0165 | 0.0161 | |
| Operation Stage | Start | SO4R2 | EC4R2 | EC4R4 | EC4R5 | SO4R8 | SO4R4 | EC4R1 | SO4R4 | SO4R4 | SO4R4 |
| End | SO4R4 | SO4R4 | EC4R2 | SO4R4 | SO4R4 | EN4R7 | EC4R4 | CO4R1 | CO4R2 | CO4R3 | |
| Value | 0.0915 | 0.0734 | 0.0589 | 0.0525 | 0.0480 | 0.0399 | 0.0389 | 0.0362 | 0.0362 | 0.0362 | |
| Decision-Making Stage | Design Stage | Construction Stage | Operation Stage | ||||
|---|---|---|---|---|---|---|---|
| Code | Risk | Code | Risk | Code | Risk | Code | Risk |
| SO1R4 | Bribery and corruption | SO2R7 | Bribery and corruption | SO3R2 | Bribery and corruption | SO4R4 | Damages on participation of local residents and community |
| CO1R1 | Unsatisfying national or local legislation | CO2R3 | Lack of sustainable clauses in contract | SO3R12 | Discoordination between contractor and public | EN4R7 | Damages on the ecological balance |
| SO1R5 | Opportunism decision making | CO2R4 | Ambiguous sustainable management program | EC3R2 | Construction delay | SO4R8 | Negative impact on residents’ life quality |
| SO1R2 | Damages on participation of local residents and community | EC2R5 | Designing cost overrun | EN3R12 | Damages to the ecological balance | EC4R5 | Weak contribution on local economy |
| SO1R7 | Difficulty of coordinating interest demand | EC2R3 | Design deficiency | EC3R1 | Construction and installation cost overruns | EC4R2 | Devaluation of residents’ assets (decrease in residents’ income) |
| CO1R2 | Decision-making mechanisms not involving all stakeholders | SO2R5 | Opaque project information (Closed design information) | SO3R3 | Excessive government intervention | SO4R2 | Damages on residents’ health |
| CO1R3 | Weak and opaque decision-making process | EC2R2 | Misestimate in time and cost | SO3R11 | Damages on participation of local residents and community | CO4R4 | |
| EC1R5 | Delay in project approval | CO3R3 | Weak sustainability awareness | ||||
| CO3R1 | Inadequate communication and coordination among stakeholders | ||||||
| EN3R1 | Air pollutant (greenhouse gases, toxic gases, dust) | ||||||
| EN3R2 | Water pollution | ||||||
| EC3R3 | Substandard quality | ||||||
| EN3R11 | Damages to natural heritage | ||||||
Publisher’s Note: MDPI stays neutral with regard to jurisdictional claims in published maps and institutional affiliations. |
© 2022 by the authors. Licensee MDPI, Basel, Switzerland. This article is an open access article distributed under the terms and conditions of the Creative Commons Attribution (CC BY) license (https://creativecommons.org/licenses/by/4.0/).
Share and Cite
Li, Y.; Xiang, P.; You, K.; Guo, J. Dynamic Network Analysis of the Risks of Mega Infrastructure Projects from a Sustainable Development Perspective. Buildings 2022, 12, 434. https://doi.org/10.3390/buildings12040434
Li Y, Xiang P, You K, Guo J. Dynamic Network Analysis of the Risks of Mega Infrastructure Projects from a Sustainable Development Perspective. Buildings. 2022; 12(4):434. https://doi.org/10.3390/buildings12040434
Chicago/Turabian StyleLi, Yuanli, Pengcheng Xiang, Kairui You, and Jin Guo. 2022. "Dynamic Network Analysis of the Risks of Mega Infrastructure Projects from a Sustainable Development Perspective" Buildings 12, no. 4: 434. https://doi.org/10.3390/buildings12040434
APA StyleLi, Y., Xiang, P., You, K., & Guo, J. (2022). Dynamic Network Analysis of the Risks of Mega Infrastructure Projects from a Sustainable Development Perspective. Buildings, 12(4), 434. https://doi.org/10.3390/buildings12040434