Abstract
A finite element model of steel frame joints is established using finite element analysis software ANSYS/LS-DYNA. The ideal triangular impact load is used to numerically analyze the dynamic response of steel frame welded joints under blast loading, the main factors affecting this response, and the failure modes of three types of joints, so as to provide reference for the antiexplosive design of steel frame joints. The results show that steel frame joints vibrate violently in the explosive blast direction. Due to the strain rate effect, the strength of steel increases, the material enters the plastic strengthening stage, and there is a certain residual displacement. In addition, displacement and stress caused by blast action in the joint area are large, and the flange shear failure of the beam and column is prone to occur in the joint. Increasing the flange width of the beam and the column cannot improve the antiexplosive performance of the joints, while increasing their thickness can. Furthermore, bolted and welded joints have the highest stiffness and best antiexplosion performance, followed by welded joints, while the antiexplosion performance of bolted joints was the worst.
1. Introduction
Steel structures have numerous advantages, such as light dead weight, good seismic performance, large building span, and easy construction. Therefore, they are widely used in various commercial and civil buildings. However, after entering the 21st century, ordinary gas explosions and terrorist attacks are topics of great interest. As an important part of the structure, steel frame joints play an important role in the bearing of structures. Thus, research on the dynamic response of steel frame joints under blast loading is increasingly important. For example, Sabuwala et al. [1] conducted finite element analysis on joints with a completely fixed boundary under blast loading. Analysis indicated the shortcomings of the TM5-1300 specification, and corresponding suggestions were put forward. Through finite element analysis on the dynamic response of steel frame structures under blast loading, Urgessa et al. [2] obtained the advantages and disadvantages of three types of joints. In addition, Daryan et al. [3] conducted finite element analysis on the joints connected by upper and lower flange angle steel under blast loading, and discussed the failure mode and applicability of the joints. Furthermore, Wu [4] studied the effects of explosive blast load, stiffener setting, and axial compression ratio of columns on the dynamic response of joints in beams and columns under blast loading. Moreover, Tan [5] analyzed the influence of the explosive blast load on the hysteretic behavior of steel frame joints. Furthermore, Qu et al. [6] studied the influence of different connection modes on the antiexplosive performance of steel frame beam and column joints. Apart from the above studies, Li et al. [7,8] explored the dynamic response of different types of joint structures at the connection between side box beam and web beam under cabin blast loading using the ALE algorithm. Yang [9] proposed a simplified framework for joint analysis, and analyzed the dynamic response and failure modes of three types of joints under indoor blast loading. Zhang et al. [10,11,12,13,14] studied the dynamic response of steel frame structures and components under blast loading, and discussed the feasibility of structural antiexplosion tests with combustible gases as the explosive source. Henrich [15] studied the explosion dynamics and its applications. McGrath et al. [16] performed dynamic response parameter analysis on steel–wood–steel bolted connections under blast loading. Krauthammer [17] studied the behavior of structural steel connection subjected to blast loads. Rajeev et al. [18] studied the dynamic response of an exterior reinforced concrete beam–column joint and proposed a well-instrumented shock tube setup. Chen et al. [19,20] simulated the effect of destruction of a building close to an explosion by the finite element method, and Zhang et al. [21] proposed a steel frame joint model and analyzed the responses under blast loads. Song [22] proposed a simplified form of parametric fragility for steel structure and studied the collapse risk of a 10-story steel frame under blast loads. Flodr et al. [23] proposed a numerical model of omega clip construction element, which features high stability and can be used in a wide variety of buildings. The dynamic response, failure modes, and influencing factors of steel frame joints are numerically simulated using ANSYS/LS-DYNA software. The failure modes of three joints and the main factors affecting the dynamic response of steel frame joints were obtained, which provide reference for the antiexplosive design of steel frame joints.
2. Establishment of Finite Element Model
2.1. Calculation Model
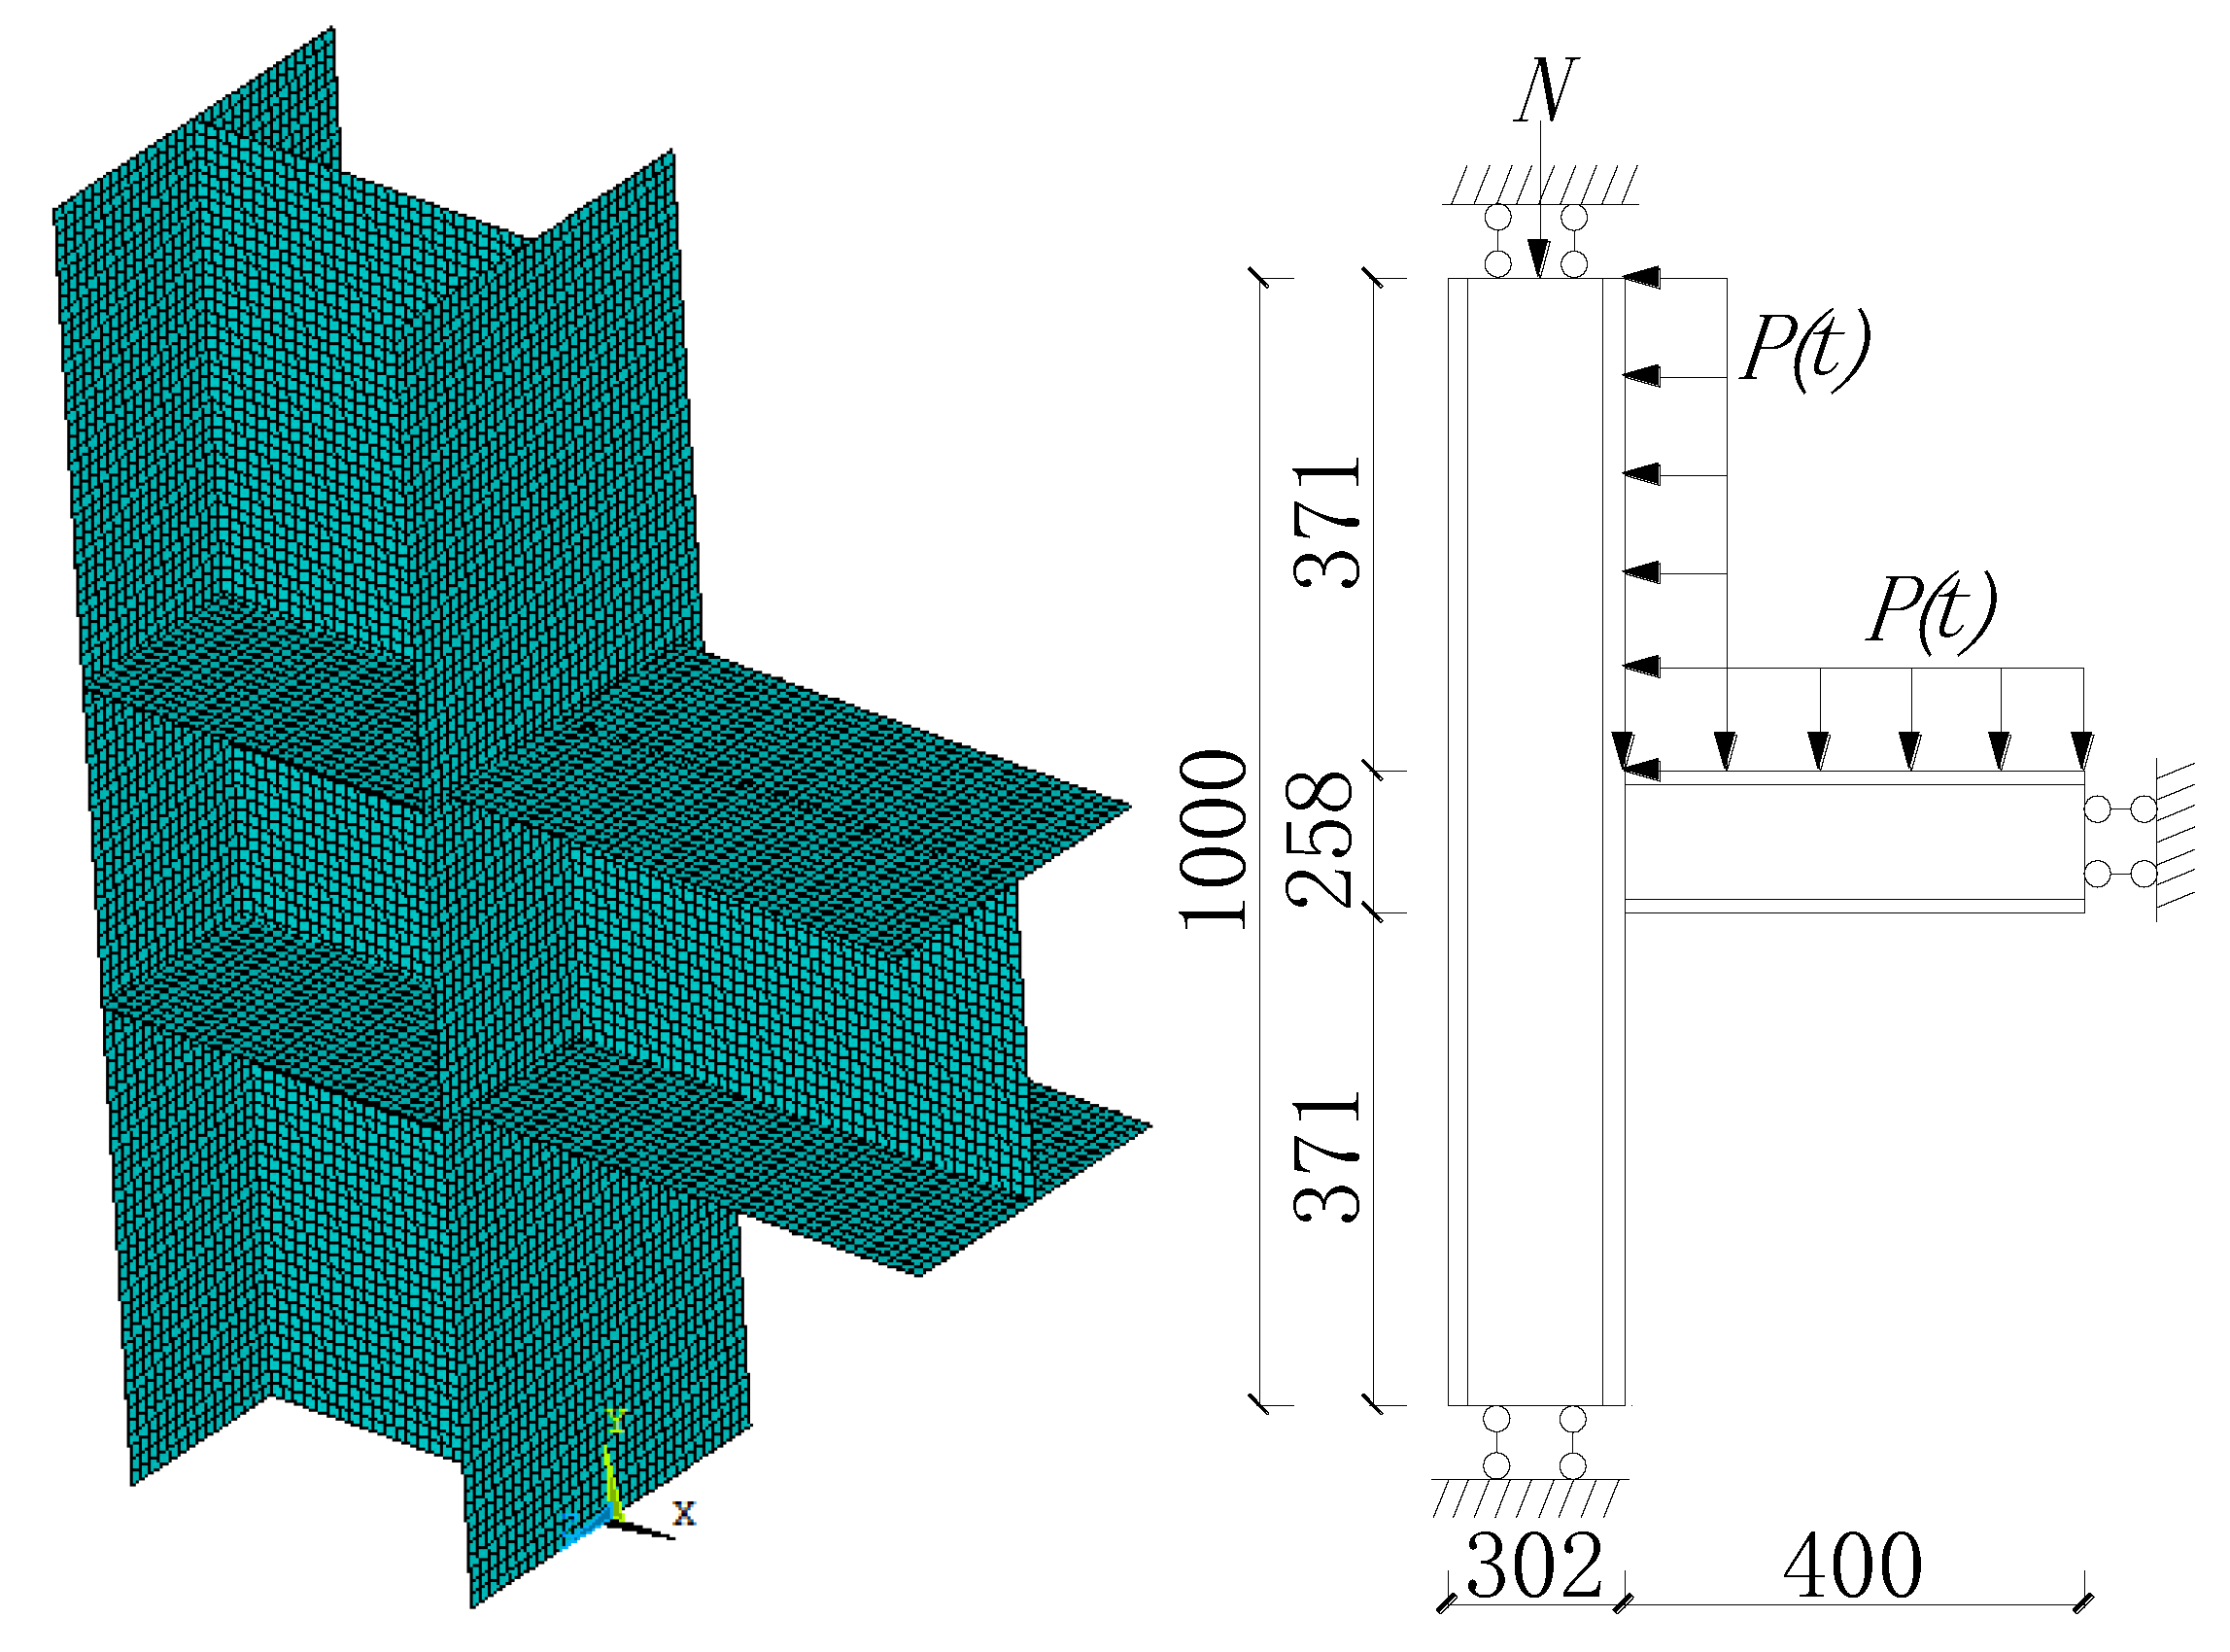
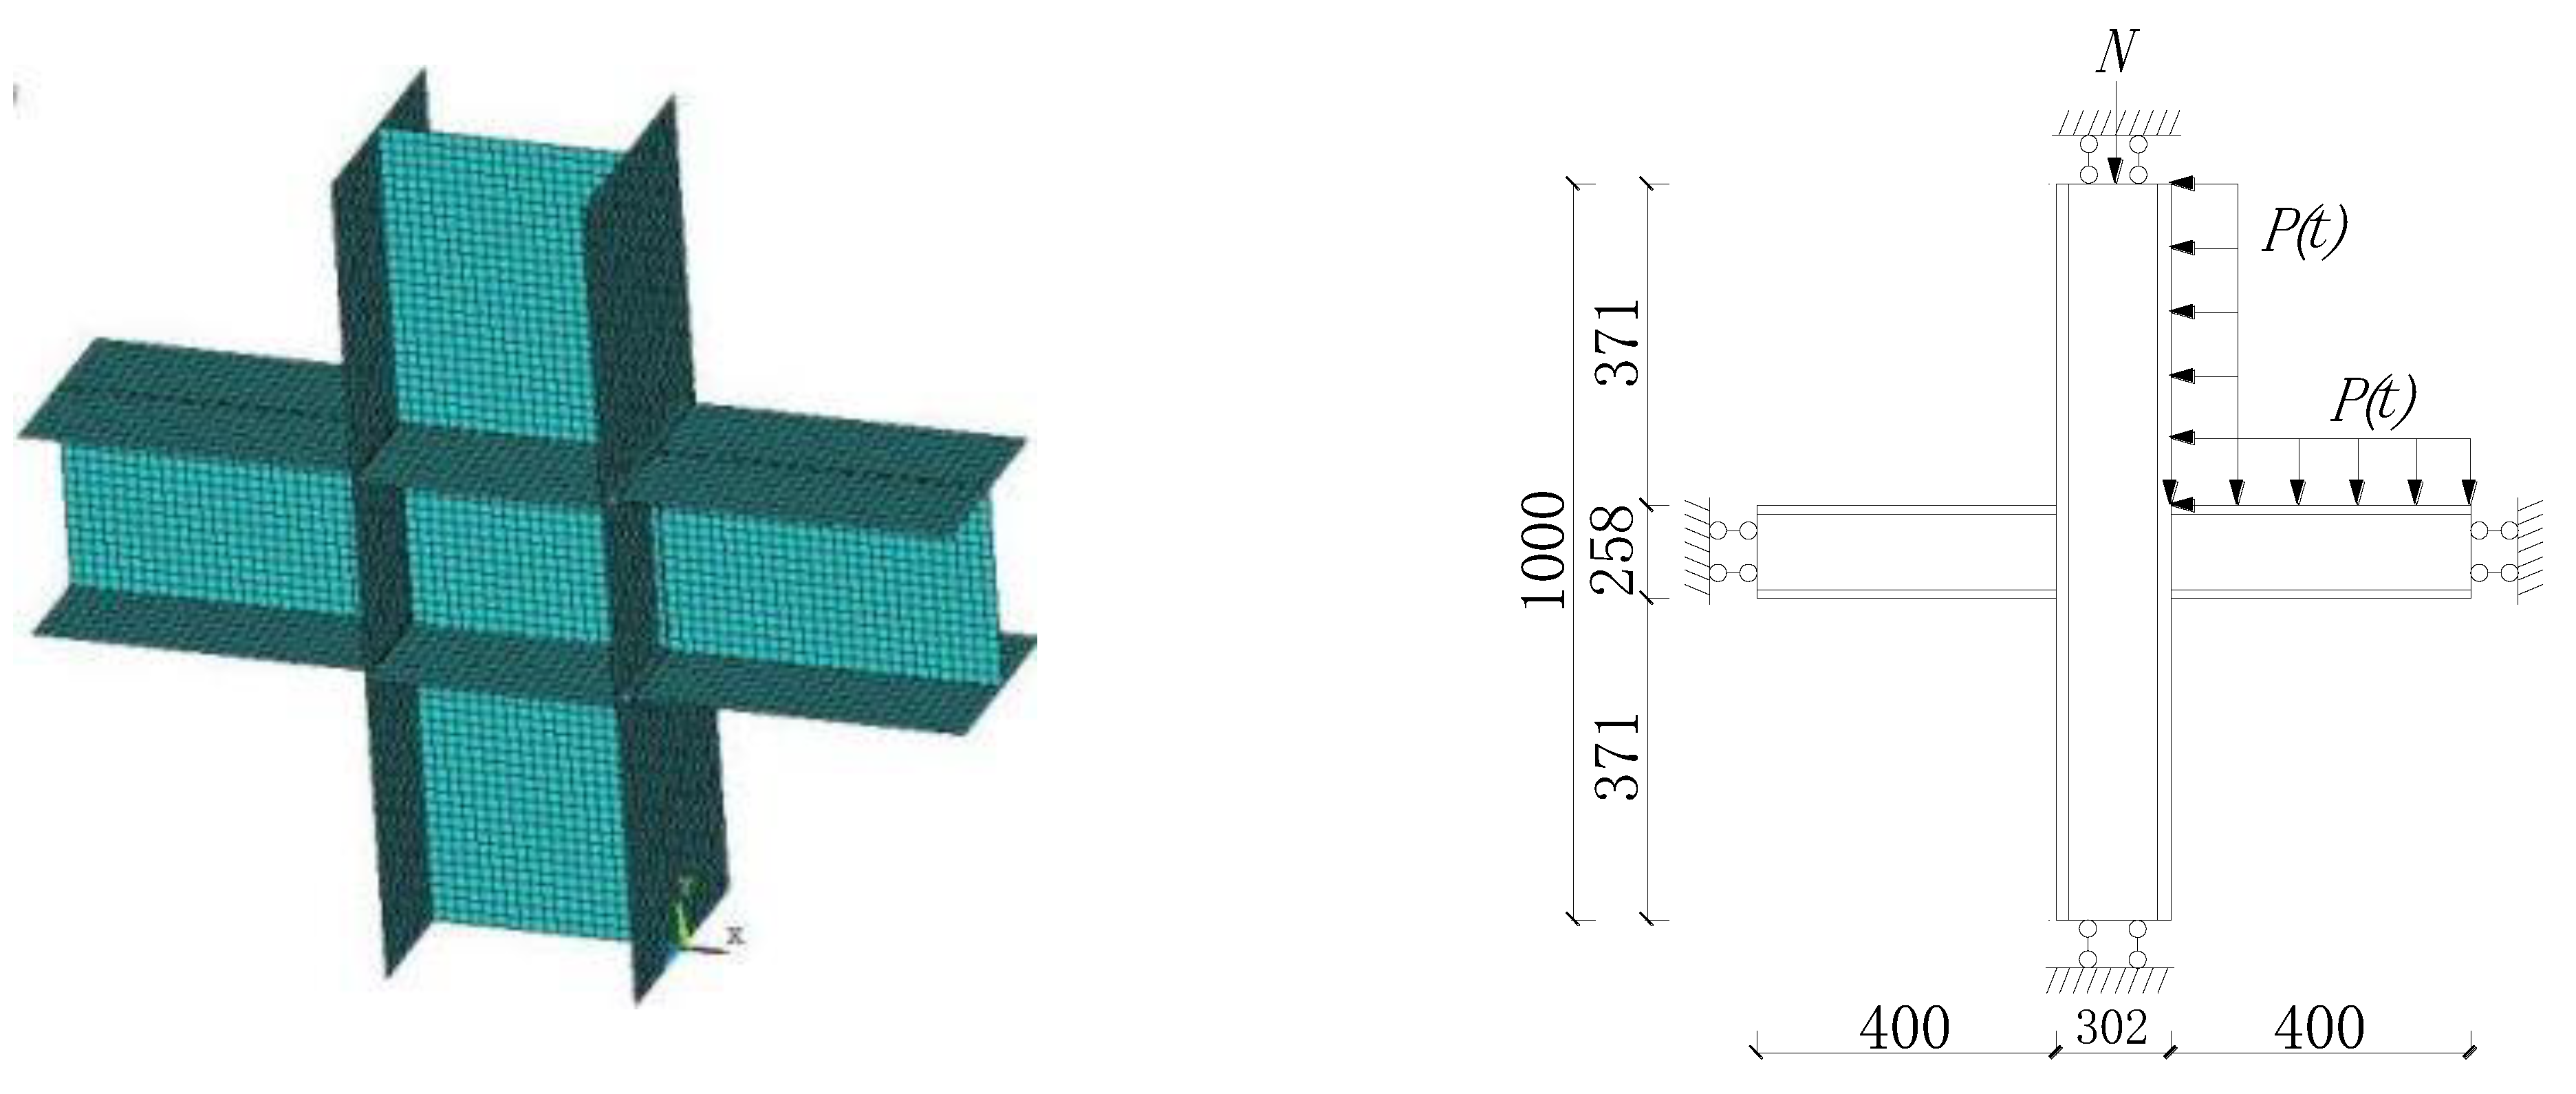
The steel frame joints were 3 m in height, and the column grid was 6 m × 6 m. Joints in the beam and the column were welded with an I-shaped section, and the flange plate size of the beam section was 250 mm × 14 mm with a web size of 230 mm × 10 mm. The flange plate size of the column section was 300 mm × 16 mm with a web size of 270 mm × 10 mm. The thickness of the stiffener on the column was 10 mm, the beam flange, the web, and the column adopted the form of a butt weld, weld leg size was 10 mm, and the strength grade of steel was Q345. The section met the strength requirements and structural requirements under static loading. Welding defects are random, diverse, and uncontrollable, and the influence of welding defects, residual stress, and other factors was ignored in the analysis. Horizontal rolling hinge supports were used at the top and bottom of the column, and vertical rolling hinge supports were adopted at the end of the beam. To truly simulate the stress of steel frame joints, a vertical load of N = 0.3Ncr = 558 kN was applied on the column top, where Ncr = 1860 kN is the stable bearing capacity of the column under axial compression, and a uniform load of 4 kN/m2 was applied on the upper flange of the beam. A finite element model was established and is shown in Figure 1.

Figure 1.
Finite element model and calculation model of joints (Unit: mm).
The frame beam and column adopted 4-node shell element Shell163, and the weld adopted 8-node solid element Solid164. Beams and columns were Q345 steel, the weld adopted was an E5016 welding rod, and the Cowper–Symonds constitutive model considering the influence of strain rates was utilized in the model. The specific parameter values are shown in Table 1 [24]. The finite element model and calculation model diagram of steel frame welded joints are shown in Figure 1.

Table 1.
Cowper–Symonds constitutive model parameters of Q345 steel.
2.2. Simplification of Blast Load
In the antiexplosive design and the dynamic response analysis of the structure under the action of blast load, the overpressure time–history curve of blast load is commonly used. However, due to the irregularity of this curve, it is not convenient for practical application. Therefore, to facilitate calculation, researchers simplify it into two hypothetical triangular loads, namely, positive and negative overpressure impact loads. At the same time, the actual positive overpressure duration is simplified into the hypothetical positive overpressure duration, as shown in Figure 2.
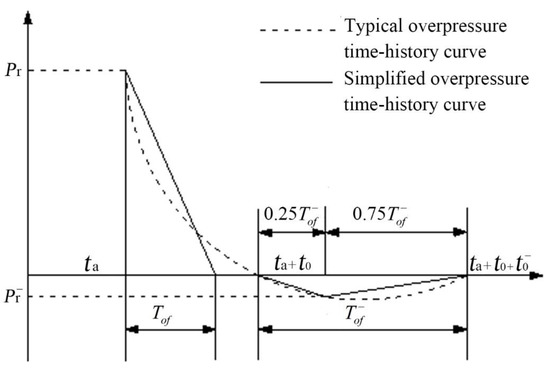
Figure 2.
Simplified blast overpressure load model.
When the simplified positive overpressure blast reaches the target point at ta from the explosive wave, it instantly rises from zero to the maximal value, and then begins to decline linearly until the hypothetical positive overpressure duration decreases to zero. The hypothetical positive overpressure duration is defined as
where Ir is the positive impulse of the blast load, and Pr is the positive peak pressure of the blast load.
Since the value of at the hypothetical positive overpressure duration obtained in Equation (1) was smaller than the value of at the actual positive overpressure duration, there was an interval between the end of the positive overpressure load and the beginning of the negative overpressure load in the simplified curve. To accurately define the negative overpressure load, the time interval parameter was retained in the simplified overpressure load curve.
The part of simplified negative overpressure load first decreased linearly from zero, reached the negative maximal value after time of 0.25 , and then increased linearly to zero. is the hypothetical negative overpressure duration, and it could be obtained from the following equation:
where is the negative impulse of the blast load, and is the negative peak pressure of the blast load.
The above simplified overpressure time–history curve of blast load was divided into positive and negative parts. When blast pressure was higher than atmospheric pressure P0, it was positive, and when it was lower than atmospheric pressure P0, it was negative. Since most of the energy in the blast load was concentrated in the stage where the positive part works, the negative part is generally ignored in the numerical simulation of an explosion; only the influence of the positive part on the components is considered, and time ta when the explosive wave reaches the target point is ignored. At that time, the pressure of the positive part can be expressed as
where Pr is the peak overpressure of the blast load, and td is the duration of the blast load.
In this paper, the ideal triangular impact load, as simplified in Equation (3), was adopted, and the blast load was applied to the upper flange of the beam and the upper flange of the column. Peak overpressure of blast load Ps was 5 MPa, and the action time of the blast load was 16 ms.
3. Dynamic Response of Joints
3.1. Deformation Characteristics of Joints
Figure 3 shows the deformation of frame joints at different times. When t = 0 s, the steel frame joint only bore a static load, the column flange had slight deformation, and the beam had no significant changes. With the increase in blast load, displacement in the joint area rapidly increased, the beam vibrated up and down, and the column vibrated left and right. The displacement of the end of the beam flange and column flange directly bearing the blast load was relatively large, and the deformation of the part indirectly bearing the blast load was relatively small because the ends of the beam and column were hinged; hence, the constraints were insufficient in addition to the locality and weak transmission of the blast load.

Figure 3.
Deformation of joints at different times: (a) t = 0 s, (b) t = 0.002 s, (c) t = 0.016 s, (d) t = 0.1 s.
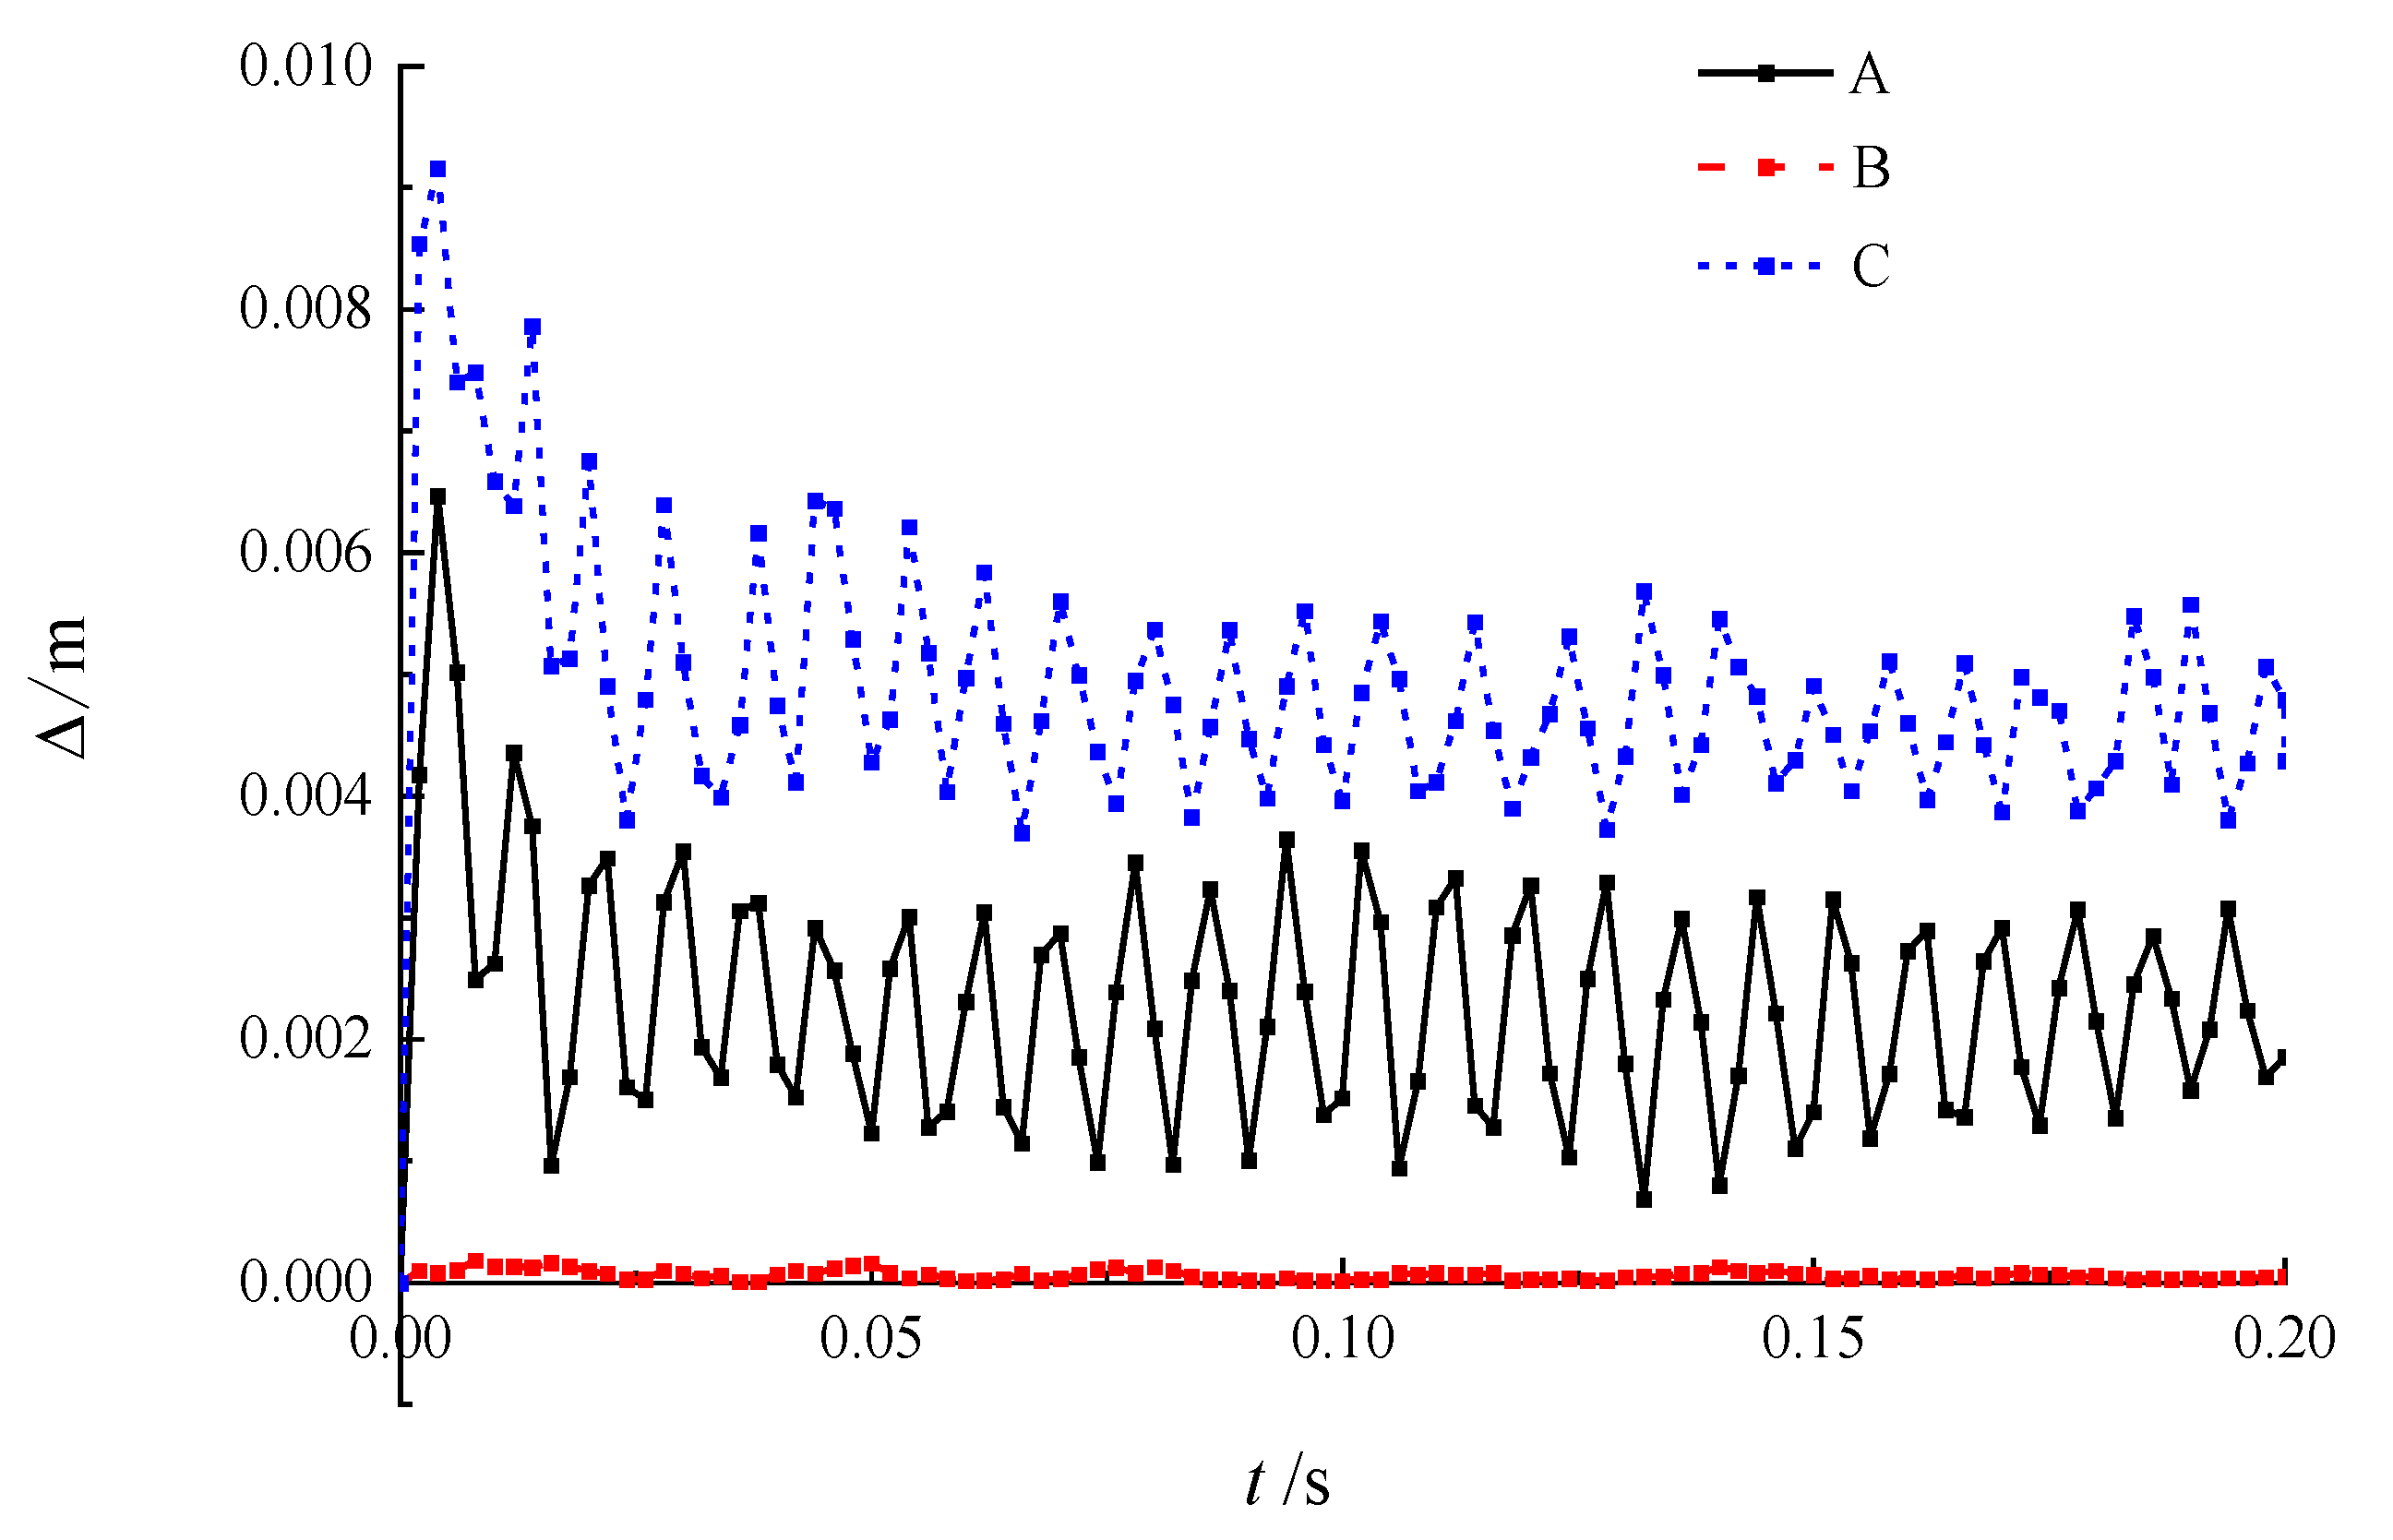
As shown in Figure 4, point A was selected where the edge displacement at the end of the upper flange of the beam was large, point B was selected at the weld edge of the beam and the column, and point C was selected where the edge displacement at the upper edge of the column flange is large. To further study the deformation process of the joint, the displacement time–history curves of points A, B, and C are given in Figure 5, where Δ represents the displacement.
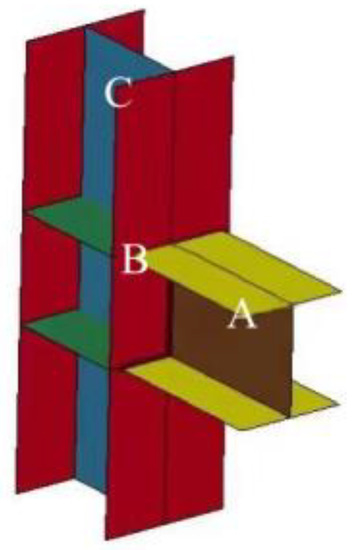
Figure 4.
Position diagram of points A, B, and C.

Figure 5.
Time–history curve of joint displacement.
As shown in Figure 5, when the blast load was applied to the joint, displacement in the joint area reached the maximum almost instantaneously and then vibrated at the equilibrium center of each point. Among displacements of points A, B, and C, the overall displacement of point C was higher than that of points A and B, and its maximal value was 9.6 mm. That is, the maximal displacement in the joint area appeared at the column flange, which was mainly because the section size of the column was relatively large, and the blast load was relatively large. The displacement of point B was the smallest, that is, there was basically no deformation at the weld. At that time, it was still at the elastic stage, which was not enough to cause weld damage. The reason for this phenomenon is that the butt weld at the joint of the beam and the column was equivalent to a rigid connection, and stiffness was large.
3.2. Velocity Characteristics of Joints
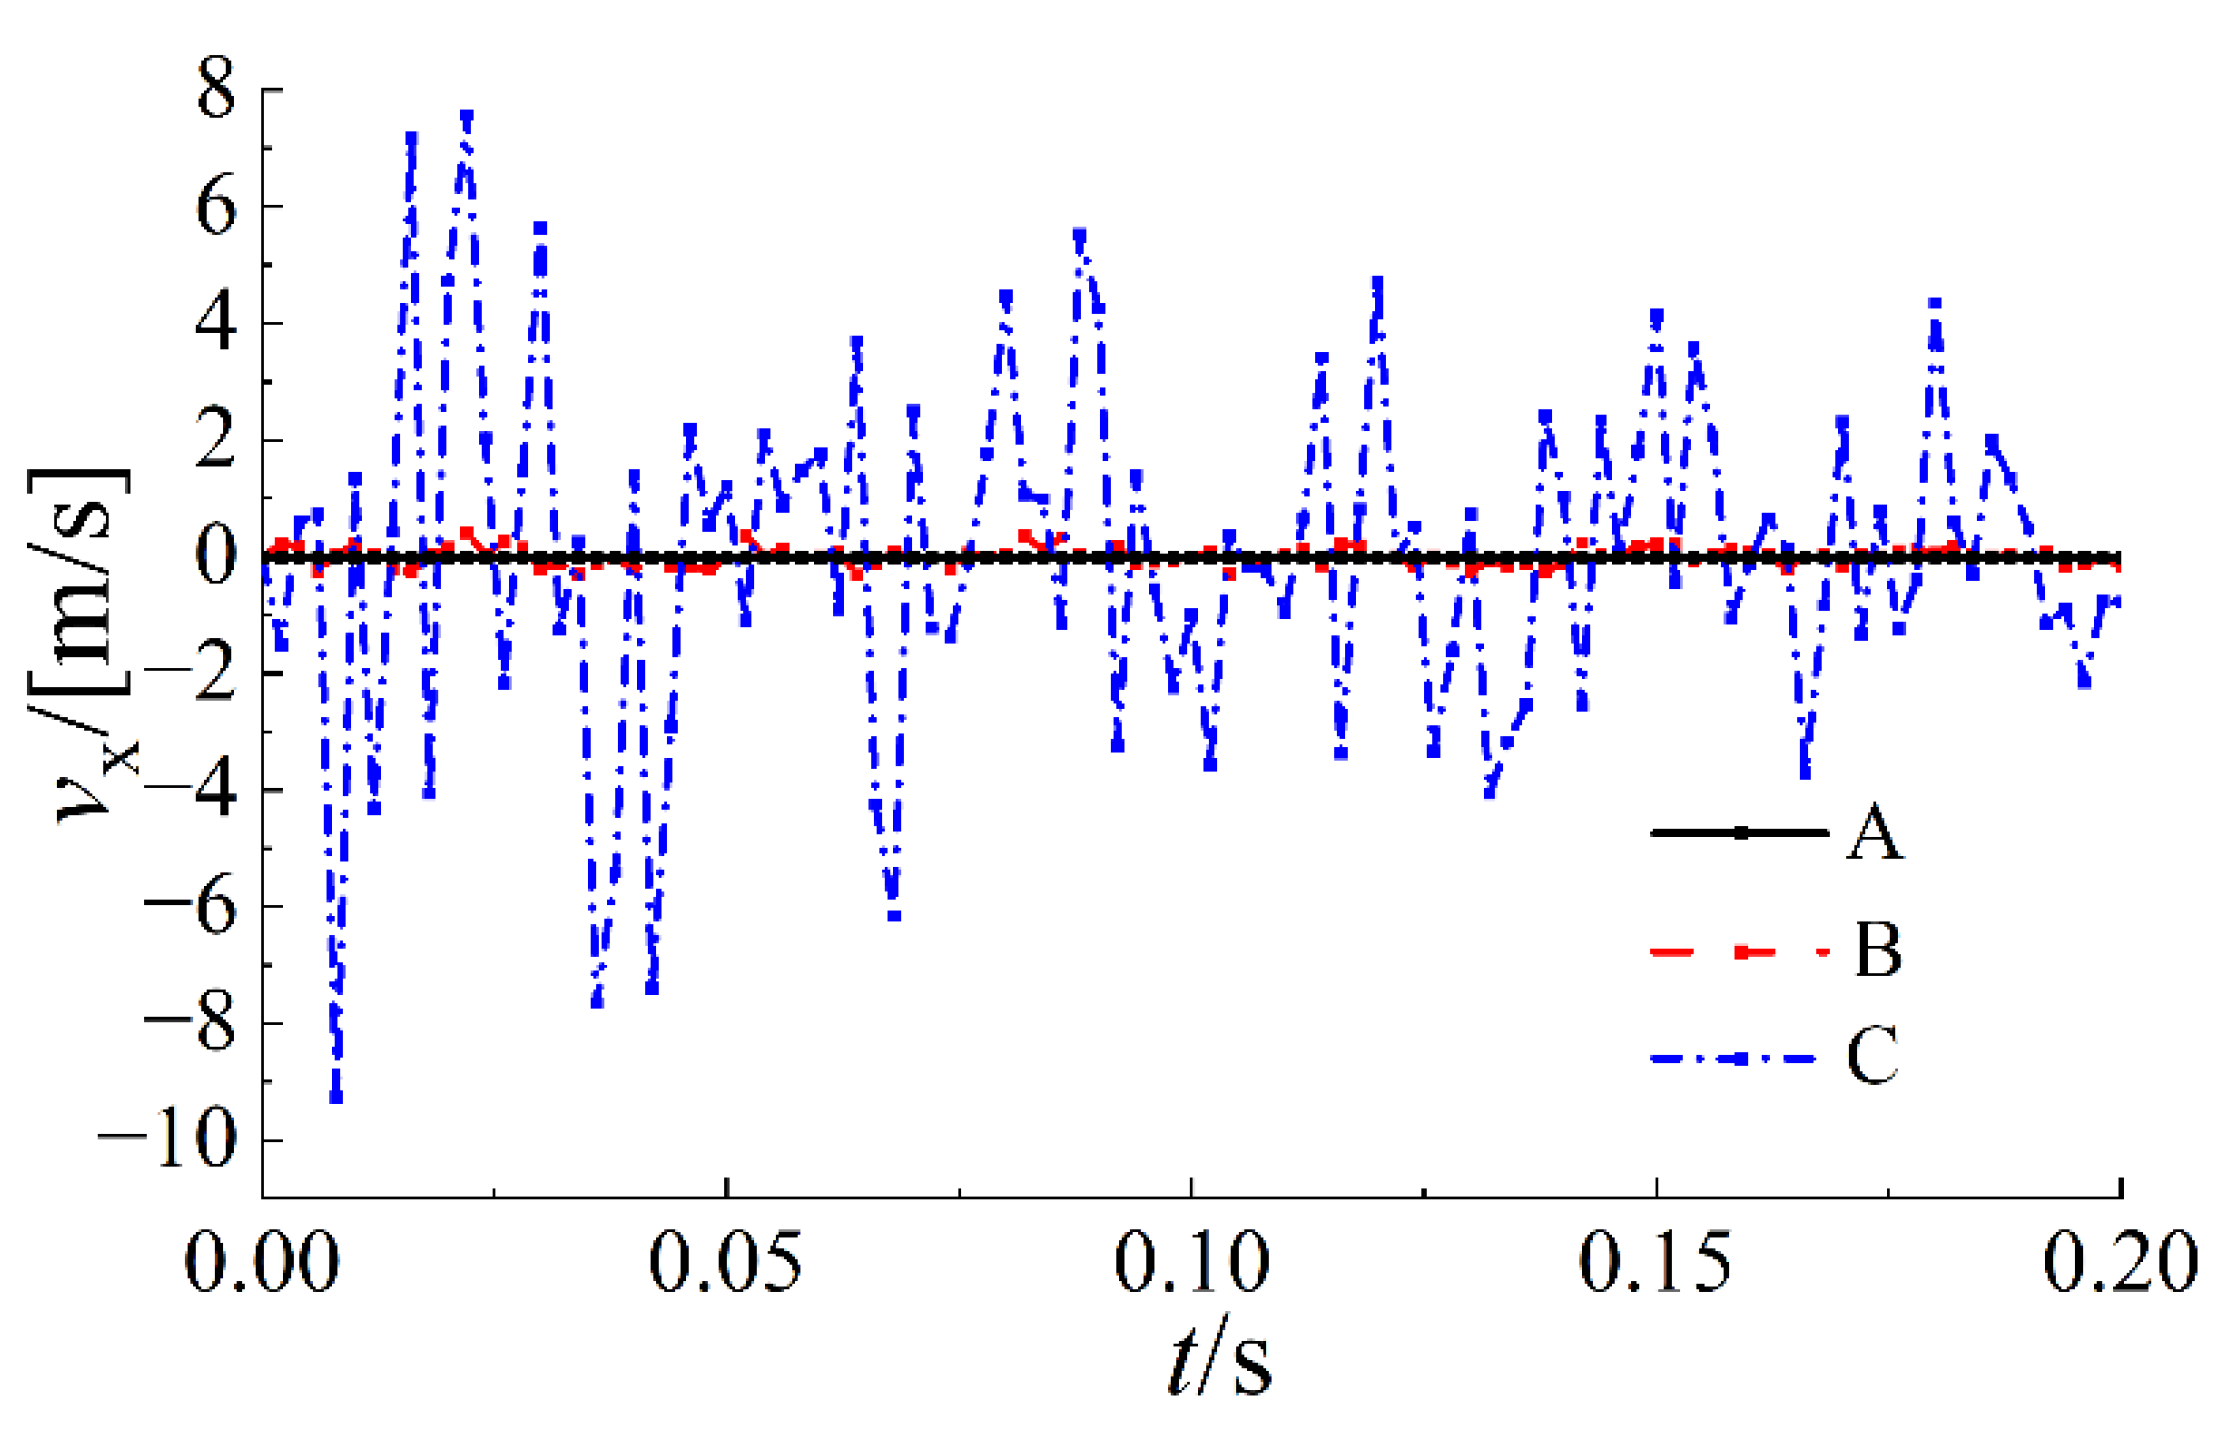
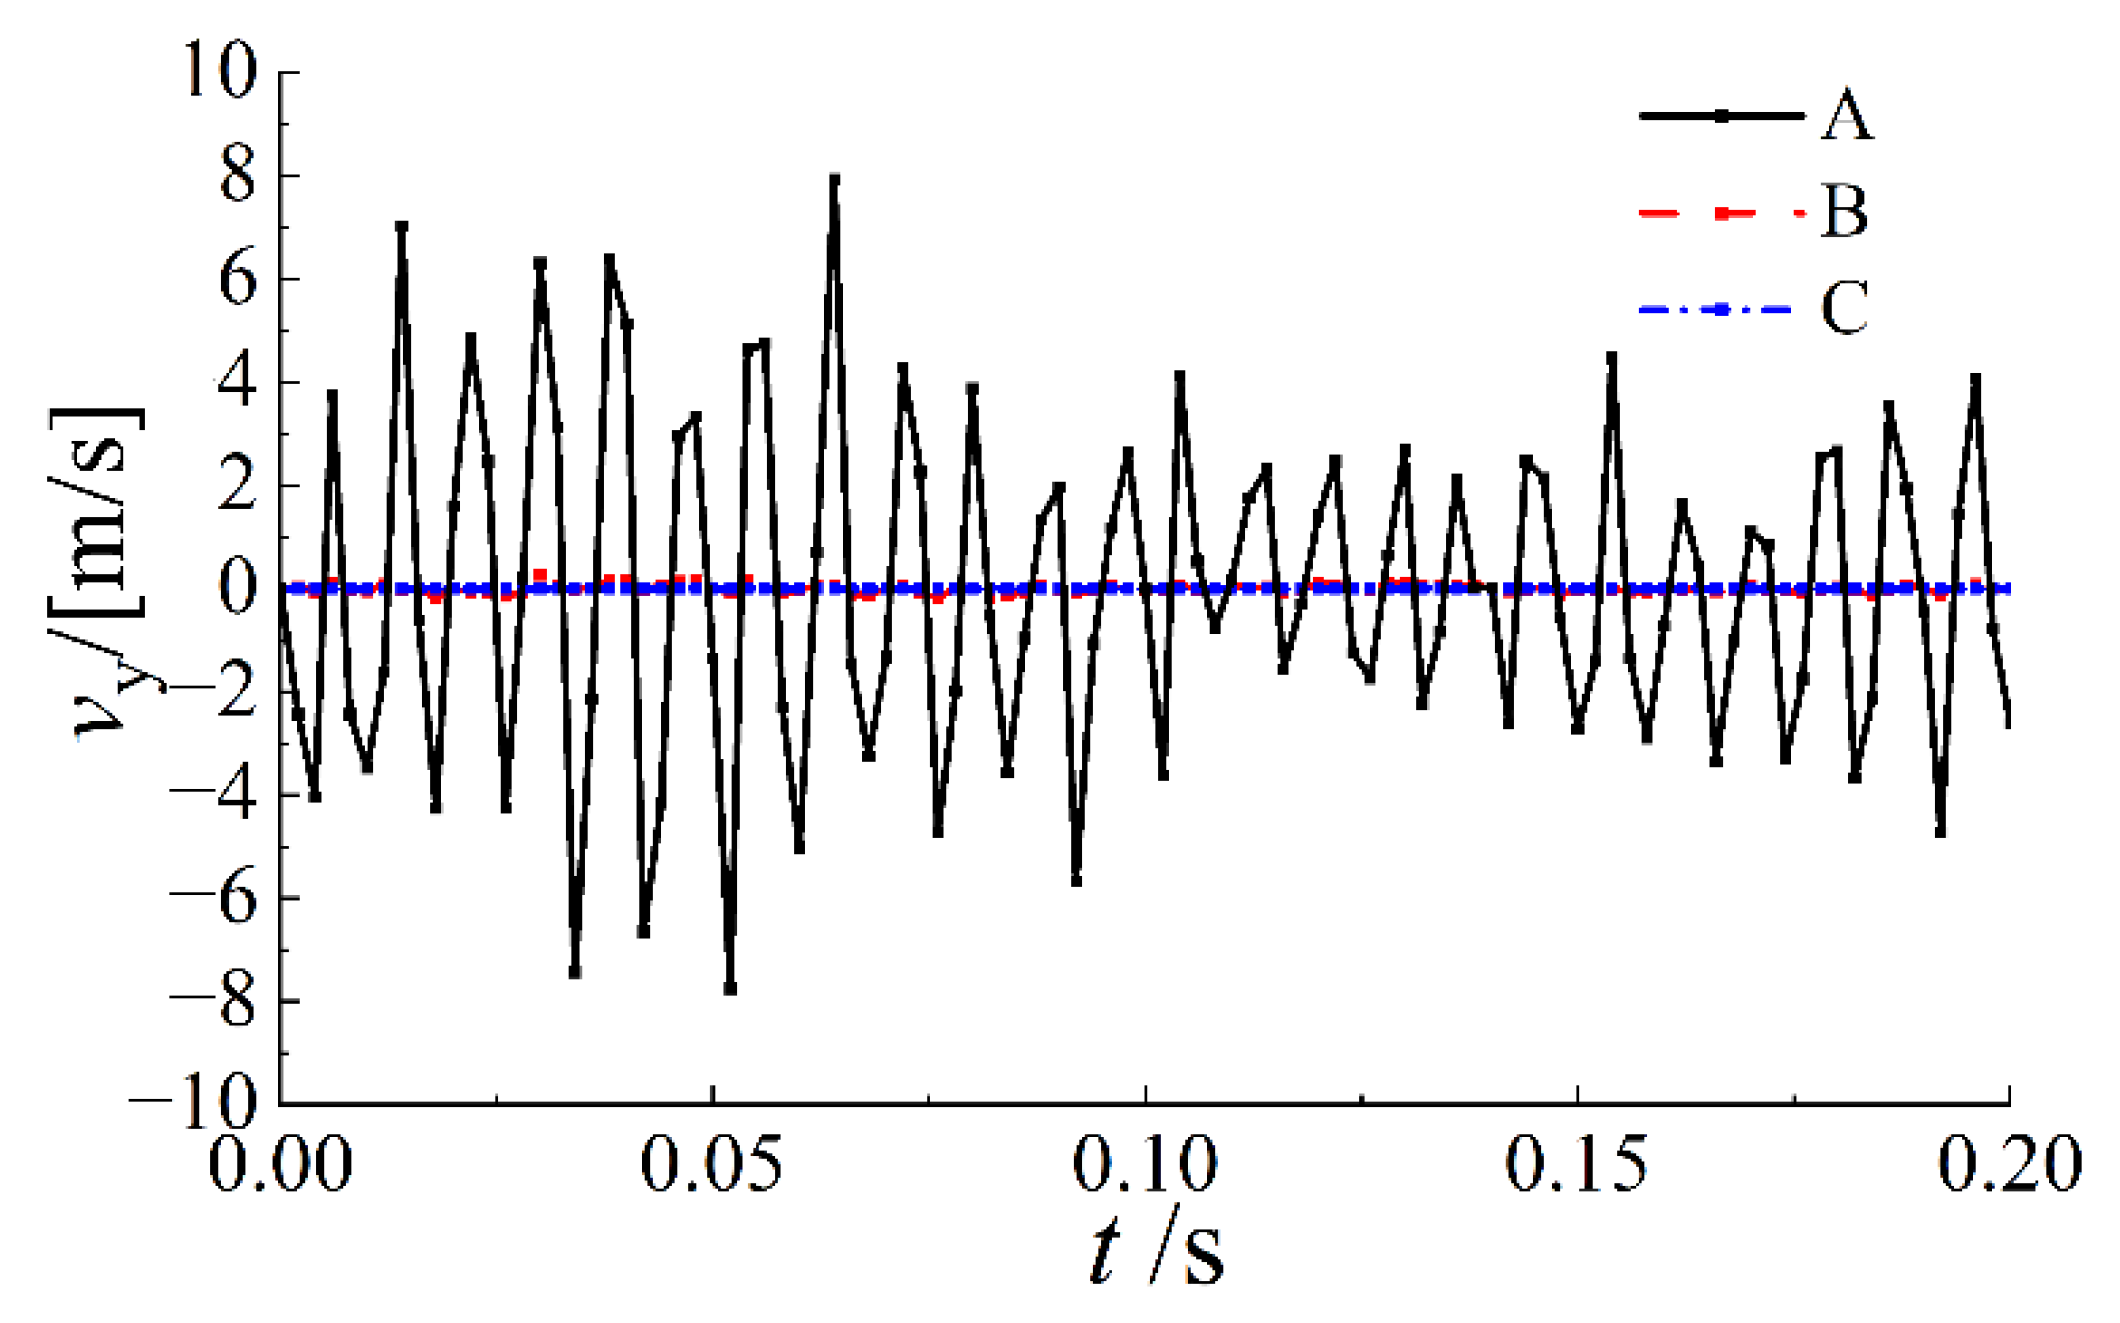
Figure 6 and Figure 7 show the velocity time–history curves of points A, B, and C along the x and y directions, respectively (vx represents the horizontal velocity, and vy represents the vertical velocity). As the two figures show, the velocity of point A, that is, the beam flange velocity, was large in the y direction and zero in the x direction. The velocity of point B, that is, the weld velocity, was minimal in the x and y directions, and basically near zero. The main reason is that it is difficult to produce large velocity due to constraints between beam and column. The velocity of point C, that is, the column flange velocity, was rather large in the x direction and very small in the y direction. The main reason is that the blast load applied on the column is in the horizontal direction, and the column lost stability out of plane. The blast load applied on the beam was vertical, leading to the bending vibration of the main plane.

Figure 6.
Horizontal velocity time–history curve.
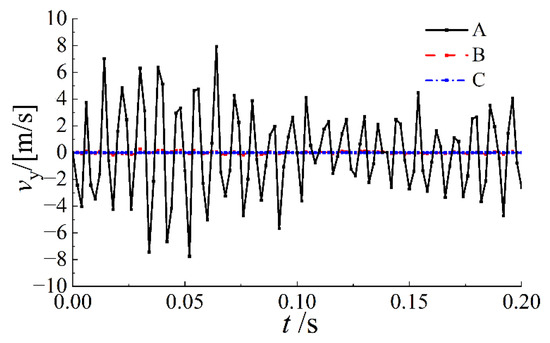
Figure 7.
Vertical velocity time–history curve.
Taken together, the velocity generated by the joint in the explosive blast direction was large, up to 9.26 m/s, while the velocity generated in other directions was small. The velocity of the blast on the joint oscillated up and down with zero. First, it oscillated in an increasing trend, and then in an attenuation trend, that is, the joint vibrated in the explosive blast direction.
3.3. Stress Characteristics of Joints
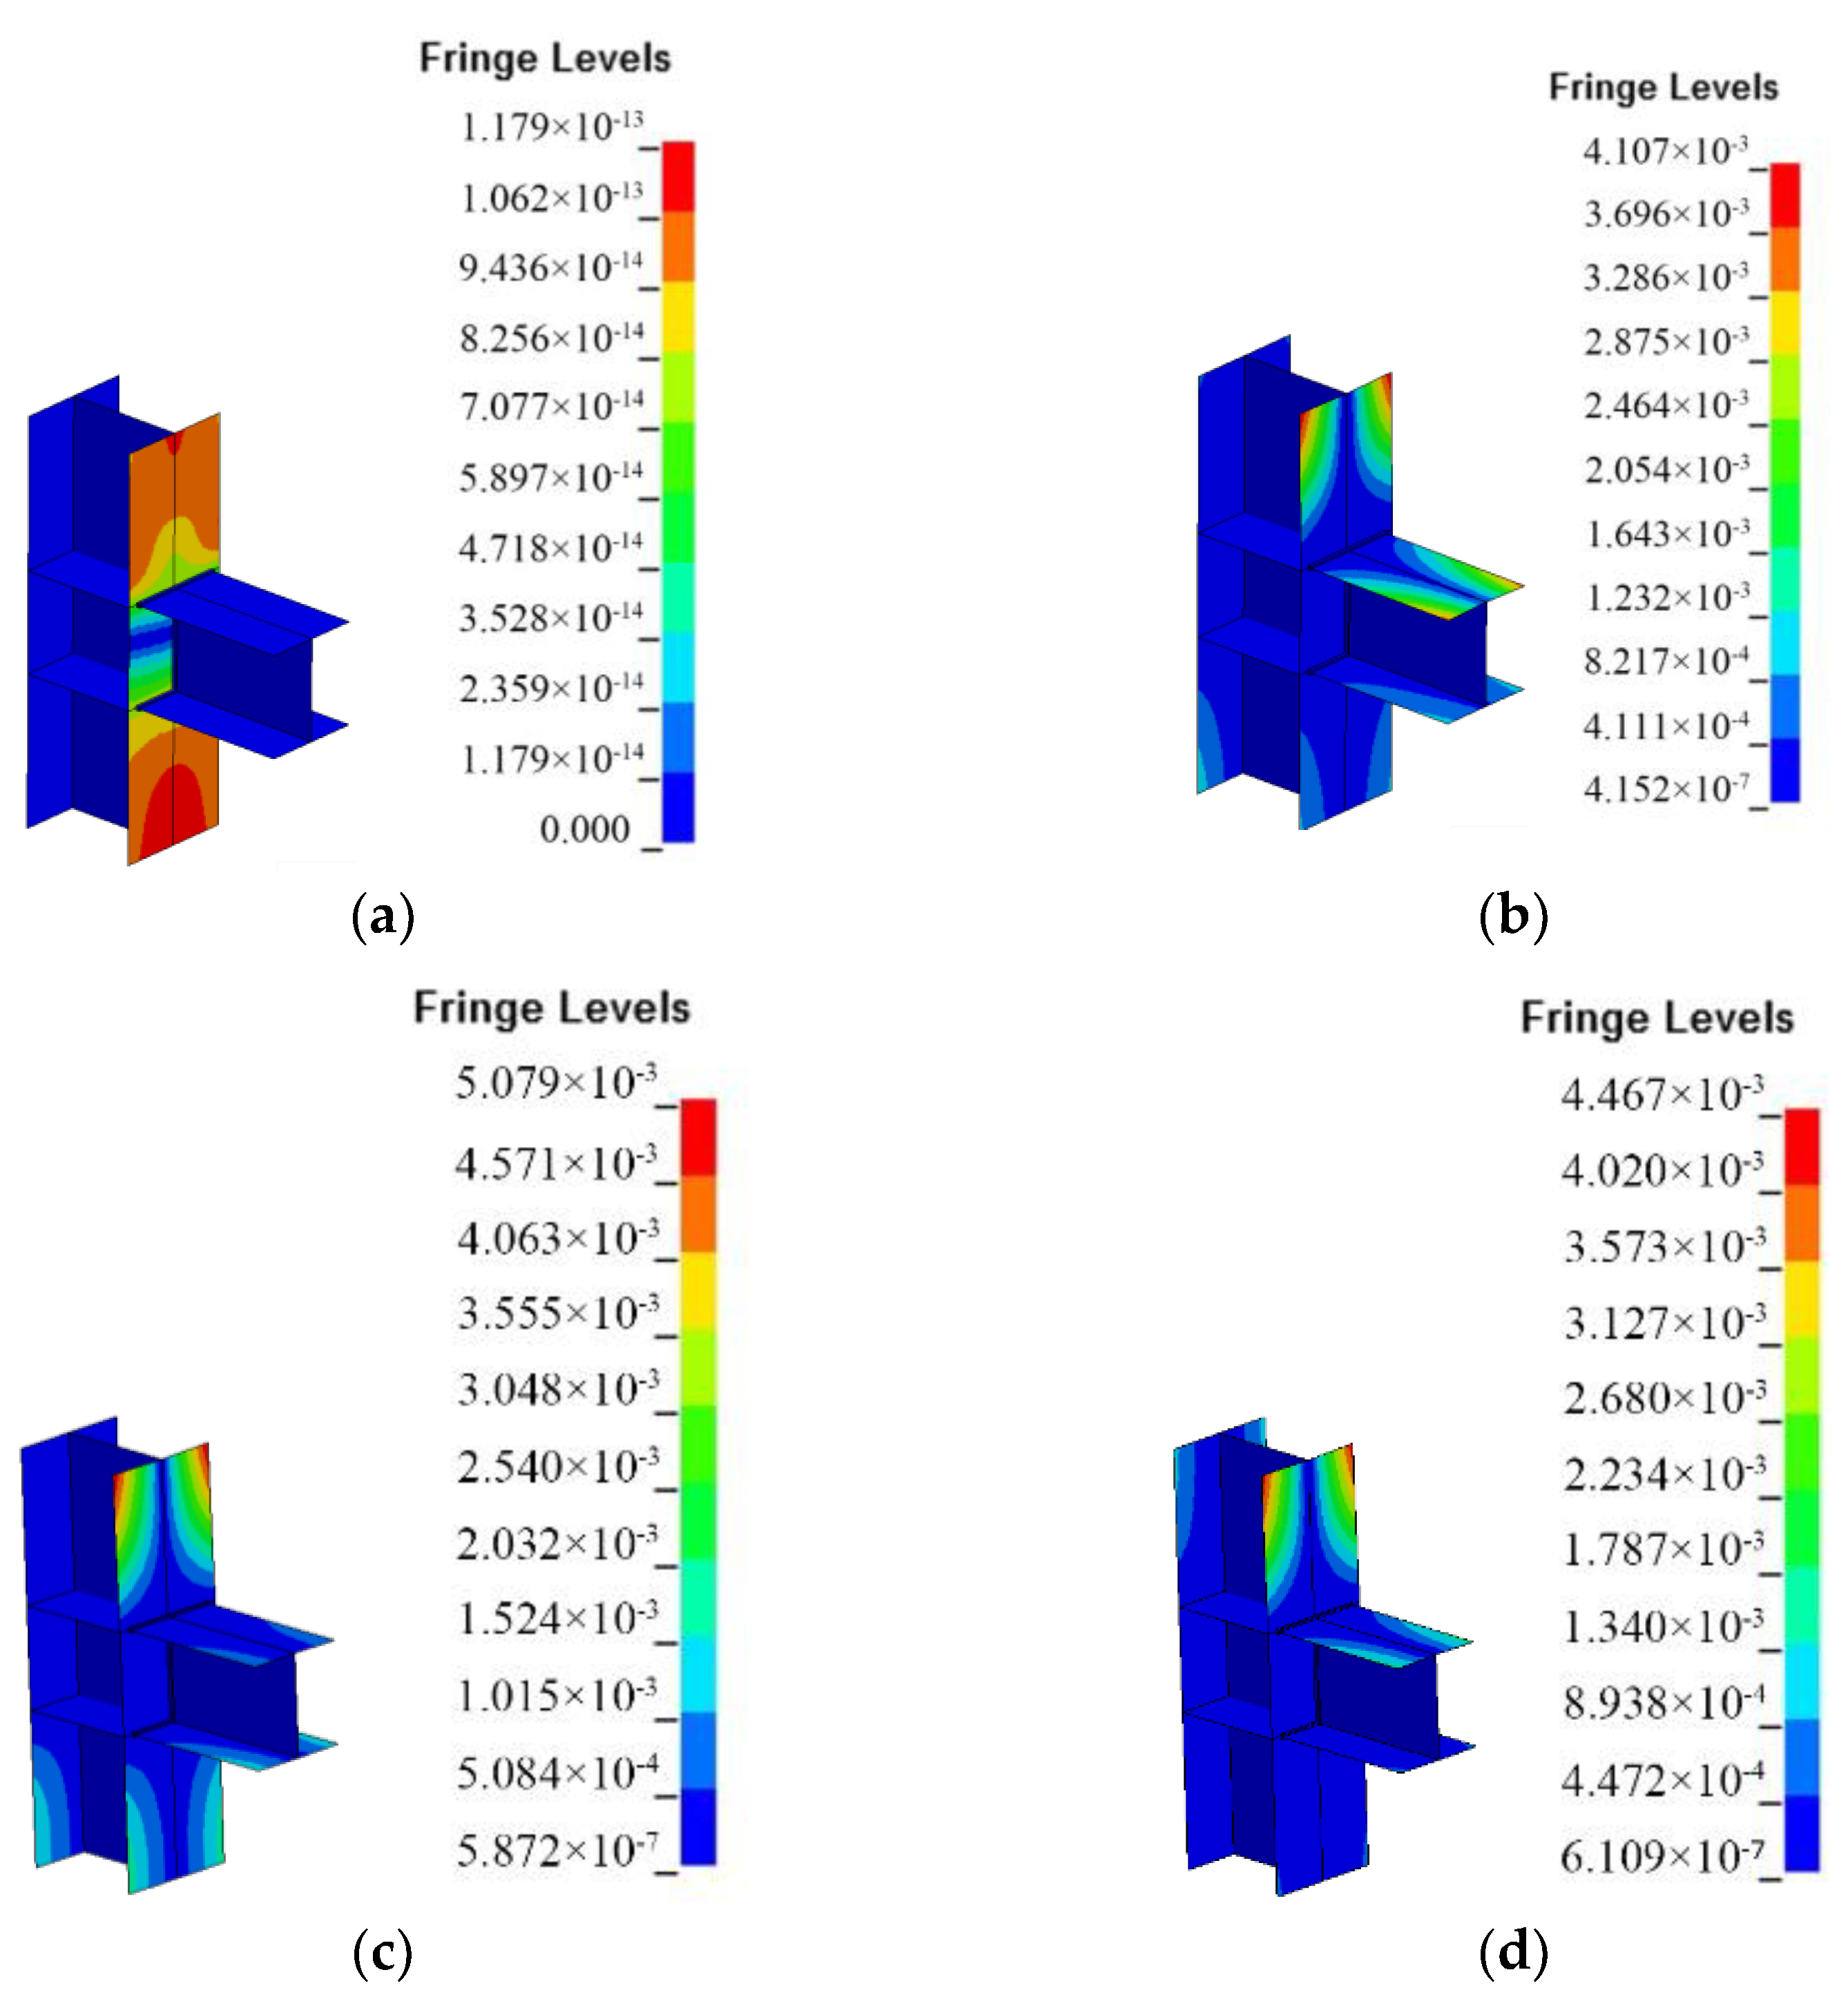
Von Mises stress is an equivalent stress that was selected for joint stress analysis. In Von Mises stress, the stress contour reflects the stress distribution of the model, which can clearly describe the change process of stress in the model and reflect the riskiest area in the model. Figure 8 shows the nephogram of von Mises-equivalent stress at the time when the joint was only subjected to static load before blast load, when the blast load reaches the peak value, when the blast load ends, and when the blast action decays to stability.
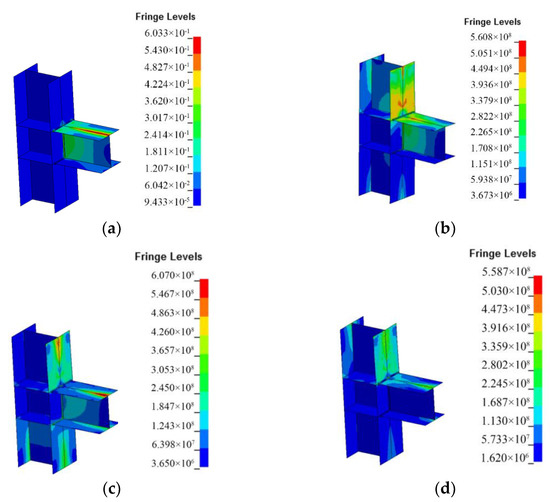
Figure 8.
Stress of the joint at different times: (a) t = 0 s, (b) t = 0.002 s, (c) t = 0.016 s, (d) t = 0.1 s.
As shown in Figure 8, when t = 0 s, the beam was mainly subjected to static load, and the stress was relatively small, which is mainly concentrated on the beam and weld. When t = 0.002 s, that is, when the blast load reaches the peak value, the stress instantly increases to 560 MPa, which is far higher than yield strength. The stress was mainly concentrated on the flange of the beam and the column, was relatively close to the weld, and the stress on the weld was also relatively large. When the blast load ended, the stress at each part of the beam and column continued to increase, and the area with large stress was mainly concentrated in the flange of the beam and the column. With blast attenuation, stress in the joint area also decreased, but the area with large stress was still concentrated at the junction of the beam and column flange, and there exists significant stress concentration.
4. Failure Modes of Joints
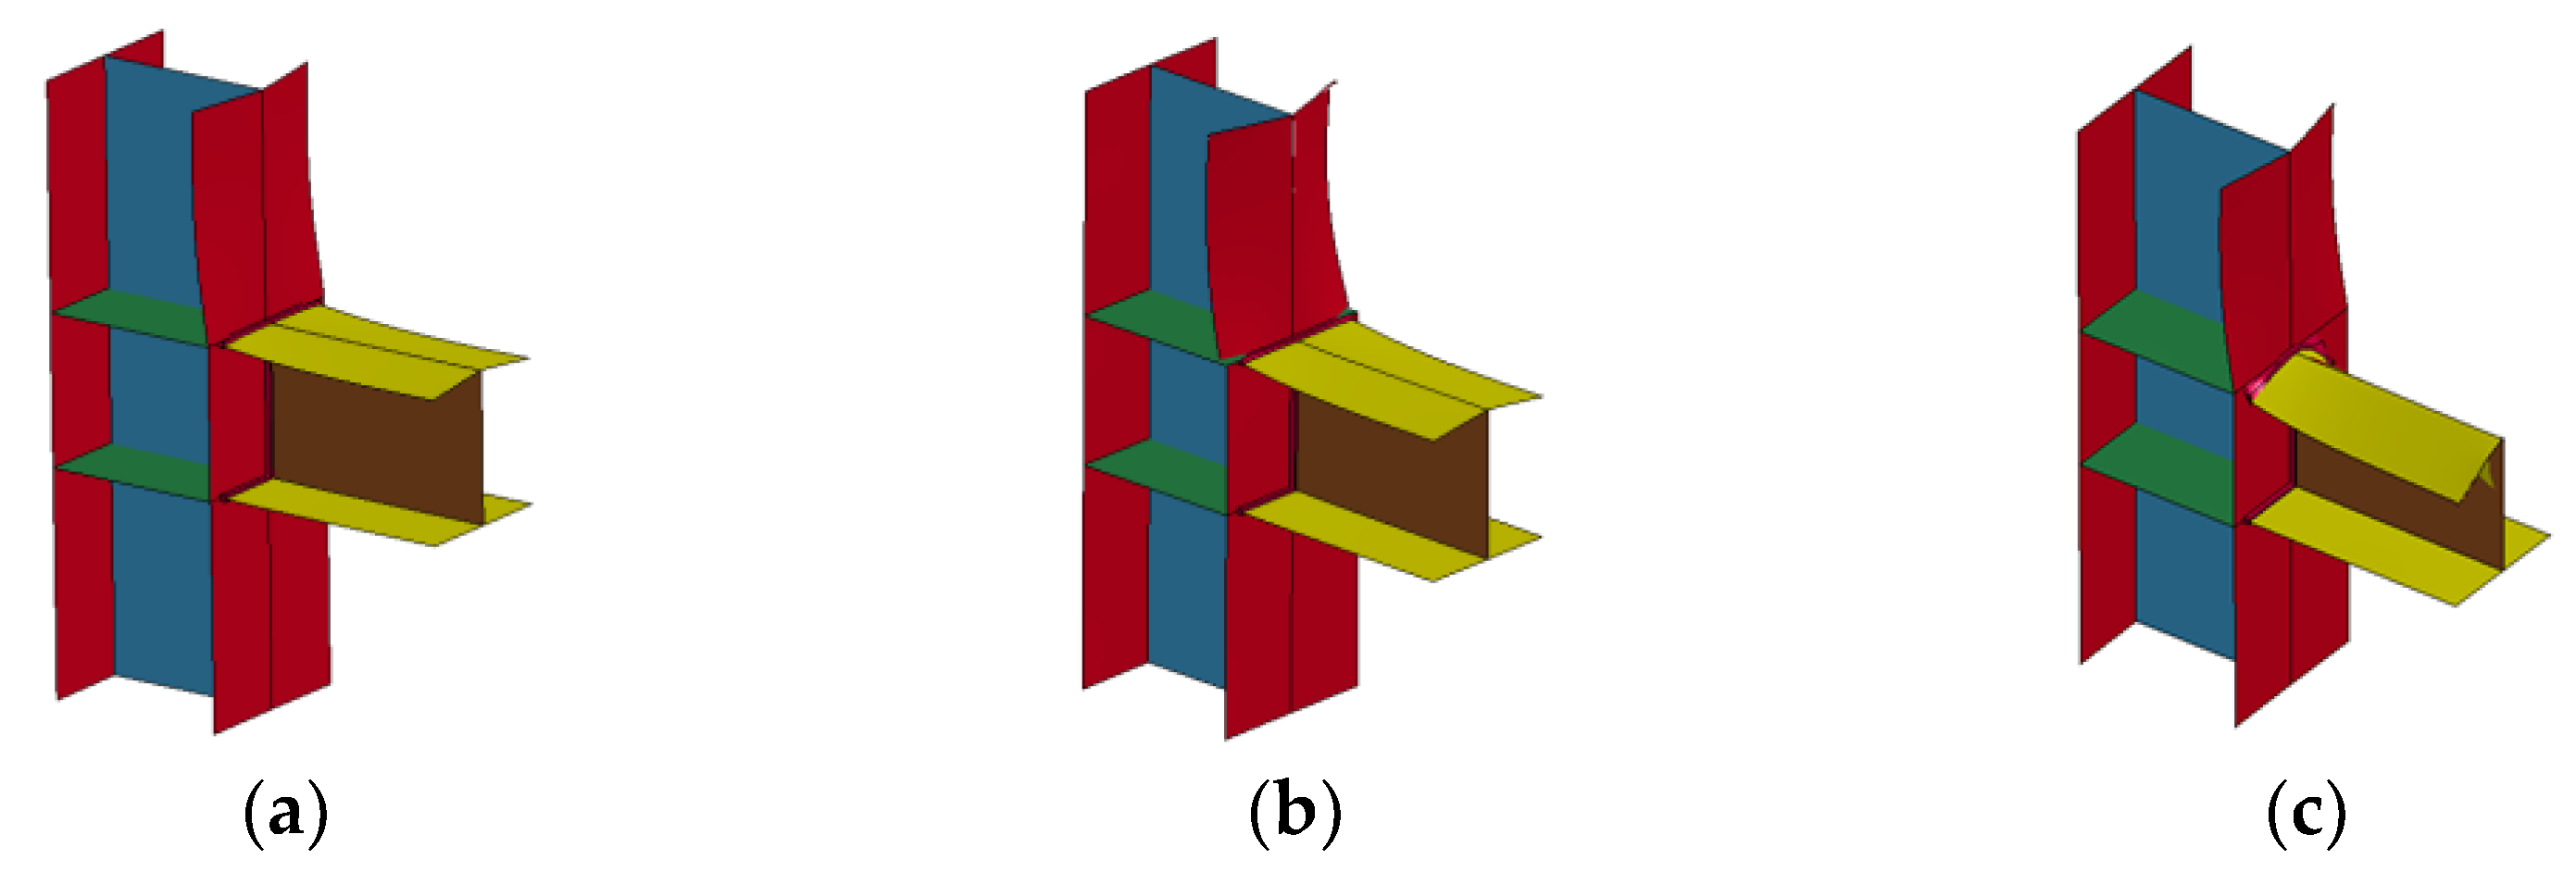
4.1. Failure Mode of Welded Joints
Joints are connected by welding. Section size was kept unchanged, and the peak pressure of the blast load was gradually increased. When it increased to 10 MPa, the joints in the beam and the column were damaged, as shown in Figure 9a, which indicates that the stress at the weld position is the largest and the failure occurs here first, while the column had obvious buckling. Since the section width of the column is larger than that of the beam, and the explosive blast load on the column is also large, the column buckles before the beam. When the section width of the column flange is increased or the thickness of the column flange is reduced, the failure of the joint occurs, as shown in Figure 9b. At this time, because the blast load on the column flange was relatively large, it was insufficient to continue to carry this load. The connection between column flange and weld began to break, the connection between column flange and web also broke, and the weld began to fail. At the same time, the bearing capacity of the column significantly decreased, through which it was easy to cause local damage to the structure due to the failure of the column bearing capacity; in serious cases, it may lead to the continuous collapse of the structure. When the beam flange section width is increased or the beam flange thickness is reduced, the joint is likely to fail, as shown in Figure 9c. At this time, the blast load on the beam flange is relatively large, which is beyond the bearing capacity of the flange, and thus the beam flange and weld are damaged.
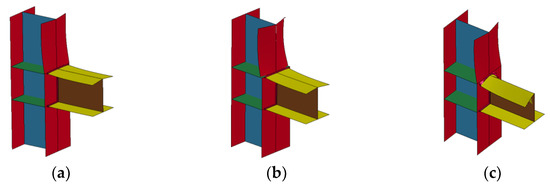
Figure 9.
Failure mode of welded joints, (a) weld failure, (b) column flange failure, (c) beam flange failure.
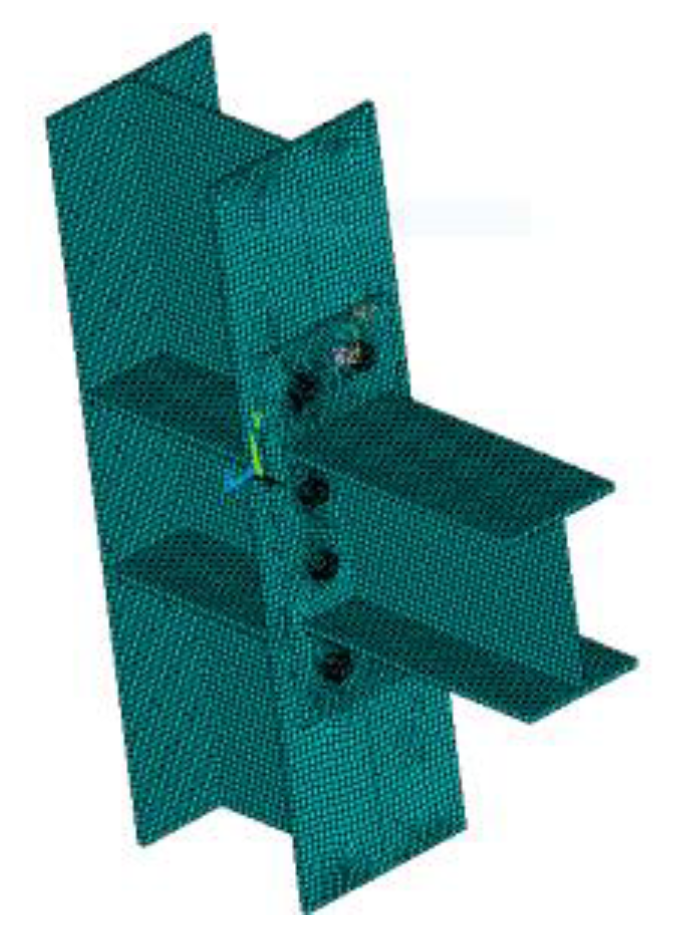
4.2. Failure Mode of Bolted Joints
The section size of beam and column with bolted joints remained unchanged, the thickness of the beam end plate was 10 mm, the bolt was 10.9 grade M20 high-strength, and the finite element model is shown in Figure 10. The blast load was still applied to the flange of the beam and the column. When the peak value of the blast load was 3 MPa and the action time was 20 ms, bolted joints were damaged. As shown in Figure 11, the joint was first pulled and cracked by bolts at the beam end plate, mainly because the beam end plate was too thin. With the continuous displacement increase in beam and column, local buckling failure occured at the lower part of the column.

Figure 10.
Finite element model of bolted connection.
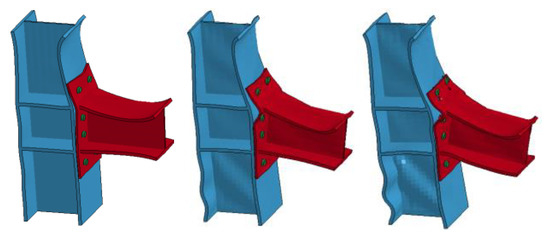
Figure 11.
Failure mode of bolted joints.
4.3. Failure Mode of Bolted and Welded Joints
The section size of the beam and the column with bolted and welded joints remains unchanged, the beam flange and column are welded, the weld leg size is 10 mm; the beam web and column are bolted, and the bolts are 10.9 grade M20 high-strength bolts. The finite element model is shown in Figure 12, and the blast load is applied to the flange of the beam and the column. When the peak value of the blast load is 5 MPa and the action time is 20 ms, the bolted and welded joints are damaged. As shown in Figure 13, under the action of blast load, due to the large joint stiffness at the beam column connection, no obvious deformation and damage are found here, and the web at the beam end is the first to fail, resulting in the continuous decline of the bearing capacity of the beam web. With the continuous displacement development of the beam and the column, the beam web becomes unstable and damaged.
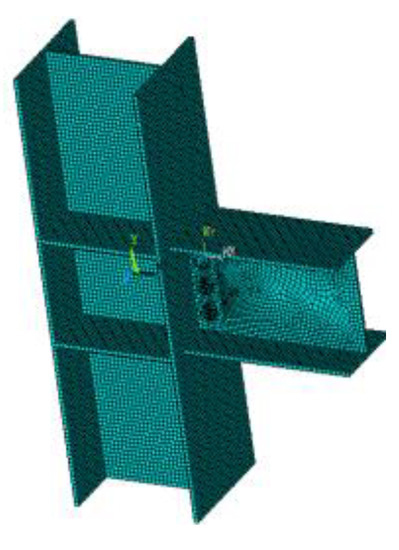
Figure 12.
Finite element model of bolted and welded connection.
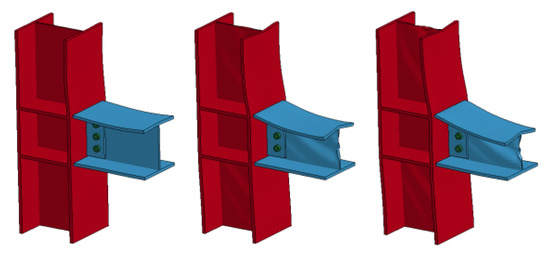
Figure 13.
Failure mode of bolted and welded joints.
5. Analysis of Dynamic Response Parameters of Steel Frame Joints
5.1. Influence of Blast Load
To further study the influence of blast load on the dynamic response of steel frame joints, three different blast loads were applied to steel frame joints by keeping other conditions unchanged, and increasing the peak pressure and the impulse of the blast load. Overpressure Ps of loads 1, 2, and 3 was 2.5, 5, and 7.5 MPa, respectively, and the corresponding impulse I was 30, 40, and 50 MPa·ms. Figure 14 and Figure 15 show the vertical displacement time–history curve of the flange edge at the beam end and the horizontal displacement time–history curve of the flange edge at the column end in the welded joint area, respectively.
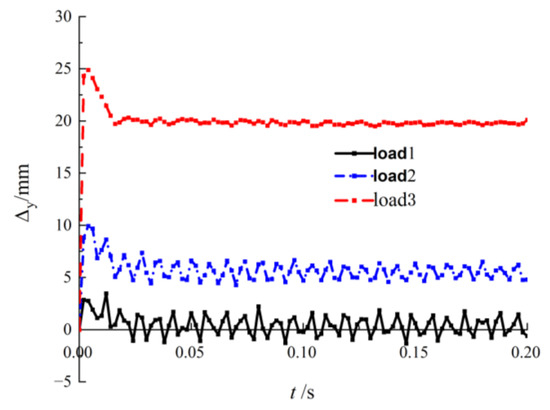
Figure 14.
Vertical displacement time–history curve of the flange edge at the beam end.
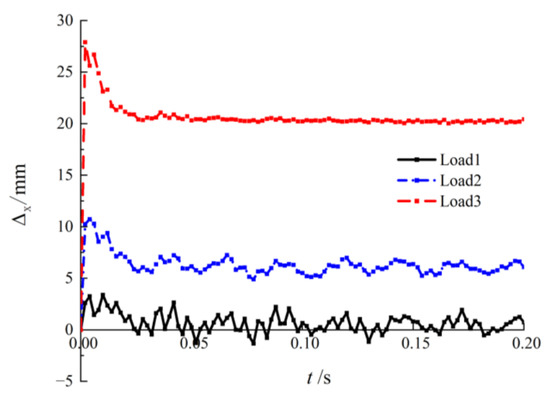
Figure 15.
Horizontal displacement time–history curve of the flange edge at the column end.
Figure 14 and Figure 15 show that, with the increase in blast load, the displacement of the steel frame beam and the column instantly reaches the maximal value. The maximal displacement of the beam and the column almost occurs at the overpressure peak of the blast load. At the end of explosion, some deformation is recovered in the beam and the column, and they vibrate at the equilibrium position under inertia. When the overpressure peak value and impulse of the blast load are small, the displacement of the beam column end reaches the peak value quickly, and then returns to the equilibrium position, and vibrates at the equilibrium position in the elastic stage. With their continuous increase, the peak displacement at the ends of the beam and the column increases. After the displacement recovers from the peak value to the equilibrium position, there is still residual displacement, which is in the elastic–plastic stage. Further increasing the overpressure peak value and impulse of the blast load, the peak displacement at the ends of the beam and the column quickly reaches the maximal value. After that, this value is close to the residual displacement, and the vibration is weakened, which is in the stage of plastic failure.
Keeping the impulse of the blast load unchanged and changing its peak value, the influence of the blast loading rate can be reflected. Four different load conditions are applied to the steel frame load, and the load conditions with different loading rates and analysis results are tabulated in Table 2.
Table 2.
Load conditions and analysis results at different loading rates.
Table 2 shows that, although the impulse of the blast load remains unchanged, with the increase of blast peak value and loading rate, the maximal stress and maximal displacement of the joints also increase exponentially. Under the working condition of 4, the joints had been damaged. Therefore, high-speed impact load had a great destructive effect on the structure.
5.2. Influence of Beam and Column Section Size
The section size of beam and column greatly influences their bearing capacity, thus it is necessary to study its dynamic response to steel frame joints under blast load. The finite element model is established by selecting different section sizes of beams and columns and keeping other conditions unchanged. Table 3 and Table 4 show the analytical results of changing the section width and thickness of beams and columns respectively.
Table 3.
Analytical results of section width and height of beam and column.
Table 4.
Analytical results of section thickness of beam and column.
Table 3 and Table 4 show that increasing the web height of the beam and the column could reduce the maximal horizontal displacement and maximal vertical displacement in the joint area, but the reduction effect is insignificant, and the maximal displacement reduction was only 14%. However, with the increase in the flange width of beam and column, the maximal displacement in the joint area decreased in one direction, but increased more than double in the other direction. This is because increasing this width also increased the action area of the blast load, so that the corresponding load on the joint was greater. Increasing the web thickness of the beam and the column, the maximal horizontal displacement and maximal vertical displacement in the joint area were both reduced, but the reduction effect was not very obvious, with maximal displacement reduction of 8%. Increasing the flange thickness of the beam and the column could reduce the maximal horizontal displacement and maximal vertical displacement in the joint area; increasing the thickness of the column flange had an obvious effect on reducing the maximal horizontal displacement in the joint area, with a reduction of 45%, while increasing the thickness of the beam flange had an obvious effect on reducing the maximal vertical displacement in the joint area, with a reduction of 40%. Therefore, results show that increasing the flange section width of the beam and the column could not improve the antiexplosion performance of the joints, and increasing the web height and web thickness of the beam and the column can reduce the displacement, but the effect is not very obvious; while increasing the flange thickness of the beam and the column can significantly improve the antiexplosion performance of the joints.
5.3. Influence of Steel Frame Joint Position
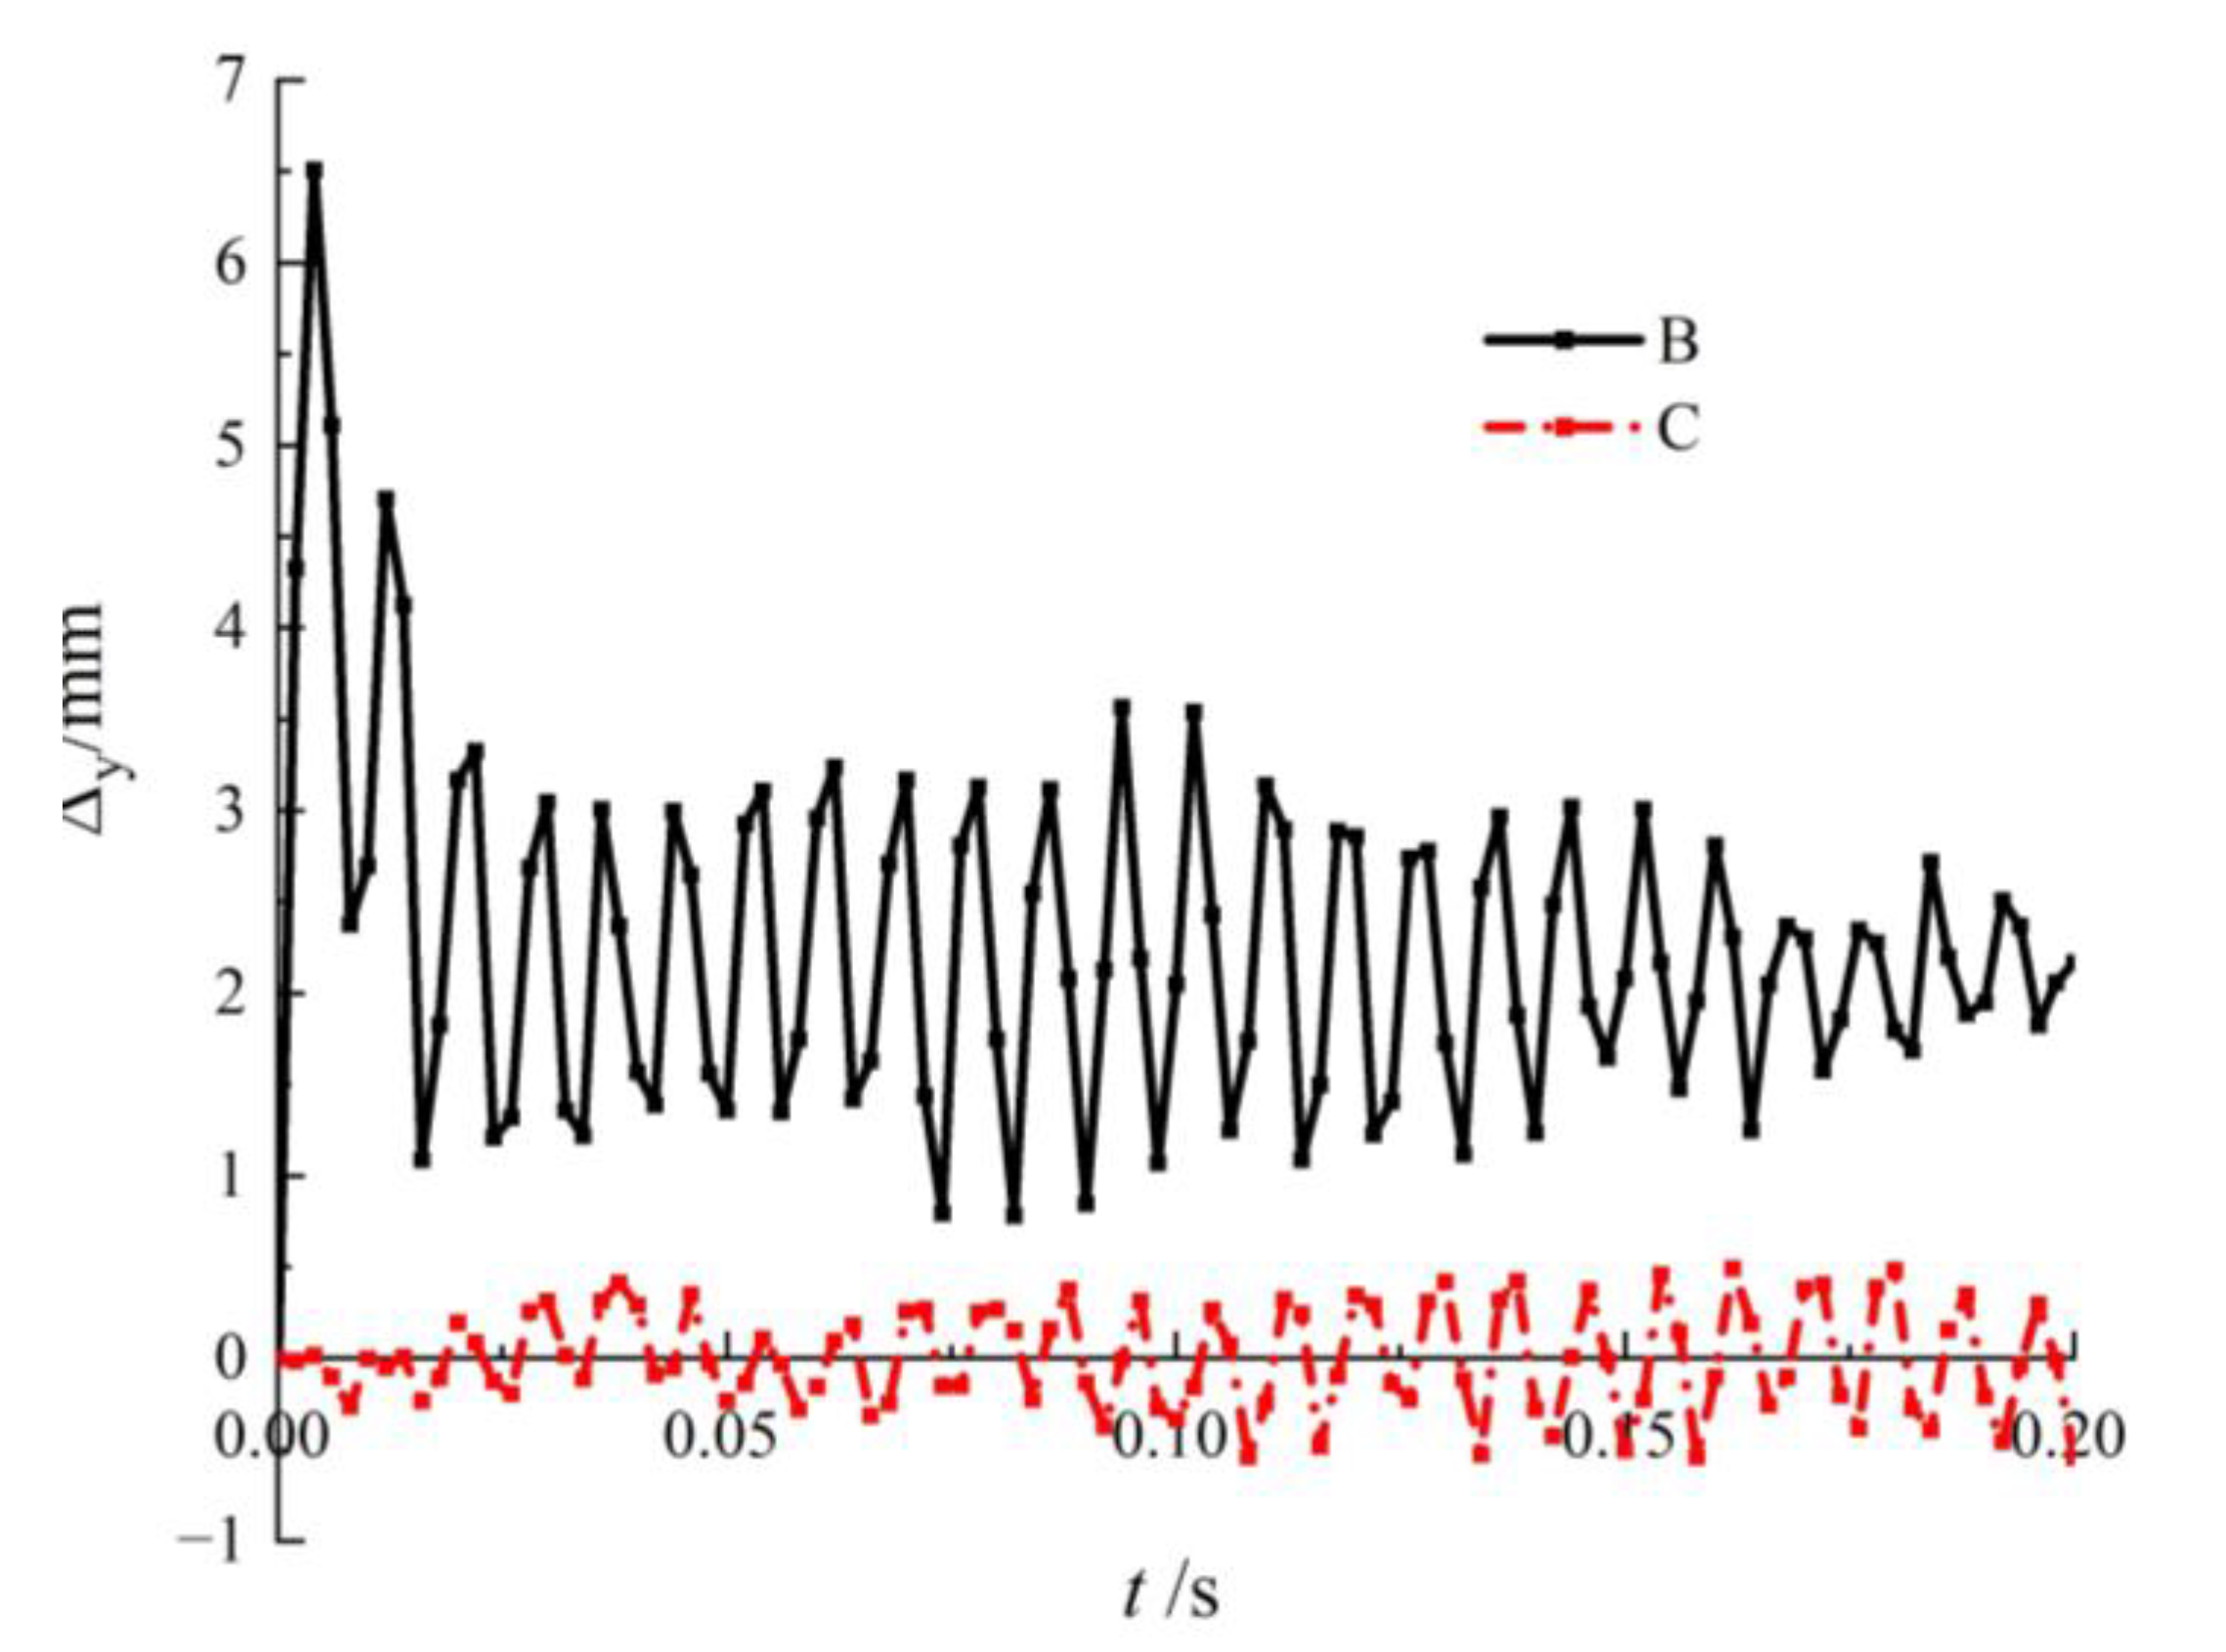
When an explosion occurs in a frame structure, the edge and middle joints are both affected by the blast load. Therefore, it is necessary to study the influence of different joint positions. Keeping the section size of the beam and the column unchanged, the finite element model of the middle joint is established, as shown in Figure 16. Applying the same blast load at the same joint position, point B at the end edge of the right flange and point C at the end edge of the left flange are taken for comparison and analysis, and its displacement time–history curve is shown in Figure 17.

Figure 16.
Finite element model of the middle joint (unit: mm).

Figure 17.
Displacement time–history curve of middle joint.
Figure 17 shows that the displacement of point B directly affected by the blast load is larger than that of point C, which was indirectly affected. The displacement of point B gradually decreased with time, while that of point C gradually increased with time, which shows the weak transmission of the blast load. The maximal vertical displacement of the joint area was only 6.5 mm, which was much smaller than the maximal vertical displacement of the edge joint (10.7 mm). This is mainly because the middle joint had more constraints, and was thus more conducive to load transmission.
5.4. Influence of Steel Frame Joint Type
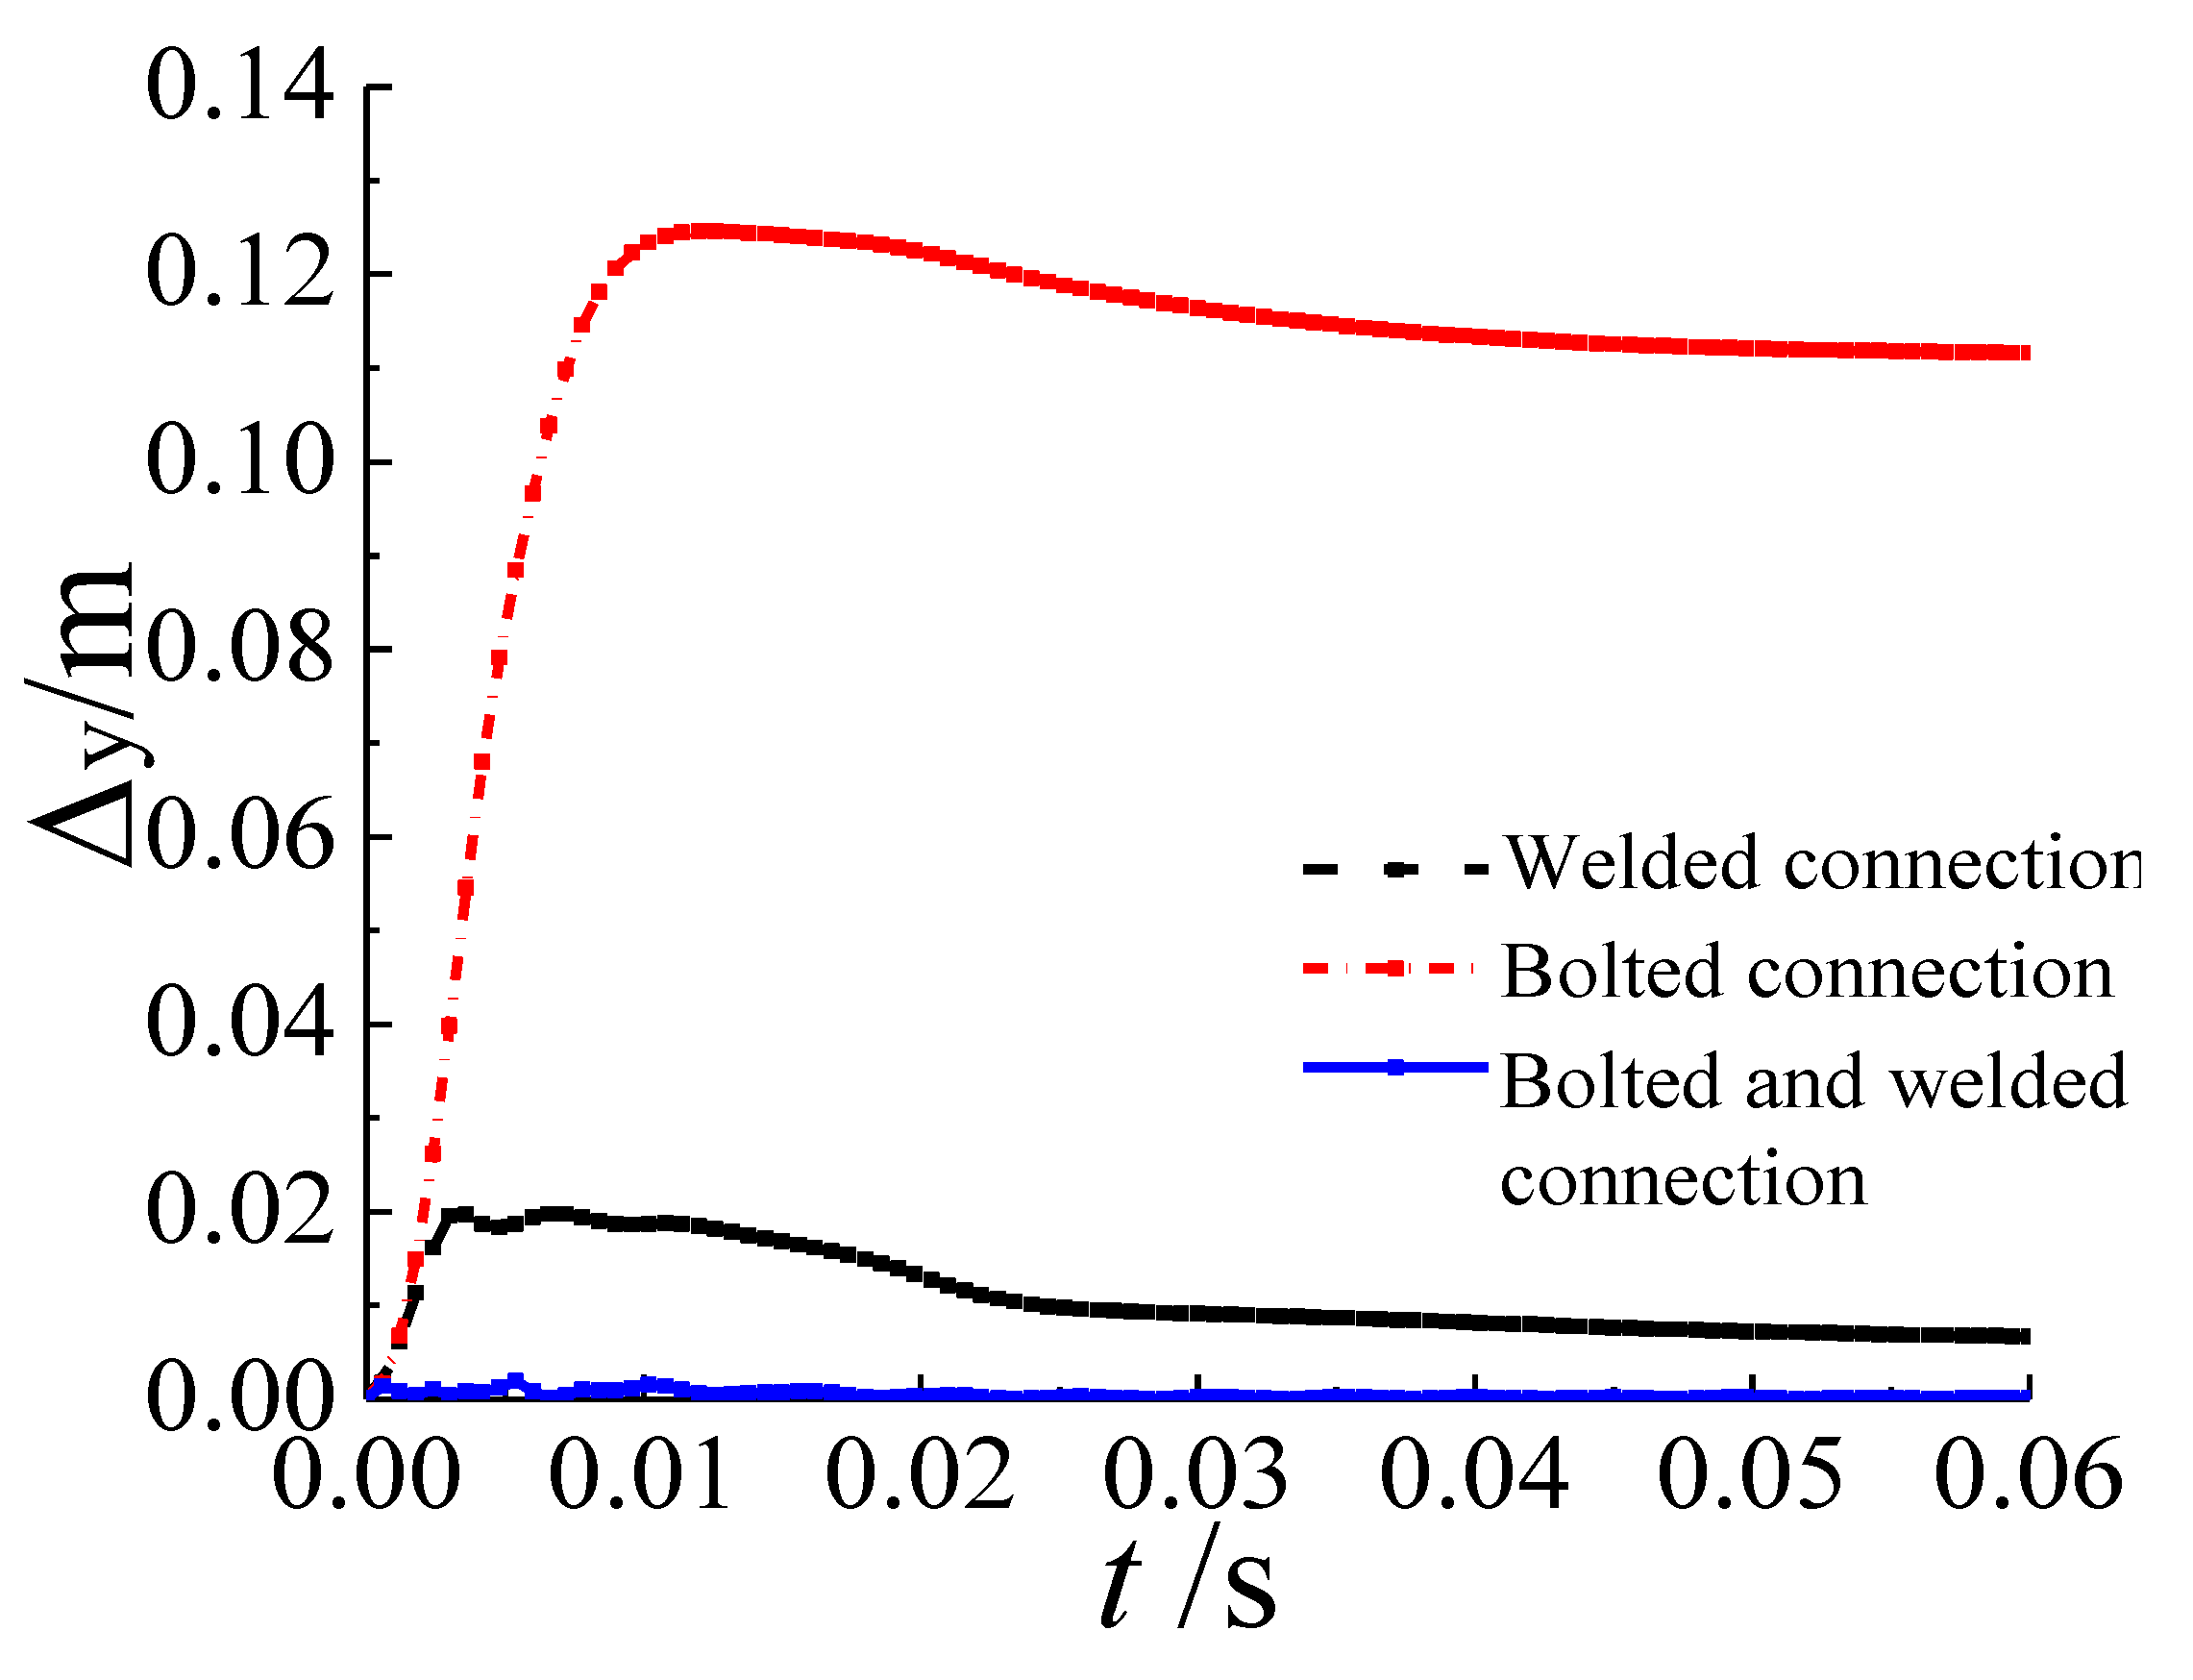
To compare the antiexplosive performance of three types of joints (welded, bolted, and bolted and welded connection), the finite element model of bolted and bolted–welded hybrid connections was established while keeping the section size of the beam and the column unchanged. In the model, bolts were 10.9 grade M20 high-strength, and the diameter and thickness of the bolt head were 31.4 and 12.5 mm, respectively. The peak pressure of the applied blast load was 1 MPa, and the action time was 20 ms. Through finite element analysis and calculation, Figure 18 gives the vertical displacement time-history curves of the flange at the beam end with three different connection modes.
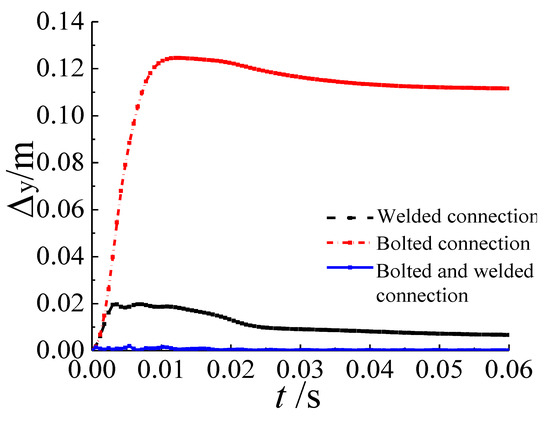
Figure 18.
Vertical displacement time–history curve of the flange at beam end with three different connection modes.
6. Conclusions
In this paper, the finite element model of steel frame joints was established using finite element analysis software ANSYS/LS-DYNA. The ideal triangular impact load was used to numerically analyze the dynamic response of steel frame welded joints under blast loading, the main factors affecting this response, and the failure modes of three types of joints, so as to provide reference for the antiexplosion design of steel frame joints. The following conclusions could be obtained:
- When the blast load acts on the steel frame joints of the beam and the column, these joints produce violent vibrations in the explosive load direction, the material strength increases due to the strain rate effect, and the steel enters the plastic strengthening stage. The joint displacement in the explosive load direction almost reaches the maximum at the time of peak pressure. At the end of the explosive blast, part of the structure recovers from deformation. The joints vibrate at the equilibrium position due to inertia, and the amplitude gradually attenuates and finally reaches equilibrium at a certain position.
- With the increase in the overpressure peak value of the blast load, the displacement and residual displacement of the joints in the explosive blast direction both increase. Keeping the impulse of the blast load unchanged and adjusting the overpressure peak value, the loading rate of the blast load greatly influenced the joints. The greater the loading rate is, the easier it is for joints to be damaged.
- Since the blast load acts on the flange of the beam and the column, increasing their width cannot improve the antiexplosion performance of the joints. At this time, shear failure of the flange is prone to occur in the joint, while increasing their thickness can improve the antiexplosion performance.
- Bolted and welded joints have the highest stiffness and best antiexplosion performance, followed by welded joints, while the antiexplosion performance of bolted joints is the worst.
The numerical results obtained by means of the proposed model were compared to those obtained by employing a recently developed class of uniaxial symmetric rate-independent models [25] and a novel family of multiple springs models [26], revealing that the finite element model of steel frame joints not only provides results that are very close to those predicted by using the uniaxial symmetric rate-independent models and a novel family of multiple springs models, but it also allows for the reduction of the computational times. The above research models and data are simple and effective, which can provide reference for related research.
Author Contributions
Conceptualization, S.K.; software, X.Z.; writing—original draft preparation, W.L.; data curation, C.S. All authors have read and agreed to the published version of the manuscript.
Funding
This research received no external funding.
Institutional Review Board Statement
Not applicable.
Informed Consent Statement
Not applicable.
Data Availability Statement
Not applicable.
Acknowledgments
This research was financially supported by the National Natural Science Foundation of China (51878130).
Conflicts of Interest
The authors declare no conflict of interest.
References
- Sabuwala, T.; Linzell, D.; Krauthzmmer, T. Finite element analysis of steel beam to column connections subjected to blast loads. Int. J. Impact Eng. 2005, 31, 861–876. [Google Scholar] [CrossRef]
- Urgessa, G.S.; Arciszewski, T. Blast response comparison of multiple steel frame connections. Finite Elem. Anal. Des. 2011, 47, 668–675. [Google Scholar] [CrossRef]
- Daryan, A.S.; Ziaei, M.; Sadrnejad, S.A. The behavior of top and seat bolted angle connections under blast loading. J. Constr. Steel Res. 2011, 67, 1463–1474. [Google Scholar] [CrossRef]
- Wu, Y.Y. Analysis on Dynamic Response of Beam-to-Column Connections of Steel Frames under Blast Load. Master’s Thesis, Shanghai Jiao Tong University, Shanghai, China, 2014. Available online: https://kns.cnki.net/KCMS/detail/detail.aspx?dbname=CMFD201501&filename=1015027505.nh (accessed on 20 November 2021).
- Jike, T. Study on the behavior of steel frame joints under blast loading. J. Jianghan Univ. 2013, 41, 69–73. [Google Scholar]
- Qu, Y.D.; Zhang, D.D.; Li, Z.P.; Qin, Y.S. Influence of different connection modes on anti explosion performance of steel beam steel column joints. J. Eng. Blasting 2019, 25, 1–6. [Google Scholar]
- Wei, D.W.; Kai, L.I.; Sun, C.C. Structural strength analysis of box hull joints under blasting load in cabin. J. Ship Sci. Technol. 2019, 41, 11–14. Available online: https://kns.cnki.net/kcms/detail/detail.aspx?FileName=JCKX201921004&DbName=CJFQ2019 (accessed on 20 November 2021).
- Zhang, N.; Liu, J.; Li, K.; Li, D. Structural strength analysis of box girder hull joint under explosion load inside cabin. Chin. J. Ship Res. 2018, 13, 39–45. Available online: http://zgjcyj.xml-journal.net/en/article/id/1808 (accessed on 20 November 2021).
- Yang, M.Q. Finite Element Analysis of Beam Column Joint Performance of Steel Frame under Indoor Explosion Load; Xi’an University of Architecture and Technology: Xi’an, China, 2020. [Google Scholar] [CrossRef]
- Zhang, X.H.; Zhang, C.; Duan, Z.D. Numerical simulation on impact responses and failure modes of steel frame structural columns subject to blast loads. J. Shenyang Jianzhu Univ. 2009, 25, 656–662. Available online: https://kns.cnki.net/kcms/detail/detail.aspx?FileName=SYJZ200904009&DbName=CJFQ2009 (accessed on 20 November 2021).
- Zhang, X.H.; Zhang, Y.; Duan, Z.D.; Li, Y.S. Dynamic Response and Influence Factor Analysis of Steel Columns under Blast Load ing. J. Disaster Prev. Mitig. Eng. 2014, 34, 73–77+84. [Google Scholar] [CrossRef]
- Zhang, X.H.; Lv, C.X.; Li, Y.S. Analysis of dynamic response and failure modes of welded I- shaped steel beams subject to blast loadings. J. Shenyang Jianzhu Univ. 2014, 30, 408–413. Available online: https://kns.cnki.net/kcms/detail/detail.aspx?FileName=SYJZ201403005&DbName=CJFQ2014 (accessed on 20 November 2021).
- Zhang, X.H.; Gao, S.; Wu, J. Numerical analysis for dynamic responses and influencing factors of profiledsteel concrete compositeslab under near explosion. J. Civ. Environ. Eng. 2016, 38, 50–58. [Google Scholar]
- Zhang, X.H.; Duan, Z.D.; Li, Y.S. Tests and numerical simulation for gas blast shock loading. J. Vib. Shock 2015, 34, 142–146. [Google Scholar] [CrossRef]
- Henrich, J. Explosion Dynamics and Its Applications; Science Press: Beijing, China, 1987. [Google Scholar]
- McGrath, A.; Doudak, G. Investigating the response of bolted timber connections subjected to blast loads. Eng. Struct. 2021, 236, 112112. [Google Scholar] [CrossRef]
- Krauthammer, T. Blast-resistant structural concrete and steel connections. Int. J. Impact Eng. 1999, 22, 887–910. [Google Scholar] [CrossRef]
- Rajeev, A.; Parsi, S.S.; Raman, S.N.; Ngo, T.; Shelke, A. Experimental and numerical investigation of an exterior reinforced concrete beam-column joint subjected to shock loading. Int. J. Impact Eng. 2020, 137, 103473. [Google Scholar] [CrossRef]
- Chen, S.L.; Xu, Q.J.; Long, Y.; Jiang, N. Numerical analysis of building dynamic response under explosion load. Blasting 2015, 32, 74–78. [Google Scholar]
- Ding, Y.; Wang, M.; Li, Z. Numerical analysis on damage and collapse process of steel frame structures under blast loads. J. Build. Struct. 2012, 33, 78–84. [Google Scholar]
- Zhang, X.; Li, W. The dynamic response analysis of steel frame joints subjected to blast loads. Shanxi Archit. 2016, 42, 19–21. [Google Scholar]
- Song, X. Parameterized fragility analysis of steel frame structure subjected to blast loads using bayesian logistic regression method. Struct. Saf. 2020, 87, 102000. [Google Scholar] [CrossRef]
- Flodr, J.; Krejsa, M.; Lehner, P. Temperature and strutural analysis of omega clip. Int. J. Steel Struct. 2019, 19, 1295–1301. [Google Scholar] [CrossRef]
- Zhang, X.H. Experimental Study and Numerical Simulation of Explosion Resistance of Steel Frame under Gas Explosion Impact. Doctoral Thesis, Harbin Institute of Technology, Harbin, China, 2011. [Google Scholar] [CrossRef]
- Vaiana, N.; Sessa, S.; Rosati, L. A generalized class of uniaxial rate-independent models for simulating asymmetric mechanical hysteresis phenomena. Mech. Syst. Signal Processing 2021, 146, 106984. [Google Scholar] [CrossRef]
- Vaiana, N.; Losanno, D.; Ravichandran, N. A novel family of multiple springs models suitable for biaxial rate-independent hysteretic behavior. Comput. Struct. 2021, 244, 106403. [Google Scholar] [CrossRef]


Publisher’s Note: MDPI stays neutral with regard to jurisdictional claims in published maps and institutional affiliations. |
© 2022 by the authors. Licensee MDPI, Basel, Switzerland. This article is an open access article distributed under the terms and conditions of the Creative Commons Attribution (CC BY) license (https://creativecommons.org/licenses/by/4.0/).