
Failure Analysis of Transmission Tower in Full-Scale Tests


Abstract
:1. Introduction
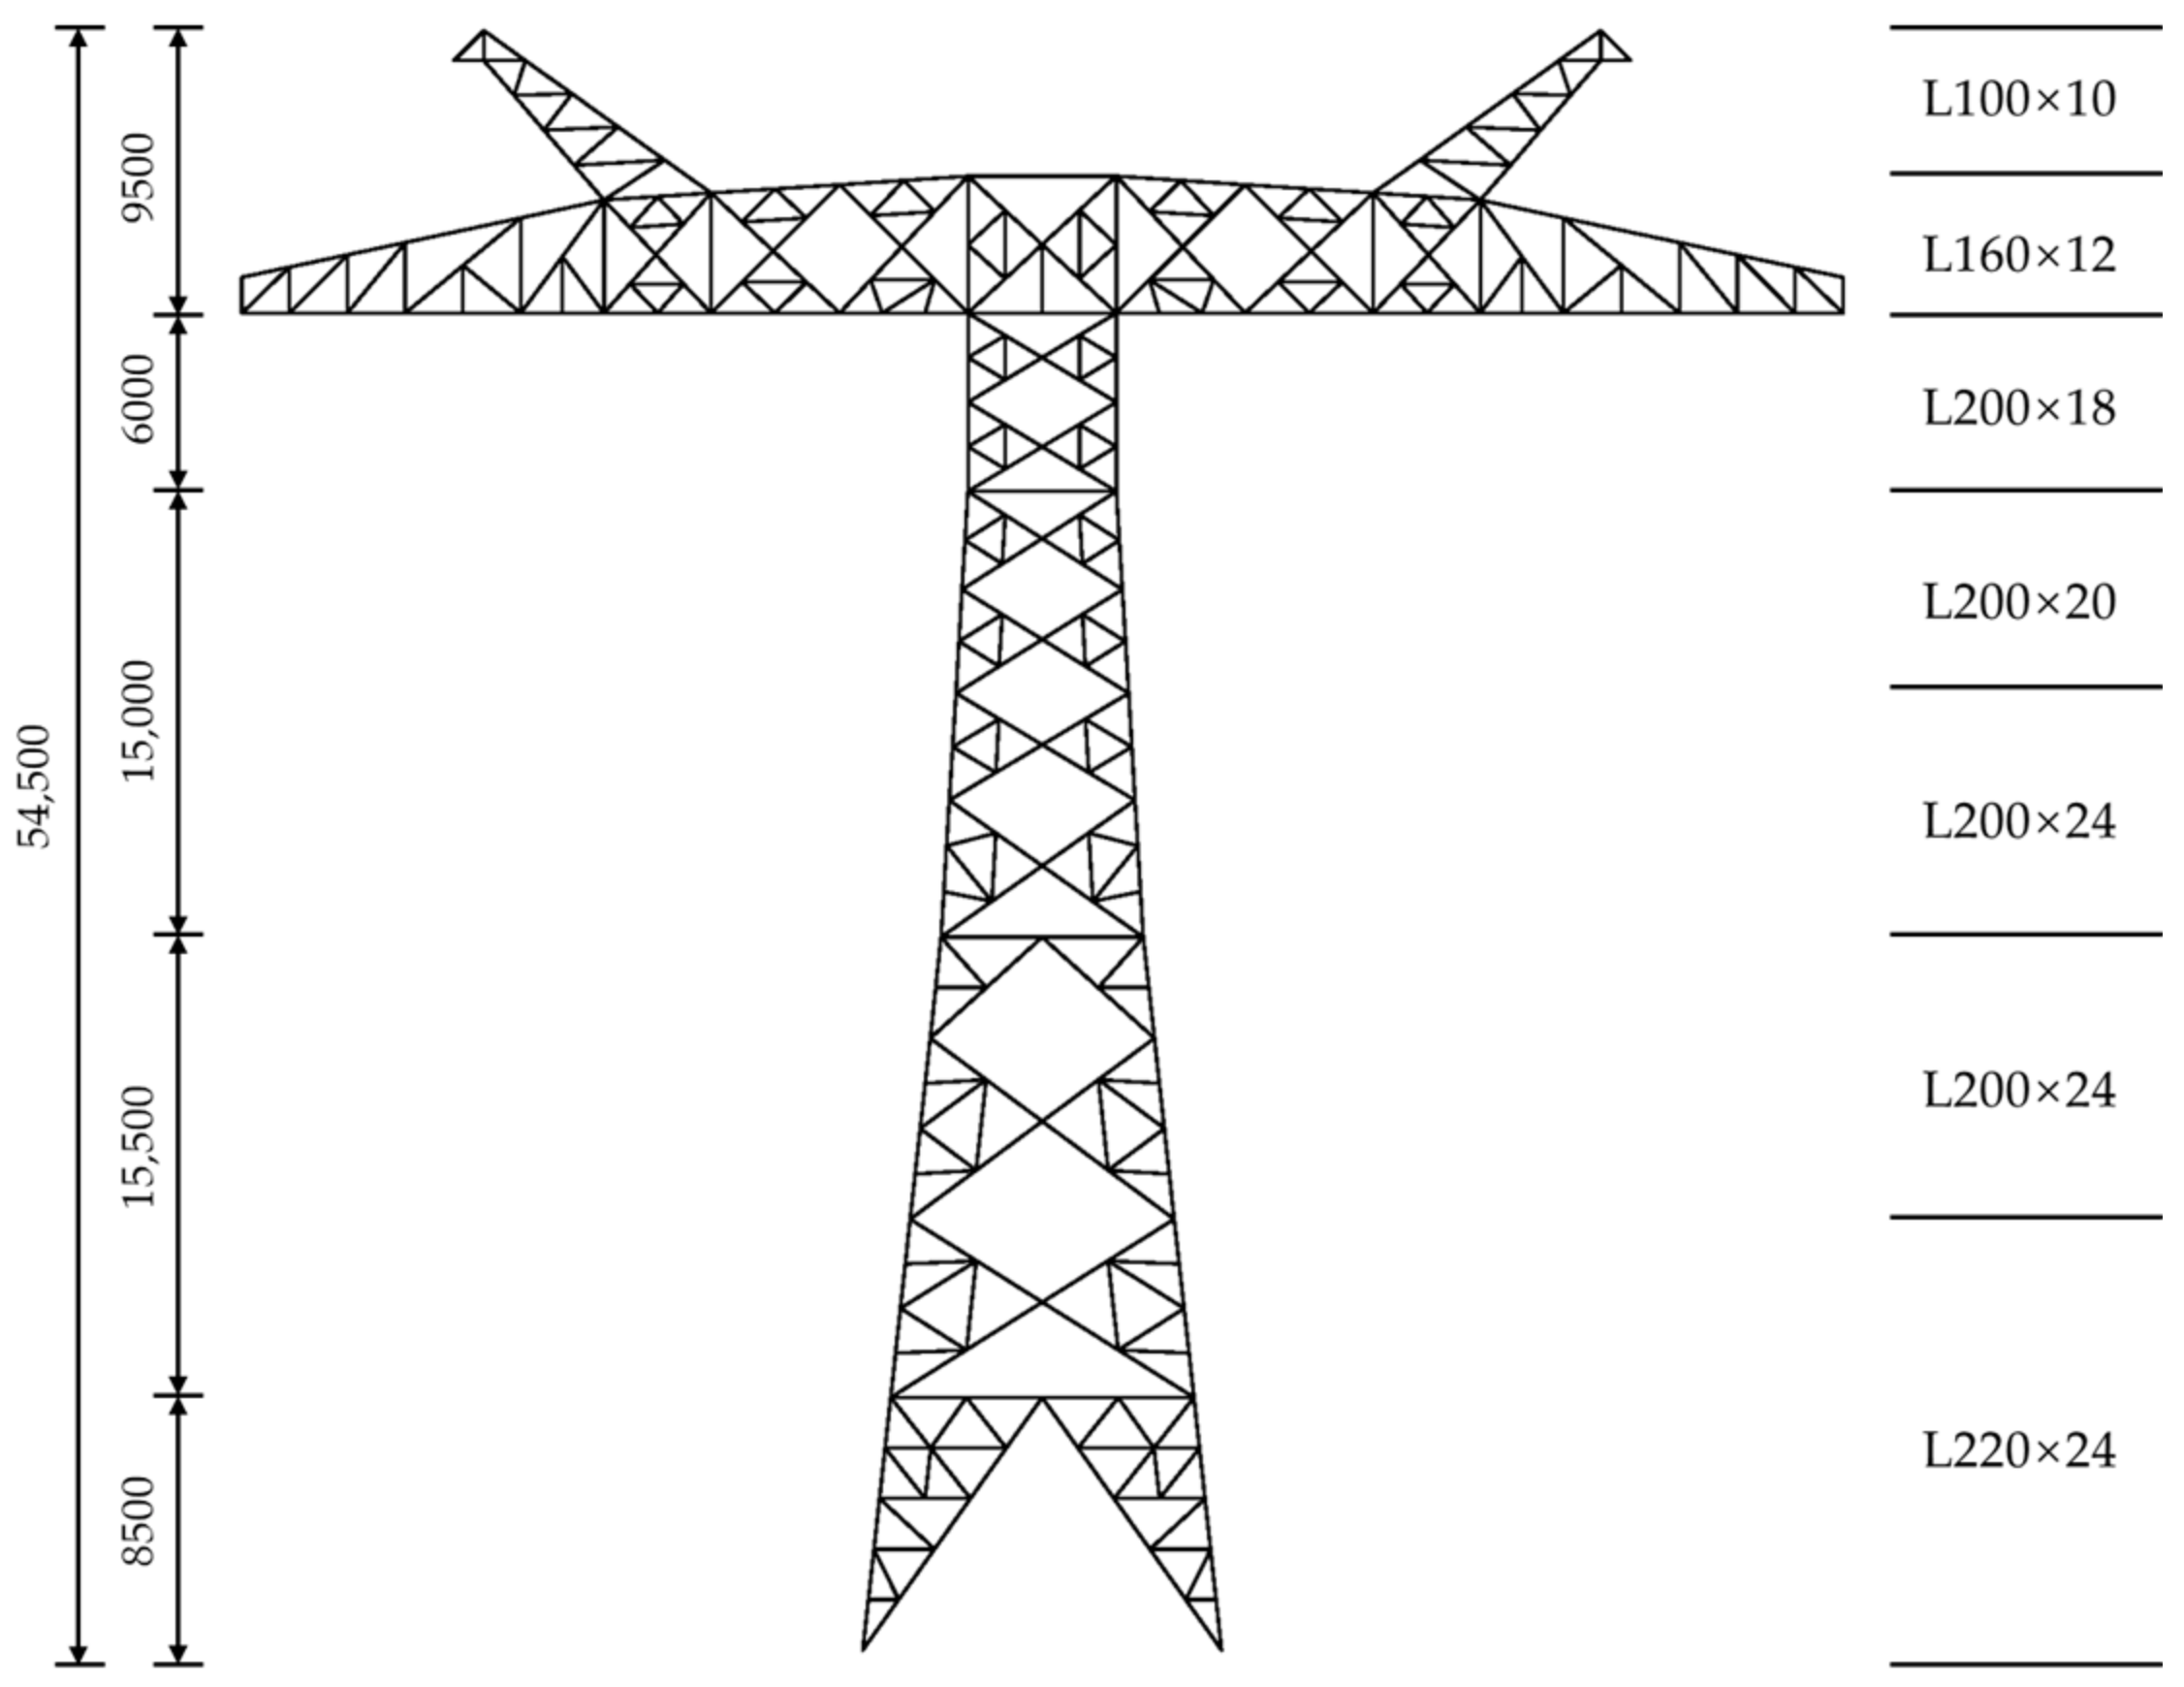
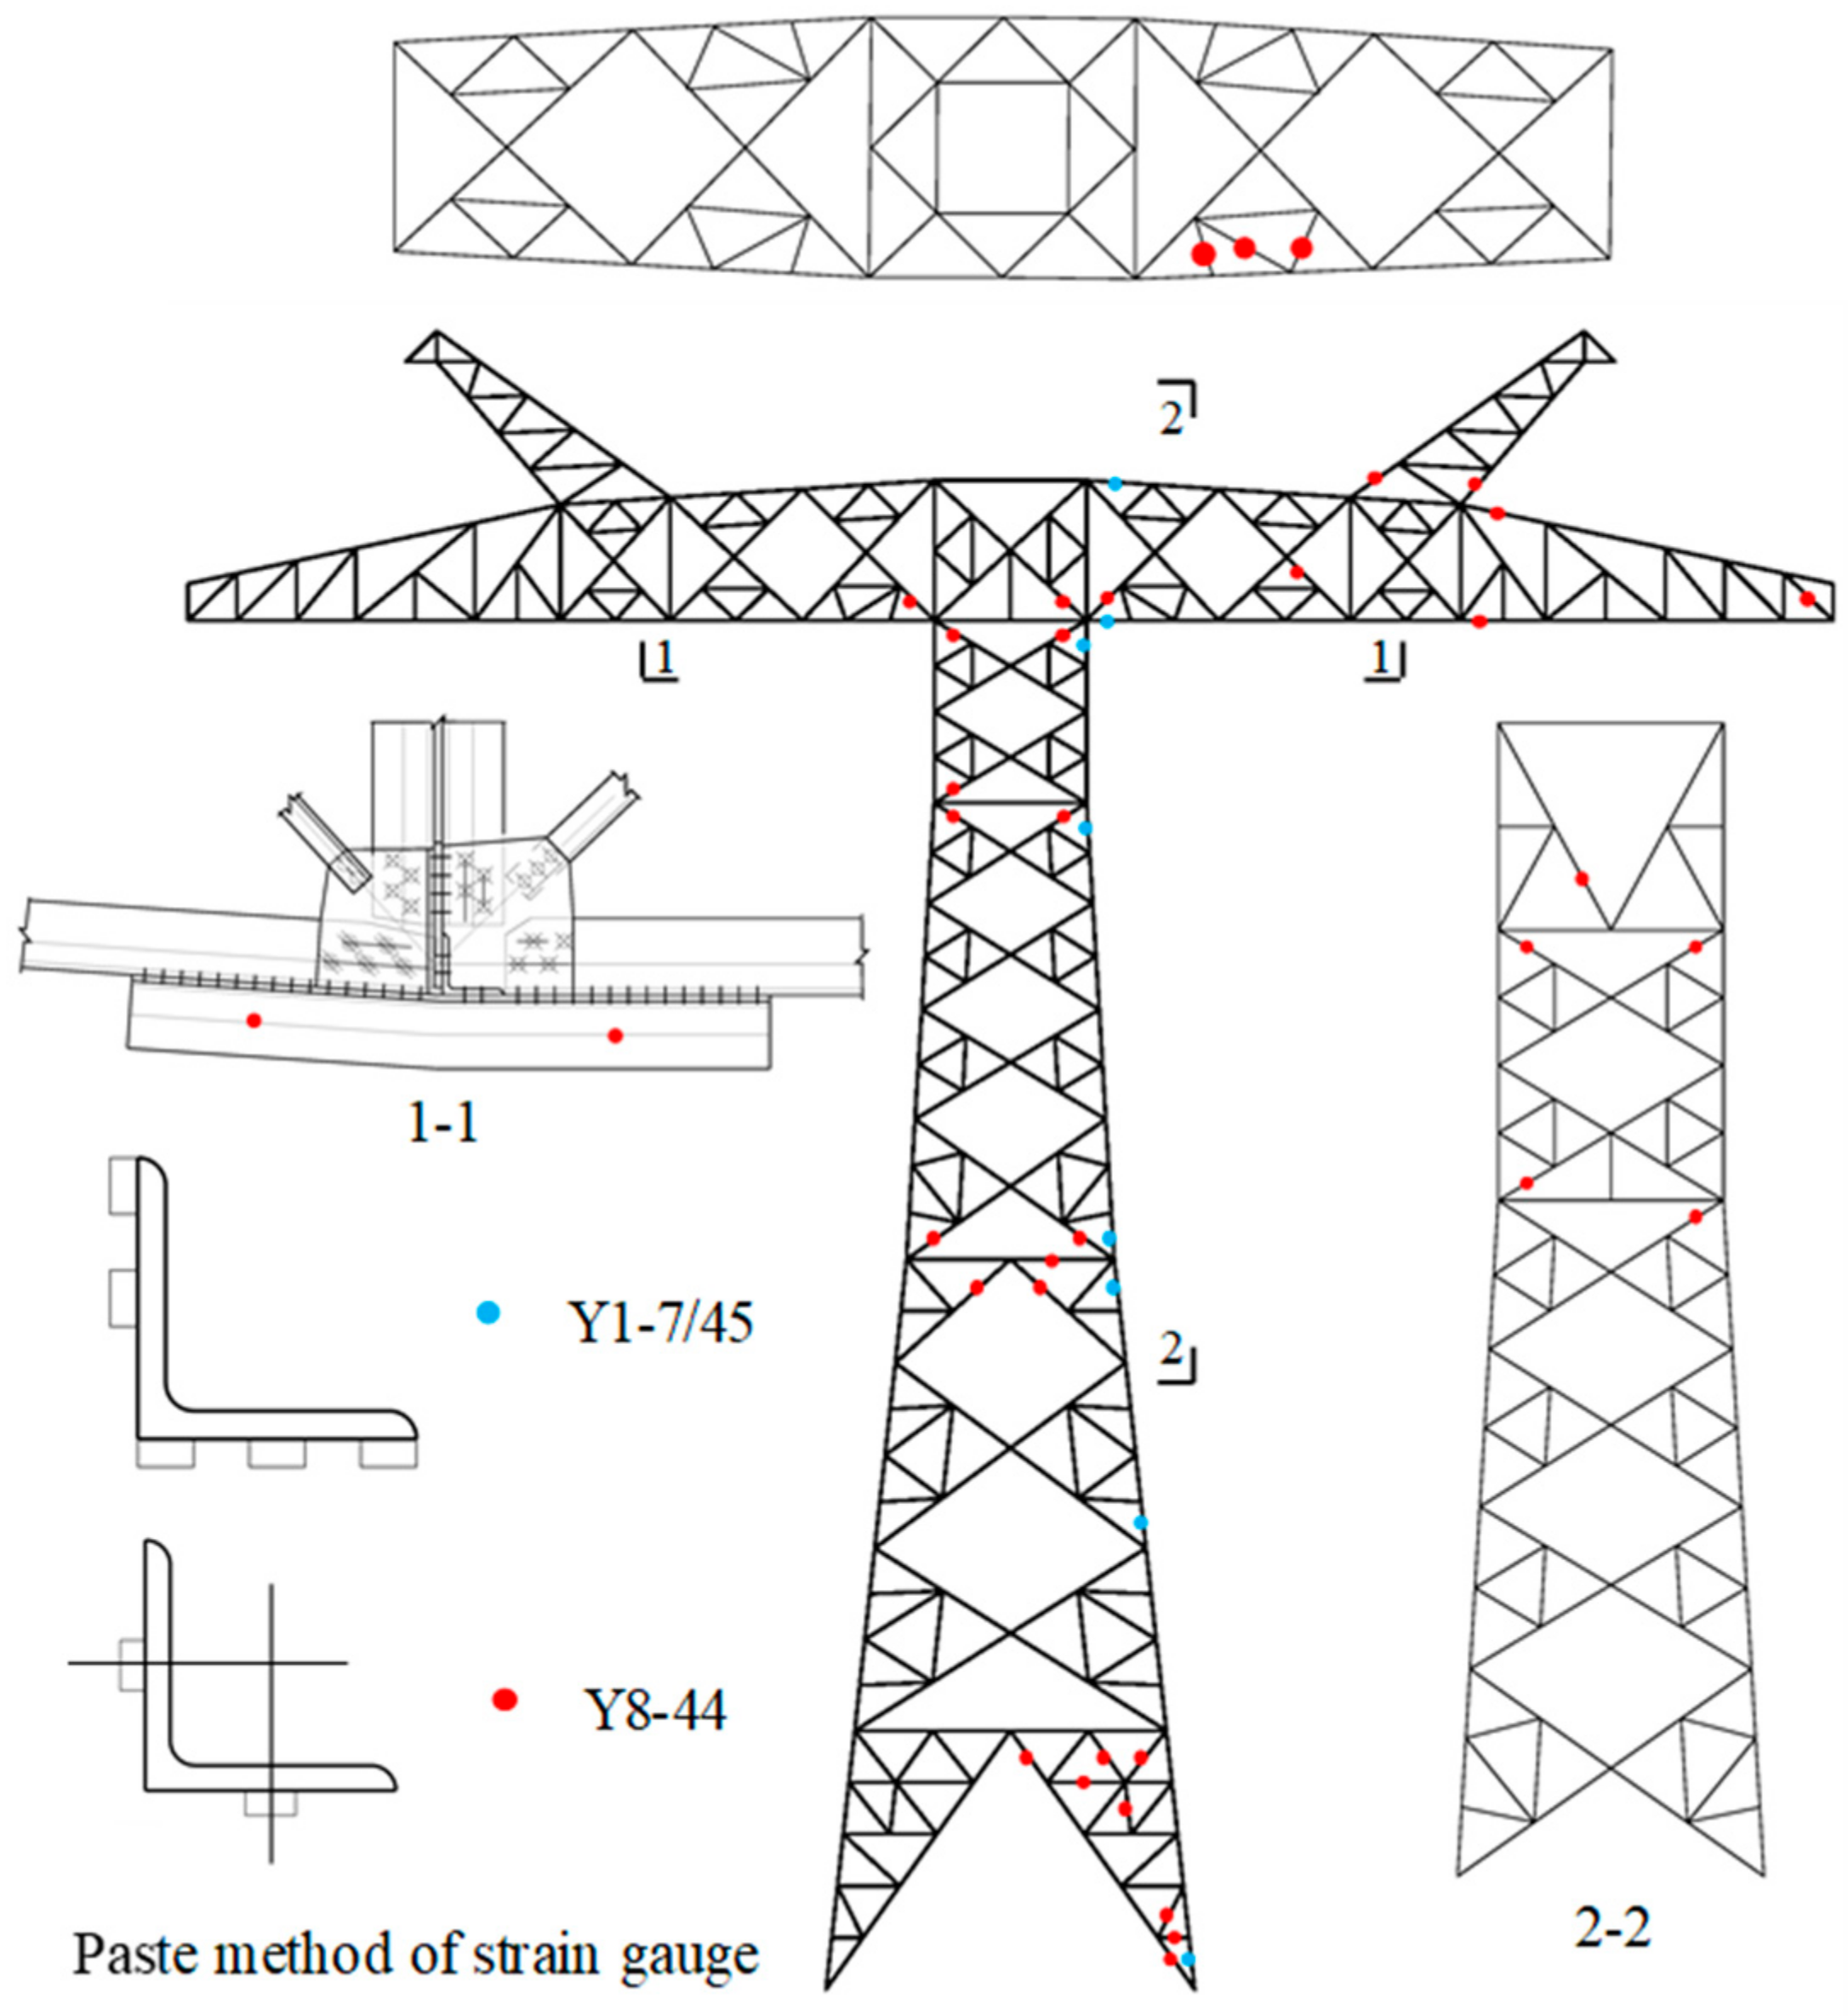
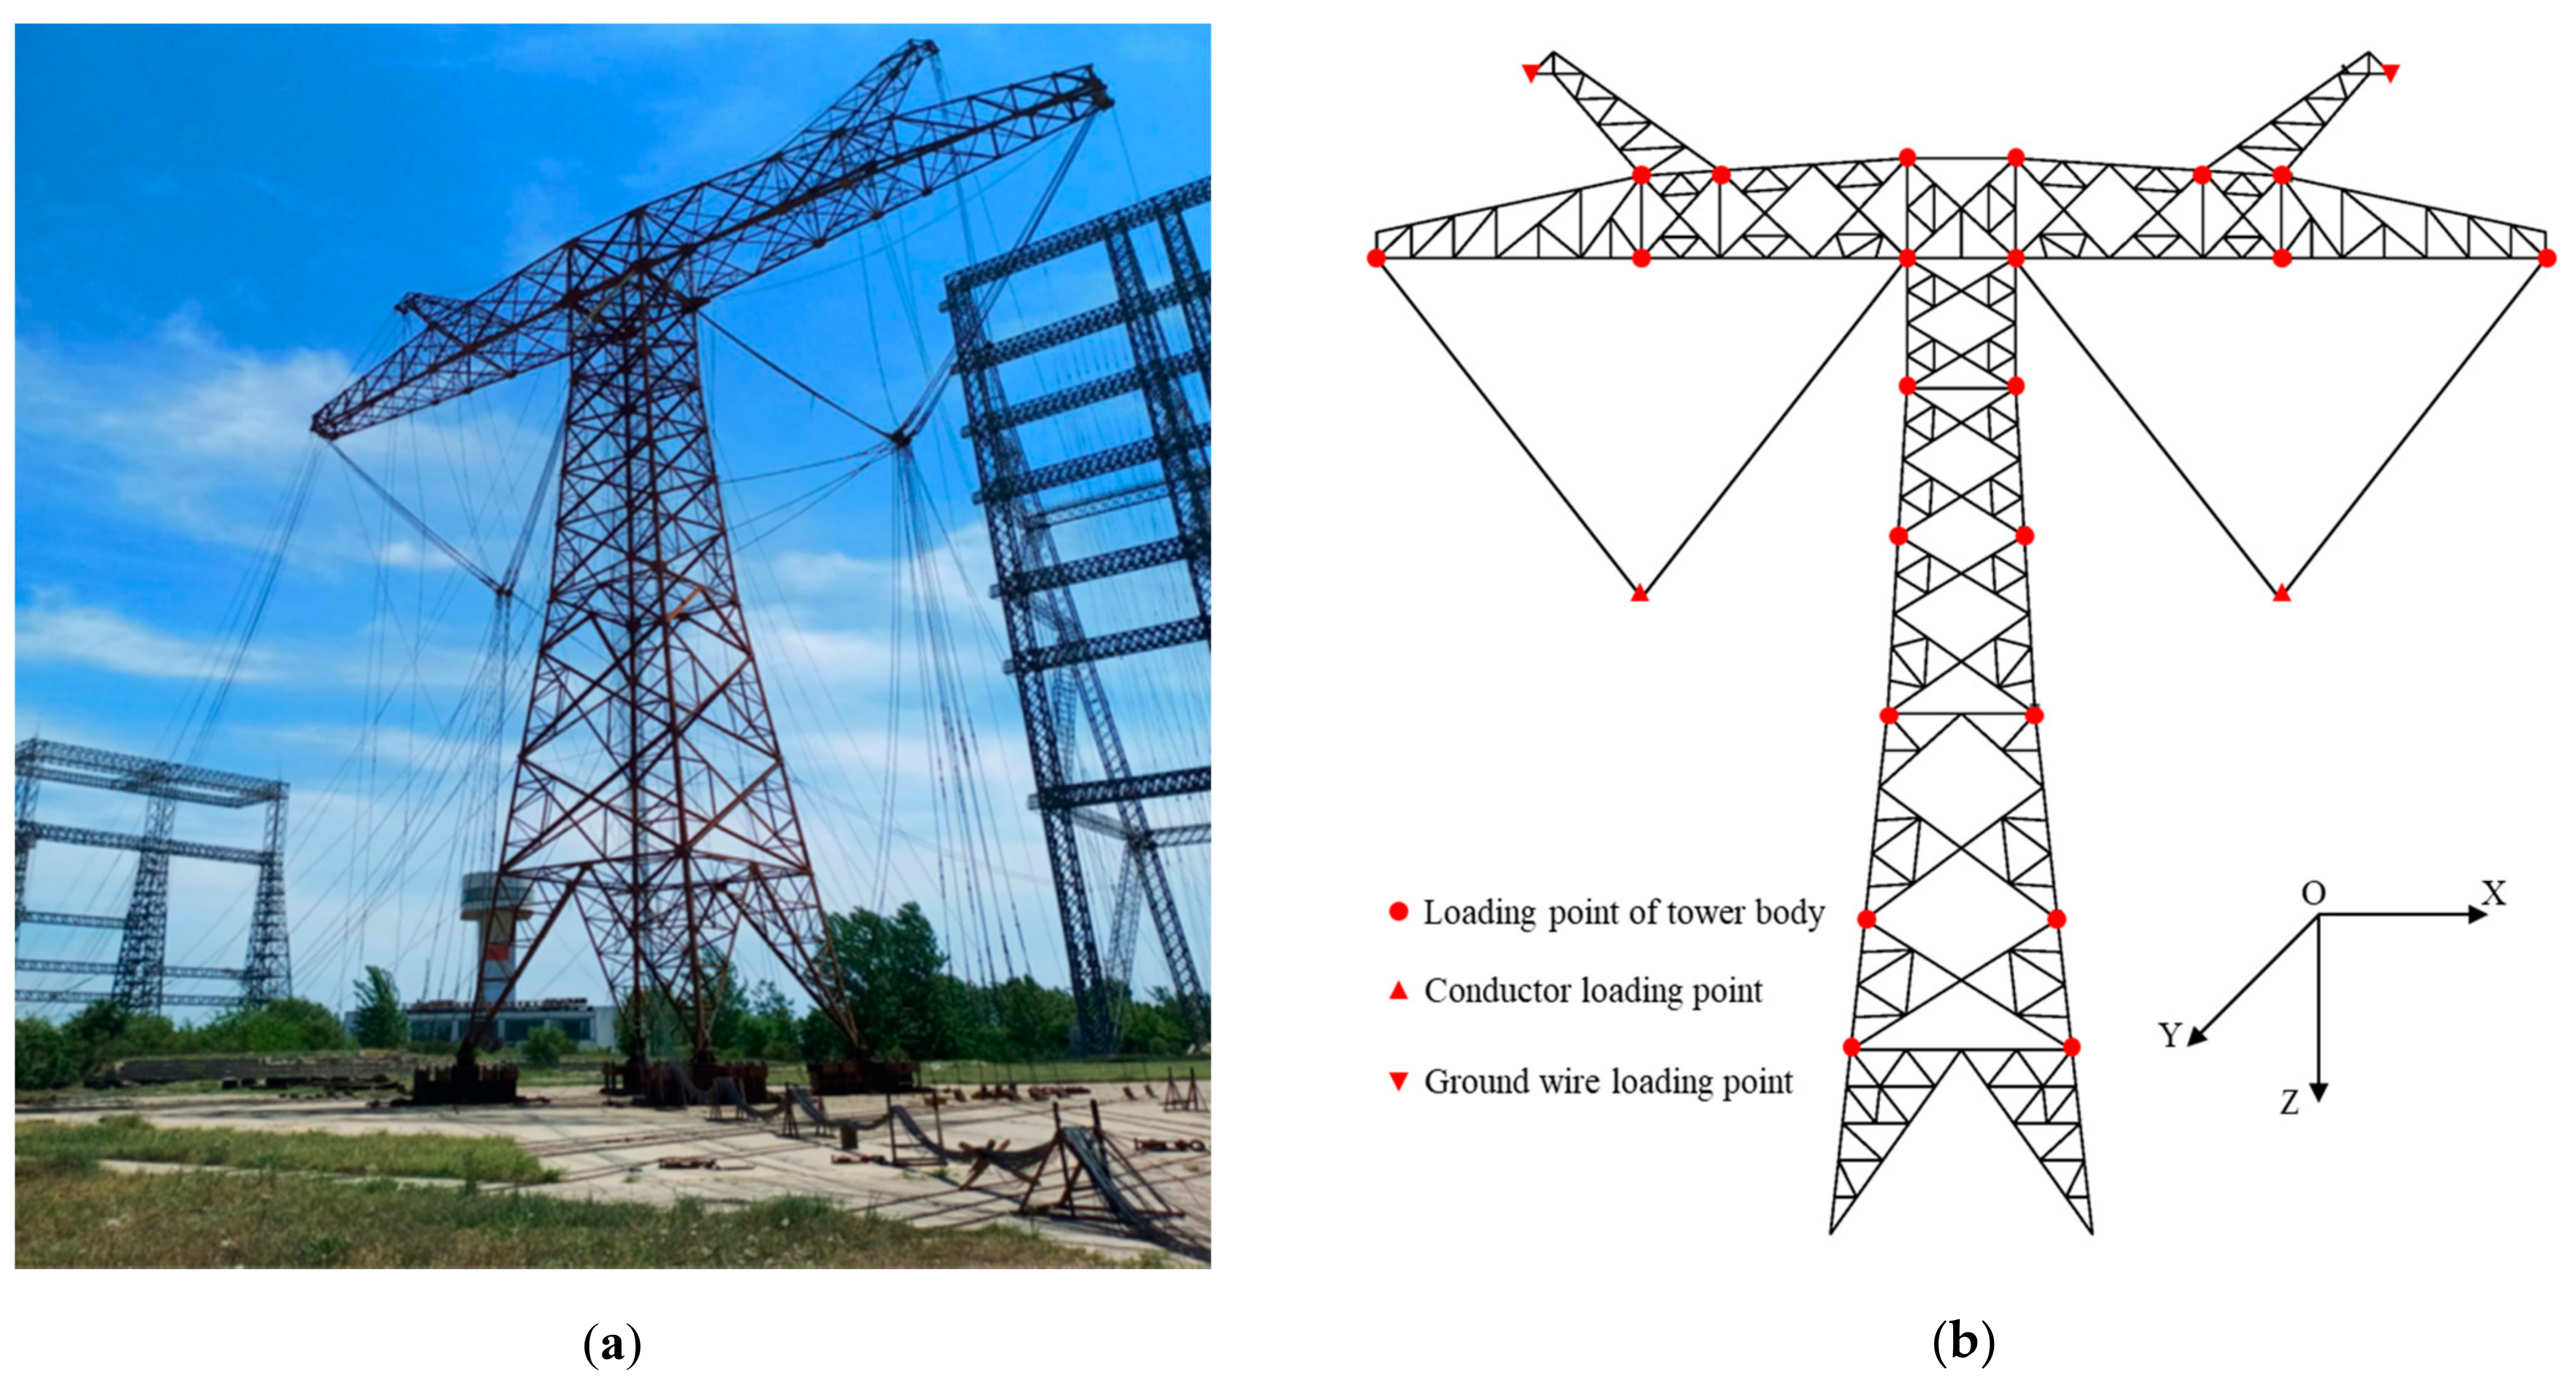
2. Full-Scale Test
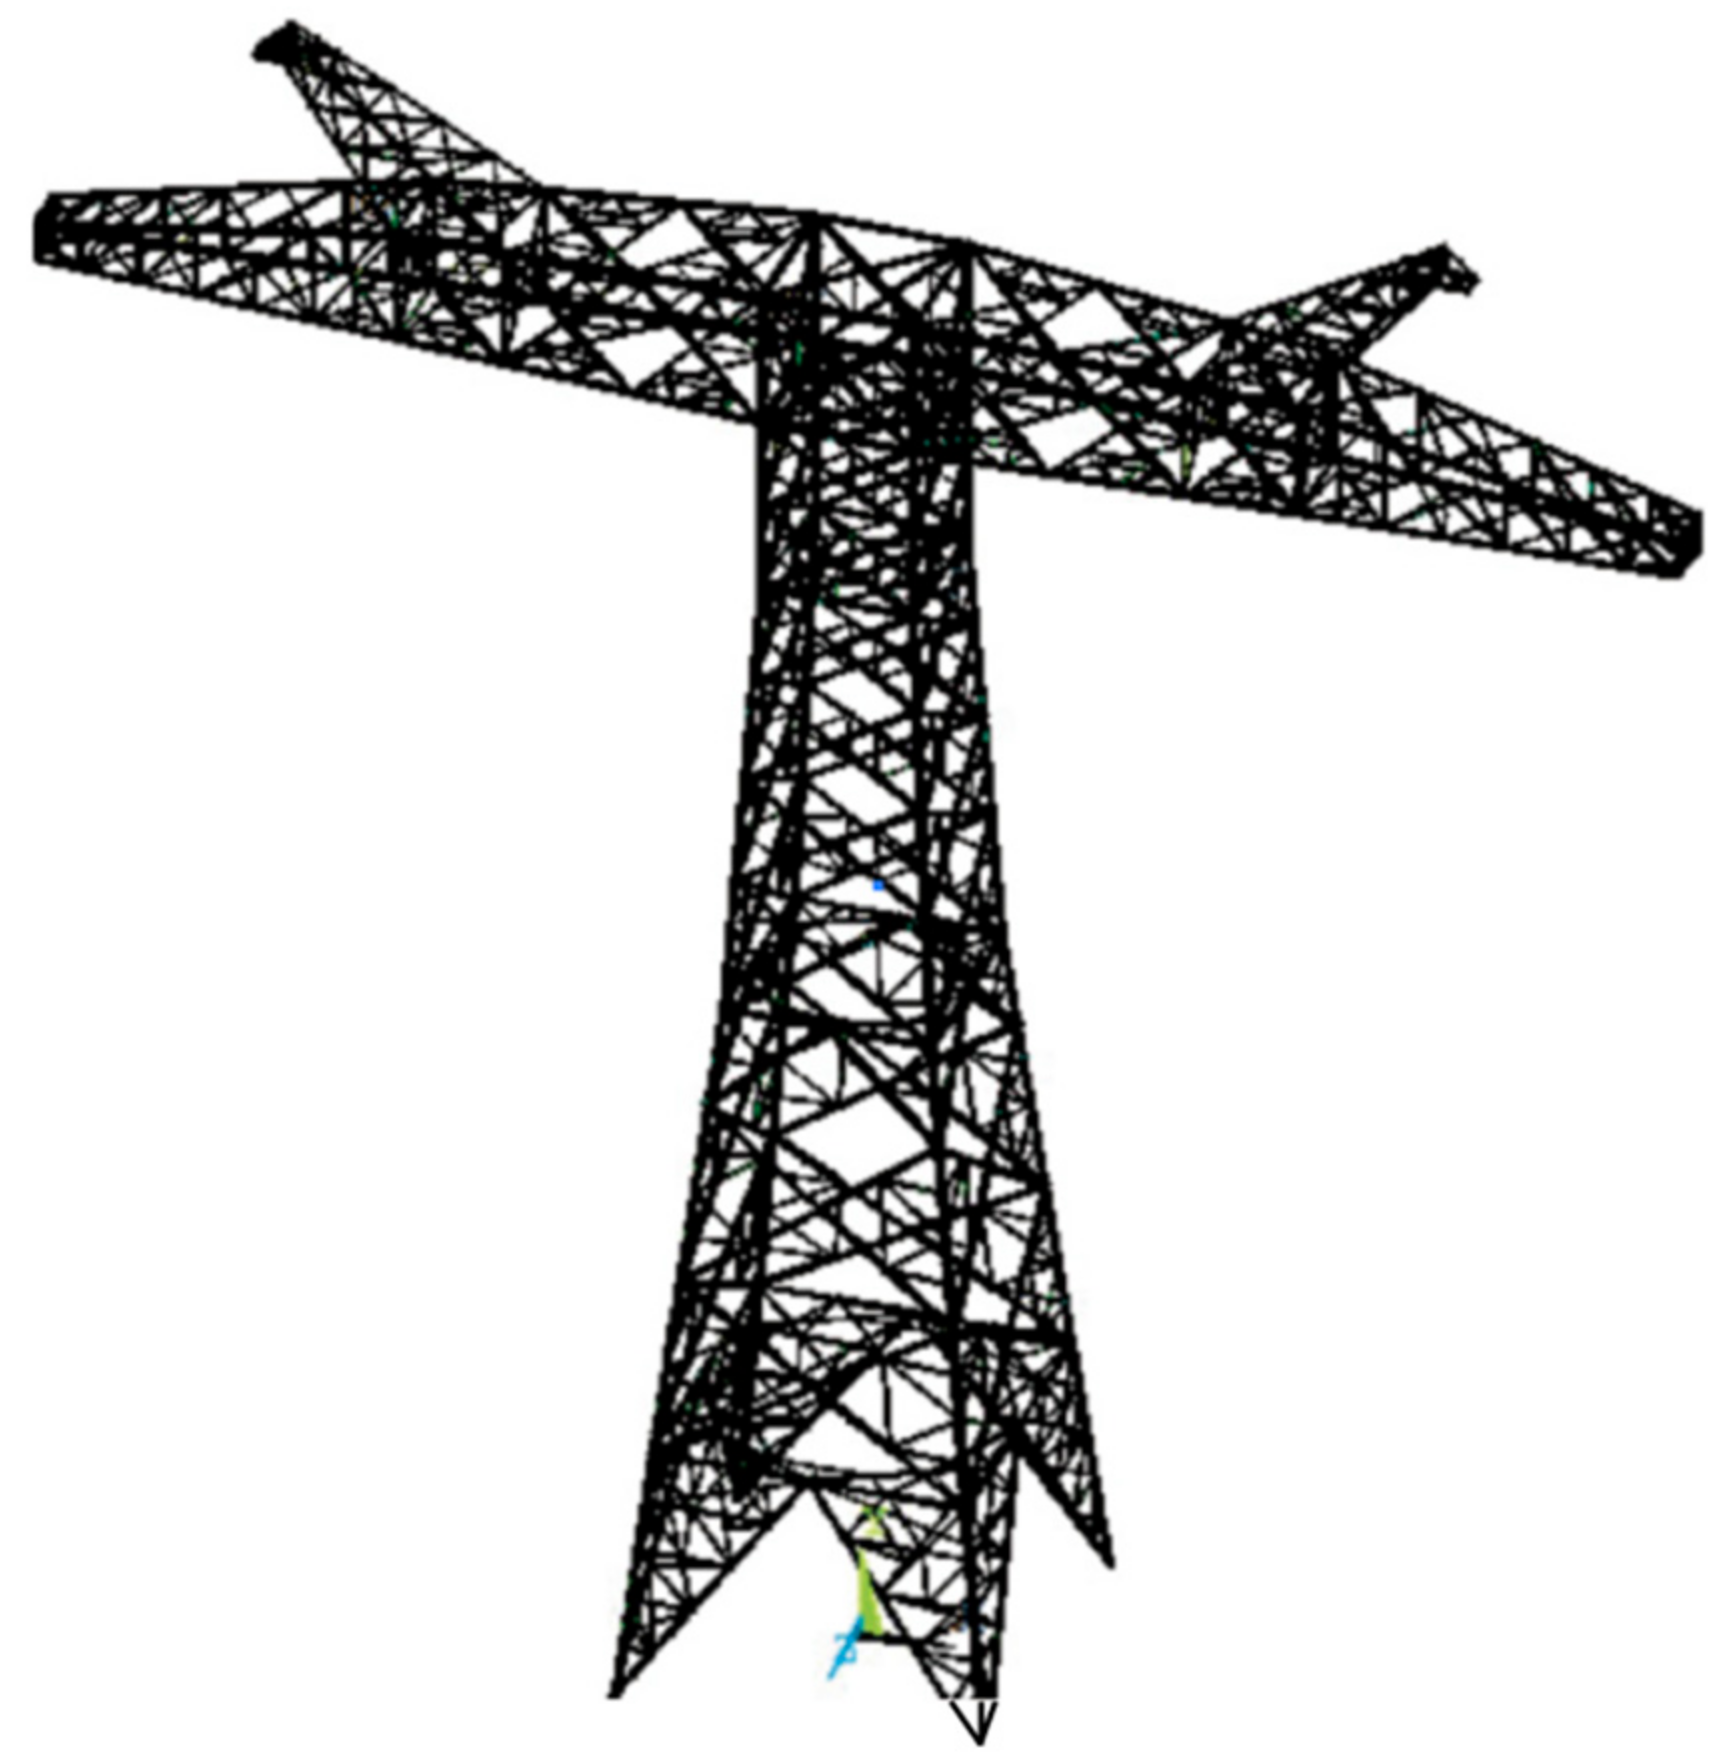
3. Finite Element Model of the Tower
4. Results and Discussion
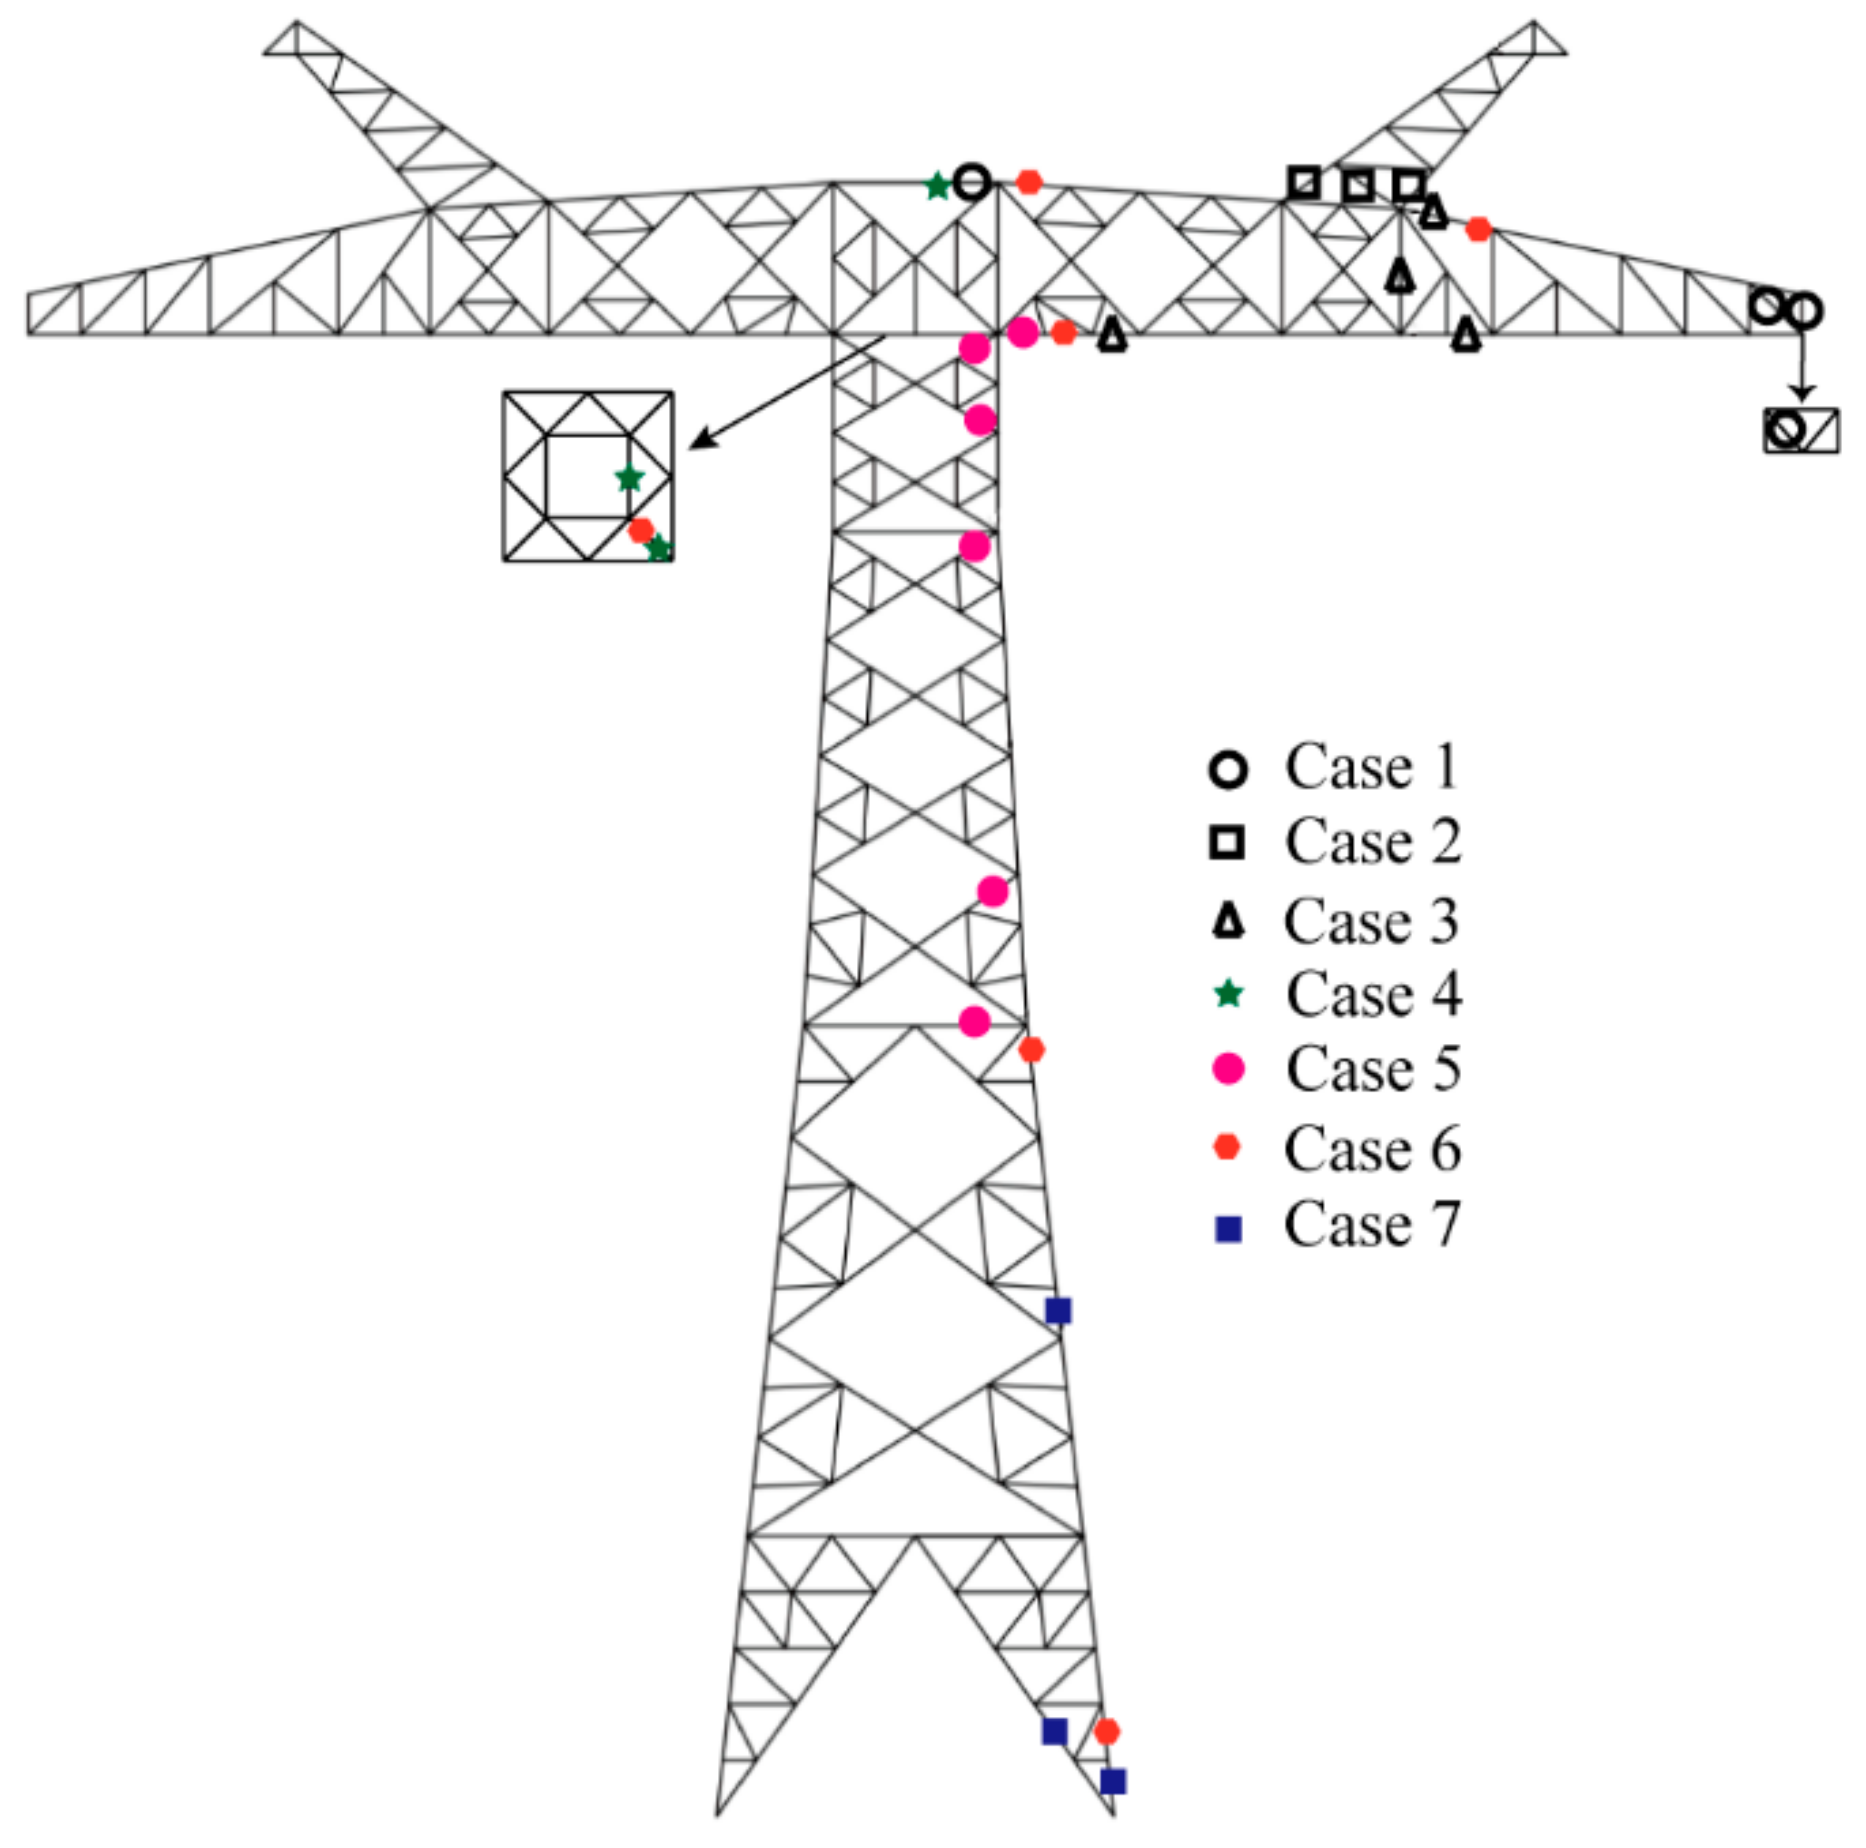
4.1. Overload Case for Uneven Ice
4.2. Key Parts of the Transmission Tower
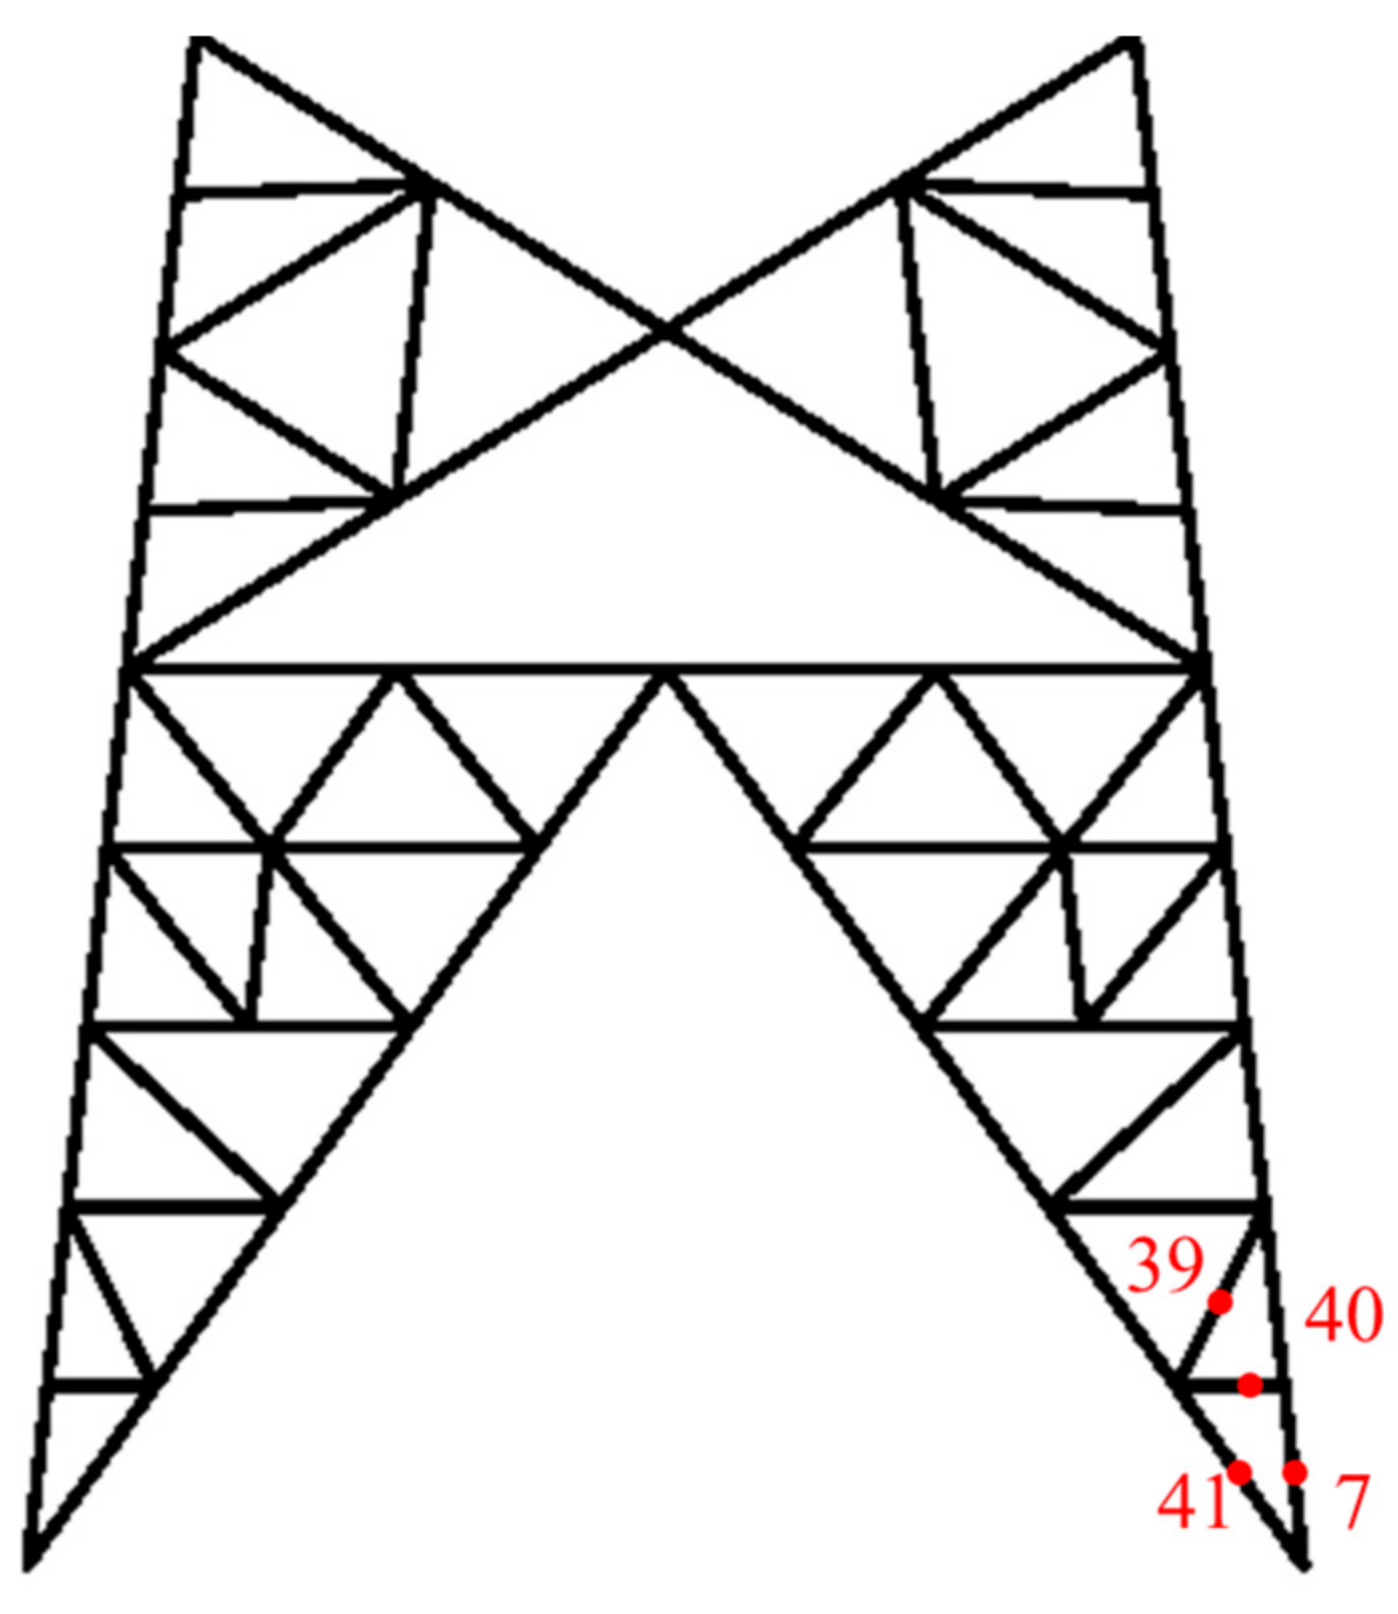
4.2.1. Tower Legs
4.2.2. Diagonal Members under the Tower Head
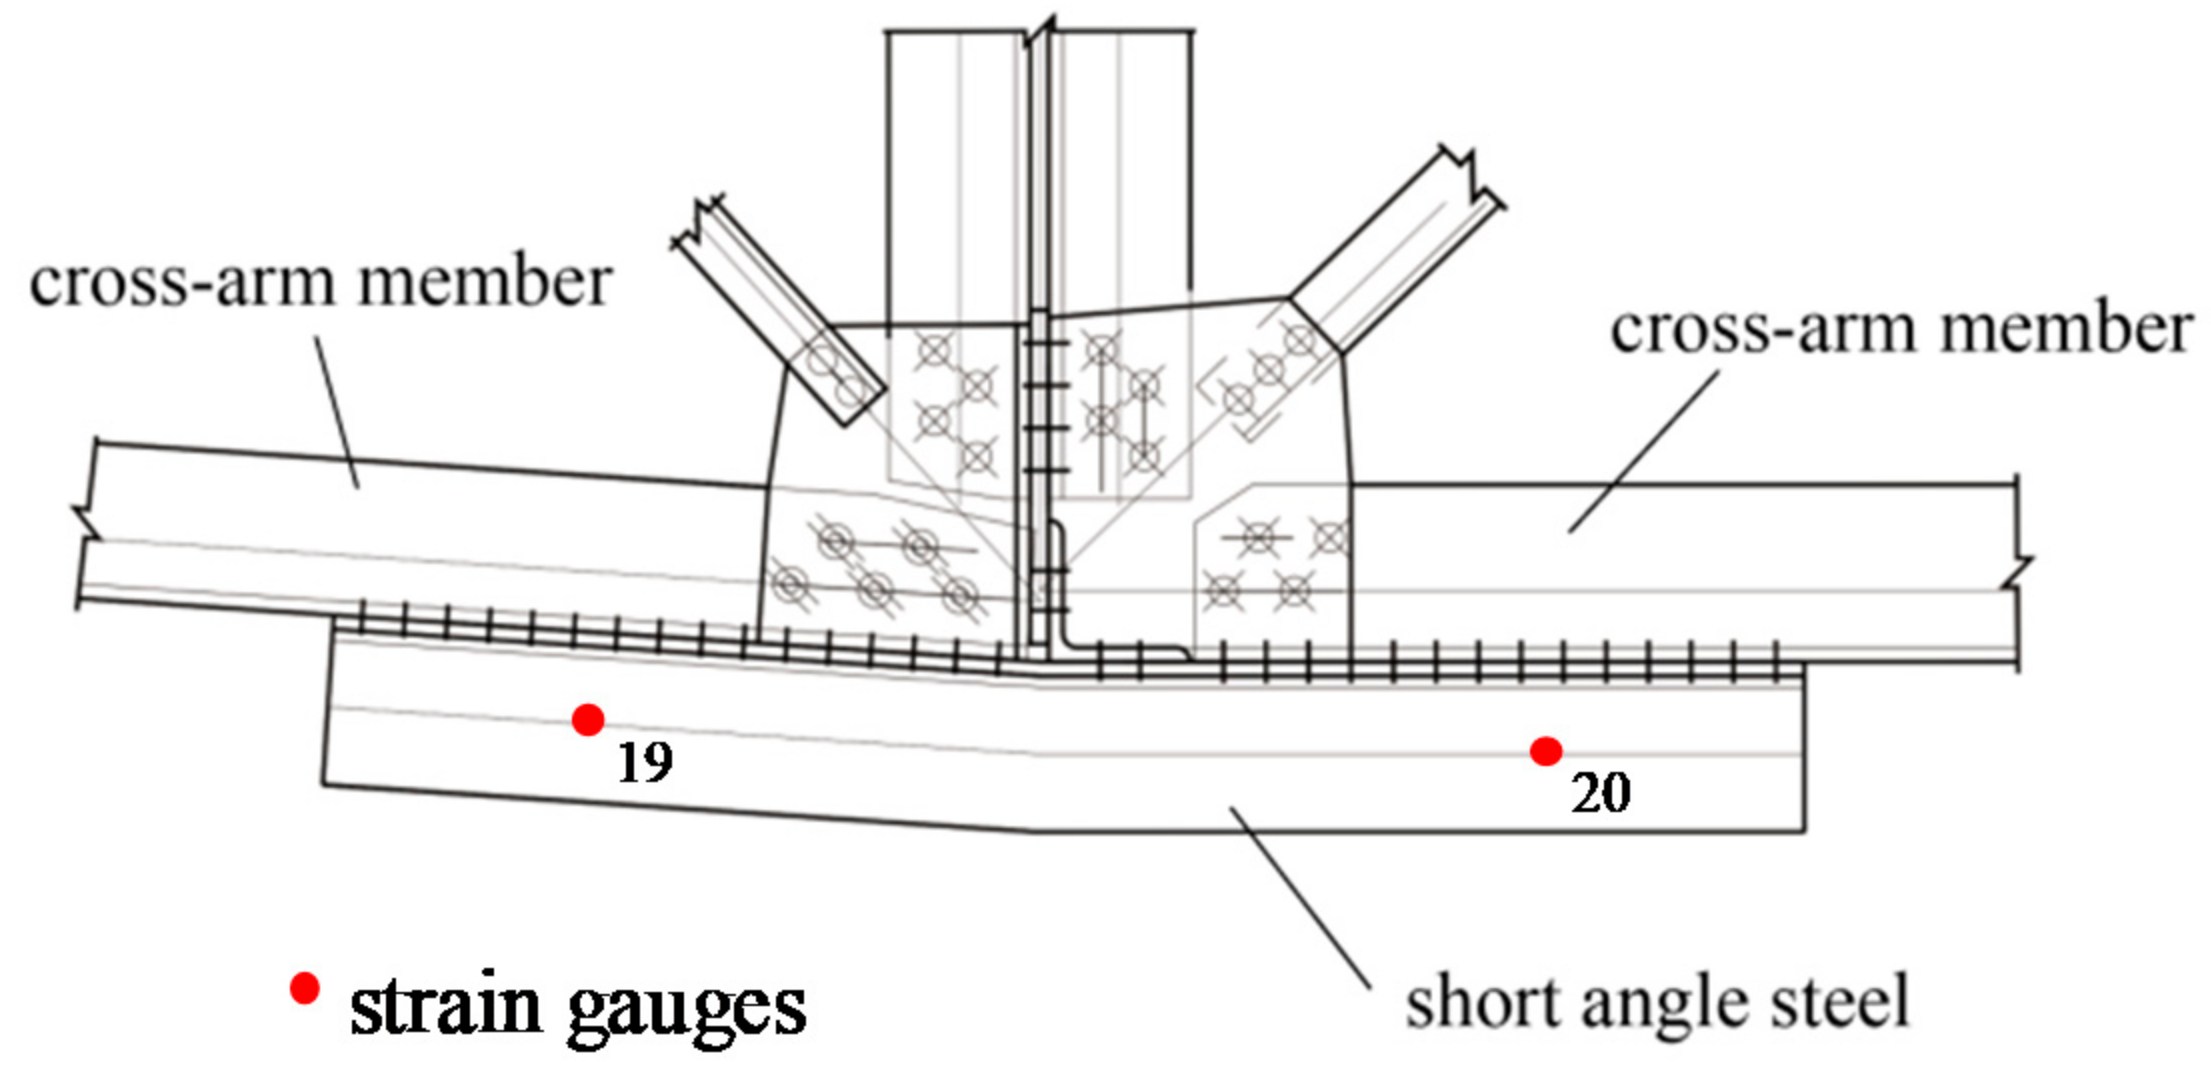
4.2.3. The Connection between the Cross-Arm and Tower Body
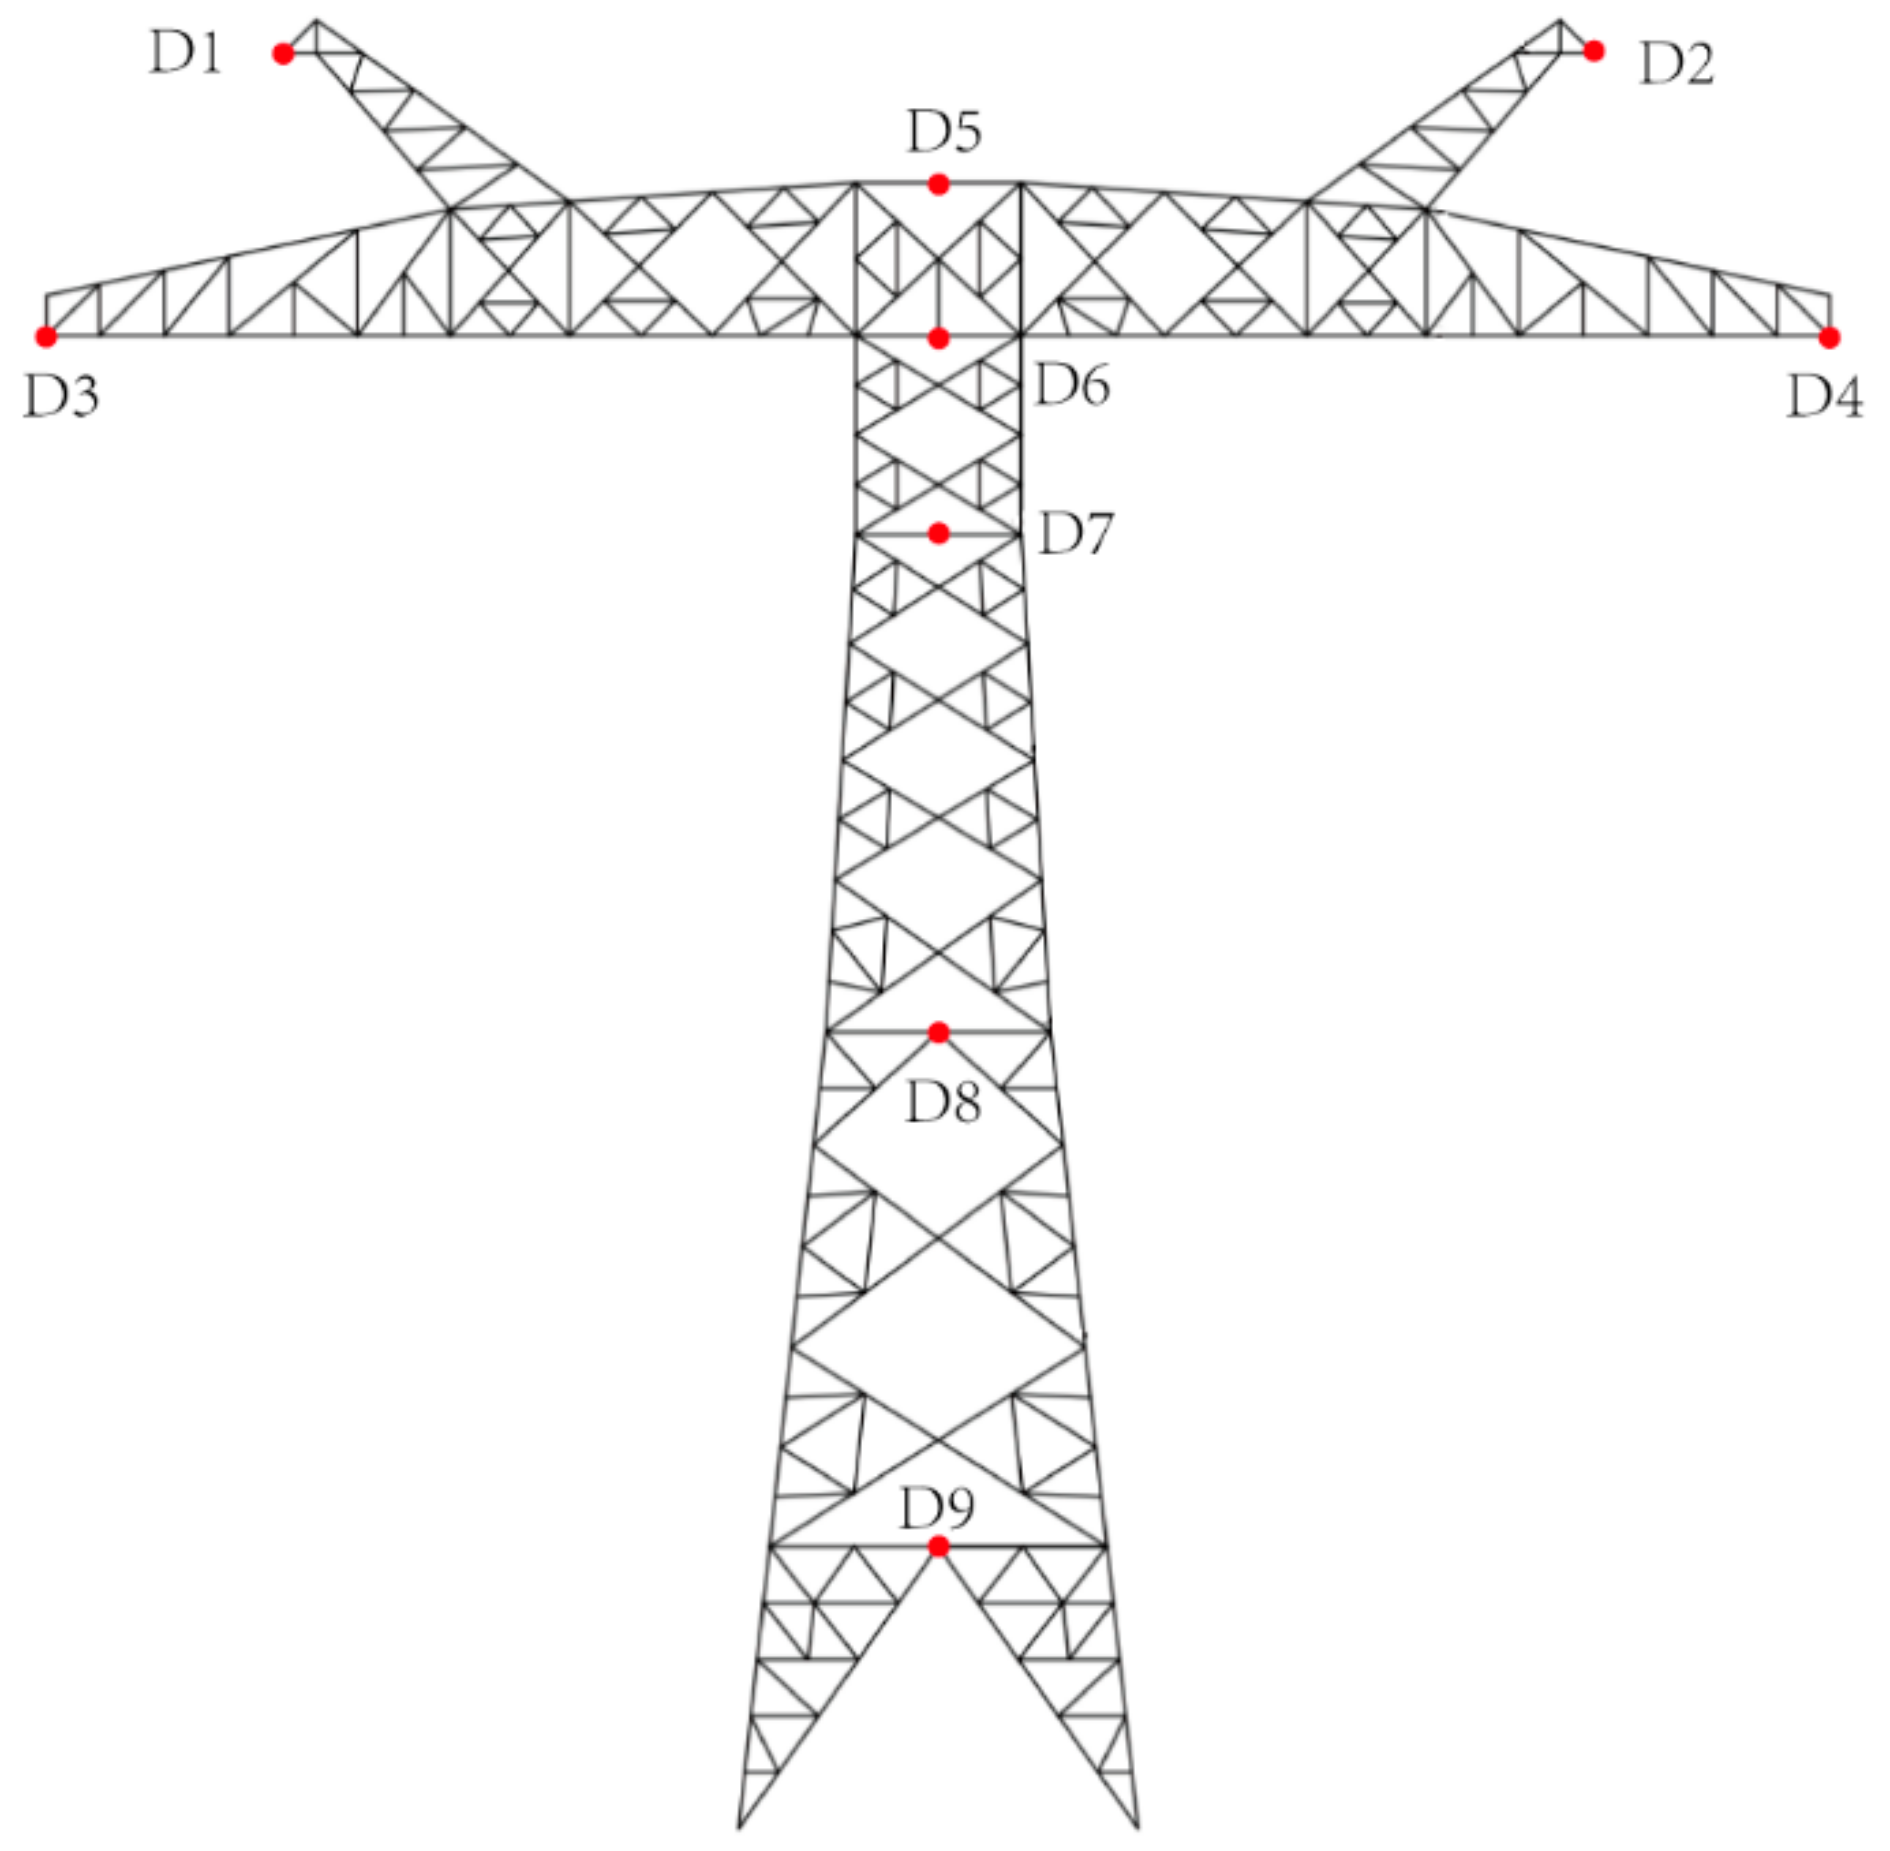
4.3. Displacement Analysis of the Transmission Tower
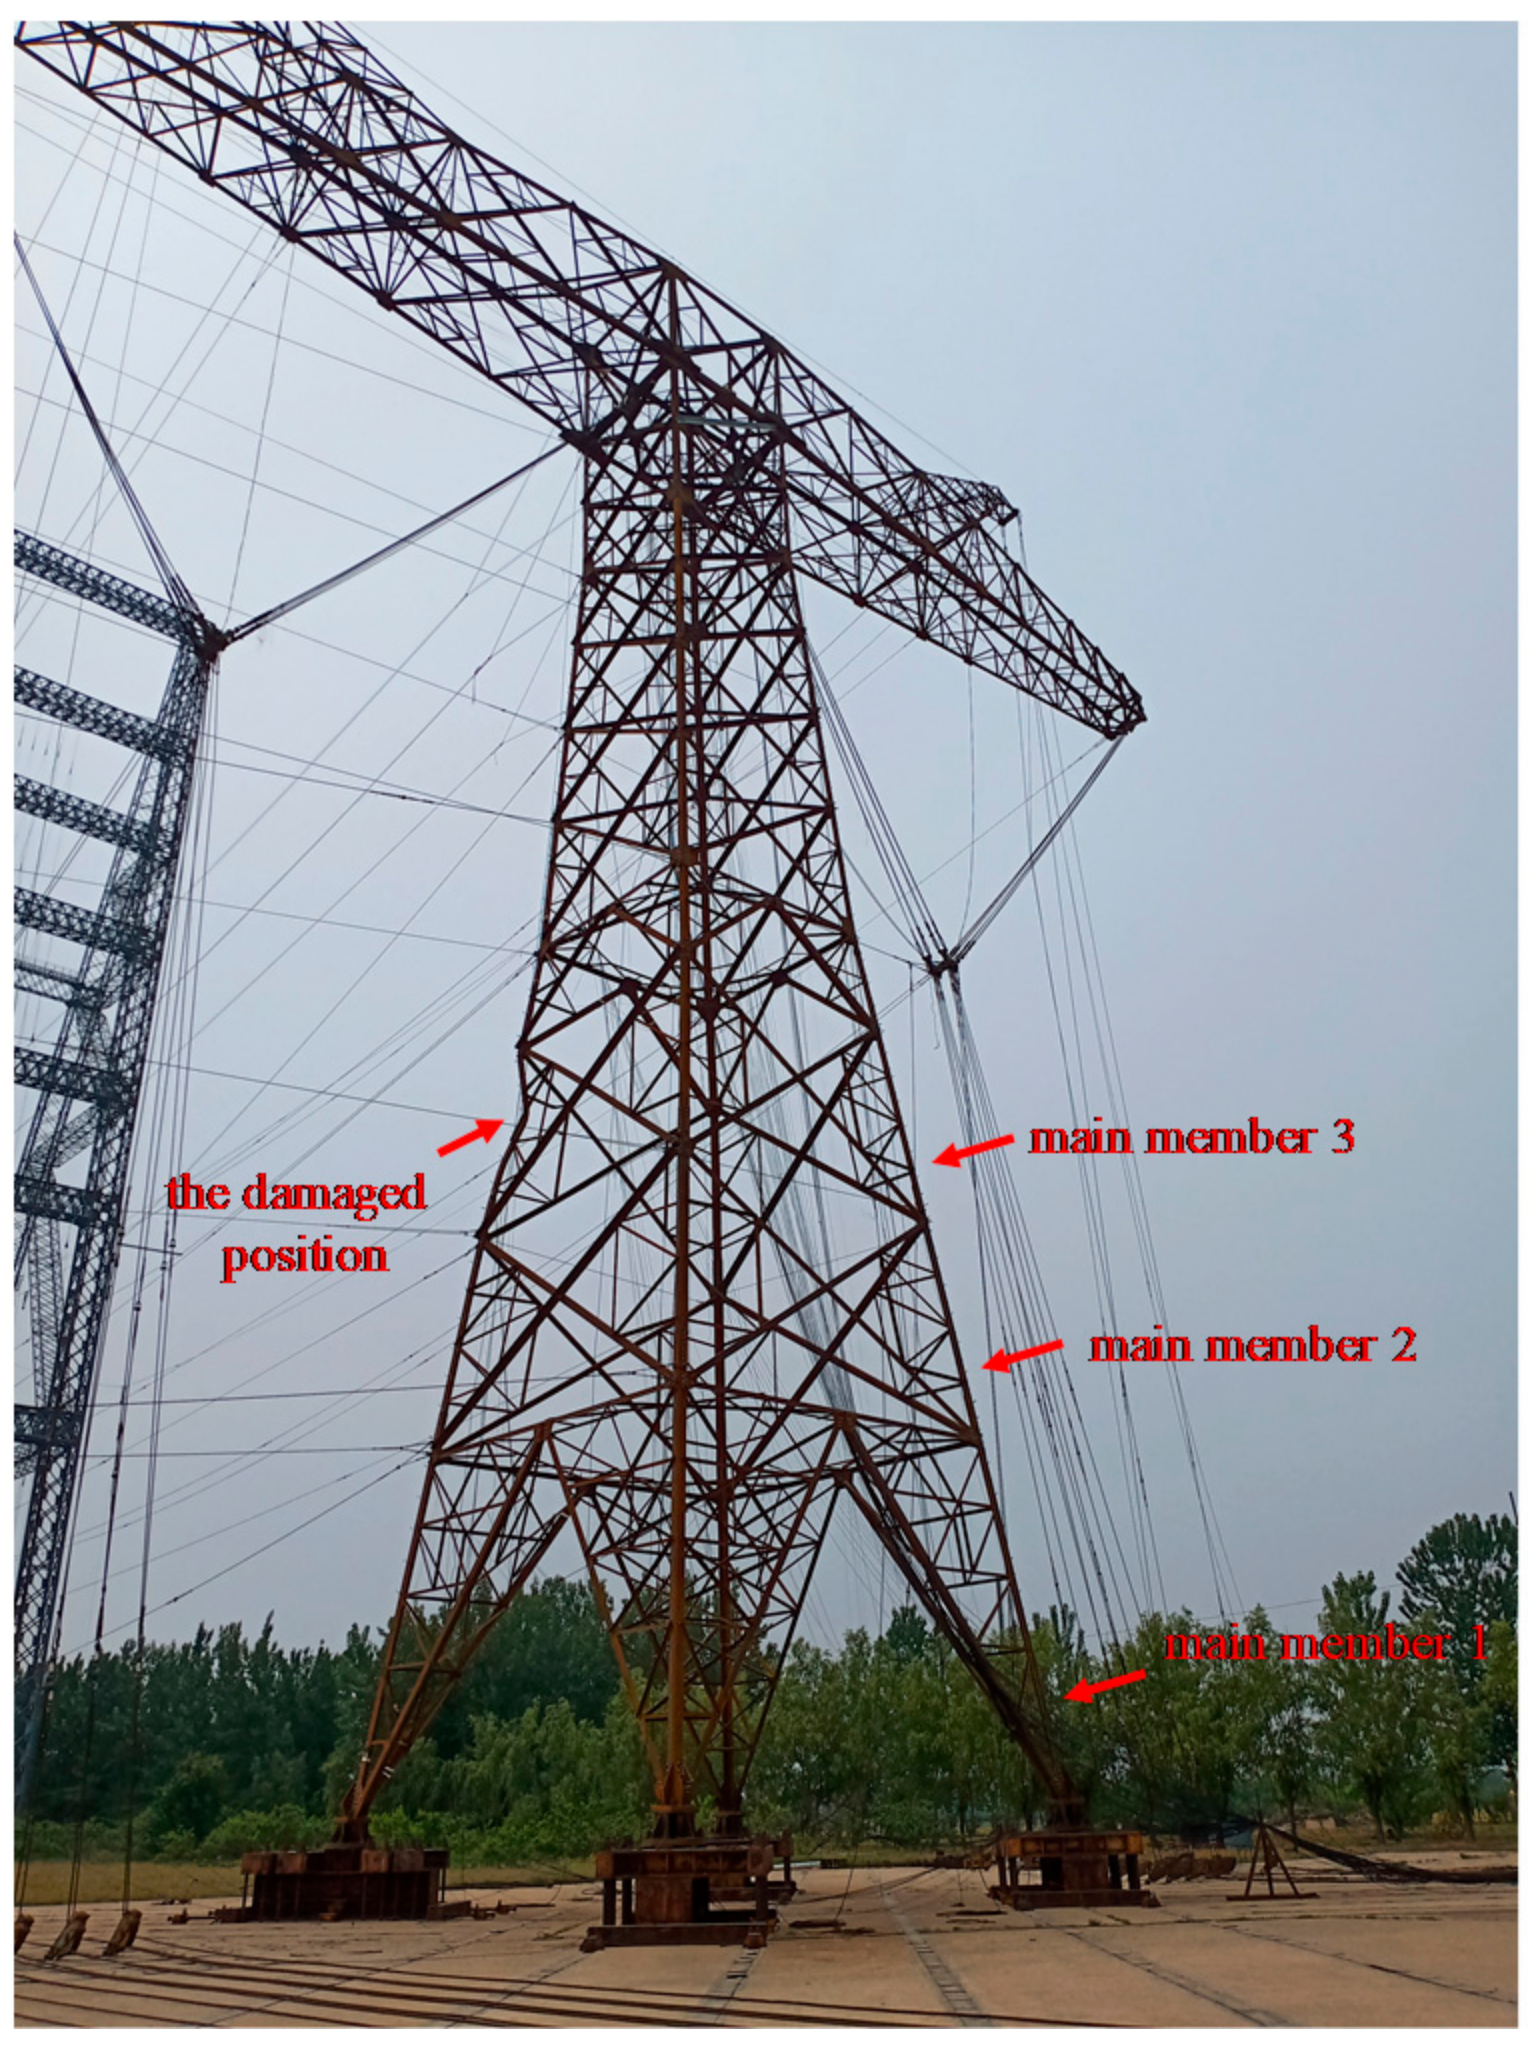
4.4. Tower Failure Analysis
4.5. Tower Force Analysis
5. Conclusions
- (1)
- The deviation of the measured displacement data of the tower under various working conditions and the calculated displacement value is within 16%, and the calculation stress of most members, by design on the tower, is close to the measured value. Therefore, the performance of the tower is good.
- (2)
- Under the condition of torsion, the actual axial force of the diagonal is far less than the axial force calculated by TTA, which is only one-third of the calculated value of TTA.
- (3)
- Compared with the calculation results of TTA and ANSYS, introducing the beam-truss hybrid calculation model in the Chinese tower design software, which can ensure the accuracy of the calculation, is suggested.
- (4)
- The short angle steel on the outer back of the cross-arm root can effectively increase the stiffness of the joint under the condition of torsion, while the strengthening effect is not obvious under the maximum bending condition.
- (5)
- Due to the bolt slippage, the measured displacement in the test is greater than the theoretical displacement value; however, the influence of bolt slip can be reduced by observing the displacement of the tower after unloading and correcting the measured displacement value.
- (6)
- According to the calculation of the tower, it is reasonable that the failure position of the tower first occurred on the main member of the second section, at the upper part of the tower leg, which is consistent with the predicted position.
- (7)
- The bracing member at the bottom of the tower leg is located at the connection of the tower leg and the foundation, and there is a sudden large change in stiffness. It is recommended to design according to 4% of the axial force of the main member.
Author Contributions
Funding
Institutional Review Board Statement
Informed Consent Statement
Data Availability Statement
Conflicts of Interest
Appendix A
- (a)
- Table 2 shows that the calculation results of the first diagonals below the tower head are obviously different from the experimental results. Therefore, the American standard ASCE10-15 is used for manual calculation. The calculation results are as follows:
- (b)
- In Section 4.4, according to the Chinese steel structure design standard GB50017-2017, the overload condition is calculated. The theoretical value of the failure load is 120% of the design load and the reason has been mentioned in the paper. The calculation process is as follows:
References
- Albermani, F.; Kitipornchai, S.; Chan, R. Failure analysis of transmission towers. Eng. Fail. Anal. 2009, 16, 1922–1928. [Google Scholar] [CrossRef]
- Alminhana, F.; Mason, M.; Albermani, F. A compact nonlinear dynamic analysis technique for transmission line cascades. Eng. Struct. 2018, 158, 164–174. [Google Scholar] [CrossRef]
- Zhang, J.; Li, H.; Li, C.; Tian, L. Seismic response analyses of transmission towers under multidimensional ground motions with rocking and torsion components. J. Aerosp. Eng. 2020, 33, 04020082. [Google Scholar] [CrossRef]
- Tian, L.; Rong, K.; Zhang, P.; Liu, Y. Vibration control of a power transmission tower with pounding tuned mass damper under multi-component seismic excitations. Appl. Sci. 2017, 7, 477. [Google Scholar] [CrossRef]
- Tian, L.; Ma, R.; Pan, H.; Qiu, C.; Li, W. Progressive collapse analysis of long-span transmission tower-line system under multi-component seismic excitations. Adv. Struct. Eng. 2017, 20, 1920–1932. [Google Scholar] [CrossRef]
- Ji, K.; Rui, X.; Li, L.; Yang, F.; McClure, G. Dynamic response of iced overhead electric transmission Lines following cable rupture shock and induced ice shedding. IEEE Trans. Power Deliv. 2016, 31, 2215–2222. [Google Scholar] [CrossRef]
- Yang, F.; Zhu, B.; Xing, H. THE slip characteristics and parametric study of bolted connections for transmission towers. Eng. Mech. 2017, 34, 116–127. [Google Scholar]
- Gan, Y.; Deng, H.; Li, C. Simplified joint-slippage model of bolted joint in lattice transmission tower. Structures 2021, 32, 1192–1206. [Google Scholar] [CrossRef]
- An, L.; Wu, J.; Jiang, W. Experimental and numerical study of the axial stiffness of bolted joints in steel lattice transmission tower legs. Eng. Struct. 2019, 187, 490–503. [Google Scholar] [CrossRef]
- Ma, L.; Bocchini, P. Hysteretic model of single-bolted angle connections for lattice steel towers. J. Eng. Mech. 2019, 145, 04019052. [Google Scholar] [CrossRef]
- Jiang, W.; Wang, Z.; McClure, G.; Wang, G.; Geng, J. Accurate modeling of joint effects in lattice transmission towers. Eng. Struct. 2011, 33, 1817–1827. [Google Scholar] [CrossRef]
- Jiang, W.; Liu, Y.; Chan, S.; Wang, Z. Direct analysis of an ultrahigh-voltage lattice transmission tower considering joint effects. J. Struct. Eng. 2017, 143, 04017009. [Google Scholar] [CrossRef]
- Prasad Rao, N.; Samuel Knight, G.; Lakshmanan, N.; Iyer, N. Investigation of transmission line tower failures. Eng. Fail. Anal. 2010, 17, 1127–1141. [Google Scholar] [CrossRef]
- Prasad Rao, N.; Samuel Knight, G.; Seetharaman, S.; Lakshmanan, N.; Iyer, N. Failure analysis of transmission line towers. J. Perform. Constr. Facil. 2011, 25, 231–240. [Google Scholar] [CrossRef]
- Prasad Rao, N.; Samuel Knight, G.; Mohan, S.; Lakshmanan, N. Studies on failure of transmission line towers in testing. Eng. Struct. 2012, 35, 55–70. [Google Scholar] [CrossRef]
- Tian, L.; Pan, H.; Ma, R.; Zhang, L.; Liu, Z. Full-scale test and numerical failure analysis of a latticed steel tubular transmission tower. Eng. Struct. 2020, 208, 109919. [Google Scholar] [CrossRef]
- Tian, L.; Guo, L.; Ma, R.; Gai, X.; Wang, W. Full-scale tests and numerical simulations of failure mechanism of power transmission towers. Int. J. Struct. Stab. Dyn. 2018, 18, 1850109. [Google Scholar] [CrossRef]
- Fu, X.; Li, H. Uncertainty analysis of the strength capacity and failure path for a transmission tower under a wind load. J. Wind. Eng. Ind. Aerodyn. 2018, 173, 147–155. [Google Scholar] [CrossRef]
- Fu, X.; Wang, J.; Li, H.; Li, J.; Yang, L. Full-scale test and its numerical simulation of a transmission tower under extreme wind loads. J. Wind. Eng. Ind. Aerodyn. 2019, 190, 119–133. [Google Scholar] [CrossRef]
- Li, J.; McClure, G.; Wang, S. Ensuring the structural safety of overhead transmission lines by design. J. Aerosp. Eng. 2021, 34, 04021010. [Google Scholar] [CrossRef]


| Case No. | Load Description |
|---|---|
| Case 1 | Anchor right conductor, while the ground wires and left conductor anchored |
| Case 2 | Right ground wire breakage |
| Case 3 | Right conductor breakage |
| Case 4 | Ice load |
| Case 5 | Uneven ice, maximum torsion (overload) |
| Case 6 | Uneven ice, maximum moment |
| Case 7 | High intensity wind 45° (overload) |
| Location | Test (MPa) | TTA (MPa) | ANSYS (MPa) |
|---|---|---|---|
| The first diagonals below the tower head | 158.8 (0.51) | 474.3 (1.53) | 140 (0.45) |
| Connection between the tower body and cross-arm | 305.5 (0.85) | 503 (1.4) | 507 (1.4) |
| Main member of bottom tower leg | 257.7 (0.72) | 232.5 (0.65) | 236 (0.66) |
| Case No. | Strain No. | Member Specs | Test Internal Force (kN) |
|---|---|---|---|
| Case 5 | 39 (bracing member) | Q345 L80 × 7 | 46.3 |
| 40 (bracing member) | Q345 L80 × 7 | 69.6 | |
| 41(main member) | Q345 L180 × 14 | 241.7 | |
| 7 (main member) | Q420 L220 × 22 | 1886.2 | |
| Case 6 | 39 (bracing member) | Q345 L80 × 7 | 5.6 |
| 40 (bracing member) | Q345 L80 × 7 | 16.8 | |
| 41 (main member) | Q345 L180 × 14 | 254.8 | |
| 7 (main member) | Q420 L220 × 22 | 2195 |
| Case No. | Strain No. | Member Specs | Test Internal Force (kN) |
|---|---|---|---|
| Case 5 | 19 | Q420 L250 × 22 | 227.4 |
| 20 | Q420 L250 × 22 | 148.7 | |
| Case 6 | 19 | Q420 L250 × 22 | 48.2 |
| 20 | Q420 L250 × 22 | 54.4 |
| Case No. | Displacement Observation Point No. | Position | Direction | D1 | D2 | D3 | CV | RD | AD |
|---|---|---|---|---|---|---|---|---|---|
| Case 1 | 4 | cross-arm | vertical | 61 | 7 | 54 | 51 | 5.6% | 19.6% |
| Case 2 | 2 | ground wire bracket | longitudinal | 206 | 21 | 185 | 182 | 1.6% | 13.2% |
| Case 3 | 4 | cross-arm | longitudinal | 849 | 479 | 370 | 379 | −2.4% | 124% |
| Case 4 | 3 | cross-arm | vertical | 265 | 61 | 204 | 187 | 8.30% | 41.7% |
| Case 5 | 3 | cross-arm | longitudinal | 1736 | 892 | 844 | 708 | 16.0% | 145% |
| Case 6 | 3 | cross-arm | longitudinal | 483 | 192 | 291 | 252 | 13.4% | 91.6% |
| Case 7 | 3 | cross-arm | longitudinal | 567 | - | - | 206 | - | 175.2% |
| Location | Member Specs | Test Yield Strength (MPa) | Theoretical Yield Strength (MPa) | Design Strength (MPa) | Test Value/Theoretical Value | Test Value/Design Strength |
|---|---|---|---|---|---|---|
| Main member 1 | Q420 L220 × 24 | 398 | 400 | 355 | 0.995 | 1.121 |
| Main member 2 | Q420 L220 × 24 | 394 | 400 | 355 | 0.985 | 1.110 |
| Main member 3 | Q420 L200 × 24 | 392 | 400 | 355 | 0.980 | 1.104 |
| Description | Member Specs | Case No. | Test Value (kN) | Calculated Value (kN) | Deviation |
|---|---|---|---|---|---|
| Ground support member | Q345 L110 × 10 | Case 2 | 397.3 | 388.1 | −2.4% |
| Cross-arm member | Q420 L220 × 2 | Case 5 | 2014.6 | 2451.2 | 17.80% |
| Main member of the tower body | Q420 L200 × 24 | Case 7 | 2094.8 | 2131.5 | 1.8% |
| Main member of the tower leg | Q420 L220 × 24 | Case 7 | 2590.9 | 2740.0 | 5.4% |
Publisher’s Note: MDPI stays neutral with regard to jurisdictional claims in published maps and institutional affiliations. |
© 2022 by the authors. Licensee MDPI, Basel, Switzerland. This article is an open access article distributed under the terms and conditions of the Creative Commons Attribution (CC BY) license (https://creativecommons.org/licenses/by/4.0/).
Share and Cite
Gao, X.; Yi, R.; Zhang, L.; Jiang, X.; Li, J. Failure Analysis of Transmission Tower in Full-Scale Tests. Buildings 2022, 12, 389. https://doi.org/10.3390/buildings12040389
Gao X, Yi R, Zhang L, Jiang X, Li J. Failure Analysis of Transmission Tower in Full-Scale Tests. Buildings. 2022; 12(4):389. https://doi.org/10.3390/buildings12040389
Chicago/Turabian StyleGao, Xiuyun, Rong Yi, Lingquan Zhang, Xiao Jiang, and Jiaxiang Li. 2022. "Failure Analysis of Transmission Tower in Full-Scale Tests" Buildings 12, no. 4: 389. https://doi.org/10.3390/buildings12040389
APA StyleGao, X., Yi, R., Zhang, L., Jiang, X., & Li, J. (2022). Failure Analysis of Transmission Tower in Full-Scale Tests. Buildings, 12(4), 389. https://doi.org/10.3390/buildings12040389