Abstract
A novel damage detection approach is proposed in this study for a continuous girder bridge in which support reaction influence lines (ILs) are adopted. First, the relationship between the local damage of a continuous girder bridge and a damage index, based on support reaction ILs, is established through analytical derivation. Subsequently, the sensitivity of a support reaction IL-based damage index is analyzed using Dempster-Shafer (D-S) evidence theory, and it shows that the support reaction IL-based damage index is more noise-resistant if more support reaction ILs from a variety of locations are used. Three case studies (a simple numerical study of a two-span continuous beam, a laboratory experimental study of a two-span aluminum beam, and a complicated numerical study of a continuous girder bridge in Xiamen) have been conducted to validate the effectiveness of the proposed method in different damage scenarios, including single damage and multiple damages. Satisfactory damage identification results can be obtained even in high-level measurement noise conditions, showing that the proposed approach offers a promising field detection technique for identifying local structural damages in continuous girder bridges.
1. Introduction
During the service period of a bridge structure over decades or even hundreds of years, the combined effects of environmental corrosion, material aging, long-term dynamic and static load effects, fatigue, and catastrophe will inevitably lead to the accumulation of structural damage and even possibly cause a catastrophic accident. According to transportation sector figures, there were 912,800 road bridges in China as of the end of 2020, with 86.15% of them being short- and medium-span bridges. Many large-span bridges and urban-level bridge groups in China have been equipped with bridge health monitoring systems to ensure the safety of bridges during operation. These systems can provide comprehensive information for bridge management, including environmental effects, load effects, and structural responses. On the one hand, it is commonly acknowledged that the monitoring system can completely monitor a variety of bridge data. Simultaneously, there are many issues concerning how to use monitoring data to provide an efficient bridge-condition evaluation. The effective condition evaluation index is at the core of implementing a structural-condition evaluation [1,2,3]. The optimal condition evaluation index should represent the structure’s fundamental qualities, be sensitive to damage, and be less susceptible to environmental changes.
There are two types of condition evaluation indicators, namely, vibration-based and static-based indicators. Frequency [4,5,6,7], mode shape [8,9,10], frequency response function [11,12], and modal strain energy [13] are examples of vibration-based damage indicators. In several domains, vibration-based indicators have had variable degrees of effectiveness, although they are typically thought to be more sensitive to environmental changes (such as temperature). Static-based indicators, on the other hand, can have exceptionally high test accuracy and stability and have been used in bridge damage identification studies.
The bridge’s influence line (IL) is a static characteristic that represents the internal force and reaction variations at a given place of the structure, generated by a unit moving load [14,15,16,17]. The measured IL of the bridge might represent the structure’s current operational state. Multiple types of ILs with varied features may be generated by reflecting on different types of monitored physical parameters (deflection, strain, rotation angle, support reaction). The IL of a bridge, as a particular static index, not only provides global information about the bridge, but it also has the benefit of being sensitive to local damage and less susceptible to environmental changes. As a result, in recent years, several researchers have attempted to utilize the IL to identify bridge degradation. By integrating video imaging and sensor data, Zaurin and Catbas [18] calculated the unit IL of a four-span bridge model, and then experimentally showed that an IL has the potential to be a useful damage indicator. Chen et al. [3] investigated and confirmed the efficiency of a collection of damage localization indicators based on stress ILs for a long-span suspension bridge. Furthermore, Chen et al. [19] established an explicit link between changes in deflection influence lines (DILs) and structural damage and then built a unique damage detection and quantification approach. Rotational IL (RIL) [20,21] was also utilized to create novel damage-detection algorithms for bridge structure state evaluation.
Although numerous studies have been conducted on damage identification indicators based on influence lines such as deflection, strain, and rotation angle, there have been few studies conducted on structural damage indicators based on support reaction ILs [22]. Continuous beam bridges are the most common structural type of short and medium span bridges, and supports are critical components of continuous beam bridges. The reaction force of the bridge support contains both a static component generated by the bridge’s dead weight and a dynamic component induced by the moving vehicle load. The support reaction ILs may be calculated using the measured moving vehicle and the synchronized support reaction force response data, and it can indicate the change in reaction force generated by the unit vertical force. Smart Supports with real-time monitoring of reaction force may be processed in prefabricated factories to achieve full-cycle safety monitoring from bridge building to their operation. In comparison to the present difficult and costly long-span bridge structural health monitoring system, the simple and low-cost smart supports monitoring system has a better chance of being popularized and deployed on short- and medium-span bridges. Wang and Liu [23] suggested a damage-localization approach based on the DIILSR (Difference Index of Influence Line for Vertical Support Reaction), in which the damage position may be determined by comparing two DIILSR graphs before and after damage. Sun et al. [24] proposed a hybrid monitoring (HM) algorithm that combines the finite-element model (FEM) with the monitored data to extend these data from discrete points to the full structure to obtain the required data at any position. They used the modal frequency, reaction force influence line, displacement influence line, and strain influence line to generate the objective function to update the finite-element model. There are few relevant studies that successfully deal with measured noise interference, and experimental verification that the support reaction IL index is employed for continuous beam-damage diagnosis is lacking. Furthermore, the support reaction force IL and its derivatives of supports have varying sensitivity to damage at the same place in multi-span continuous beams. It is important to identify a way to eliminate noise interference during the derivation process of the change of the IL of the measured support reaction, as well as to fuse the ILs information from numerous sensors in order to properly find the damage. As a result, the critical issues of the continuous beam bridge damage diagnosis approach based on the support reaction ILs can be summarized as follows: (1) there should be a suitable theoretical foundation for determining whether or not the continuous beam bridge is damaged, as well as the location of the damage via the support reaction ILs; (2) How to assure its noise resistance and robustness while enhancing the support reaction ILs index’s sensitivity to damage.
This paper presents a novel damage localization approach of a continuous girder bridge by fusing noisy support reaction ILs. First, formula derivation establishes the relationship between the local damage of a two-span continuous beam and a support reaction ILs-based damage index. Then, to locate the damage, a cubic smooth spline curve was used to fit the measured IL polluted by noise, and the Dempster-Shafer (D-S) evidence theory was used to fuse the data of the multi-support reaction ILs. Preliminary study results from the verification of numerical simulation, laboratory aluminum beam test, and BRT continuous box girder bridge demonstrate that the support reaction IL has potential for development into a continuous girder bridge diagnosis technique.
2. Support Reaction IL—Based Damage Index
For simplicity, a two-span continuous beam is used to model the continuous girder bridge. Figure 1 depicts the two-span continuous beam model, where a single-span span is , and the cross-sectional bending stiffness is .
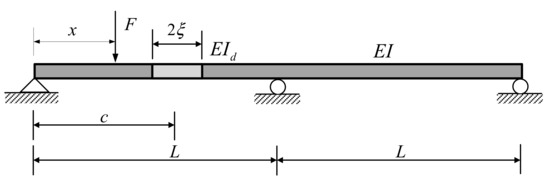
Figure 1.
Schematic diagram of a two-span continuous girder bridge.
The basic unknown force is used to replace the redundant constraint of the mid-span support. By imposing the boundary restriction such that the vertical displacement at the mid-span support is zero, the basic equation of the force technique may be determined:
in which is the vertical displacement of the unit force acting on the mid-span support of the basic structure, and denotes the vertical displacement of the mid-span support caused by the moving force .
The coefficients and in the fundamental equation of the force method can be generated via graph multiplication according to the principle of virtual work. As a result, in the non-destructive condition, the function of the support reaction IL is established as follows:
where is the non-destructive formulation of the support reaction IL, is the bridge direction coordinate, and is the continuous beam’s single span. The breadth of the damage, assuming the continuous beam is locally affected at , is . The parameter of the damage is defined, so that the section stiffness of the damage area is reduced to of the initial stiffness of the section. Therefore, the damage degree of this section can be expressed as:
Similarly, the coefficients and under the damage condition are calculated according to the graph multiplication. According to Equation (1), the theoretical expression of the support reaction IL of the middle support of the continuous beam of two spans in the damaged state can be obtained:
According to the above formula, the support reaction ILs before and after the damage are all cubic functions of the section of the moving load’s location , and have the characteristics of continuous smoothness. The support reaction IL in an undamaged state is symmetrical to the support’s position in the center of the span. When a continuous beam is destroyed, the function will abruptly alter near the damaged area, and the original symmetry will be lost. According to this characteristic of the support reaction IL, the change of the support reaction IL before and after damage is defined as the index of damage:
where the support reaction IL in the damaged and undamaged states are shown by and , respectively.
To increase the sensitivity of the influence line index to damage, the first and second derivatives of the influence line change are recommended as the damage index. To make the computation easier, the notion of finite element is used to discretize the continuous IL curve and to obtain the IL factor corresponding to each discrete point. The following formula can be used to estimate the first and second derivatives of the IL change.
where , , and indicate the change in the IL factor corresponding to the j-th discrete point, as well as the first and second derivatives of the change, respectively. The distance between two adjacent discrete points is represented by , while the number of discrete points is represented by .
3. Damage Localization Based on Measured Support Reaction ILs
3.1. Curve Fitting of the Support Reaction ILs Change Based on Cubic Spline Function
When localized damage occurs in a continuous beam, the curve of the second derivative of the change in the IL changes abruptly at the damaged point, which is plainly different from the non-damaged position. As a result, the damage location is identified in this work based on the abrupt peak value of the second derivative of the IL changes. However, owing to instrument error and interference from the external environment, a certain amount of noise interference will necessarily be included in the measured support reaction IL changes during the actual measurement procedure. The change in the measured support reaction IL may be represented as:
where denotes the measured IL change, and the real support reaction IL change is denoted by , while the error term owing to measurement noise and fitting error is denoted by .
The second derivative index of the support reaction IL change is more sensitive to noise. Even though the amplitude of the noise interference term is minor, the damage location impact of the second derivative index of the change in the support reaction IL will be considerably decreased if the measured change in the IL containing noise is not processed. As a result, if you wish to utilize the second derivative index of the change of the support reaction IL to detect the local damage of the continuous beam, it is necessary to successfully tackle the major problem of being overly sensitive to noise.
Before and after the damage, the support reaction IL change is a piecewise cubic function of the moving load position , with a smooth and continuous characteristic. As a result, this paper proposes to fit the measured support reaction influence line change with a cubic smooth spline curve, which is more in line with the smooth and continuous characteristics of the influence line change, in order to solve the problem of the damage index being too sensitive to noise. The fitted support reaction IL change is expressed as a cubic spline function:
where is a cubic function that fits the support reaction IL at the section, and is the number of segments. are the coefficients of the cubic term, quadratic term, initial term, and constant term of the section’s cubic function. At the nodes, the cubic spline function meets the following continuity condition:
Furthermore, the computation of the cubic spline function mentioned above necessitates the presence of boundary conditions at the two ends, which are often natural borders, fixed boundaries, and non-kink boundaries, and may be solved using the catch-up approach If the fit the change of the support reaction IL is directly fit with noise using the change of the cubic spline, it will result in over-fitting, which will lead to a considerable fluctuation in the fitted curve of the change of the IL. This does not reflect the current situation and is not helpful in identifying damage. To make the fitting curve smoother, a crude penalty component is added to the optimization function and turns it into the following form.
where stands for the argument of the minimum, represents the measured change in the IL, represents the fitted IL, represents the fitting function’s second derivative, and indicates the smoothing factor of the fitting function. Additionally, is the sum of the squares of the fitting error term, which is used to guarantee that the data fitting effect is accurate and denotes the roughness term, which is used to guarantee that the solution is smooth. When , is the straight line with the least squares that fits the support reaction IL. When , is the interpolation fitting of the support reaction IL’s natural cubic spline. As a result, the selection of the value is very critical. The fitting curve may be kept near to the original data and has good smooth properties if the value of is chosen suitably.
To calculate the smoothing factor, the statistical approach of generalized cross validation (GCV) is used [25]. The smoothing factor is determined by minimizing the following equation:
in which is the factor of the measured influence line change at , is the factor of the fitted influence line change at , is a smooth matrix that satisfies the condition, and is the trace of matrix , also known as the fitting degree of freedom.
After calculating the above equation to obtain the change of the fitted support reaction IL, Equation (7) is used to obtain the second derivative of the fitted IL change curve, and the damage location is identified based on the mutation range of the second derivative curve.
3.2. Damage Localization Based on Information Fusion of Multiple ILs
The support reaction IL index supplied by different support measuring locations has a varying sensitivity to damage for a multi-span continuous beam. Because of the presence of multiple unfavorable conditions such as test-environment interference and sensor-measurement inaccuracy, pinpointing the location of the injury must is limited when relying solely on a single sensor [26,27]. As a result, it is necessary to consider fusing the support reaction force information of multiple measurement points, fully utilizing the complementarity between the support reaction force information of multiple measurement points, enhancing the consistent damage information in the multi-source signal [28], and eliminating non-uniform noise information in order to precisely locate the damage to the continuous beam structure.
Information fusion technology can naturally blend the data from several position sensors to produce a more precise description of the status of the study item. The D-S evidence theory [29,30,31,32,33,34], Bayesian technique [26], and other commonly used ways of information fusion technology each have their unique properties. The D-S evidence theory offers certain benefits over other information fusion methodologies [35] as the theory does not necessitate preconditions such as conditional probability and prior probability, hence eliminating the assumption of an unknown probability distribution. As a result, the article D-S evidence theory was used to fuse multi-sensor data in order to pinpoint specific damage location.
The first step in applying D-S evidence theory to fuse information from multiple ILs for damage detection is to build an appropriate identification framework. Using a two-span continuous beam as an example, the entire beam was divided into detection regions, in which each detection area’s information is independent of the others, therefore the recognition frame may be stated as the following formula:
where stands for the position of the m-th detection area.
Following that, the mass function for each element in the discerning frame should be assigned depending on the sensor measurement information. Based on prior research, the second derivative index of the change in the support reaction IL is an excellent predictor of damage location, and the mass function is derived based on at the location . The vector of mass functions is as follows:
where
in which is the second derivative index based on the change in the IL of the i-th sensor’s support reaction at the location . If other factors are not taken into account, the peak of will occur at the structure’s damage position. As a result, the higher the value of , the greater the likelihood of harm to the position , and the higher the value of the mass function.
When the fusion of information between the various sensors is considered thoroughly, and the mass function corresponding to distinct detection zones is calculated, Equation (14) may be extended into the form of the following matrix.
where the subscript denotes the number of detection positions, represents the number of fused sensors. The coefficient of the mass function signifies the degree of conviction in the damage at the position based on the support reaction IL data from the i-th sensor. As a result, each row in the matrix represents the mass function of each detection area formed using information from a single sensor, and it fulfills the following formula.
According to the D-S evidence theory, the information from various sensors may be merged to increase the credibility of damage decision making. Thus, the mass function derived after fusing the information of sensors for the location is the following formula.
The likelihood of damage to each detection area may be calculated by fusing the monitoring information of sensors using Equation (18). The larger the comprehensive index , the more likely the detection area will be damaged.
3.3. Main Steps of Damage Localization Approach
This subsection summarizes the damage localization approach of a continuous beam bridge by fusing noisy support reaction ILs, and the associated flowchart is shown in Figure 2.
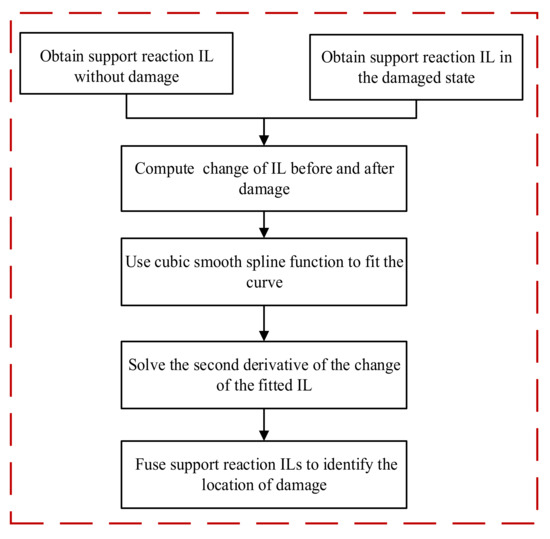
Figure 2.
Flow chart of the proposed damage localization method.
- Step 1: Use the measured data to compute the change of the IL of the support reaction before and after the damage;
- Step 2: Use the cubic smoothing spline function to solve the fitted curve of the change in the support reaction IL;
- Step 3: Use the central difference method to solve the second derivative of the fitted curve of the change in the support reaction IL;
- Step 4: Use Equation (18) to combine data from multiple sensors to provide a comprehensive index of the likelihood of each detection region.
4. Verification of the Proposed Damage Localization Method
In this section, a simple numerical study of a two-span continuous beam, a laboratory experimental study of a two-span aluminum beam, and a complicated numerical study of a continuous girder bridge in Xiamen have been carried out to verify the proposed method. Several hypothetical damage scenarios were introduced for validation, including single damage, double damages and multiple damages.
4.1. Case Study 1: Numerical Simulation of a Two-Span Continuous Beam
4.1.1. Model Introduction
For the numerical investigation, a two-span continuous beam was used, as illustrated in Figure 3. Assume that the continuous beam’s single-span span L = 10 m, the height , the width of the rectangular section, the material elastic modulus , and the material density are 2500 kg/m3. The plane beam element is utilized for modeling, and 200 beam elements are evenly distributed along the longitudinal direction of the beam, with a length of 0.1 m for each element. Under the self-weight of the continuous beam, the support in the middle of the span can bear the maximum load of approximately 125 kN. Assuming that the range of the sensor at the support is 500 kN, the moving unit force () is successively applied to the nodes of the beam element, and the shear force values at different support measurement locations are output. Then, the support reaction IL is obtained based on the balance of the static force at the measuring point condition.
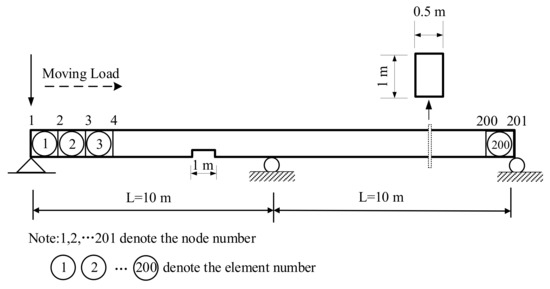
Figure 3.
The two-span continuous beam model.
Four damage scenarios shown in Figure 4 and Table 1 were stimulated. (1) In Cases S1 and S2, a local damaged square area with a width of 0.1 m and 20% reduction in flexural stiffness is defined. Among them, Case S1’s damage location is 1/4 of the left span, and Case S2’s damage location is 3/4 of the left span. (2) In Cases S3 and S4, two local damaged regions (the rectangle area with a width of 0.1 m) are defined. Two damages in Case S3 are located in the same span, while two damages in Case S4 are located in two spans. Among them, the center of Case S3’s damage area 1 is 4.5 m distant from the left support with a 30% reduction in flexural stiffness, while the center of damage area 2 is positioned at 3/4 of the left span with a 20% reduction in flexural stiffness. The center of Case S4′s damage region 1 is located at 3/4 of the left span and has a 20% loss in flexural stiffness, whereas the center of damage area 2 is located 16.5 m away from the left support and has a 30% reduction in flexural stiffness.
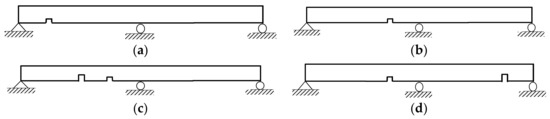
Figure 4.
Damage case scenarios: (a) Case S1; (b) Case S2; (c) Case S3; (d) Case S4.

Table 1.
Damage cases considered in the two-span continuous beam.
Random white noise is introduced to the signal of the support reaction IL before and after the damage to verify the robustness of the proposed damage detection technique, and the noise addition method is as follows:
where and are the measured ILs before and after the damage, respectively, is the support sensor’s comprehensive error, is the sensor range, and is a randomly distributed vector. The Gaussian white noise with a noise level of 5% was added to the support reaction IL change.
4.1.2. Single Damage Case
The damage Cases S1 and S2 were chosen to verify the viability of the damage locating technique under single damage conditions. To begin, add white noise to the IL to simulate the measured support reaction IL, and then calculate the support reaction IL change at the mid-span support measurement sites before and after the damage. Then, to curve-fit the change in the measured IL with noise, the cubic smoothing spline function is utilized. Finally, under the single damage scenario, the fitted support reaction IL change curve is illustrated in Figure 5.
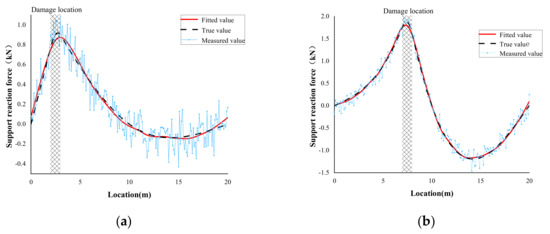
Figure 5.
IL change of single damage case: (a) Case S1; (b) Case S2.
As seen in the above images, although the measured support reaction IL change will fluctuate due to noise interference, there will still be an extreme value at the area of the damage. In addition, at a given noise level, because Case S1’s damage site is less sensitive to damage, the IL change was more strongly disturbed by noise, and the measured IL change had larger fluctuations. Because Case S2’s damage position is more sensitive to damage, the IL change was less influenced by noise, and the measured IL change fluctuation was reduced. Case S2’s fitted IL change curve is in good agreement with the real results in terms of shape and peak size, and the fitting effect was found to be better than that of Case S1. Based on the central difference method, the first derivative of the fitted IL change and the IL change under noise-free interference were calculated, and Figure 6 depicts the results.
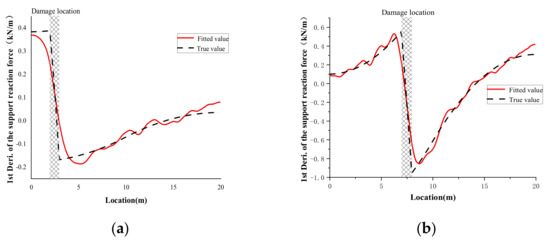
Figure 6.
First derivative of IL change of single damage case: (a) Case S1; (b) Case S2.
It can be seen from Figure 6 that the first derivative of the fitted IL change will have a transition from positive to negative in the damage area, and the range of the transition can correspond to the location of the damage. The central difference method was further applied to calculate the second derivative of the fitted IL change, and the resulting plot is shown in Figure 7.
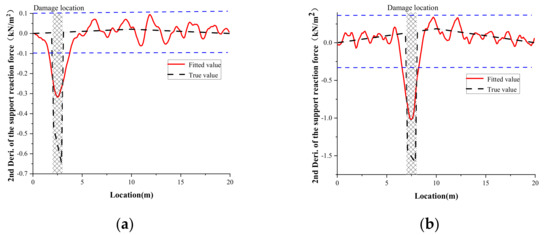
Figure 7.
Second derivative of IL change of single damage case: (a) Case S1; (b) Case S2.
Figure 7 shows that the second derivative of the fitted IL change fluctuates somewhat in the non-destructive area, while there are more noticeable abrupt fluctuations in the damaged area. Despite the disturbance caused by the noise (with amplitude less than the thresholds of in Figure 7a), one obvious peak at the damage location can be clearly identified. As a result, by finding the peak of the second derivative of the fitted IL change curve, the site of the damage may be determined. It can be observed that Case S2’s fitting curve was closer to the true result in terms of peak size and shape than Case S1, and the peak value in the damage region is more obvious.
To decrease the fluctuation in the non-destructive region and make damage localization more reliable, the information fusion technique was further applied to the IL information of the three support measuring sites. According to the proposed approach, curve fitting was also performed on the measured support reaction IL change with noise at the measuring locations on the left and right sides of the two-span continuous beam, and then the second derivative of the fitted IL change was obtained. The D-S evidence theory was then applied to fuse the IL information of the three support measurement locations in order to determine the location of the damage, with the following final identification findings.
Figure 8 shows that the fluctuation of the comprehensive index of the IL information of the three support measuring sites greatly decreased in the non-destructive region, but the abrupt change was more severe in the damaged area. Furthermore, following information fusion, the peak value of the Case S2’s comprehensive index in the damage region was found to be higher than the peak value of the Case S1’s comprehensive index in the damage region; additionally, the abrupt change in the comprehensive index of Case S2 matches better to the damage position. It indicates that variations in the sensitivity of the damage location will result in different recognition results.
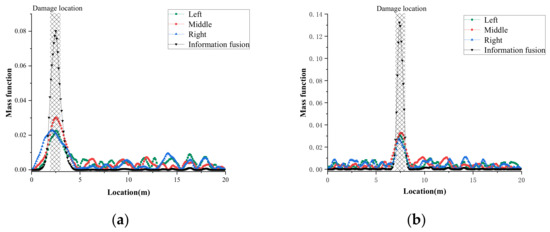
Figure 8.
Results of damage localization of single damage case: (a) Case S1; (b) Case S2.
4.1.3. Double Damage Case
The damage Cases S3 and S4 were then selected to test the feasibility of the damage locating approach under two damage conditions. Similarly, to imitate the actual measured IL, the corresponding level of white noise was added to the baseline IL, and the support reaction IL change of the mid-span support was determined. Based on the smoothing cubic spline function, the measured support reaction IL with noise was fitted. Finally, under two damage situations, the fitted support reaction IL change of the continuous beam mid-span support was derived (Figure 9).
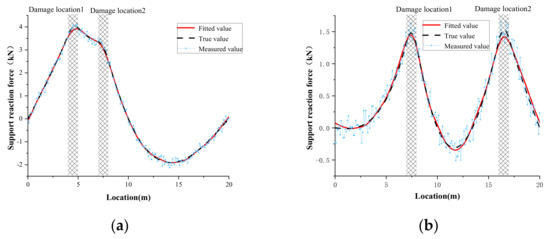
Figure 9.
IL change of double damage case: (a) Case S3; (b) Case S4.
A satisfactory fitting effect on the peak value and shape may still be obtained for the measured IL change curve under two damage situations. Figure 9a shows that when two damages exist on the same span, the support reaction IL change curve is clearly different from the single damage situation. When two damages occur on the same span, the true value curve in the damage area will have two vertex angles. The damage site will be overlooked if the harm location is simply determined based on the peak value of the IL change. When two damage areas exist in different spans, the support reaction IL change curve is comparable to the single damage condition, and there are evident peaks in the corresponding damage area. The second derivative of the fitted IL change under two damage situations was determined using the central difference method, and the results are shown in Figure 10.
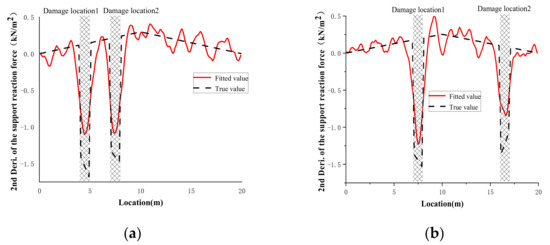
Figure 10.
Second derivative of IL change of double damage case: (a) Case S3; (b) Case S4.
It can be shown that under the situation with two damages, the second derivative of the fitted support reaction IL change curve shows noticeable abrupt changes in the corresponding damaged region, while the non-destructive area fluctuates less. The second derivative of the fitted IL change of the measurement points on the left and right sides was retrieved and integrated with the D-S evidence theory to fuse the IL information of the three measuring points, as illustrated in Figure 11.
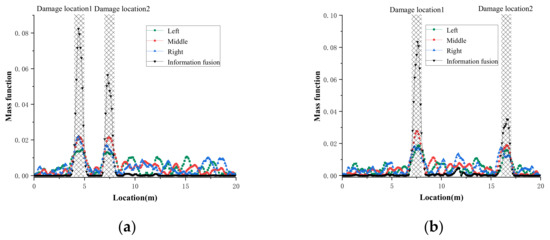
Figure 11.
Results of damage localization of double damage case: (a) Case S3; (b) Case S4.
The above figures indicate that independent of whether the two damages are placed on the same span or on two spans, the comprehensive index fusing the IL information of numerous sensors will have noticeable mutations in the damage region, allowing the damage site to be reliably detected. Therefore, the damage localization approach proposed in this study may still produce a satisfactory identification effect for a continuous beam with two damages.
4.2. Case Study 2: Laboratory Experiment of a Two-Span Aluminum Beam
4.2.1. Experiment Introduction
During the test, the noise interference was not always evenly distributed white noise. As a result, in this part, a laboratory experiment on a two-span aluminum beam was carried out to test the practicality of the suggested damage detection method. The beam’s material properties are as follows: Young’s Modulus , density . The two-span continuous aluminum beam has a length of 2.1 m, a section height of 0.012 m, and a width of 0.1 m. Pressure sensors were installed beneath the continuous beam’s three supports. The sensor model is DYLF-102, and it has a total accuracy of roughly 0.05% FS. Figure 12 shows the Experimental setup.
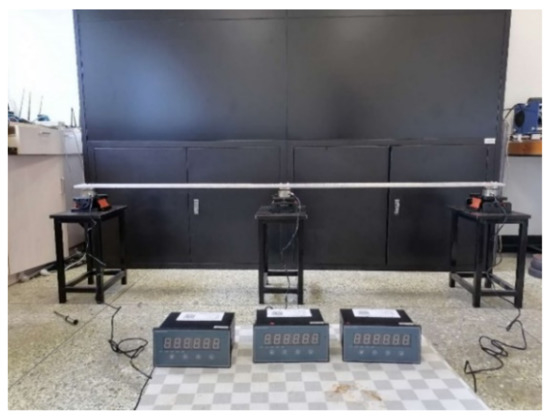
Figure 12.
Experimental setup.
The beam was separated into 40 parts, which were then numbered from left to right. The length of the unit at both ends of the beam was set to 10 cm, while the remaining units were set to 5 cm. A mass block with a weight of 99.5 N was used to apply static loads sequentially according to a certain interval to simulate the unit force of vertical movement. The loading start point is in the center of the No. 1 unit, the loading end point is in the center of the No. 40 unit, and the effective loading area is 2 m. Figure 13 depicts the test loading procedure.
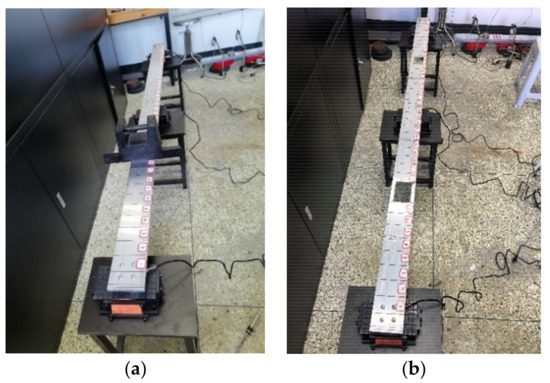
Figure 13.
Experimental beam: (a) Unit division and loading; (b) Experimental beam in damage state.
In the experiments, two damage scenarios were simulated (see Figure 13), as stated below:
- Single damage case: A single damage was introduced at 0.4–0.5 m from the section, with a moment of inertia reduction of 70% by making a hole.
- Double damage case: Afterwards, the second damage was introduced at 1.4–1.5 m from the section in a similar manner. The corresponding moment of inertia reduction was relatively smaller (60%).
4.2.2. Support Reaction Influence Line Indicator Calculation
First, by applying the moving mass to the intact beam, the corresponding support reaction ILs of the aforementioned three sensor locations was acquired. Then, to simulate the damage state, a hole was cut in the beam and the support reaction ILs were output to the corresponding sensors. The actual measured support reaction ILs before and after the damage are shown in Figure 14. The IL curves before and after damage are almost similar, especially when the sensor is far from the damage area. The degree of the damage () in the single damage case and double damage case described in this study is 0.7 and 0.6, respectively.
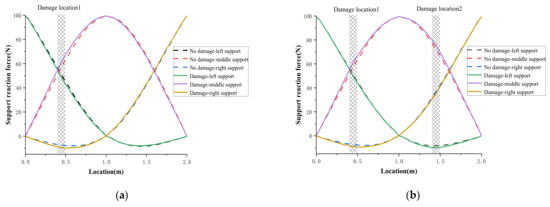
Figure 14.
ILs measured before and after: (a) Single damage case; (b) Double damage case.
Based on the measured ILs, the IL changes in both the single damage case and double damage case are shown in Figure 15. It can be found from Figure 15 that due to noise interference such as instrument errors and measurement errors during the measurement process, the measured support reaction IL change is not a smooth and continuous curve. The support reaction IL change curves of different measuring locations, however, revealed peaks at the damage position, and the IL change curve of the middle-span sensor was the most sensitive to damage, while the IL change curves of the left and right supports were very similar.
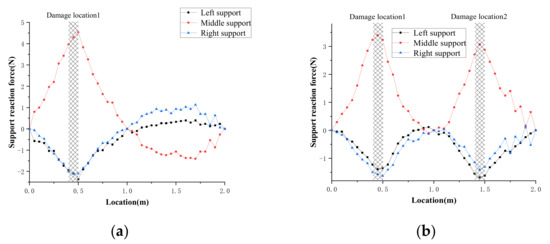
Figure 15.
IL changes in experimental beam: (a) Single damage case; (b) Double damage case.
4.2.3. Damage Location Results
For verification, in the single damage case, the measured support reaction IL change at the mid-span support was first selected. To decrease the interference of the measured noise, the cubic smoothing spline function was used to curve fit the measured IL change. The second derivative of the fitted IL change index was then solved using the central difference method. Figure 16 depicts the fitted IL changes curve and its second derivative curve in the experimental beam for the single-damage case.
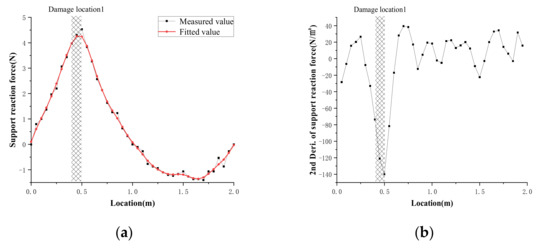
Figure 16.
IL index of mid-span support for single-damage case: (a) the fitted IL changes; (b) Second derivative of the fitted IL change.
When analyzing the data in Figure 16a, it is clear that the curve of the fitted support reaction IL can better conform to the measured findings from the overall shape, and has smooth and continuous features, which is more in accordance with the real situation. Further examination of Figure 16b reveals that the second derivative of the fitted IL change curve has a distinct abrupt shift in the region of the damaged area, which differs dramatically from the non-destructive area.
Similarly, the cubic smoothing spline function was used to curve-fit the measured support reaction IL change of the aluminum beam’s left and right sides, and the center difference method was utilized to calculate the second derivative of the fitted IL change, as illustrated in Figure 17. The second derivative of the fitted support reaction IL change curves at various measurement sites all exhibit distinct peaks around the damage position.
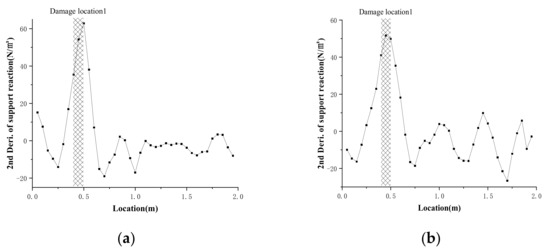
Figure 17.
Second derivative of the fitted IL change of the side support: (a) Left support; (b) Right support.
In the non-destructive area, however, the second derivative of the fitted IL change curve of each measurement point fluctuates substantially. As a result, determining the location of damage using only the IL information of a single sensor may result in errors. The D-S evidence theory was then employed to fuse the IL information from the three support measurement locations (see Figure 18).
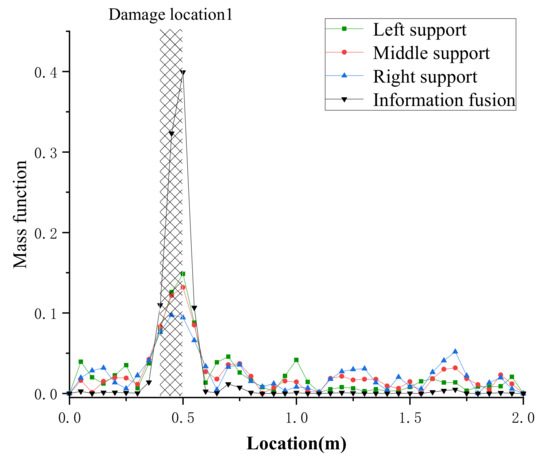
Figure 18.
Results of damage localization of single damage case.
After fusing the sensor information from the three measurement locations, the peak value of the comprehensive index at the damage place became more noticeable, and the fluctuation in the non-destructive region also greatly decreased. In comparison to the recognition result of single-sensor information, the integrated index resulting from the fusion of the three measurement locations’ IL information can more precisely identify the location of the damage.
In the Double damage case, the same method was applied to identify the damaged locations of the aluminum beam, and the final result is displayed in Figure 19. The comprehensive index after information fusion exhibits evident peaks at the two damage locations, and the fluctuation in the non-destructive area greatly decreased for the double damage case.
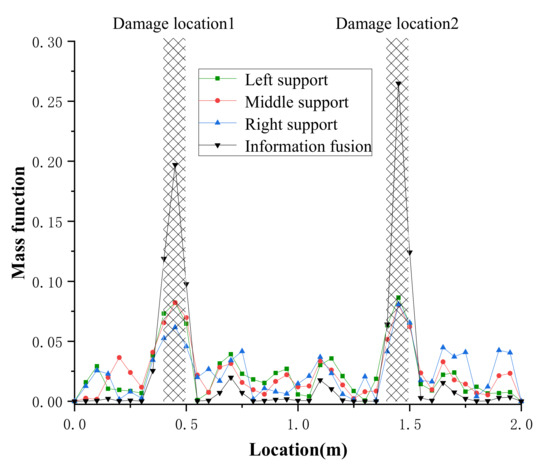
Figure 19.
Results of damage localization of double damage case.
4.3. Case Study 3: BRT Continuous Box Girder Bridge
4.3.1. Finite Element Model of the BRT Bridge
To verify the efficacy of the proposed method for damage localization, BRT, a three-span reinforced concrete continuous box girder bridge in Xiamen, was chosen for the case study. The box girder bridge is 1.8 m high and 10 m wide with a total length of 90 m (see Figure 20). The bridge’s top section is made of prestressed box girders, the bottom section is made of reinforced concrete column piers, and the middle is joined by plate rubber supports (as shown in Figure 21).
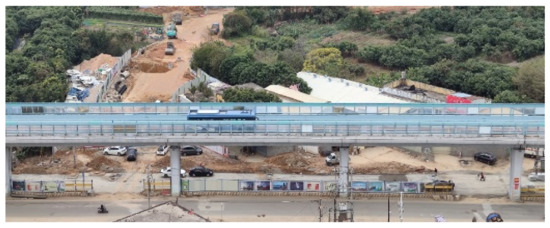
Figure 20.
Photo of the BRT Bridge.
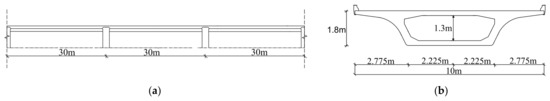
Figure 21.
Schematic drawing of the BRT Bridge: (a) Bridge layout; (b) Cross section.
Based on the design drawings of the Xiamen BRT bridge, a structural health monitoring (SHM)-oriented finite element model (FEM) of BRT was established. The bridge FEM model contains 4136 elements (SOLID65) and eight supports. The bridge’s material properties are as follows: concrete grade C50, Young’s Modulus , density , Poisson’s ratio . The schematic diagram of the model is shown in Figure 22.
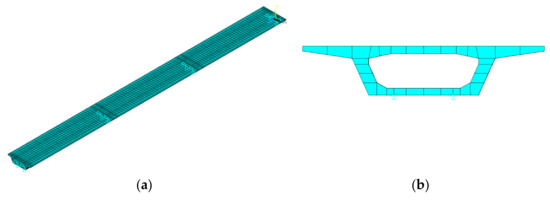
Figure 22.
FEM model of BRT: (a) Bridge layout; (b) Cross section.
In real structures, damage of continuous girder bridges is likely to occur in the areas of the top and bottom plates of the box girder. The support reaction IL change induced by local damage at various locations is also affected by the spatial effect of the box girder bridge. Furthermore, discrepancies in the output data may be caused by the discrepancy between the damage area and the spatial position of the detected vehicle. To test the feasibility of the proposed damage-identification method applied to a box girder bridge, two types of damage (top plate damage and bottom plate damage) were set up in this paper, and bridge damage was simulated by reducing the flexural stiffness of the elements in the corresponding damage area.
Two damage scenarios, in which one or multiple typical local bridge components suffer from serious damage, were assumed and are described in Table 2 and Figure 23. A specific amount of white noise was applied to the support reaction ILs before and after the damage to make the numerical simulation more realistic. The noise-addition approach is depicted in Equations (19) and (20). Assuming the detected vehicle weighs 600 kN, the complete accuracy of the pressure sensor at the pier support is FS, the range is and the magnitude of the simulated noise is about .
Table 2.
Damage cases considered in the BRT bridge.
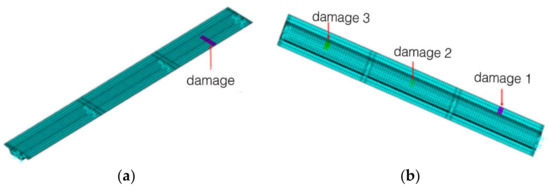
Figure 23.
Schematic diagram of BRT bridge damage: (a) Single damage case; (b) Multiple damage case.
4.3.2. Validation Results of Different Hypothetical Scenarios
In both single damage case and multiple damage case, the proposed damage localization method of continuous beam bridge by fusing noisy support reaction ILs was applied. First, the noise was added to the BRT bridge’s support reaction ILs, and then the IL changes were solved. Furthermore, to eliminate noise interference, the cubic smoothing spline function was employed to fit the change of the ILs, including noise. Finally, to generate the mass function index, the central-difference approach was used to calculate the second derivative of the fitted IL change, and then the D-S evidence theory was applied to fuse multiple-sensor data. The identification result is shown in Figure 24.
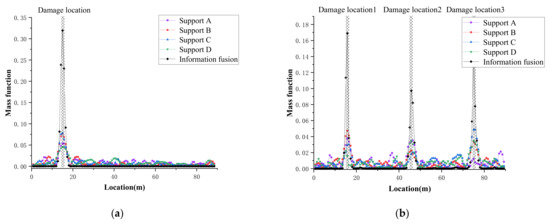
Figure 24.
Results of damage localization: (a) Single damage case; (b) Multiple damage case.
Regardless of a single damage case or a multiple damage case, the comprehensive index fusing multiple-sensor information will have obvious peaks at each damaged area, and the fluctuations in the non-destructive area will be significantly reduced. The results indicate that the proposed damage-localization method of a continuous beam bridge can achieve an excellent result and accurately identify the damage location.
5. Parameter Analysis
5.1. Effect of Damage Degree in Case Study 1
To investigate the relationship between the damage degrees and the support reaction IL index, a parametric analysis was applied to different levels of damage. Assuming that the damage location is located at the center of the left span, the damage width is 1 m. For damage degrees () of 10%, 20%, and 30%, the corresponding support reaction IL indicators (IL change, first derivative of IL change and second derivative of IL change) are calculated as shown in Figure 25.
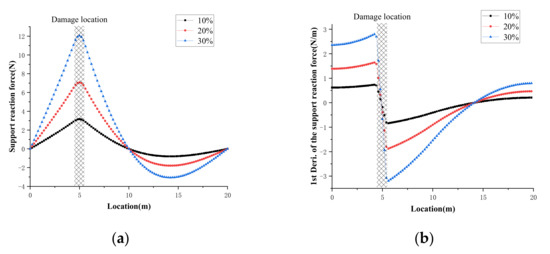
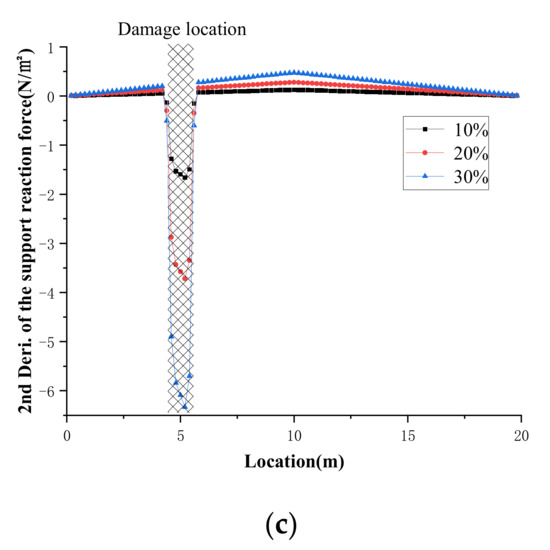
Figure 25.
The corresponding support reaction IL indicators: (a) IL change; (b) first derivative of IL change; (c) second derivative of IL change.
Figure 25a shows that the peak value of the IL change increases as the damage degree increases, and the peak value has a positive association with the damage degree, implying that the support response IL change has the capacity to quantify the damage degree. The transition from positive to negative in the first derivative of the IL change near the damage location can be seen in Figure 25b, and the region where the changeover occurs can better correlate to the damage location. Moreover, as the damage degree increases, the magnitude of the transition increases accordingly. The second derivative of the IL change is mutated at the damage location, the region where the mutation occurs corresponds exactly to the damage location, and the peak of the mutation grows with the degree of damage, as shown in Figure 25c.
5.2. Effect of Damage Degree in Case Study 3
A parameter analysis of the damage degree was also performed in Case Study 3 for the two damage cases. In single damage case, 25%, 45%, 65%, and 85% of various degrees of damage were simulated in the relevant damage position of the FEM, respectively, to investigate the link between damage degrees and the support reaction IL index of BRT bridges under various damage scenarios. Similarly, at the corresponding damage areas of the BRT FEM, 45%, 65%, and 85% of varying damage degrees were modulated, and the support reaction IL change before and after the damage was output.
As is shown in Figure 26a, the peak value of IL change corresponding to an 85% damage degree was approximately five times that of a 45% damage degree under the single damage scenario. It shows that the peak value of the IL changes increases with the degree of damage and is positively correlated with the degree of damage. The same conclusion can also be obtained under multiple damage conditions as shown in Figure 26b. The result indicates that the effectiveness of the damage localization depends on the damage degree.
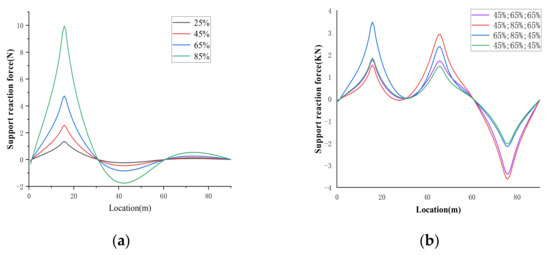
Figure 26.
The corresponding support reaction IL change: (a) Single damage case; (b) Multiple damage case.
6. Conclusions
This paper proposed a novel damage-localization approach of a continuous girder bridge based on support reaction ILs.
- The relationship between the local damage of a continuous beam and support reaction IL change has been established by formula derivation, which provides a theoretical basis for the damage location of the support reaction IL-based damage index.
- It was observed that the support reaction IL-based damage index has strong noise resistance and robustness due to the use of a cubic smooth spline curve to fit the IL polluted by noise and D-S evidence theory to fuse the data of the multi-support reaction ILs.
The effectiveness of the proposed approach was verified through three case studies, numerically and experimentally.
- The detection performance of numerical cases demonstrates that the usage of a cubic smoothing spline function to fit the change of the measured support reaction IL can get a result closer to the true value, successfully resolving the problem of the second derivative index of the IL change being sensitive to noise.
- In addition, the application of D-S evidence theory to fuse the ILs information of multiple measuring locations in order to construct the mass function can effectively reduce the interference of inconsistent information, thereby identifying the location of damages in continuous girder bridges accurately.
- Different from the damage index that is sensitive to local damage (e.g., stress influence line), the support-reaction influence line is a more global index, which is less sensitive but has a wider detectable range.
The experimental results demonstrate the proposed method, in which the support reaction ILs-based damage index is adopted, is promising in practical application.
Author Contributions
Conceptualization, Q.C. and X.R.; methodology, Q.C.; software, Y.W.; validation, Q.C., X.R. and Y.W.; formal analysis, Y.W.; investigation, Q.C.; resources, Y.W.; data curation, X.R.; writing—original draft preparation, X.R.; writing—review and editing, X.R.; visualization, Q.C.; supervision, Z.C.; project administration, X.R.; funding acquisition, Z.C. All authors have read and agreed to the published version of the manuscript.
Funding
This research was funded by National Natural Science Foundation of China, grant number NSFC-51778550.
Institutional Review Board Statement
Not applicable.
Informed Consent Statement
Not applicable.
Data Availability Statement
Not applicable.
Acknowledgments
The authors wish to acknowledge the financial support from the National Natural Science Foundation of China (NSFC-51778550). Any opinions and concluding remarks presented in this paper are entirely those of the authors.
Conflicts of Interest
The authors declare no conflict of interest.
References
- Banan, M.R.; Mehdi-Pour, Y. Detection and assessment of damage in 2D structures using measured modal response. J. Sound Vib. 2007, 306, 803–817. [Google Scholar] [CrossRef]
- Hu, M.-H.; Tu, S.-T.; Xuan, F.-Z.; Xia, C.-M.; Shao, H.-H. Strain energy numerical technique for structural damage detection. Appl. Math. Comput. 2012, 219, 2424–2431. [Google Scholar] [CrossRef]
- Chen, Z.-W.; Zhu, S.; Xu, Y.-L.; Li, Q.; Cai, Q.-L. Damage detection in long suspension bridges using stress influence lines. J. Bridge Eng. 2015, 20, 05014013. [Google Scholar] [CrossRef]
- Narkis, Y. Identification of crack location in vibrating simply supported beams. J. Sound Vib. 1994, 172, 549–558. [Google Scholar] [CrossRef]
- Cawley, P.; Adams, R.D. The location of defects in structures from measurements of natural frequencies. J. Strain Anal. Eng. Des. 1979, 14, 49–57. [Google Scholar] [CrossRef]
- Khiem, N.; Lien, T. Multi-crack detection for beam by the natural frequencies. J. Sound Vib. 2004, 273, 175–184. [Google Scholar] [CrossRef]
- He, W.-Y.; Zhu, S. Moving load-induced response of damaged beam and its application in damage localization. J. Vib. Control. 2016, 22, 3601–3617. [Google Scholar] [CrossRef]
- Pandey, A.; Biswas, M.; Samman, M. Damage detection from changes in curvature mode shapes. J. Sound Vib. 1991, 145, 321–332. [Google Scholar] [CrossRef]
- Stubbs, N.; Kim, J.-T. Damage localization in structures without baseline modal parameters. AIAA J. 1996, 34, 1644–1649. [Google Scholar] [CrossRef]
- Wang, J.; Qiao, P. On irregularity-based damage detection method for cracked beams. Int. J. Solids Struct. 2008, 45, 688–704. [Google Scholar] [CrossRef] [Green Version]
- Faverjon, B.; Sinou, J.-J. Robust damage assessment of multiple cracks based on the frequency response function and the Constitutive Relation Error updating method. J. Sound Vib. 2008, 312, 821–837. [Google Scholar] [CrossRef] [Green Version]
- Liu, X.; Lieven, N.; Escamilla-Ambrosio, P.J. Frequency response function shape-based methods for structural damage localisation. Mech. Syst. Signal Process. 2009, 23, 1243–1259. [Google Scholar] [CrossRef]
- Shi, Z.; Law, S.; Zhang, L. Structural damage localization from modal strain energy change. J. Sound Vib. 1998, 218, 825–844. [Google Scholar] [CrossRef]
- Zheng, X.; Yang, D.-H.; Yi, T.-H.; Li, H.-N. Development of bridge influence line identification methods based on direct measurement data: A comprehensive review and comparison. Eng. Struct. 2019, 198, 109539. [Google Scholar] [CrossRef]
- Chen, Z.-W.; Zhao, L.; Zhang, J.; Cai, Q.-L.; Li, J.; Zhu, S. Damage quantification of beam structures using deflection influence line changes and sparse regularization. Adv. Struct. Eng. 2021, 24, 1997–2010. [Google Scholar] [CrossRef]
- Wang, N.-B.; Ren, W.-X.; Huang, T.-L. Baseline-free damage detection method for beam structures based on an actual influence line. Smart Struct. Syst. 2019, 24, 475–490. [Google Scholar]
- Liu, Y.; Zhang, S. Damage localization of beam bridges using quasi-static strain influence lines based on the BOTDA technique. Sensors 2018, 18, 4446. [Google Scholar] [CrossRef] [Green Version]
- Zaurin, R.; Necati Catbas, F. Structural health monitoring using video stream, influence lines, and statistical analysis. Struct. Health Monit. 2011, 10, 309–332. [Google Scholar] [CrossRef]
- Chen, Z.W.; Cai, Q.L.; Zhu, S. Damage quantification of beam structures using deflection influence lines. Struct. Control. Health Monit. 2018, 25, e2242. [Google Scholar] [CrossRef]
- Alamdari, M.M.; Kildashti, K.; Samali, B.; Goudarzi, H.V. Damage diagnosis in bridge structures using rotation influence line: Validation on a cable-stayed bridge. Eng. Struct. 2019, 185, 1–14. [Google Scholar] [CrossRef]
- Huseynov, F.; Kim, C.; Obrien, E.J.; Brownjohn, J.; Hester, D.; Chang, K. Bridge damage detection using rotation measurements–Experimental validation. Mech. Syst. Signal Processing 2020, 135, 106380. [Google Scholar] [CrossRef]
- Zheng, X.; Yi, T.-H.; Yang, D.-H.; Li, H.-N. Stiffness Estimation of Girder Bridges Using Influence Lines Identified from Vehicle-Induced Structural Responses. J. Eng. Mech. 2021, 147, 04021042. [Google Scholar] [CrossRef]
- Wang, Y.; Liu, X. Damage Localization Method Using Vertical Support Reaction Data for Real-world Continuous Bridge. In Sustainable Development of Critical Infrastructure; ASCE: Reston, VA, USA, 2014; pp. 447–454. [Google Scholar]
- Sun, L.; Li, Y.; Zhang, W. Experimental Study on Continuous Bridge-Deflection Estimation through Inclination and Strain. J. Bridge Eng. 2020, 25, 04020020. [Google Scholar] [CrossRef]
- de Boor, C. Spline Models for Observational Data; Wahba, G., Ed.; SIAM: Philadelphia, PA, USA, 1990. [Google Scholar]
- Basir, O.; Yuan, X. Engine fault diagnosis based on multi-sensor information fusion using Dempster–Shafer evidence theory. Inf. Fusion 2007, 8, 379–386. [Google Scholar] [CrossRef]
- Jiang, S.-F.; Zhang, C.-M.; Zhang, S. Two-stage structural damage detection using fuzzy neural networks and data fusion techniques. Expert Syst. Appl. 2011, 38, 511–519. [Google Scholar] [CrossRef]
- Guo, H.; Zhang, L. A weighted balance evidence theory for structural multiple damage localization. Comput. Methods Appl. Mech. Eng. 2006, 195, 6225–6238. [Google Scholar] [CrossRef]
- Yager, R.R. On the Dempster-Shafer framework and new combination rules. Inf. Sci. 1987, 41, 93–137. [Google Scholar] [CrossRef]
- Dempster, A.P. Upper and lower probabilities induced by a multivalued mapping. In Classic Works of the Dempster-Shafer Theory of Belief Functions; Springer: Berlin/Heidelberg, Germany, 2008; pp. 57–72. [Google Scholar]
- Schocken, S.; Hummel, R.A. On the use of the Dempster Shafer model in information indexing and retrieval applications. Int. J. Man-Mach. Stud. 1993, 39, 843–879. [Google Scholar] [CrossRef] [Green Version]
- Yager, R.R. Dempster–Shafer belief structures with interval valued focal weights. Int. J. Intell. Syst. 2001, 16, 497–512. [Google Scholar] [CrossRef]
- Yang, B.-S.; Kim, K.J. Application of Dempster–Shafer theory in fault diagnosis of induction motors using vibration and current signals. Mech. Syst. Signal Process. 2006, 20, 403–420. [Google Scholar] [CrossRef]
- Banerjee, T.P.; Das, S. Multi-sensor data fusion using support vector machine for motor fault detection. Inf. Sci. 2012, 217, 96–107. [Google Scholar] [CrossRef]
- Guo, H. Structural damage detection using information fusion technique. Mech. Syst. Signal Process. 2006, 20, 1173–1188. [Google Scholar] [CrossRef]
Publisher’s Note: MDPI stays neutral with regard to jurisdictional claims in published maps and institutional affiliations. |
© 2022 by the authors. Licensee MDPI, Basel, Switzerland. This article is an open access article distributed under the terms and conditions of the Creative Commons Attribution (CC BY) license (https://creativecommons.org/licenses/by/4.0/).