Article

Method for Ranking Pulse-like Ground Motions According to Damage Potential for Reinforced Concrete Frame Structures

1
State Key Laboratory of Precision Blasting, Jianghan University, Wuhan 430056, China
2
Hubei Key Laboratory of Blasting Engineering, Jianghan University, Wuhan 430056, China
3
Key Laboratory of Earthquake Engineering and Engineering Vibration, Institute of Engineering Mechanics, China Earthquake Administration, Harbin 150080, China
*
Author to whom correspondence should be addressed.
Buildings 2022, 12(6), 754; https://doi.org/10.3390/buildings12060754
Submission received: 10 April 2022 / Revised: 20 April 2022 / Accepted: 22 April 2022 / Published: 1 June 2022
(This article belongs to the Special Issue Structural Health Monitoring)

Abstract

:
To rank the pulse-like ground motions based on the damage potential to different structures, the internal relationship between the damage potential of pulse-like ground motions and engineering demand parameters (EDPs) is analyzed in this paper. First, a total of 240 pulse-like ground motions from the NGA-West2 database and 16 intensity measures (IMs) are selected. Moreover, four reinforced concrete frame structures with significantly different natural vibration periods are established for dynamic analysis. Second, the efficiency and sufficiency of the IMs of ground motion are analyzed, and the IMs that can be used to efficiently and sufficiently evaluate the EDPs are obtained. Then, based on the calculation results, the principal component analysis (PCA) method is employed to obtain a comprehensive IM for characterizing the damage potential of pulse-like ground motions for specific building structures and EDPs. Finally, the pulse-like ground motions are ranked based on the selected IM and the comprehensive IM for four structures and three EDPs. The results imply that the proposed method can be used to efficiently and sufficiently characterize the damage potential of pulse-like ground motions for building structures.

1. Introduction

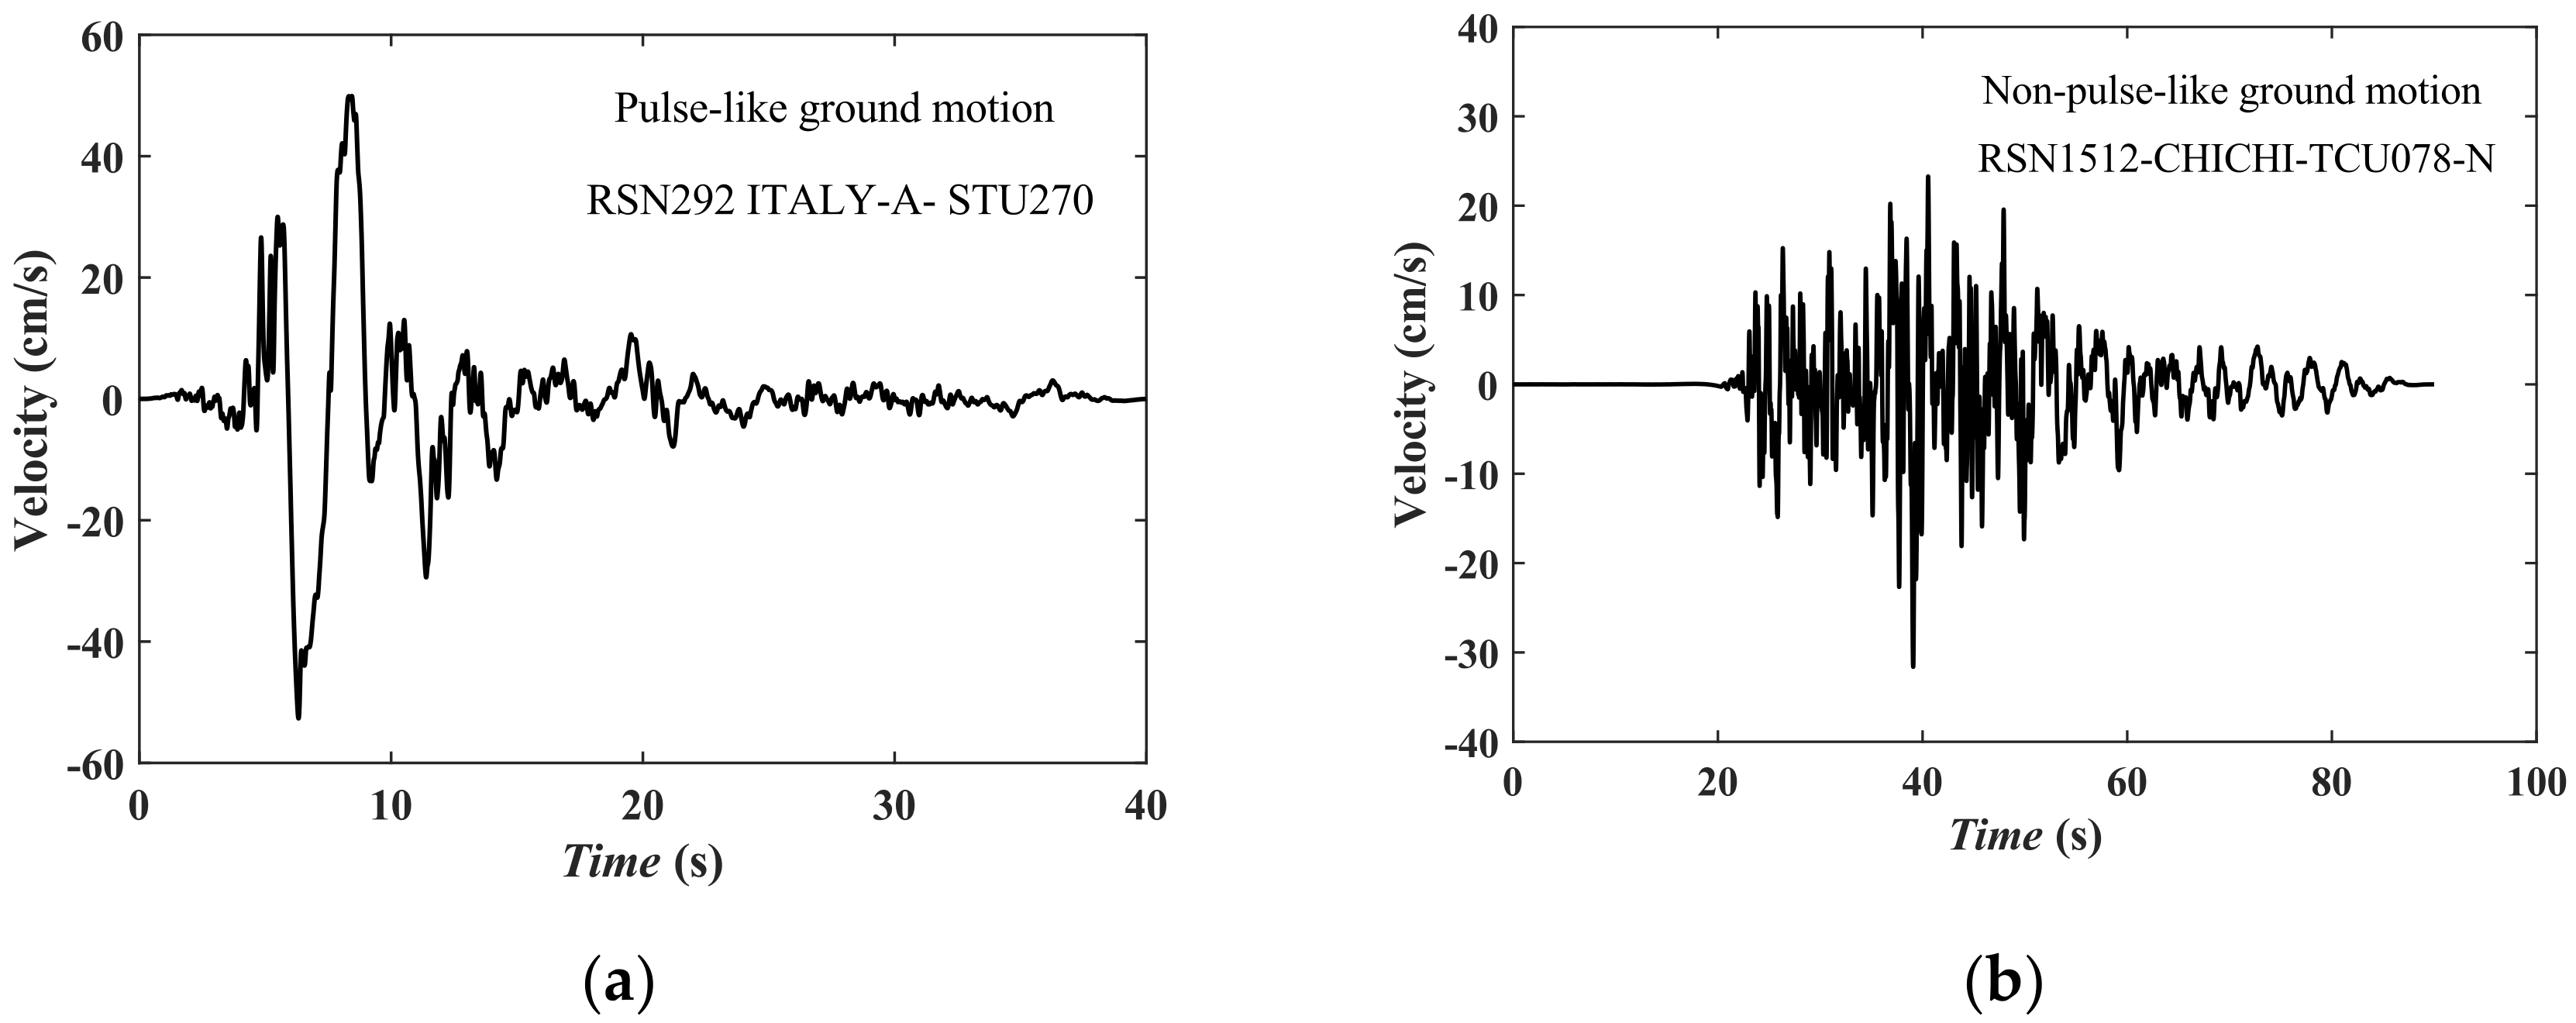
Ground motion damage to building structures is of two types: (1) cumulative damage, which occurs due to ground motion at medium and faraway sites; (2) instantaneous damage, which primarily occurs due to the destructive pulse-like ground motion. The mechanisms of the two types of ground motion damage are different. The damage potential of pulse-like ground motions for building structures is more significant compared with that of ordinary ground motions [1,2,3,4]. Therefore, the damage potential of pulse-like ground motions must be accurately evaluated for the seismic design of building structures. To estimate the damage potential of ground motions for building structures, two intermediate variables are introduced—one represents structural performance and the other represents ground motion characteristics [5,6,7,8]. An intensity measure (IM) that has a strong correlation with the appropriate engineering demand parameter (EDP) must be selected. However, several IMs can be used to predict structural responses by establishing a seismic demand model between IMs and EDPs [3,9,10]. Yazdani and Yazdannejad [11] noted that the uncertainties associated with the seismic demand model are related to uncertainties associated with ground motions.
A few studies have focused on commonly used IMs such as peak ground acceleration (PGA), peak ground velocity (PGV), peak ground displacement (PGD), Arias intensity (AI), specific energy density (SED), and cumulative absolute velocity (CAV) [12]. However, these IMs are based only on ground motion characteristics, and the uncertainties associated with structural performance are not considered. The more ground motion information and structural information an IM contains, the better the correlation with EDPs is. Compared with the aforementioned IMs, the first-order spectral acceleration (Sa (T1)) is the most extensively used IM in seismic risk analysis and structural seismic analysis [13,14,15,16,17,18,19]. Sa (T1) presents a high degree of correlation with the EDPs of structures with small natural vibration periods. However, several studies [20,21] have discovered that there is a low degree of correlation between the Sa (T1) and EDPs of super-high-rise buildings. To this end, some experts have selected relative displacement (Sd (T1)) or input energy (Ei (T1)) as the IMs for predicting structural responses [18,22]. A few studies have focused on achieving discreteness in vector IMs and EDPs [23,24]; the discreteness achieved in vector IMs and EDPs is smaller than that in scalar IMs. However, vector IMs are complex and thus not conducive to practical engineering applications. To avoid the complexities associated with the use of vector IMs, scalar IMs can be used instead, especially when the same capacity for predicting EDPs can be achieved using scalar IMs [25,26].
Significant uncertainties are prevalently associated with structural performance. However, in some studies, only a few similar structures have been comprehensively analyzed via non-linear time-history analysis [9,20,26,27]; the results obtained in this direction are consistent. Ebrahimian [9] analyzed the prediction capacities of different IMs for the structural responses of four-story and six-story isolated structures, which were subjected to pulse-like ground motions and ordinary ground motion. The results implied that the vector IMs related to Sa (T1) could be used to predict structural responses more efficiently and sufficiently. Dávalos and Miranda [26] analyzed the efficiency and sufficiency of FIV3 in predicting the structural responses of a four-story reinforced concrete (RC) frame. The results indicated that the novel FIV3 is a promising parameter that can be used for assessing structural collapse risks. Furthermore, some researchers have investigated the correlation between the IMs and structural responses of different structures. Palanci [28] analyzed the correlation between the average values of spectral displacement over different periods via the SDOF system involving different hysteretic models. However, in this study, the correlation between different IMs and the average values of EDPs of different structures is investigated to determine the prediction capacities of IMs, without considering the uncertainties associated with the structures. Note that the correlations between the EDPs and different IMs are significantly different for structures with different natural vibration periods [29,30,31]. Yakhachalian and Ghodrati [29] analyzed the discreteness of IMs and EDPs for low- and middle-rise structures via the strip method. The vector IM (Sa (T1), Sa (T1)/PGV) is proposed as an optimal IM for predicting the maximum inter-story drift ratio (MIDR) for low- and middle-rise RC moment-resisting frame structures.
However, the aforementioned studies have only verified the prediction capacity of the selected IMs for different structures; meanwhile, few studies have used the obtained IMs to further analyze ground motion characteristics. The damage potential of ground motions for building structures can be determined based on different IMs. Notably, ground motions, especially pulse-like ground motions, have not been ranked based on the optimal IMs in the aforementioned studies. In this study, pulse-like ground motions are ranked based on their damage potential for different RC frame structures.

2. Technical Framework

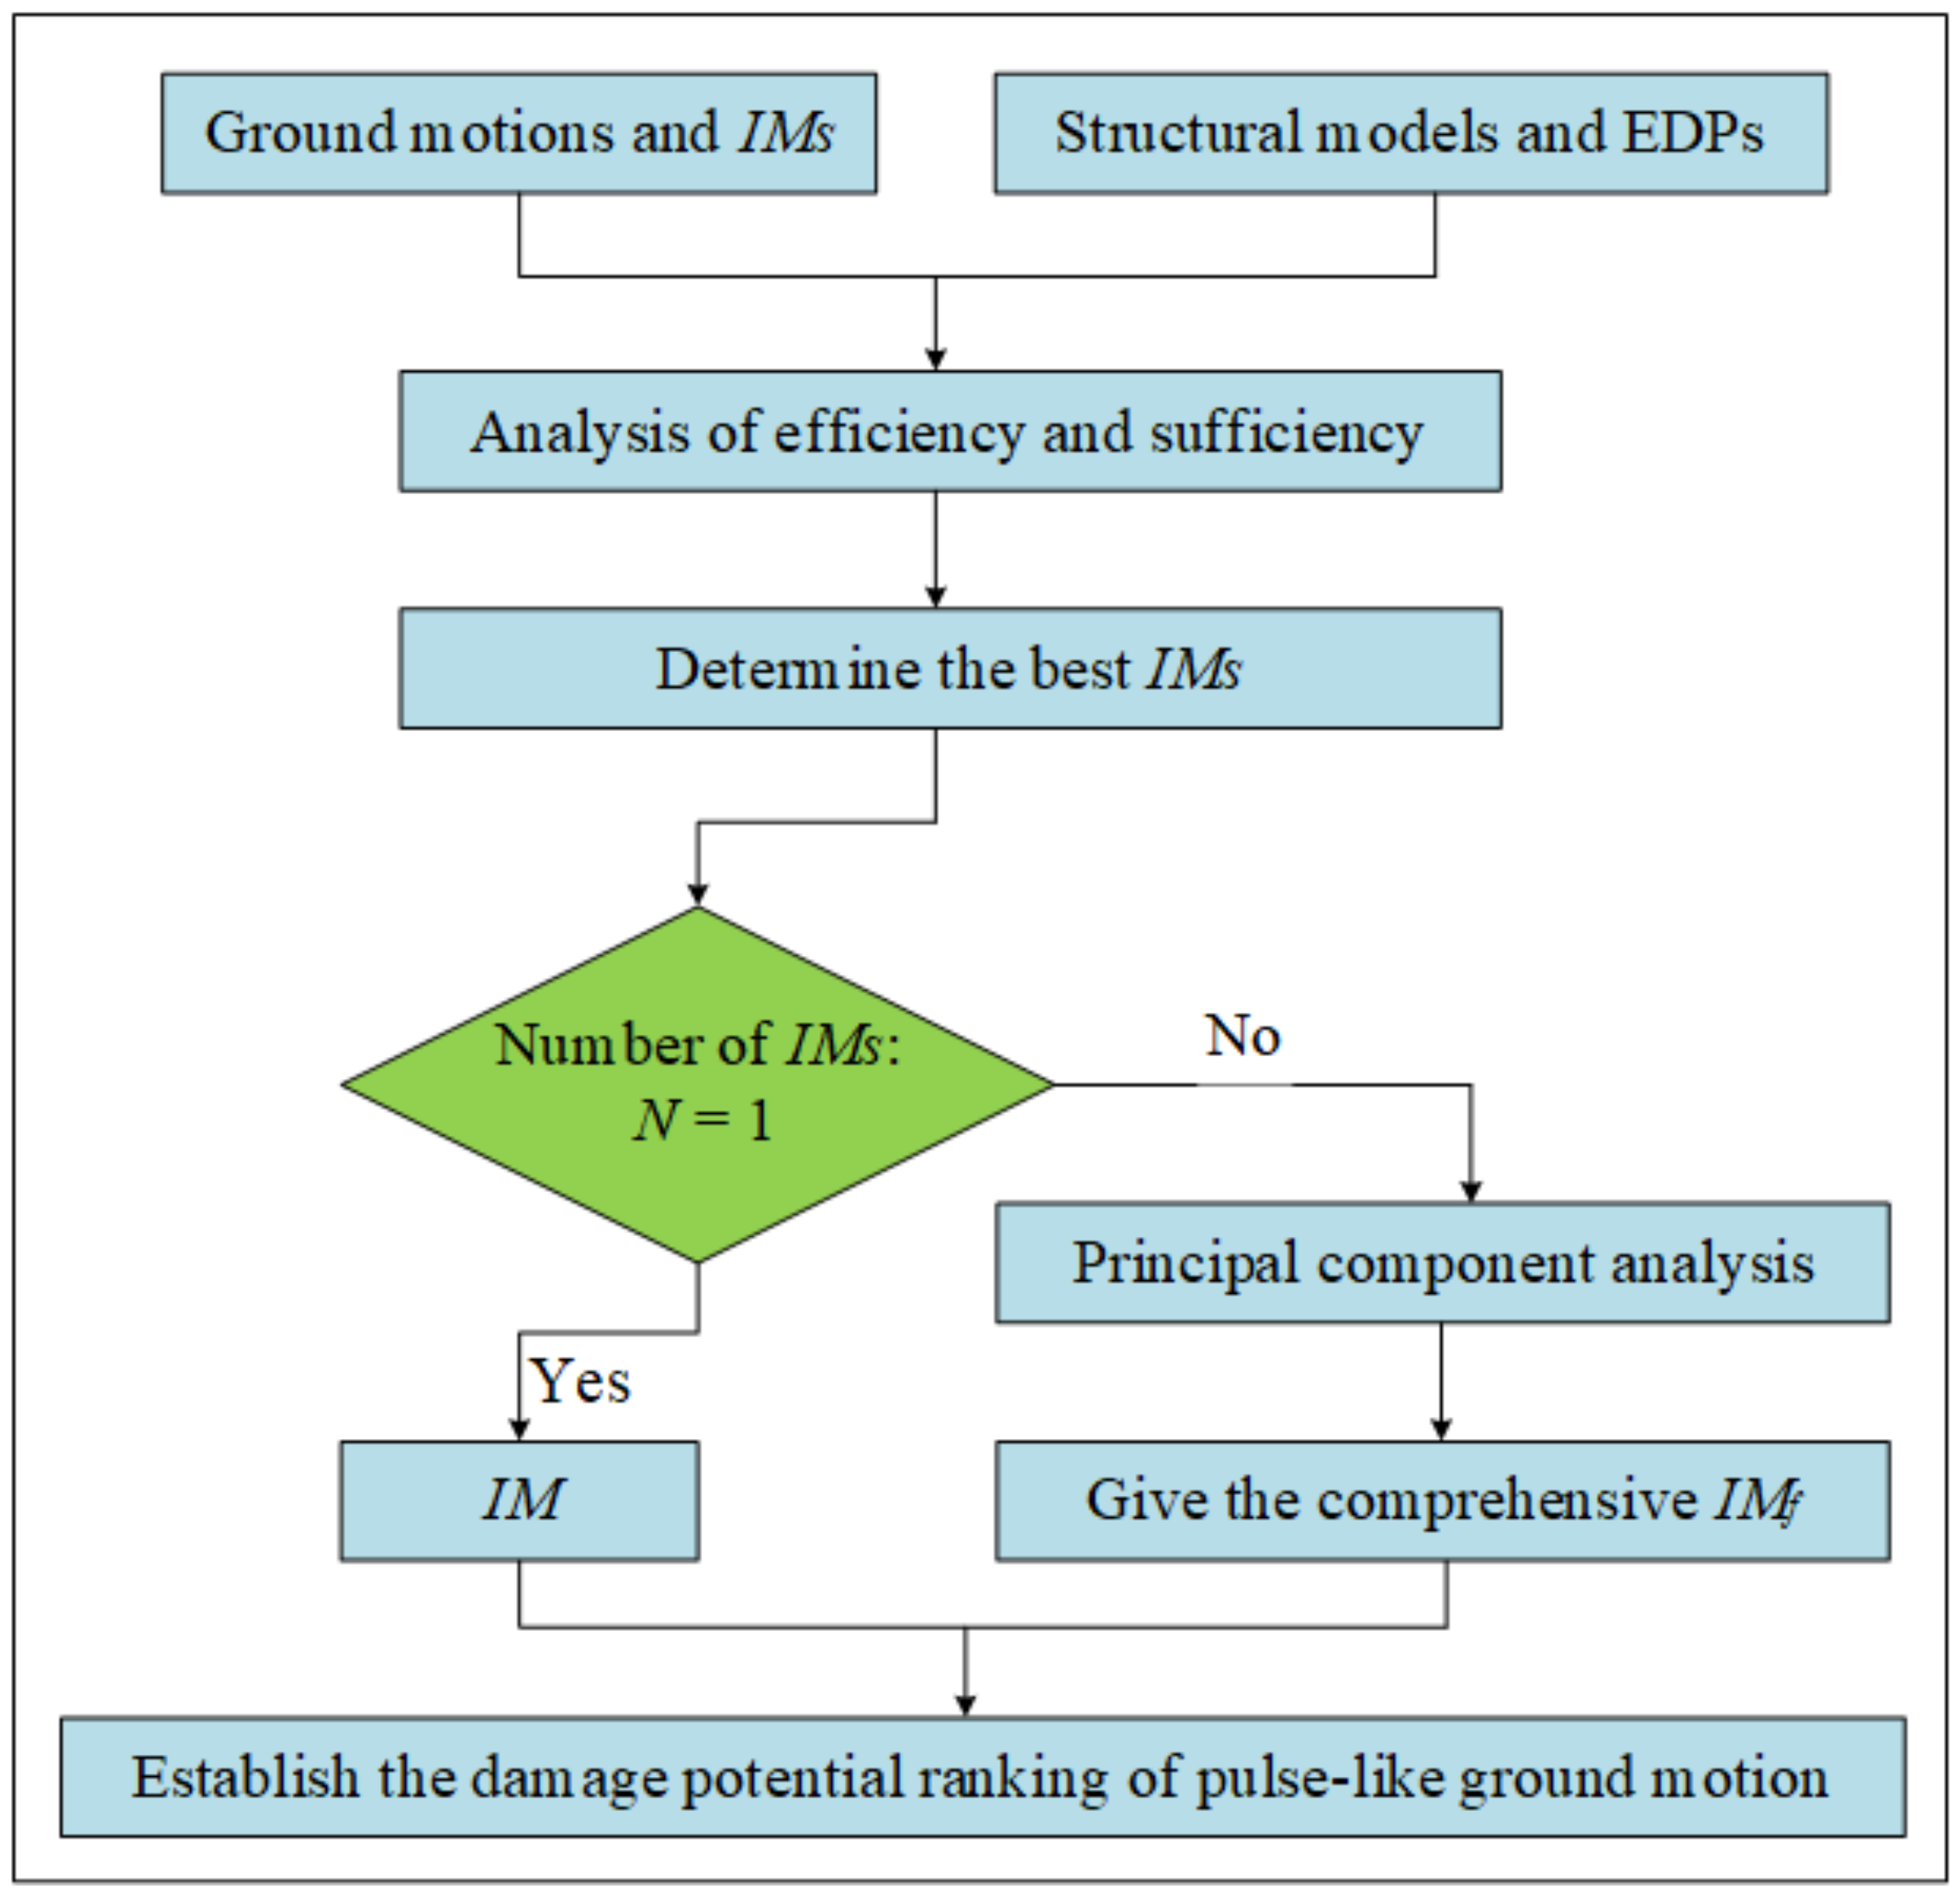
To rank the ground motions in predicting EDPs based on the damage potential, a method is proposed for ranking pulse-like ground motions according to their damage potential in this study; the method involves predicting EDPs based on ground motion IMs. The uncertainties associated with both ground motions and building structures are considered in the proposed method. The 16 selected 
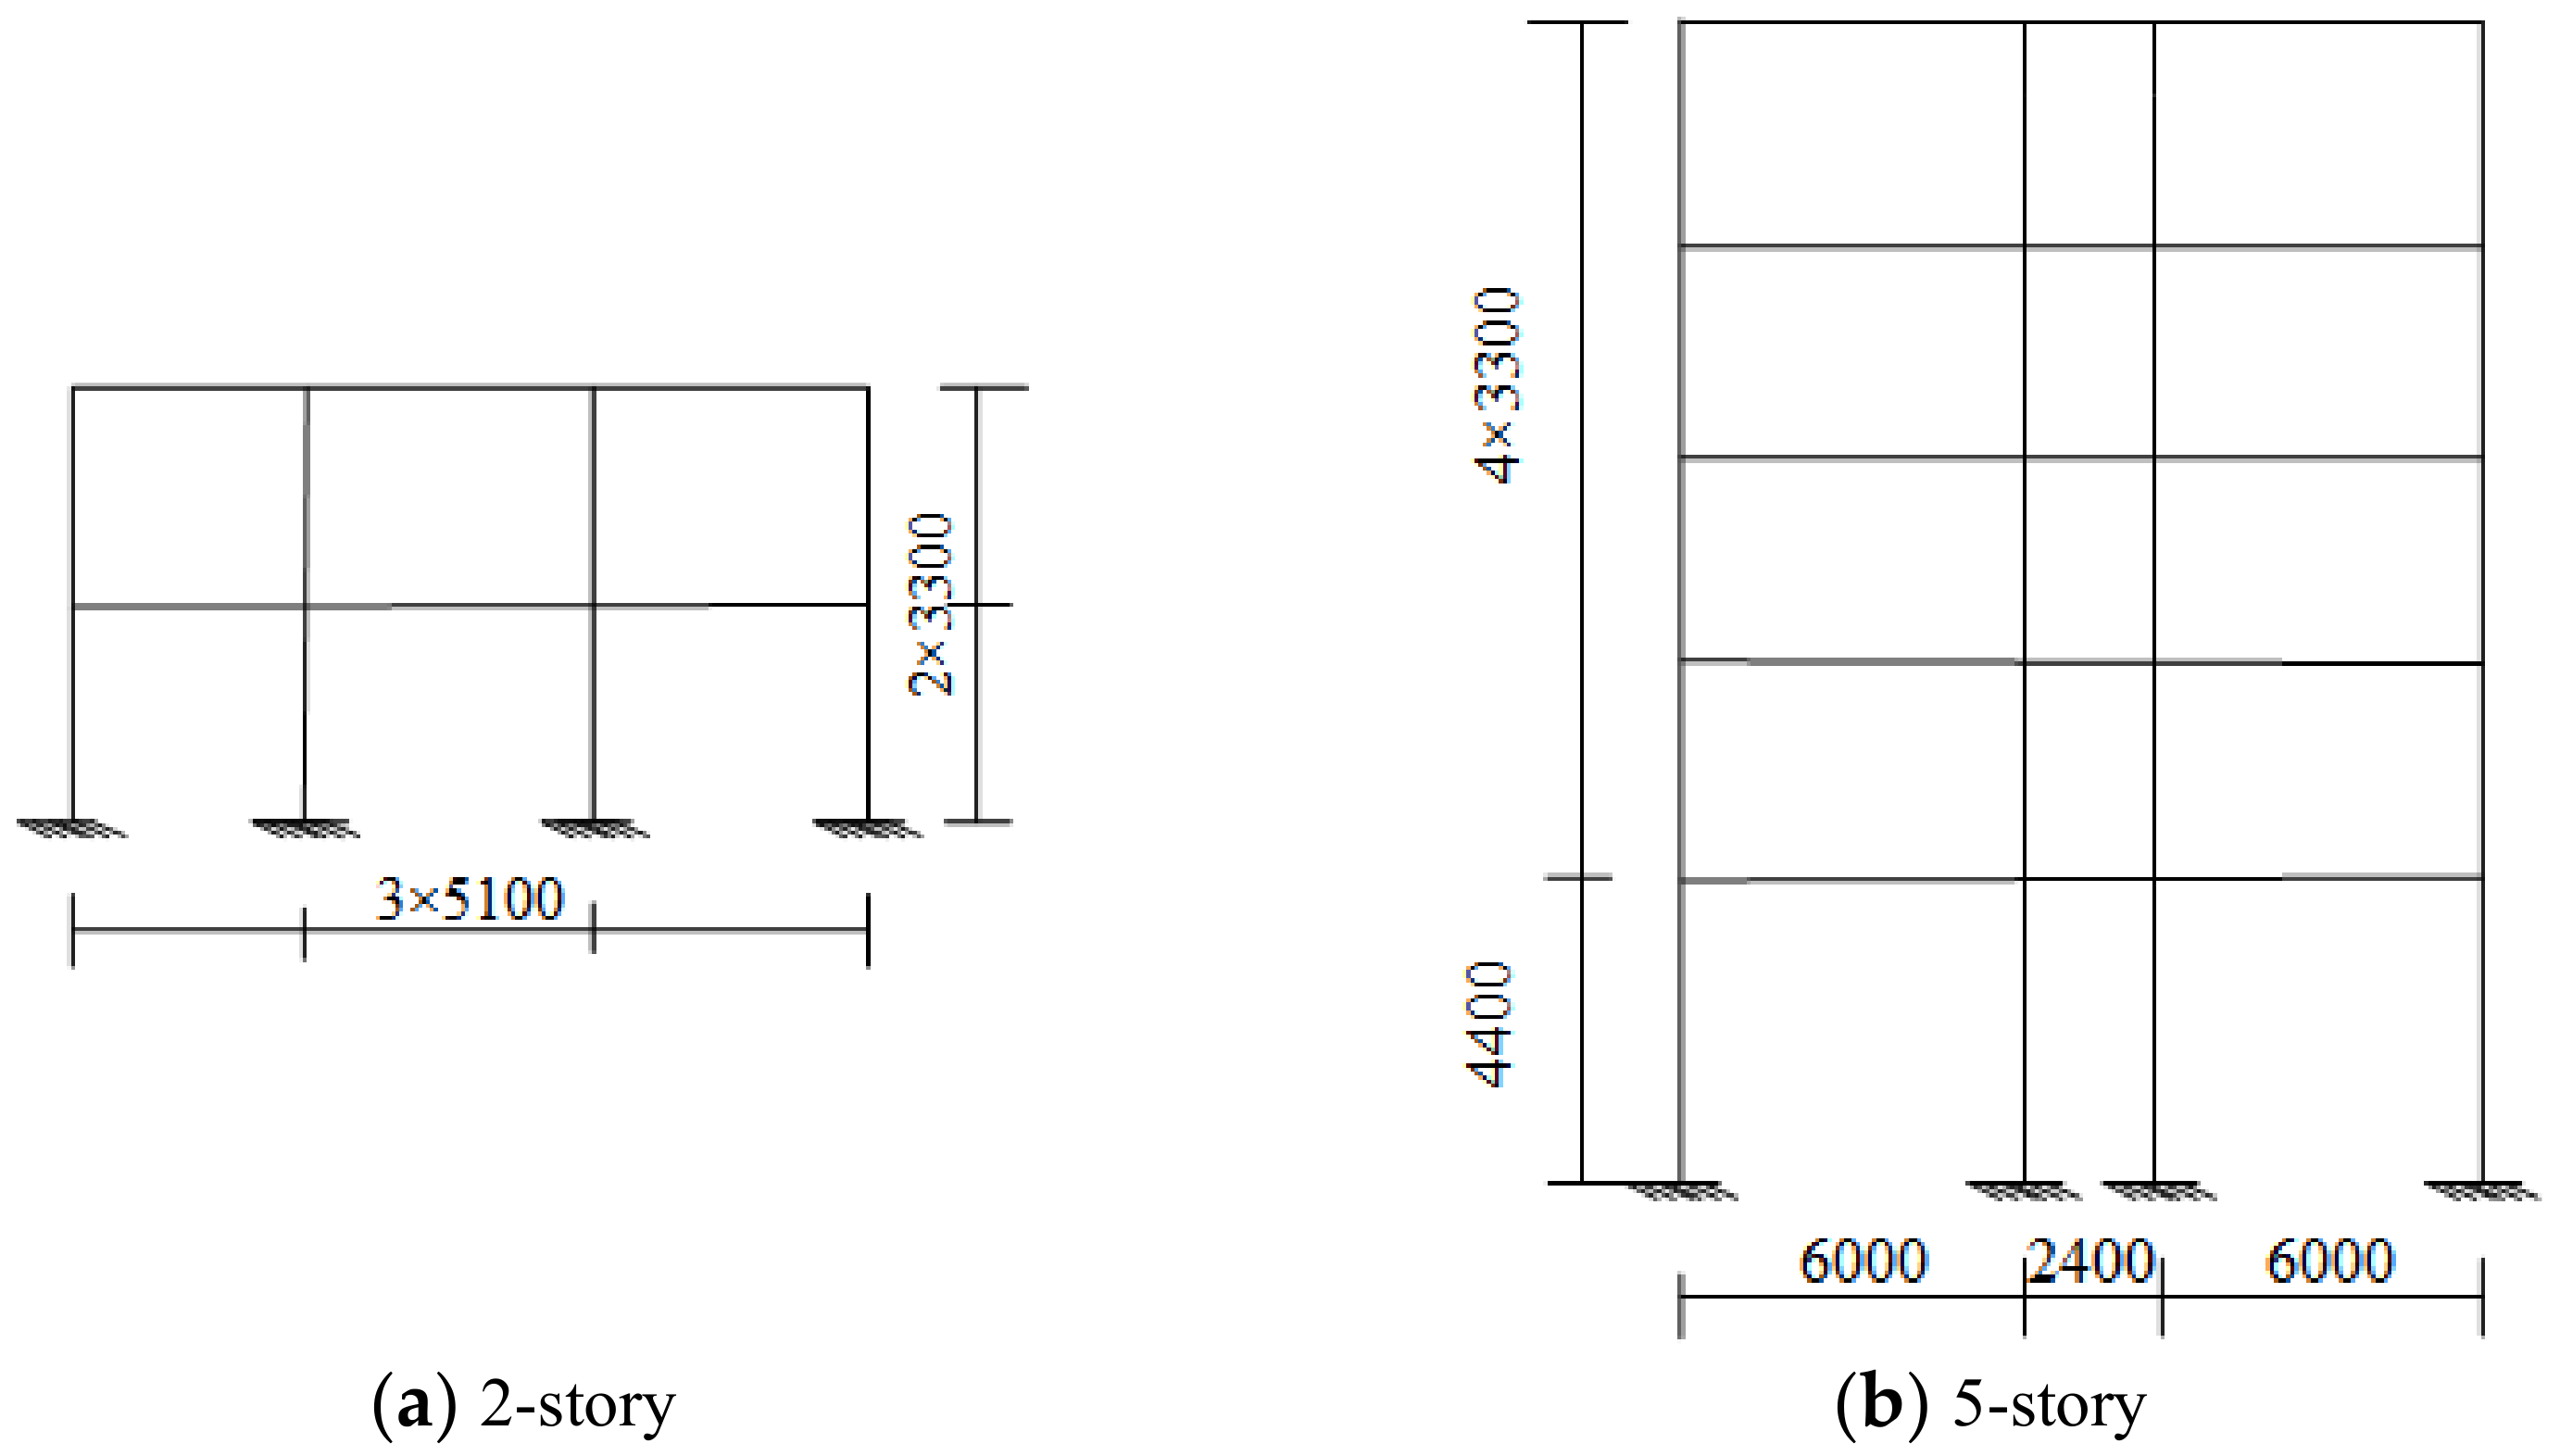
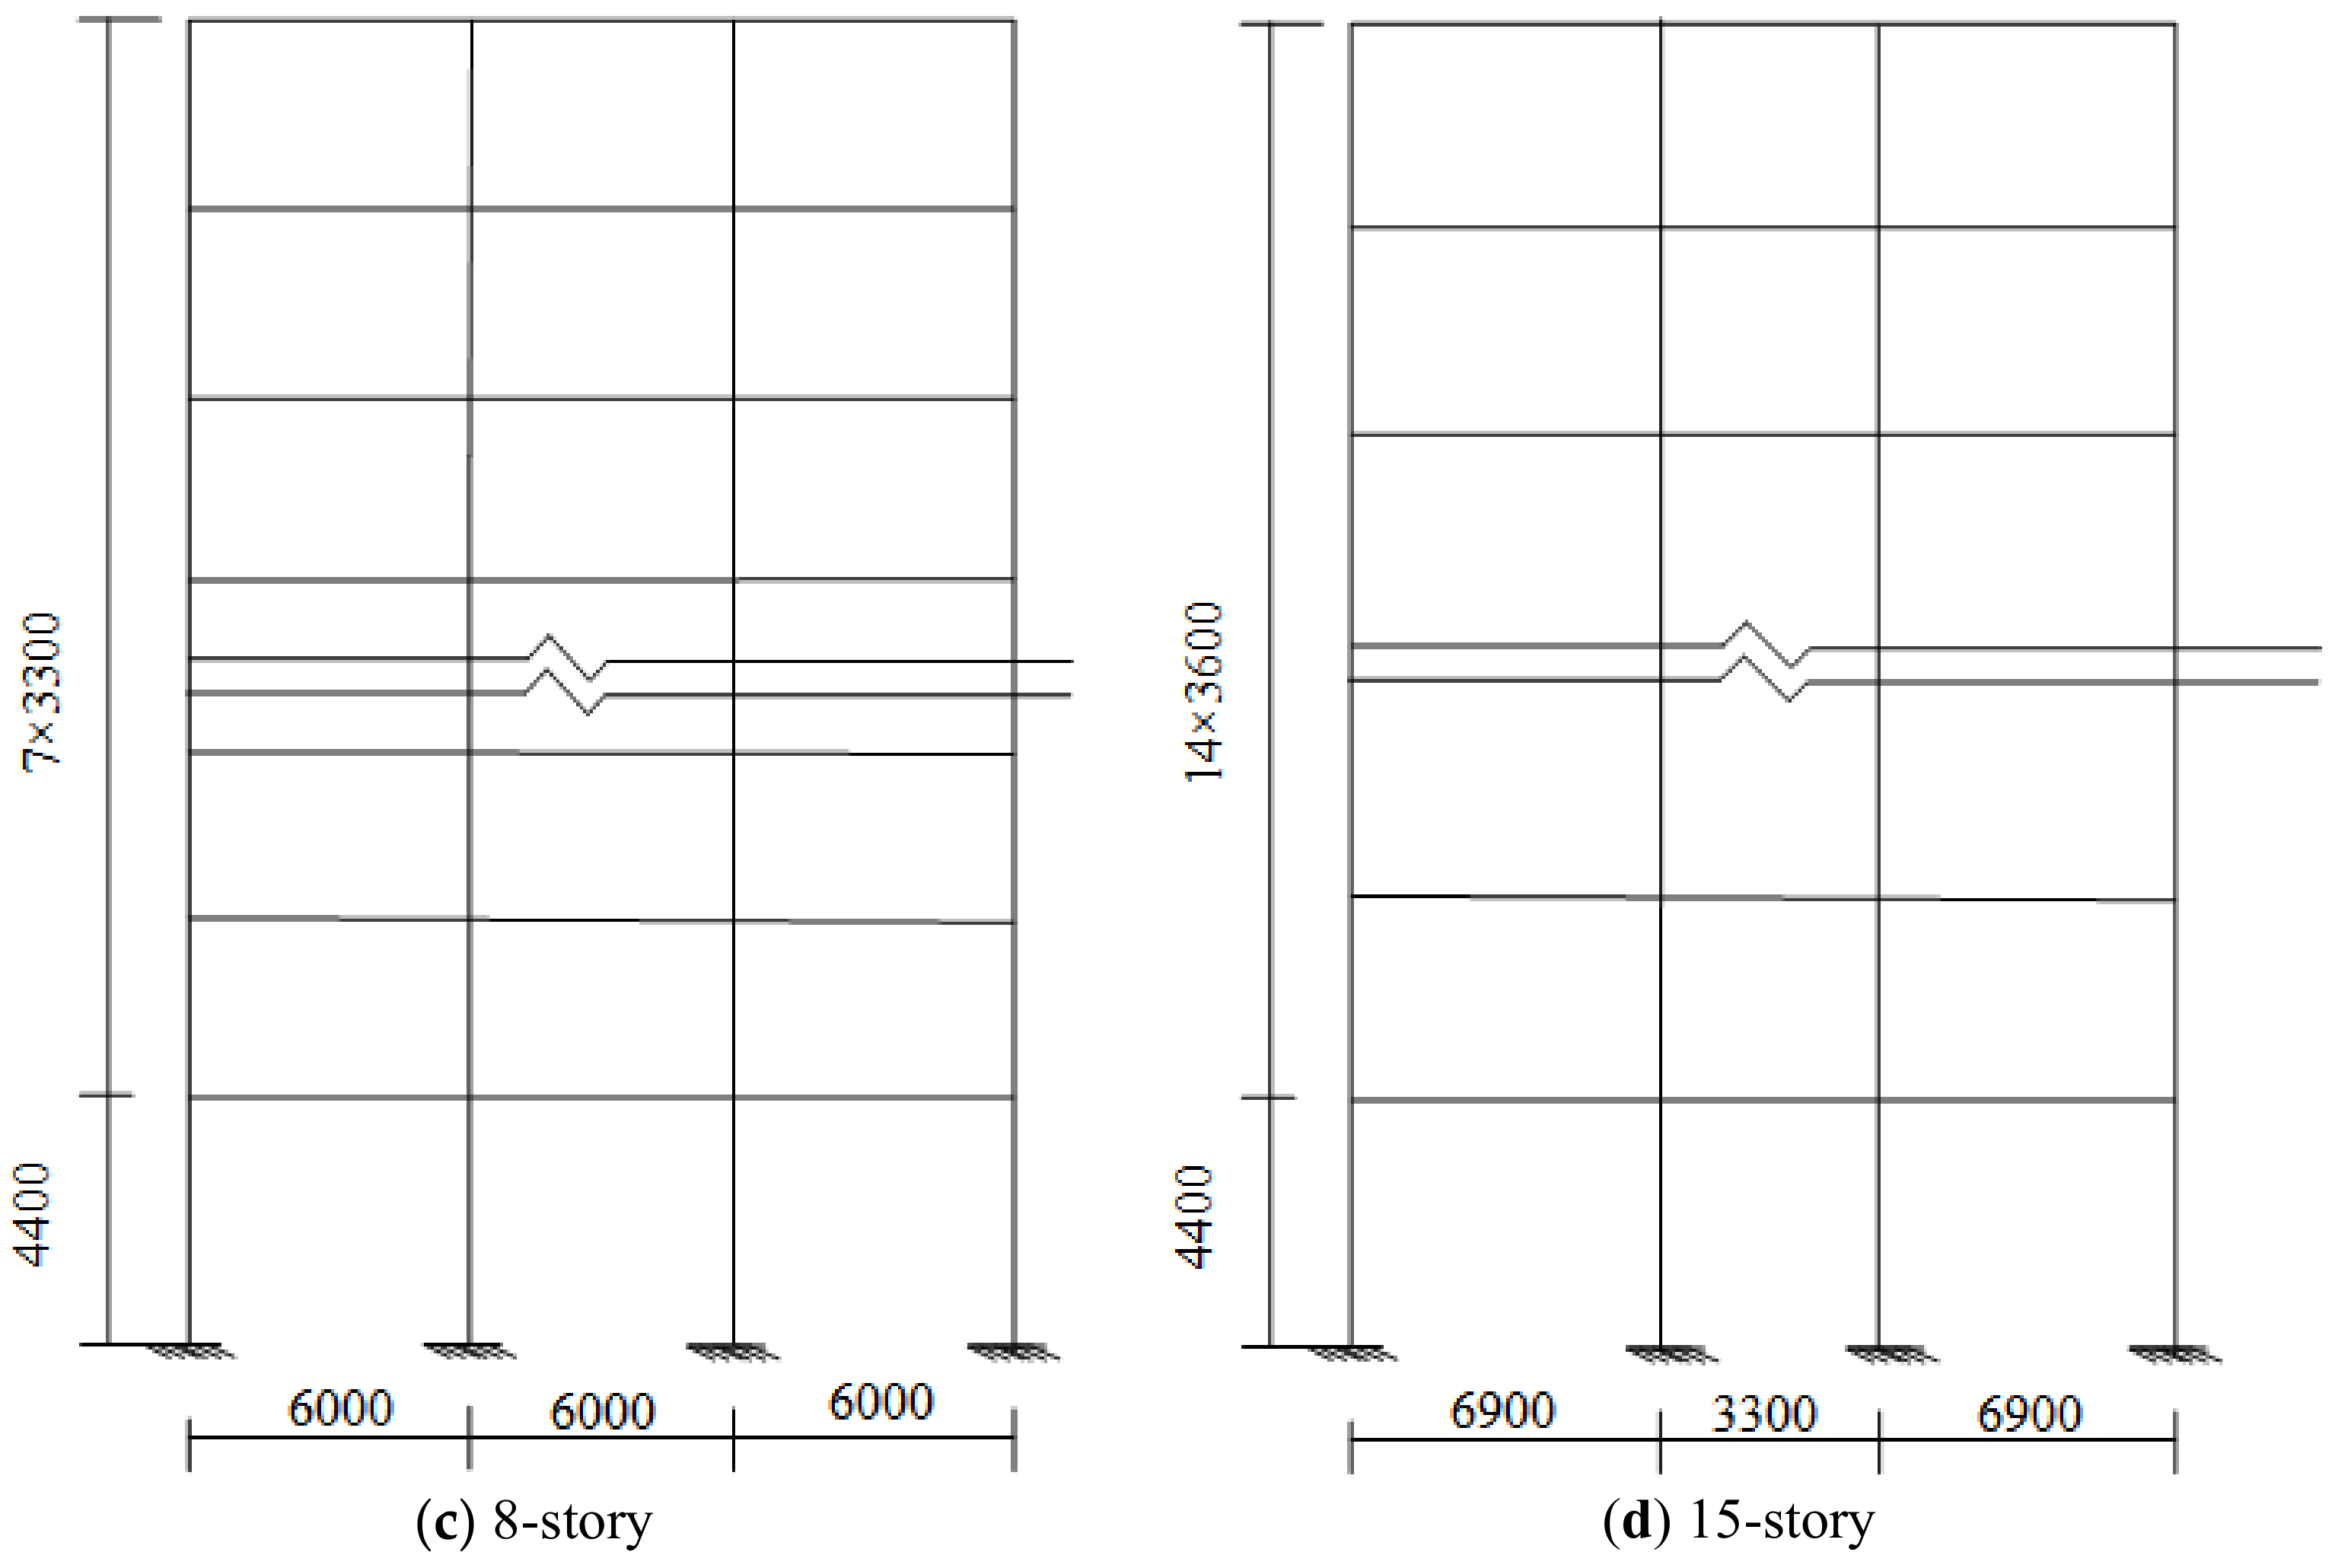
IMs include amplitude, spectrum, and duration, which can be used to describe the uncertainties associated with ground motions. Meanwhile, four reinforced concrete (RC) frame structural models with significantly different natural vibration periods are established, and three EDPs are considered for evaluating the uncertainty of the established structures. The efficiency and sufficiency of IMs in predicting EDPs are analyzed to determine the optimal IMs for different structures. Furthermore, for multiple optimal IMs, the pulse-like ground motions are ranked by determining the comprehensive IM via the principal component analysis (PCA) method. Finally, the pulse-like ground motions are ranked according to their damage potential using the selected optimal IM. The technical framework of this paper is illustrated in Figure 1.

3. Selection of Pulse-like Ground Motions and IMs

3.1. Selected Pulse-like Ground Motions

Compared with that of ordinary ground motions, the damage potential of pulse-like ground motions is typically higher. Pulse-like ground motions involve the release of significant amounts of instantaneous energy, thereby causing impact damage in building structures. Figure 2 depicts the velocity time-histories of two ground motions, (a) pulse-like ground motion and (b) non-pulse-like ground motion, which are significantly different from each other. In this study, the damage potential of 240 pulse-like ground motions is analyzed; the ground motions are selected according to the method proposed by Zhai [32]. An energy-based significant velocity half-cycle is used as a reference for distinguishing pulse-like ground motions. Note that these pulse-like ground motions are extensively studied [33]. Figure 3 illustrates the station distribution of pulse-like ground motions, which is mainly distributed in the United States, Japan, the Middle East, and Taiwan Province of China. Figure 4 shows the distributions of Vs30, magnitude (M), and epicentral distance (R). The values of M range from 5.21 to 7.62, and those of Vs30 are mainly < 1000 m/s. Pulse-like ground motions can be generated not only in the near field, but also in the relative far field (R > 100 km).

3.2. Selected IMs

The main causes of structural damage caused by ground motion are included in the whole ground motion time-history. The time-history characteristics of ground motion are indicated by various IMs. In this study, a novel method is employed for predicting the damage potential of ground motion for building structures; the method involves adopting 16 commonly used IMs, including amplitude, duration, spectrum, and energy parameters, based on previous studies. The selected IMs are shown in Table 1, and their physical significance and calculation methods are mentioned in the relevant literature [32,34,35].

4. Selection of Structural Models and EDPs

4.1. Structural Models

To comprehensively analyze the destruction mechanism of different structures caused by pulse-like ground motions, four representative structural models with quite different natural vibration periods are established and used for comprehensively analyzing the damage caused by pulse-like ground motions in different structures. The structural models are designed according to Zhai et al. [35] and Li et al. [36]. The four frame structures are of different types—short-period, short- and middle-period, middle- and long-period, and long-period—with 2, 5, 8, and 15 stories, respectively. These buildings are symmetric. The finite element software IDARC-2D is used to analyze the four frame structures [37]. The natural vibration period (T1) of each structure is shown in Table 2. The four structural models are based on four ordinary RC frame structures, with seismic fortification intensity of seven degrees. The four structures are modeled considering a class II site. The improved I-K trilinear hysteretic model is used for the four structures [38,39], and Figure 5 shows the hysteretic skeleton curve of the model. The four buildings use C30 concretes, and the live load is 0.4 kN/m2. Figure 6 illustrates the plan and elevation of the four representative structures. Table 3 and Table 4 show the sectional dimensions, concrete grades, and steel rebars of the beams and columns of the structures. The yielding strength fyk of the main reinforcement rebars is 400 MPa, and the yielding strength fyk of the stirrups is 300 MPa. During calculations, the stiffness in the floor plane is considered infinite. The stiffness degradation coefficient α, strength degradation coefficient β, and pinch effect coefficient γ determine the hysteretic responses of the structures. The values 8.0, 0.1, and 0.5 are selected for the parameters α, β, and γ, respectively, for the analysis using the IDARC-2D software. Centralized plasticity is considered as the plasticity type.

4.2. Selected EDPs

The degree of damage in the structures due to pulse-like ground motions is comprehensively evaluated by selecting several EDPs, as shown in Table 5: (1) MIDR is the maximum inter-story drift ratio (drift normalized by the story height) over all stories/closely related to local damage, instability, and story collapse; (2) MFA is the maximum value of floor absolute acceleration for all stories and indicates the level of non-structural damage; (3)~OSDI denotes the degree of overall damage in the structure and is determined by the peak displacement and hysteretic energy consumption of the structure.

5. Prediction and Analysis of EDPs Based on IMs

The capacity of an IM for predicting EDPs is primarily determined via analyzing the efficiency and sufficiency of the IM. In traditional methods [32,35], the numerical values of IMs and EDPs are typically assumed to have linear or logarithmic distribution, as shown in Equations (1) and (2). The aim of this study is to rank pulse-like ground motions based on their damage potential. To this end, a new data-processing method is proposed. The IMs that can be used to efficiently and sufficiently predict EDPs are positively correlated with EDPs. IMs and EDPs are separately used to rank ground motions, which are ranked based on IMs and EDPs, respectively, and the relationship between the two ranking results (RIM and REDP) is shown in Equation (3). The efficiency and sufficiency of an IM is determined by the ability of the IM to predict EDP.
η D I M = b 0 + b 1 I M
ln η D I M = b 0 + b 1 ln I M
R ^ E D P = b 0 + b 1 R I M
where b0 and b1 are regression coefficients, RIM is the ranking obtained using an IM, and REDP is the ranking obtained using an EDP.

5.1. Efficiency of the IMs

Efficiency is an important metric for assessing the quality of a selected IM. There are two commonly used statistical parameters that can be used to describe the efficiency of IMs [9,40]. The first parameter is the determination coefficient (R2), as shown in Equation (4). A value of R2 is closer to one; the efficiency of the IM increases with the decrease in the discreteness of IM ranking and EDP ranking fitting. The second statistical parameter is the standard deviation βD|IM. The greater the value of βD|IM, the smaller the dispersion, which means that the regression model is more efficient for characterizing the structural response. Either of the statistical parameters can be used to effectively measure the efficiency of IMs. R2 is used as the criterion in this study.
R 2 = k = 1 n ( R ^ E D P R ¯ E D P ) 2 k = 1 n ( R E D P k R ¯ E D P ) 2
where n denotes the number of ground motion data points; R ^ E D P denotes the response fitting ranking based on the IM ranking; R ¯ E D P is the average ranking of EDP; R E D P is the EDP ranking.
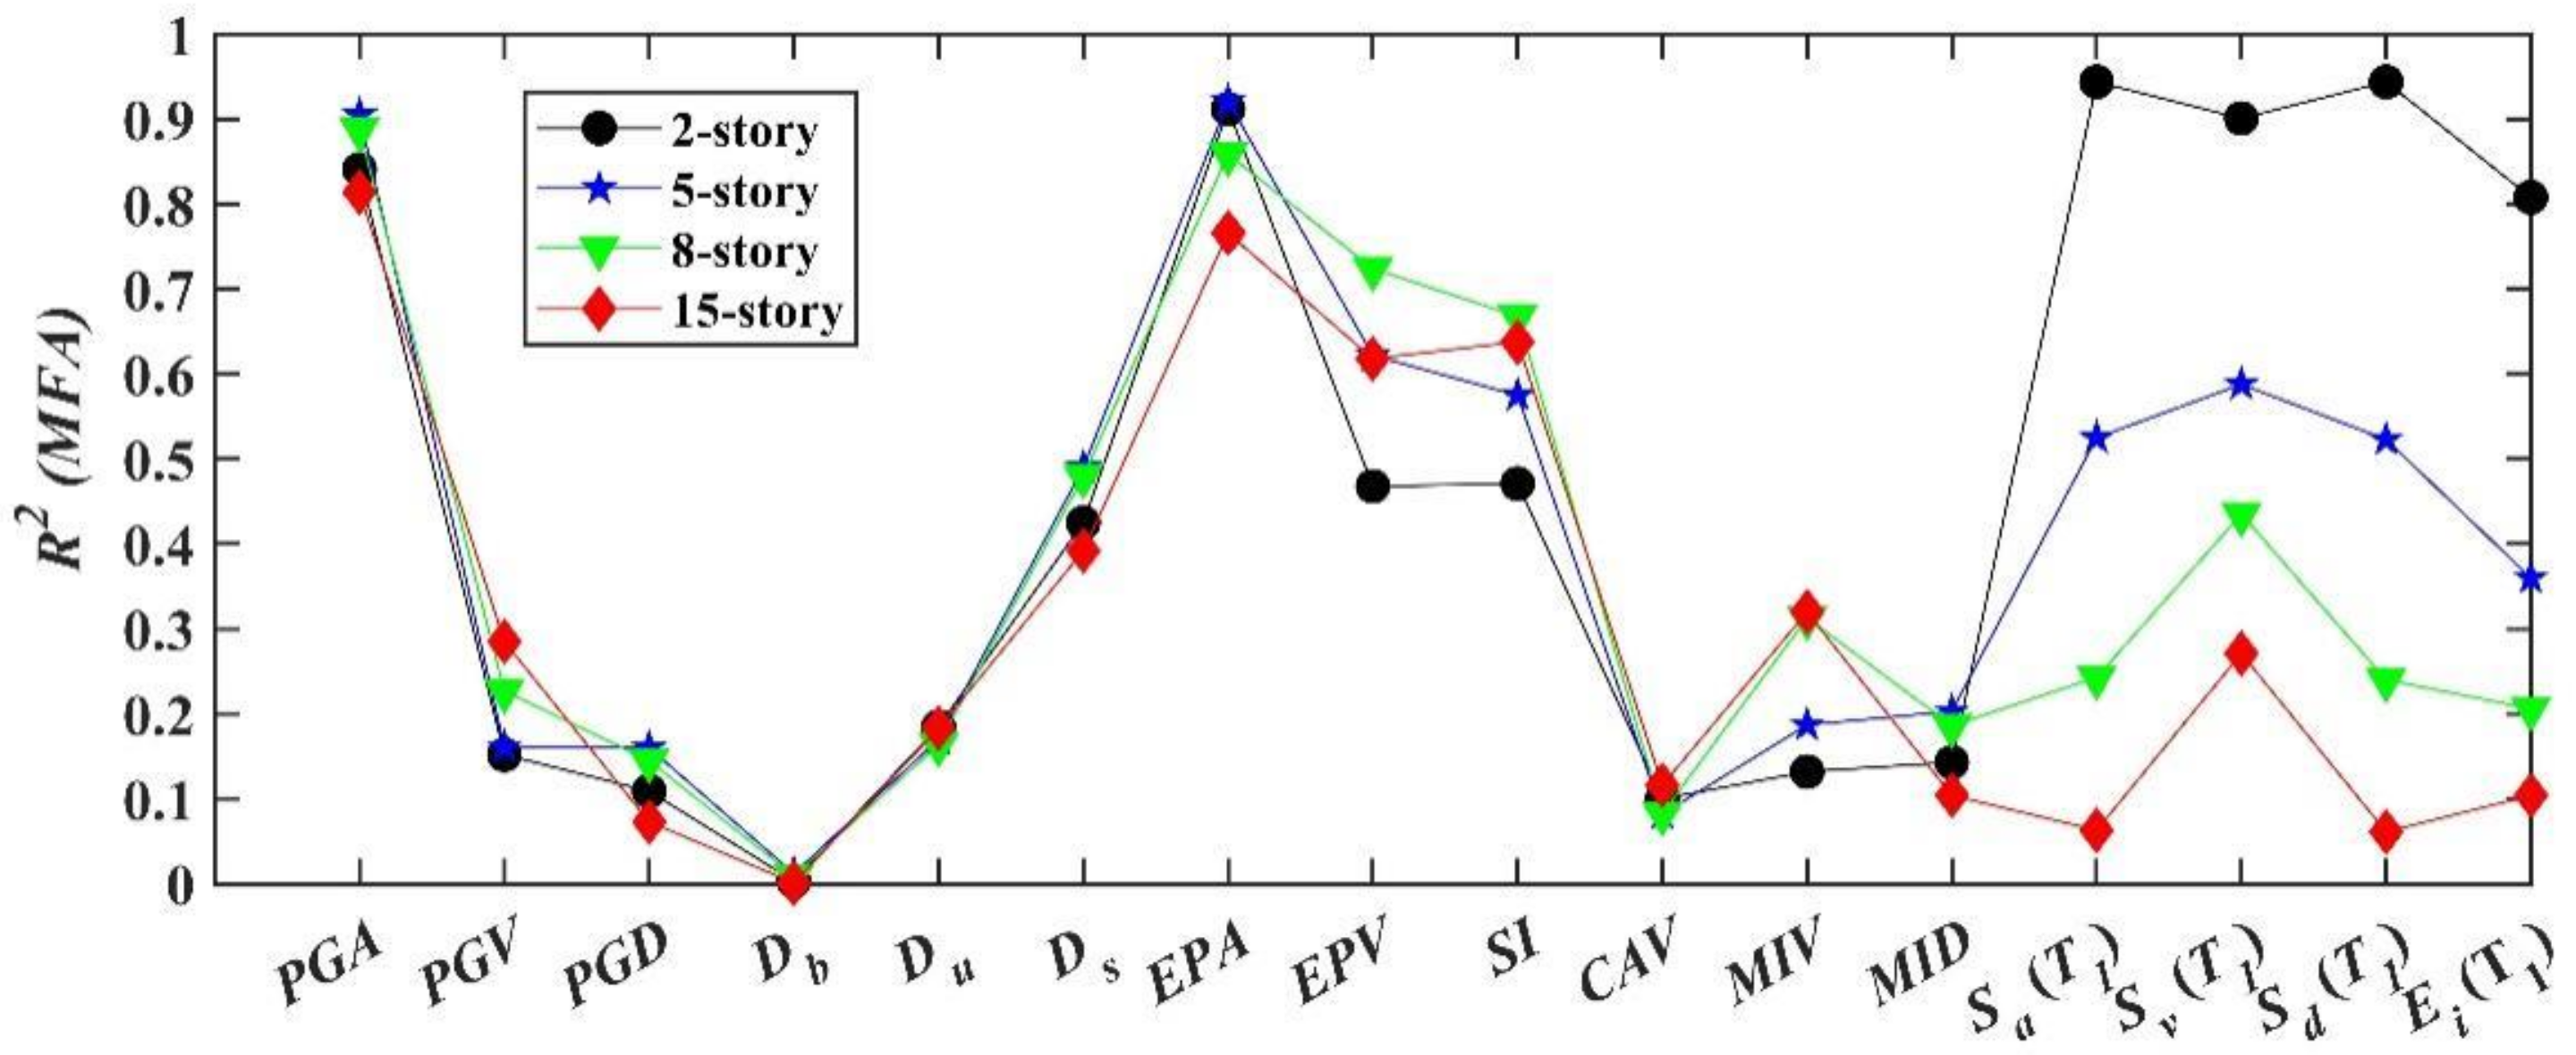
The efficiencies of the IMs are analyzed based on the structural responses of the four structures, and the calculation results are shown in Figure 7, Figure 8 and Figure 9. Notably, the uncertainties associated with ground motion and building structure should be considered while analyzing the damage potential of ground motion for building structures. There are notable differences between the discreteness of the same IM and the same EDP for different structures. Furthermore, the discreteness of the same IM and different EDPs may also be different for the same structure. These results indicate the uncertainties associated with structure. However, in many studies, only similar structures have been analyzed, and the results are inconsistent with the findings of this study [9,26].
In addition, there are significant differences between the R2 values of different IMs and EDPs for the same structure; this indicates the uncertainties associated with ground motion.
The uncertainties associated with ground motion and building structure are considered in this study for analyzing the ability of IMs to predict EDPs accurately and to determine the optimal IMs for describing the damage potential of ground motion. Three IMs with the largest R2 for EDP prediction are selected for the different structural types and EDPs. The results are shown in Table 6. The results indicate that even for the same EDP, the most efficient IMs are different for different structural types. When MIDR is selected as the EDP, the most efficient IMs are different for different building types: EPA, Sa (T1), and Sd (T1) are the most efficient IMs for two-story buildings; SI, EPV, and Sa (T1) are the most efficient IMs for five-story buildings; PGV, Sd (T1), and E(T1) are the most efficient IMs for eight-story buildings, and PGD, MID, and Sd (T1) are selected as the most efficient IMs for 15-story buildings. The IMs that can be used to predict OSDI and MIDR are the same in most cases. Some IMs related to acceleration can be used to efficiently characterize MFA, such as PGA, EPA, and Sa (T1).

5.2. Sufficiency of the Selected IMs

In addition to efficiency, sufficiency is important for assessing the quality of IMs. An IM is sufficient when the probability distribution of an EDP is independent from ground motion characteristics, such as epicenter distance, magnitude, and the ground motion parameter epsilon (ε) [41]. Zelaschi et al. [40] obtained p-values for the residuals of EDP and ln η D I M with magnitude and epicenter distance of the ground motion when they proved that an IM is sufficient. Similar methods [20,29,42] have been used in relevant studies to demonstrate the sufficiency of IMs. However, the method proposed by Zelaschi et al. is unreasonable because the calculated p-values are closely related to the number of samples, as noted in relevant studies [40,43]. It becomes more difficult to accept the null hypothesis with an increasing number of samples.
The sufficiency of an IM can also be verified based on relative entropy, a concept in seismic engineering proposed by Jalayer [27]. In this study, based on the concept of relative entropy, a simple quantitative measure is introduced; it is called the relative sufficiency measure, which is selected as a parameter to measure the relative sufficiency of one IM with respect to another. Therefore, the relative sufficiency measure is used to verify the sufficiency of the selected IMs. The simplified and approximate formulation of relative sufficiency is shown in Equation (5).
I D I M 2 I M 1 1 n k = 1 n log 2 β D I M 1 β D I M 2 φ ln y k ln η D I M 2 I M 2 , K β D I M 2 φ ln y k ln η D I M 1 I M 2 , K β D I M 1
where βD|IM is the conditional standard deviation, which serves as a quantitative measure for the prediction efficiency of the IMs; yk is the REDP; lnηD|IM is the fitting function; n is the number of samples.
The above equation was derived by Jalayer [27] and Ebrahimian [9]. The reference intensity (i.e., IM1 in Equation (5)) is considered to be Sa (T1) for the structural response, mainly because Sa (T1) is a better characterization parameter for the structural response and is extensively used in earthquake engineering. The sufficiency is measured for each candidate IM relative to Sa (T1).
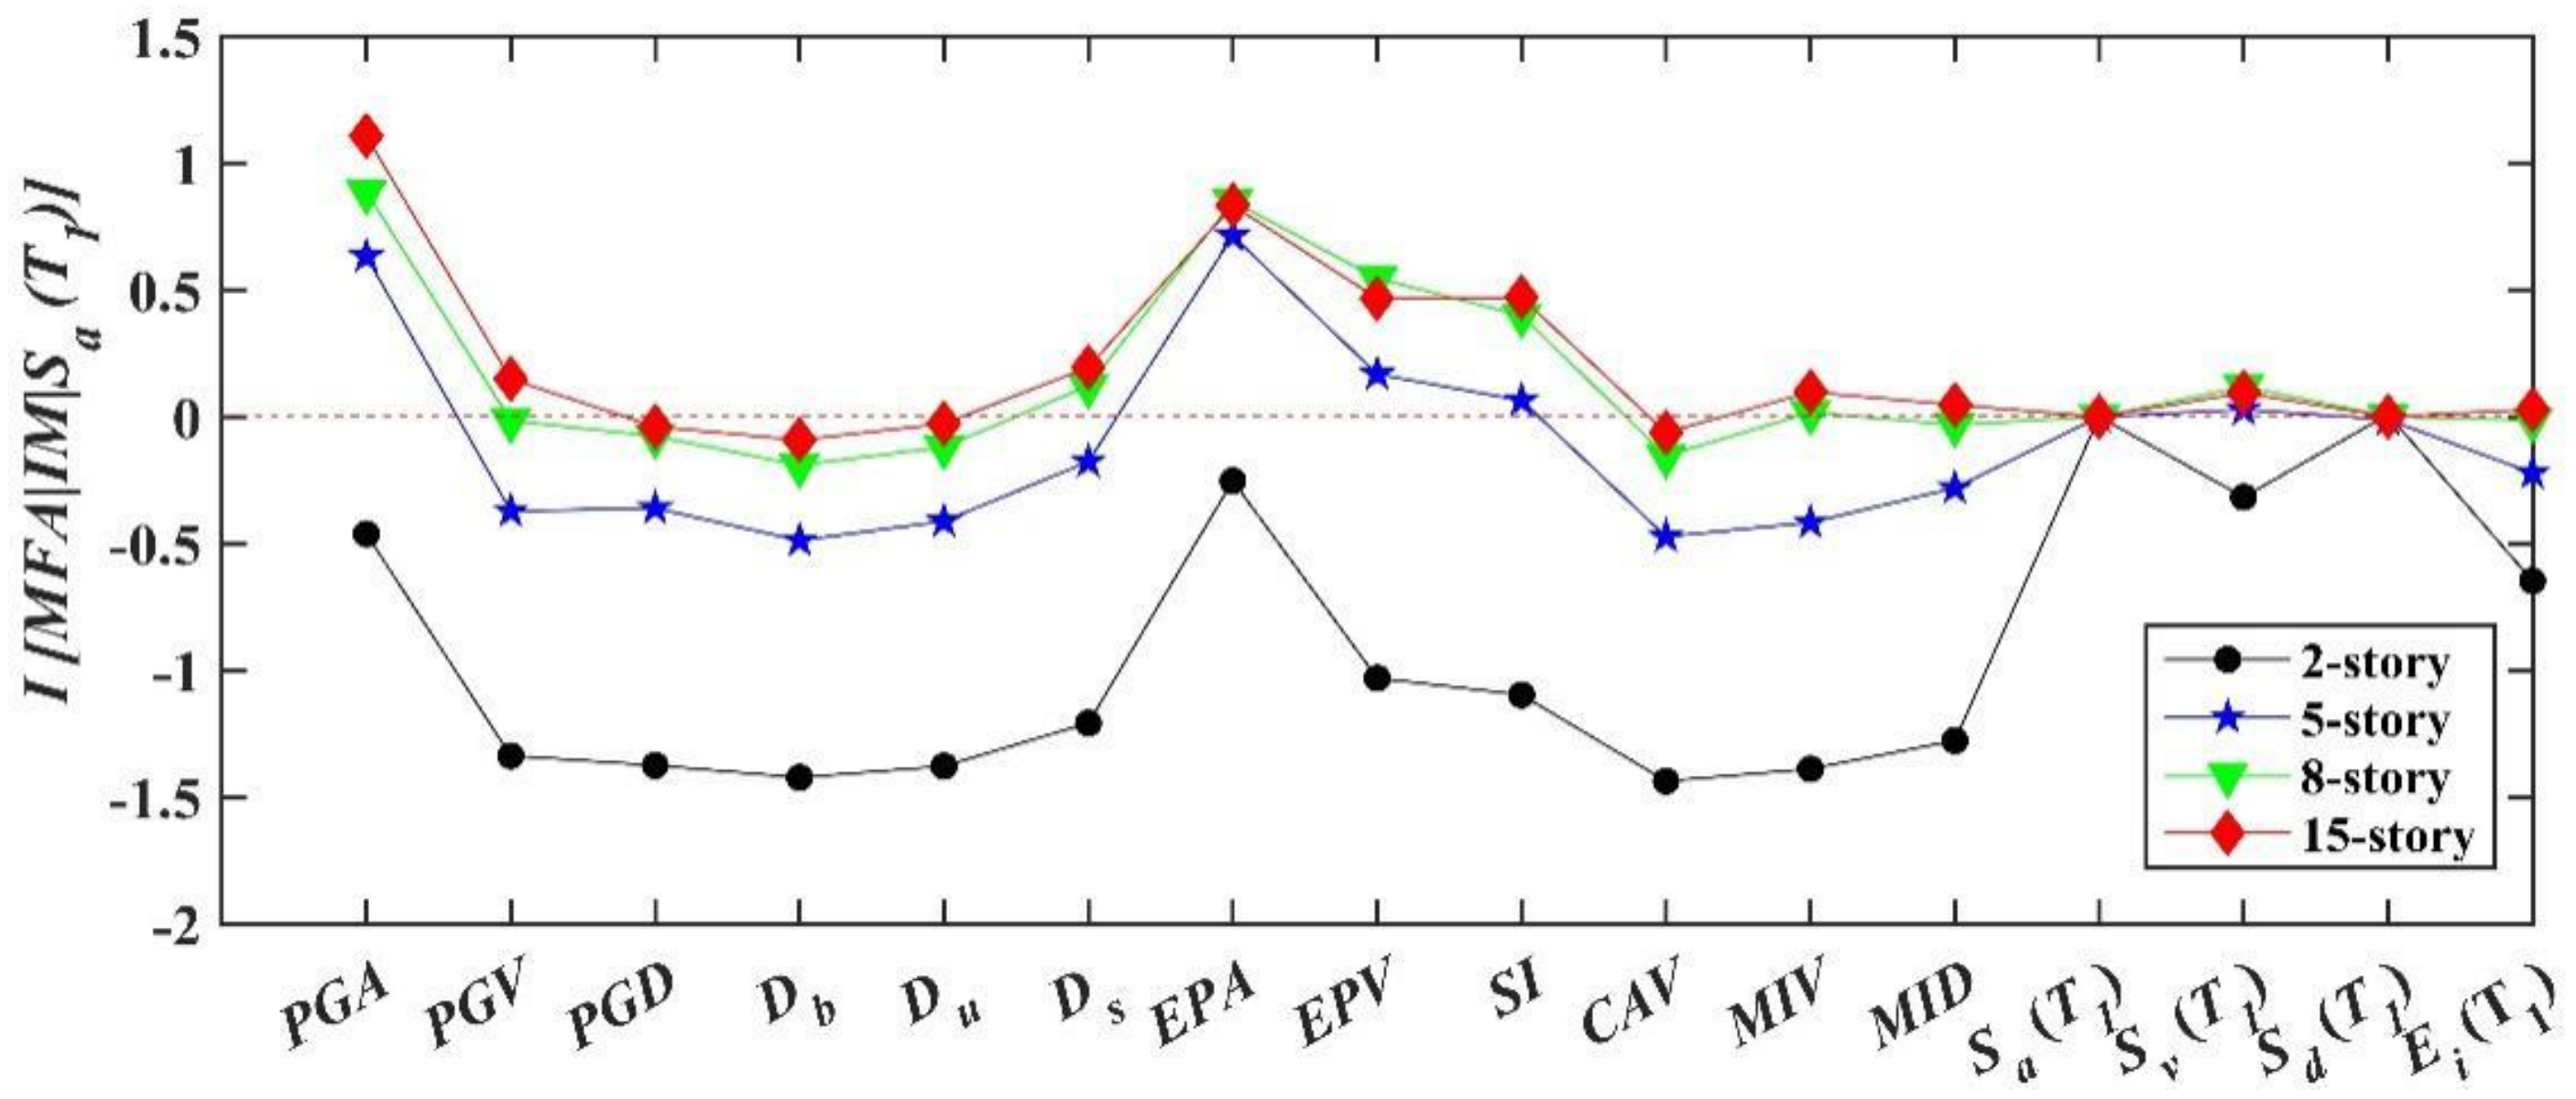
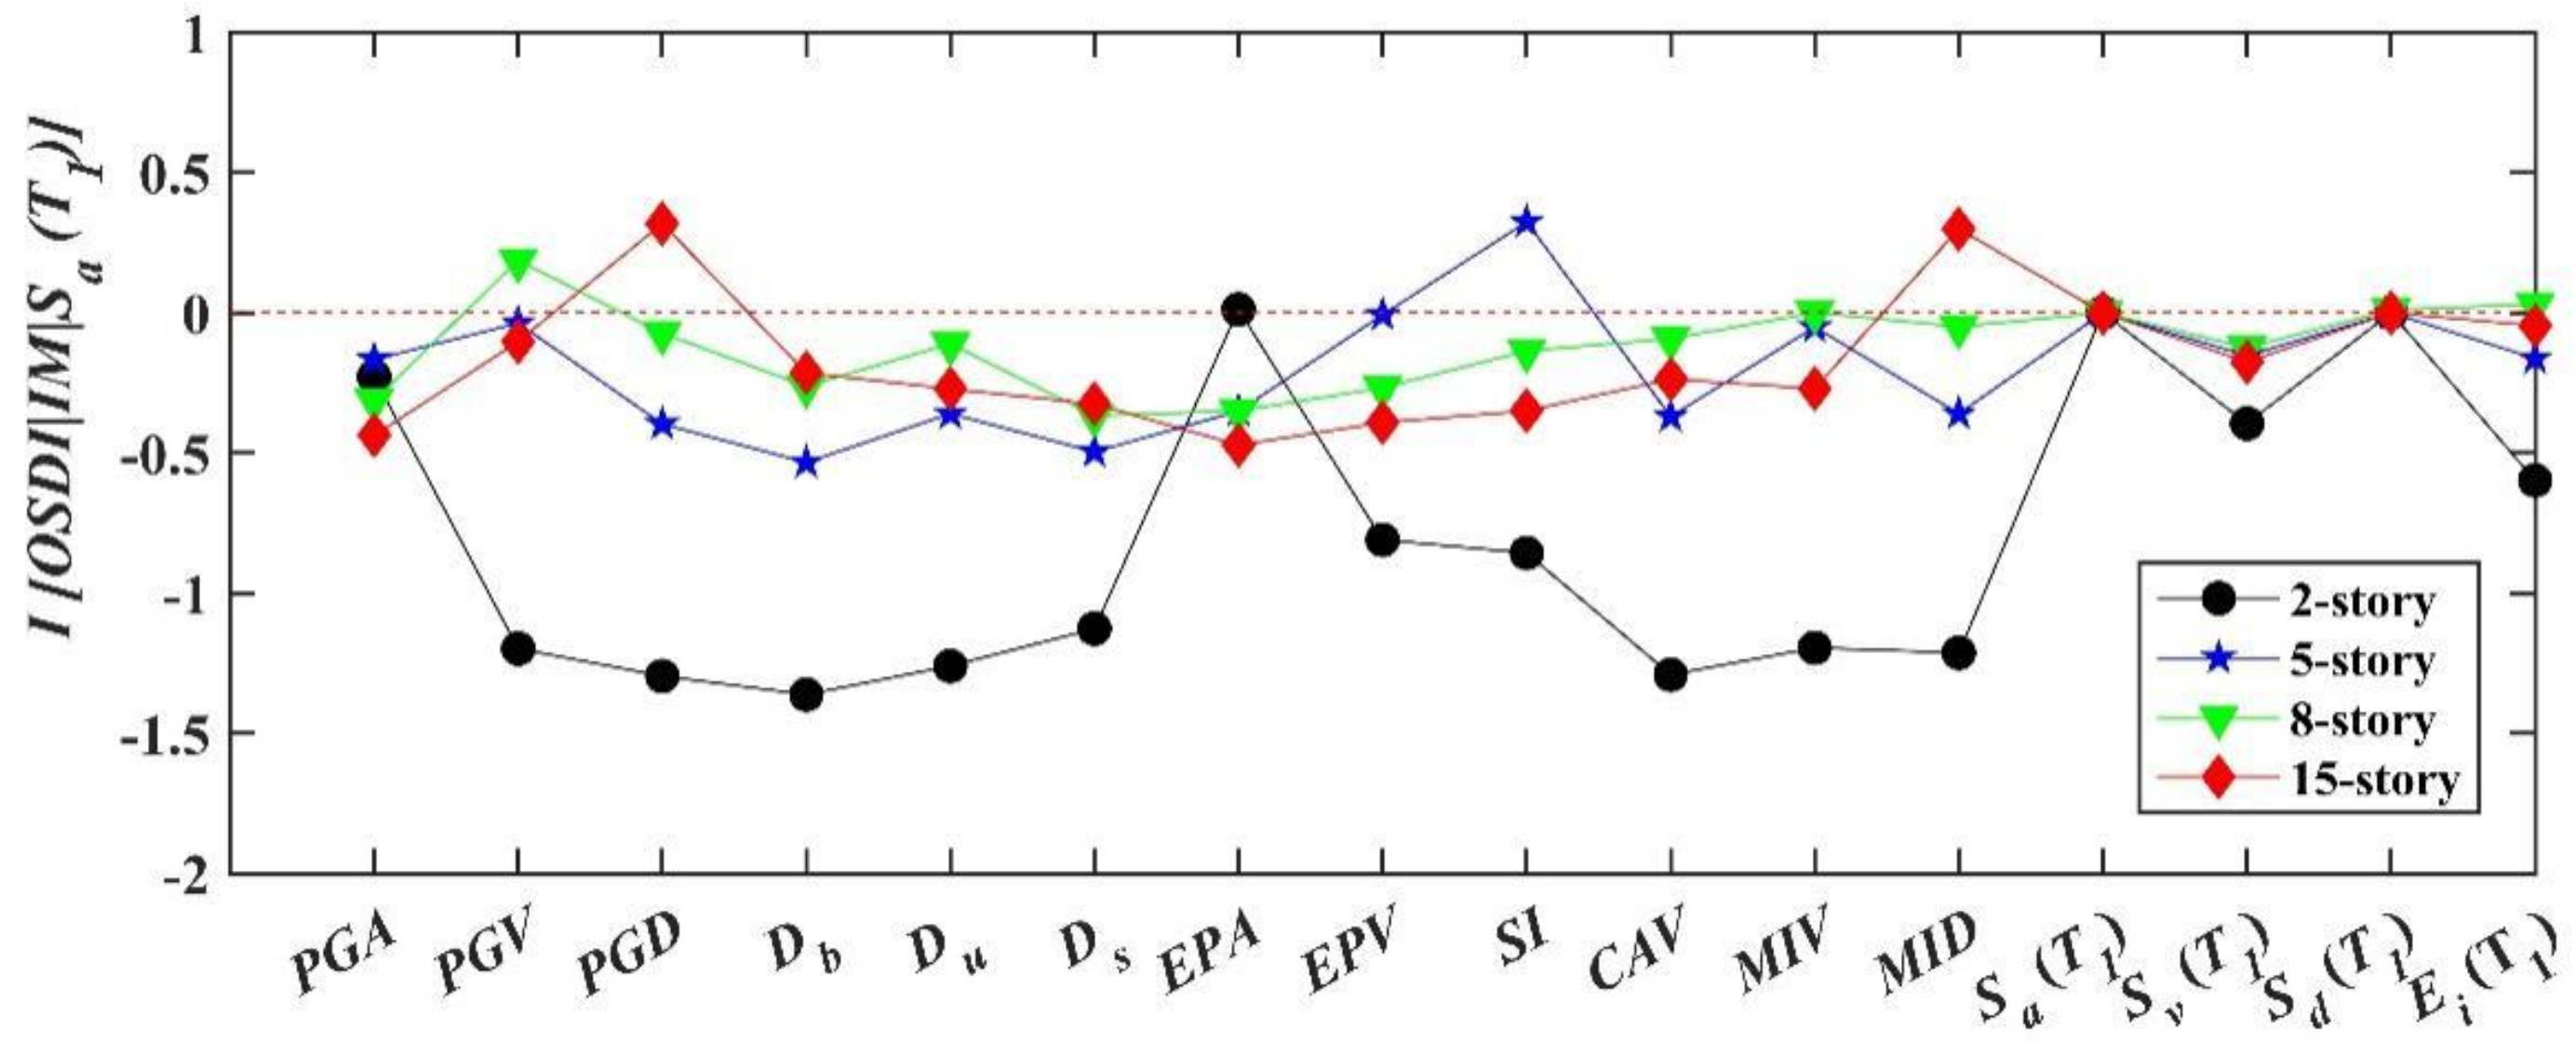
If (IM2|IM1) has a positive value, the candidate IM is more sufficient than Sa (T1). Similarly, if I (IM2|IM1) has a negative value, the candidate IM is less sufficient than Sa (T1) for predicting EDPs.
The obtained results, as shown in Figure 10, Figure 11 and Figure 12, indicate that one or more IMs are more sufficient than Sa (T1) for characterizing the EDPs in most cases. However, when analyzing MFA and MIDR for a two-story structure, all I ( I M 2 I M 1 ) values are not positive, which indicates that Sa (T1) is the most sufficient among all parameters. Finally, all the most sufficient IMs for characterizing the EDPs are obtained, as shown in Table 7.

5.3. Comprehensive Analysis of the Selected IMs

The efficiency and sufficiency of 16 IMs are analyzed to determine the optimal IMs for accurately describing the damage potential of ground motions. The ground motion IMs that satisfy the requirements of both efficiency and sufficiency are determined by comparing the analysis results for efficiency and sufficiency, as shown in Table 8. For a short-period structure (for example, two-story) and MFA as the EDP, the acceleration-related IMs can be used to efficiently and sufficiently characterize the EDPs. For MIDR or OSDI as the EDP and a medium-period structure (for example, eight-story), the velocity-related IMs can be used to efficiently and sufficiently characterize the EDPs. Finally, the displacement-related IMs can be used to efficiently and sufficiently characterize the MIDR or OSDI for a long-period structure (for example, 15-story).

6. Establishing the Pulse-like Ground Motion Rankings

To describe the destructive capacity of ground motion more accurately and rank the pulse-like ground motions based on the optimal IMs, the efficiency and sufficiency of 16 IMs are analyzed by four different structures. However, there are two cases based on the number of IMs, as shown in Table 8: (1) only one optimal IM is obtained, and the pulse-like ground motions are ranked directly based on this IM, which is the damage potential ranking result of the pulse-like ground motions; the ranking depicts the ranking in which the ground motions can damage a building structure—the most unfavorable to the most favorable; (2) multiple IMs are obtained. However, further analysis is necessary for developing a ranking method in the case of multiple IMs.
A novel method is proposed for combining multiple IMs into one comprehensive IM. The method involves reducing the dimensions of the variables via PCA. Subsequently, the damage potential of pulse-like ground motion is comprehensively evaluated according to the principal component. The results are highly interpretable [44,45,46].

6.1. Comprehensive IM Determination Based on the PCA

The proposed method is a multivariate statistical method that involves dimensional reduction and the transformation of multiple indicators into a few comprehensive indicators, while ensuring minimal loss of data or information. Generally, the comprehensive IM generated via transformation is called the principal component, which is a linear combination of original variables. Based on the principal component, the main contradictions can be identified and the collinearity problem between variables can be avoided, and thus the efficiency of the IM can be improved.
For example, there are n samples, and each sample contains p variables. A strong correlation exists among these p variables, which is denoted by X = (x1, x2, …, xp)’ after standardization. The mathematical model of PCA is shown in Equation (6). A is an orthogonal matrix as shown in Equation (7).
y 1 = a 11 x 1 + a 12 x 2 + + a 1 p x p y 2 = a 21 x 1 + a 22 x 2 + + a 2 p x p y p = a p 1 x 1 + a p 2 x 2 + + a p p x p
A ¯ = a 11 a 12 a 1 p a 21 a 22 a 2 p a p 1 a p 2 a p p
where y1, y2, …, yp are the principal components. The determination steps of the comprehensive IM based on PCA are as follows.
Step 1: The correlation coefficient matrix is calculated to test whether the variables to be analyzed are suitable for PCA. According to the results in Table 8, there are seven cases for which PCA can be applied: (1) MIDR of 5-story, (2) MFA of 5-story, (3) MIDR of 8-story, (4) MFA of 8-story, (5) MIDR of 15-story, (6) MFA of 15-story, and (7) OSDI of 15-story. The correlation coefficients for IMs under all conditions are depicted in Table 9. Notably, when a high degree of correlation exists between the two IMs under all cases, PCA can be performed.
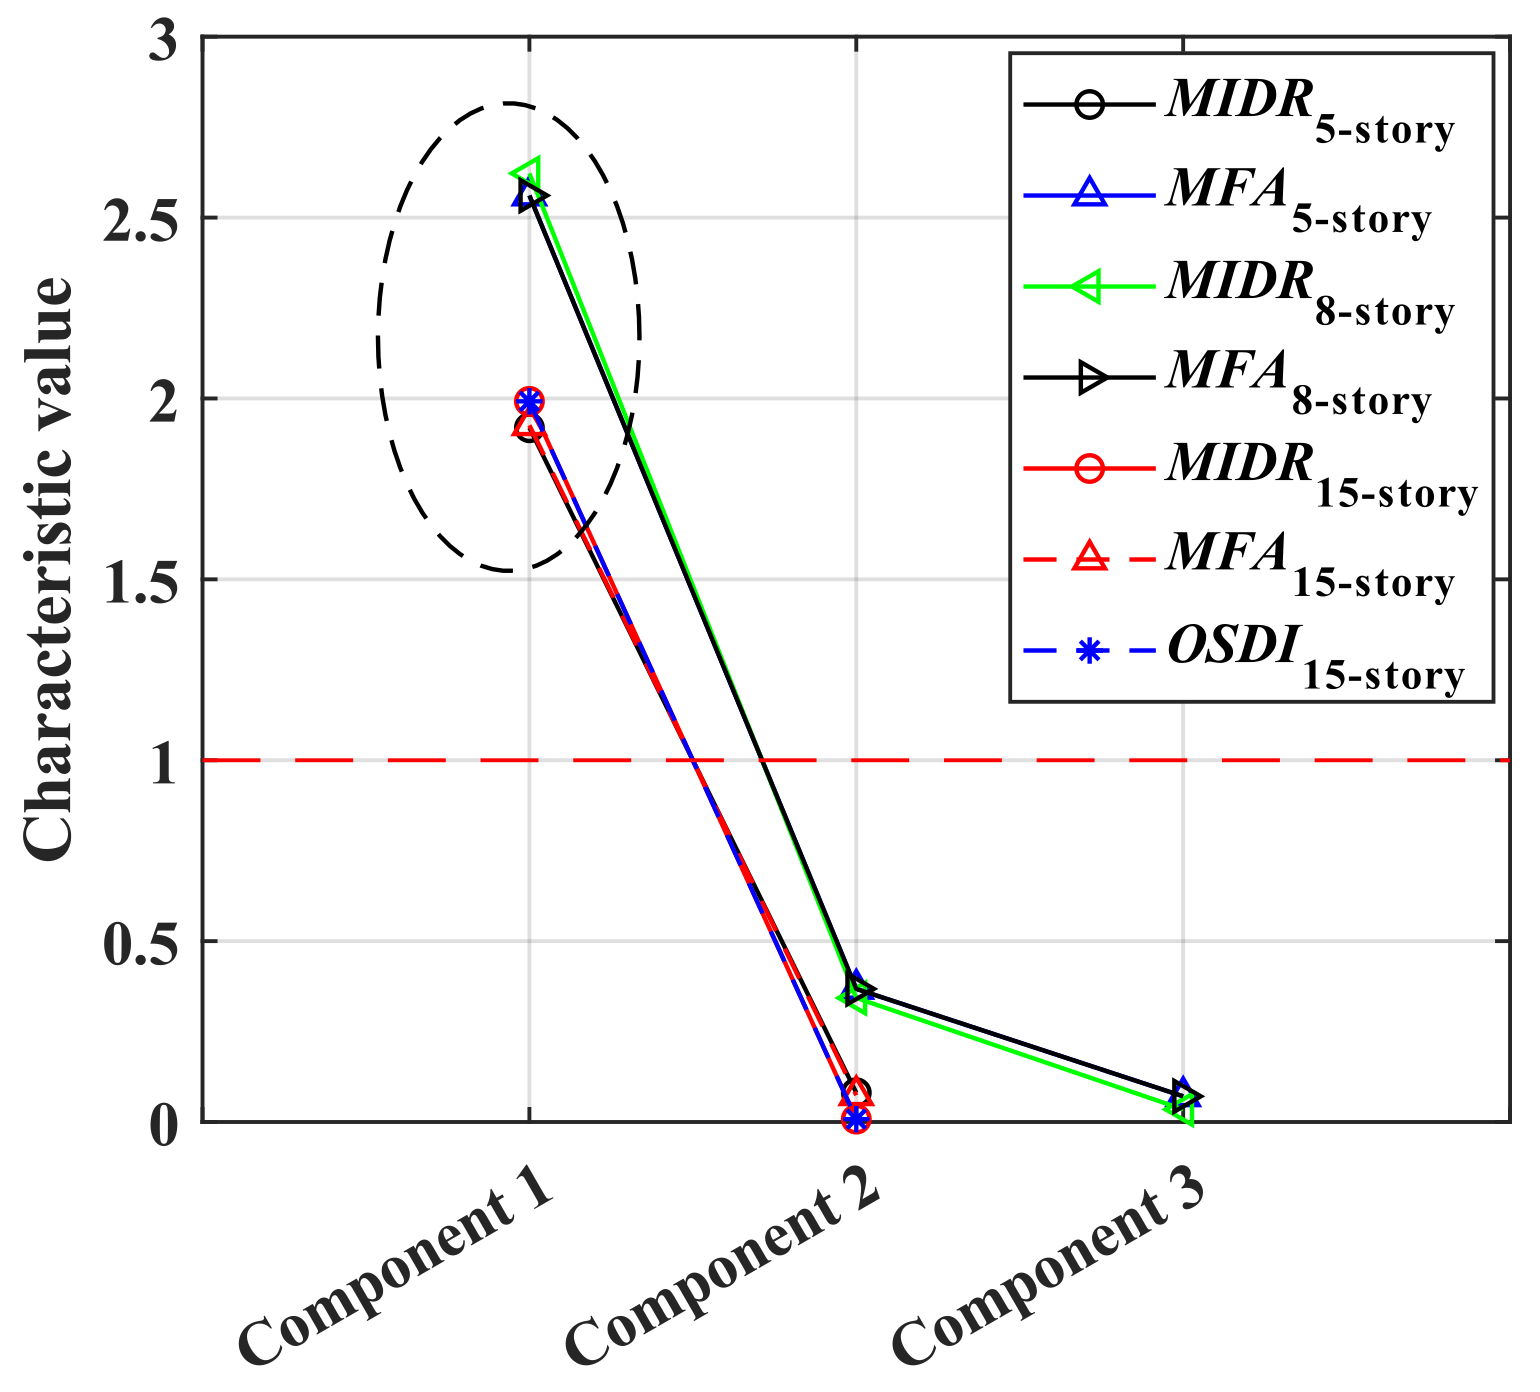
Step 2: The characteristic values of the correlation coefficient matrix are calculated under seven cases, and the calculation results are shown in Figure 13.
Step 3: The number of principal components is determined. There are two situations associated with the determination of the principal component: (1) the cumulative contribution rate of the principal component reaches a certain probability; (2) the characteristic value is greater than one. The second situation is applied to this study. Based on the characteristic values shown in Figure 13, the number of principal components obtained is one. Therefore, only one principal component f1 can be used to characterize the damage potential of ground motions.
Step 4: The pulse-like ground motions are ranked based on the principal components. The pulse-like ground motions can be ranked directly based on the first principal component f1. Each principal component need not be added to determine the comprehensive score. Table 10 shows the correlation coefficients and component score coefficients between the principal component f1 and IMs under the same case. Note that the principal component is highly correlated with other parameters. The principal component f1 is calculated as shown in Equation (8).
f 1 = c 1 I M 1 + c 2 I M 2 + + c n I M n  
where c1, c2, …, cn are the score coefficients of different IMs; n is the number of IMs.

6.2. Ranking of Pulse-like Ground Motions According to Damage Potential

The pulse-like ground motions are ranked according to the selected IMs under different cases, as shown in Table 11. If only one IM is obtained in certain cases, the pulse-like ground motions can be ranked directly based on that IM. In addition, the pulse-like ground motions are ranked according to the principal component f1. Furthermore, the ranking results are obtained for the damage potential of pulse-like ground motions for different structures. The ranking results are shown in Appendix A. Due to the large number of ground motion data points, only a few of the ranked ground motion data points are given. The remaining data points are entered in an MS Excel spreadsheet.

7. Discussion

It is well known that the damage potential of pulse-like ground motions is greater than that of ordinary ground motions. However, previous studies have not yet quantitatively measured the damage potential of pulse-like ground motions for different structures. To solve this challenge, this study proposed a new method to rank pulse-like ground motions based on the damage potential. The method was developed based on 240 pulse-like ground motions and 16 IMs. IMs were employed to describe the damage potential of ground motions, and EDPs were used to characterize the damage state of structures. The relationship between the IMs and EDPs was analyzed based on four representative RC frame structures to cover a wide range of natural vibration periods, which can better represent the variety of actual structures than the traditional studies with close natural vibration periods. The results of this study indicate that there are notable differences between the discreteness of the IMs and the EDPs for the RC frame structures with different natural vibration periods. When MFA is used as the EDP, the acceleration-related IMs can be used to efficiently and sufficiently characterize MFA for all four structures. When MIDR or OSDI is used as the EDP, the acceleration-related, velocity-related, and displacement-related IMs can be used to efficiently and sufficiently characterize EDP for short-period structures (e.g., two-story), medium-period structures (e.g., eight-story), and long-period structures (e.g., fifteen-story), respectively.
In addition, the two cases on the selected IMs shown in Table 8 indicate that: (1) only one optimal IM was obtained for the structures with different natural vibration periods and EDPs, respectively; (2) multiple IMs were obtained, the PCA method was employed to obtain a comprehensive IM to characterize the damage potential of pulse-like ground motions for specific building structures and EDPs. The pulse-like ground motions were ranked based on the selected IM and the comprehensive IM for four structures and three EDPs, respectively. The proposed method can quantitatively evaluate the damage potential of pulse-like ground motions for RC frame structures. Note that the proposed ranking method was validated for four representative RC-frame structures, and the feasibility of the method for more types of structures needs further investigation.

8. Conclusions

In this paper, a new method of ranking pulse-like ground motions based on the damage potential was proposed. Four ordinary representative RC frame structures with different natural vibration periods were built, based on which the IMs that could predict the damage potential of ground motions for structures were analyzed and obtained. Then, the efficiency and sufficiency of the obtained IMs were verified. Finally, the pulse-like ground motions were ranked according to their damage potential. The conclusions of the study are as follows.
(1)
The ground motion IMs that can be used to efficiently and sufficiently predict the EDPs of different structures are obtained by analyzing the efficiency and sufficiency of 16 IMs. First, when the MFA is selected as the EDP, the acceleration-related IMs can efficiently determine the EDP. Second, when MIDR or OSDI is selected as the EDP, the acceleration-related, velocity-related, and displacement-related IMs can be used to effectively determine the EDPs of short-period structures (for example, two-story), medium-period structures (for example, eight-story), and long-period structures (for example, 15-story), respectively.
(2)
The PCA method is used to reduce the variable dimensions of the IMs selected under seven conditions, and the principal component f1 is selected as the comprehensive IM that can reflect the damage potential of multiple IMs.
(3)
The pulse-like ground motions are ranked based on the selected IMs and the comprehensive IM under different cases. Finally, the damage-potential-based ranking of the pulse-like ground motions is completed.
The damage potential ranking method proposed in this study can quantitatively evaluate the damage potential of pulse-like ground motions. The ranking results of 240 pulse-like ground motions provide a database for selecting ground motions in seismic design of RC-frame structures.

Author Contributions

Conceptualization, Q.L. and J.H.; methodology, L.X. (Lili Xie); software, Q.L.; validation, Q.L., J.H., L.X. (Lili Xie) and L.X. (Longjun Xu); formal analysis, L.X. (Longjun Xu) and S.L.; investigation, S.L.; resources, S.L.; data curation, Q.L.; writing—original draft preparation, Q.L.; writing—review and editing, J.H.; visualization, J.H.; supervision, L.X. (Lili Xie); project administration, L.X. (Longjun Xu); funding acquisition, L.X. (Longjun Xu). All authors have read and agreed to the published version of the manuscript.

Funding

This research was funded by the National Natural Science Foundation of China, grant number [U2139207; U1939210]. Additionally, the APC was funded by [U2139207].

Institutional Review Board Statement

Not applicable.

Informed Consent Statement

Not applicable.

Data Availability Statement

Not applicable.

Acknowledgments

The work is supported by the National Natural Science Foundation of China (Grant No. U2139207; U1939210). The support is gratefully acknowledged. The authors would also like to thank the NGA-West2 database for providing the strong ground motion data.

Conflicts of Interest

The authors declare no conflict of interest.

Appendix A

Table A1. Damage potential ranking of pulse-like ground motions.
Ranking Number2-Story5-Story8-Story15-Story
MIDR and MFAOSDIMIDRMFAOSDIMIDRMFAOSDIMIDR and OSDIMFA
1GBZ000GBZ000H-E03140H-E05140SKR090SKR090H-E05140TCU059-NTCU059-NH-E05140
6PUL194PUL194SCE288DZC270SCE288YPT330DZC270TCU057-WTCU057-WDZC270
11H-E03230H-E03230WPI046PAR--TWPI046TCU060-WPAR--TSCR090TCU026-WH-E03230
16H-E11230H-E11230LDM334TCU068-NH-E10320TCU115-WTCU068-NA-BIR180SHI000SCR090
21DZC180DZC180CPM000H-E06140WPI316DZC270H-E06140SCE288TCU046-WH-ECC002
26TAK090TAK090TCU060-WTCU057-WTCU059-WH-E11230TCU057-WTCU115-WTCU065-WTCU057-W
31H-E06140H-E06140ERZ-NSCPM000ERZ-NSERZ-NSCPM000CHY002-NTCU056-NSKR090
36LCN000LCN000MUL279D-TSM270CNP196TCU116-WD-TSM270SHI000TCU029-NWPI316
41ORR090ORR090WVC000SCE018WVC000WPI316SCE018CPM000TCU076-NLDM334
46A-OR2010A-OR2010ORR090TCU128-WH-E04230LDM334TCU128-WH-E11230CHY101-WSCE018
51CPM000CPM000H-HVP225SPV270D-TSM270H-HVP315SPV270TCU103-WTCU045-WTCU111-W
56LDM334LDM334D-TSM360DZC180STN110H-ECC002DZC180TCU057-NCHY029-NSCS142
61GOF090GOF090TCU120-WRIO270TCU063-NORR090RIO270TCU063-NTCU047-NTCU059-W
66HSP000HSP00040I07EWMUL279H-BRA315A-OR2010MUL279WVC000TCU094-WUNI005
71STG000STG000A-ZAK360MVH135H-E08140SPV270MVH135TCU087-WTCU100-WTCU038-W
7640E01EW40E01EWYER270NAS270H-BRA22540I07EWNAS270TCU049-WTCU064-NTCU068-W
81TCU059-NTCU059-NMU2035WWT180LOS000TRI090WWT180TCU096-WILA037-NH-BRA225
86CPM090CPM090H-AGR273H-HVP225TCU095-NTCU060-NH-HVP225A-OR2010TCU070-NERZ-NS
9140I01EW40I01EWCPM090D-PVY045DZC180TCU026-WD-PVY045H-BRA315TCU098-ND-PVY045
96UNI005UNI005TCU055-NTCU057-NTCU068-NTCU103-WTCU057-NH-E06140HSP000H-E10050
101SCS052SCS052A-BAG270TAB-LNCYC285TCU076-NTAB-LNTCU095-NTCU095-WARC090
106WWT270WWT27040E01EWWVC270D-OLC270TCU136-EWVC270TCU026-WCHY006-EWVC270
111TCU115-WTCU115-WTCU052-WTCU116-WNPS21040E01EWTCU116-WTCU068-NYPT330BOL090
116TCU045-NTCU045-NSPG36040E01EWG01090TCU040-N40E01EWTCU039-NA02043A-ZAK360
121TCU031-WTCU031-WA02043TCU040-NH-QKP085TCU045-NTCU040-NJEN022H-AGR273TCU040-N
126TCU049-NTCU049-NMUL009TAZ000TCU048-NTCU049-WTAZ000TCU076-NA02133TCU117-W
131STG090STG090TCU049-NSTG000GAZ000MU2035STG000MU2035TCU064-WSTG000
136TCU117-WTCU117-WH-AGR003TCU105-NTCU109-WG01090TCU105-NPAC265TCU075-WKJM090
141TCU046-WTCU046-WTCU104-NH-E11140GOF090H-BRA225H-E11140TCU051-W40I01EWH-BRA315
146S2330S2330TCU026-WTCU100-NTCU128-NC02065TCU100-NTCU042-WH-HVP315TCU045-N
151KJM090KJM090TAB-TRHVR240ARC090TCU039-WHVR240TCU076-WWPI316HVR240
156PAC175PAC175TCU034-WTCU098-NTCU018-WTCU017-WTCU098-NH-E06230H-E03140TAZ090
161A02133A02133FOR000A02133TCU046-WSTG000A02133LGP000CHY002-NH-QKP085
166G06090G06090TAZ000TCU055-NH-AEP045TCU083-WTCU055-NTCU036-NGOF090TAB-TR
171TCU083-WTCU083-WTCU031-WTCU104-NTCU105-WTCU105-WTCU104-NTCU070-NNAS270TCU095-N
176TCU048-NTCU048-NTCU050-NTCU039-NSCS052TCU017-NTCU039-NDZC180PAR--LNSY-N
181TCU050-WTCU050-WSTG000TCU103-WTCU003-WCHY101-NTCU103-WTCU048-NTAK000TCU109-W
186PRS090PRS090TCU067-WH-FRN044PAC175D-OLC270H-FRN044KJM090PRS090TCU029-N
191TCU104-WTCU104-WTCU015-WTCU087-WTCU050-WMUL009TCU087-W40I07EWCNP196H-FRN044
196TCU064-WTCU064-WTCU076-NTCU015-WTCU104-WH-QKP085TCU015-WTCU067-NG06230TCU015-W
201TCU105-WTCU105-WTCU083-WTCU010-WTCU083-WTCU064-WTCU010-WTCU053-NMU2035TCU104-W
206CHY080-NCHY080-NTCU029-NTCU083-WTCU051-WTCU036-NTCU083-WG06090CYC195TCU065-W
211TCU029-WTCU029-WTCU047-NTCU096-WCHY101-NTCU089-NTCU096-WTCU095-WGAZ000TCU095-W
216JEN292JEN292TCU098-WTCU064-WTCU089-NPAC175TCU064-WH-QKP085H-BRA225TCU064-W
221GAZ090GAZ090S2330TCU076-NTCU075-WCHY029-NTCU076-NH-FRN044H-E08140TCU053-W
226TCU-ETCU-ETCU029-WCHY080-WTCU064-NCHY028-WCHY080-WPAC175CPM090CHY080-W
231CHY080-WCHY080-WTCU087-NCHY029-NTCU-EH-ECC092CHY029-NCHY029-NH-E07140CHY029-N
236TCU067-NTCU067-NTCU067-NTCU067-NTCU067-N40I01EWTCU067-NTCU067-WLDM064TCU067-N
Note: 1. Due to the large number of ground motion records, only a part of the ground motion records are given. Others are given in electronic form. 2. For the same structure, when the IMs representing the two structural response indexes are the same, a ranking result is used.

References

  1. Kalkan, E.; Kunnath, S.K. Effects of fling step and forward directivity on seismic response of buildings. Earthq. Spectra 2006, 22, 367–390. [Google Scholar] [CrossRef]
  2. Sehhati, R.; Rodriguezm, M.A.; Elgawady, M.; Cofer, W.F. Effects of near-fault ground motions and equivalent pulses on multi-story structures. Eng. Struct. 2011, 33, 767–779. [Google Scholar] [CrossRef]
  3. Champion, C.; Liel, A. The effect of near-fault directivity on building seismic collapse risk. Earthq. Eng. Struct. Dynam. 2012, 41, 1391–1409. [Google Scholar] [CrossRef]
  4. Wen, W.P.; Zhai, C.H.; Li, S.; Chang, Z.W.; Xie, L.L. Constant damage inelastic displacement for the near-fault pulse-like ground motions. Eng Struct. 2014, 59, 599–607. [Google Scholar] [CrossRef]
  5. Bazzurro, P. Probabilistic Seismic Demand Analysis. Ph.D. Thesis, Department of Civil Engineering, Stanford University, Stanford, CA, USA, 1998. [Google Scholar]
  6. FEMA-355; State of the Art Report on Systems Performance of Steel Moment Frames Subject to Earthquake Ground Shaking. SAC Joint Venture: Sacramento, CA, USA, 2000.
  7. Moehle, J.; Deierlein, G.G. A framework methodology for performance-based earthquake engineering. In Proceedings of the 13th World Conference on Earthquake Engineering, Vancouver, BC, Canada, 1–6 August 2004. [Google Scholar]
  8. Kostinakis, K.; Fontara, I.K.; Athanatopoulou, A.M. Scalar Structure-Specific Ground Motion Intensity Measures for Assessing the Seismic Performance of Structures: A Review. J. Earthq. Eng. 2018, 22, 630–665. [Google Scholar] [CrossRef]
  9. Ebrahimian, H.; Jalayer, F.; Lucchini, A.; Mollaioli, F.; Manfredi, G. Preliminary ranking of alternative scalar and vector intensity measures of ground shaking. Bull. Earthq. Eng. 2015, 13, 2805–2840. [Google Scholar] [CrossRef]
  10. Iervolino, I.; Chioccarelli, E.; Baltzopoulos, G. Inelastic displacement ratio of near-source pulse-like ground motions. Earthq. Eng. Struct. Dyn. 2012, 41, 2351–2357. [Google Scholar] [CrossRef]
  11. Yazdani, A.; Yazdannejad, K. Estimation of the seismic demand model for different damage levels. Eng. Struct. 2019, 194, 183–195. [Google Scholar] [CrossRef]
  12. Kramer, S.L. Geotechnical Earthquake Engineering; Prentice Hall: Englewood Cliffs, NJ, USA, 1996. [Google Scholar]
  13. Shome, N.; Cornell, C.A.; Bazzurro, P.; Carballo, J.E. Earthquakes, records and nonlinear responses. Earthq. Spectra 1998, 14, 469–500. [Google Scholar] [CrossRef]
  14. Gardoni, P.; Mosalam, K.M.; Kiureghian, A.D. Probabilistic seismic demand models and fragility estimates for R.C. bridges. J. Earthq. Eng. 2003, 7, 79–106. [Google Scholar] [CrossRef]
  15. Jalayer, F. Direct Probabilistic Seismic Analysis: Implementing Nonlinear Dynamic Assessments. Ph.D. Thesis, Department of civil and Environmental Engineering, Stanford University, Stanford, CA, USA, 2003. [Google Scholar]
  16. Baker, J.W.; Cornell, C.A. A vector-valued ground motion intensity measure consisting of spectral acceleration and epsilon. Earthq. Eng. Struct. Dyn. 2005, 34, 1193–1217. [Google Scholar] [CrossRef]
  17. Ramamoorthy, S.K. Seismic Fragility Estimates for Reinforced Concrete Framed Buildings. Ph.D. Thesis, Texas A&M University, College Station, TX, USA, 2006. [Google Scholar]
  18. Tothong, P.; Cornell, C.A. Structural performance assessment under near-source pulse-like ground motions using advanced ground motion intensity measures. Earthq. Eng. Struct. Dyn. 2008, 37, 1013–1037. [Google Scholar] [CrossRef]
  19. Jeong, S.H.; Mwafy, A.M.; Elnashai, A.S. Probabilistic seismic performance assessment of code-compliant multi-story RC buildings engineering structures. Eng. Struct. 2012, 34, 527–537. [Google Scholar] [CrossRef]
  20. Zhang, Y.; He, Z. Appropriate ground motion intensity measures for estimating the earthquake demand of floor acceleration-sensitive elements in super high-rise buildings. Struct. Infrastruct. Eng. 2018, 15, 1–17. [Google Scholar] [CrossRef]
  21. Guan, M.; Du, H.; Cui, J.; Zeng, Q.; Jiang, H. Optimal ground motion intensity measure for long-period structures. Meas. Sci. Technol. 2015, 26, 105001. [Google Scholar] [CrossRef]
  22. Tothong, P.; Luco, N. Probabilistic seismic demand analysis using advanced ground motion intensity measures. Earthq. Eng. Struct. Dyn. 2007, 36, 1837–1860. [Google Scholar] [CrossRef]
  23. Zengin, E.; Abrahamson, N.A. A vector-valued intensity measure for near-fault ground motions. Earthq. Eng. Struct. Dyn. 2020, 49, 716–734. [Google Scholar] [CrossRef]
  24. Jamshidiha, H.R.; Yakhchalian, M. New vector-valued intensity measure for predicting the collapse capacity of steel moment resisting frames with viscous dampers. Soil. Dyn. Earthq. Eng. 2019, 125, 105625. [Google Scholar] [CrossRef]
  25. Luco, N.; Cornell, C.A. Structure-specific scalar intensity measures for near-source and ordinary earthquake ground motions. Earthq. Spectra 2007, 23, 357–392. [Google Scholar] [CrossRef] [Green Version]
  26. Dávalos, H.; Miranda, E. Filtered incremental velocity: A novel approach in intensity measures for seismic collapse estimation. Earthq. Eng. Struct. Dyn. 2019, 48, 1384–1405. [Google Scholar] [CrossRef]
  27. Jalayer, F.; Beck, J.L.; Zareian, F. Analyzing the sufficiency of alternative scalar and vector intensity measures of ground shaking based on information theory. J. Eng. Mech. 2012, 138, 307–316. [Google Scholar] [CrossRef]
  28. Palanci, M.; Senel, S.M. Correlation of earthquake intensity measures and spectral displacement demands in building type structures. Soil. Dyn. Earthq. Eng. 2019, 121, 306–326. [Google Scholar] [CrossRef]
  29. Yakhchalian, M.; Ghodrati, A.G. A vector intensity measure to reliably predict maximum drift in low- to mid-rise buildings. Proc. Inst. Civ. Eng. Struct. Build. 2019, 172, 42–54. [Google Scholar] [CrossRef]
  30. Dávalos, H.; Miranda, E. Robustness evaluation of fiv3 using near-fault pulse-like ground motions. Eng. Struct. 2021, 230, 111694. [Google Scholar] [CrossRef]
  31. Papasotiriou, A.; Athanatopoulou, A. Seismic Intensity Measures Optimized for Low-rise Reinforced Concrete Frame Structures. J. Earthq. Eng. 2021, 25, 1–39. [Google Scholar] [CrossRef]
  32. Zhai, C.H.; Li, C.H.; Kunnath, S. An efficient algorithm for identifying pulse-like ground motions based on significant velocity half-cycles. Earthq. Eng. Struct. Dyn. 2018, 47, 757–777. [Google Scholar] [CrossRef]
  33. Chen, X.Y.; Wang, D.S.; Zhang, R. Identification of Pulse Periods in Near-Fault Ground Motions Using the HHT Method. Bull. Seismol. Soc. Am. 2019, 109, 201–212. [Google Scholar] [CrossRef]
  34. Ye, L.P.; Ma, Q.L.; Miao, Z.W.; Guan, H.; Yan, Z.G. Numerical and comparative study of earthquake intensity indices in seismic analysis. Struct. Des. Tall. Spec. 2013, 22, 362–381. [Google Scholar] [CrossRef] [Green Version]
  35. Zhai, C.H.; Chang, Z.W.; Li, S.; Xie, L.L. Selection of the most unfavorable real ground motions for low- and mid-rise RC frame structures. J. Earthq. Eng. 2013, 17, 1233–1251. [Google Scholar] [CrossRef]
  36. Li, S.; He, Y.; Wei, Y. Truncation Method of Ground Motion Records Based on the Equivalence of Structural Maximum Displacement Responses. J. Earthq. Eng. 2021, 5, 1–22. [Google Scholar] [CrossRef]
  37. Reinhorn, A.M.; Roh, H.; Sivaselvan, M.; Kunnath, S.K.; Valles, R.E.; Madan, A.; Li, C.; Lobo, R.; Park, Y.J. IDARC-2D Version 7: A Program for Inelastic Damage Analysis of Structures; State University of New York: Buffalo, NY, USA, 2010. [Google Scholar]
  38. Ibarra, L.F.; Medina, R.A.; Krawinkler, H. Hysteretic models that incorporate strength and stiffness deterioration. Earthq. Eng. Struct. Dyn. 2005, 34, 1489–1511. [Google Scholar] [CrossRef]
  39. Ibarra, L.F.; Krawinkler, H. Variance of collapse capacity of SDOF systems under earthquake excitations. Earthq. Eng. Struct. Dyn. 2011, 40, 1299–1314. [Google Scholar] [CrossRef]
  40. Zelaschi, C.; Ricardo, M.; Rui, P. Critical Assessment of Intensity Measures for Seismic Response of Italian RC Bridge Portfolios. J. Earthq. Eng. 2019, 23, 980–1000. [Google Scholar] [CrossRef]
  41. Baker, J.; Cornell, C.A. Spectral shape, epsilon and record selection. Earthq. Eng. Struct. Dyn. 2006, 35, 1077–1095. [Google Scholar] [CrossRef]
  42. Yang, G.; Xie, L.; Li, A.Q. Ground motion intensity measures for seismically isolated RC tall buildings. Soil. Dyn. Earthq. Eng. 2019, 125, 105727. [Google Scholar] [CrossRef]
  43. Goodman, S. A dirty dozen: Twelve p-value misconceptions. Seminars in Hematology. WB Saunders. 2008, 45, 135–140. [Google Scholar]
  44. Kim, K.I.; Jung, K.; Hang, J.K. Face recognition using kernel principal component analysis. IEEE. Signal. Proc. Lett. 2002, 9, 40–42. [Google Scholar]
  45. Sayed, A.A. Principal component analysis within nuclear structure. Nucl. Phys. A 2015, 933, 154–164. [Google Scholar] [CrossRef] [Green Version]
  46. Ana, F.N.; Filipe, M.; Diego, Z.S. Deep Learning Enhanced Principal Component Analysis for Structural Health Monitoring. Struct. Health Monit. 2022, 10, 14759217211041684. [Google Scholar]
Figure 1. Technical framework.
Buildings 12 00754 g001
Figure 2. Velocity time-history of pulse-like and non-pulse-like ground motions. (a) Pulse-like ground motion; (b) non-pulse-like ground motion.
Buildings 12 00754 g002
Figure 3. Station distribution of selected pulse-like ground motions.
Buildings 12 00754 g003
Figure 4. Distribution ranges of M, R, and Vs30 of the selected pulse-like ground motions. (a) Vs30-M; (b) Vs30-R.
Buildings 12 00754 g004
Figure 5. Backbone curve for improved I-K hysteretic model.
Buildings 12 00754 g005
Figure 6. Elevation of four representative reinforced concrete frame structures (unit: mm).
Buildings 12 00754 g006aBuildings 12 00754 g006b
Figure 7. R2 of IMs and MIDR, obtained via the cloud analysis of four typical structures subjected to pulse-like ground motions.
Buildings 12 00754 g007
Figure 8. R2 of IMs and MFA, obtained via the cloud analysis of four typical structures subjected to pulse-like ground motions.
Buildings 12 00754 g008
Figure 9. R2 of IMs and OSDI, obtained via the cloud analysis of four typical structures subjected to pulse-like ground motions.
Buildings 12 00754 g009
Figure 10. I (IM2IM1) between IMs and MIDR, obtained via the cloud analysis of four typical structures subjected to pulse-like ground motions.
Buildings 12 00754 g010
Figure 11. I (IM2IM1) between IMs and MFA, obtained via the cloud analysis of four typical structures subjected to pulse-like ground motions.
Buildings 12 00754 g011
Figure 12. I (IM2IM1) between IMs and OSDI, obtained via the cloud analysis of four typical structures subjected to pulse-like ground motions.
Buildings 12 00754 g012
Figure 13. Characteristic values of different components.
Buildings 12 00754 g013
Table 1. Selected IMs..
NoteGround Motion IMsExpression
IM1Peak ground acceleration (PGA) P G A = max a ( t )
IM2Peak ground velocity (PGV) P G V = max ν ( t )
IM3Peak ground displacement (PGD) P G D = max d ( t )
IM4Bracketed duration (Db) D b = max ( t ) min ( t )
IM5Uniform duration (Du) D u = 0 H a t a 0 d t
IM6Significant duration (Ds) D s = t 95 t 5
IM7Effective peak acceleration (EPA) E P A = S a / 2 . 5
IM8Effective peak velocity (EPV) E P V = S v / 2 . 5
IM9Housner intensity (SI) S I ζ = 0.1 2.5 S v ξ , T d T
IM10Cumulative absolute velocity (CAV) C A V t = i t i t i + 1 W i A t d t
IM11Maximum incremental velocity (MIV)-
IM12Maximum incremental displacement (MID)-
IM13Spectral acceleration at the first mode period of vibration (Sa (T1))-
IM14Spectral velocity at the first mode period of vibration (Sv (T1))-
IM15Spectral displacement at the first mode period of vibration (Sd (T1))-
IM16Relative input energy at the first mode period of vibration Ei (T1) E T 1 = 2 a g v d t
Table 2. Natural vibration periods and types of structures.
Building StructuresNatural Vibration Period T1Structure Types
2-story0.20 sShort period
5-story0.89 sShort and middle period
8-story1.73 sMiddle and long period
15-story2.73 sLong period
Table 3. Beam section properties of four RC frame buildings.
StructureStorySection Size (mm × mm)Area of Longitudinal Reinforcement (mm2)/Stirrup (mm2)
Side ColumnMiddle ColumnSide ColumnMiddle Column
2-story1–2600 × 300600 × 3001313/φ8@1001313/φ8@100
5-story1–4500 × 250400 × 2501008/φ8@100763/φ8@200
5500 × 250400 × 250763/φ8@200603/φ8@200
8-story1–4500 × 250500 × 2501296/φ8@100710/φ8@200
5–6500 × 250500 × 2501015/φ8@100710/φ8@200
7–8500 × 250500 × 250710/φ8@100710/φ8@200
15-story1–7600 × 250450 × 2501964/φ8@100935/φ8@100
8–10600 × 250450 × 2501742/φ8@100833/φ8@100
11–12600 × 250450 × 2501520/φ8@100833/φ8@100
13–14600 × 250450 × 2501250/φ8@100833/φ8@100
15600 × 250450 × 250942/φ8@100755/φ8@100
The yielding strength fyk of main reinforcement rebars is 400 MPa, and the yielding strength fyk of stirrups is 300 MPa.
Table 4. Column section properties for four RC frame buildings.
StructureStorySection Size (mm × mm)Area of Longitudinal Reinforcement (mm2)/Stirrup (mm2)
Side ColumnMiddle ColumnSide ColumnMiddle Column
2-story1–2700 × 700700 × 7002330/φ8@1002330/φ8@100
5-story1–5500 × 500500 × 5002512/φ8@1002512/φ8@100
8-story1–5550 × 550550 × 5502733/φ8@1002733/φ8@100
6–8500 × 500600 × 6002035/φ8@1002035/φ8@100
15-story1–5650 × 650650 × 6504560/φ10@1004560/φ10@100
6–10600 × 600600 × 6003807/φ10@1003807/φ10@100
11–15550 × 550550 × 5503411/φ8@1003411/φ8@100
The yielding strength fyk of main reinforcement rebars is 400 MPa, and the yielding strength fyk of stirrups is 300 MPa.
Table 5. Engineering demand parameters considered in the study.
NumNotationName
1MIDRMaximum inter-story drift ratio
2MFAMaximum floor acceleration
3OSDIOverall structural damage index
Table 6. The most efficient IMs for different typical structures.
ModelsMIDRMFAOSDI
2-storyEPA, Sa (T1), Sd (T1)EPA, Sa (T1), Sd (T1)EPA, Sa (T1), Sd (T1)
5-storySI, EPV, Sa (T1)PGA, EPA, EPVSI, Sa (T1), Sd (T1)
8-storyPGV, Sd (T1), Ei (T1)PGA, EPA, EPVPGV, Sd (T1), E(T1)
15-storyPGD, MID, Sd (T1)PGA, EPA, SIPGD, MID, Sd (T1)
Table 7. The most sufficient IMs for different structures.
Building Structure MIDRMFAOSDI
2-storySa (T1)Sa (T1)EPA
5-storySI, EPVPGA, EPA, EPV, Sv (T1)SI
8-storyPGV, Sd (T1), Ei (T1)PGA, Ds, EPA, EPV, SIMIV, Sv (T1), Sd (T1)PGV, Sd (T1), Ei (T1)
15-storyPGD, MIDPGA, Ds, EPA, EPV, SIPGD, MID, Sd (T1)
Table 8. The most efficient and sufficient IMs for different buildings.
Building StructureMIDRMFAOSDI
2-storySa (T1)Sa (T1)EPA
5-storySI, EPVPGA, EPA, EPVSI
8-storyPGV, Sd (T1), E(T1)PGA, EPA, EPVPGV
15-storyPGD, MIDPGA, EPAPGD, MID
Table 9. Correlation coefficients for related parameters (p < 0.05).
Correlation CoefficientsPGAPGVPGDEPVSd (T1 = 1.73 s)
MID--0.99--
EPA0.93--0.68-
EPV0.73----
SI---0.92-
Sd (T1 = 1.73 s)-0.73---
Ei (T1 = 1.73 s)-0.73--0.97
Table 10. Correlation coefficients and score coefficients between principal component f1 and corresponding values.
Building StructureEDPIMCorrelation Coefficient (p < 0.05)Score Coefficient
5-storyMIDRSI0.980.51
EPV0.980.51
MFAPGA0.960.38
EPA0.950.37
EPV0.860.34
8-storyMIDRPGV0.870.33
Sd (T1)0.970.37
Ei (T1)0.970.37
MFAPGA0.960.38
EPA0.950.37
EPV0.860.34
15-storyMIDRPGD1.000.50
MID1.000.50
MFAPGA0.980.51
EPA0.980.51
OSDIPGD1.000.50
MID1.000.50
Table 11. Ranking of pulse-like ground motions based on optimal IMs under different cases.
Type of StructuresRepresentative StructuresMIDRMFAOSDI
Low period2-storySa (T1)Sa (T1)EPA
Low and middle period5-storyf1, (SI, EPV)f1, (PGA, EPA, EPV)SI
Middle and tall period8-storyf1, (PGV, Sa (T1), E(T1))f1, (PGA, EPA, EPV)PGV
Tall period15-storyf1, (PGD, MID)f1, (PGA, EPA)f1, (PGD, MID)
Publisher’s Note: MDPI stays neutral with regard to jurisdictional claims in published maps and institutional affiliations.

