
Immersive Technology Implementation in the Construction Industry: Modeling Paths of Risk


Abstract
:1. Introduction
2. Review of Related Literature
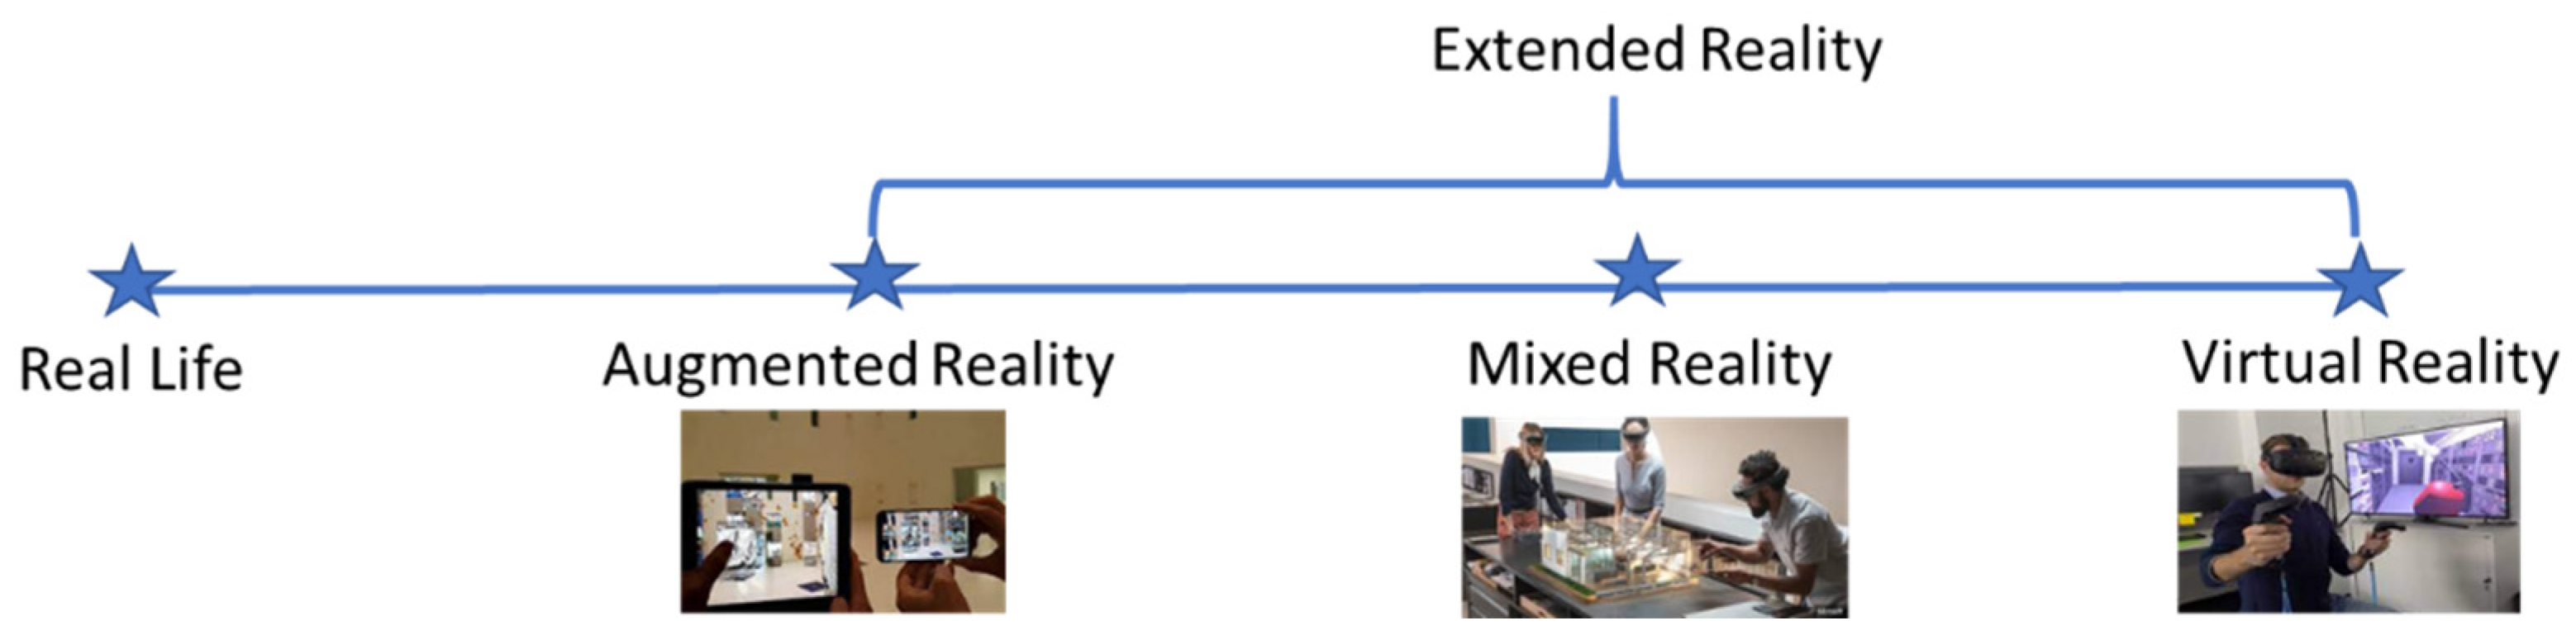
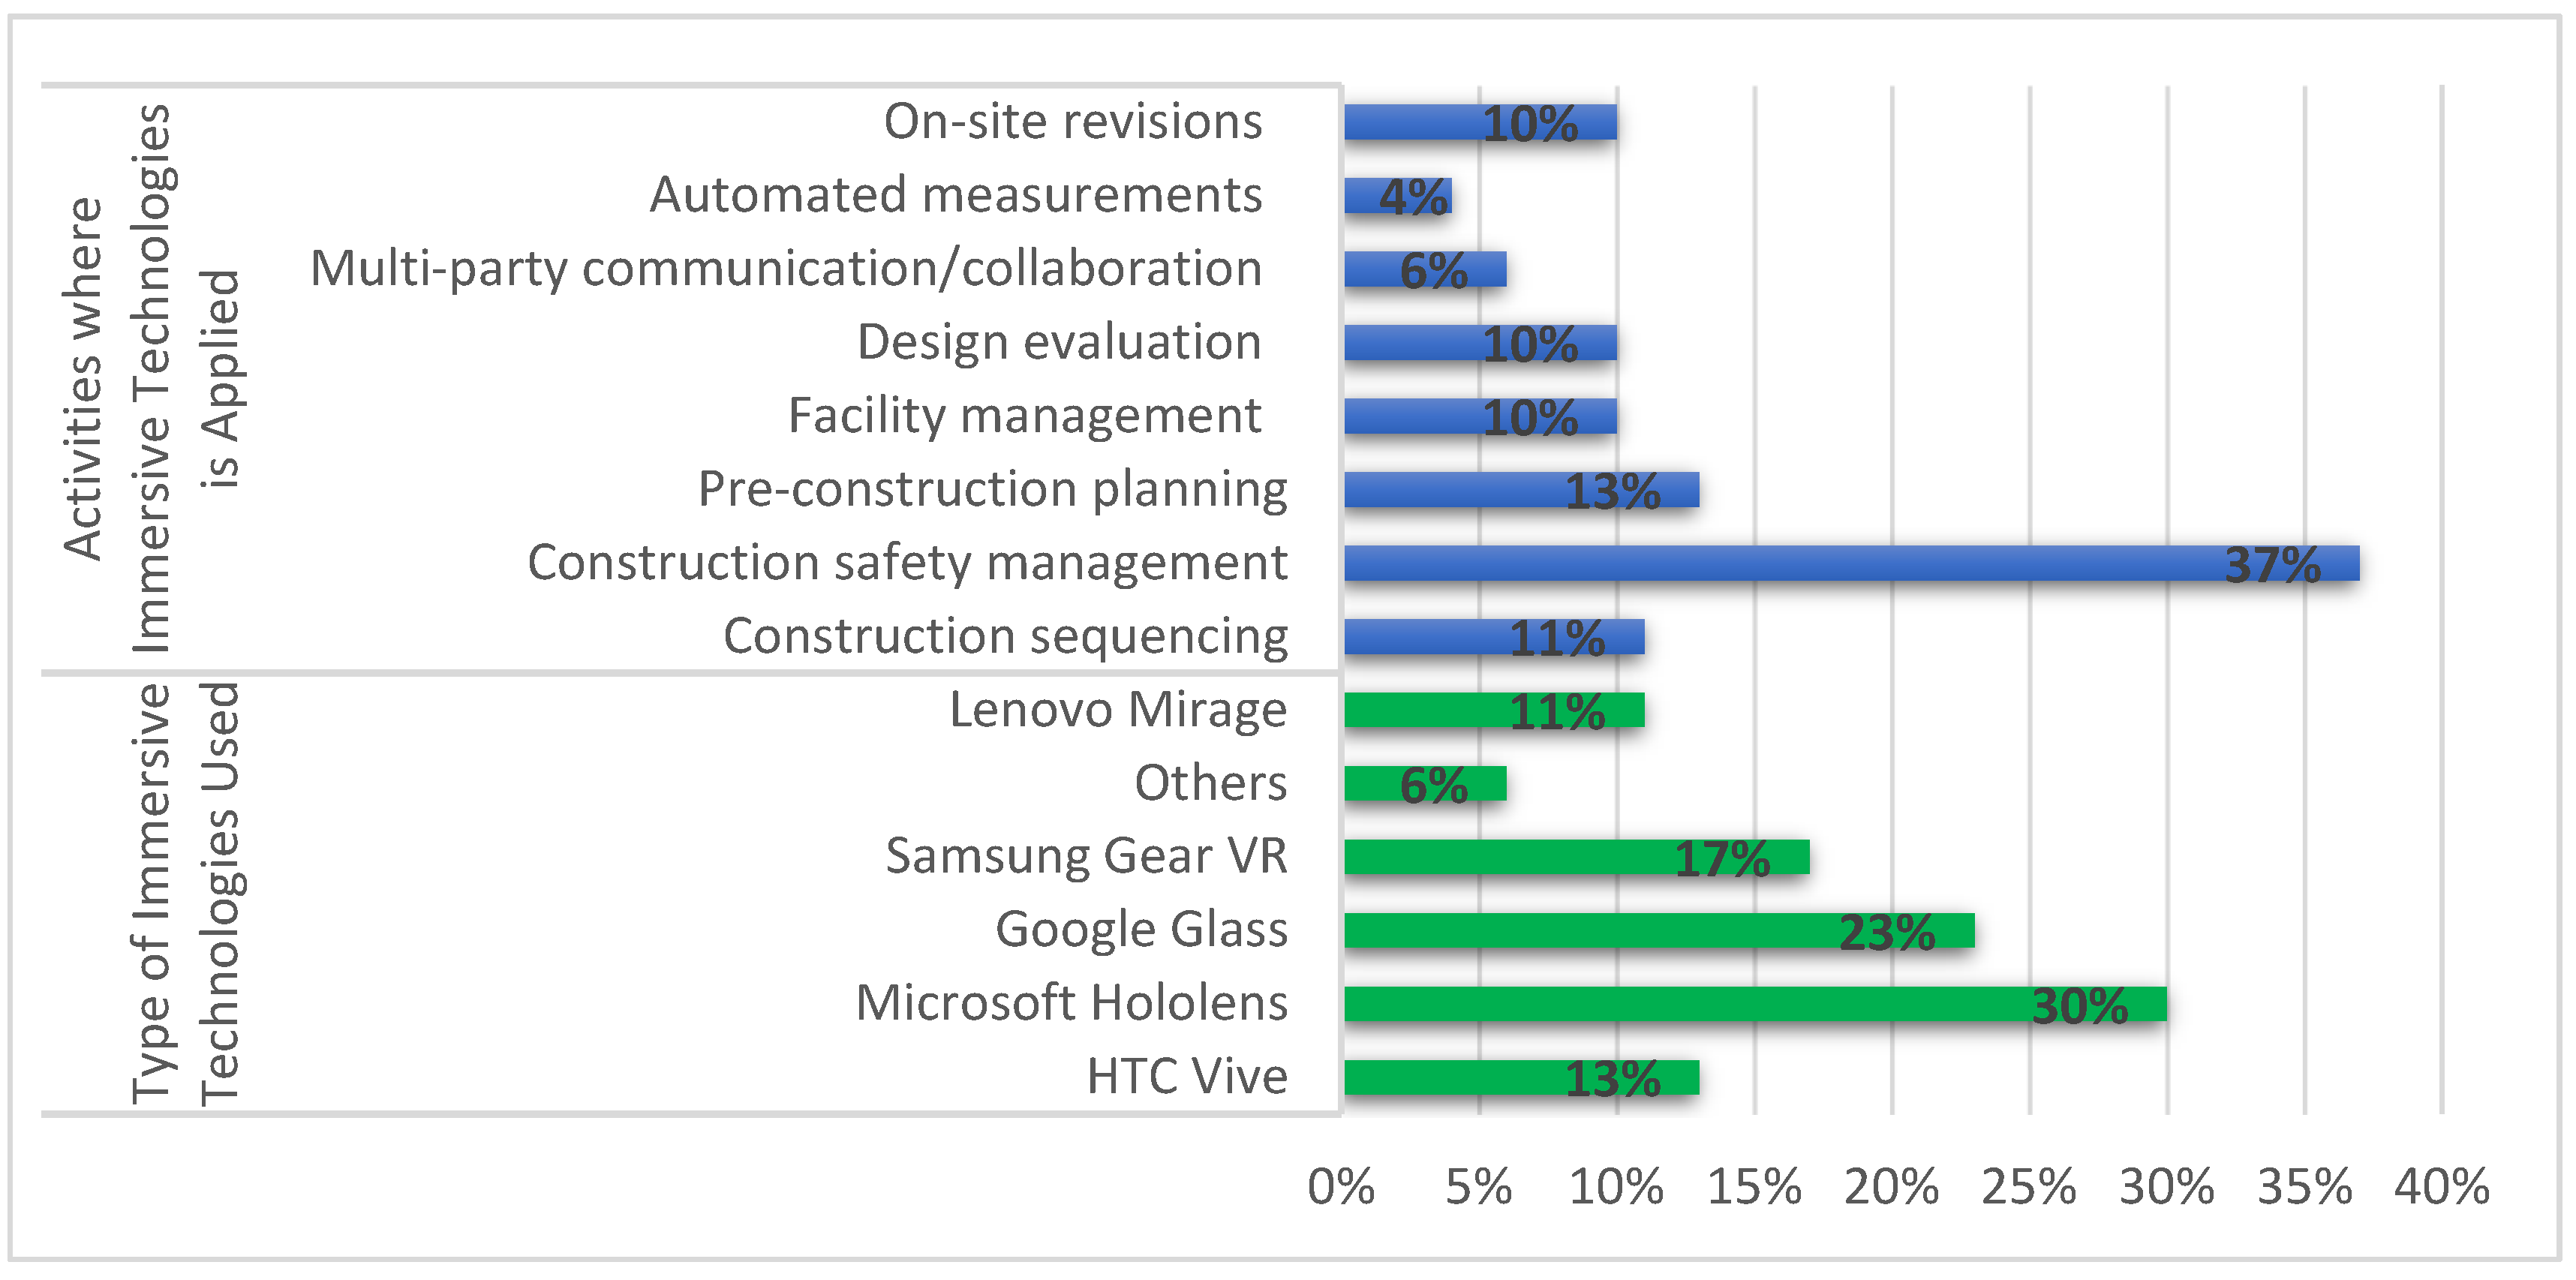
2.1. Application of Immersive Technologies/Extended Reality in AEC
2.2. Factors Impacting the Implementation of ImTs in the A.E.C. Industry
3. Methods
3.1. Literature Review
- The application of ImTs on a construction project;
- The challenges impacting the implementation of ImTs in occupational settings; or
- Risk factors impeding the adoption of emerging technologies in the construction industry.
3.2. Survey Development
3.3. Survey Distribution
3.4. Statistical Analysis
3.4.1. Risk Quantification
3.4.2. Risk Path Analysis
4. Results
4.1. Demographics
4.2. Risk Factors Preventing the Implementation of ImTs
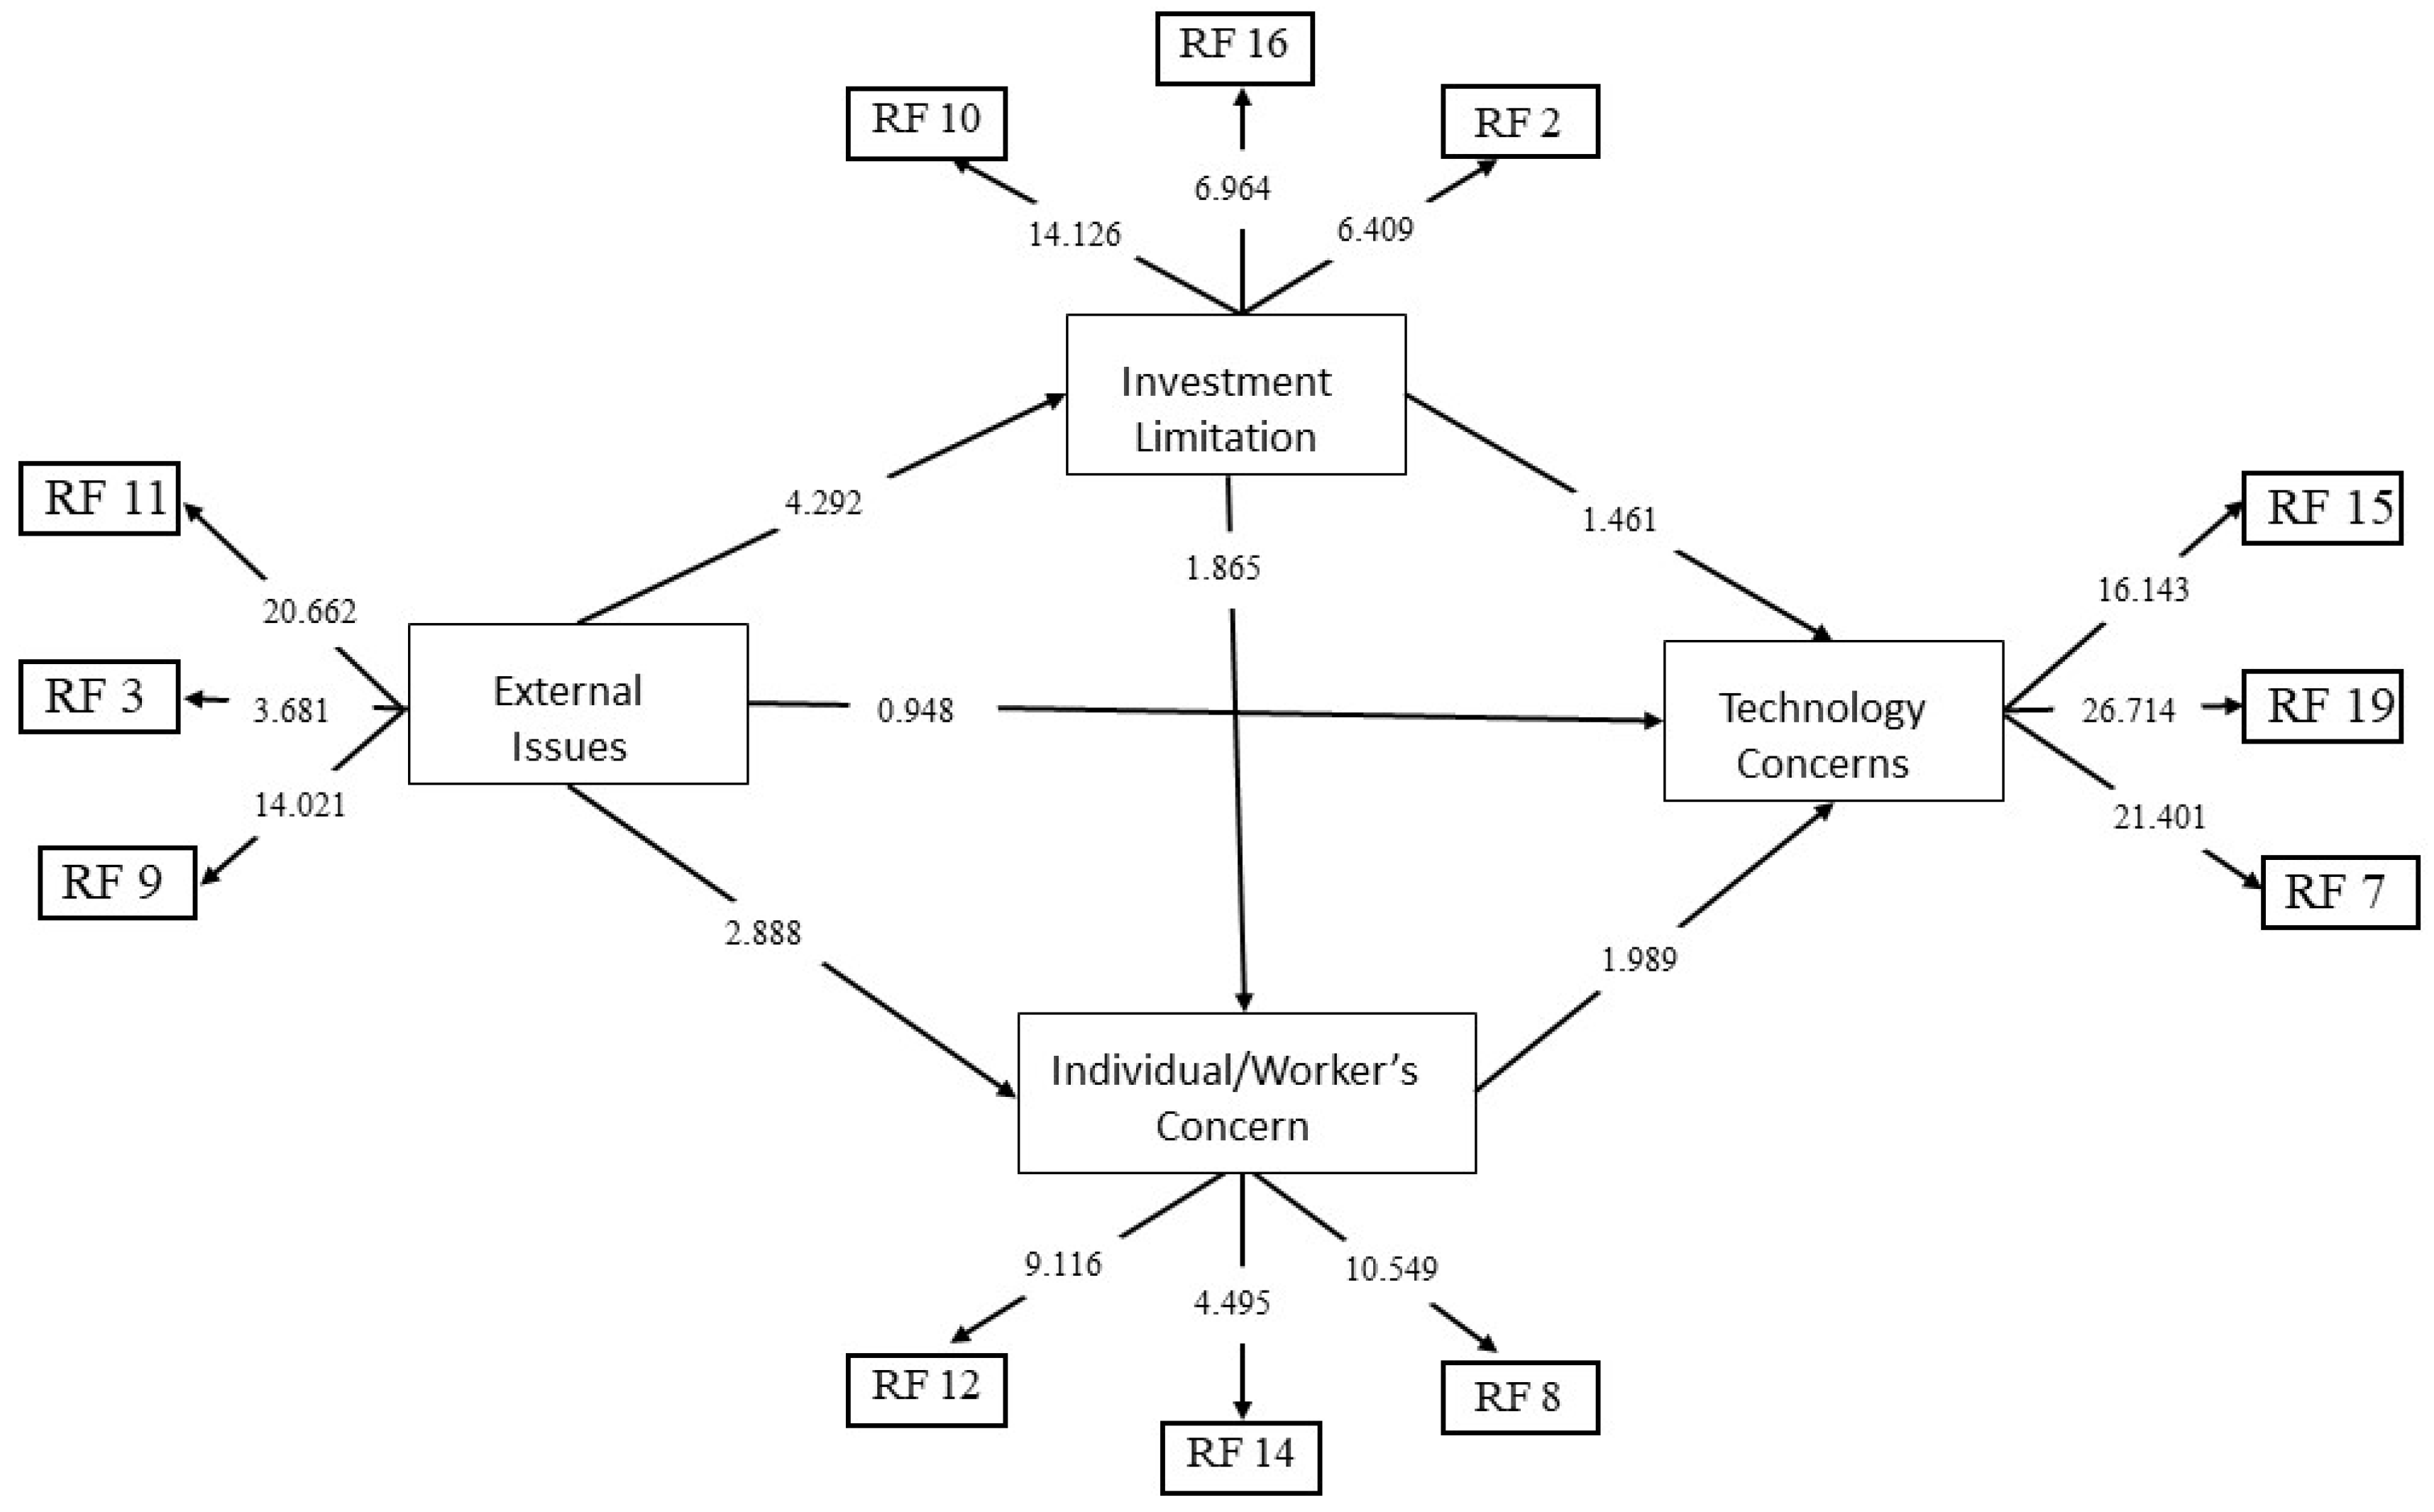
4.3. Modeling Paths of Implementation Risks
Model Verification and Validity
5. Discussion
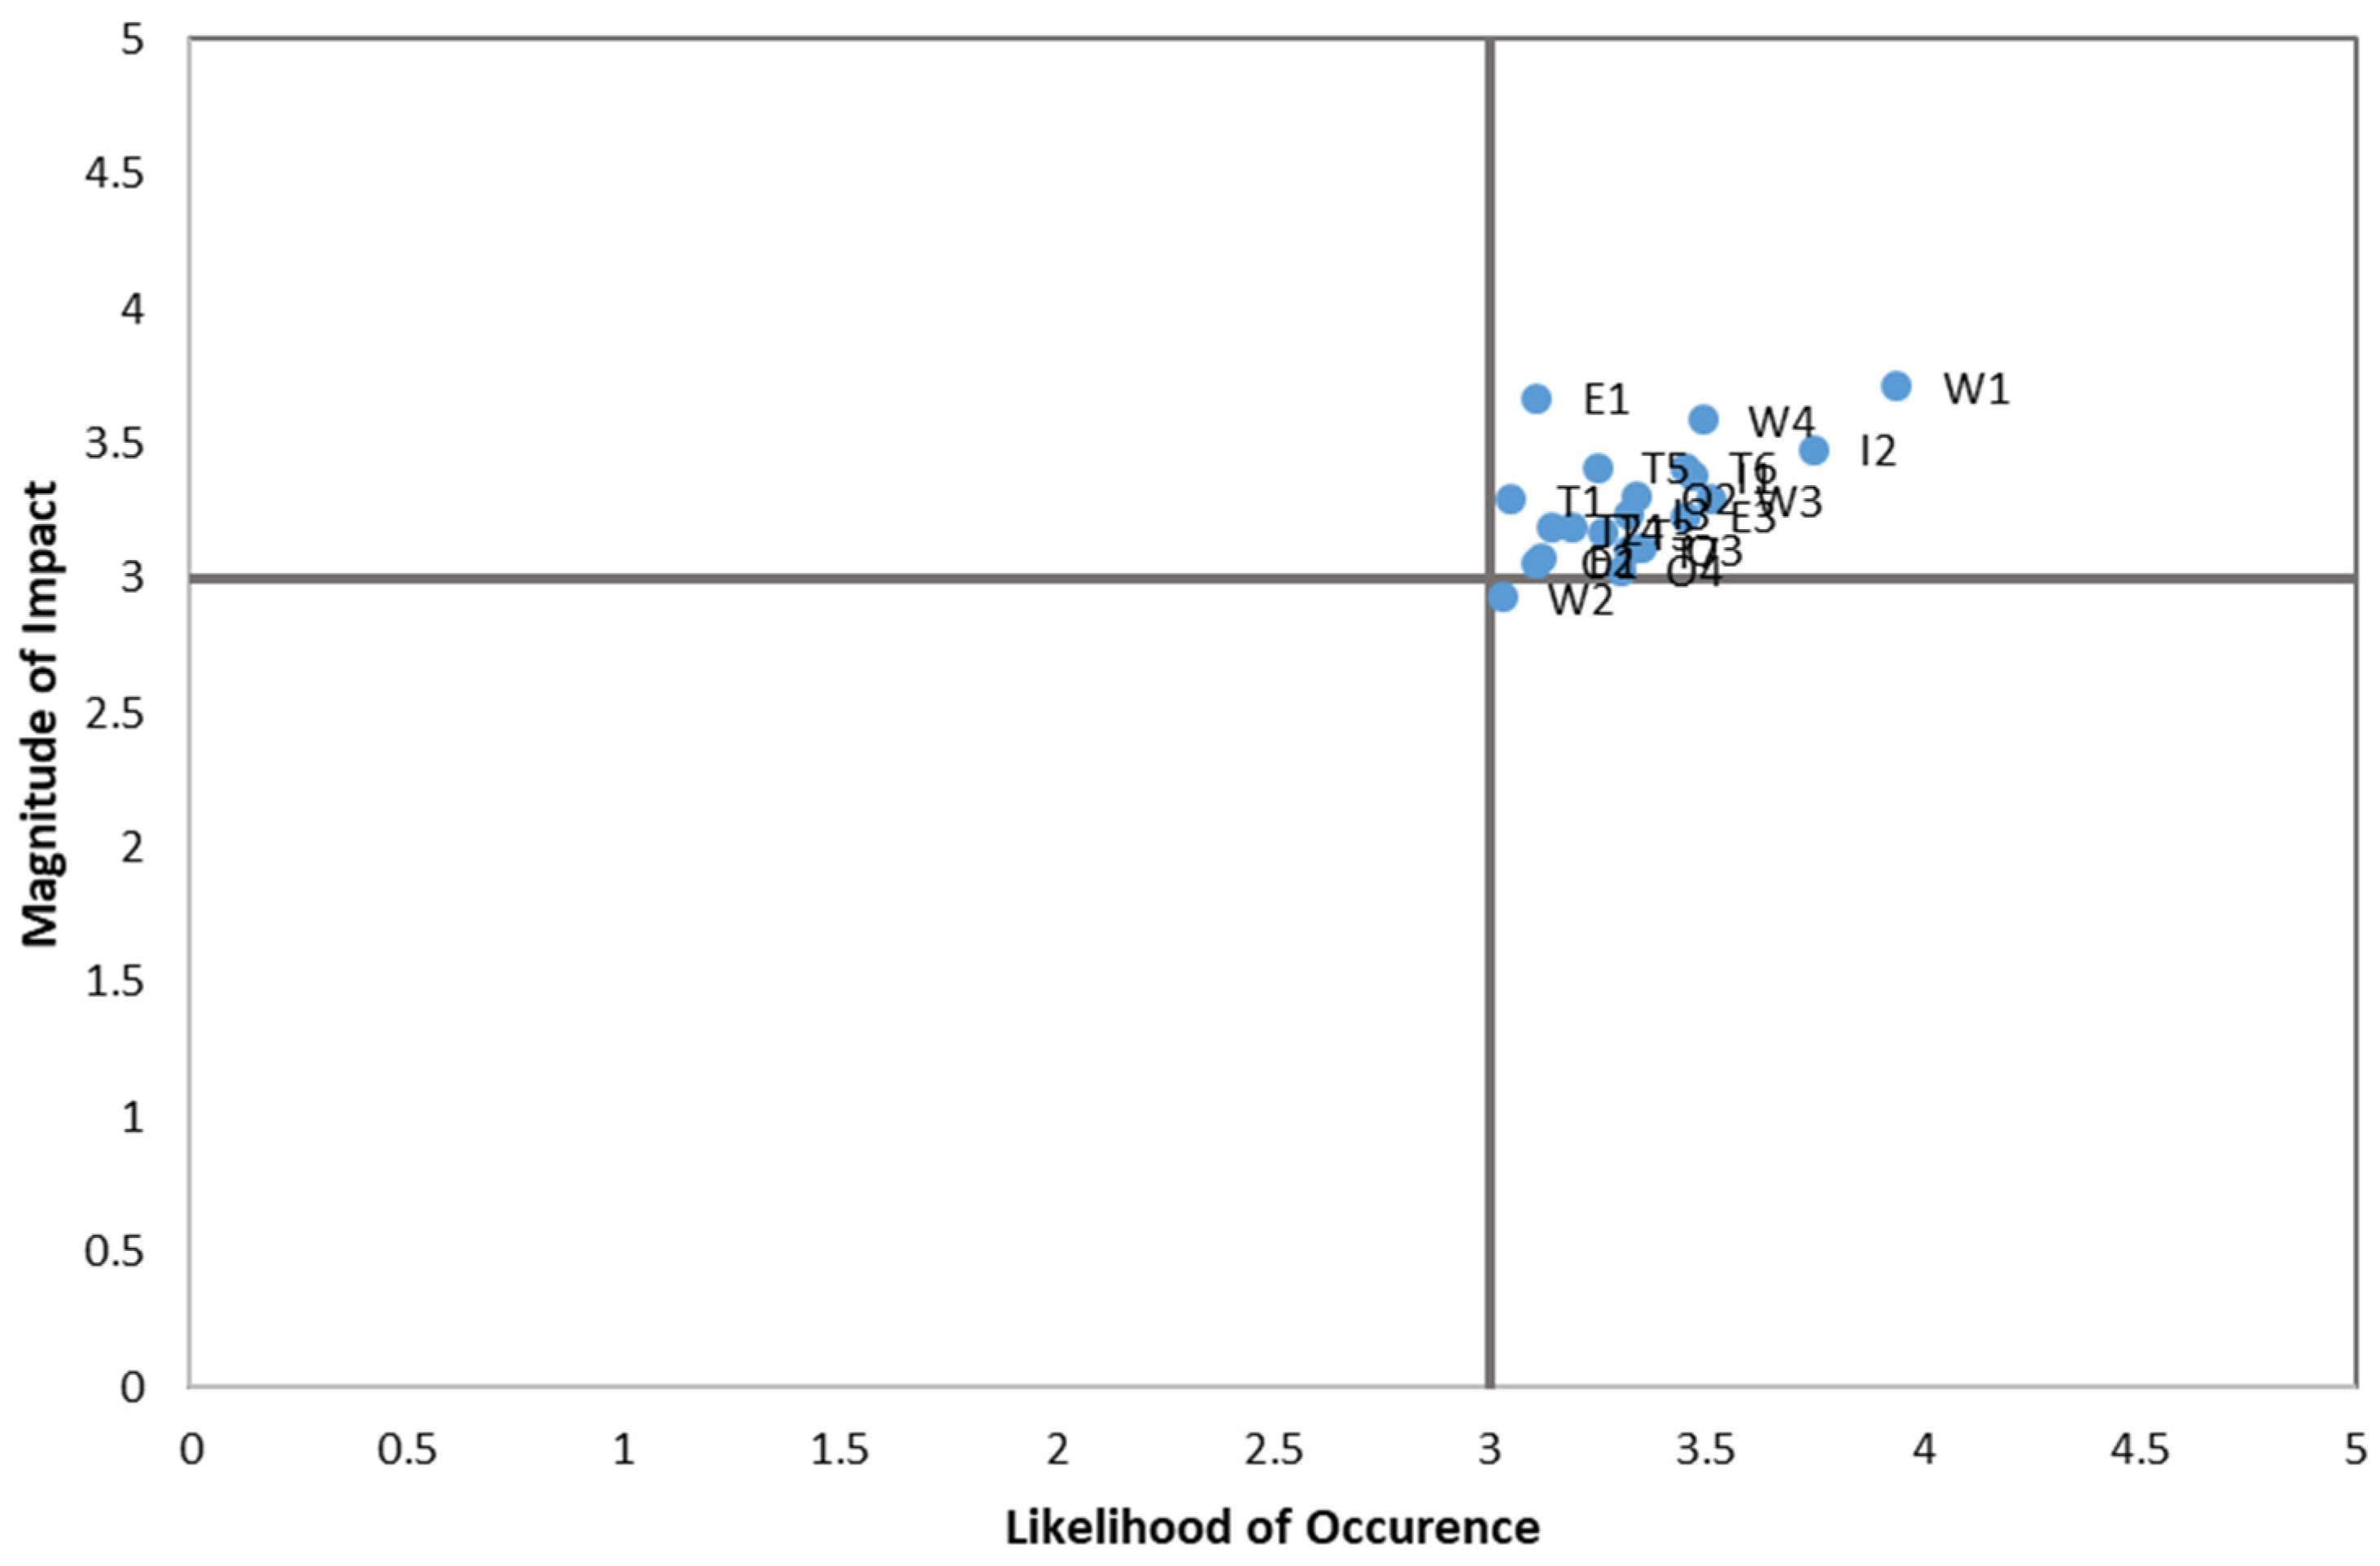
5.1. Risk Quantification
5.2. Modeling the Path of Risk
6. Conclusions
6.1. Contributions
6.2. Research Limitations
Author Contributions
Funding
Institutional Review Board Statement
Informed Consent Statement
Data Availability Statement
Acknowledgments
Conflicts of Interest
References
- Ali, A.S. The performance measurement of construction projects managed by ISO-certified contractors in Malaysia Macmillan Publishers Ltd. 1479–1110. J. Retail. Leis. Prop. 2010, 9, 25–35. [Google Scholar] [CrossRef] [Green Version]
- Zhou, N.; Ding, L.Y.; Chen, L.Y. Application of 4D visualization technology for safety management in metro construction. Autom. Constr. 2013, 34, 25–36. [Google Scholar] [CrossRef]
- Bansal, V.K. Use of G.I.S. to consider spatial aspects in the construction planning process. Int. J. Constr. Manag. 2020, 20, 207–222. [Google Scholar]
- McGeorge, D.; Zou, P.X.W. Construction Management New Directions, 3rd ed.; Wiley-Blackwell: Hoboken, NJ, USA, 2013. [Google Scholar]
- Gambatese, J.A.; Halowell, M. Factors that influence the development and diffusion of technical innovations in the construction industry. Constr. Manag. Econ. 2011, 29, 507–517. [Google Scholar] [CrossRef]
- Ramilo, R.; Embi, M.R.B. Critical analysis of key determinants and barriers to digital innovation adoption among architectural organizations. Front. Archit. Res. 2014, 3, 431–451. [Google Scholar] [CrossRef] [Green Version]
- Chowdhury, T.; Adafin, J.; Wilkinson, S. Review of digital technologies to improve productivity of New Zealand construction industry. J. Inf. Technol. Constr. 2019, 24, 569–587. [Google Scholar]
- Nnaji, C.; Karakhan, A.A. Technologies for safety and health management in construction: Current use, implementation benefits and limitations, and adoption barriers. J. Build. Eng. 2020, 29, 101212. [Google Scholar] [CrossRef]
- Bradley, A.; Li, H.; Lark, R.; Dunn, S. BIM for infrastructure: An overall review and constructor perspective. Autom. Constr. 2016, 71, 139–152. [Google Scholar] [CrossRef]
- 9 Construction Tech Trends to Watch in 2019. Available online: https://www.theb1m.com/video/9-construction-tech-trends-to watch-in-2019 (accessed on 17 December 2021).
- Awolusi, I.; Marks, E.; Hallowell, M. Wearable technology for personalized construction safety monitoring and trending: Review of applicable devices. Autom. Constr. 2018, 85, 96–106. [Google Scholar] [CrossRef]
- Careertrend.com. Available online: https://careertrend.com/facts-7524967-meaning construction-technology.html (accessed on 17 December 2021).
- Delgado, J.M.D.; Oyedele, L.; Ajayi, A.; Akanbi, L.; Akinade, O.; Bilal, M.; Owolabi, H. Robotics and automated systems in construction: Understanding industry-specific challenges for adoption. J. Build. Eng. 2019, 26, 100868. [Google Scholar] [CrossRef]
- Alizadehsalehi, S.; Hadavi, A.; Huang, J.C. From BIM to extended reality in A.E.C. industry. Autom. Constr. 2020, 116, 103254. [Google Scholar] [CrossRef]
- Delgado, J.M.; Oyedele, L.O.; Demian, P.; Beach, T. A research agenda for augmented and virtual reality in architecture, engineering and construction. Adv. Eng. Inf. 2020, 45, 101122. [Google Scholar] [CrossRef]
- Wang, P.; Wu, P.; Wang, J.; Chi, H.L.; Wang, X. A critical review of the use of virtual reality in construction engineering education and training. Int. J. Environ. Res. Public Health 2018, 15, 1204. [Google Scholar] [CrossRef] [PubMed] [Green Version]
- Castronovo, F.; Nikolic, D.; Liu, Y.; Messner, J. An evaluation of immersive virtual reality systems for design reviews. In Proceedings of the 13th International Conference on Construction Applications of Virtual Reality, London, UK, 30–31 October 2013. [Google Scholar]
- Noghabaei, M.; Heydarian, A.; Balali, V.; Han, K. Trend Analysis on Adoption of Virtual and Augmented Reality in the Architecture, Engineering, and Construction Industry. Data 2020, 5, 26. [Google Scholar] [CrossRef] [Green Version]
- Ibem, E.O.; Laryea, S. E-tendering in the South African construction industry. Int. J. Constr. Manag. 2017, 17, 310–328. [Google Scholar] [CrossRef]
- Windapo, A.O. Skilled labour supply in the South African construction industry: The nexus between certification, quality of work output and shortages. South Asian J. Hum. Resour. Manag. 2016, 14, 1–8. [Google Scholar] [CrossRef] [Green Version]
- Sadeghi, M.; Mahmoudi, A.; Deng, X. Adopting distributed ledger technology for the sustainable construction industry: Evaluating the barriers using Ordinal Priority Approach. Environ. Sci. Pollut. Res. 2022, 29, 10495–10520. [Google Scholar] [CrossRef]
- Sepasgozar, S.M.E.; Loosemore, M.; Davis, S.R. Conceptualizing information and equipment technology adoption in construction: A critical review of existing research. Eng. Constr. Archit. Manag. 2016, 23, 158–176. [Google Scholar] [CrossRef]
- Azhar, S.; Behringer, A. A BIM-based approach for communicating and implementing a construction site safety plan. In Proceedings of the 49th A.S.C. Annual Conference, San Luis Obispo, CA, USA, 10–13 April 2013. [Google Scholar]
- Abbas, A.; Choi, M.; Seo, J.; Cha, S.H.; Li, H. Effectiveness of Immersive Virtual Reality-based Communication for Construction Projects. KSCE J. Civ. Eng. 2019, 23, 4972–4983. [Google Scholar] [CrossRef]
- Lin, J.; Zhu, R.; Li, N.; Becerik-Gerber, B. Do people follow the crowd in building emergency Evacuation? A cross-cultural immersive virtual reality-based study. Adv. Eng. Infor. 2020, 43, 101040. [Google Scholar] [CrossRef]
- Zhao, X. A scientometric review of global BIM research: Analysis and visualization. Autom. Constr. 2017, 80, 37–47. [Google Scholar] [CrossRef]
- Nnaji, C.; Awolusi, I. Critical success factors influencing wearable sensing device implementation in AEC industry. Technol. Soc. 2021, 66, 101636. [Google Scholar] [CrossRef]
- Oke, A.E.; Kineber, A.F.; Albukhari, I.; Dada, A.J. Modeling the robotics implementation barriers for construction projects in developing countries. Int. J. Build. Pathol. Adapt. 2021. [Google Scholar] [CrossRef]
- Li, X.; Yi, W.; Chi, H.L.; Wang, X.; Chan, A.P. A critical review of virtual and augmented reality (VR/AR) applications in construction safety. Autom. Constr. 2018, 86, 150–162. [Google Scholar] [CrossRef]
- Sacks, R.; Perlman, A.; Barak, R. Construction safety training using immersive virtual reality. Constr. Manag. Econ. 2013, 31, 1005–1017. [Google Scholar] [CrossRef]
- Shibeika, A.; Harty, C. Diffusion of digital innovation in construction: A case study of a U.K. engineering firm. Constr. Manag. Econ. 2015, 33, 453–466. [Google Scholar] [CrossRef] [Green Version]
- Xue, X.; Zhang, R.; Yang, R.J.; Dai, J. Innovation in construction: A critical review and future research. Int. J. Innov. Sci. 2014, 6, 111–126. [Google Scholar] [CrossRef]
- Flavian, C.; Sanchez, S.I.; Orus, C. Integrating virtual reality devices into the body: Effects of technological embodiment on customer engagement and behavioral intentions toward the destination. J. Travel Tour. Mark. 2019, 36, 847–863. [Google Scholar] [CrossRef]
- Whyte, J.; Nikolic, D. Virtual Reality and the Built Environment, 2nd ed.; Routledge: London, UK, 2002. [Google Scholar]
- Okpala, I.; Nnaji, C.; Karakhan, A.A. Utilizing emerging technologies for construction safety risk mitigation. Pract. Period. Struct. Des. Constr. 2020, 25, 04020002. [Google Scholar] [CrossRef]
- Omar, T.; Nehdi, M.L. Data acquisition technologies for construction progress tracking. Autom. Constr. 2016, 70, 143–155. [Google Scholar] [CrossRef]
- Baeza, E. Applications of Virtual Reality in Construction. 2018. Available online: https://digitalcommons.calpoly.edu/cgi/viewcontent.cgi?article=1105&context=cmsp (accessed on 30 December 2021).
- Moore, H.F.; Gheisari, M. A Review of Virtual and Mixed Reality Applications in Construction Safety Literature. Safety 2019, 5, 51. [Google Scholar] [CrossRef] [Green Version]
- Somaiieh, R.; Sadeghi-Niaraki, A.; Choi, S.-M. A Review on Mixed Reality: Current Trends, Challenges and Prospects. Appl. Sci. 2020, 10, 636. [Google Scholar]
- Rankohi, S.; Waugh, L. Review and analysis of augmented reality literature for construction industry. Vis. Eng. 2013, 1, 9. [Google Scholar] [CrossRef] [Green Version]
- Jokkaw, N.; Suteecharuwat, P.; Weerawetwat, P.J. Measurement of construction workers’ feeling by virtual environment (VE) technology for guard rail design in high-rise building construction projects. Eng. J. 2017, 21, 161–177. [Google Scholar] [CrossRef]
- Eiris, R.; Gheisari, M.; Esmaeili, B. Using augmented 360-degree panoramas of reality for construction safety training. Int. J. Environ. Res. Public Health 2018, 15, 2452. [Google Scholar] [CrossRef] [Green Version]
- Kim, B.; Kim, C.; Kim, H. Interactive modeler for construction equipment operation using augmented reality. J. Comput. Civ. Eng. 2012, 26, 331–341. [Google Scholar] [CrossRef]
- Zhou, Y.; Luo, H.; Yang, Y. Implementation of augmented reality for segment displacement inspection during tunneling construction. Autom. Constr. 2017, 82, 112–121. [Google Scholar] [CrossRef]
- Shin, D.H.; Dunston, P.S. Identification of application areas for augmented reality in industrial construction based on technology suitability. Autom. Constr. 2008, 17, 882–894. [Google Scholar] [CrossRef]
- Wang, X.; Truijens, M.; Hou, L.; Wang, Y.; Zhou, Y. Integrating augmented reality with building information modeling: Onsite construction process controlling for the liquefied natural gas industry. Autom. Constr. 2014, 40, 96–105. [Google Scholar] [CrossRef]
- Bosche, F.; Abdel-Wahab, M.; Carozza, L. Towards a mixed reality system for construction trade training. J. Compt. Civ. Eng. 2016, 30, 16. [Google Scholar] [CrossRef]
- Liu, F.; Seipel, S. Precision study on augmented reality-based visual guidance for facility management tasks. Autom. Constr. 2018, 90, 79–90. [Google Scholar] [CrossRef]
- Tedeschi, A.; Benedetto, F. A real-time automatic pavement crack and pothole recognition system for mobile Android-based devices. Adv. Eng. Inform. 2017, 32, 11–25. [Google Scholar] [CrossRef]
- Sabeti, S.; Shoghli, O.; Baharani, M.; Tabkhi, H. Toward AI-enabled augmented reality to enhance the safety of highway work zones: Feasibility, requirements, and challenges. Adv. Eng. Inform. 2021, 50, 101429. [Google Scholar] [CrossRef]
- Kim, D.; Ko, Y.J. The impact of virtual reality technology on sports spectators’ flow experience and satisfaction. Comput. Hum. Behav. 2019, 93, 346–356. [Google Scholar] [CrossRef]
- Vahdatikhaki, F.; El-Ammari, K.; Langroodi, A.K.; Miller, S.; Hammad, A.; Doree, A. Beyond data visualization: A context-realistic construction equipment training simulators. Autom. Constr. 2019, 106, 102853. [Google Scholar] [CrossRef]
- de Klerk, R.; Duarte, A.M.; Medeiros, D.P.; Duarte, J.P.; Jorge, J.; Lopes, D.S. Usability studies on building early-stage architectural models in virtual reality. Autom. Constr. 2019, 103, 104–116. [Google Scholar] [CrossRef]
- Wejnert, B. Integrating Models of Diffusion of Innovations: A Conceptual Framework. Annu. Rev. Sociol. 2002, 28, 297–326. [Google Scholar] [CrossRef] [Green Version]
- Hartmann, T.; Meerveld, H.V.; Vossebeld, N.; Adriaanse, A. Aligning building information model tools and construction management methods. Autom. Constr. 2012, 22, 605–613. [Google Scholar] [CrossRef]
- Dossick, C.S.; Neff, G. Organizational Divisions in BIM-enabled Commercial Construction. J. Constr. Eng. Manag. 2010, 136, 459–467. [Google Scholar] [CrossRef] [Green Version]
- Neges, M.; Koch, C. Augmented reality supported work instructions for onsite facility maintenance. In Proceedings of the 23rd International Workshop of the European Group for Intelligent Computing in Engineering, Leuven, Belgium, 30 June–3 July 2019; pp. 1–10. [Google Scholar]
- Fazel, A.; Izadi, A. An interactive augmented reality tool for constructing free-form modular surfaces. Autom. Constr. 2018, 85, 135–145. [Google Scholar] [CrossRef]
- Hasanzadeh, S.; Polys, N.; Garza, J.M. Presence, Mixed Reality, and Risk-Taking Behavior: A Study in Safety Interventions. IEEE Transactions on Visual. Comput. Graph. 2020, 26, 2115–2125. [Google Scholar]
- Zhao, D.; Lucas, J. Virtual reality simulation for construction safety promotion. Int. J. Inj. Control. Saf. 2015, 22, 57–67. [Google Scholar] [CrossRef] [PubMed]
- Pereira, E.R.; Moore, H.F.; Gheisari, M.; Esmaeili, B. Development and Usability Testing of a Panoramic Augmented Reality Environment for Fall Hazard Safety Training. In Proceedings of the 35th CIB W78 2018 Conference: IT in Design, Construction, and Management, Chicago, IL, USA, 1–3 October 2018; pp. 271–279. [Google Scholar]
- Golparvar-Fard, M.; Pena-Mora, F.; Savarese, S. 4ar–a 4-dimensional augmented reality model for automating construction progress monitoring data collection, processing, and communication. J. Inf. Technol. Constr. 2009, 14, 129–153. [Google Scholar]
- Huang, L.; Kawamura, T.; Yamada, H. Operability of a control method for grasping soft objects in a construction teleoperation robot tested in virtual reality. Int. J. Fluid Power 2014, 13, 39–48. [Google Scholar] [CrossRef]
- Albert, A.; Hallowell, M.R.; Kleiner, B.; Chen, A.; Golparvar-Fard, M. Enhancing construction hazard recognition with high-fidelity augmented virtuality. J. Constr. Eng. Manag. 2014, 140, 04014024. [Google Scholar] [CrossRef]
- Chu, M.; Matthews, J.; Love, P.E.D. Integrating mobile Building Information Modelling and Augmented Reality systems: An experimental stcMMudy. Autom. Constr. 2018, 85, 305–316. [Google Scholar] [CrossRef]
- Shi, Y.; Du, J.; Ahn, C.R.; Ragan, E. Impact assessment of reinforced learning methods on construction workers’ fall risk behavior using virtual reality. Autom. Constr. 2019, 104, 197–214. [Google Scholar]
- Fernandes, K.J.; Raja, V.; White, A.; Tsinopoulos, C.-D. Adoption of virtual reality within construction processes: A factor analysis approach. Technovation 2006, 26, 111–120. [Google Scholar] [CrossRef]
- Ahmed, S. A Review on Using Opportunities of augmented reality and virtual reality in construction project management. Organ. Technol. Manag. Constr. 2019, 11, 1839–1852. [Google Scholar] [CrossRef] [Green Version]
- Sampaio, A.Z.; Martins, O.P. The application of virtual reality technology in the construction of bridge: The cantilever and incremental launching methods. Autom. Constr. 2014, 37, 58–67. [Google Scholar] [CrossRef]
- Du, J.; Shi, Y.; Zou, Z.; Zhao, D. Cloud-based multiuser virtual reality headset system for project communication of remote users. J. Constr. Eng. Manag. 2018, 144, 04017109. [Google Scholar] [CrossRef]
- Wuni, I.Y.; Shen, G.Q. Towards a decision support for modular integrated construction: An integrative review of the primary decision-making actors. Int. J. Constr. Manag. 2019, 1–20. [Google Scholar] [CrossRef]
- Palmarini, R.; Erkoyuncu, J.A.; Roy, R.; Torabmostaedi, H. A systematic review of augmented reality applications in maintenance. Robot. Comput. -Integr. Manu. 2018, 49, 215–228. [Google Scholar] [CrossRef] [Green Version]
- Mutis, I.; Ambekar, A. Challenges and enablers of augmented reality technology for in situ walkthrough applications. J. Inform. Technol. Constr. 2020, 25, 55–71. [Google Scholar] [CrossRef]
- Renganayagalu, S.K.; Mallam, S.C.; Nazir, S. Effectiveness of VR Head Mounted Displays in Professional Training: A Systematic Review. Technol. Knowl. Learn. 2021, 26, 999–1041. [Google Scholar] [CrossRef]
- Behringer, R.; Øhrstrøm, P. Persuasive Design in Teaching and Learning. Int. J. Concept. Struct. Smart Appl. 2013, 1, 1–5. [Google Scholar] [CrossRef] [Green Version]
- Eynon, J. BIM-ing the Team—Construction Manager’s BIM Handbook; John Wiley & Sons Ltd.: New York, NY, USA, 2016. [Google Scholar]
- Elshafey, A.; Saar, C.C.; Binti, E.; Gheisari, A.M.; Usmani, A. Technology acceptance model for Augmented Reality and Building Information Modeling integration in the construction industry. J. Inform. Techol. Constr. 2020, 25, 161–172. [Google Scholar] [CrossRef] [Green Version]
- Ghobadi, M.; Sepasgozar, S.M.E. An Investigation of Virtual Reality Technology Adoption in the Construction Industry. In Smart Cities and Construction Technologies; IntechOpen: London, UK, 2020; pp. 1–35. [Google Scholar]
- Gontier, J.C.; Wong, P.S.P.; Teo, P. Towards the implementation of immersive technology in construction—A SWOT Analysis. J. Inform. Technol. Constr. 2021, 26, 366–380. [Google Scholar]
- Khan, A.; Sepasgozar, S.; Liu, T.; Yu, R. Integration of BIM and Immersive Technologies for AEC: A Scientometric-SWOT Analysis and Critical Content Review. Buildings 2021, 11, 126. [Google Scholar] [CrossRef]
- Chapman, C. Key points of contention in framing assumptions for risk and uncertainty management. Int. J. Prof. Manag. 2006, 24, 303–313. [Google Scholar] [CrossRef]
- Qi, B.; Razkenari, M.; Li, J.; Costin, A.; Kibert, C.; Qian, S. Investigating US industry practitioners’ perspectives towards the adoption of emerging technologies in industrialized construction. Buildings 2020, 10, 85. [Google Scholar] [CrossRef]
- Schimanski, C.P.; Marcher, C.; Monizza, G.P.; Matt, D.T. The Last Planner® system and building information modeling in construction execution: From an integrative review to a conceptual model for integration. Appl. Sci. 2020, 10, 821. [Google Scholar] [CrossRef] [Green Version]
- Karakhan, A.A.; Rajendran, S.; Gambatese, J.; Nnaji, C. Measuring and evaluating safety maturity of construction contractors: Multicriteria decision-making approach. J. Constr. Eng. Manag. 2018, 144, 04018054. [Google Scholar] [CrossRef]
- Souza, M.T.D.; Silva, M.D.D.; Carvalho, R.D. Integrative review: What is it? How to do it? Einstein 2010, 8, 102–106. [Google Scholar] [CrossRef]
- Hwang, B.-g.; Shan, M.; Supa’at, N.N.B. Green commercial building projects in Singapore: Critical risk factors and mitigation measures. Sust. Cities Soc. 2017, 30, 237–247. [Google Scholar] [CrossRef]
- Al-Omari, A.I.; Benchiha, S.; Almanjahie, I.M. Efficient Estimation of the Generalized Quasi-Lindley Distribution Parameters under Ranked Set Sampling and Applications. Math. Probl. Eng. 2021, 2021, 1–17. [Google Scholar] [CrossRef]
- Azeez, M.; Gambatese, J.; Hernandez, S. What do construction workers really want? A study about representation, importance, and perception of U.S. construction occupational rewards. J. Constr. Eng. Manag. 2019, 145, 04019040. [Google Scholar] [CrossRef]
- Zou, P.X.W.; Zhang, G.; Wang, J. Understanding the key risks in construction projects in China. Int. J. Proj. Manag. 2007, 25, 601–614. [Google Scholar] [CrossRef]
- Ke, Y.; Wang, S.; Chan, A.P.C.; Cheung, E. Understanding the risks in China’s PPP projects: Ranking of their probability and consequence. Eng. Constr. Archi. Manag. 2011, 18, 481–496. [Google Scholar] [CrossRef]
- Liu, J.; Zhao, X.; Li, Y. Exploring the factors inducing contractors’ unethical behavior: Case of China. J. Prof. Issues Eng. Edu. Pract. 2016, 143, 04016023. [Google Scholar] [CrossRef]
- Vinzi, V.E.; Trinchera, L.; Amato, S. PLS path modeling: From foundations to recent developments and open issues for model assessment and improvement. In Handbook of Partial Least Squares; Esposito Vinzi, V., Ed.; Springer: Berlin/Heidelberg, Germany, 2010; pp. 47–82. [Google Scholar] [CrossRef]
- Rahman, I.A.; Memon, A.H.; Karim, A.T. Examining factors affecting budget overrun of construction projects undertaken through management procurement method using PLS-SEM approach. In Proceedings of the Evaluation of Learning for Performance Improvement Internet Conference, Kota Bharu, Malaysia, 25–26 February 2013. [Google Scholar]
- David, G. Partial Least Squares (PLS-SEM); Garson and Statistical Associates Publishing: Asheboro, CA, USA, 2016. [Google Scholar]
- Ojelabi, R.A.; Oyeyipo, O.O.; Afolabi, A.O.; Omuh, I.O. Evaluating barriers inhibiting investors participation in Public-Private Partnership project bidding process using structural equation model. Int. J. Constr. Manag. 2020, 1–10. [Google Scholar] [CrossRef]
- Moshood, T.D.; Nawanir, G.; Sorooshian, S.; Mahmud, F.; Adeleke, A.Q. Barriers and Benefits of ICT Adoption in the Nigerian Construction Industry. A Comprehensive Literature Review. Appl. Syst. Innov. 2020, 3, 46. [Google Scholar] [CrossRef]
- Yap, J.B.H.; Lee, K.P.H.; Wang, C. Safety enablers using emerging technologies in construction projects: Empirical study in Malaysia. J. Eng. Des. Technol. 2021. ahead-of-print. [Google Scholar] [CrossRef]
- Hussain, S.; Fangwei, Z.; Siddiqi, A.; Ali, Z.; Shabbir, M. Structural equation model for evaluating factors affecting quality of social infrastructure projects. Sustainability 2018, 10, 1415. [Google Scholar] [CrossRef] [Green Version]
- Introduction to Structural Equation Modeling Partial Least Squares (SEM-PLS). Available online: https://www.slideshare.net/pallobby/introduction-to-structural-equation-modeling-partial-least-sqaures-sempls-61043221 (accessed on 17 December 2021).
- Henseler, J.; Ringle, C.M.; Sarstedt, M. Using partial least squares path modeling in advertising research: Basic concepts and recent issues. In Handbook of Research on International Advertising; Okazaki, S., Ed.; Edward Elgar Publishing: Cheltenham, UK, 2012; pp. 252–276. [Google Scholar]
- Memon, A.H.; Rahman, I.A. SEM-PLS analysis of inhibiting factors of cost performance for large construction projects in Malaysia: Perspective of clients and consultants. Sci. World J. 2014, 2014, 1–9. [Google Scholar] [CrossRef] [Green Version]
- George, D.; Mallery, M. Using SPSS for Windows Step by Step: A Simple Guide and Reference; Allyn & Bacon: Boston, MA, USA, 2003. [Google Scholar]
- Hock, C.; Ringle, C.M.; Sarstedt, M. Management of multi-purpose stadiums: Importance and performance measurement of service interfaces. Int. J. Serv. Technol. Manag. 2010, 14, 188–207. [Google Scholar] [CrossRef]
- Hair, J.F.; Lukas, B. Marketing Research; McGraw-Hill Education: Sydney, Australia, 2014. [Google Scholar]
- Chin, W.W. The Partial Least Squares Approach to Structural Equation Modeling; Lawrence Erlbaum Associates: Mahwah, NJ, USA, 1998. [Google Scholar]
- Taylor, T.; Geldenhuys, S. Using Partial Least Squares to measure tourism students’ satisfaction with work-integrated learning. In Tourism–Perspectives and Practices; Sabah, S., Ed.; IntechOpen: London, UK, 2019; pp. 1–8. [Google Scholar]
- Cohen, J. Statistical Power Analysis for the Behavioural Sciences; Lawrence Erlbaum Associates: Hillsdale, NJ, USA, 1988. [Google Scholar]
- Yung, R.; Khoo-Lattimore, C. New realities: A systematic literature review on virtual reality and augmented reality in tourism research. Curr. Issues Tour. 2017, 22, 2056–2081. [Google Scholar] [CrossRef]
- Jeelani, I.; Han, K.; Albert, A. Development of Immersive Personalized Training Environment for Construction Workers. In Proceedings of the Computing in Civil Engineering, American Society of Civil Engineers, Reston, VA, USA, 25–27 June 2017; pp. 407–415. [Google Scholar]
- Stansfield, S.; Shawver, D.; Sobel, A.; Prasad, M.; Tapia, L. Design and implementation of a virtual reality system and its application to training medical first responders. Presence Teleoperators Virtual Environ. 2000, 9, 524–556. [Google Scholar] [CrossRef]
- Seymour, N.E.; Gallagher, A.G.; Roman, S.A.; O’Brien, M.K.; Bansal, V.K.; Andersen, D.K.; Satava, R.M. Virtual reality training improves operating room performance—Results of a randomized, double-blinded study. Ann. Surg. 2002, 236, 458–464. [Google Scholar] [CrossRef]
- Sturts, D.C.; Sakagami, M. Implementing web-based project management systems in the United States and Japan. J. Constr. Eng. Manag. 2008, 134, 189–196. [Google Scholar]
- Industry Foundation Classes Release 4 (IFC 4). Available online: https://standards.buildingsmart.org/IFC/RELEASE/IFC4/FINAL/HTML/ (accessed on 17 December 2021).
- Grudzewski, F.; Awdziej, M.; Mazurek, G.; Piotrowska, K. Virtual Reality in Marketing Communication—The Impact on the Message, Technology and Offer Perception—Empirical Study. Econ. Bus. Rev. 2018, 4, 36–50. [Google Scholar] [CrossRef]
- Lin, Y.C.; Chen, Y.P.; Yien, H.W.; Huang, C.Y.; Su, Y.C. Integrated BIM, game engine and V.R. technologies for healthcare design: A case study in a cancer hospital. Adv. Eng. Inform. 2018, 36, 130–145. [Google Scholar] [CrossRef]
- Dris, A.-S.; Lehericey, F.; Gouranton, V.; Arnaldi, B. OpenBIM Based IVE Ontology: An Ontological Approach to Improve Interoperability for Virtual Reality Applications. In Advances in Informatics and Computing in Civil and Construction Engineering; Mutis, I., Hartmann, T., Eds.; Springer Publishing: Cham, Switzerland, 2019; pp. 129–136. [Google Scholar]
- Manikas, K.; Hansen, K.M. Software ecosystems—A systematic literature review. J. Syst. Softw. 2013, 86, 1294–1306. [Google Scholar] [CrossRef]
- Valenca, G.; Alves, C.; Heimann, V.; Jansen, S.; Brinkkemper, S. Competition and collaboration in requirements engineering: A case study of an emerging software ecosystem. In Proceedings of the IEEE 22nd International Requirements Engineering Conference, Karlskrona, Sweden, 25–29 August 2014; pp. 84–393. [Google Scholar]
- Stagman, M. How UK Government Is Helping Virtual and Augmented Reality Flourish. Available online: https://www.inlinepolicy.com/blog/how-uk-government-is-helping-virtual-and-augmented-reality-flourish (accessed on 17 December 2021).


| Risk Categories | Risk Factors | Code | Sources |
|---|---|---|---|
| Technology concerns | ImTs having limited impact on error prevention | T1 | [15] |
| Data security is not guaranteed | T2 | [58,59] | |
| Concerns regarding the durability of ImTs | T3 | [62] | |
| ImT has limited functionality | T4 | [63] | |
| The technology is complex to use | T5 | [15,58,62,64] | |
| Concerns regarding the technical support available from the manufacturer | T6 | [63,64,65] | |
| Limited opportunity(ies) to observe and try these technologies before adoption | T7 | [66] | |
| Operational limitations | Lack of central system for managing data captured during training | O1 | [16] |
| Lack of decision tools to support ImT integration | O2 | [23,24,25] | |
| The difficulty associated with integrating these technologies into existing processes (interoperability) | O3 | [57,60] | |
| Organization prefers using existing processes to manage safety | O4 | [67,68,69,70] | |
| Investment limitations | Lack of cost/benefit analysis and return on investment information | I1 | [15,57,71] |
| High investment (capital cost) cost | I2 | [71,72,73] | |
| Extra maintenance costs associated with ImTs cannot be accommodated | I3 | [73,74] | |
| Individual/worker’s concerns | Need for extensive worker training before achieving optimum performance | W1 | [60,62] |
| Workers are not familiar with ImT | W2 | [75,76,77,78] | |
| Workers will likely not take ImT-based safety training seriously (could be seen as unrealistic) | W3 | [62,76] | |
| Could introduce new risks to workers (e.g., misrepresent severity of safety risk) | W4 | [60,75] | |
| External issues | Little or no known standards for operation | E1 | [15,71] |
| The decision to use ImTs varies significantly with the client (e.g., D.O.T.s, private entities, etc.) | E2 | [77,79] | |
| Little or no government regulations for using ImTs | E3 | [71,79,80] |
| Magnitude of Impact (MI) | |||||||
|---|---|---|---|---|---|---|---|
| 1 | 2 | 3 | 4 | 5 | |||
| Not at All Impactful | Slightly Impactful | Somewhat Impactful | Very Impactful | Extremely Impactful | |||
| Likely Occurrence (LO) | 1 | Extremely Unlikely (<20%) | Low | Low | Low | Medium | Medium |
| 2 | Unlikely (20% ≤ LO < 40%) | Low | Low | Low | Medium | Medium | |
| 3 | Neutral (40% ≤ LO < 60%) | Low | Medium | Medium | Medium | High | |
| 4 | Likely (60% ≤ LO < 80%) | Medium | Medium | Medium | High | High | |
| 5 | Extremely Likely (LO > 80%) | Medium | Medium | High | High | High | |
| Demographic Information | Frequency | Percent | Cumulative Percent |
|---|---|---|---|
| Role in the construction industry | |||
| General Contractor | 46 | 26.3 | 26.3 |
| Sub-Contractor | 15 | 8.6 | 34.9 |
| Consultant | 59 | 33.7 | 68.6 |
| Others (Owner, client, educator, health, safety officer, etc.) | 55 | 31.4 | 100.0 |
| Industry Work Years’ Experience | |||
| Less than 1 year | 1 | 0.6 | 0.6 |
| 1 to 5 years | 37 | 21.1 | 21.7 |
| 6 to 10 years | 63 | 36.0 | 57.7 |
| 11 to 20 years | 54 | 30.9 | 88.6 |
| Above 20 years | 20 | 11.4 | 100.0 |
| Usage of Immersive Technologies | |||
| Yes | 67 | 38.3 | 38.3 |
| No | 108 | 61.7 | 100.0 |
| Experience in Immersive Technologies | |||
| More than 0 years but less than two years | 23 | 34.3 | 34.3 |
| More than two years but less than five years | 9 | 13.4 | 47.7 |
| More than five years | 17 | 25.4 | 73.1 |
| No response | 18 | 26.9 | 100.0 |
| Duration of Organization using Immersive Technologies | |||
| More than 0 years but less than two years | 18 | 26.9 | 26.9 |
| More than two years but less than five years | 14 | 20.8 | 47.7 |
| Not Sure | 17 | 25.4 | 73.1 |
| No response | 18 | 26.9 | 100.0 |
| Risk Factors | Likely Occurrence (L.O.) | Magnitude of Impact (MI) | Risk Criticality (R.C.) | |||||
|---|---|---|---|---|---|---|---|---|
| MS | p-Value | RI | MS | p-Value | RI | MS | RI | |
| W1 | 3.94 | <0.00 * | 1st | 3.71 | <0.00 * | 1st | 3.18 | 1st |
| I2 | 3.75 | <0.00 * | 2nd | 3.48 | 0.05 * | 4th | 2.87 | 2nd |
| W3 | 3.51 | 0.01 * | 3rd | 3.29 | 0.12 | 9th | 2.54 | 6th |
| W4 | 3.49 | 0.01 * | 4th | 3.59 | 0.00 * | 3rd | 2.77 | 3rd |
| I1 | 3.47 | 0.03 * | 5th | 3.38 | 0.10 | 7th | 2.54 | 6th |
| E3 | 3.45 | 0.03 * | 6th | 3.23 | 0.33 | 12th | 2.49 | 9th |
| T6 | 3.45 | 0.02 * | 6th | 3.41 | 0.07 | 5th | 2.59 | 4th |
| O3 | 3.35 | 0.03 * | 8th | 3.11 | 0.62 | 16th | 2.25 | 12th |
| O2 | 3.34 | 0.03 * | 9th | 3.30 | 0.08 | 8th | 2.50 | 8th |
| I3 | 3.32 | 0.07 | 10th | 3.24 | 0.24 | 17th | 2.22 | 14th |
| T7 | 3.32 | 0.08 | 10th | 3.10 | 0.64 | 11th | 2.36 | 11th |
| O4 | 3.30 | 0.17 | 12th | 3.03 | 0.89 | 20th | 2.19 | 15th |
| T3 | 3.26 | 0.13 | 13th | 3.17 | 0.41 | 15th | 2.18 | 16th |
| T5 | 3.25 | 0.14 | 14th | 3.41 | 0.04 * | 5th | 2.57 | 5th |
| T4 | 3.19 | 0.29 | 15th | 3.19 | 0.35 | 13th | 2.25 | 12th |
| T2 | 3.14 | 0.48 | 16th | 3.19 | 0.39 | 13th | 2.18 | 16th |
| E2 | 3.12 | 0.43 | 17th | 3.07 | 0.72 | 18th | 2.02 | 21st |
| O1 | 3.11 | 0.62 | 18th | 3.06 | 0.00 * | 19th | 2.17 | 18th |
| E1 | 3.11 | 0.54 | 18th | 3.67 | 0.75 | 2nd | 2.41 | 10th |
| T1 | 3.05 | 0.75 | 20th | 3.29 | 0.08 | 9th | 2.14 | 19th |
| W2 | 3.03 | 0.90 | 21st | 2.93 | 0.79 | 21st | 2.07 | 20th |
| Risk Category | Risk Factor | Loadings | Cronbach Alpha | Composite Reliability | AVE |
|---|---|---|---|---|---|
| Technology concerns | T2 | 0.860 | 0.849 | 0.907 | 0.766 |
| T3 | 0.867 | ||||
| T6 | 0.898 | ||||
| Individual/Worker’s concern | W3 | 0.886 | 0.737 | 0.852 | 0.659 |
| W2 | 0.807 | ||||
| W4 | 0.734 | ||||
| Investment limitations | I2 | 0.807 | 0.739 | 0.850 | 0.654 |
| I1 | 0.794 | ||||
| I3 | 0.826 | ||||
| External issues | E2 | 0.726 | 0.792 | 0.873 | 0.698 |
| E1 | 0.901 | ||||
| E3 | 0.870 |
| Risk Category | External Issues | Individual/Worker’s Concerns | Investment limitations | Technology Concerns |
|---|---|---|---|---|
| External issues | 0.836 | |||
| Individual/Worker’s concerns | 0.643 | 0.812 | ||
| Investment limitations | 0.584 | 0.593 | 0.809 | |
| Technology concerns | 0.658 | 0.735 | 0.697 | 0.875 |
| Risk Factor | Risk Categories | |||
|---|---|---|---|---|
| External Issues | Individual/Worker’s Concerns | Investment Limitation | Technology Concerns | |
| E1 | 0.901 | 0.626 | 0.543 | 0.604 |
| E3 | 0.870 | 0.625 | 0.534 | 0.640 |
| E2 | 0.726 | 0.239 | 0.337 | 0.318 |
| W3 | 0.570 | 0.886 | 0.486 | 0.506 |
| W2 | 0.628 | 0.807 | 0.462 | 0.593 |
| W4 | 0.356 | 0.734 | 0.489 | 0.681 |
| I3 | 0.409 | 0.600 | 0.826 | 0.692 |
| I2 | 0.584 | 0.493 | 0.807 | 0.472 |
| I1 | 0.425 | 0.297 | 0.794 | 0.503 |
| T6 | 0.486 | 0.619 | 0.672 | 0.898 |
| T3 | 0.469 | 0.560 | 0.487 | 0867 |
| T2 | 0.732 | 0.726 | 0.645 | 0.860 |
| Parameters (Risk Categories) | SSO | SSE | Q2 (=1 − SSE/SSO) |
|---|---|---|---|
| External issues | 201.000 | 201.000 | |
| Individual/Worker’s concerns | 201.000 | 151.322 | 0.247 |
| Investment limitation | 201.000 | 160.378 | 0.202 |
| Technology concerns | 201.000 | 107.731 | 0.464 |
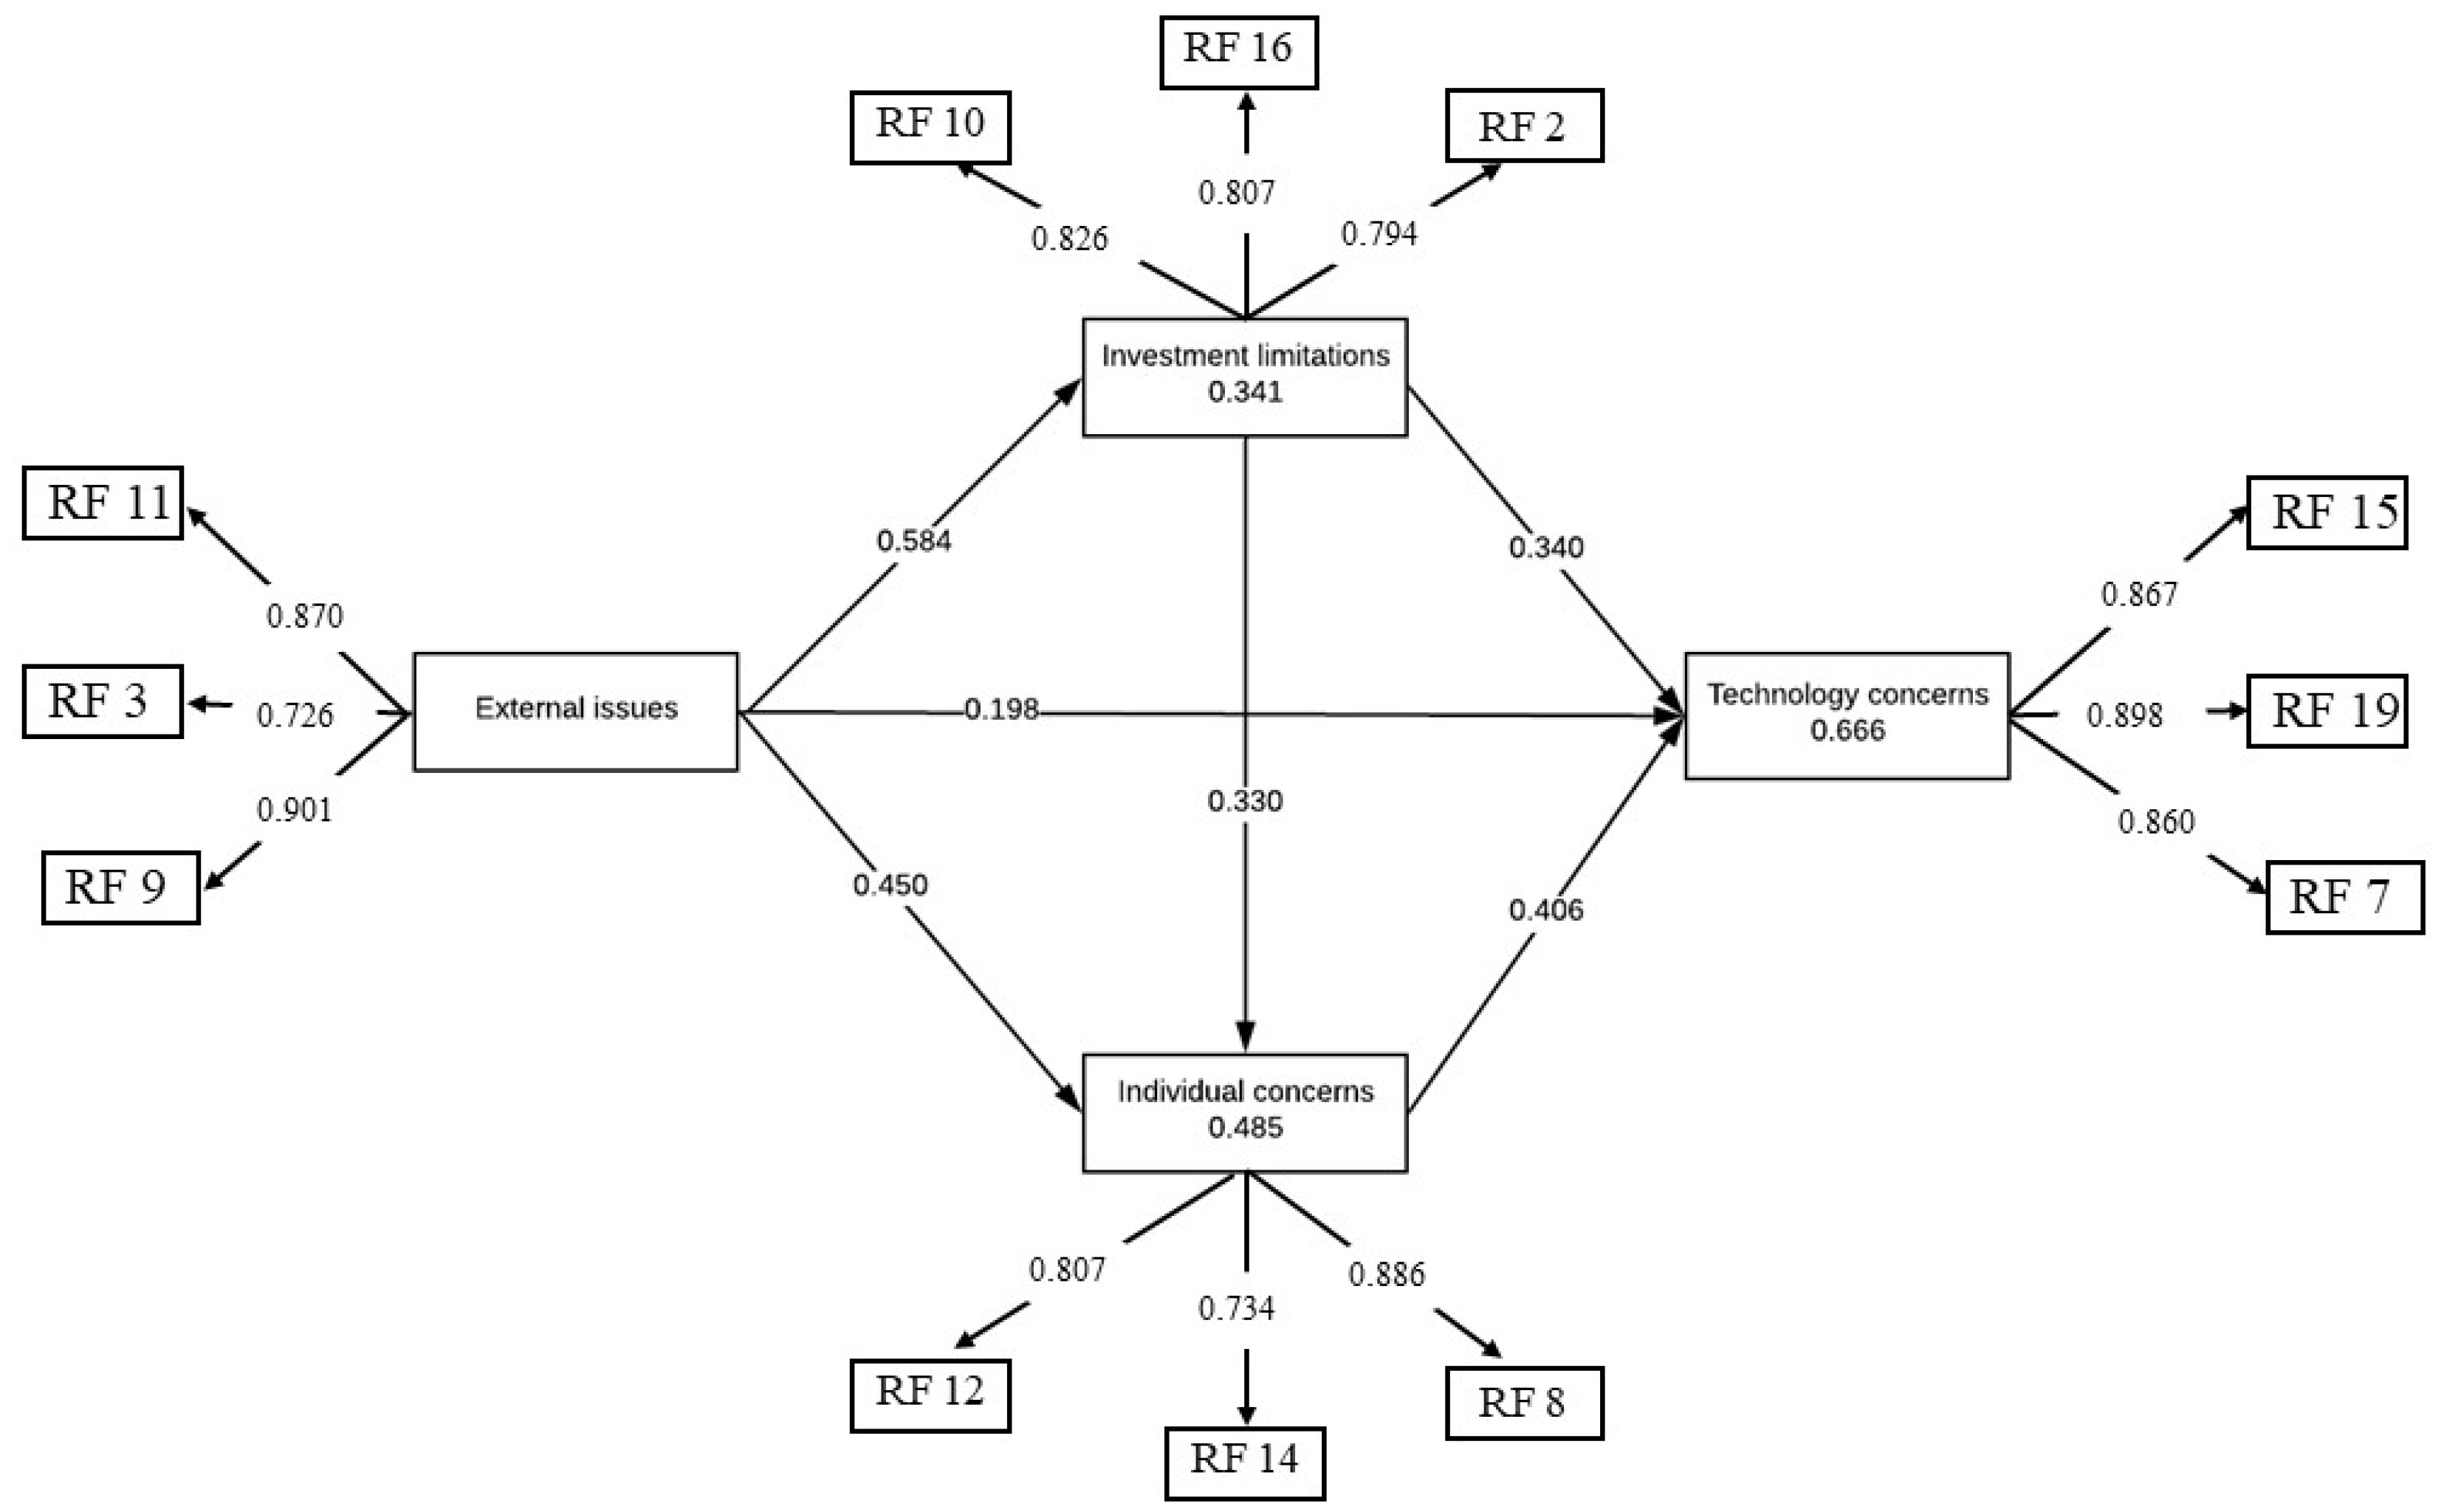
| Hypothesis | Hypothetical Path | Standard Beta | Standard Deviation | T-Statistics | p-Values | Inference | f2 | Inference |
|---|---|---|---|---|---|---|---|---|
| H1 | External issues risk–Individual/Worker’s concern risk | 0.450 | 0.156 | 2.888 | 0.004 ** | Supported | 0.259 | Moderate |
| H2 | External issues risk–Investment limitation risk | 0.584 | 0.136 | 4.292 | 0.000 ** | Supported | 0.517 | Large |
| H3 | External issues risk–Technology concern risk | 0.198 | 0.209 | 0.948 | 0.343 | Not Supported | 0.061 | Small |
| H4 | Individual/Worker’s concern risk–Technology concerns risk | 0.406 | 0.204 | 1.989 | 0.047 ** | Supported | 0.255 | Moderate |
| H5 | Investment limitation risk– Individual/Worker’s concern risk | 0.330 | 0.177 | 1.865 | 0.063 | Not Supported | 0.139 | Moderate |
| H6 | Investment limitation risk–Technology concern risk | 0.340 | 0.233 | 1.461 | 0.145 | Not Supported | 0.201 | Moderate |
Publisher’s Note: MDPI stays neutral with regard to jurisdictional claims in published maps and institutional affiliations. |
© 2022 by the authors. Licensee MDPI, Basel, Switzerland. This article is an open access article distributed under the terms and conditions of the Creative Commons Attribution (CC BY) license (https://creativecommons.org/licenses/by/4.0/).
Share and Cite
Afolabi, A.O.; Nnaji, C.; Okoro, C. Immersive Technology Implementation in the Construction Industry: Modeling Paths of Risk. Buildings 2022, 12, 363. https://doi.org/10.3390/buildings12030363
Afolabi AO, Nnaji C, Okoro C. Immersive Technology Implementation in the Construction Industry: Modeling Paths of Risk. Buildings. 2022; 12(3):363. https://doi.org/10.3390/buildings12030363
Chicago/Turabian StyleAfolabi, Adedeji Olushola, Chukwuma Nnaji, and Chioma Okoro. 2022. "Immersive Technology Implementation in the Construction Industry: Modeling Paths of Risk" Buildings 12, no. 3: 363. https://doi.org/10.3390/buildings12030363
APA StyleAfolabi, A. O., Nnaji, C., & Okoro, C. (2022). Immersive Technology Implementation in the Construction Industry: Modeling Paths of Risk. Buildings, 12(3), 363. https://doi.org/10.3390/buildings12030363