Article

High-Rise Building Construction Progress Measurement from Top View Based on Component Detection

School of Economic and Management, North China Electric Power University, Beijing 102206, China
*
Author to whom correspondence should be addressed.
Buildings 2022, 12(2), 106; https://doi.org/10.3390/buildings12020106
Submission received: 28 December 2021 / Revised: 16 January 2022 / Accepted: 20 January 2022 / Published: 23 January 2022
(This article belongs to the Special Issue Advanced BIM Application in Construction and Buildings)

Abstract

:
The construction progress of a high-rise building is hidden by clutter such as formwork, wood slats, and rebar, making it difficult to measure its progress through existing automated techniques. In this paper, we propose a method to monitor the construction process of high-rise buildings. Specifically, by using the target detection technique, unfinished building components are identified from the top view, and then the identified components are registered to the BIM elements one by one. This is achieved by comparing the position relationship between the target detection results and the projection area of the BIM elements on the imaging plane. Finally, the overall construction progress is inferred by calculating the number of identified and registered components. The method was tested on a high-rise building construction site. The experimental results show that the method is promising and is expected to provide a solid basis for the successful automatic acquisition of the construction process. The use of top view reduces occlusion compared to similar methods, and the identification of the unfinished component makes the method more suitable for the actual construction sites of high-rise buildings. In addition, the combination of target detection and rough registration allows this method to take full advantage of the contextual information in the images and avoid errors caused by misidentification.

1. Introduction

Progress measurement is a daily task in construction management, providing reliable support for decision making in the field. Traditional construction progress measurement relies heavily on manual work and has been criticized by Architecture, Engineering and Construction (AEC) practitioners for its repetitiveness, inefficiency and error-prone nature. Over the past decade, many automated technologies have emerged, including radio frequency identification (RFID), bar codes, ultra-wideband (UWB) tags, global positioning systems (GPS), three-dimensional (3D) laser scanning, image-based modeling, and more. These technologies provide a wealth of support for automated monitoring of the construction process. In particular, 3D reconstruction (including laser-based scanning and image-based modeling) is favored by researchers as a result of its ability to visually reproduce the 3D structure of buildings.
In recent years, the number and height of high-rise buildings around the world have increased dramatically due to economic development, migration of people from rural to urban areas, and advances in construction technology and materials [1,2]. Estimates have predicted that these trends will continue in the future. Tracking the construction process of such buildings is an important task. However, the existing literature seems to pay less attention to it, which may be related to the characteristics of tall building construction. For example, the same unit is repeatedly constructed in the vertical direction; the horizontal working plane is very narrow and there is usually no suitable platform to install monitoring equipment; and the building facades are blocked by scaffolding and protective nets, so it is difficult to obtain the latest construction progress from the ground level. Therefore, whether the existing method is applicable to high-rise buildings needs further discussion.
Laser-based scanning allows the direct acquisition of 3D surface models of buildings [3,4,5,6]. This technique has the advantages of being fast, accurate, and independent of light, however it is not accepted by most companies due to expensive equipment and high technical requirements [7,8,9,10]. As shown in Figure 1, the construction site of a high-rise building is chaotic, including building materials and construction tools. More importantly, the building under construction is composed of formwork and steel reinforcement, rather than the concrete elements themselves. At this time, the point cloud scanned by the laser technology consists of points that are mostly useless. From this perspective, laser scanning technology is suitable for scanning completed components, not those under construction. Therefore, the laser-based measurements are not suitable for high-rise buildings.
In recent years, image-based modeling has attracted increased attention due to the low cost of image acquisition [11,12,13,14,15,16,17,18,19]. Unlike laser scanning, it generates 3D point clouds from images based on the principle of triangulation imaging. However, in the construction site of a high-rise building, the concrete elements are surrounded. As shown in Figure 1, what can be captured are formwork, wood strips, steel bars, and other debris. As with 3D laser scanning, the generated point cloud contains too much useless information rather than the components. Therefore, it is clear that the image-based modeling is not suitable for such a complex environment.
Some scholars project BIM models onto the imaging plane and then infer construction progress by identifying materials in the projected area [9,20,21]. This approach avoids the identification of components from noisy point clouds. However, in the available literature, this technique has not been applied to complex construction sites. The reason is that it is not possible to capture the latest construction progress as the concrete components are tightly wrapped by formwork and protective nets. Therefore, it is difficult to monitor the construction process of high-rise buildings through the materials in the projection area.
In conclusion, the common feature of the above methods is the identification of the completed components. This is impractical when measuring the construction progress of a high-rise building. On-site concrete pouring and continuous construction are characteristics of high-rise construction, which means that it is impossible to visualize the latest construction progress.
While the above methods do not provide an ideal solution, it has been found that the construction process of a high-rise building can be observed from an overhead perspective. Moreover, it is easy to collect daily unordered construction images from the tower crane. Thus, this paper proposes a method to measure the construction progress of high-rise buildings from the top view. Specifically, the top view of the construction site is collected by the tower crane workers; the building components are identified from the top view and mapped to BIM elements; and the construction progress is inferred from the number of registered components. The innovations of this study are mainly in the following three aspects:
  • Identify the auxiliary objects (formwork and reinforcement), not the completed concrete elements, according to the actual situation;
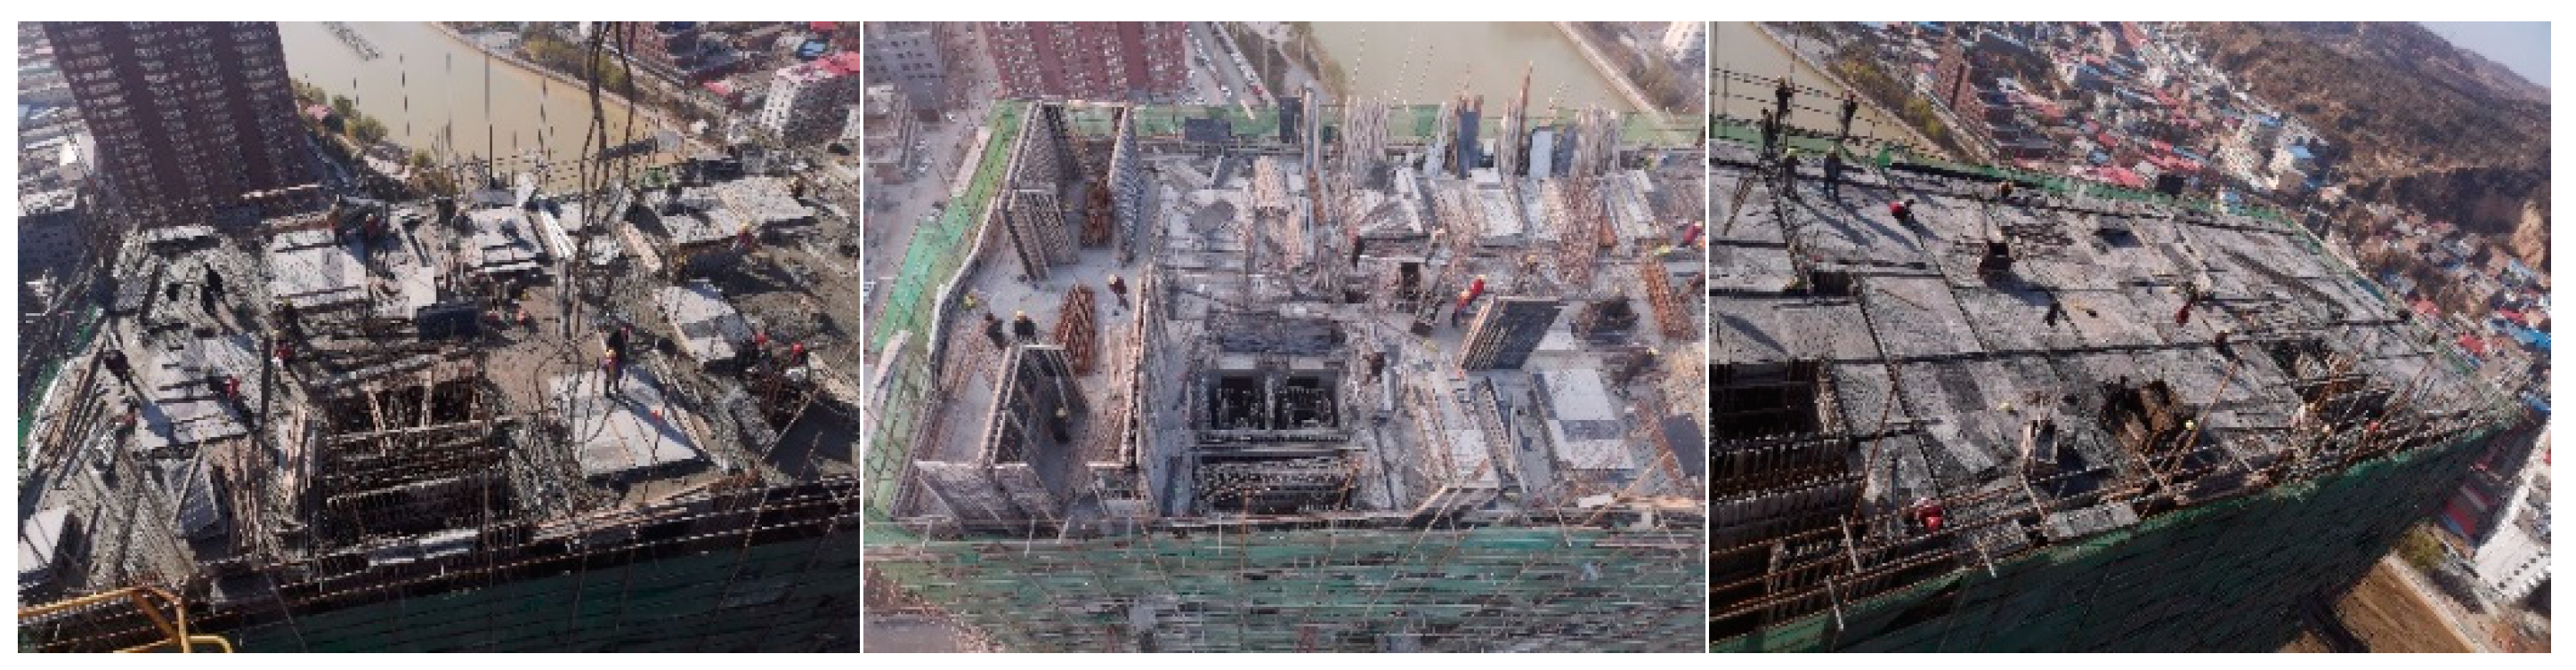
  • Using only the top view to measure construction progress, as monitoring from the side is not practical for high-rise buildings;
  • The reliability of the results is improved by using rough registration to locate the target detection results.
The objective of this study is to measure the construction progress of high-rise buildings, which is different from existing studies. In order to highlight the uniqueness of this study, the assumptions are listed as follows:
  • The construction of the high-rise building is carried out by pouring concrete on site, and the concrete components are wrapped by formwork;
  • The latest construction progress cannot be collected from the ground or sides due to the obstruction of the protective net;
  • The monitoring object is the latest construction progress of the structure, not the indoor construction progress.
This paper is structured as follows. First, it starts with an introduction to the related work about building component detection and construction progress measurement. The next section outlines the proposed method and explains in detail the three important steps: target detector training, camera calibration, and registration and reasoning. Next, the method is validated by tracking and measuring the progress of an actual high-rise building project. Three results (detection, registration and reasoning) and error cases are analyzed in detail. Finally, the advantages of the proposed method are summarized and highlighted by comparing it with similar techniques.

2. Related Work

2.1. Building Component Detection

In the past decade, with the breakthrough of deep learning, target detection technology has made unprecedented developments. The task of target detection is to find out all interested targets (objects) within an image and determine their categories and locations, which is one of the core problems in the field of computer vision. In the AEC industry, target detection technology has been applied to the detection and tracking of construction workers [22,23,24,25], machines [26,27], equipment [28] and building components [29]. For example, Park and Brilakis [25] focused on the continuous localization of construction workers via integration of detection and tracking. Zhu et al. [28] identified and tracked workforce and equipment from construction-site videos.
As for the recognition of building components, the existing methods can be divided into three categories:
  • Geometric reasoning (align the 3D point cloud and BIM model, calculate the space occupied by the point cloud, and infer the components from the geometric point of view) [11,30];
  • Appearance-based reasoning (the BIM model is projected to the imaging plane, and the material texture of the projection area is identified to determine the component) [31,32];
  • Target detection (directly using object detection technology to identify building components from the image) [29,33].
Each technology has its advantages. Among them, the first two methods have achieved a lot, while the latter technology is emerging.
At present, building component recognition based on target detection has produced some results. For example, some scholars use target detection technology to identify concrete areas from images. However, since many components are made of concrete, the detected concrete areas are interconnected, and the building components cannot be subdivided [34,35]. To overcome this limitation, Zhu and Brilakis [36] proposed an automatic detection method for concrete columns based on visual data. By analyzing the boundary information (such as color and texture) of concrete columns, the structural columns were separated from the concrete area. Recently, Deng et al. [15] presented a method that combines computer vision with BIM for the automated progress monitoring of tiles. Wang et al. [37] proposed a novel framework to realize automatically monitoring construction progress of precast walls. Hou et al. [29] proposed an automatic method for building structural component detection based on the Deeply Supervised Object Detector (DSOD). In addition, the point cloud is usually inevitable in the 3D reconstruction of the building structure. Some scholars use a deep learning method to detect building components from the point cloud. For example, Bassier et al. [38] presented a method for the automated classification of point cloud data. The data is pre-segmented and processed by machine learning algorithms to label the floors, ceilings, roofs, beams, walls and clutter in noisy and occluded environments.

2.2. Construction Progress Measurement
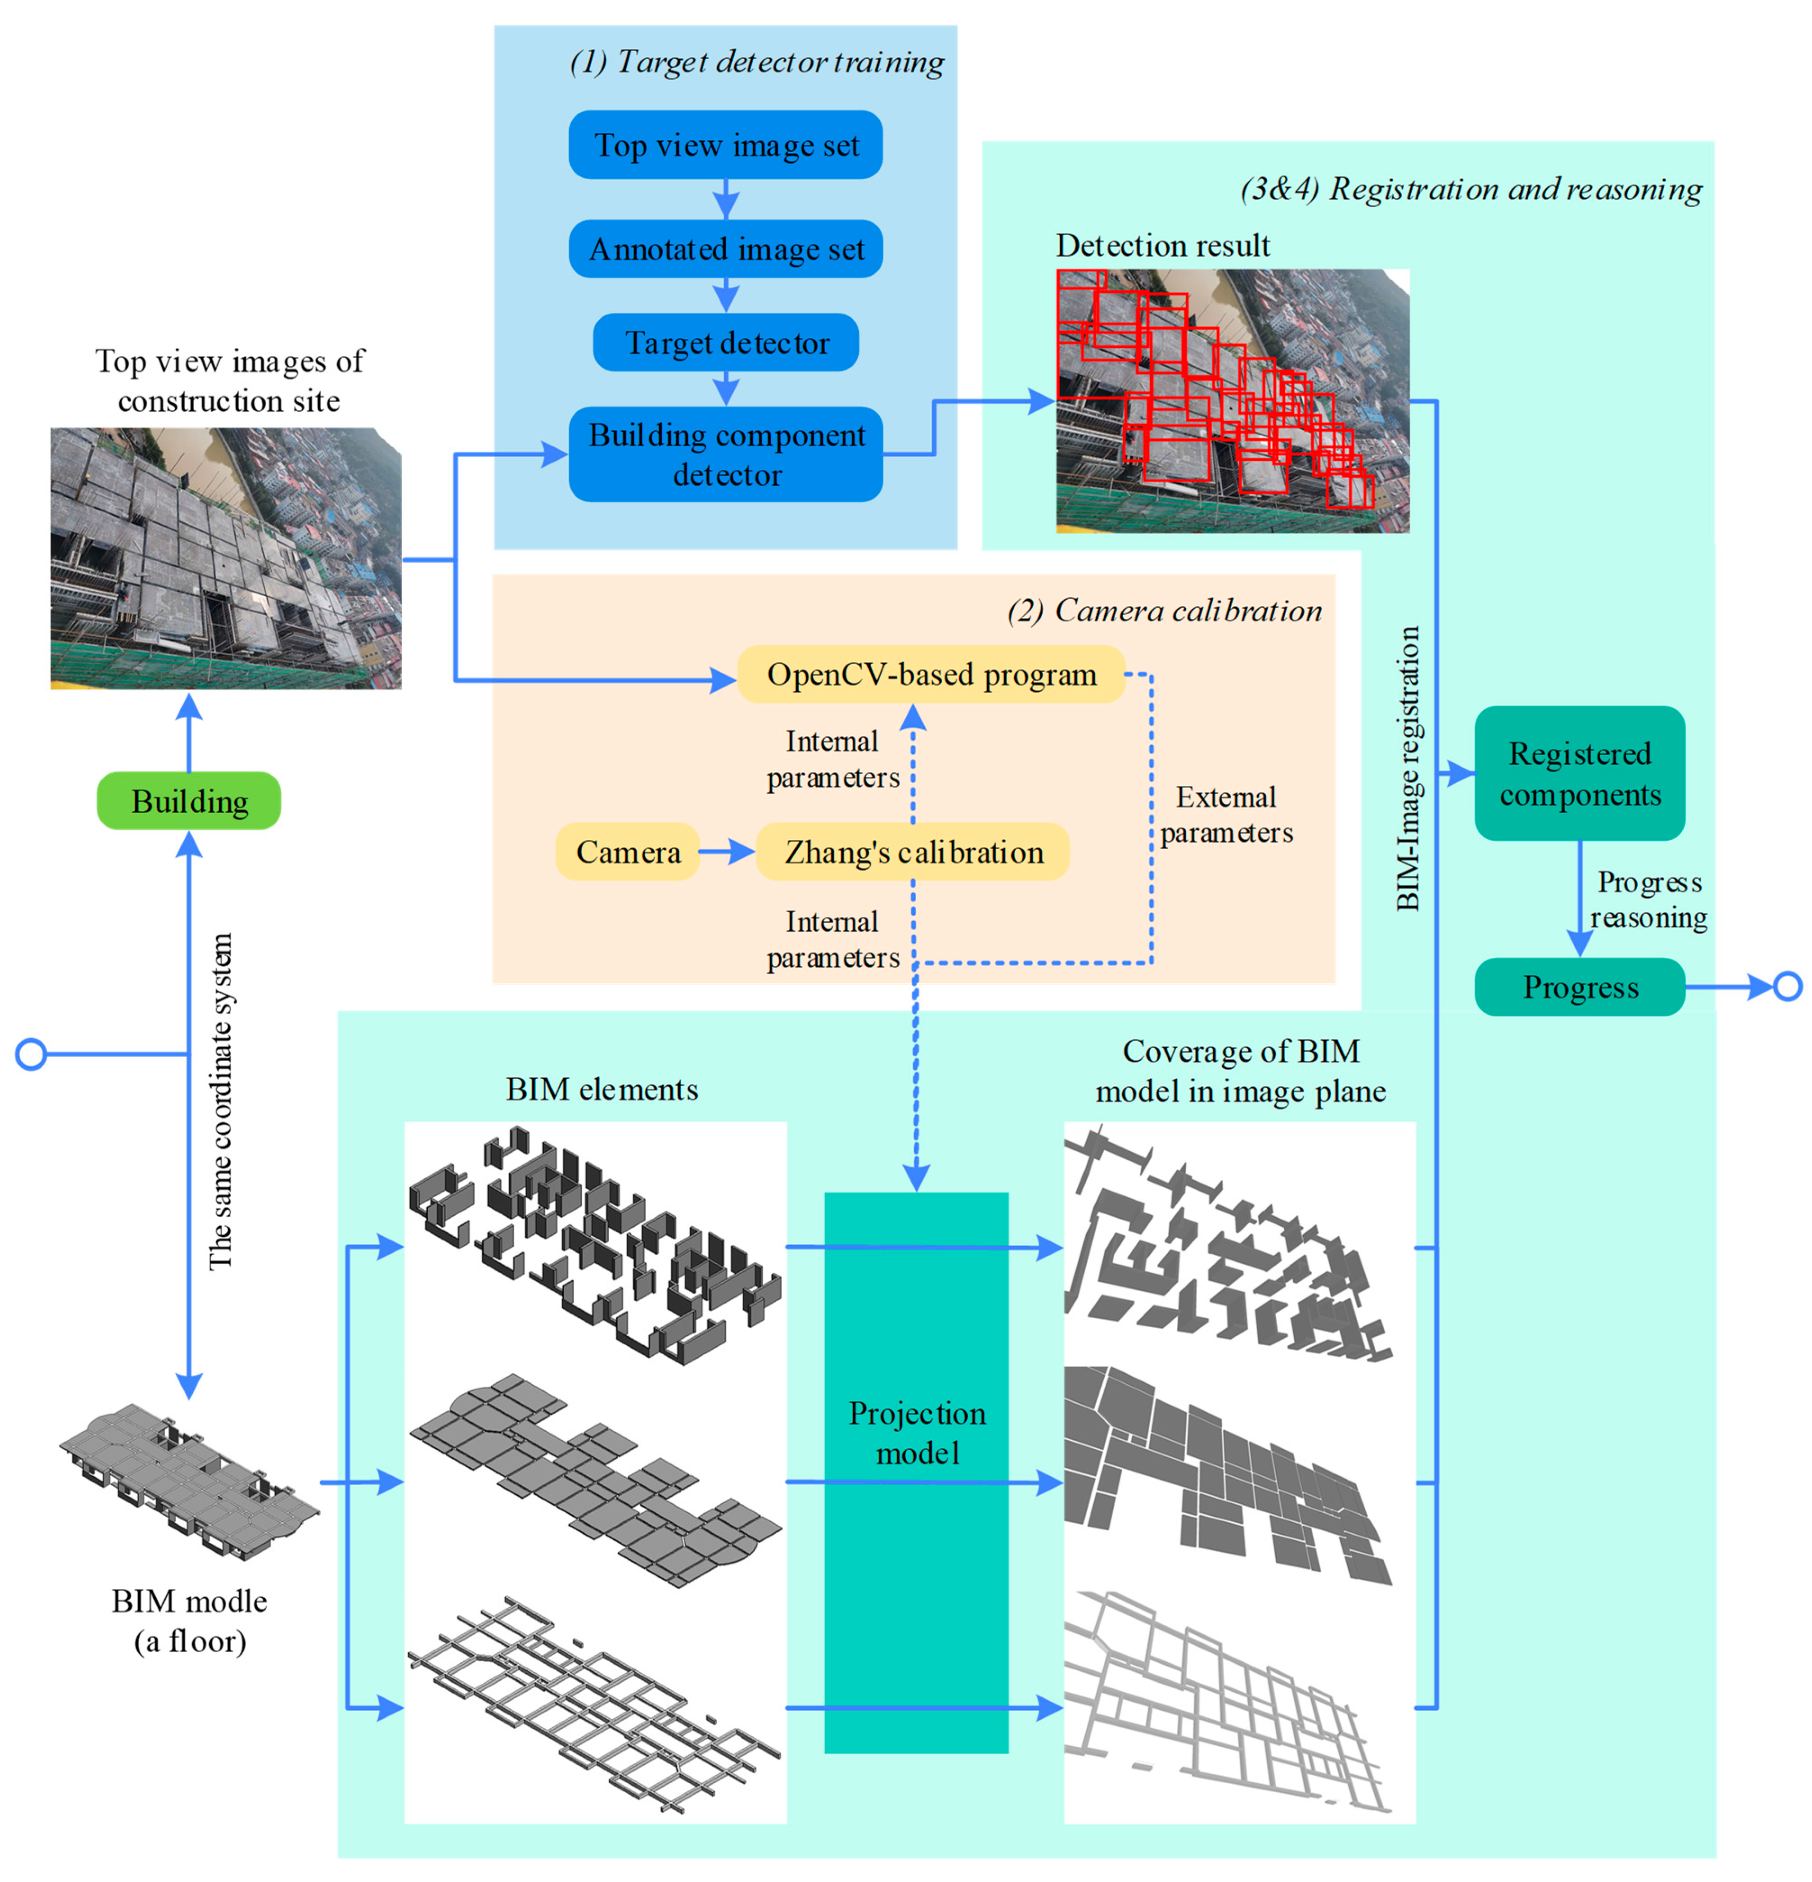
To improve the accuracy and feedback speed of information in the construction site, quite a few technologies have been studied to realize automatic construction progress measurement [39,40,41,42]. These methods can be classified into two categories: imaging techniques and geospatial techniques. The advantages and limitations of these technologies are shown in Table 1.
Imaging techniques include laser scanning, 3D ranging camera, image-based modelling and material classification of projection area. 3D laser scanning technology, based on laser ranging principle, can quickly reconstruct the 3D model of the measured object by recording the 3D coordinates, reflectivity and texture of a large number of dense points on the surface of the measured object [57]. This technology has unique advantages in efficiency and accuracy, and is not affected by illumination [3,4,5,6]. However, there are also some shortcomings, such as high cost, limited texture information and high technical requirements for operation [7,8,9,10]. Therefore, the small and exquisite 3D ranging camera is attracting scholars’ attention, and many scholars have carried out research based on the helmet mounted equipment, especially the Kinect developed by Microsoft [43,44,45,46]. The 3D ranging camera is portable, relatively cheap and contains rich texture information. Image-based modelling and material classification of the projection area make full use of the flexibility and convenience of the camera to obtain information [11,12,13,14,15,16,17]. The advantage of camera measurement lies in the low cost of equipment and the high-speed acquisition of field data. However, the camera measurement technology requires high visible light intensity of the environment.
Geospatial techniques include GPS, Barcode, RFID and UWB. GPS is a satellite-based system widely used in position and navigation. The system receives signals from satellites to locate the position of specific objects. GPS has been used for equipment and material tracking and progress tracking [50]. Barcodes are widely used in material tracking, inventory management, construction progress tracking and document management due to its advantages of low cost, high reliability and easy identification [51,52]. RFID stores data through chips, and some can even transmit active signals. Therefore, the information stored in it can be easily read and written [53,54,55]. UWB is a kind of radio technology for short-range communication. This has characteristics such as low power requirement, the ability to work indoors and outdoors, long reading range and so on. It has been applied to material tracking and activity-based progress tracking, especially in harsh construction environments [56].

3. Methodology

Based on the above analysis, this section will introduce a method to measure the construction progress from the top view of the construction site. As shown in Figure 2, the method includes four main steps:
  • Train building component detector in advance, and identify the building components from the top view;
  • Establish the mapping relationship between the 3D world (BIM model) and the imaging plane through the camera calibration;
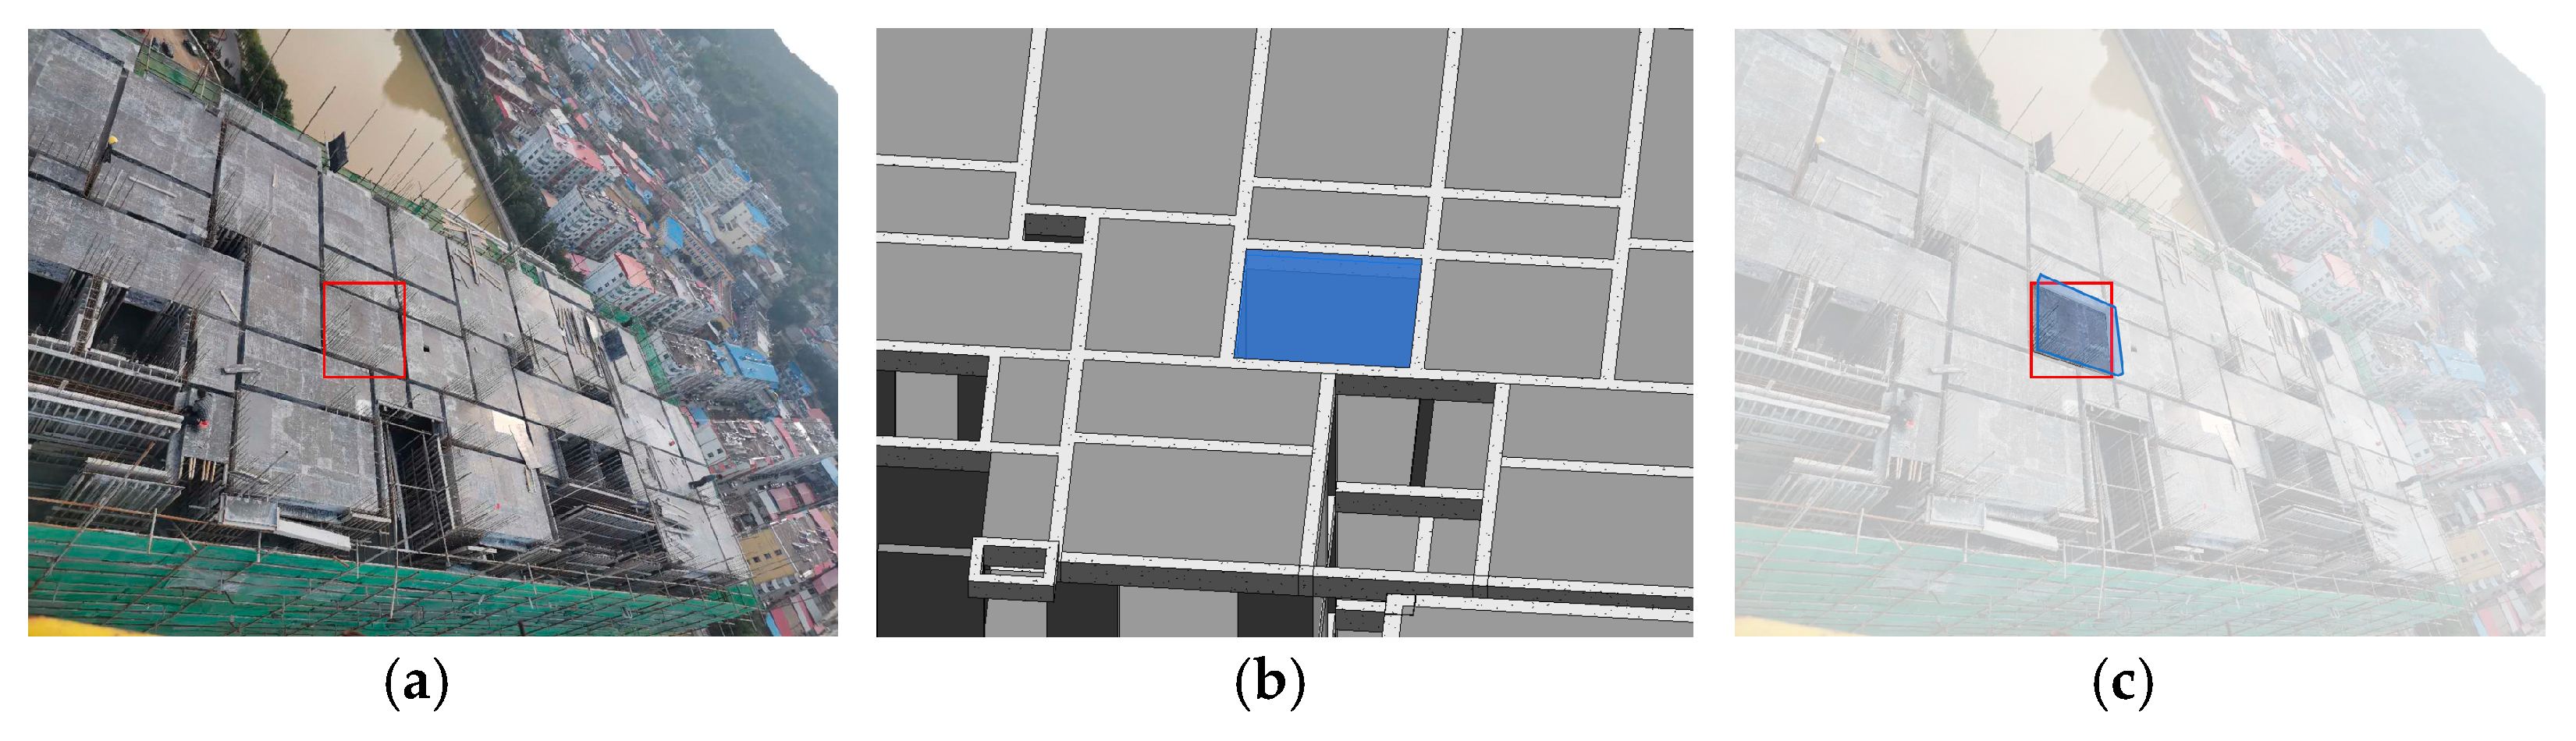
  • Register the detected components with BIM elements by comparing the projection position of BIM elements in the imaging plane;
  • Infer the construction progress with the number of detected and registered components.
As mentioned in the introduction section, the construction process of high-rise buildings is blocked by scaffolding and a protective net, and can only be collected from the top view. Therefore, the images of this study are collected daily by the tower crane driver. As such, these images must overlap each other. On the one hand, these images are inputted into the target detector to obtain the detection results. On the other hand, they are used to calculate the external parameters of each image to obtain corresponding projection models. The remaining steps are discussed in detail in the following sections.

3.1. Target Detector Training

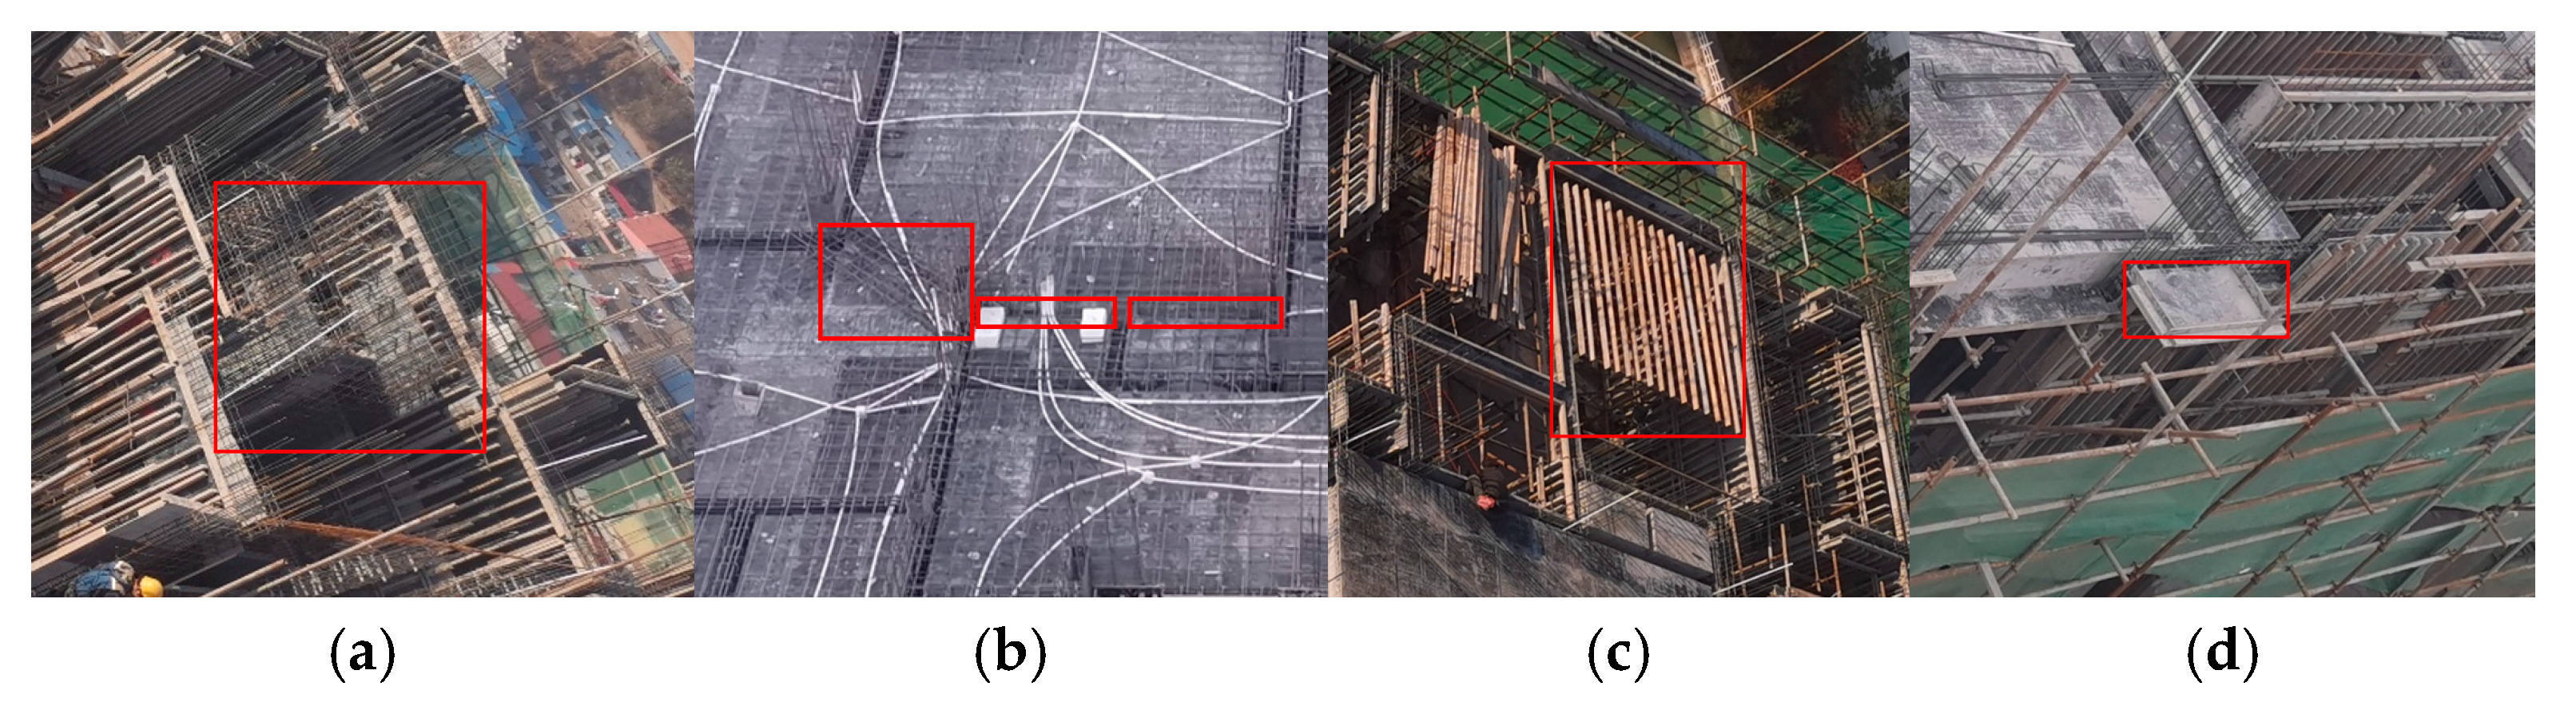
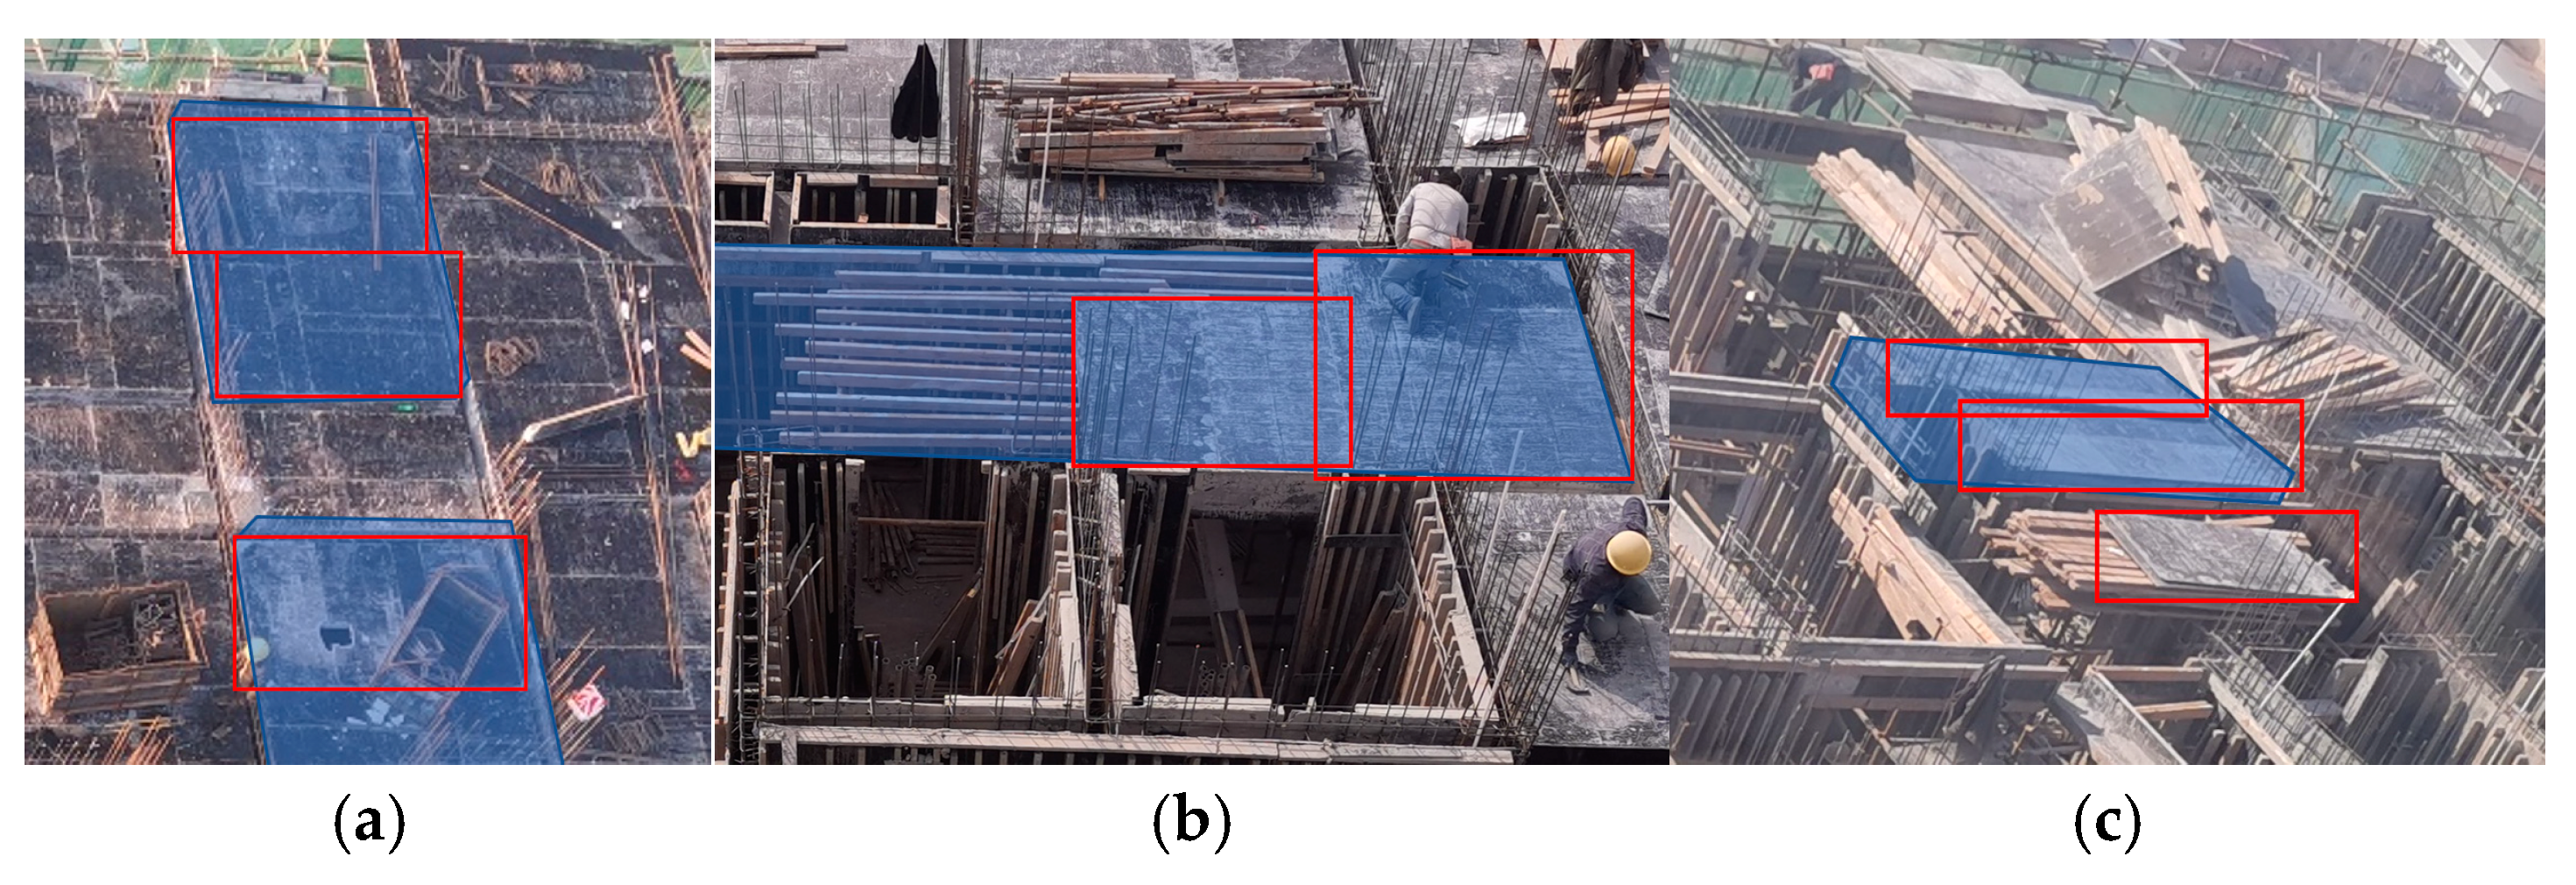
3.1.1. Objects to Be Identified

In the construction process, the formation of a building’s structural component mainly goes through five stages: binding reinforcement cage, supporting formwork at the periphery, pouring concrete, curing concrete, and removing formwork. Considering the construction technology, due to the mutual connection of components in same layer, the concrete pouring, concrete curing and formwork removal processes of different components are carried out at the same time, while the processes of steel bar binding and formwork support are staggered. Therefore, it is impossible to observe all states of all components, and most of the time, what can be photographed from the top view is their semi-finished products.
To identify which components and what states can be identified, the construction site states of a floor in different periods are combed, as shown in Table 2. The time point after the concrete pouring of the last layer is taken as the start of the construction of this floor.

3.1.2. Data Acquisition and Annotation

At present, there is no ready-made, open and integrated images dataset of building components available in the AEC industry for building component recognizer training. To obtain a data set that can be used to train the component recognizer, a DJI Mavic Air2 unmanned aerial vehicle was used to shoot five construction sites from top view for 45 days. It was shot twice a day and a total of 450 video clips were collected. Ten images were intercepted from each video as the training set (4500 images in total), and then 500 images were intercepted as the test set. To create a comprehensive data set, different perspectives, zooms and lighting conditions were considered.
Based on the analysis of the construction-site environment, it is obvious that a component shows various forms in different periods, and it is unrealistic to recognize all states of all components from the image due to occlusion. Therefore, in this study, only a few types of components are labeled and identified to infer the construction progress. The identified objects include stacked formwork, walls or columns with formwork, beams enclosed by formwork, beams with steel cages, slabs with bottom formwork, slabs with steel cages, and pouring tools. The training set is annotated by the graphic image annotation tool LabelImg [58], generating XML files in PASCAL VOC format.

3.1.3. Detector Selection and Training

There are various target detection algorithms in the field of computer vision. Most target detection algorithms get initial weights from the pre-trained model on image databases like ImageNet, and build the final model through fine-tuning. There are two advantages: one is that many models are open source and can be directly used for target detection; the other is that fine-tuning can quickly get the final model, and the training data required is relatively small. However, the features of building components (such as beams, columns, etc.) are extremely similar, and there are huge differences between them and natural objects. Therefore, in the previous work, Learning Deeply Supervised Object Detectors from Scratch (DSOD) [59] was selected to detect building components from site images. Combining DenseNet network [60], the parameters of DSOD model are greatly reduced. More importantly, it breaks the traditional barrier of detector training based on pre-training and fine-tuning, so the highest level of target detector can be obtained by using limited data sets and training from scratch.
In this study, two RTX 3080 Ti graphics processing units were used to train and test the DSOD model [61]. The training set was sent into the neural network after data enhancement (resize, zoom, flip, crop, illumination adjust, hue adjust). Finally, a building component recognizer is obtained. Using the trained recognizer, the building components (including type, state and location) can be detected from the construction-site images. Note: In this study, the labeled and identified components contain state information, so the recognition results include three kinds of information: type, state and location. For example, when “slab with bottom formwork” is recognized, the component type and state are “slab” and “with bottom formwork”, respectively.

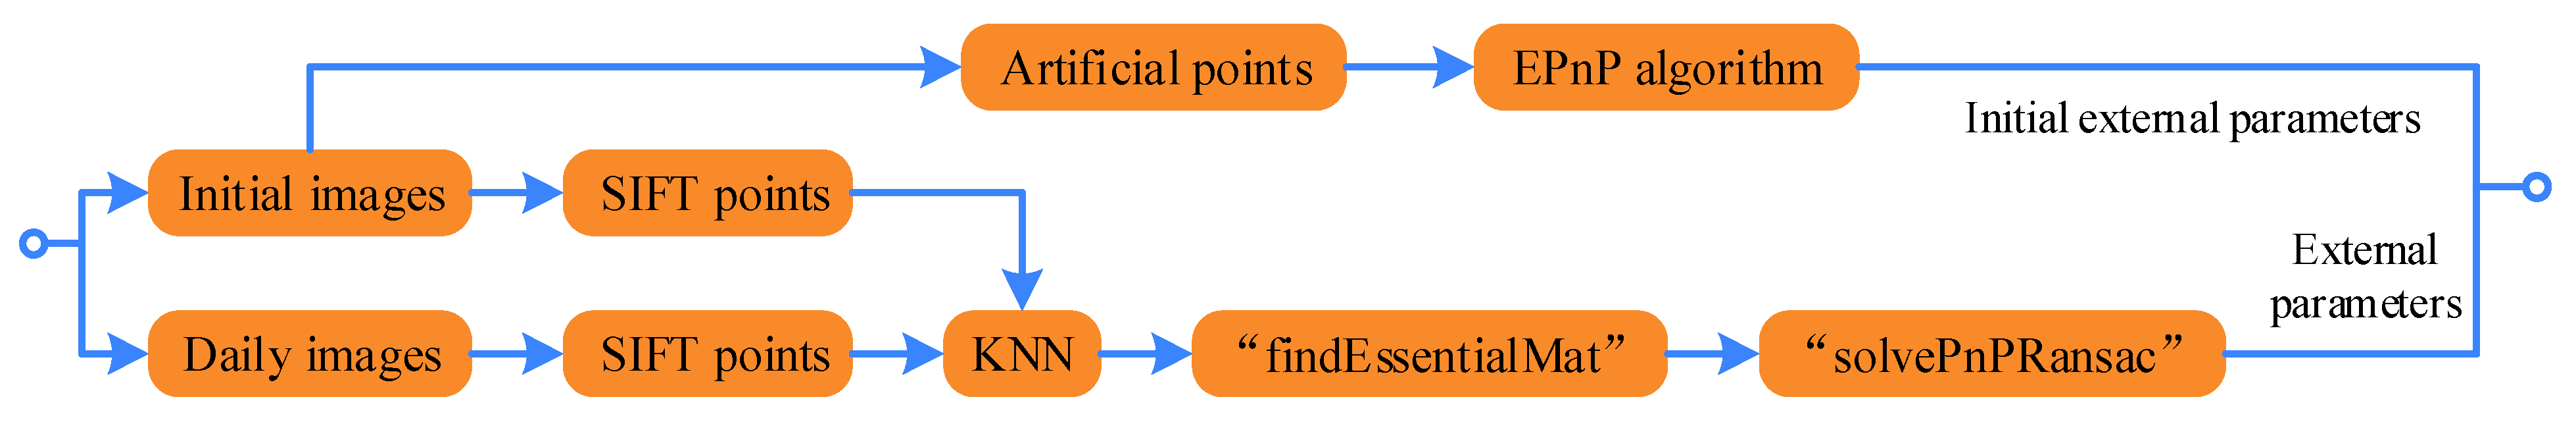
3.2. Camera Calibration

The purpose of camera calibration is to determine the mapping relationship between the BIM model/3D world and the imaging plane. The mapping relationship is a camera projection model, which is the basis for establishing the mapping between the BIM elements and the target detection results in this paper. Camera calibration is the process of solving the model parameters, including internal and external parameters. The internal parameters are related to the characteristics of the camera itself, such as the focal length and pixel size, while the external parameters are the parameters in the world coordinate system, such as the position and rotation direction of the camera.
To obtain the internal parameters, Zhang’s calibration method was used in this study, for it has mature application, wide application range, and more reliable and accurate calibration results [62]. First, a 6 × 8 square black-and-white chessboard is made and photographed from multiple angles. Then, these images are imported into the Camera Calibrator toolbox in MATLAB to obtain the camera parameters. Only the internal parameters are retained.
To obtain the external parameters, an OpenCV-based program is introduced, which can be used to infer camera external parameters through feature points between images [63]. As shown in Figure 3, the program consists of the following steps:
  • Extract Scale Invariant Feature Transform (SIFT) points from images [64];
  • Match features using k-nearest neighbor (KNN) classification algorithm [65];
  • Calculate the essential matrix between two images by “findEssentialMat” function;
  • Calculate the external parameter matrices by “solvePnPRansac” function.
In this method, the parameters of the initial image need to be known. Therefore, multiple known points are manually selected from the initial image, and the initial external parameters are calculated using the Efficient Perspective-n-Point (EPNP) algorithm [66]. To make the calculation results accurate, the initial image should contain as many known points as possible, and these known points should not be on the same plane in the 3D world. In addition, the external parameters are obtained through the corresponding SIFT points in two images, which is independent of the shooting position. Therefore, the lifting of the tower crane does not affect the results of camera calibration.

3.3. Registration and Reasoning

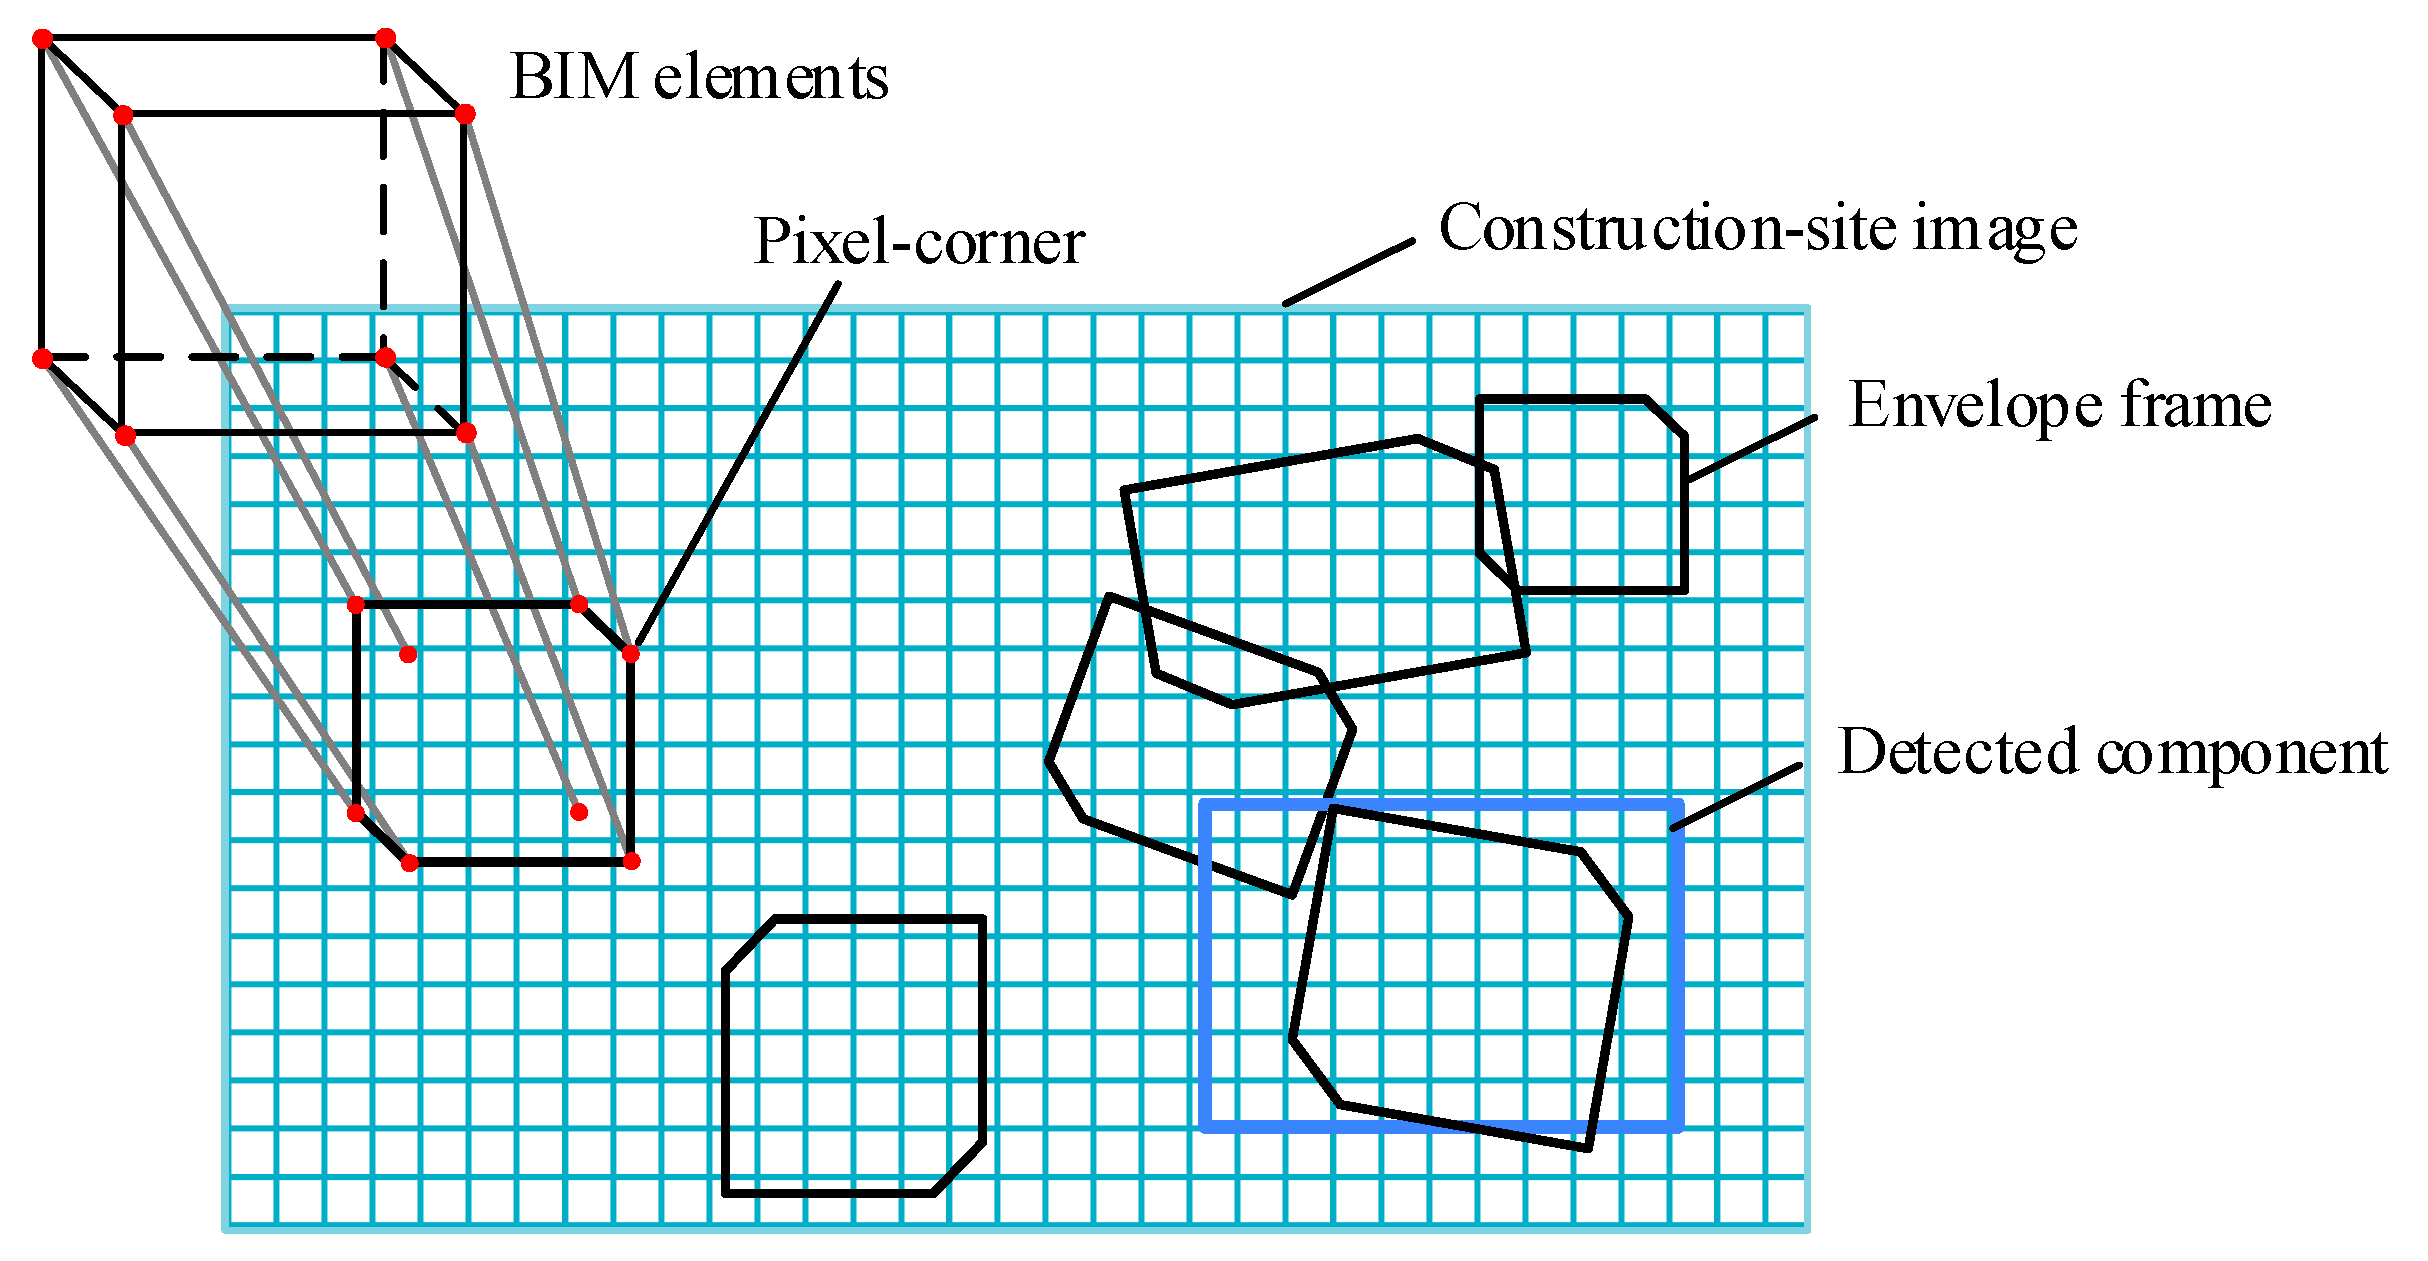
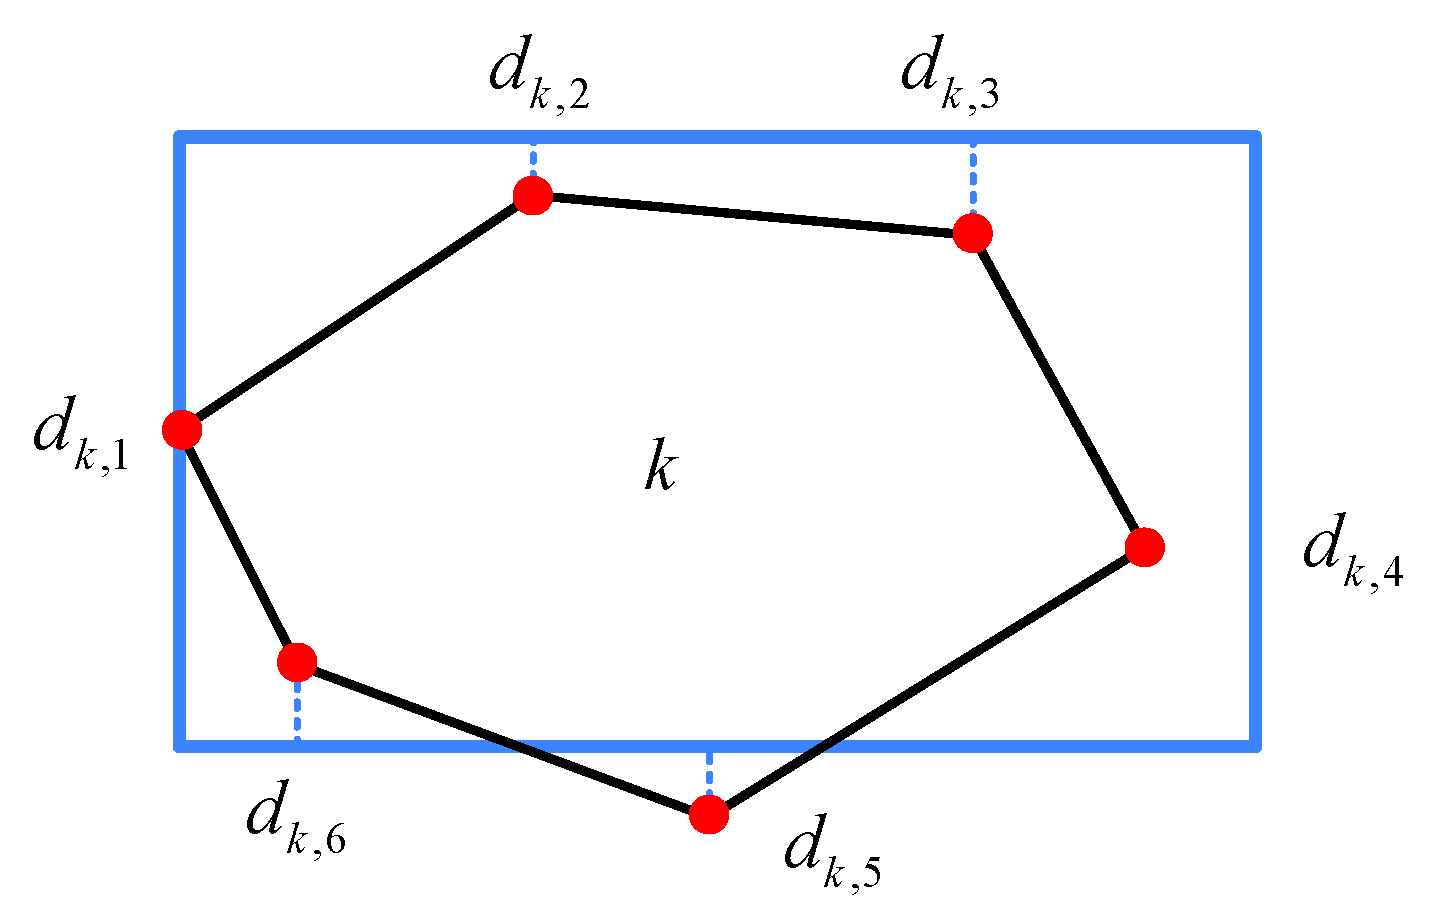
3.3.1. BIM-to-Image Rough Registration

This section establishes the mapping relationship between the BIM elements (building components) and the detected components. It works by calculating the positional relationship between the BIM projection area and the detection results in the imaging plane.
First, it is necessary to calculate the position of BIM elements in each image plane. In this study, the coordinates of each corner of BIM element are extracted manually at once. Through the transformation of the projection model, the coordinates of the corners of BIM elements in the plane can be obtained. As show in Figure 4, each corner of the component corresponds to a pixel point, which is named as ‘pixel-corner’. Then, the exterior pixel-corners are connected to form a convex polygon, named ‘envelope frame’, so that all the pixel-corners are wrapped in the envelope frame and the component location can be represented by these pixel-corners on the envelope frame.
Then, for each detected component, it is compared with the BIM projection areas. The comparison method is shown in Figure 5. The outer rectangular box is a location frame generated by target detection, and the inner polygon is an envelope frame generated by a BIM element projection, which is a convex polygon composed of six pixel-corners. For each rectangular frame, the mean-square error between it and the envelope frame k could be calculated by:
D k = 1 n i = 1 n d k , i 2 , i = 1 , 2 , , n
where k is the index of the envelope frame; d k , i is the minimum distance from the pixel-corner i of the envelope frame k to the four edges of the rectangular box; and n is the number of pixel-corners. The BIM element corresponding to the minimum mean-square error D k is chosen, and the registration result is as follows:
K = { k | min D k }
where K represents the envelope frame with index k.
The purpose of rough registration is to match the building components identified in images with the items in the BIM element projection library. However, for each registration, most BIM envelope frames are useless. Therefore, the envelope frames that satisfy any of the following conditions would be excluded:
  • The envelope frames of components that do not belong to the construction layer;
  • The envelope frames which do not overlap with the rectangular box;
  • The envelope frames with horizontal and vertical dimensions greater than two times or less than 0.5 times the size of the rectangular box;
  • The envelope frames whose type are inconsistent with the rectangular box.
To visualize the BIM-to-Image registration, a component is taken as an example to show the experimental process and results. The component is detected from a construction-site image, which is a rectangular box, as shown in Figure 6a. Its BIM model is a hexahedron, as shown in Figure 6b. When the hexahedron is projected onto the construction-site image, it becomes a polygon and is registered with the rectangular frame, as shown in Figure 6c.

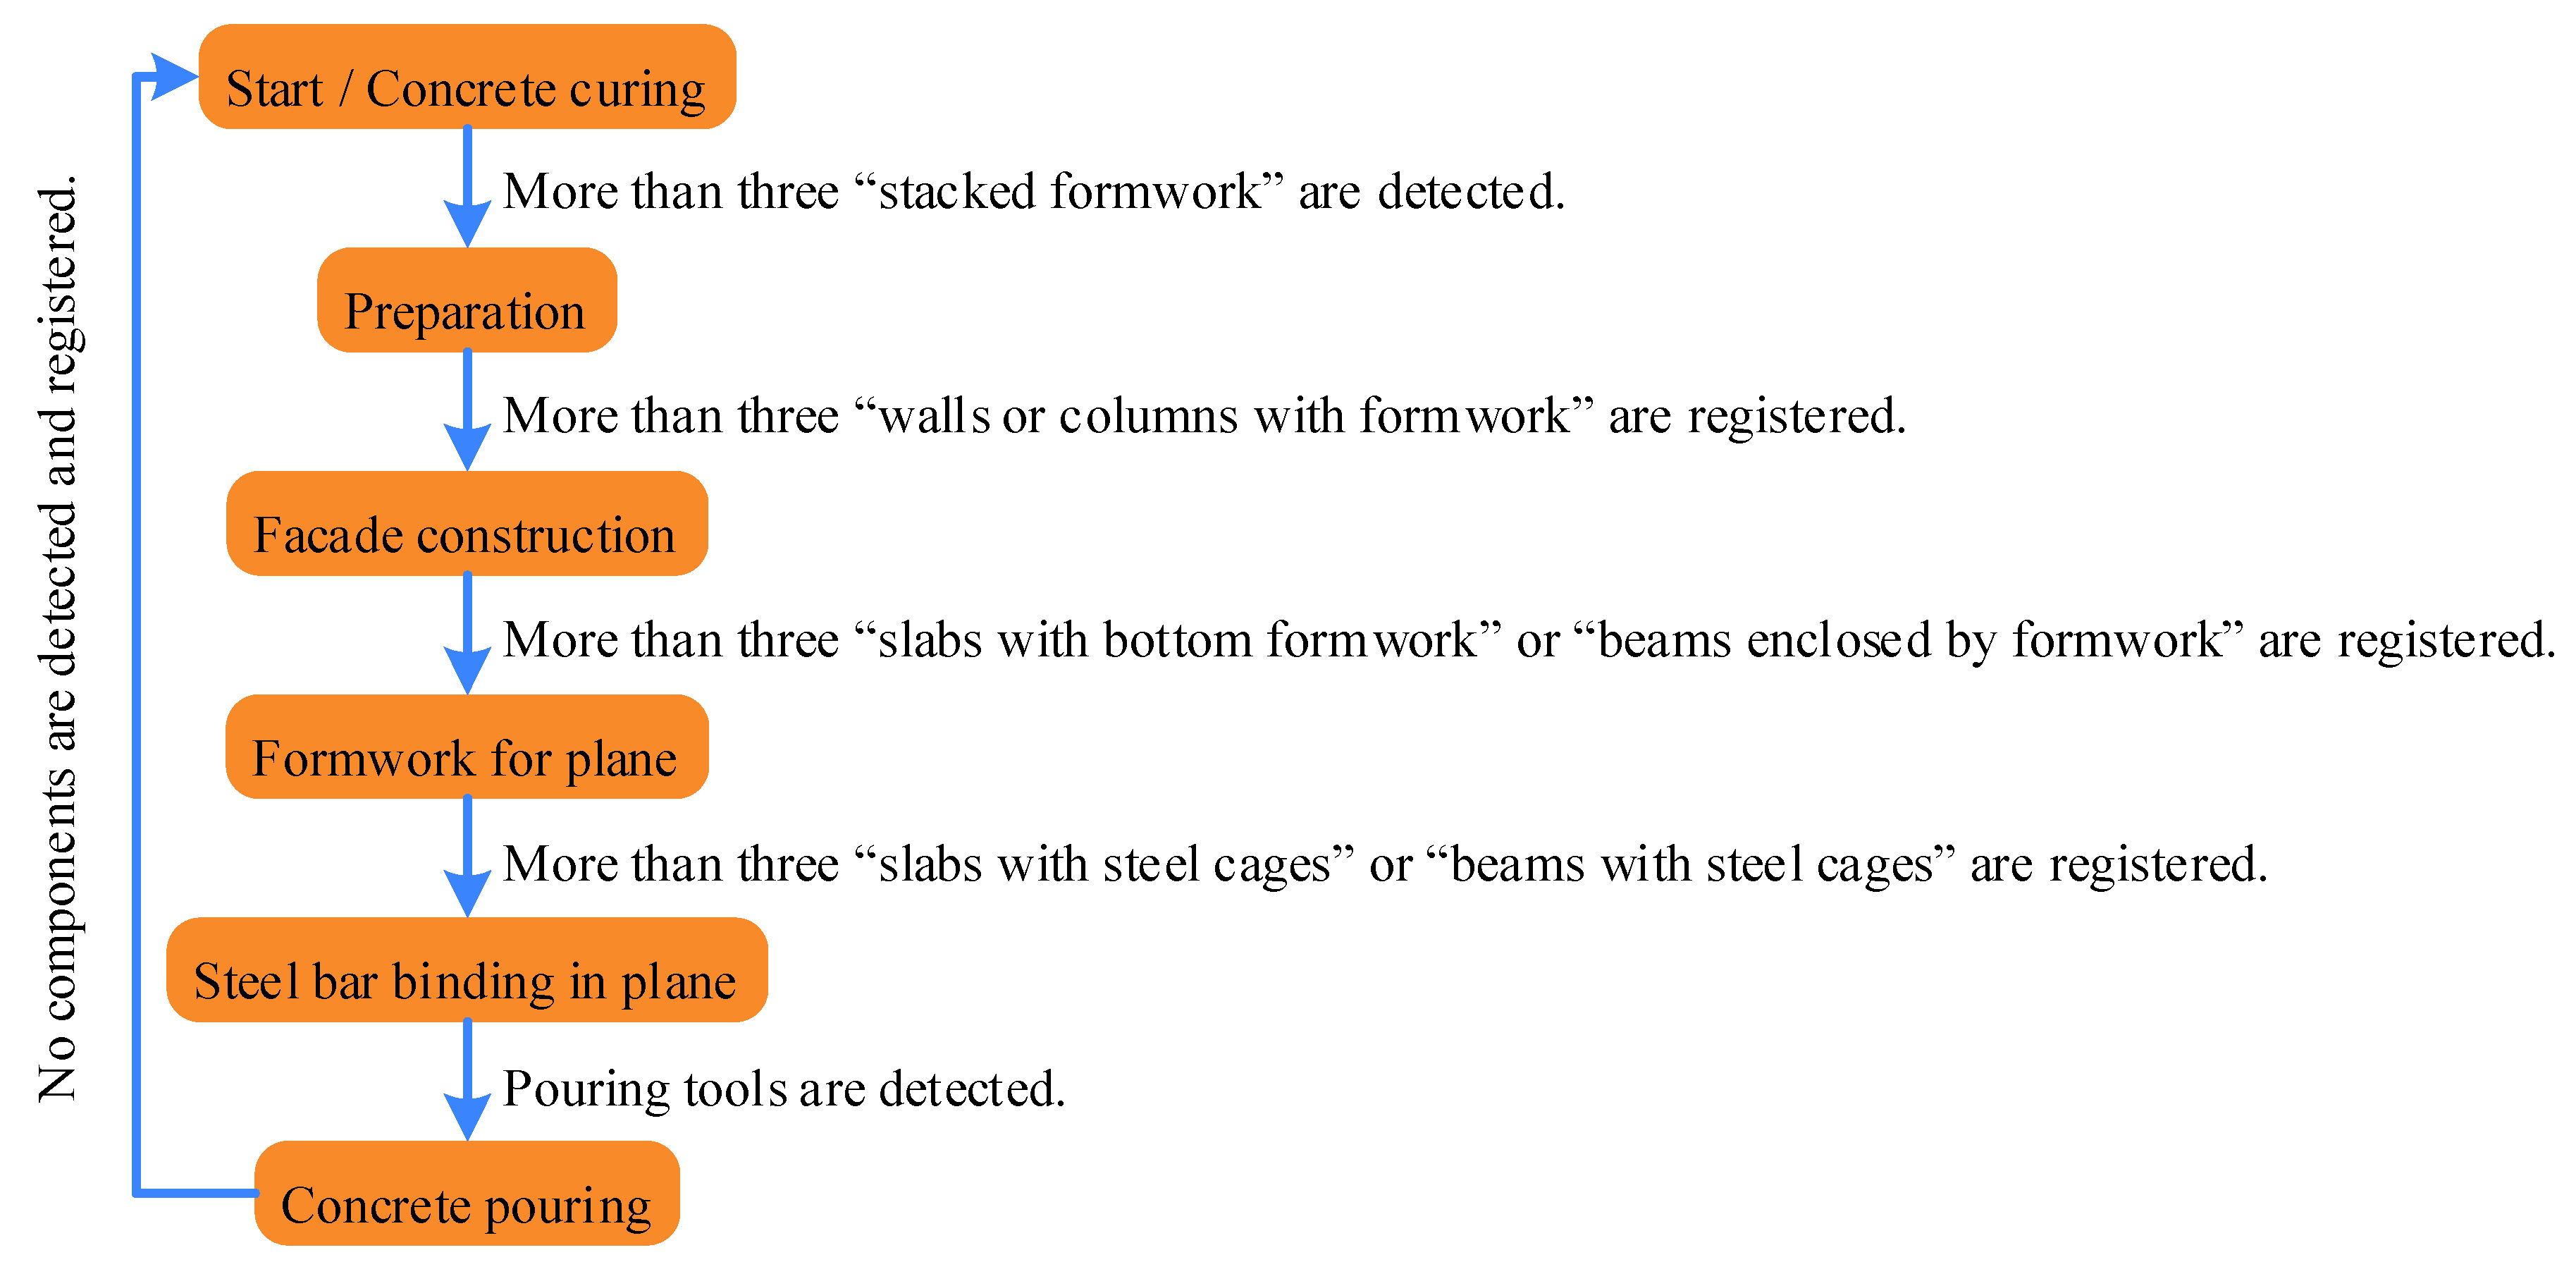
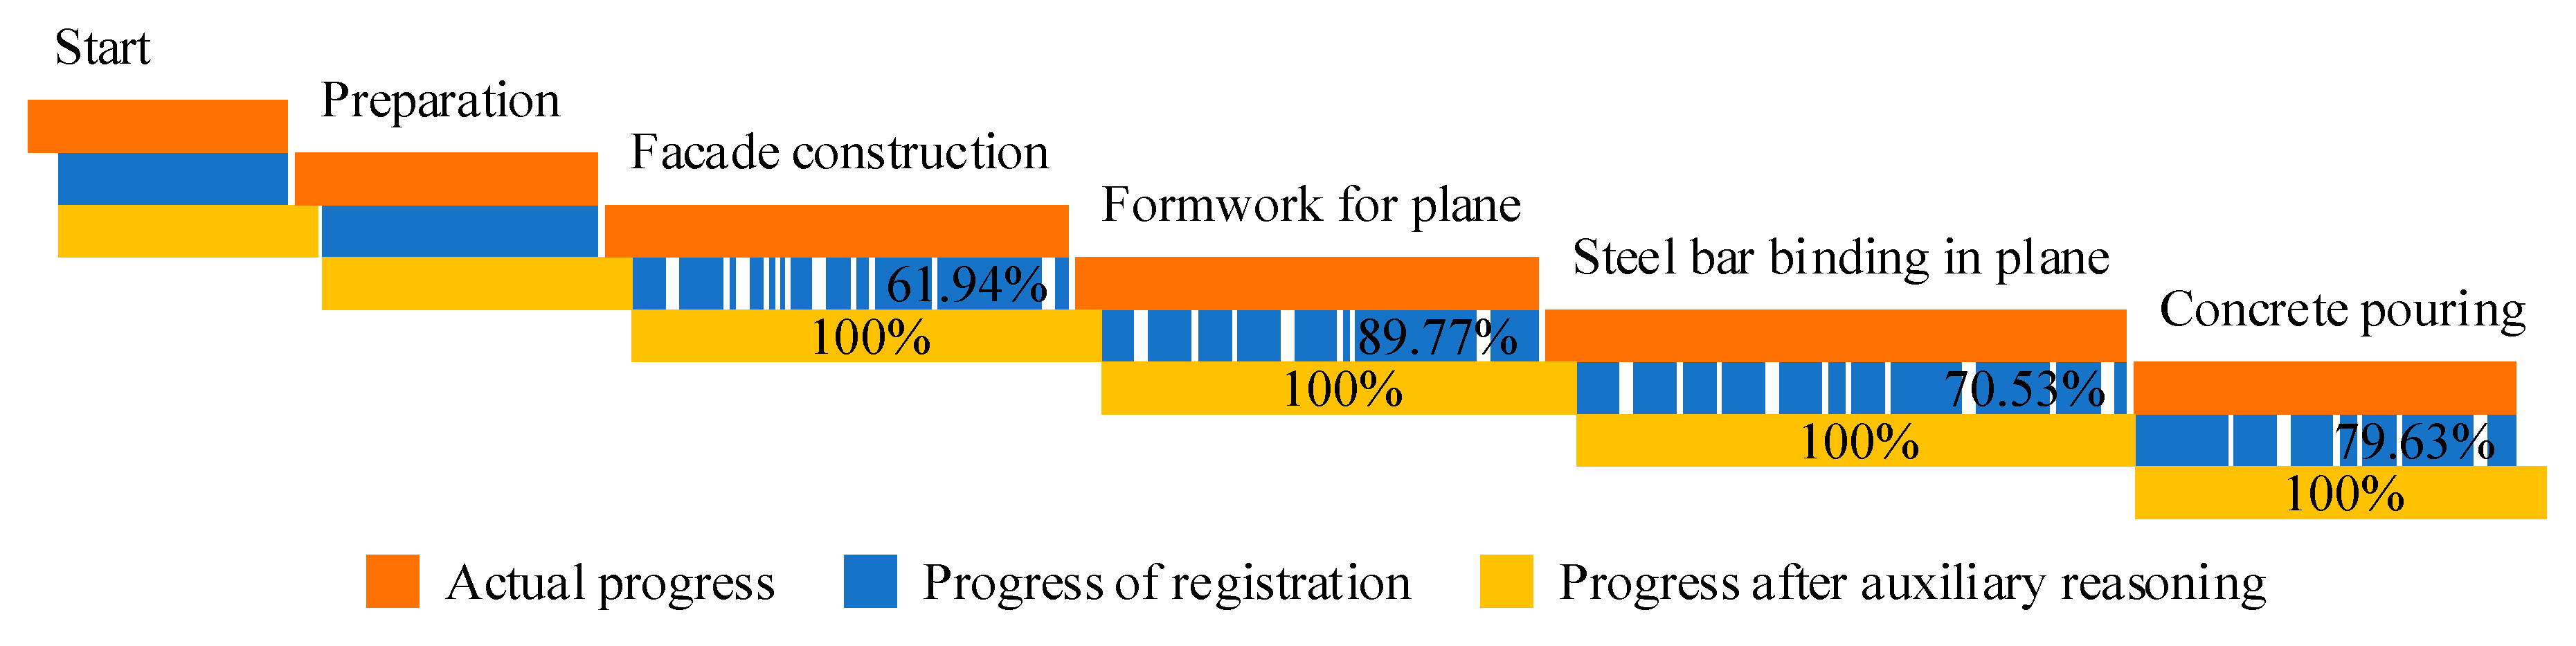
3.3.2. Progress Reasoning

After the registration, the BIM elements corresponding to the target recognition results are obtained, however they are not the schedule. It is necessary to further infer the construction progress with auxiliary information. In addition, due to the widespread occlusion in a construction site, many components are not recognized and registered. Therefore, through auxiliary reasoning, the influence of occlusion can be avoided as much as possible to obtain the actual progress.
Using auxiliary information to assist reasoning can greatly reduce the duplication of effort in the data collection phase and the ambiguity of recognition results. The auxiliary information includes physical relations (aggregation, topological and directional relationships) and logical relations between objects or geometric primitives. Nuchter and Hertzberg [67] represented the knowledge model of the spatial relationships with a semantic net. Nguyen et al. [68] automatically derived topological relationships between solid objects or geometric primitives with a 3D solid CAD model. Braun et al. [30] attributed these relationships to technological dependencies and represented these dependencies with graphs (nodes for building elements and edges for dependencies).
In this study, the sequential relationship of different components is used as supplementary information for auxiliary reasoning. For example, when the bottom formworks of slabs are detected and registered, it can be considered that the steel bar binding and formwork supporting work of facades have been finished. Figure 7 shows the conditions under which construction can be judged to have entered a new stage. To avoid accidental errors, the threshold of stage update is set to three. After the concrete pouring, building components cannot be identified, and the construction progress would be judged to enter a new floor.

4. Experiment and Analysis

4.1. Experimental Data Collection and Setup

To verify the effectiveness of this method, an experiment was carried out in a high-rise building construction site. A tower crane driver was employed to take several top views of the construction site every day. Within 45 days, a total of 117 images with a resolution of 4000 × 3000 pixels were collected. The distribution of 117 images was shown in Figure 8. The calibration results of internal parameters were as follows: focal length is 3144.71 × 3178.63 pixels; principal point is 2062.56 × 1270.47 pixels; and skew is −15.48.

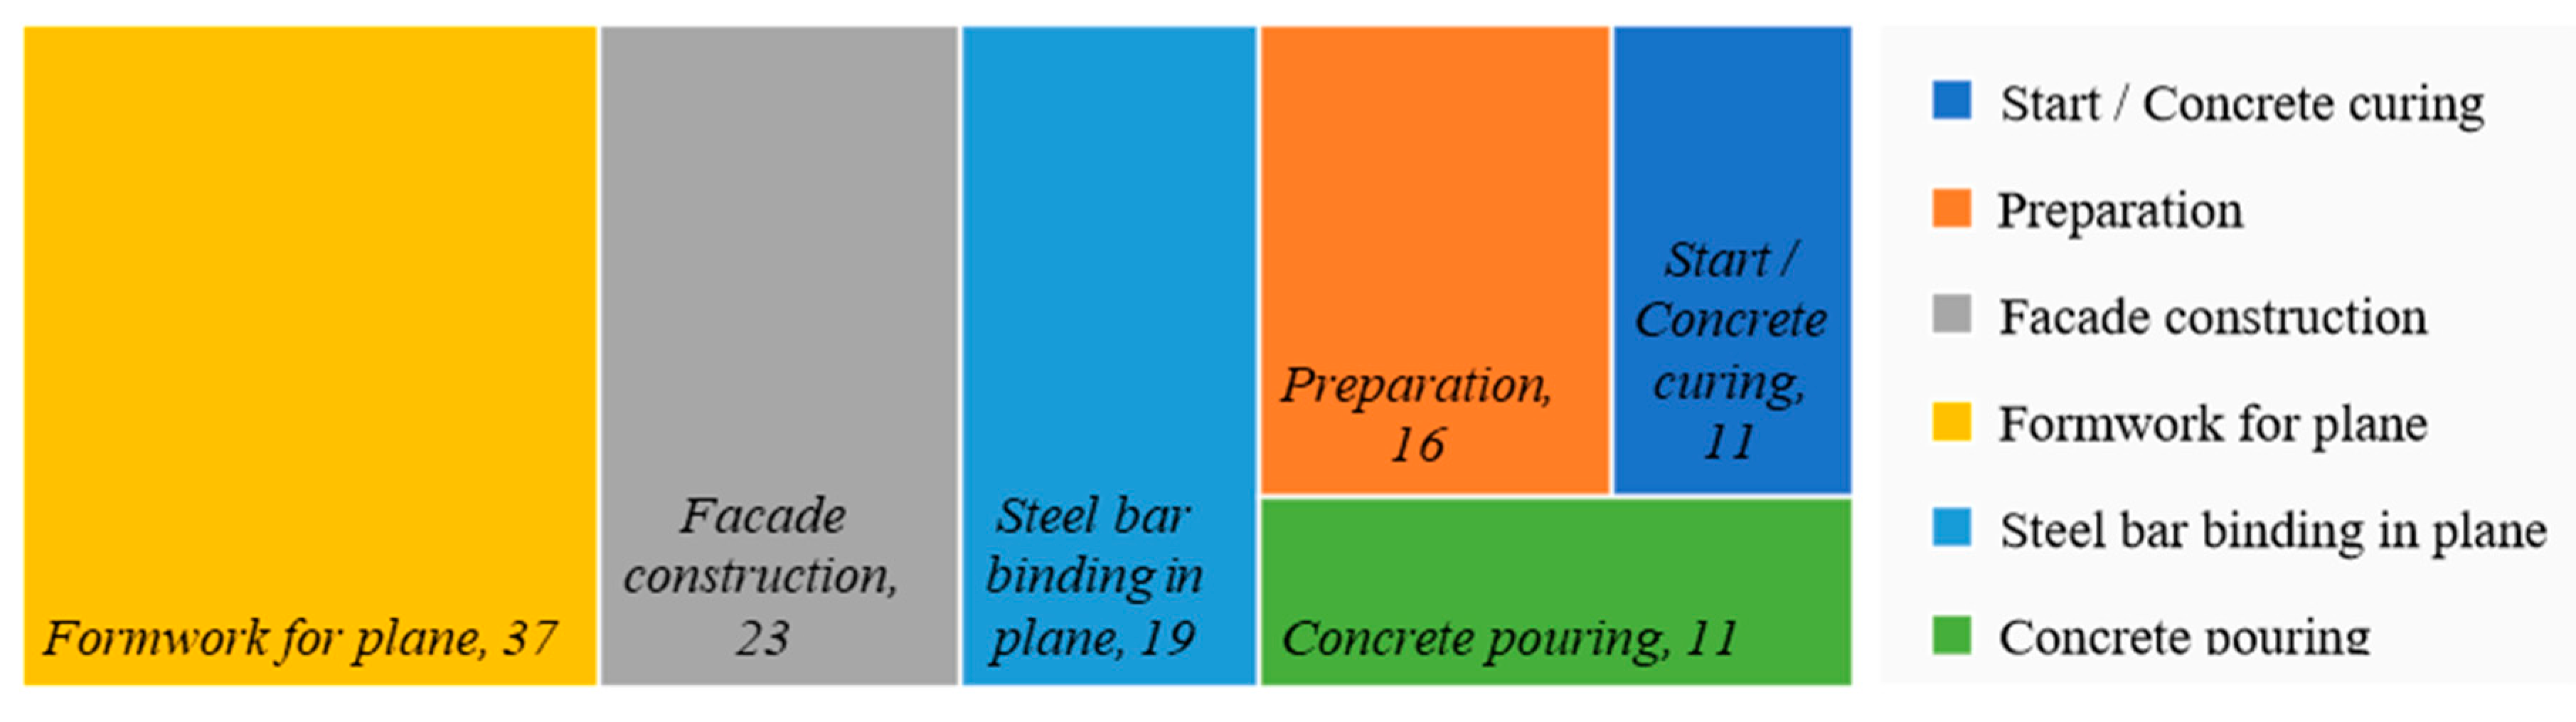
4.2. Results and Analysis

In the process of obtaining the construction schedule, three results are generated: detection result, registration result and process reasoning result. In the following, these results are analyzed to evaluate the performance of the method. The collected image data belong to different floors and different construction stages, and the content of multiple images taken at the same time is repeated. To eliminate the influence of sample size, the images taken at the same time are regarded as a group (64 groups in total), and then these groups are classified into five construction stages. Therefore, taking the construction stage as the category and the group as the unit, these data were averaged and analyzed.
The detection results are shown in Table 3, including the detection accuracy of various components and the time-consuming of each image. In the calculation, the repeated components in the same group are treated as a component as it only needs to be identified once to prove that the component already exists.
It can be seen from Table 3 that the algorithm has a better effect on the recognition of “Stacked formwork” and “Pouring tools”, and the worst effect on the recognition of “Walls or columns with formwork” and “Slabs with steel cages”. In the preparation phase, “Stacked formwork” is almost not occluded, and its boundary is so clear that it is easy to be detected. In the facade construction stage, the construction site is chaotic, and the occlusion caused by the interaction between walls or columns is serious, so that the recognition effect is not ideal. In the plane formwork stage, the bottom formwork of slab blocks the results of steel bar binding and formwork erection in the lower layer, and the bottom formwork is orderly arranged with clear boundaries. Although there are some errors caused by occlusion or half formwork, the recognition effect is better than other stages. In the stage of steel bar binding in plane and concrete pouring, the content of recognition is the slabs or beams with steel cages, however the steel cages obscure the bottom formwork and make the boundaries of components fuzzy, so that the recognition effect is poor. In addition, the average detection time of each image is 65.43 ms.
The registration results are shown in Table 4, including the registration accuracy of various components and the registration time of each image. The progress collection ratio is set to evaluate how much progress information the method has collected from the image during the whole process.
We can see from Table 4 that the registration accuracy of the column and wall is the lowest, the registration accuracy of slab and beam is similar, and the registration accuracy of the slab is higher than that of the beam. From an overall perspective, the progress collection rate of the facade construction stage is the lowest, and that of the plane formwork stage is the highest. In the plane formwork stage, the progress collection rate of the slab is higher than that of the beam, however it is opposite to the plane steel bar binding stage and concrete pouring stage. Overall, the progress collection rate mainly depends on the effect of detection accuracy, and is less affected by the registration accuracy.
The progress reasoning results are shown in Figure 9, including the actual process, process of registration and process after auxiliary reasoning. These data are used to analyze the recall rate of construction progress information and the effectiveness of auxiliary reasoning.
From Figure 10, the progress collected is behind the actual construction progress, as there are not enough components in the top view to prove that the construction has started, and the threshold of the progress update is set so as to avoid any incorrect reasoning in this paper. In the process of registration, some components are not detected, so the progress data is intermittent. Considering the number of components cannot be used to evaluate the construction progress at the beginning and preparation stage, the construction progress of registration is not marked. In other construction stages, the ratio of the number of registered components to the number of components in images is used as the construction progress of registration. Among them, the concrete pouring stage starts from the detection of pouring tools, and the progress is calculated by the missing slabs and beams with steel bar cages. From the data, it can be concluded that the progress of facade construction, steel bar binding in plane and concrete pouring is fuzzy, while the progress of formwork for the plane is clear. After auxiliary reasoning, the construction progress of each stage is completed before the next stage, so the final construction progress is consistent with the actual construction progress in general, although there are some delays.

4.3. Analysis of Error Cases

Error cases are illustrated from three aspects: recognition, registration and reasoning. The causes of detection errors are diverse, including occlusion, light intensity, richness of training set data and so on. Figure 10 shows four detection error cases. The formwork of a wall in Figure 10a is not detected as it is shaded by reinforcement cages. The beams in Figure 10b are not detected as their features are not obvious. In contrast, the support bars of a bottom formwork in Figure 10c are identified as a wall. A formwork is detected in Figure 10d, however it is actually a formwork supported for other components, which is not expected.
The reason for registration error lies in the inaccurate detection results, and the camera calibration has little impact on the registration results. Figure 11 shows three cases of registration errors. Figure 11a shows that the formwork is identified as small blocks due to the obvious interference lines inside the formwork after raining. The formwork in Figure 11b is being assembled and therefore identified as small pieces. The recognized types of these components are correct, however the wrong registration occurs due to the large size difference. The three formworks in Figure 11c are actually stacked, although they are identified as bottom formworks, which lead to improper registration.
The reason of reasoning error lies in two aspects: one is that some components cannot be detected, and the other is that the threshold to determine that the progress has changed is set. Among them, the setting of threshold is the necessary cost to avoid more serious errors. Figure 12 shows two examples of reasoning errors. No member is identified in Figure 12a, so it is assumed that the construction has entered the concrete curing stage, although the opposite is true. In Figure 12b, two bottom formworks are detected, however since the number is less than three, it is not determined that the construction has entered the plane formwork support stage.
To sum up, errors occur in different stages, and the main reason is the low detection accuracy caused by occlusion and light. However, most detection errors can be eliminated during registration, so the registration process can improve the accuracy of the final result. Although there are errors in the camera calibration process, these errors are very small and hardly affect the final result. In the progress reasoning stage, auxiliary conditions are used to ensure the reliability of the obtained progress information. These auxiliary conditions will cause the obtained progress to be slightly delayed. The threshold set in this paper is three components, which has an acceptable impact on the timeliness of data.

5. Discussion

5.1. Why Target Detection?

The method used to obtain progress information in this paper is one of target detection, rather than one in that identifies materials in the back-projected area. Target detection has many outstanding advantages:
  • Target detection can identify component categories with texture and context information in the image. In construction, many components are made of concrete, which makes it difficult to tell whether the components are beams, slabs, columns, or walls only according to the material. Compared with the method of inferring component types by measuring the space occupied by the point cloud, object detection can make full use of the texture information of the material in the image. Furthermore, compared with the method of identifying material in the back-projected area, target detection can make full use of the context information in the image;
  • Target detection identifies the actual components rather than the planned ones in the schedule. When using the back projection method, it is unrealistic to project all the components into the image, so it is necessary to determine which components are projected each time, and which is the root of the problem. The general construction progress can be planned by referring to historical experience, however the specific implementation of these plans in practice is affected by many factors. When a few components are projected, there is uncertainty as to whether these components will be built first and while many components are projected, the occlusion relationship among these components cannot be determined. Therefore, the number of projected components and the order of schedule implementation will impact the effect of schedule tracking. In contrast to this method, target detection directly identifies the existing components from the image without the planned information, which is more flexible;
  • Target detection can be extended to the identification of other objects on the construction site. In this paper, target detection is used to identify formwork, steel cages, pouring tools and so on, which is necessary for progress reasoning in this paper. In future research, more components, tools, materials, machinery and personnel can be identified to enrich the collected construction progress details or expand other management functions based on this technology.

5.2. The Role of Rough Registration

In fact, the construction progress can be inferred from the target detection results. For example, the ratio of the number of detected components to the total number of components can be used as the construction progress, and the appearance of new components, can be used as the updated condition of the construction stage. However, rough registration is still used in this paper to specify the schedule to each component. This is case as the authors want to improve the accuracy of recognition, which is helpful to expand other functions of this technology in the future. In addition, the method refines the progress to the component level, which makes it applicable to a flat building structure. Most importantly, the rough registration can eliminate most of the components that are wrongly detected, which makes up for the defect of low recognition rate.

5.3. Coherence of Images

This method requires at least one group of data to be collected every day, during which the construction site changes greatly. Therefore, it is necessary to collect a certain proportion of the surrounding background to achieve the registration of the front and back images and obtain the external parameters of new images. When the tower crane is lifted, the construction site before and after lifting should be recorded to avoid too many changes affecting the registration effect.

5.4. Advantages

Above all, the advantages of this method are mainly shown in the following five aspects:
  • Top view: The high-rise building is constructed in layers, and the components of each layer overlap less in the vertical direction, although they overlap seriously in the horizontal direction. With the help of a tower crane, the construction site can be photographed clearly with less shielding;
  • Auxiliaries rather than concrete members: The material used to infer construction progress in this paper is the auxiliary of building components. This includes a formwork, support, reinforcement cage and pouring tool. Compared with the method of identifying concrete components, this method is more suitable for the actual construction site, the reason being that in the construction site of a cast-in-place concrete structure it is these auxiliary materials that can be collected rather than the concrete component itself;
  • Target detection rather than material identification: Compared with material identification, target detection considers not only the texture of the material, but also the context information in the image. In this way, the detection results can be specific to the type of components, which is more accurate and avoids the confusion of adjacent components;
  • Rough registration: In the process of registration between the target detection results and BIM model projection, four constraints are set to exclude irrelevant components, which improves the registration efficiency and accuracy. In addition, rough registration is not strict registration, which provides a certain fault tolerance space and ensures the accuracy of registration;
  • Point cloud avoidance: The current 3D reconstruction process mainly relies on the point cloud, however, there are some inherent shortcomings in point cloud-based 3D reconstruction. Firstly, it is time-consuming to remove all points of the backgrounds and the objects of no interest, and there is no guarantee on the completeness of the point clouds. In addition, the point clouds also have problems such as high noise, difficulty in segmentation and registration. The proposed method does not need to infer the progress by calculating the space occupied by feature points, so the trouble caused by the point cloud is avoided.

5.5. Limitations

The limitations of this method include the following two aspects:
  • External parameter error accumulation: The quality of the lens, the inaccuracy of the manual estimation of the coordinates of the known points in the initial image, the registration error between images and other factors will cause the inaccuracy of the estimated external parameters. After several iterations, the five errors accumulate continuously. Therefore, external parameters need to be adjusted regularly to keep them accurate;
  • Incompatibility with indoor scenes: The indoor space is limited, and the camera is very close to the subject. If you want to include all the scene details as much as possible, you need to take a lot of photos. The more photos, the lower the accuracy of camera calibration results. Multiple start scenes must be set to improve the registration accuracy. However, each initial scenario requires manual participation, which is not in line with the original intention of automatically collecting progress information. Therefore, this method needs to be further improved to adapt to indoor scenes in the future.

5.6. Application

There are many manual working steps for target detector training, camera calibration, registration and progress reasoning. When this method is applied to other high-rise building projects in the future, the repeatability and automation of different steps are different, as shown in Table 5. Most of the steps are automated and the workload of manual operation is small.

6. Conclusions and Future Works

Monitoring the construction process of high-rise buildings is the weak part of the research as the concrete components are obscured by formwork, wooden strips, steel bars and other sundries. This paper presents a solution by realizing the automatic tracking of high-rise building construction process. Using the target detection technology, the method first identifies the building components in different states from the top view of the construction site. Secondly, based on the principle of triangular imaging, the mapping between the 3D world (BIM) and the imaging plane is established to make the 3D BIM elements and the components in the image comparable. Then, the rough registration algorithm is used to match the BIM elements with the target detection results one by one. Finally, the construction progress is inferred from the number of components in each state in one floor. When compared to similar methods, this paper uses the top view to reduce the occlusion and identify the auxiliary objects of the construction site instead of the concrete components, and uses the target detection instead of the material classification, which is more simple, efficient and practical. In addition, the combination of target detection and rough registration makes the method make full use of the context information in the image and avoid the error caused by false recognition.
Nevertheless, there are still some open research challenges that need further investigation. For instance, in this paper, the detection effect of building components is not ideal. The reason for this is that the data set used for training is very small, so a larger data set is needed for recognizer training in the future. In addition, it is a wise choice to use video instead of manually collected images for monitoring, which can make the construction progress update in real time. However, the tracked construction progress is still slightly delayed, so in the future, other clues in the construction site can be used to replace the number of detected or registered components to update the construction stage.

Author Contributions

Conceptualization, J.X.; investigation, J.X. and X.H.; writing—original draft preparation, J.X.; writing—review and editing, J.X. All authors have read and agreed to the published version of the manuscript.

Funding

This research received no external funding.

Institutional Review Board Statement

Not applicable.

Informed Consent Statement

Not applicable.

Data Availability Statement

The data presented in this study are available on request from the corresponding author. The data are not publicly available as the data also forms part of an ongoing study.

Conflicts of Interest

The authors declare no conflict of interest.

References

  1. Wua, K.; de Sotob, B.G.; Adeyc, B.T.; Zhanga, F. BIM-based estimation of vertical transportation demands during the construction of high-rise buildings. Autom. Constr. 2020, 110, 102985. [Google Scholar] [CrossRef]
  2. Do, S.T.; Nguyen, V.T.; Dang, C.N. Exploring the relationship between failure factors and stakeholder coordination performance in high-rise building projects: Empirical study in the finishing phase. Eng. Constr. Archit. Manag. 2021; ahead-of-print. [Google Scholar] [CrossRef]
  3. Andriasyan, M.; Moyano, J.; Nieto-Julián, J.E.; Antón, D. From point cloud data to building information modelling: An automatic parametric workflow for heritage. Remote Sens. 2020, 12, 1094. [Google Scholar] [CrossRef] [Green Version]
  4. Adan, A.; Quintana, B.; Prieto, S.A.; Bosche, F. An autonomous robotic platform for automatic extraction of detailed semantic models of buildings. Autom. Constr. 2020, 109, 102963. [Google Scholar] [CrossRef]
  5. Liu, J.; Xu, D.; Hyyppa, J.; Liang, Y. A survey of applications with combined BIM and 3D laser scanning in the life cycle of buildings. IEEE J. Sel. Top. Appl. Earth Observ. Remote Sens. 2021, 14, 5627–5637. [Google Scholar] [CrossRef]
  6. Zhang, C.; Arditi, D. Advanced progress control of infrastructure construction projects using terrestrial laser scanning technology. Infrastructures 2020, 5, 83. [Google Scholar] [CrossRef]
  7. Bechtold, S.; Höfle, B. Helios: A multi-purpose LiDAR simulation framework for research, planning and training of laser scanning operations with airborne, ground-based mobile and stationary platforms. ISPRS Ann. Photogramm. Remote Sens. Spat. Inf. Sci. 2016, III-3, 161–168. [Google Scholar] [CrossRef] [Green Version]
  8. Hong, S.; Park, I.; Lee, J.; Lim, K.; Choi, Y.; Sohn, H.G. Utilization of a terrestrial laser scanner for the calibration of mobile mapping systems. Sensors 2017, 17, 474. [Google Scholar] [CrossRef] [Green Version]
  9. Rebolj, D.; Pučko, Z.; Babič, N.Č.; Bizjak, M.; Mongus, D. Point cloud quality requirements for Scan-vs-BIM based automated construction progress monitoring. Autom. Constr. 2017, 84, 323–334. [Google Scholar] [CrossRef]
  10. Xu, Y.; Stilla, U. Toward building and civil infrastructure reconstruction from point clouds: A review on data and key techniques. IEEE J. Sel. Top. Appl. Earth Observ. Remote Sens. 2021, 14, 2857–2885. [Google Scholar] [CrossRef]
  11. Omar, H.; Mahdjoubi, L.; Kheder, G. Towards an automated photogrammetry-based approach for monitoring and controlling construction site activities. Comput. Ind. 2018, 98, 172–182. [Google Scholar] [CrossRef]
  12. Yang, J.; Shi, Z.-K.; Wu, Z.-Y. Towards automatic generation of as-built BIM: 3D building facade modeling and material recognition from images. Int. J. Autom. Comput. 2016, 13, 338–349. [Google Scholar] [CrossRef]
  13. Kropp, C.; Koch, C.; König, M. Interior construction state recognition with 4D BIM registered image sequences. Autom. Constr. 2018, 86, 11–32. [Google Scholar] [CrossRef]
  14. Acharya, D.; Ramezani, M.; Khoshelham, K.; Winter, S. BIM-Tracker: A model-based visual tracking approach for indoor localisation using a 3D building model. ISPRS Ann. Photogramm. Remote Sens. Spat. Inf. Sci. 2019, 150, 157–171. [Google Scholar] [CrossRef]
  15. Deng, H.; Hong, H.; Luo, D.; Deng, Y.; Su, C. Automatic indoor construction process monitoring for tiles based on BIM and computer vision. J. Constr. Eng. M. 2020, 146, 04019095. [Google Scholar] [CrossRef]
  16. Han, X.-F.; Laga, H.; Bennamoun, M. Image-based 3D object reconstruction: State-of-the-art and trends in the deeplearning era. IEEE T. Pattern Anal. 2019, 43, 1578–1604. [Google Scholar] [CrossRef] [Green Version]
  17. Liu, Y.-p.; Yan, X.-p.; Wang, N.; Zhang, X.; Li, Z. A 3D reconstruction method of image sequence based on deep learning. J. Phys. Conf. Ser. 2020, 1550, 032051. [Google Scholar] [CrossRef]
  18. Golparvar-Fard, M.; Peña-Mora, F.; Savarese, S. Automated progress monitoring using unordered daily construction photographs and IFC-based building information models. J. Comput. Civil Eng. 2015, 29, 04014025. [Google Scholar] [CrossRef]
  19. Golparvar-Fard, M.; Peña-Mora, F.; Arboleda, C.A.; Lee, S. Visualization of construction progress monitoring with 4D simulation model overlaid on time-lapsed photographs. J. Comput. Civil Eng. 2009, 23, 391–404. [Google Scholar] [CrossRef] [Green Version]
  20. Pučko, Z.; Šuman, N.; Rebolj, D. Automated continuous construction progress monitoring using multiple workplace real time 3D scans. Adv. Eng. Inform. 2018, 38, 27–40. [Google Scholar] [CrossRef]
  21. Dimitrov, A.; Golparvar-Fard, M. Vision-based material recognition for automated monitoring of construction progress and generating building information modeling from unordered site image collections. Adv. Eng. Inform. 2014, 28, 37–49. [Google Scholar] [CrossRef]
  22. Lee, Y.-J.; Park, M.-W. 3D tracking of multiple onsite workers based on stereo vision. Autom. Constr. 2019, 98, 146–159. [Google Scholar] [CrossRef]
  23. Park, M.-W.; Brilakis, I. Construction worker detection in video frames for initializing vision trackers. Autom. Constr. 2012, 28, 15–25. [Google Scholar] [CrossRef]
  24. Son, H.; Kim, C. Integrated worker detection and tracking for the safe operation of construction machinery. Autom. Constr. 2021, 126, 103670. [Google Scholar] [CrossRef]
  25. Park, M.-W.; Brilakis, I. Continuous localization of construction workers via integration of detection and tracking. Autom. Constr. 2016, 72, 129–142. [Google Scholar] [CrossRef]
  26. Xiao, B.; Kang, S.-C. Vision-based method integrating deep learning detection for tracking multiple construction machines. J. Comput. Civil Eng. 2021, 35, 04020071. [Google Scholar] [CrossRef]
  27. Xiao, B.; Lin, Q.; Chen, Y. A vision-based method for automatic tracking of construction machines at nighttime based on deep learning illumination enhancement. Autom. Constr. 2021, 127, 103721. [Google Scholar] [CrossRef]
  28. Zhu, Z.; Ren, X.; Chen, Z. Integrated detection and tracking of workforce and equipment from construction jobsite videos. Autom. Constr. 2017, 81, 161–171. [Google Scholar] [CrossRef]
  29. Hou, X.; Zeng, Y.; Xue, J. Detecting structural components of building engineering based on deep-learning method. J. Constr. Eng. M. 2020, 146, 04019097. [Google Scholar] [CrossRef]
  30. Braun, A.; Tuttas, S.; Borrmann, A.; Stilla, U. A concept for automated construction progress monitoring using BIM-based geometric constraints and photogrammetric point clouds. J. Inf. Technol. Constr. 2015, 20, 68–79. [Google Scholar]
  31. Han, K.; Degol, J.; Golparvar-Fard, M. Geometry-and appearance-based reasoning of construction progress monitoring. J. Constr. Eng. M. 2018, 144, 04017110. [Google Scholar] [CrossRef] [Green Version]
  32. Han, K.K.; Golparvar-Fard, M. Appearance-based material classification for monitoring of operation-level construction progress using 4D BIM and site photologs. Autom. Constr. 2015, 53, 44–57. [Google Scholar] [CrossRef]
  33. Rahimian, F.P.; Seyedzadeh, S.; Oliver, S.; Rodriguez, S.; Dawood, N. On-demand monitoring of construction projects through a game-like hybrid application of BIM and machine learning. Autom. Constr. 2020, 110, 103012. [Google Scholar] [CrossRef]
  34. Son, H.; Kim, C.; Kim, C. Automated color model-based concrete detection in construction-site images by using machine learning algorithms. J. Comput. Civil Eng. 2012, 26, 421–433. [Google Scholar] [CrossRef]
  35. Zhu, Z.; Brilakis, I. Parameter optimization for automated concrete detection in image data. Autom. Constr. 2010, 19, 944–953. [Google Scholar] [CrossRef]
  36. Zhu, Z.; Brilakis, I. Concrete column recognition in images and videos. J. Comput. Civil Eng. 2010, 24, 478–487. [Google Scholar] [CrossRef]
  37. Wang, Z.; Zhang, Q.; Yang, B.; Wu, T.; Lei, K.; Zhang, B.; Fang, T. Vision-based framework for automatic progress monitoring of precast walls by using surveillance videos during the construction phase. J. Comput. Civil Eng. 2021, 35, 04020056. [Google Scholar] [CrossRef]
  38. Bassier, M.; Van Genechten, B.; Vergauwen, M. Classification of sensor independent point cloud data of building objects using random forests. J. Build. Eng. 2019, 21, 468–477. [Google Scholar] [CrossRef]
  39. Wang, R.; Peethambaran, J.; Chen, D. LiDAR point clouds to 3-D urban models: A review. IEEE J. Sel. Top. Appl. Earth Observ. Remote Sens. 2018, 11, 606–627. [Google Scholar] [CrossRef]
  40. Wang, Q.; Tan, Y.; Mei, Z. Computational methods of acquisition and processing of 3D point cloud data for construction applications. Arch. Comput. Method Eng. 2019, 27, 479–499. [Google Scholar] [CrossRef]
  41. Czerniawski, T.; Leite, F. Automated digital modeling of existing buildings: A review of visual object recognition methods. Autom. Constr. 2020, 113, 103131. [Google Scholar] [CrossRef]
  42. Alizadeh Salehi, S.; Yitmen, İ. Modeling and analysis of the impact of BIM-based field data capturing technologies on automated construction progress monitoring. Int. J. Civil Eng. 2018, 16, 1669–1685. [Google Scholar] [CrossRef]
  43. Pučko, Z.; Rebolj, D. Automated construction progress monitoring using continuous multipoint indoor and outdoor 3D scanning. In Proceedings of the Lean and Computing in Construction Congress -Joint Conference on Computing in Construction, Heraklion, Greece, 4–7 July 2017; pp. 105–112. [Google Scholar] [CrossRef] [Green Version]
  44. Li, Y.; Li, W.; Tang, S.; Darwish, W.; Hu, Y.; Chen, W. Automatic indoor as-built building information models generation by using low-cost RGB-D sensors. Sensors 2020, 20, 293. [Google Scholar] [CrossRef] [PubMed] [Green Version]
  45. Wasenmüller, O.; Stricker, D. Comparison of kinect v1 and v2 depth images in terms of accuracy and precision. In Proceedings of the Asian Conference on Computer Vision(ACCV 2016), Taipei, Taiwan, China, 20–24 November 2016; pp. 34–45. [Google Scholar] [CrossRef]
  46. Volk, R.; Luu, T.H.; Mueller-Roemer, J.S.; Sevilmis, N.; Schultmann, F. Deconstruction project planning of existing buildings based on automated acquisition and reconstruction of building information. Autom. Constr. 2018, 91, 226–245. [Google Scholar] [CrossRef]
  47. Kim, C.; Kim, B.; Kim, H. 4D CAD model updating using image processing-based construction progress monitoring. Autom. Constr. 2013, 35, 44–52. [Google Scholar] [CrossRef]
  48. Ibrahim, Y.M.; Lukins, T.C.; Zhang, X.; Trucco, E.; Kaka, A.P. Towards automated progress assessment of workpackage components in construction projects using computer vision. Adv. Eng. Inform. 2009, 23, 93–103. [Google Scholar] [CrossRef]
  49. Han, K.K.; Golparvar-Fard, M. Potential of big visual data and building information modeling for construction performance analytics: An exploratory study. Autom. Constr. 2017, 73, 184–198. [Google Scholar] [CrossRef] [Green Version]
  50. Song, J.; Haas, C.T.; Caldas, C.H. Tracking the location of materials on construction job sites. J. Constr. Eng. M. 2006, 132, 911–918. [Google Scholar] [CrossRef] [Green Version]
  51. Navon, R.; Sacks, R. Assessing research issues in Automated Project Performance Control (APPC). Autom. Constr. 2007, 16, 474–484. [Google Scholar] [CrossRef]
  52. Tserng, H.P.; Dzeng, R.J.; Lin, Y.C.; Lin, S.T. Mobile construction supply chain management using PDA and bar codes. Comput. Aided Civ. Infrastruct. Eng. 2005, 20, 242–264. [Google Scholar] [CrossRef]
  53. Chen, Q.; Adey, B.T.; Haas, C.; Hall, D.M. Using look-ahead plans to improve material flow processes on construction projects when using BIM and RFID technologies. Constr. Innov. 2020, 20, 471–508. [Google Scholar] [CrossRef]
  54. Oner, M.; Ustundag, A.; Budak, A. An RFID-based tracking system for denim production processes. Int. J. Adv. Manuf. Technol. 2017, 90, 591–604. [Google Scholar] [CrossRef]
  55. Araújo, C.S.; de Siqueira, L.C.; Ferreira ED, A.M.; Costa, D.B. Conceptual framework for tracking metallic formworks on construction sites using IoT, RFID and BIM technologies. In Proceedings of the 18th International Conference on Computing in Civil and Building Engineering, São Paulo, Brazil, 18–20 August 2020; pp. 865–878. [Google Scholar] [CrossRef]
  56. Cho, Y.K.; Youn, J.H.; Martinez, D. Error modeling for an untethered ultra-wideband system for construction indoor asset tracking. Autom. Constr. 2010, 19, 43–54. [Google Scholar] [CrossRef]
  57. Chu, C.-C.; Nandhakumar, N.; Aggarwal, J.K. Image segmentation using laser radar data. Pattern Recognit. 1990, 23, 569–581. [Google Scholar] [CrossRef]
  58. GitHub. LabelImg: A Graphical Image Annotation Tool. Available online: https://github.com/tzutalin/labelImg (accessed on 15 January 2020).
  59. Shen, Z.; Liu, Z.; Li, J.; Jiang, Y.-G.; Chen, Y.; Xue, X. DSOD: Learning deeply supervised object detectors from scratch. In Proceedings of the IEEE International Conference on Computer Vision (ICCV), Venice, Italy, 22–29 October 2017; pp. 1937–1945. [Google Scholar] [CrossRef] [Green Version]
  60. Huang, G.; Liu, Z.; Van Der Maaten, L.; Weinberger, K.Q. Densely connected convolutional networks. In Proceedings of the IEEE Conference on Computer Vision and Pattern Recognition (CVPR), Honolulu, HI, USA, 21–26 July 2017; pp. 4700–4708. [Google Scholar] [CrossRef] [Green Version]
  61. GitHub. DSOD: Learning Deeply Supervised Object Detectors from Scratch. Available online: https://github.com/szq0214/DSOD (accessed on 15 January 2020).
  62. Zhang, Z. Flexible camera calibration by viewing a plane from unknown orientations. In Proceedings of the IEEE International Conference on Computer Vision (ICCV), Kerkyra, Greece, 20–27 September 1999; pp. 666–673. [Google Scholar] [CrossRef]
  63. GitHub. Sfm-Python. Available online: https://github.com/adnappp/Sfm-python (accessed on 15 January 2020).
  64. Lowe, D.G. Distinctive image features from scale-invariant keypoints. Int. J. Comput. Vision 2004, 60, 91–110. [Google Scholar] [CrossRef]
  65. Denœux, T. A k-nearest neighbor classification rule based on Dempster-Shafer theory. IEEE Trans. Syst. Man Cybern. 1995, 219, 804–813. [Google Scholar] [CrossRef] [Green Version]
  66. Lepetit, V.; Moreno-Noguer, F.; Fua, P. EPnP: An accurate O(n) solution to the PnP problem. Int. J. Comput. Vision 2009, 81, 155–166. [Google Scholar] [CrossRef] [Green Version]
  67. Nuchter, A.; Hertzberg, J. Towards semantic maps for mobile robots. Robot. Auton. Syst. 2008, 56, 915–926. [Google Scholar] [CrossRef] [Green Version]
  68. Nguyen, T.-H.; Oloufa, A.A.; Nassar, K. Algorithms for automated deduction of topological information. Autom. Constr. 2005, 14, 59–70. [Google Scholar] [CrossRef]
Figure 1. Examples of chaotic construction sites.
Buildings 12 00106 g001
Figure 2. Overview of the method.
Buildings 12 00106 g002
Figure 3. Calibration of external parameters.
Buildings 12 00106 g003
Figure 4. Envelope frame.
Buildings 12 00106 g004
Figure 5. Location Registration.
Buildings 12 00106 g005
Figure 6. The process of a component: (a) Detection result; (b) BIM element; (c) Registration result.
Buildings 12 00106 g006
Figure 7. Stage update conditions.
Buildings 12 00106 g007
Figure 8. Image distribution.
Buildings 12 00106 g008
Figure 9. Comparison of construction progress.
Buildings 12 00106 g009
Figure 10. Detection error cases: (a) Not detected due to occlusion; (b) Not detected as the feature is not obvious; (c) Detected, although of type error; (d) Detected, however it is an unrelated object.
Buildings 12 00106 g010
Figure 11. Registration error cases: (a) The interference of messy lines after rain; (b) Incomplete formwork; (c) Difficult distinction between stacked formwork and bottom formwork.
Buildings 12 00106 g011
Figure 12. Reasoning error cases: (a) End of concreting; (b) Start of formwork for plane.
Buildings 12 00106 g012
Table 1. Automatic construction progress measurement.
TypeMethodAdvantageLimitationReferences
Imaging techniquesLaser scanningAutomated data collection, high accuracy, not affected by illuminationExpensive equipment, high technical requirements, and limited texture information[3,4,5,6,43,44]
3D ranging cameraPortable, relatively cheap and rich texture informationshort range applications[20,45,46]
Image-based modelingLow cost, low technical requirements, portable, high resolution, and rich texture informationSensitivity to lighting conditions and high time complexity[11,12,13,14,16,17]
Material classification of projection areaLow cost, low technical requirements, portable, high resolution, and rich texture informationSensitivity to lighting conditions and high time complexity[31,32,47,48,49]
Geospatial techniquesGPSWide positioning range and strong adaptabilityLow precision and limited to outdoor[50]
BarcodeLow cost and simple operation requirementsTime consuming and easily damaged[51,52]
RFIDWide practicability and no need for lightTime consuming, and error prone in the presence of metals and liquids[53,54,55]
UWBReliable signals, longer read ranges, provide 3D position estimateHigh cost and no mini device or daily-necessity-embedded too[56]
Table 2. Construction site states.
StageExample of Construction SiteMain Work Content and
Construction Site States
Recognizable Components and States
Start (Concrete curing) Buildings 12 00106 i001Work: Concrete curing of the last floor
State: The concrete slab is flat, although there are sporadic protruding steel bars.
-
Preparation Buildings 12 00106 i002Work: Molds and materials preparation and formwork removal from the last floor
State: Formwork, steel bars, supports and other tools are piled up on the floor, which makes the construction site chaotic.
Stacked formwork *
Facade construction Buildings 12 00106 i003Work: Steel bar binding and formwork supporting for columns and shear walls
State: The back of the formwork occupies most of the area in the top view, and there are many bars arranged on it, so the construction site is relatively regular.
Walls or columns with formwork
Formwork for plane Buildings 12 00106 i004Work: Formwork for slabs and beams
State: The vertical templates are gradually blocked, leaving neatly arranged flat templates with obvious boundaries.
Slabs with bottom formwork and
Beams enclosed by formwork
Steel bar binding in plane Buildings 12 00106 i005Work: Steel bar binding for slabs
State: There are steel cages on the slab, and the boundaries between the formworks become blurred.
Slabs with steel cages and
Beams with steel cages
Concrete pouring Buildings 12 00106 i006Work: Concrete pouring
State: There are steel cages on the slab. With the pouring of concrete, the steel cages gradually disappear, and the boundaries of the formwork change from fuzzy to clear and then disappear.
Slabs with steel cages and
Beams with steel cages and
Pouring tools *
* To refine the construction progress information, the stacked formwork and pouring tools are identified to assist reasoning.
Table 3. Detection results 1.
StageComponent’s Type# of Comp. in BIM 2# of Comp. in Images# of Detected Comp.# of Correctly Detected Comp.Detection Accuracy 3
PreparationStacked formwork017.7517.7517.75100.00%
Facade constructionWalls or columns with formwork8251.6737.3336.2570.16%
Formwork for planeSlabs with bottom formwork6244.6544.3543.6097.65%
Beams enclosed by formwork11881.5076.7575.6092.76%
Steel bar binding in planeSlabs with steel cages6255.7341.0940.0071.78%
Beams with steel cages118105.9181.0980.7376.22%
Concrete pouringSlabs with steel cages6262.0051.1750.1780.91%
Beams with steel cages118118.00101.80100.4085.08%
Pouring tools01.001.001.00100.00%
1 The average detection time of each image is 65.43 ms. 2 The number of BIM components in one floor. 3 It is the ratio between the “# of correctly detected comp.” and the “# of comp. in images”.
Table 4. Registration results 1.
StageComponent’s Type# of Comp. in Images# of Correctly Detected Comp.# of Registered Comp.# of Correctly Registered Comp.Registration Accuracy 2Progress Collection Ratio 3
Facade constructionWalls or columns with formwork51.67 36.25 32.2532.0088.28%61.94%
Formwork for planeSlabs with bottom formwork44.65 43.60 42.7042.2096.79%94.51%
Beams enclosed by formwork81.50 75.60 71.8071.0593.98%87.18%
Steel bar binding in planeSlabs with steel cages55.73 40.00 38.4538.0095.00%68.19%
Beams with steel cages105.91 80.73 76.5576.0094.14%71.76%
Concrete pouringSlabs with steel cages62.00 50.17 48.6748.3396.35%77.96%
Beams with steel cages118.00 100.40 95.8095.0094.62%80.51%
Pouring tools1.001.00----
1 The average registration time of each image is 50.25 ms. 2 The ratio between the # of correctly registered comp. and the # of correctly detected comp. 3 The ratio between the # of correctly registered comp. and the # of comp. in images.
Table 5. Repeatability and automation of steps in future applications.
StageStepRepeatability and Automation
Target detector trainingImage collection and labelingData can be supplemented, and this step is unnecessary to repeat.
model trainingUnnecessary repetition
Camera calibrationInternal parameter calibrationNeed to be repeated, and calibrated once for each camera
Initial external parameter acquisitionNeed to be repeated, and calibrated once for each scene
External parameter updateNeed to be repeated, and updated through automated iterations
RegistrationProjectionNeed to be repeated, and automated
ScreeningNeed to be repeated, and automated
Rough registrationNeed to be repeated, and automated
Progress reasoningProgress reasoningNeed to be repeated, and automated
Publisher’s Note: MDPI stays neutral with regard to jurisdictional claims in published maps and institutional affiliations.

