Article

A Parallel Dissipation-Free and Dispersion-Optimized Explicit Time-Domain FEM for Large-Scale Room Acoustics Simulation

1
Technical Research Institute, Hazama Ando Corporation, Tsukuba 305-0822, Japan
2
Environmental Acoustics Laboratory, Department of Architecture, Graduate School of Engineering, Kobe University, Kobe 657-8501, Japan
*
Author to whom correspondence should be addressed.
Buildings 2022, 12(2), 105; https://doi.org/10.3390/buildings12020105
Submission received: 1 December 2021 / Revised: 19 January 2022 / Accepted: 19 January 2022 / Published: 23 January 2022

Abstract

:
Wave-based acoustics simulation methods such as finite element method (FEM) are reliable computer simulation tools for predicting acoustics in architectural spaces. Nevertheless, their application to practical room acoustics design is difficult because of their high computational costs. Therefore, we propose herein a parallel wave-based acoustics simulation method using dissipation-free and dispersion-optimized explicit time-domain FEM (TD-FEM) for simulating room acoustics at large-scale scenes. It can model sound absorbers with locally reacting frequency-dependent impedance boundary conditions (BCs). The method can use domain decomposition method (DDM)-based parallel computing to compute acoustics in large rooms at kilohertz frequencies. After validation studies of the proposed method via impedance tube and small cubic room problems including frequency-dependent impedance BCs of two porous type sound absorbers and a Helmholtz type sound absorber, the efficiency of the method against two implicit TD-FEMs was assessed. Faster computations and equivalent accuracy were achieved. Finally, acoustics simulation of an auditorium of 2271 m 3 presenting a problem size of about 150,000,000 degrees of freedom demonstrated the practicality of the DDM-based parallel solver. Using 512 CPU cores on a parallel computer system, the proposed parallel solver can compute impulse responses with 3 s time length, including frequency components up to 3 kHz within 9000 s.

1. Introduction

1.1. Background

Wave-based acoustics simulation methods can model acoustics in architectural spaces [1] such as concert halls and classrooms accurately based on the wave equation or the Helmholtz equation using numerical techniques such as the finite element method (FEM) [2], finite difference method [3,4], and boundary element method [5]. A benefit of wave-based simulations is that they can accurately assess effects of two key technologies of sound absorption and sound scattering for room acoustics control [6]. With sound absorbers and acoustic diffusers, one can design a comfortable indoor sound environment by controlling noise levels and reverberation times according to room use. Consequently, wave-based simulations are reliable prediction tools for room acoustics design. Additionally, such simulations can further accommodate virtual reality (VR) technology. The use of such simulations in VR for engineering [7,8] and entertainment [9,10] is becoming an attractive application in recent years. An attractive feature of VR with wave-based simulations is that spatial sound field reproduction by ambisonics [11,12] with binaural rendering are conducted easily. That is true because expansion coefficients for spherical harmonics are accessed by placement of virtual microphone array [13] or numerical differentiation [14]. Subsequently, decoding and binaural auralization with headphones are accomplished using virtual studio technology plugins such as Resonance Audio [15] and SPARTA [16].
However, the main difficulty in applying wave-based simulations to architectural acoustic simulations is the necessary imposition of expensive computational loads, i.e., colossal memory consumption and long computational times, because architectural spaces have large dimensions compared to the acoustic wavelength at audible frequencies. Wave-based simulations require discretization of spaces with smaller-sized elements than the acoustic wavelength of interest to keep the discretization error, designated as the dispersion error, within an acceptable level. Although continuous progress in computing technology widens the applicable range of wave-based simulations, more efficient wave-based simulation methods able to reduce the dispersion error with smaller computational efforts than existing methods are necessary for application to architectural acoustic design. To this end, many researchers have examined the development of efficient wave-based simulation methods to date. For example, one can find reports of studies using higher-order finite-difference time-domain (FDTD) methods [17,18,19] and higher-order frequency-domain and time-domain FEMs [20,21,22,23,24,25,26]. Among other methods, this study addresses a time-domain FEM having explicit time-marching scheme, with the proposal of efficient acoustic simulation methods for large-scale room acoustics simulations.
Some efficient wave-based room acoustics simulation methods with dispersion-reduced FEMs using low-order finite elements (FEs) in both the frequency domain and time domain have been developed [27,28,29,30,31,32,33,34]. They have been applied respectively to acoustics simulation in a simple-shaped concert hall [31], simulations of reverberation absorption coefficient measurements of sound absorbers with woven and non-woven fabrics [32], and acoustics improvement of an existing meeting room with microperforated panel absorbers [33]. The salient feature of the dispersion-reduced FEMs is that they can maintain dispersion error at a low level with low-order FEs without increasing additional computational costs. The methods are able to do so because of the use of modified integration rule (MIR) [35,36], which uses numerical integration points able to reduce dispersion error for element matrix construction. Consequently, the methods can decrease the total number of degrees of freedom (DOFs) without increasing the matrix’s bandwidth more than higher-order FEM. The computational costs required per element are lower than those of higher-order methods. For development, first, dispersion-reduced implicit time-domain FEM (TD-FEM) [27] and frequency-domain FEM (FD-FEM) [29] have been developed for room acoustics simulation. A dispersion-reduced high-order FD-FEM and TD-FEM using spline FEs have also been proposed in an earlier report of the relevant literature [26]. Subsequently, a dispersion-reduced explicit TD-FEM with fourth-order accuracy in terms of dispersion error was proposed to accelerate a computational speed for acoustic simulations further in architectural spaces discretized only with rectangular FEs [28,30]. Later, by developing a time integration method called the modified Adams method for time discretization [34], the limitation of using rectangular FEs was removed without accuracy reduction caused by dispersion error. However, the explicit TD-FEM with the modified Adams method still has the important shortcoming that includes numerical dissipation error. With the error, sound energy decreases over time despite the use of a lossless wave equation. Although the attenuation level in sound energy can be reduced using a smaller time interval value, the strategy entails increased computational costs.
More recently, a dissipation-free fourth-order accurate explicit TD-FEM for room acoustics simulation [37] has been proposed, which overcomes shortcomings in TD-FEM with the modified Adams method. It achieves a dissipation-free scheme using a newly developed three-step time-integration method based on the general form of linear multi-step time integration method [38]. Furthermore, the dissipation-free explicit TD-FEM can enhance the capability of sound field approximation at higher frequencies using an optimization method with no additional computational costs. In the optimized method, the dispersion errors in axial and diagonal directions are minimized at a specific mesh or element resolution with optimized MIR and weight coefficients in time integration. The basic performance of the dissipation-free and dispersion-optimized explicit TD-FEMs has been examined for simply shaped room acoustics problems with rigid boundaries at wideband frequencies. Those examinations showed outstanding performance against a standard second-order accurate implicit TD-FEM. Nevertheless, the method still lacks implementation of absorbing boundary conditions (BCs) to reflect the effects of sound absorbers such as porous materials. Therefore, its performance for practical room acoustic modeling remains unclear.
The quality of sound absorption modeling is well known to have a strong effect on the resulting accuracy in sound field predictions. Ideally, using an extended-reaction BC ability is desirable to address both frequency dependence and incident-angle dependence in sound absorption characteristics of sound absorbers. Note that uncertainty in input data concerning sound absorption modeling also has a considerable effect on calculation results [39,40]. A local-reaction BC that simplifies the incident-angle dependence is another selection because the computation becomes easier with the surface impedance of sound absorbers than the extended-reaction BCs that require discretization of materials according to corresponding partial differential equations. Although the implementation of frequency-dependence into time-domain methods is difficult because of the inclusion of convolution operation, very recently developed time-domain methods [23,41,42,43,44,45] can specifically address the frequency-dependence in the local-reaction BC and extended-reaction BC efficiently. This report also addresses the implementation of frequency-dependent local-reaction impedance BCs into the dissipation-free and dispersion-optimized explicit TD-FEM using auxiliary differential equations method [46].
Furthermore, the use of parallel computing technology for wave-based room acoustics simulation is a simple choice for extending its applicable range to large architectural spaces at high frequencies. Because cloud-computing environments such as Amazon Web Service [47], Microsoft Azure [48], and Google Cloud [49] are becoming increasingly familiar in recent years, the development of massively parallel solvers is an exciting subject. Some earlier studies have presented excellent parallel performance of parallel wave-based acoustics simulation with a high performance computing (HPC) system having many CPU cores or GPUs [50,51,52,53,54,55]. A marked speeding up of acoustics simulation with a parallel implicit TD-FEM using spline FEs have also been demonstrated for a simply shaped hall with 13,000 m 3 [50] when using an HPC system with 256 cores about ten years ago. Because of this marked performance gain with large-scale parallel computing can also anticipate for a dissipation-free and dispersion-optimized explicit TD-FEM, as a practical demonstration, we will examine the parallel performance for calculating an impulse response in an auditorium model, including frequency-dependent impedance BCs of two porous-type sound absorbers and a Helmholtz-type sound absorber.

1.2. Purpose of This Study

The present study proposes a parallel wave-based room-acoustics simulation method with a dissipation-free and dispersion-optimized explicit TD-FEM, with eventual demonstration of its practicality for acoustics simulation at kilohertz frequency range in a large room. As the salient point of novelty of the present work, we present the completely new simulation method for large-scale room acoustics simulation composed of a time-marching scheme to deal with frequency-dependent impedance BC and a DDM-based parallel computation algorithm. It can predict an impulse response up to three seconds in an auditorium of 2271 m 3 having multiple frequency-dependent impedance BCs within 9000 s using 512 cores. Our study also includes two validation studies that use impedance tube problems and a small cubic room problem with frequency-dependent impedance BCs. For the latter problem, we show the performance of the proposed method over existing TD-FEMs and the efficient numerical setup for the proposed method. Hereinafter, the proposed dissipation-free and dispersion-optimized explicit TD-FEM and the non-optimized fourth-order explicit TD-FEM, i.e., the dissipation-free method only, are abbreviated respectively to the Opt-E TD-FEM and the 4th-E TD-FEM. This paper is organized as follows. Section 2 describes the theory of proposed time-marching scheme with Opt-E and 4th-E TD-FEMs including frequency-dependent impedance BCs. This section also includes, for readers’ convenience, details of theories of other FEM-based room acoustic solvers used herein. Section 3 presents tests of the validity of the proposed methods with the impedance tube problem and cubic room problems. Section 4 examines the efficiency of the proposed method over two existing implicit TD-FEM, including a proposal of the efficient optimization setup for the proposed methods. Section 5 demonstrates the practicality of parallel Opt-E TD-FEM using a hybrid framework with Message Passing Interface (MPI) and OpenMP to large-scale room acoustics simulation with an auditorium model with the volume of 2271 m 3 . Section 6 concludes the paper. All computational codes used in the present study are in-house software written with Fortran 90.
2. Theory

This section presents the theory of proposed room acoustics simulation methods with the dissipation-free and dispersion-optimized explicit TD-FEMs: Opt-E and 4th-E TD-FEMs. For the readers’ convenience, this section also includes brief descriptions of the fundamental theories of FD-FEM and implicit TD-FEM used for subsequent numerical experiments. The end of this section includes presentation of the theoretical dispersion error properties of the proposed Opt-E and 4th-E TD-FEMs compared to two implicit TD-FEMs. The results are expected to be useful for discussion in subsequent numerical experiments.

2.1. Basic Equation and Its Spatial Discretization with Finite Elements

To model acoustic wave propagation in a space Ω enclosed by a boundary Γ , we specifically examine the second-order scalar wave equation expressed as
2 p ( r , t ) t 2 c 0 2 2 p ( r , t ) = ρ 0 c 0 2 q ( r , t ) t δ ( r r s )
with the following three BCs: the rigid BC Γ 0 , the vibration BC Γ V , and the impedance BC Γ Z as
p ( r , t ) n = 0 on Γ 0 ρ 0 v ˙ n ( r , t ) on Γ V 1 c 0 t y n ( r , t τ ) p ˙ ( r , τ ) d τ on Γ Z
Therein, p stands for the sound pressure, q signifies the volume velocity per unit volume, and t denotes the time. Also, 2 is the Laplacian operator. c 0 represents the speed of sound. ρ 0 denotes the density of air. For the analyses described herein, we consistently set c 0 = 343.7 m/s and ρ 0 = 1.205 kg/m 3 . Also, r and r s respectively represent the arbitrary coordinate vector in Ω and the coordinate vector of a point source. The Dirac delta function is δ . In addition, v n represents the vibration velocity. Symbol · is the first-order time derivative. y n stands for the specific acoustic admittance ratio in the time domain. Multiplication of Equation (1) by the arbitrary weight function ϕ f and applying Green’s theorem yields the weak form defined as
Ω ϕ f 2 p ( r , t ) t 2 + c 0 2 ϕ f p ( r , t ) d Ω c 0 2 Γ ϕ f p ( r , t ) n d Γ = ρ 0 c 0 2 Ω ϕ f q ( r , t ) t δ ( r r s ) d Ω
Taking the Galerkin method with three BCs in Equation (2) leads to the second-order ordinary differential equation (ODE) as [45]
M p ¨ + c 0 2 K p + c 0 C ( y ˇ × p ˙ ) = f
where
M = i = 1 N e M e = i = 1 N e Ω e N T N d Ω e
K = i = 1 N e K e = i = 1 N e Ω e N T N d Ω e
C = i = 1 N s C e = i = 1 N s Γ e N T N d Γ e
y ˇ × p ˙ = t y n ( r , t τ ) p ˙ ( r , τ ) d τ
Here, M , K , and C respectively represent the global consistent mass matrix, the global stiffness matrix, and the global dissipation matrix composed with each element matrix M e , K e and C e . Also, N denotes the shape function vector; p and f respectively denote the sound pressure vector and the external force vector. N e represents the number of FE Ω e ; N s is the number of surface elements Γ e . Symbol · · signifies second-order time derivatives. For the analyses described herein, only eight-node hexahedral FEs are used for spatial discretization. Therefore, integrations for element matrix calculations in Equations (5) and (6) are performed with two-point Gauss–Legendre quadrature in each direction as
K e = h = 1 2 i = 1 2 j = 1 2 N ( α k , h , α k , i , α k , j ) T N ( α k , h , α k , i , α k , j ) det ( J )
M e = h = 1 2 i = 1 2 j = 1 2 N ( α m , h , α m , i , α m , j ) T N ( α m , h , α m , i , α m , j ) det ( J )
where α k and α m represent coordinates of integration points in a natural coordinate system for K e and M e . Also, J is the Jacobian matrix. The standard acoustic FEMs in both frequency-domain and time-domain present second-order accuracy in space with conventional integration point coordinates of α k = α m = ± 1 / 3 . However, it can achieve fourth-order accuracy in space using modified coordinates of α k = α m = ± 2 / 3 [27,31,35,36]. Applying the Fourier transformation to Equation (4) with the time factor of exp ( j ω t ) yields the following discretized matrix equation for FD-FEM.
K k 2 M + j k C y n ( ω ) p = f
Therein, k and j respectively denote the wavenumber and the imaginary unit. Furthermore, ω represents the angular frequency and y n ( ω ) denotes the frequency-domain specific acoustic admittance ratio. The FD-FEM can simulate sound fields at a steady state by solving Equation (11) with sparse direct solvers such as PARDISO or Krylov-subspace iterative solvers such as Conjugate Orthogonal Conjugate Gradient (COCG) method [56]. In later numerical experiments Equation (11) are solved using the COCG method with a diagonal scaling preconditioning under the convergence tolerance of 10 6 .

2.2. Incorporation of Frequency-Dependent Absorbing Boundary

For the analyses presented herein, the ADE method [46] is used for dealing with convolution involved with the frequency-dependent impedance boundary Γ Z in Equation (2) efficiently. The ADE method uses the frequency-domain specific acoustic admittance ratio y n ( ω ) , which is approximated to a rational form as
y n ( ω ) y ( ω ) = y + i = 1 n rp A i λ i + j ω + i = 1 n cp ( B i j C i α i j β i + j ω + B i + j C i α i + j β i + j ω )
where n rp and n cp are the numbers of real poles λ i and pairs of complex conjugate poles α i ± j β i . Also, y , A i , B i and C i are real-valued parameters. To perform stable simulations λ i 0 , α i 0 are imposed for causality reasons. Also, Re y ( ω ) 0 at arbitrary ω is imposed for passivity. The use of y ( ω ) approximates the convolution in Equation (4) as
y ˇ p ˙ y p ˙ + i = 1 n rp A i ϕ i + 2 i = 1 n cp ( B i ψ i ( 1 ) + C i ψ i ( 2 ) )
with accumulators ϕ i , ψ i ( 1 ) and ψ i ( 2 ) respectively denoted by the following simultaneous first-order ODEs as
ϕ ˙ i + λ i ϕ i = p ˙
ψ ˙ i ( 1 ) + α i ψ i ( 1 ) + β i ψ i ( 2 ) = p ˙
ψ ˙ i ( 2 ) + α i ψ i ( 2 ) β i ψ i ( 1 ) = 0
This report presents a solution for the ODEs of Equations (14), (15) and (16) above using the Crank–Nicolson method in both implicit and explicit TD-FEMs. As shown in numerical simulations conducted in Section 3, the Crank–Nicolson method has good accuracy and stability in the time-marching calculations for the accumulators. Details of the Crank–Nicolson method implementation are presented in an earlier report of the literature [45]. With the help of ADE method, Equation (4) is transformed into
M p ¨ + c 0 2 K p + c 0 C ( y p ˙ + i = 1 n rp A i ϕ i + 2 i = 1 n cp ( B i ψ i ( 1 ) + C i ψ i ( 2 ) ) ) = f .
The implicit TD-FEM solves Equation (17) with a direct time integration method. In a later numerical experiment, fourth-order accurate Fox–Goodwin method [57] is used for time integration. The stability limit time interval, Δ t limit of the implicit TD-FEM with Fox–Goodwin method depends on the local coordinates of integration points as shown below [27,31].
Δ t limit = h 6 c 0 with α k = α m = ± 1 3
Δ t limit = h 3 c 0 with α k = α m = ± 2 3
In those equations, h denotes the edge size of cubic-shaped FE. Hereinafter, we call the implicit TD-FEM with integration points in Equation (18) 2nd-I TD-FEM, and those with integration points in Equation (19) 4th-I TD-FEM. The 2nd-I TD-FEM has second-order accuracy in space and fourth-order accuracy in time, whereas the 4th-I TD-FEM achieves fourth-order accuracy in both space and time. The two methods have the same dispersion error property with respect to temporal discretization, but the 2nd-I TD-FEM has larger dispersion error than the 4th-I TD-FEM because dispersion error derives from spatial discretization, as shown in Section 2.4. To solve the linear system of equations at each time step, we use an iterative solver, conjugate gradient (CG) method, with a diagonal scaling preconditioning for both implicit TD-FEMs. Its convergence tolerance is set as 10 6 .

2.3. Proposed Dissipation-Free and Dispersion-Optimized Explicit TD-FEMs including Frequency-Dependent Impedance Boundary

2.3.1. Dissipation-Free Time-Stepping Scheme

The explicit TD-FEM solves the following simultaneous first-order ODEs equivalent to the second-order system of Equation (4) [34].
D p ˙ = M v
D v ˙ = f c 0 2 K p c 0 C ( y p ˙ + i = 1 n rp A i ϕ i + 2 i = 1 n cp ( B i ψ i ( 1 ) + C i ψ i ( 2 ) ) )
In those equations, D represents the lumped mass matrix assembled from M using the row-sum method [58]. Additionally, v denotes the auxiliary vector equivalent to the first derivative of p with respect to time. To achieve higher accuracy in time without numerical dissipation, we discretize p ˙ in Equation (20) using the three-step time integration method [37], and v ˙ in Equation (21) using first-order backward difference approximation as
p n = i = 1 3 a i p n i + Δ t D 1 j = 1 3 b j Mv n j
v n = v n 1 + Δ t D 1 f n c 0 2 K p n c 0 C ( y p ˙ + i = 1 n rp A i ϕ i + 2 i = 1 n cp ( B i ψ i ( 1 ) + C i ψ i ( 2 ) ) )
Here, Δ t and n respectively denote the time interval and the time step. Furthermore, a i and b j respectively represent the i-th and j-th real-valued weight coefficients. An inherently dissipation-free scheme is constructed with
a 1 = 2 , a 2 = 2 , a 3 = 1 , b 2 = 1 2 b 1 , b 3 = b 1
Details of the mechanism involved in the elimination of dissipation error are described in an earlier report of the relevant literature [37]. Additionally, p ˙ in Equation (23) is discretized using first-order central difference approximation based on Equation (22) as
p ˙ n = b 1 2 D 1 Mv n + 1 2 D 1 ( b 2 Mv n 1 + b 3 Mv n 2 ) + 1 2 Δ t ( a 1 p n + ( a 2 1 ) p n 1 + a 3 p n 2 )
Substituting Equation (25) into Equation (23) produces the time-marching equation for v as
I + b 1 2 c 0 Δ t y D 1 C D 1 M v n = v n 1 + Δ t D 1 f n c 0 2 K p n c 0 C ( y V n + i = 1 n rp A i ϕ i + 2 i = 1 n cp ( B i ψ i ( 1 ) + C i ψ i ( 2 ) ) )
with
V n = 1 2 D 1 ( b 2 Mv n 1 + b 3 Mv n 2 ) + 1 2 Δ t ( a 1 p n + ( a 2 1 ) p n 1 + a 3 p n 2 )
The dissipation-free time-stepping scheme for explicit TD-FEM is constructed with Equations (22) and (26). Consequently, both the 4th-E TD-FEM and the Opt-E TD-FEM use Equations (22) and (26) with the weight coefficients of Equation (24), but with different integration points of α m and α k and different weight coefficients of b 1 . The 4th-E TD-FEM achieves fourth-order accuracy in space and time using α m = ± 4 / 3 , α k = ± 2 / 3 , and b 1 = 13 / 12 . However, the Opt-E TD-FEM uses theoretically derived optimum integration points and weight coefficient, i.e., α m = ± α m , opt , α k = ± α k , opt and b 1 = b 1 , opt , respectively denoted as [37]
α m , opt = 4 π 2 + R 2 ( cos 2 ( 2 π R ) 1 ) R 2 ( cos ( 2 π R ) 1 ) 2
α k , opt = ( 2 R X 1 + X 2 ) 3 X 3 2 X 4 2 X 5 X 6
with
X 1 = X 3 2 X 4 2 X 6 ( R 2 X 4 2 ( Y 1 Y 2 ) 2 ( X 6 ) + 48 π 2 X 5 )
X 2 = α m 6 X 3 3 X 5 X 7 X 3 ( Y 1 + 1 ) 2 ( 1 + Y 2 ) X 7 + α m 2 ( Y 1 2 1 ) ( 3 + Y 1 Y 2 + 3 Y 1 Y 2 ) X 7 α m 4 X 3 2 X 7 2
X 3 = Y 1 1 , X 4 = 1 + α m 2 + Y 1 α m 2 Y 1 X 5 = Y 2 1 , X 6 = 1 + α m 2 + Y 2 α m 2 Y 2 X 7 = 3 Y 1 Y 2 + 3 Y 1 Y 2
Y 1 = cos π R , Y 2 = cos 2 π R
and
b 1 , opt = 1 2 cos ( ω Δ t ) ω 2 Δ t 2 + 1 4 csc 2 ( ω Δ t 2 )
In the equations presented above, R represents the spatial resolution of used mesh or each FE, which is expressed as the number of elements per wavelength at an arbitrary frequency. Therein α m , opt and α k , opt minimize the dispersion error at arbitrary frequencies under given spatial resolution meshes, respectively, in the axial direction and diagonal direction. In addition, b 1 , opt minimizes the dispersion error in temporal discretization at the frequency of interest. Both 4th-E and Opt-E TD-FEMs have the same computational cost in terms of the required memory and computational complexity. However, as shown in Section 4, the Opt-E TD-FEM can enhance accuracy at higher frequencies compared to 4th-E TD-FEM. The stability conditions for both methods become the same; Δ t limit is given as
Δ t limit = 0.490774 h / c 0

2.3.2. Locally Implicit Strategy

Here, Equation (22) is an explicit equation, but Equation (26) becomes an implicit equation, which requires the solution of linear systems because the consistent mass matrix M of the left-hand side engenders non-diagonal components in the coefficient matrix. The fact vitally reduces the computational efficiency of explicit TD-FEM. However, the non-diagonal components in the coefficient matrix of Equation (26) appear only for row-related nodes on the boundary surfaces. Consequently, the local application of linear equation solver into the boundary part reduces the computational complexity accompanying the solution of linear equations. Using this strategy, the remaining part of the system is calculable explicitly using the following time-marching equation.
v n = v n 1 + Δ t D 1 f n c 0 2 K p n
A report of earlier work [59] described that the locally implicit strategy can make the computational complexity much smaller than that in a case with a fully implicit scheme, but it can do so without reducing accuracy. We apply the locally implicit scheme for both the Opt-E and the 4th-E TD-FEMs. As a solver for local linear equations having an indefinite coefficient matrix, we used the conjugate residual (CR) method [60] without preconditioning. Subsequent numerical experiments reveal that CR shows rapid convergence with a small iteration number of less than ten.

2.4. Theoretical Dispersion Error Property of Proposed Explicit TD-FEMs against Two Implicit TD-FEMs

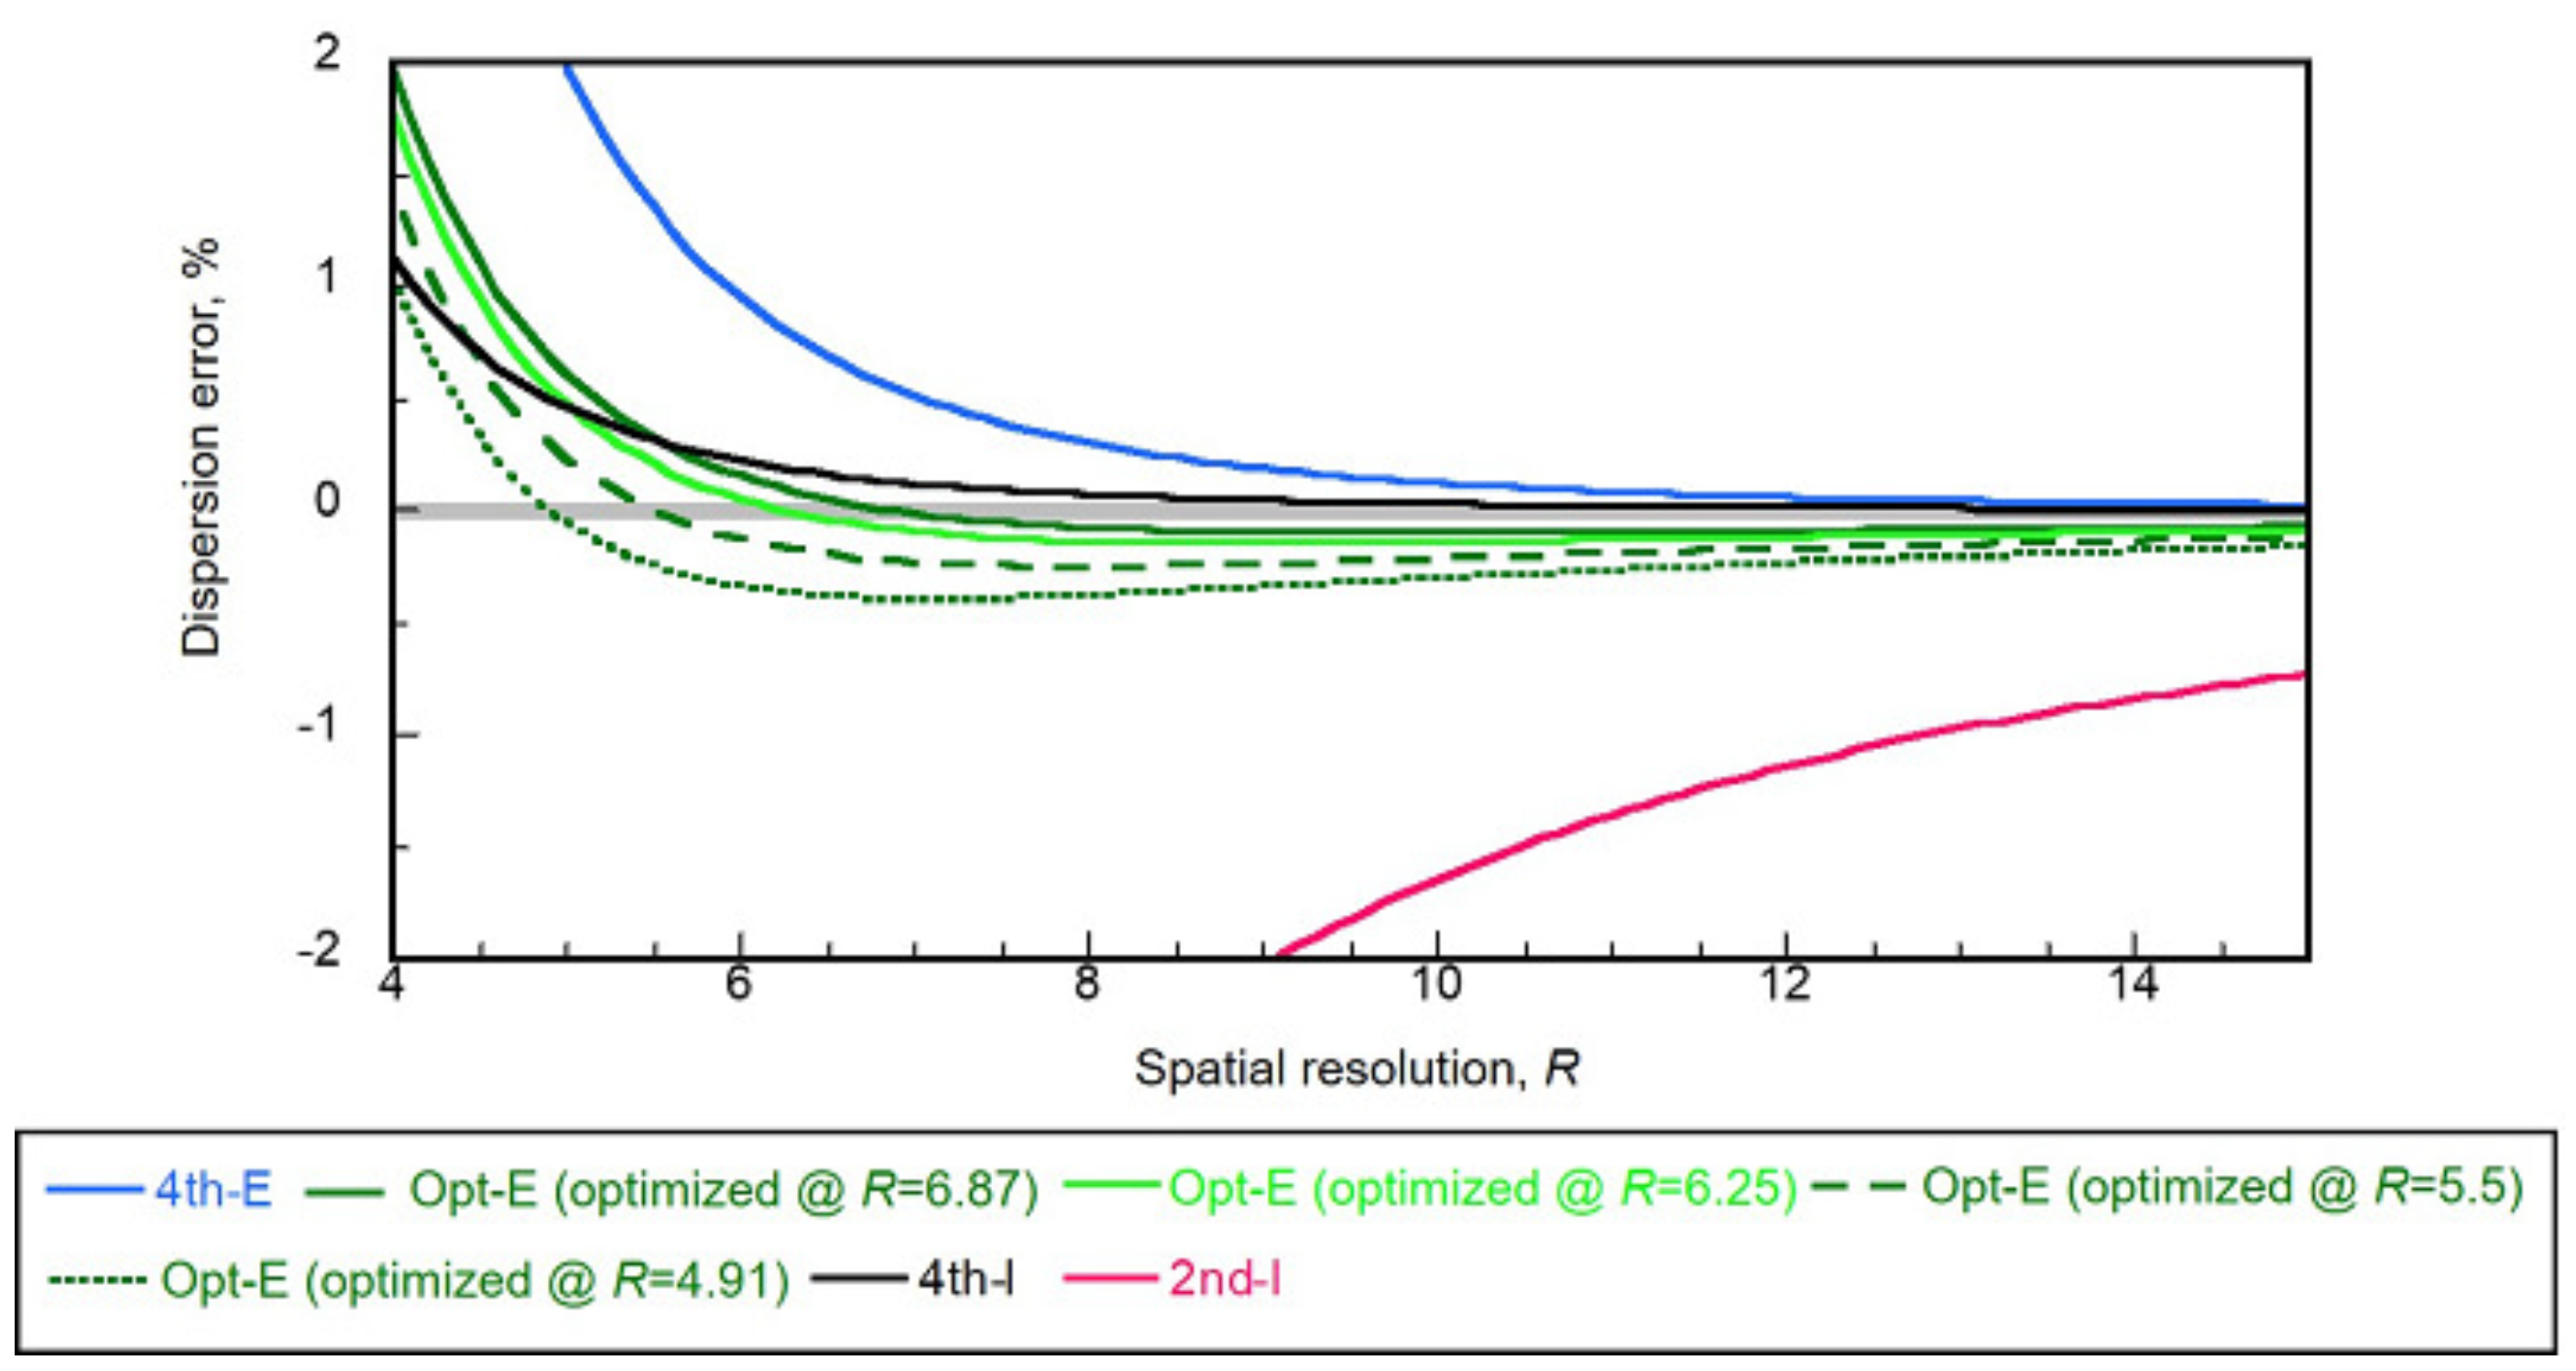
This section presents the theoretically estimated dispersion error property of the 4th-E and Opt-E TD-FEMs compared to those of the 4th-I and 2nd-I TD-FEMs. It is noteworthy that dispersion error estimation is based on an ideal condition that assumes plane wave propagation in free field on a structured mesh discretized using cubic FEs. The theoretical dispersion errors of the 4th-E method and two implicit TD-FEMs are evaluated explicitly with the equations written in [37] and [27], respectively. The dispersion error of Opt-E method can be evaluated numerically according to procedures described in our earlier work [37]. We evaluated the dispersion error of Opt-E method with four optimizing conditions, where each condition minimized the dispersion error at the respective spatial resolutions of R = 6.87, 6.25, 5.5, and 4.91. For all methods, time intervals Δ t were set to their stability limit values. Figure 1 presents dispersion errors of 4th-E and Opt-E TD-FEMs with the four optimized conditions compared to those of 4th-I and 2nd-I TD-FEMs. In the figure, positive error values numerically represent sound speeds lower than c 0 , whereas negative values represent higher sound speeds. Additionally, the illustrated curves show errors in sounds propagating for Cartesian coordinate axes because all methods show maximum dispersion error in those directions.
The standard 2nd-I TD-FEM needs R > 12.8 to maintain dispersion error within 1%. Other methods can suppress dispersion error of less than 1% with much fewer R: the 4th-E method requires R > 5.9 ; the Opt-E method (optimized at R = 6.87 ) requires R > 4.5 ; the Opt-E method (optimized at R = 6.25 ) needs R > 4.4 ; the Opt-E method (optimized at R = 5.5 ) needs R > 4.2 ; the Opt-E method (optimized at R = 4.91 ) needs R > 4.0 ; and the 4th-I method requires R > 4.1 . We also observed that the Opt-E methods took minimum values at intended frequencies for the respective optimizing conditions. Moreover, the Opt-E TD-FEM keeps the dispersion error e dispersion small in a wideband and at a higher frequency than 4th-E method, i.e., e dispersion 0.2 % in R 5.8 (optimized at R = 6.87), e dispersion 0.3 % in R 5.3 (optimized at R = 6.25), e dispersion 0.4 % in R 5 (optimized at R = 5.5), and e dispersion 0.5 % in R 4.4 (optimized at R = 4.91). In addition, the 4th-E method shows slower sound speed, but Opt-E methods show a faster sound speed at a spatial resolution larger than that used for optimization.

3. Validation of the Proposed Explicit TD-FEM with the Impedance Tube Problem and Small Cubic Room Problem

This section presents the validity of the proposed explicit TD-FEM, including frequency-dependent impedance BCs via numerical analyses of an impedance tube and a cubic room. The verification was made by comparison with a theoretical solution in the impedance tube problem and a reference solution accessed by the well-developed FD-FEM with a mesh having sufficient spatial resolution in the cubic room problem. Here, we use only the 4th-E TD-FEM, which is a basis of the Opt-E TD-FEM. The accuracy of Opt-E TD-FEM is examined in the next section. For the validation study, we modeled sound absorption characteristics of three sound absorbers for frequency-dependent impedance boundaries: rigid-backed glass-wool (GW), rigid-backed needle felt (NF), and glass-wool backed microperforated panel (MPP-GW). The acoustical characteristics of two porous absorbers were modeled using an equivalent fluid model with Miki model: GW and NF [61]. Also, GW was assumed to have flow resistivity of 6900 Pa s/m 2 and 50 mm thickness, whereas NF has flow resistivity of 10,000 Pa s/m 2 and 15 mm thickness. The surface impedance Z of each porous absorber was calculated using the transfer matrix method [62]. Additionally, we used Maa’s transfer impedance model [63] for MPP modeling. Then, Z for MPP-GW is also calculated based on the transfer matrix method. For the following experiments, we set the MPP’s parameters as the panel thickness of 0.5 mm, the hole diameter of 0.5 mm, the perforation ratio of 0.55% and the dynamic viscosity of the air of 17.9 μ Pa s.
The surface impedance of each absorber was used to calculate the parameters in the rational function form of Equation (12) using the vector fitting method [64] with passivity enforcement [65] at frequencies of 100 Hz to 5 kHz. The fittings were made respectively with n rp = 3 and n cp = 3 for GW, n rp = 2 and n cp = 2 for NF and n rp = 10 and n cp = 5 for MPP-GW. The complete parameters for rational function forms of each absorber are presented in Appendix A.

3.1. Impedance Tube Problem

This subsection shows the validity of 4th-E TD-FEM with an impedance tube problem. With 4th-E TD-FEM, we computed the normal incidence sound absorption characteristics of three sound absorbers, i.e., absorption coefficient and surface impedance, according to the transfer function method [66]. Then the computed results were compared with the theoretical results calculated using the transfer matrix method. Figure 2 presents the analyzed tube model of 0.5 m length with the cross-sectional area of 0.02 m × 0.02 m. It assigns frequency-dependent impedance BCs at the tube end. For FEM calculation, the tube model was discretized spatially by cubic FEs with edge length of 0.01 m. As an initial condition, the waveform of modulated Gaussian pulse with a peak frequency of 1 kHz was given to the vibration boundary at the tube inlet. The waveform and frequency characteristics of the used Gaussian pulse are presented in Figure 3. The sound pressures at two receiving points (x, y, z) = (0.44, 0.01, 0.01) and (0.45, 0.01, 0.01) were calculated using the 4th-E TD-FEM up to 1.0 s. Then the absorption coefficient and surface impedance of each absorber were computed using the transfer function method. As an accuracy measure for 4th-E TD-FEM, we defined the relative error of surface impedance e Z between the theoretical values and the TD-FEM results as
e Z = 1 N f f = f l f u | Z theory ( f ) Z FEM ( f ) | 2 f = f l f u | Z theory ( f ) | 2
where N f is the total number of frequencies, and f l and f u are respectively the lowest frequency of 100 Hz and the highest frequency of 5 kHz. Z theory ( f ) and Z FEM ( f ) represent the surface impedance at frequency f calculated by the theory and the TD-FEM. Δ t was set to Δ t limit . The convergence tolerance of the CR method was set to 10 6 .
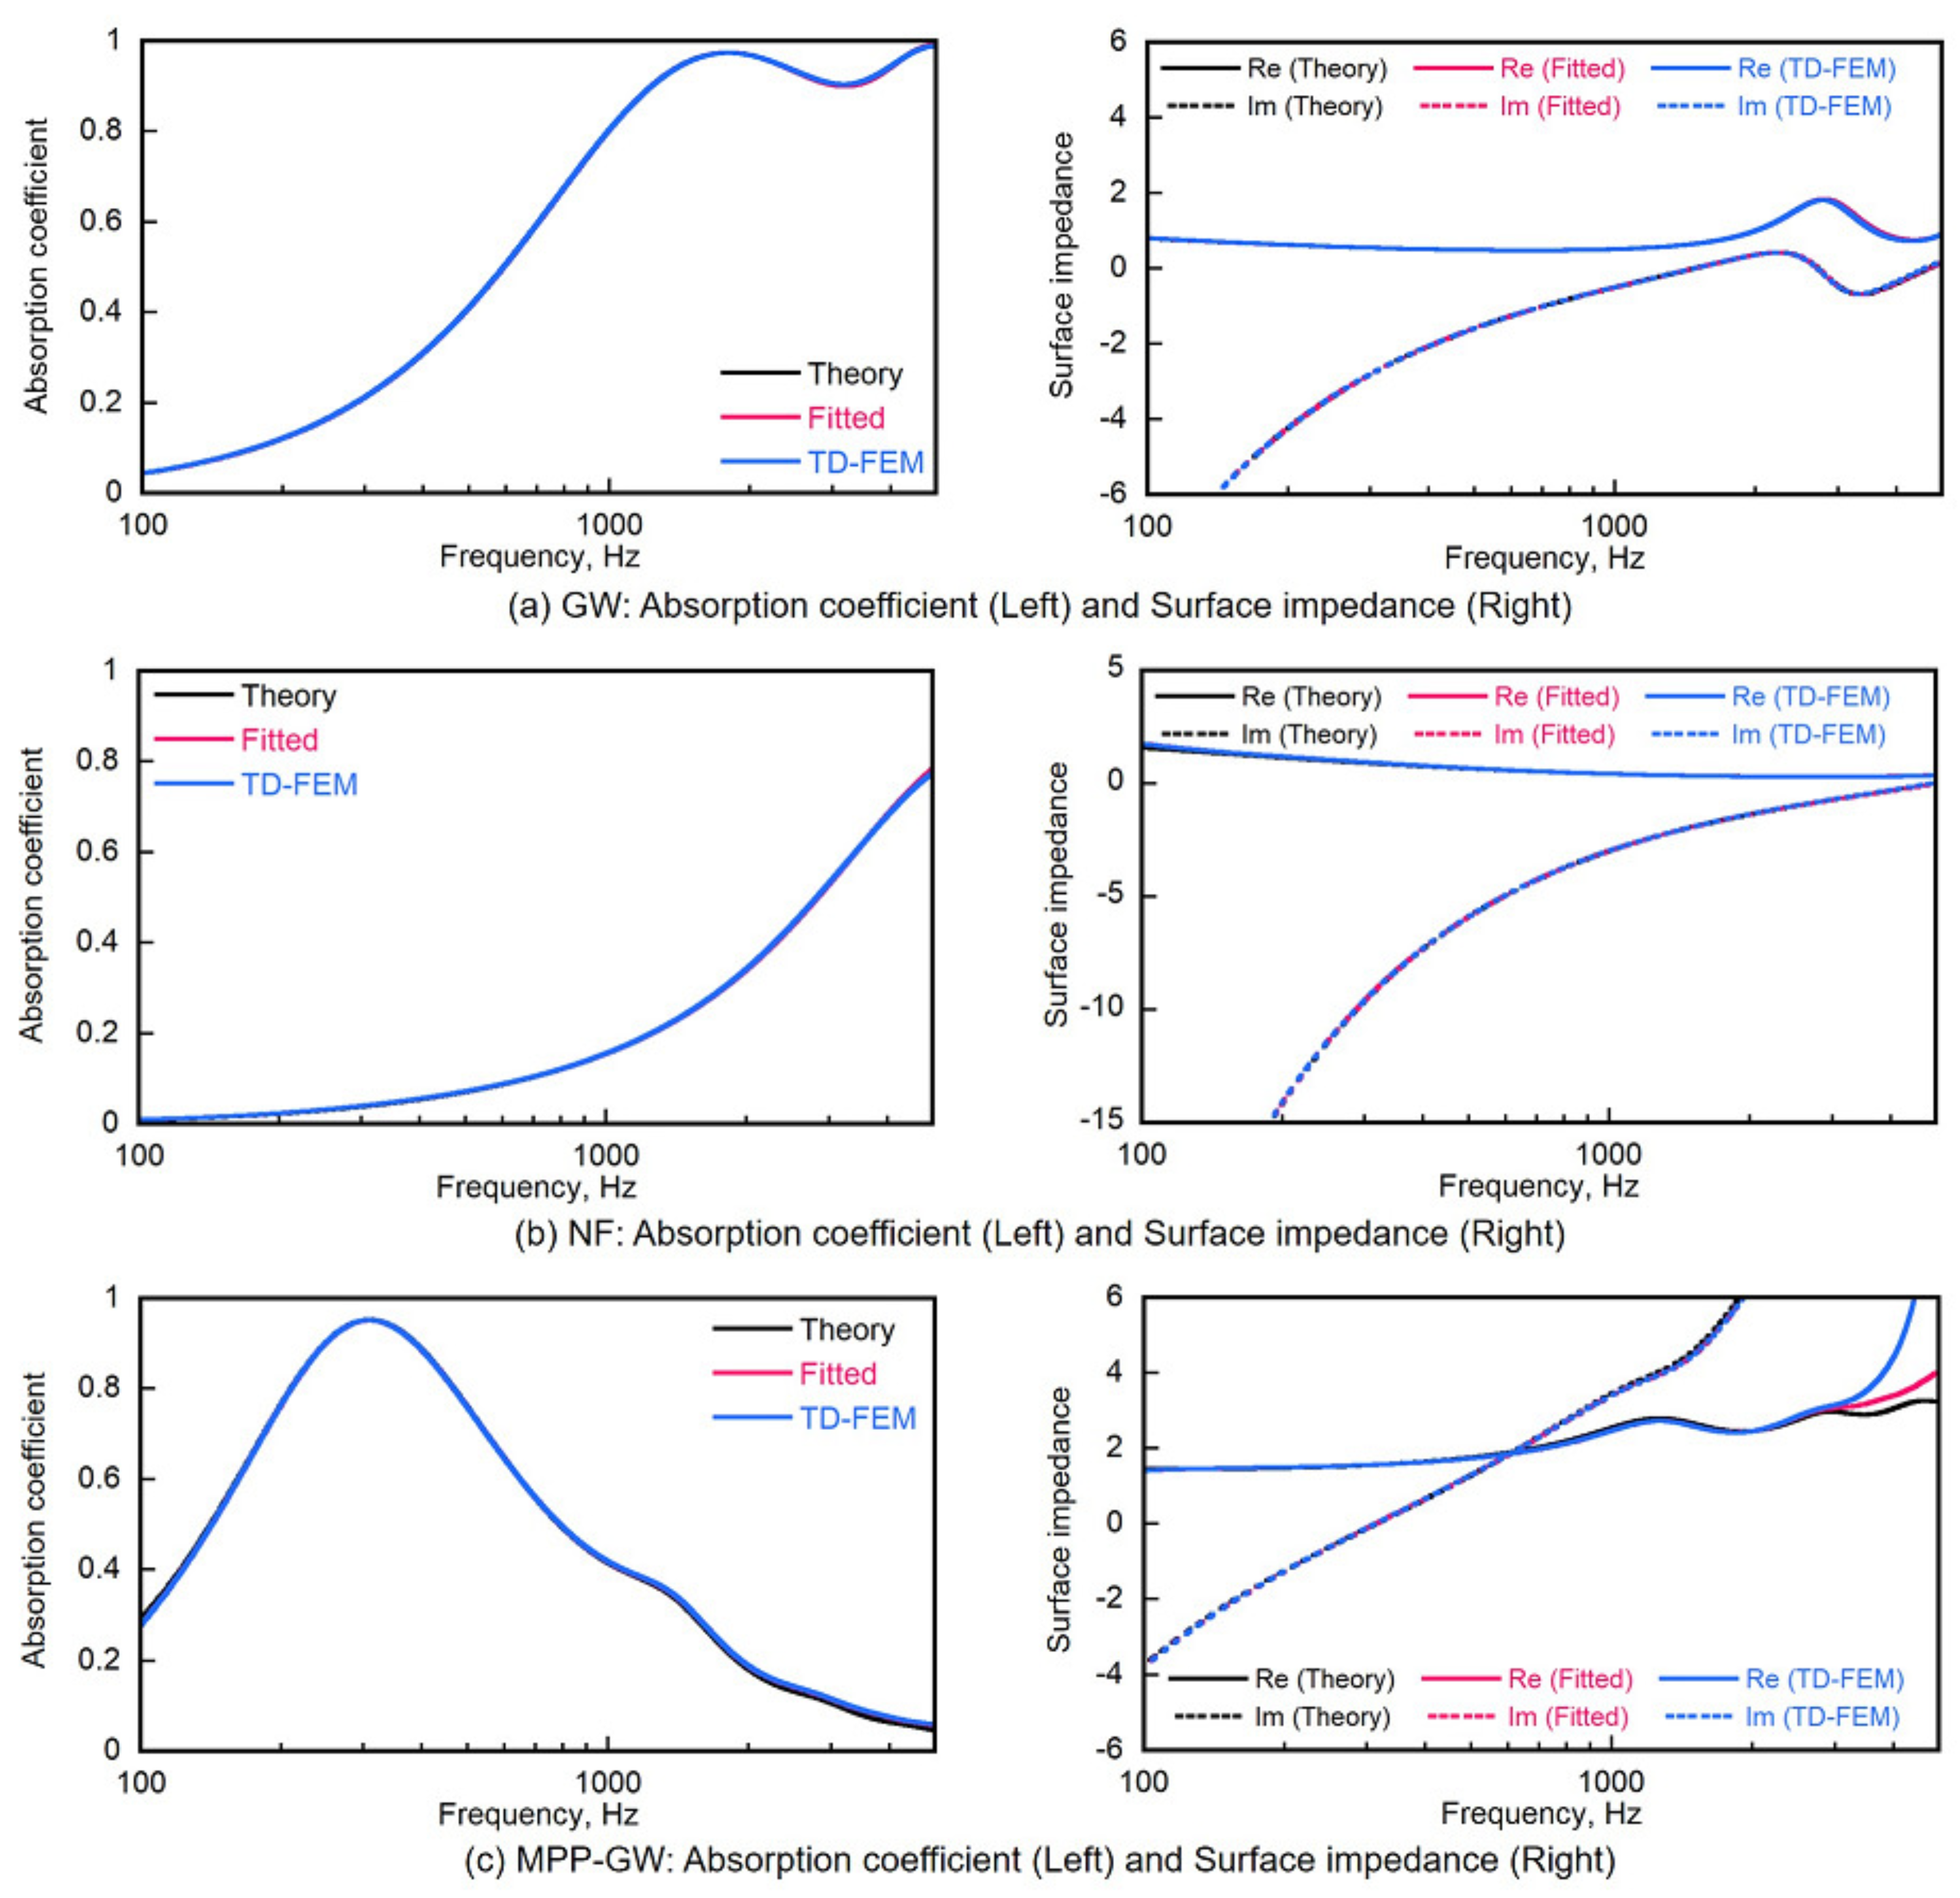
Figure 4a–c respectively present comparisons of normal-incidence absorption coefficient and normalized surface impedance among the theoretical results according to the transfer matrix method, the fitted results by the vector fitting method, and numerical results by the 4th-E TD-FEM for GW, NF, and MPP-GW. For the two porous-type sound absorbers of GW and NF, one can find good agreement at frequencies of 100 Hz to 5 kHz in both the absorption coefficient and surface impedance among the theory, fitted results, and 4th-E TD-FEM. The relative errors e Z s show respectively 0.035% and 0.011% for GW and NF. Those results show the validity of our formulation. We can also see good agreement in the absorption coefficient for the Helmholtz type sound absorber of MPP-GW. However, the impedance results showed that FEM and the fitted results have discrepancies from theory at frequencies higher than 3 kHz. Additionally, the larger relative error e Z of 0.395% than those of GW and NF was observed. Therefore, at this stage, the present formulation still demands improvement for accurate modeling of MPP absorbers at higher frequencies. This is left as a subject for future work.

3.2. Small Cubic Room Problem

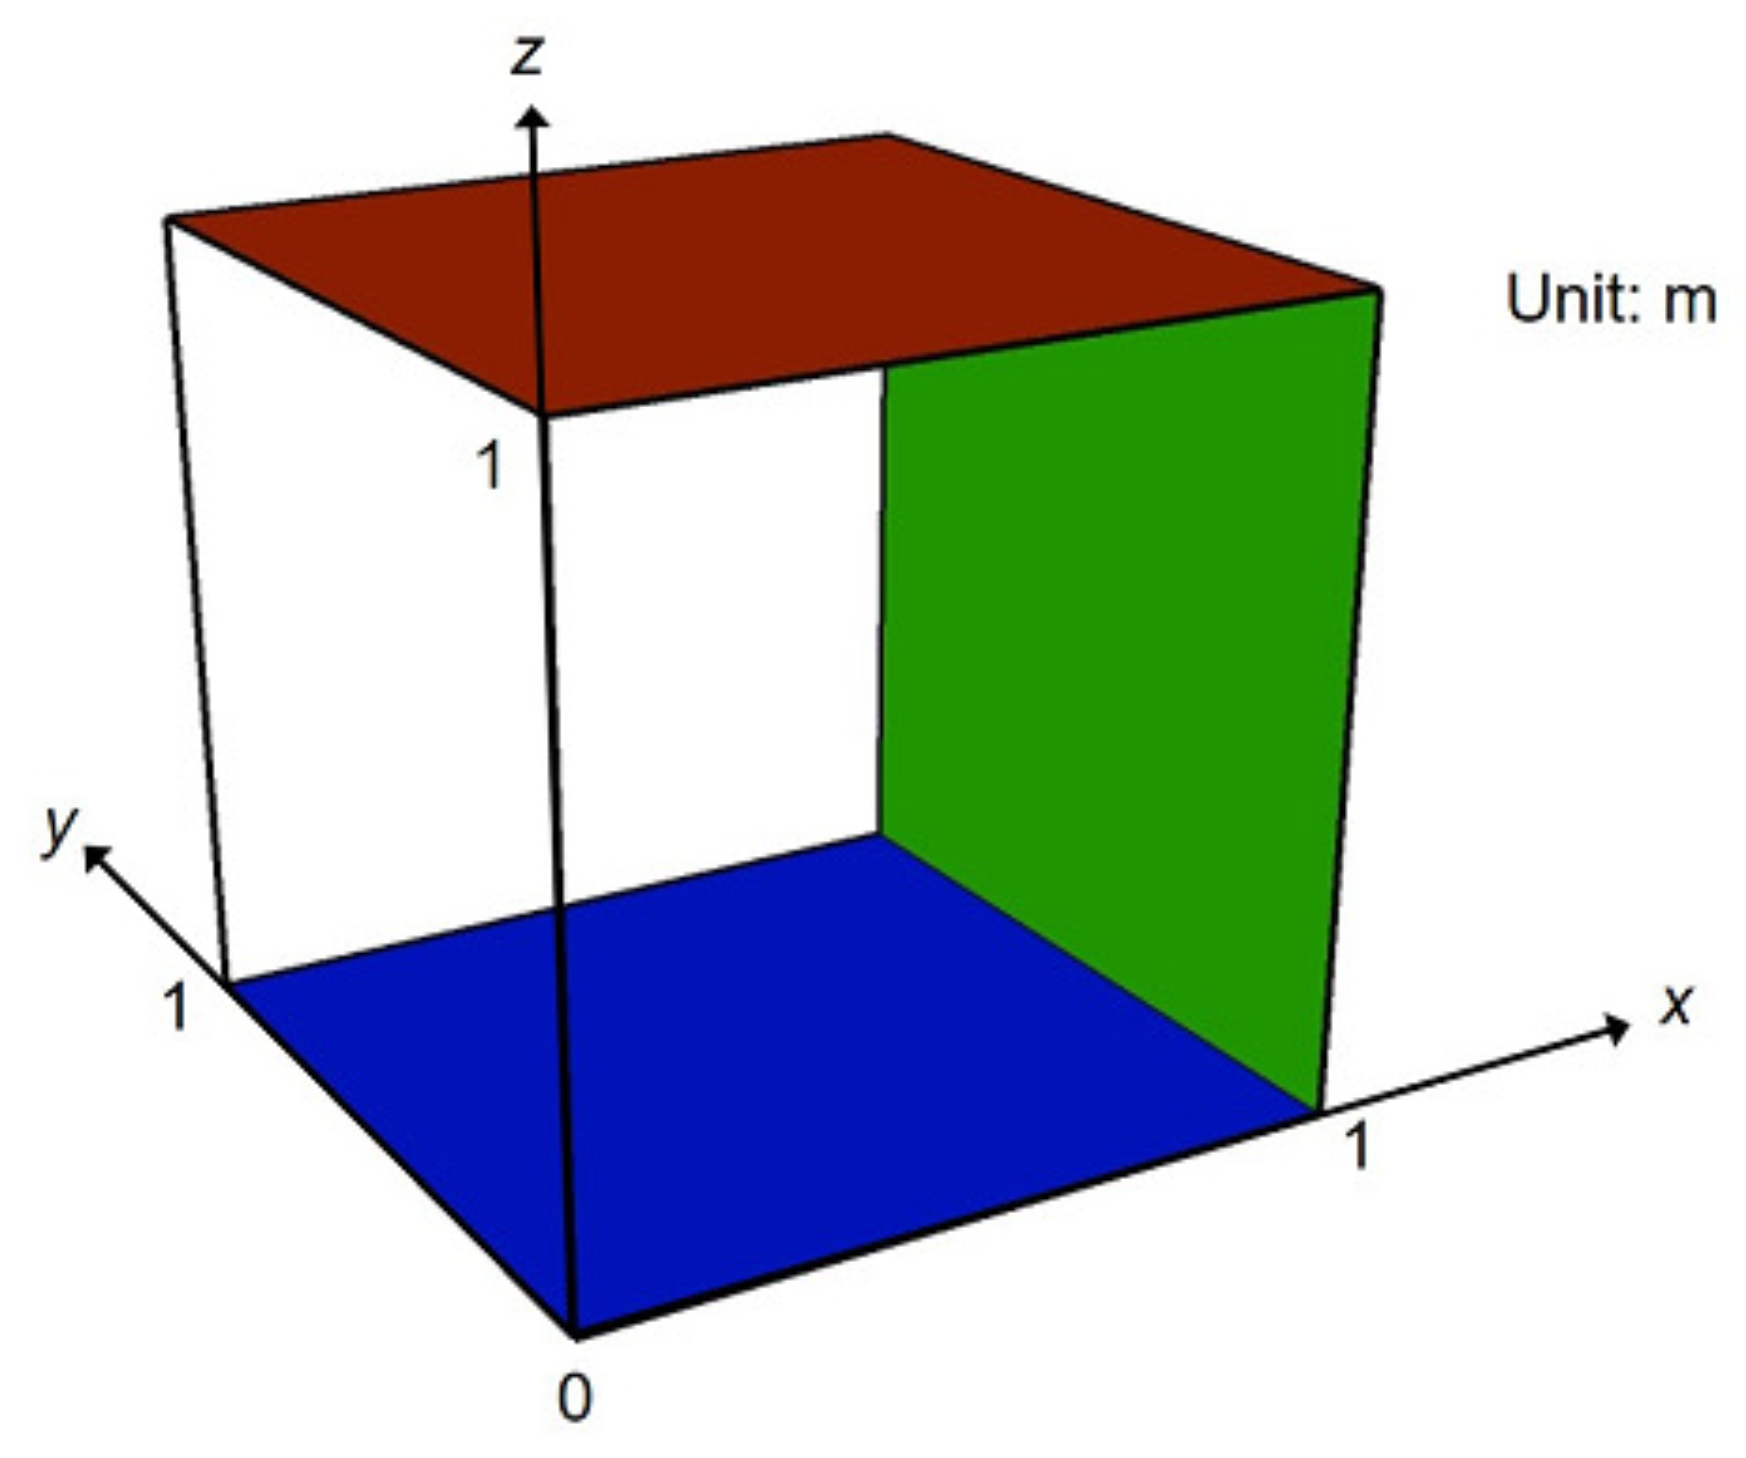
We examine further how accurate 4th-E TD-FEM is compared to FD-FEM. The latter is a standard selection for acoustics simulation because it can precisely reflect the sound absorption characteristics of sound absorbers. A fourth-order accurate FD-FEM [29] is used here to calculate reference solutions. Therefore, this examination can show FD-FEM users the potential of the proposed 4th-E TD-FEM for room acoustics simulation from the perspective of accuracy. Figure 5 shows the small, 1 m 3 cubic room used for examinations. The room is a typical selection to verify the accuracy of wave-based room acoustics simulations. We assumed that the room has two sound-absorber configurations of Case 1 and Case 2, with their respectively different frequency-dependent impedance BCs settings. The sound absorber configuration of Case 1 has a GW ceiling absorber (red surface in Figure 5) with sound absorption characteristics shown in Figure 4a. The remaining boundaries have absorbing surfaces of normal-incidence sound absorption coefficient 0.052, which corresponds to normalized real-valued surface impedance of 74.4. Case 2 also has the GW ceiling absorber, and has NF floor absorber (blue surface in Figure 5) and MPP-GW absorber (green surface in Figure 5). The NF and MPP-GW absorbers have sound absorption characteristics shown in Figure 4b,c. The remaining boundaries are absorbing surfaces of normal-incidence sound absorption coefficient 0.052. A sound source was located at a corner (x, y, z) = (0, 0, 0). We used the same source signal as in Section 3.1 for 4th-E TD-FEM, whereas we used the volume acceleration of 1 m 3 / s 2 for FD-FEM. Sound receivers were placed at six points on a line: y = z = 0.52 with 0.2 m spacing. We calculated time responses up to 1 s at six receivers with a time interval Δ t limit . Frequency responses were also calculated with a 1 Hz interval using FD-FEM. We used cubic FEs with a size of 0.04 m for spatial discretization.
The comparison was made using a mean sound pressure level (SPL) among six receivers at frequencies of 100 Hz to 1.2 kHz. Here, the SPL is a transfer function removing sound source characteristics in time-domain results according to a procedure described in an earlier report [45]. As a quantitative measure, the similarity of frequency responses between the FD-FEM result and the TD-FEM result were evaluated using the cross-correlate coefficient with respect to mean SPL C C L m as
C C L m = f = f l f u L m , FD ( f ) L m , TD ( f ) f = f l f u L m , FD ( f ) 2 f = f l f u L m , TD ( f ) 2
where L m , FD ( f ) and L m , TD ( f ) are respectively mean SPL calculated with the FD-FEM and TD-FEM at frequency f. Here, f l and f u were set to 100 Hz and 1.2 kHz, respectively. Hereafter, the tolerance value for the CR method was set to 10 4 which provided sufficient accuracy while maintaining efficiency. The effects of the tolerance value on the calculation results were examined in Appendix B.
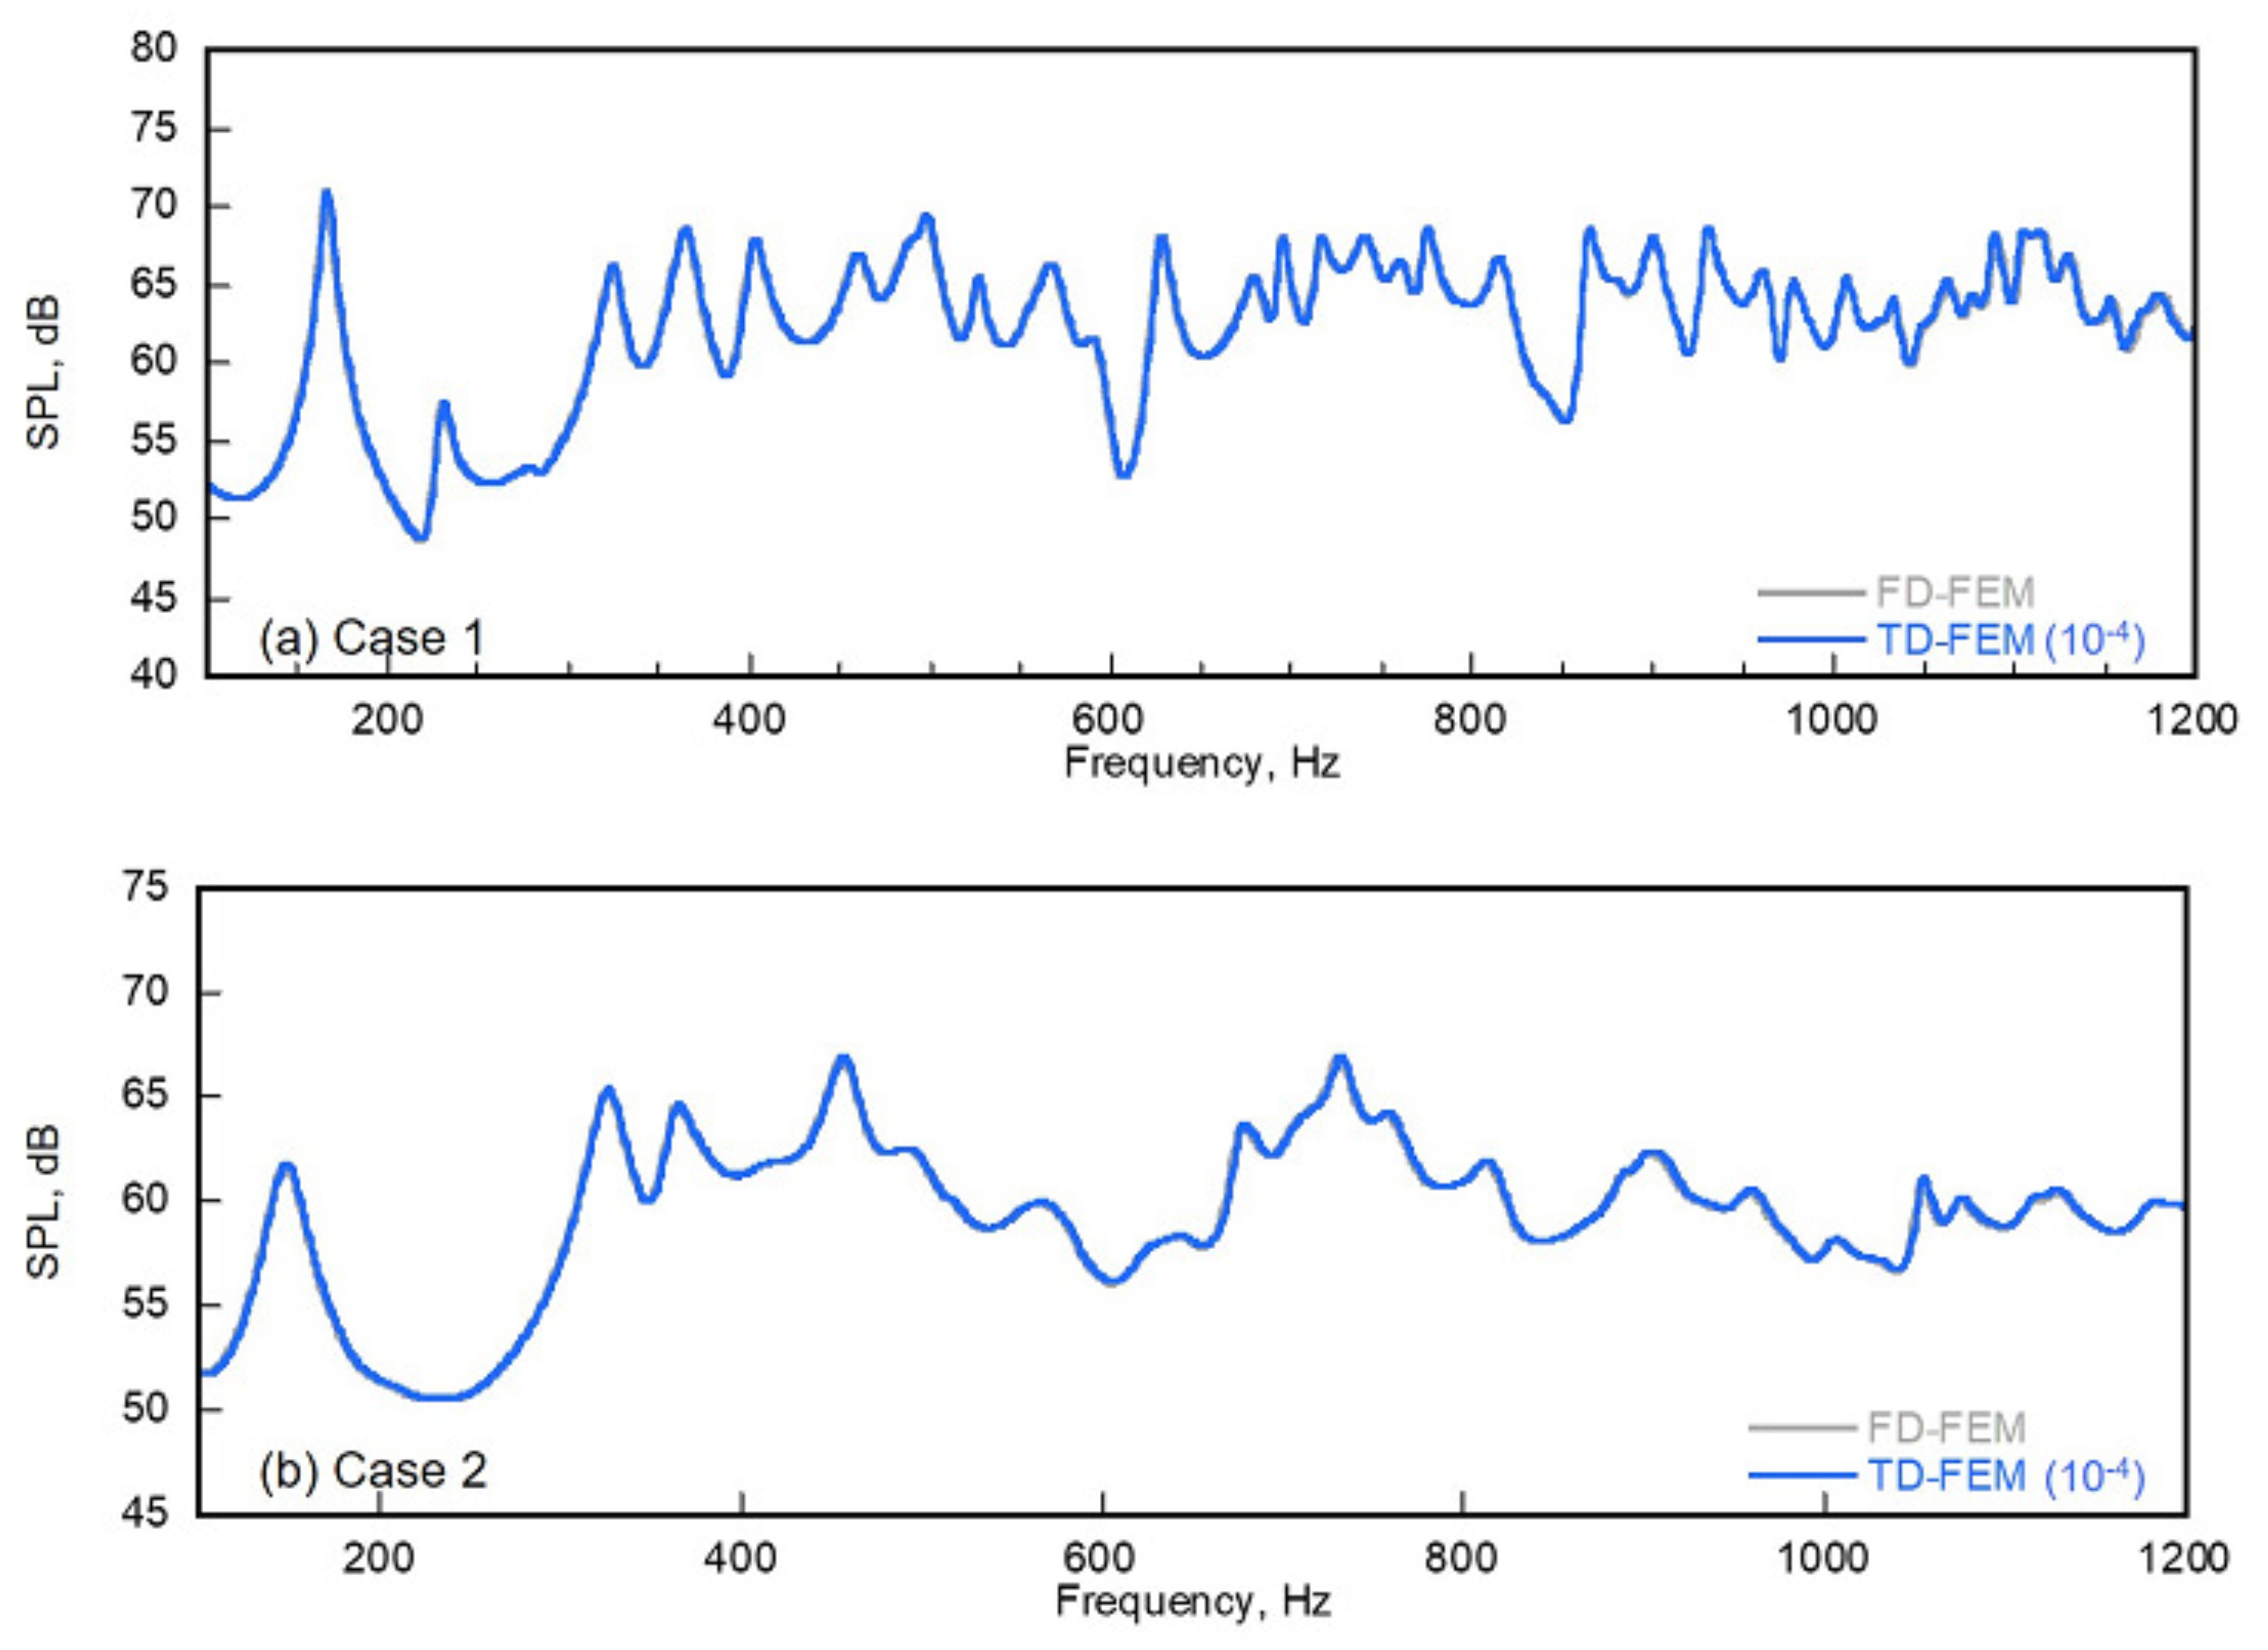
Figure 6a,b respectively depict comparisons of mean SPLs between the FD-FEM and the 4th-E method with convergence tolerance of 10 4 for Case 1 and Case 2. In both cases, the TD-FEM results agree well with the FD-FEM results. The results revealed that the proposed 4th-E TD-FEM can conduct accurate acoustic simulation, including multiple frequency-dependent impedance BCs with a similar degree of accuracy as in FD-FEM in a qualitative sense. As a quantitative sense, the C C L m values for Case 1 and Case 2 were respectively 0.998 and 0.999. In addition, we observed rapid convergence of CR method where numbers of mean iteration per time step were respectively 3.59 for Case 1 and 3.80 for Case 2.

4. Performance Comparison in Broadband Acoustic Modeling with Two Existing Implicit TD-FEMs

The present section presents a discussion of performances of the 4th-E TD-FEM and the Opt-E TD-FEM compared to the two existing implicit TD-FEMs [27,45], i.e., the fourth-order accurate implicit TD-FEM (4th-I) and the standard second-order implicit TD-FEM (2nd-I) in broadband room acoustic modeling. For Opt-E TD-FEM, we use the four optimized settings shown in Section 2.4. We will present a recommended setting for the Opt-E TD-FEM. The performance comparison was produced using the small cubic room problem with the sound absorber configuration of Case 1 used in Section 3.2. However, calculations were made at broad frequencies up to 2.5 kHz. All computations were performed using a workstation (Precision Tower 7810, Intel Xeon E5-2650 v4, 2.2 GHz; Dell Inc., Round Rock, TX, USA) with an Intel Fortran compiler (ver. 2019) and OpenMP parallel computation using eight threads.

4.1. Numerical Configuration

We assessed the performance achieved with three meshes M1, M2, and M3, each discretized with cubic FEs having different spatial resolutions. The coarsest mesh M1 has spatial resolution R of 5.5 elements per wavelength at 2.5 kHz, discretizing elements with edge size of 0.025 m. Mesh M2 has spatial resolution of R = 11 using elements with 0.0125 m edge size. The finest mesh M3 has spatial resolution of R = 20.5 , employing elements with edge size of 0.0067 m. For performance examination, we use only the coarsest mesh M1 for 4th-E TD-FEM, Opt-E TD-FEM, and 4th-I TD-FEM because they are dispersion-reduced schemes that can accommodate larger elements than the standard 2nd-I TD-FEM. For standard 2nd-I TD-FEM, we use mesh M2, which satisfies a well-known rule of thumb for linear elements, i.e., at least ten elements per wavelength [67]. The finest M3 was used for computing the reference solution with 4th-I TD-FEM. The earlier report [45] describes that the 4th-I method can provide more accurate results than the fourth-order accurate FD-FEM with the same FE mesh in room acoustic modeling including the frequency-dependent impedance boundary. The presented scenario exhibits two aspects of the proposed methods: (1) how the 4th-E and Opt-E TD-FEMs perform well with the coarsest mesh compared to the standard 2nd-I TD-FEM, and (2) how the 4th-E and Opt-E TD-FEMs perform compared to 4th-I TD-FEM under the condition using the same coarsest mesh. Each method uses the stability-limit time interval Δ t limit . Four optimization conditions are assumed for Opt-E TD-FEM, respectively minimizing the dispersion error at R = 6.87 (2 kHz), R = 6.25 (2.2 kHz), R = 5.5 (2.5 kHz), and R = 4.91 (2.8 kHz). The source point was set as (x, y, z) = (0, 0, 0). The six receivers were located on the line: y = z = 0.5 with 0.2 m spacing. Each method calculated time responses up to 1 s using the source signal presented in Figure 3.

4.2. Measures of Accuracy

To quantify accuracy, we used the following measures. The first measure is cross-correlation coefficient C C , which evaluates similarity to the reference solution, defined as
C C = f = f l f u L ref ( f , r i ) L FEM ( f , r i ) f = f l f u L ref ( f , r i ) 2 f = f l f u L FEM ( f , r i ) 2
Therein, L ref ( f , r i ) and L FEM ( f , r i ) are SPLs at frequency f on the receiver position of r i for the reference solution and TD-FEM results. They were calculated via discrete Fourier transformation to the resulting time responses. Here, the SPLs are transfer functions as used in the preceding section. Furthermore, f l and f u were respectively set to 100 Hz and 2.5 kHz. In an earlier study [45], C C was used for time responses, but the present study applied C C to frequency responses to evaluate similarity with respect to excitation with a flat spectrum.
We also defined accuracy measures using room acoustics parameters from practical aspects of architectural acoustics. Two room acoustics parameters were selected: early decay time ( E D T ) and C 50 . They are, respectively, evaluated for perceived reverberance and clarity in speech. For the respective room acoustic parameters, we defined the following two error measures e EDT and e C as
e EDT ( f c ) = 1 N r i = 1 N r | E D T ref ( f c , r i ) E D T FEM ( f c , r i ) | E D T ref ( f c , r i ) × 100 ( % )
e C ( f c ) = 1 N r i = 1 N r | C ref ( f c , r i ) C FEM ( f c , r i ) | ( dB )
Therein, E D T ref ( f c , r i ) and E D T FEM ( f c , r i ) respectively denote E D T at 1/3 octave band center frequency f c at a receiver position r i for the reference solution and TD-FEM results. Also, C ref ( f c , r i ) and C FEM ( f c , r i ) represent those for C 50 . Those parameters were calculated from the simulated impulse responses using ITA toolbox [68]. The reason for E D T use instead of the reverberation time (RT) such as a T 20 is that the energy decay curve shows nonlinear decay with the unevenly distributed absorber placement [69].

4.3. Results and Discussion

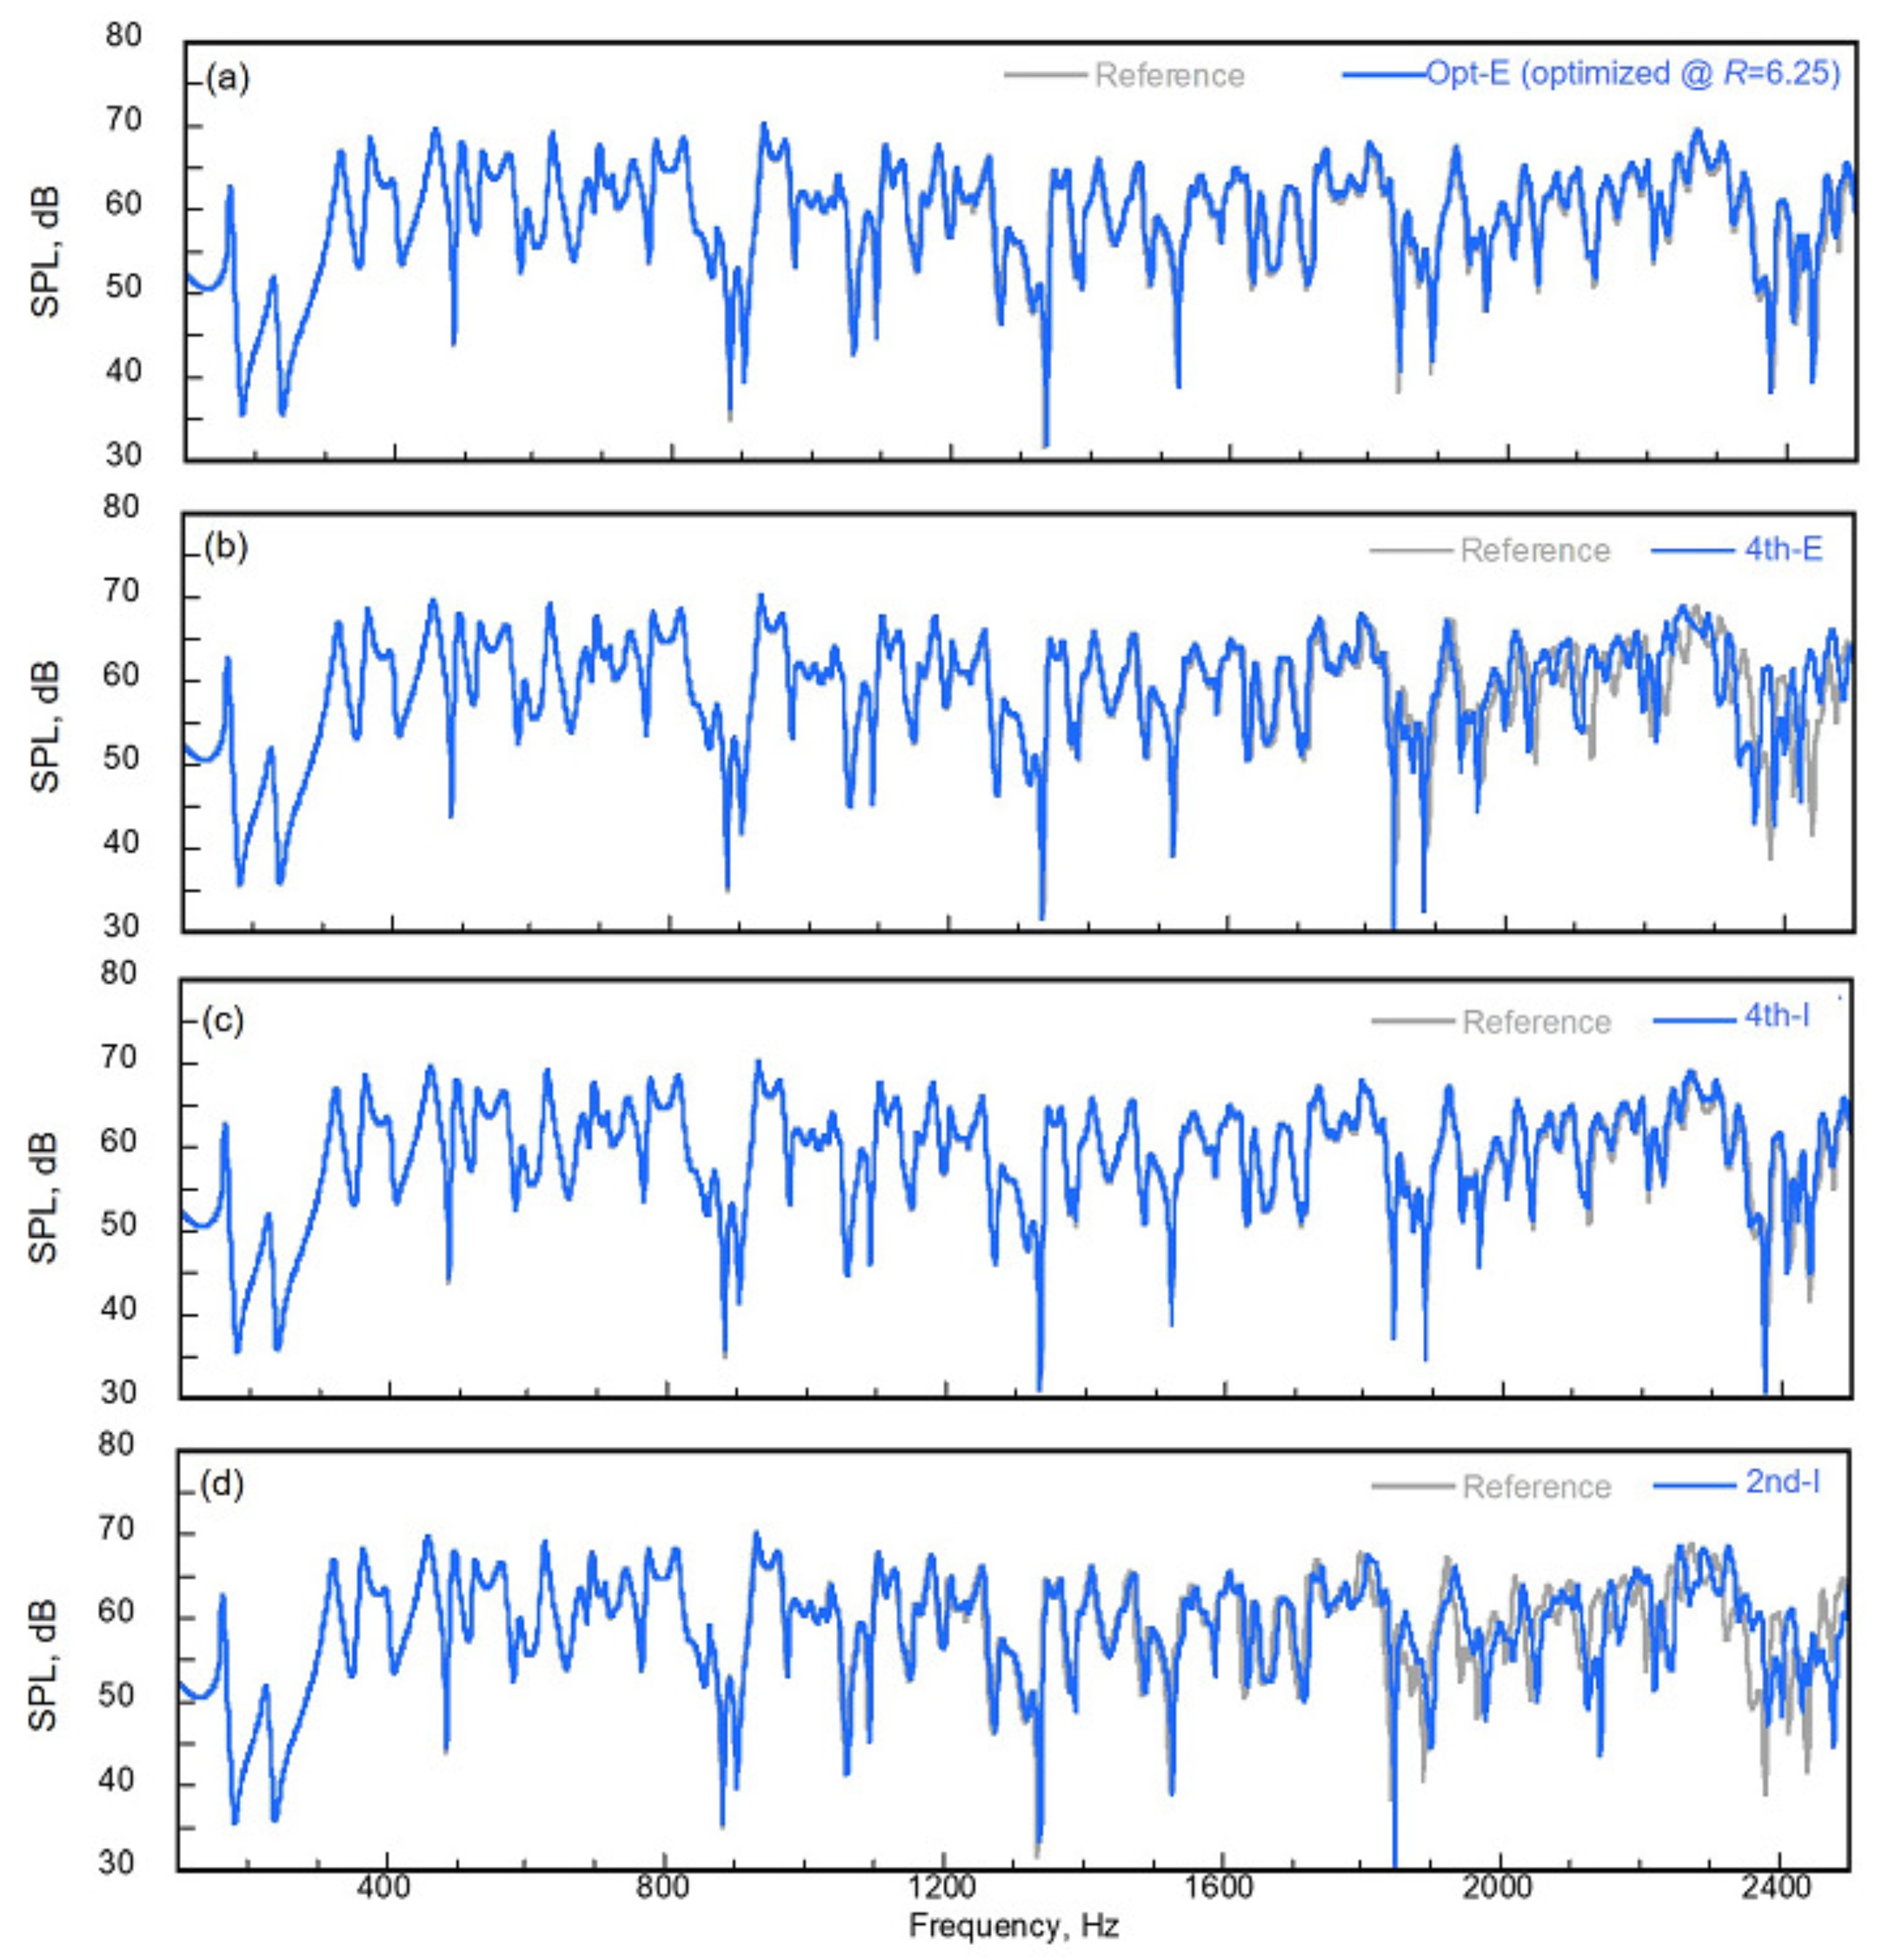
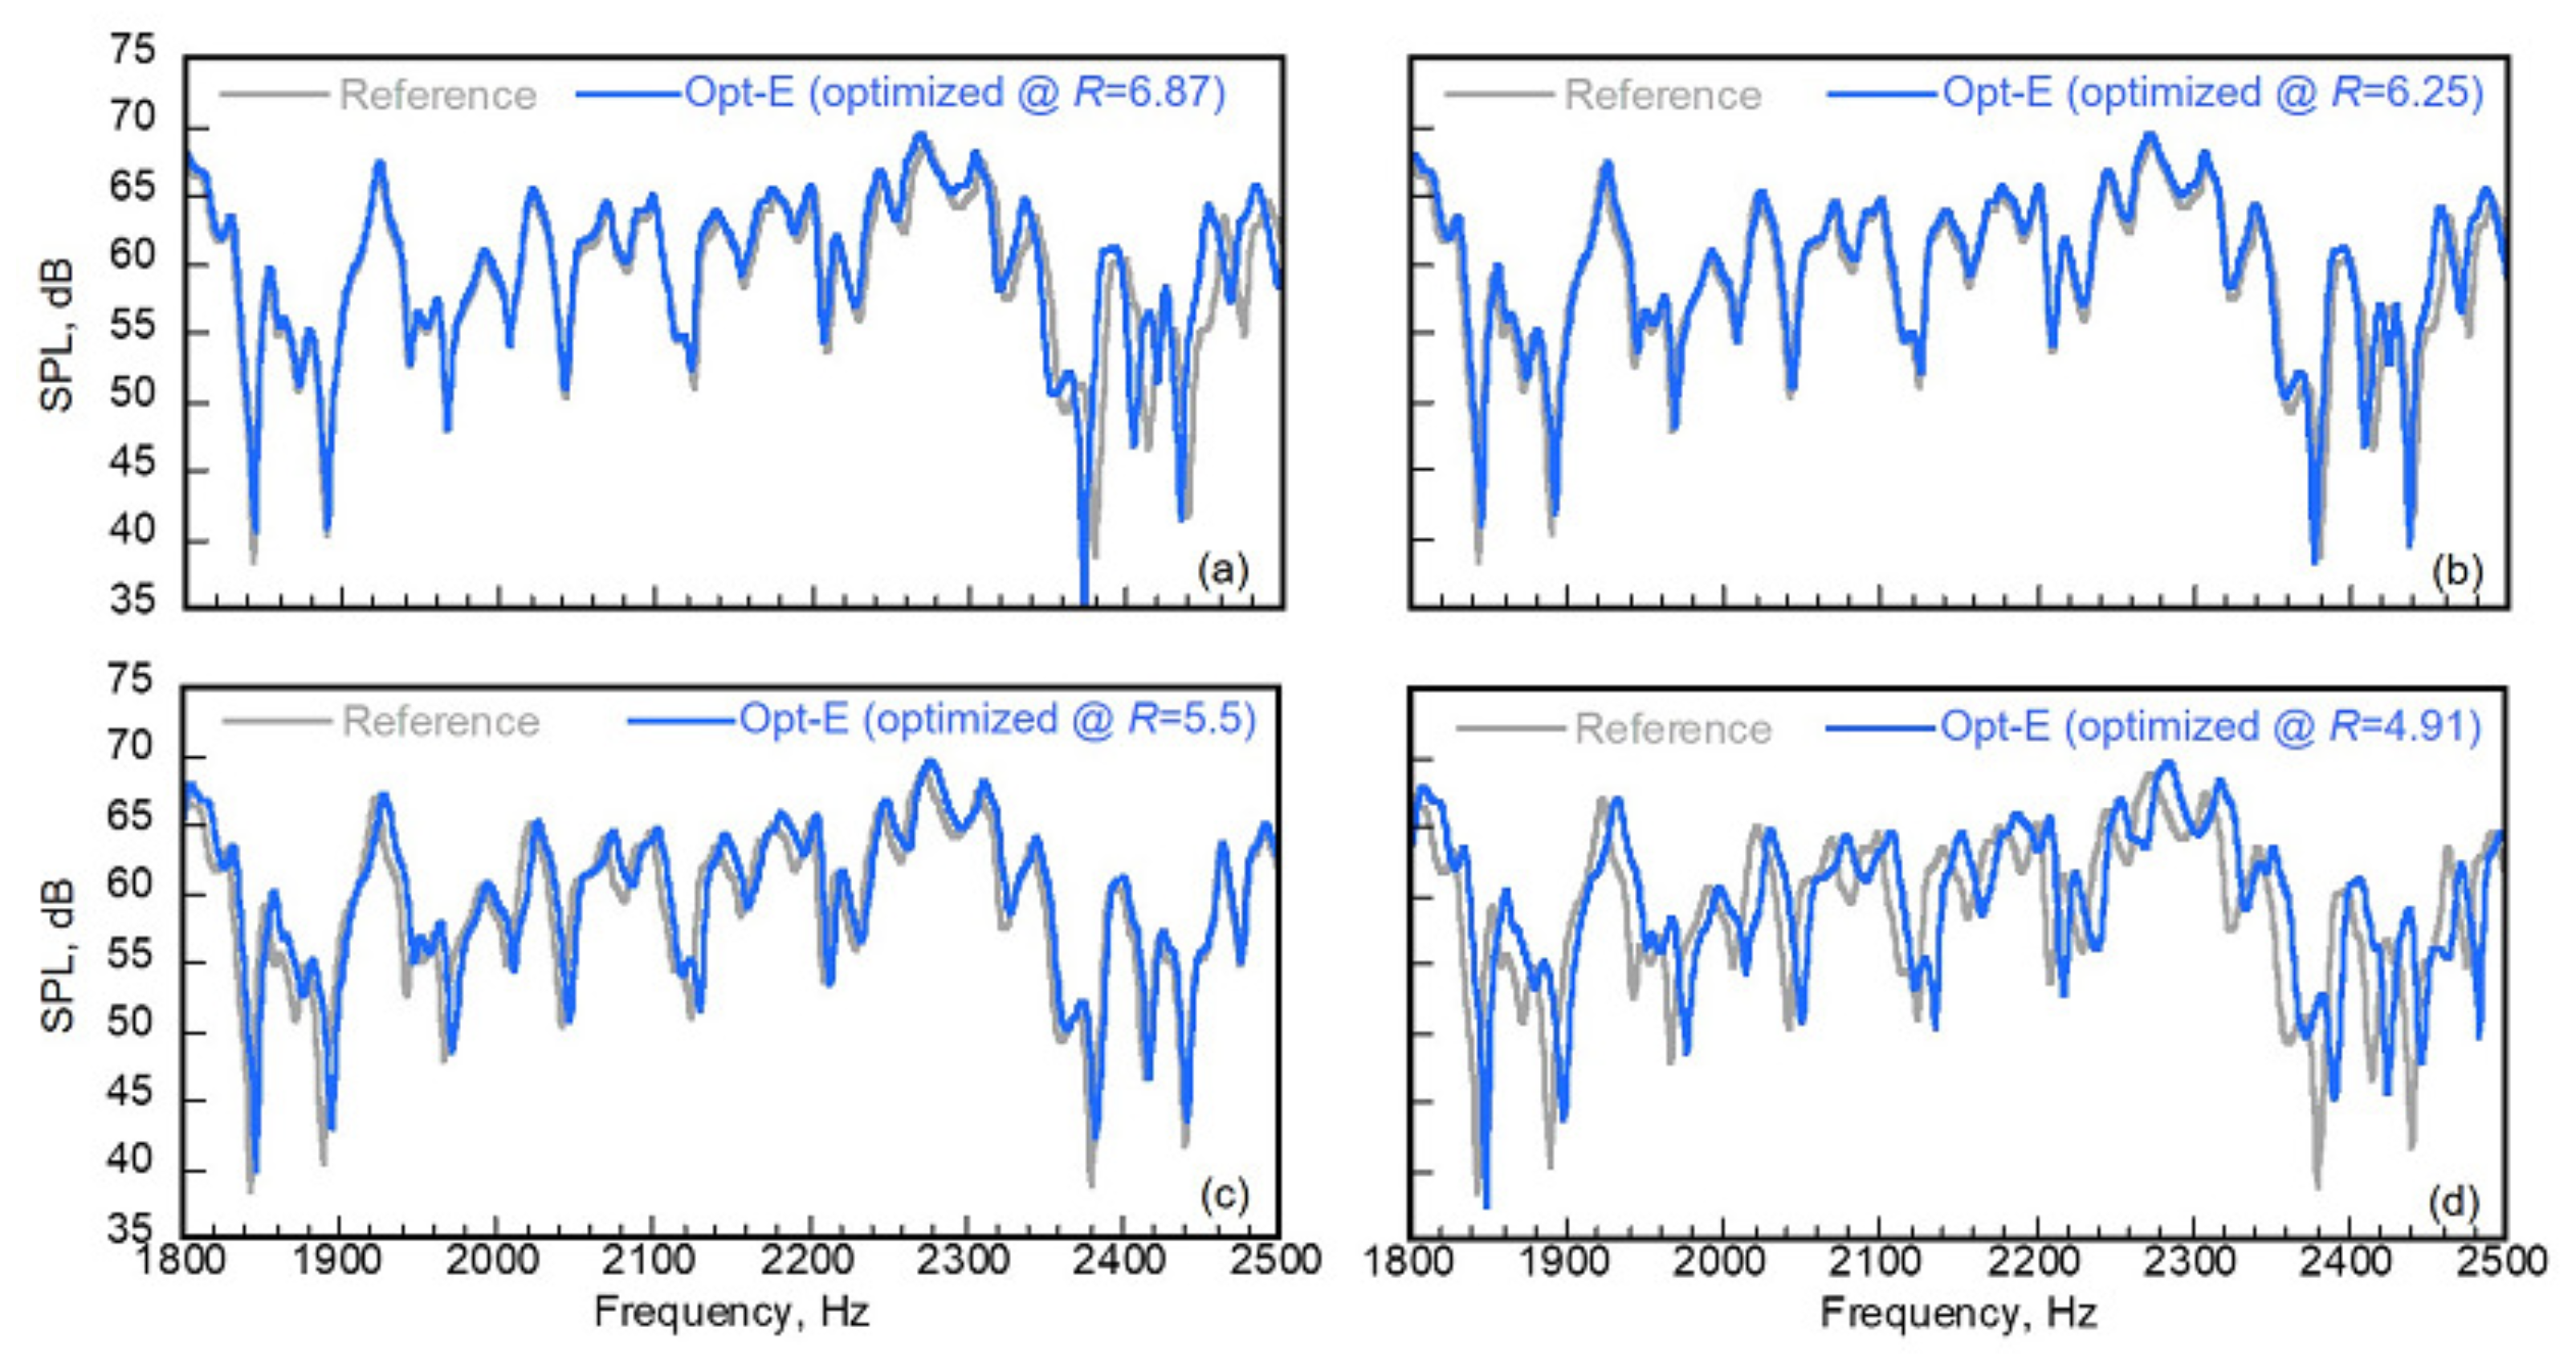
First, we undertake comparisons of the SPL spectra at a receiver (x, y, z) = (0.6, 0.5, 0.5) among the reference solution, the Opt-E TD-FEM (optimized at R = 6.25), the 4th-E TD-FEM, 4th-I TD-FEM, and 2nd-I TD-FEM in Figure 7. The Opt-E method and 4th-I method show much better agreement with the reference solution in broadband than either the 4th-E method or the 2nd-I method. The 4th-E method shows discrepancies from the reference solution at frequencies higher than 2.1 kHz, where frequencies at which peaks and dips occur with shift to the lower frequency. The 2nd-I method using a finer mesh M2 shows the greatest discrepancies above 1.9 kHz and for frequencies at which peaks and dips shift to higher frequencies. These error characteristics of the 4th-E method and 2nd-I method are explainable by the theoretical dispersion error properties presented in Section 2.4, i.e., the dispersion error property of slower sound speed, as in the 4th-E method, engenders frequencies at which peaks and dips create a shift to a lower frequency than the reference solution. In comparison, the dispersion error property of faster sound speed, as in the 2nd-I method, produces the frequency shift to a higher frequency. Additionally, the much better accuracy of Opt-E and 4th-I TD-FEMs is explainable by their theoretical dispersion error properties presented in Figure 1, where these methods have theoretically much lower dispersion error than the 4th-E and 2nd-I TD-FEMs. Then, we show how the four optimizations work in the Opt-E TD-FEM. Figure 8 presents comparisons of SPLs above 1.8 kHz among the reference solution and the Opt-E TD-FEMs using the four optimizations. One can observe that each Opt-E TD-FEM shows excellent agreement around each optimized frequency: 2 kHz for R = 6.87, 2.2 kHz for R = 6.25, 2.5 kHz for R = 5.5, and 2.8 kHz for R = 4.91. In addition, at a frequency higher than the optimized frequency, frequencies at which peaks and dips occur with a shift to higher frequencies than the reference solution for all Opt-E methods. This error behavior can be explained by their theoretical dispersion error properties shown in Figure 1. One can suggest further that the optimization at too small R is ineffective, as might be apparent in the results for which R = 4.91.
Table 1 shows the spatially averaged C C values obtained using the respective methods. The 4th-I TD-FEM shows the highest CC value of 0.964. Three Opt-E TD-FEMs with R = 6.874, 6.25, and 5.5 are all high CC values larger than 0.91. As one might expect from the SPL comparison presented in Figure 7 above, Opt-E TD-FEM with R = 6.25 shows a comparable result to that obtained with 4th-I TD-FEM. Although Opt-E TD-FEM with R = 4.91 shows a slightly lower CC value than those for the other three Opt-E TD-FEMs, as expected from Figure 8, the value is still higher than the standard 2nd-I TD-FEM, which uses a resolution mesh that is two times higher. The 4th-E TD-FEM has a slightly higher CC value than the Opt-E TD-FEM with R = 4.91.
Table 2 and Table 3 respectively present comparisons of e EDT and e C among the 4th-E TD-FEM, the Opt-E TD-FEMs with four optimized settings, 4th-I TD-FEM, and the 2nd-I TD-FEM. Herein, the results below 1 kHz were omitted because the error magnitude was smaller than the JND values for E D T [70] and C 50 [71], i.e., 5% for E D T and 1.1 dB for C 50 . Only the two Opt-E TD-FEMs optimized at R = 6.25 and R = 5.5 produce smaller errors than JND values for both room acoustic parameters at all frequencies. It is particularly interesting that the two Opt-E TD-FEMs have higher accuracy at 2.5 kHz than the 4th-I TD-FEM. Considering the error estimations in the frequency and time domains, we recommend using the Opt-E TD-FEM optimized at R = 6.25 for room acoustic simulation at broadband.
As the end of this section, the computational costs among all TD-FEMs tested here are compared. It is noteworthy that the required memories for 4th-E and Opt-E TD-FEMs are equivalent, and that the computational complexities of both methods are also comparable because the mean iteration numbers of the CR method become almost identical to those shown in Table 4. Consequently, the computational costs of 4th-E and Opt-E TD-FEMs are presented as equivalent. The 4th-E and Opt-E TD-FEMs require 49.6 MBytes, which is slightly larger than 46.6 MBytes of 4th-I TD-FEM and which is 1/7.3 less than 359.0 MBytes of 2nd-I TD-FEMs. By contrast, 4th-E and Opt-E TD-FEMs present computational times of 82.1 s, which are respectively 1.4 times faster and 76.4 times faster than 116.9 s for the 4th-I method and 6272.2 s for the 2nd-I method. This computational cost comparison and the error estimation results described above suggest that the proposed Opt-E TD-FEM is a faster room acoustics solver than the existing two implicit TD-FEM solvers, while matching their accuracy.

5. Large-Scale Acoustics Simulation in an Auditorium Using a Highly Parallel Wave-Based Solver

This section presents a highly parallel Opt-E TD-FEM using the domain decomposition method for large-scale room acoustics simulation. Its applicability is demonstrated for an impulse response calculation in an auditorium model of 2271 m 3 , including approximate frequency components up to 3 kHz. Auditoriums are classical architectural spaces with large dimensions that need appropriate acoustical consideration for speech clarity. We selected this architectural space for the demonstration purpose of the proposed method because its acoustics simulation with the wave-based acoustics simulation methods is a challenging task due to the requirement of high computational cost. We use a supercomputer system consisting of 2000 nodes at Kyushu University: ITO, Subsystem A, Fujitsu Primergy CX2550/CX2560M4. Each node has two Intel Xeon Gold 6154 (3.0 GHz) with 18 cores. Also, Intel Fortran compiler ver. 2020 was used. The supercomputer has a distributed-memory type parallel computer among nodes, but shared-memory type parallel computation is available within each node.

5.1. Parallel Dissipation-Free and Dispersion-Optimized Explicit TD-FEM Using Domain Decomposition

The domain decomposition method (DDM) is a general term for division of the computational domain into multiple subdomains and performance of calculations in the respective subdomains to obtain a solution. In the parallel computation method based on DDM, each node or processor is assigned to compute each subdomain and to execute the computation. Using the DDM-based parallel computation technique, all computational processes in the Opt-E TD-FEM, i.e., matrices construction processes and time-marching scheme, can be parallelized. Communications using MPI are necessary when using data stored for each node.
For DDM-based parallel computations, one must first partition an FE mesh to subdomain meshes that include communication information with a partitioning algorithm. This study uses Metis Library [72] for the partitioning process, and the FE mesh is divided into non-overlapping subdomain meshes. With subdomain meshes, the finite element matrices construction processes, i.e., constructions of M , K , and D , are performed in parallel at each node or processor. For ease of implementation, the surface matrix C is assembled for the present study with the nonpartitioned surface mesh. Then, it is sorted into each process. After finishing the matrix construction processes, the time-marching computation consisting of Equations (22), (26) and (33) is also performed in parallel at each node or processor with communications using MPI. Communications appear in the following processes: (1) the assembly process of D , which performs only once before the time-marching computation, (2) the two sparse matrix–vector product operations per time step of Mv in Equation (22) and Kp in Equation (33), and the solution process of Equation (26) using the CR method, which includes sparse matrix–vector operations and inner product operations. Thread-parallelization is available within a shared-memory type architecture. We also use thread-parallelization using OpenMP.
As a detailed calculation procedure, the sparse matrix-vector product operations Mv can be described as the summation of sparse matrix-vector product results at each subdomain.
Mv = i = 1 N sd M i v i = i = 1 N sd w i
where N sd is the total number of subdomains, M i and v i are respectively M and v in the i-th subdomain, and w i is the resulting vector from the matrix-vector product in the i-th subdomain. In the DDM-based parallel computation, the sparse matrix-vector product operations are first performed at each subdomain and the vector w i of each subdomain are computed as a result. Then, the vector w i of each subdomain has to be added the components of nodes at overlapping boundary interfaces of other subdomains, with a communication. This treatment is also necessary for constructing the matrix D . Furthermore, one must consider the influence of duplicate boundary interfaces among subdomains to calculate the inner product, i.e., the vector component at the boundary interface’s nodes must be divided by the number of subdomains to which the nodes belong. With this consideration, the inner product is computed as
( q · q ) = i = 1 N sd ( q i · q i / N bd ) = i = 1 N sd s i
where q is arbitrary vectors, q i is q in the i-th subdomain, N bd is the vector stored the number of subdomains to which the nodes belong, and s i is the resulting scalar from the inner product in the i-th subdomain. The inner product is first computed at each subdomain, and then the resulting scalar s i of each subdomain is summed via a communication.

5.2. Room Configuration and Boundary Conditions

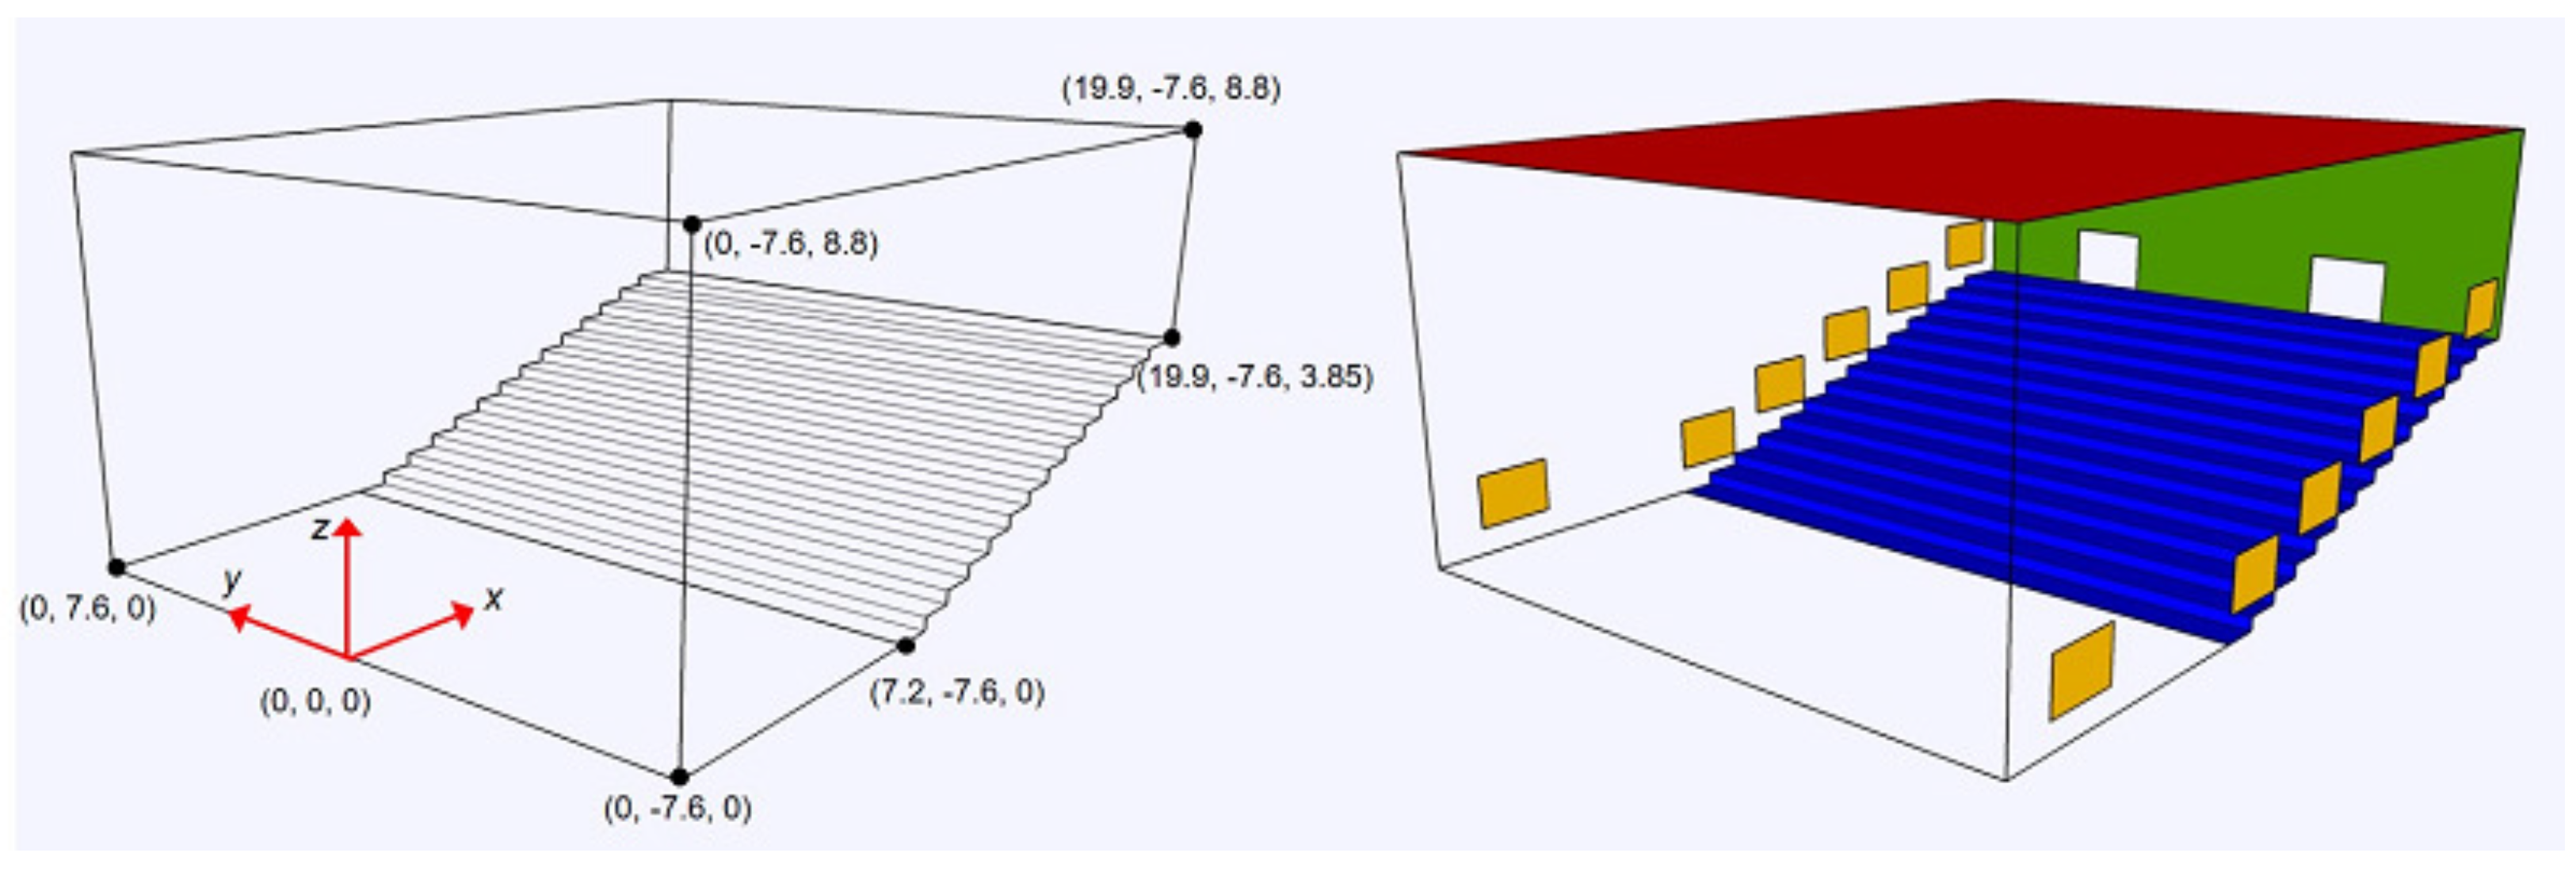
Figure 9 presents the analyzed auditorium model. We analyzed an auditorium with two BCs (Cond. 1 and Cond. 2). In Cond. 1, the red, blue, and green surfaces in Figure 9 were, respectively, assigned the frequency-dependent surface impedance of GW, NF, and MPP-GW used in Section 3. Other surfaces were reflective boundaries with real-valued frequency-independent impedance corresponding to the normal-incidence absorption coefficient of 0.1. In Cond. 2, 12 additional sound-absorbing panels with GW absorption characteristics were further installed into the yellow surfaces on sidewalls as sidewall absorbers to assess effects of sidewall absorbers in a large auditorium. The sound-absorbing panels have size of 1.74 m × 1.2 m. It is noteworthy that the used BCs are a virtual scenario to demonstrate the applicability of parallel Opt-E TD-FEM to practical applications. The source point was placed on (x, y, z) = (2.1, 0, 1.2). We set 14 sound receivers at the coordinates presented in Table 5.

5.3. Simulation Outline

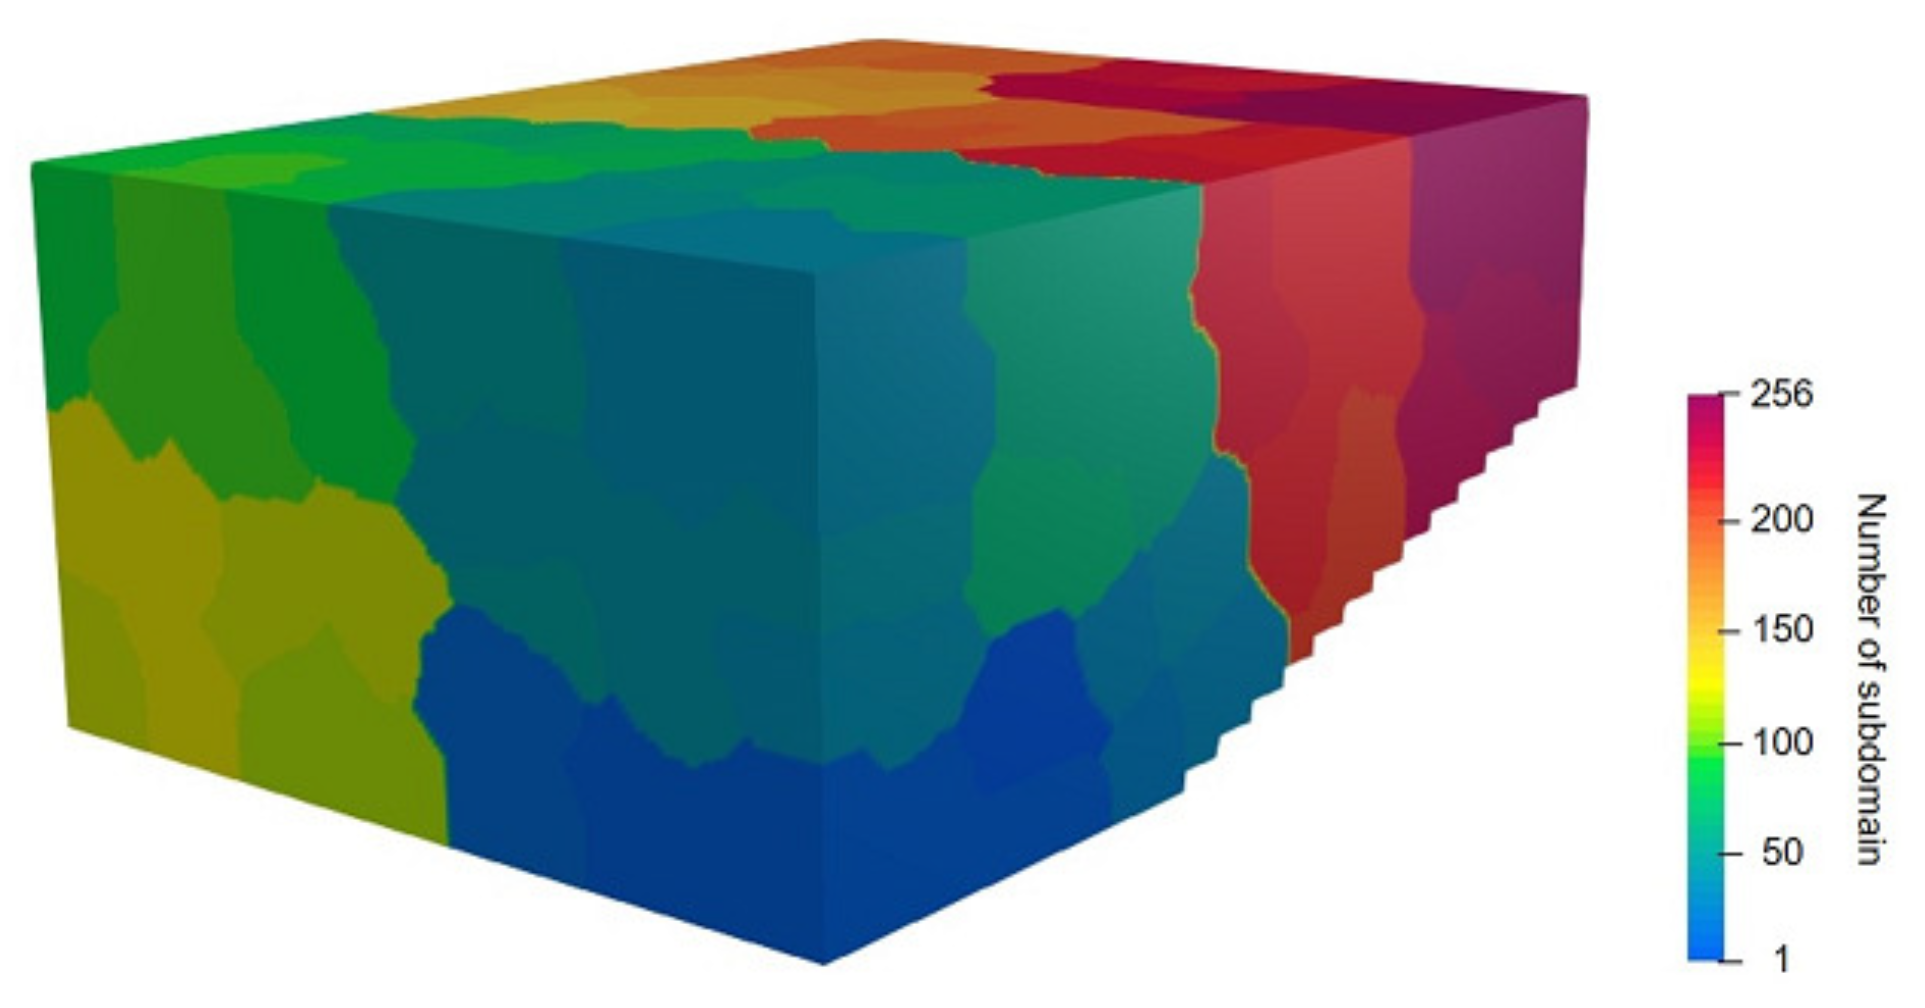
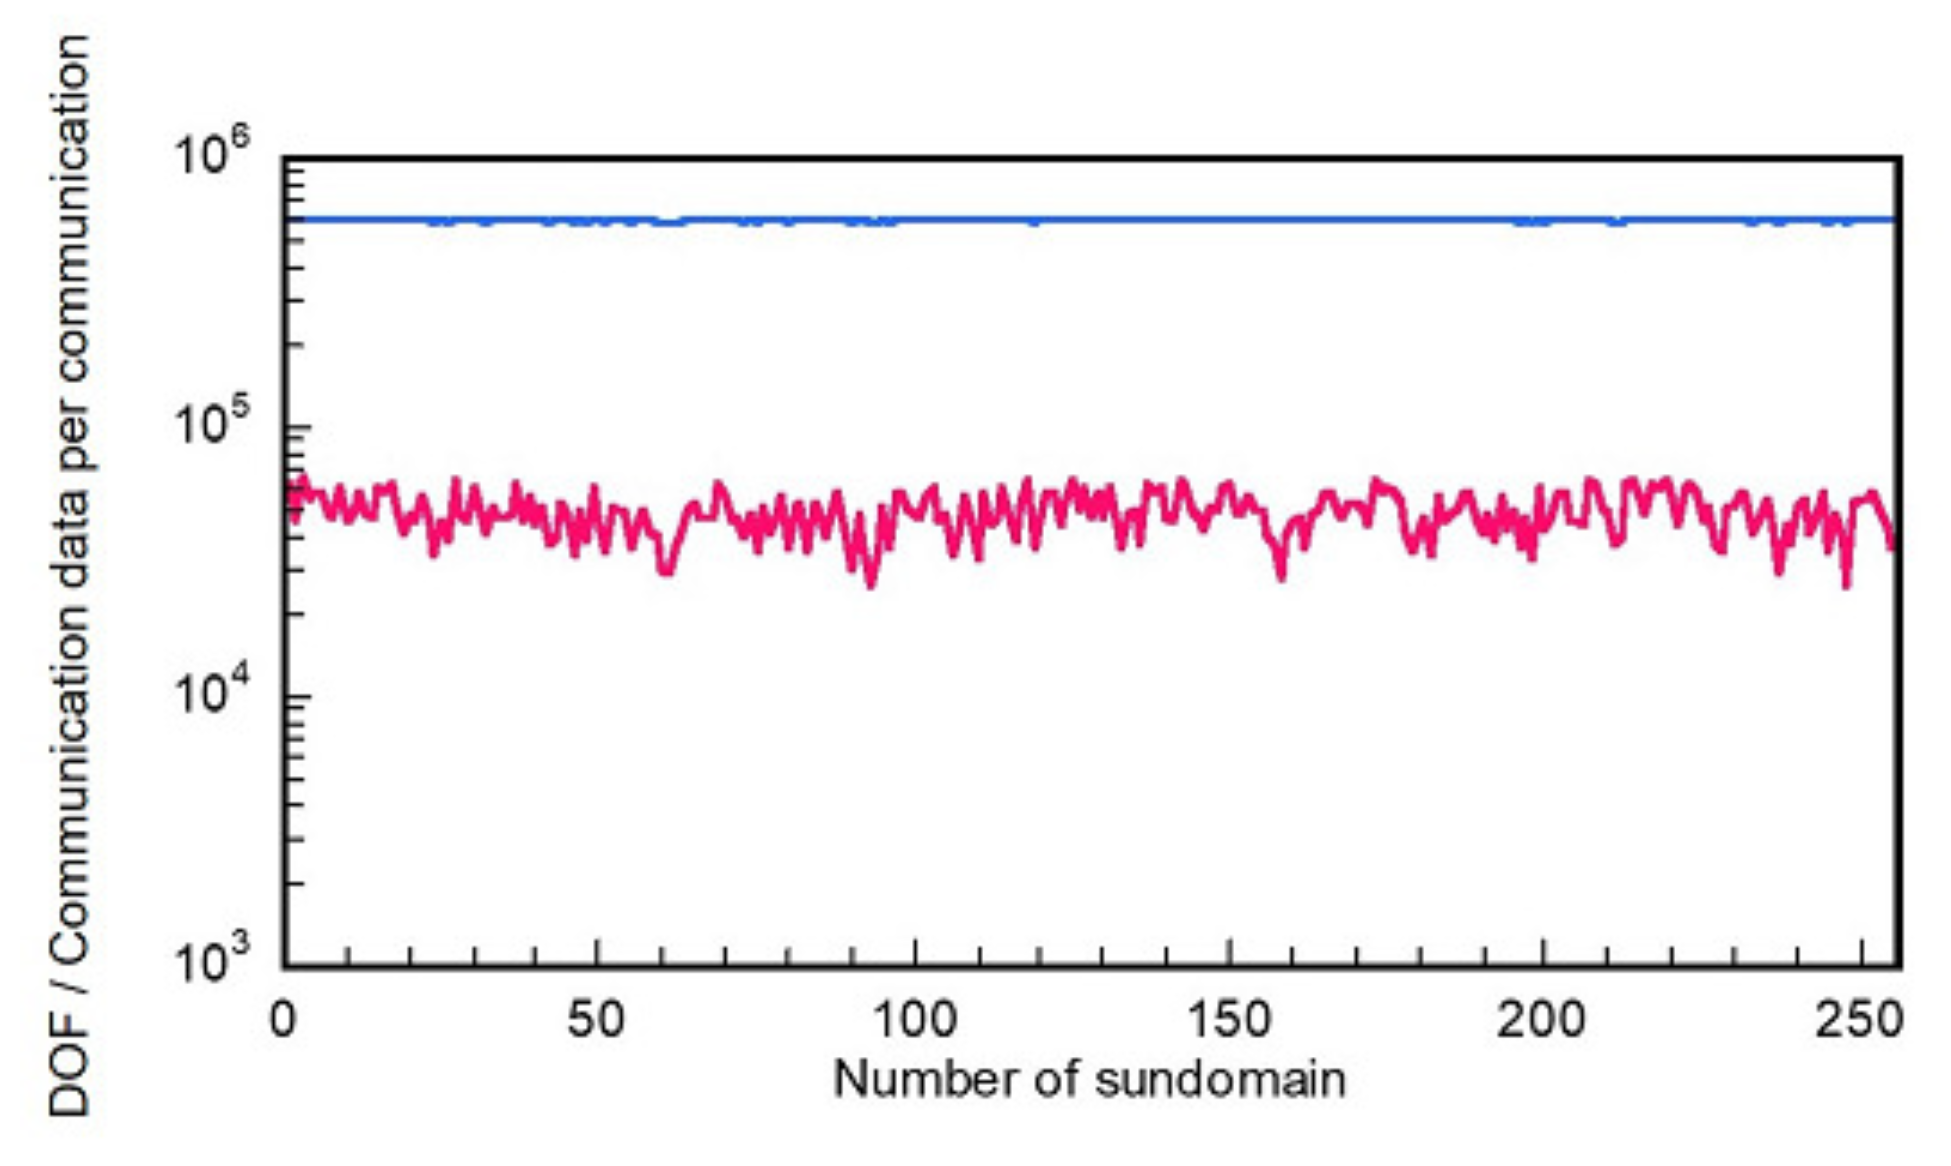
For acoustics simulations, the auditorium model was spatially discretized using variously shaped 8-node hexahedral FEs having a maximum edge size smaller than 0.025 m. The resulting FE mesh has 146,583,255 DOFs. For DDM-based parallel computation, we partitioned the FE mesh to 256 subdomain meshes using Metis Library [72]. Figure 10 presents the image of decomposed auditorium model with 256 subdomains. Also, Figure 11 shows a workload distribution among 256 subdomains, i.e., DOF of each subdomain and number of communication data per communication in each subdomain. The average values for DOF and communication data among all subdomains were respectively 596,287 and 48,451. The coefficient of variance for the distributed DOF is 0.72%, meaning that the DOF of the global auditorium model was evenly arranged to each subdomain. In addition, the coefficient of variance for communication data among all subdomains is 18.2%, which was larger than that for DOF. However, a workload-balanced domain decomposition among the subdomains without the extreme deviation of the partitioning was achieved. Because we use two thread-parallelization for each node or processor, parallel computation using 512 cores was performed, i.e., 256 process-parallelization by MPI and two thread-parallelization by OpenMP. For effective dispersion optimization with FE mesh composed of nonuniform elements, each element sets the integration points to minimize dispersion error at 2.2 kHz with the maximum edge length per element. Actually, this optimization procedure is based on the earlier work [37]. Considering the stability condition of Equation (32) using the smallest edge size in the FE mesh, a time interval was set as 1/30,000 s in both BCs. We calculated impulse responses up to 3 s with the Gaussian pulse sound source of Figure 3. Using the computed impulse responses, we made comparisons of the impulse responses (IRs), energy decay curves (EDCs), and four room acoustic parameters (reverberation time T 30 , E D T , C 50 and sound strength G) between the two conditions. The EDCs and room acoustic parameters were estimated according to ISO3382-1 [70]. The room acoustic parameters were calculated for the 125 Hz to 2 kHz octave band. In addition, the parallel performance of the proposed solver was examined by evaluating the speedup against the non-parallelized case. The evaluation is made with analyzed time up to 0.1 s (3000 steps) because the computational time of the non-parallelized solver exceeds the resource limit on the supercomputer when calculating 3 s impulse response.

5.4. Results and Discussion

First, we can show the excellent computational speed of the proposed parallel Opt-E TD-FEM. The computational times for IR calculations up to 3 s were only 8878 s and 8996 s, respectively, for Cond. 1 and Cond. 2. The slight increase of computational time for Cond. 2 occurs because the condition includes more frequency-dependent impedance BCs for the GW sound-absorbing panels. The speedups against the non-parallelized solver are 336 and 341 for Cond. 1 and Cond. 2, respectively, showing its notable parallel performance. This result demonstrates that the practicality of our proposed method in room acoustics design. It is noteworthy that the computational speed can be enhanced further using more CPU cores. At this stage, our computational code is only insufficiently optimized. A detailed performance study of massively parallel computing environments remains as a subject for future work.
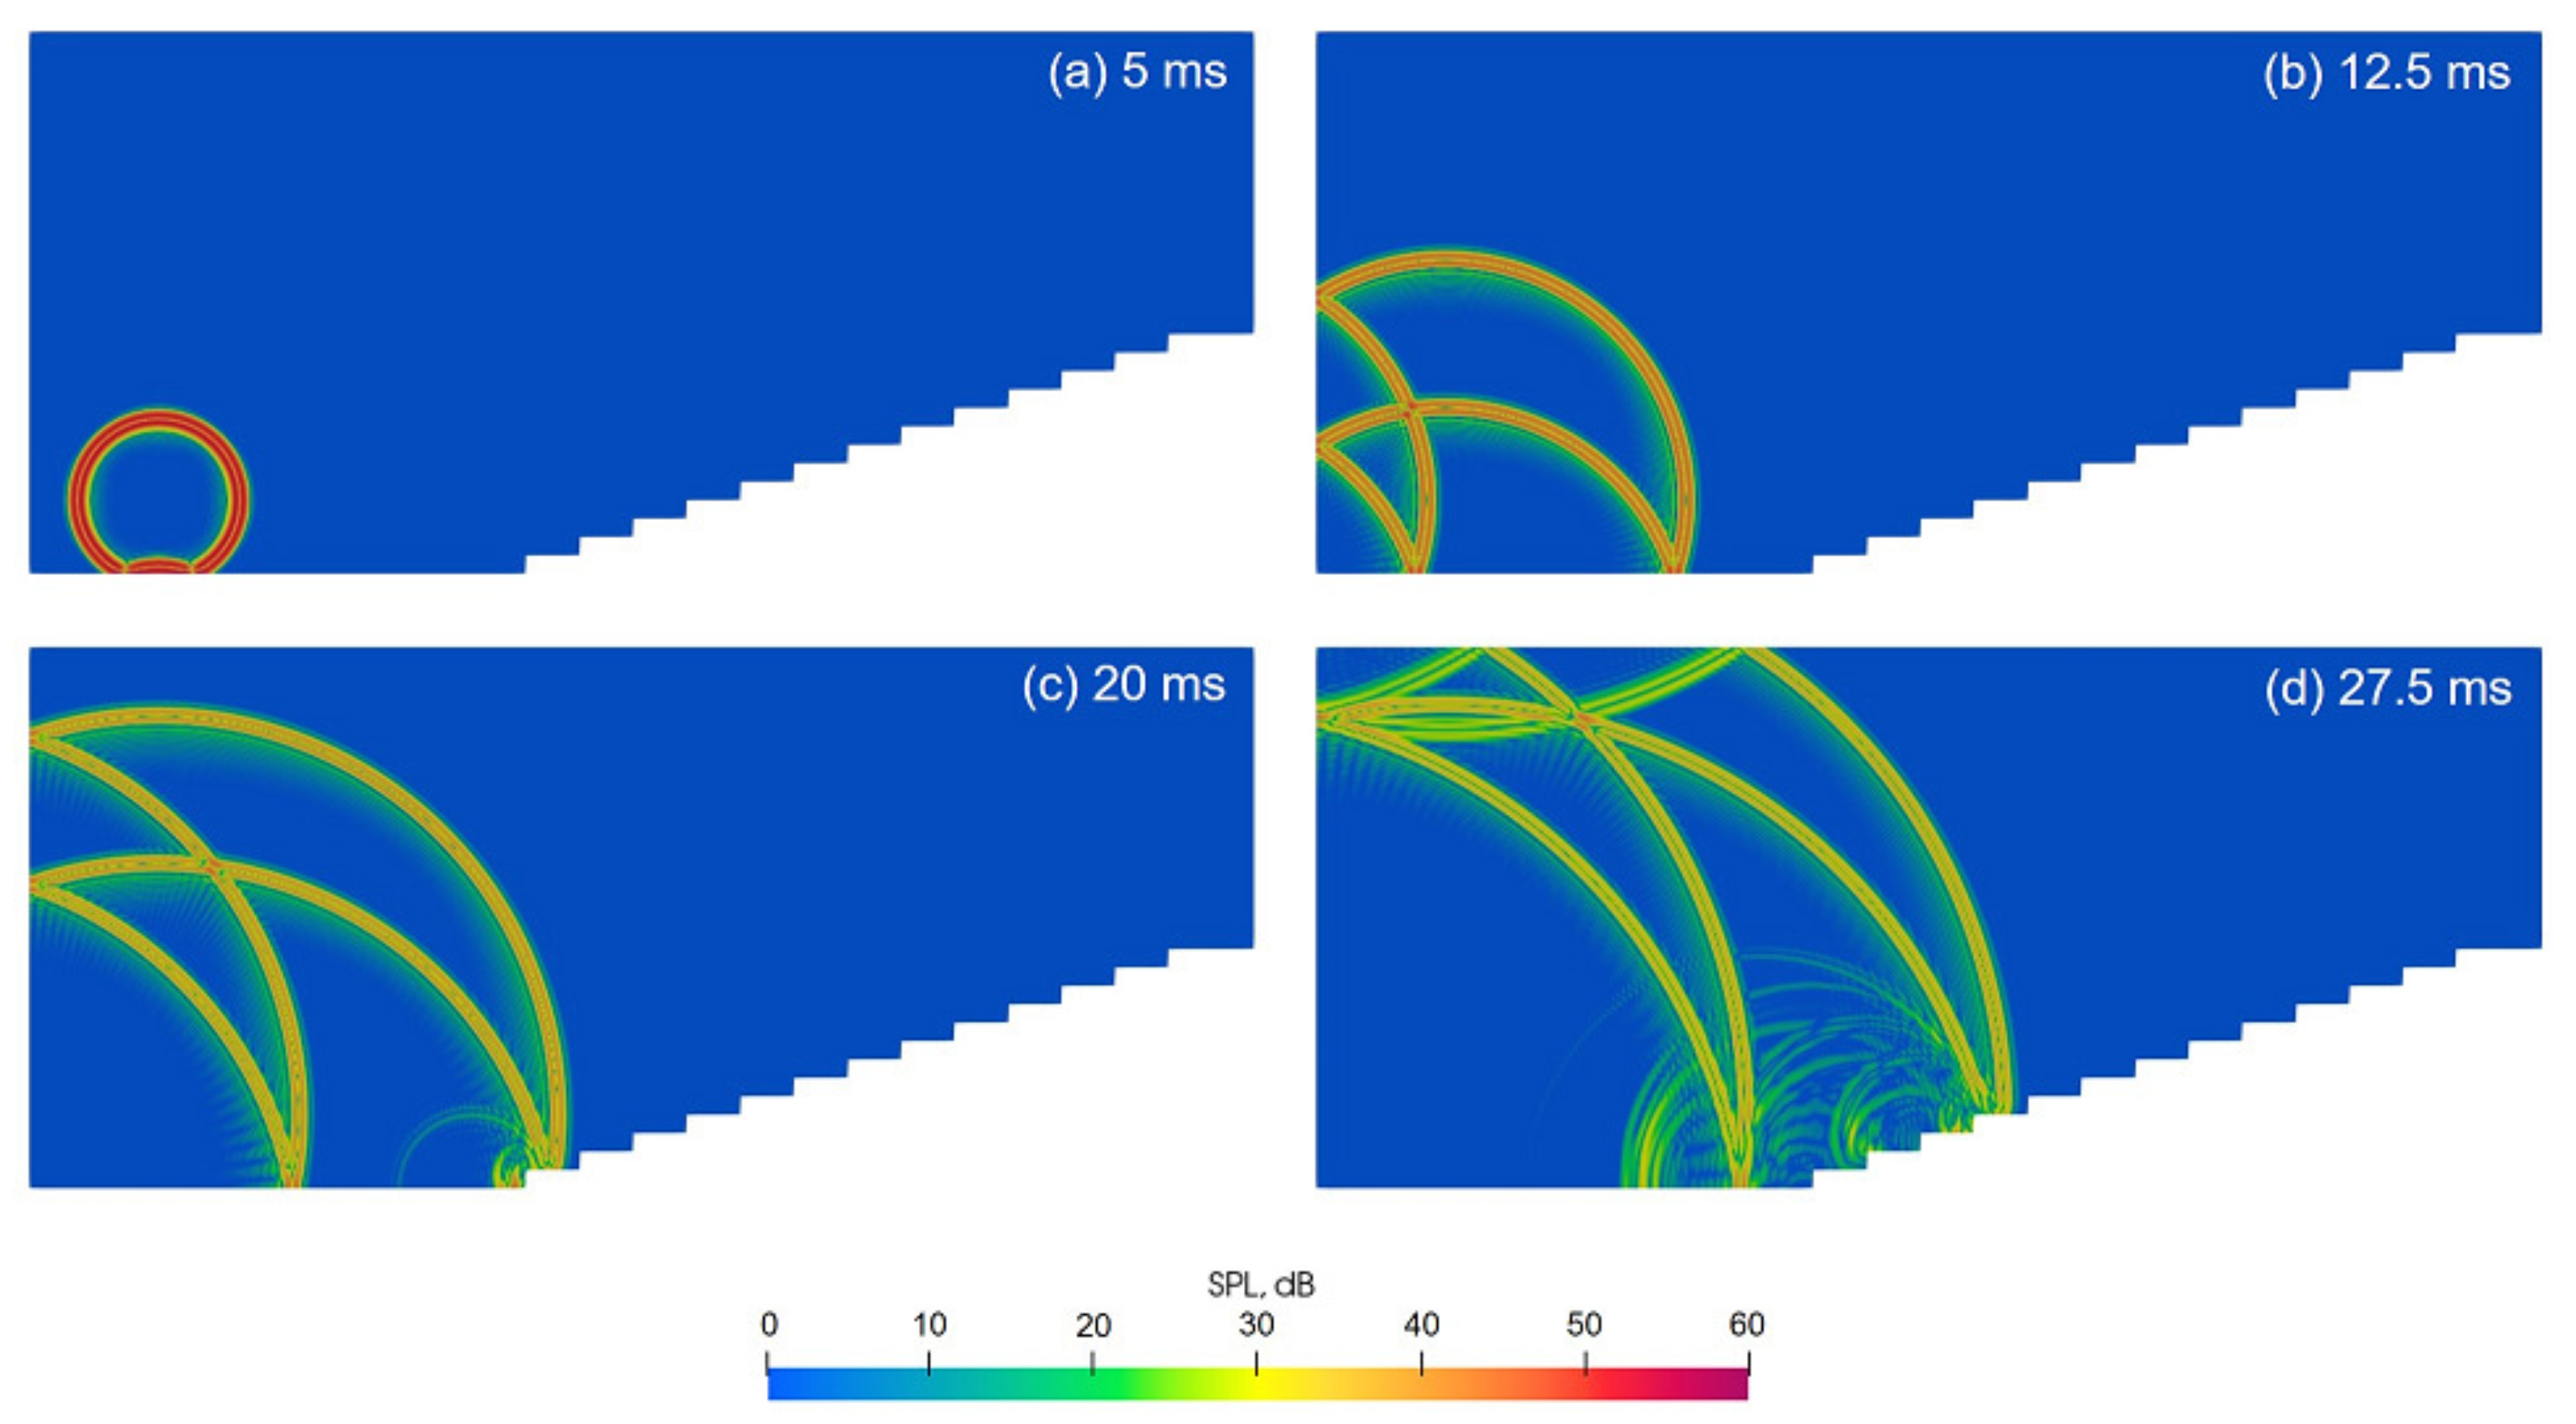
Figure 12a–d, respectively present the simulated sound field on the z x plane (y = 0) at 5 ms, 12.5 ms, 20 ms, and 27.5 ms. In fact, the figure shows only the sound field of Cond. 1. There is no difference between the two cases at the snapped times because the sound does not reach the sidewalls, where different BCs were assumed. Isotopic sound wave propagation can be observed, indicating that the proposed Opt-E TD-FEM reduces the dispersion error effect. Figure 12c,d present diffracted sound around the seating area. Additionally, the sound absorption effect of the ceiling absorber is evident in Figure 12d, where the reflected sound from the ceiling (green wavefront) was weakened more than other sounds (yellow wavefront). This visualization presents an intuitive understanding of the sound absorber effectiveness.
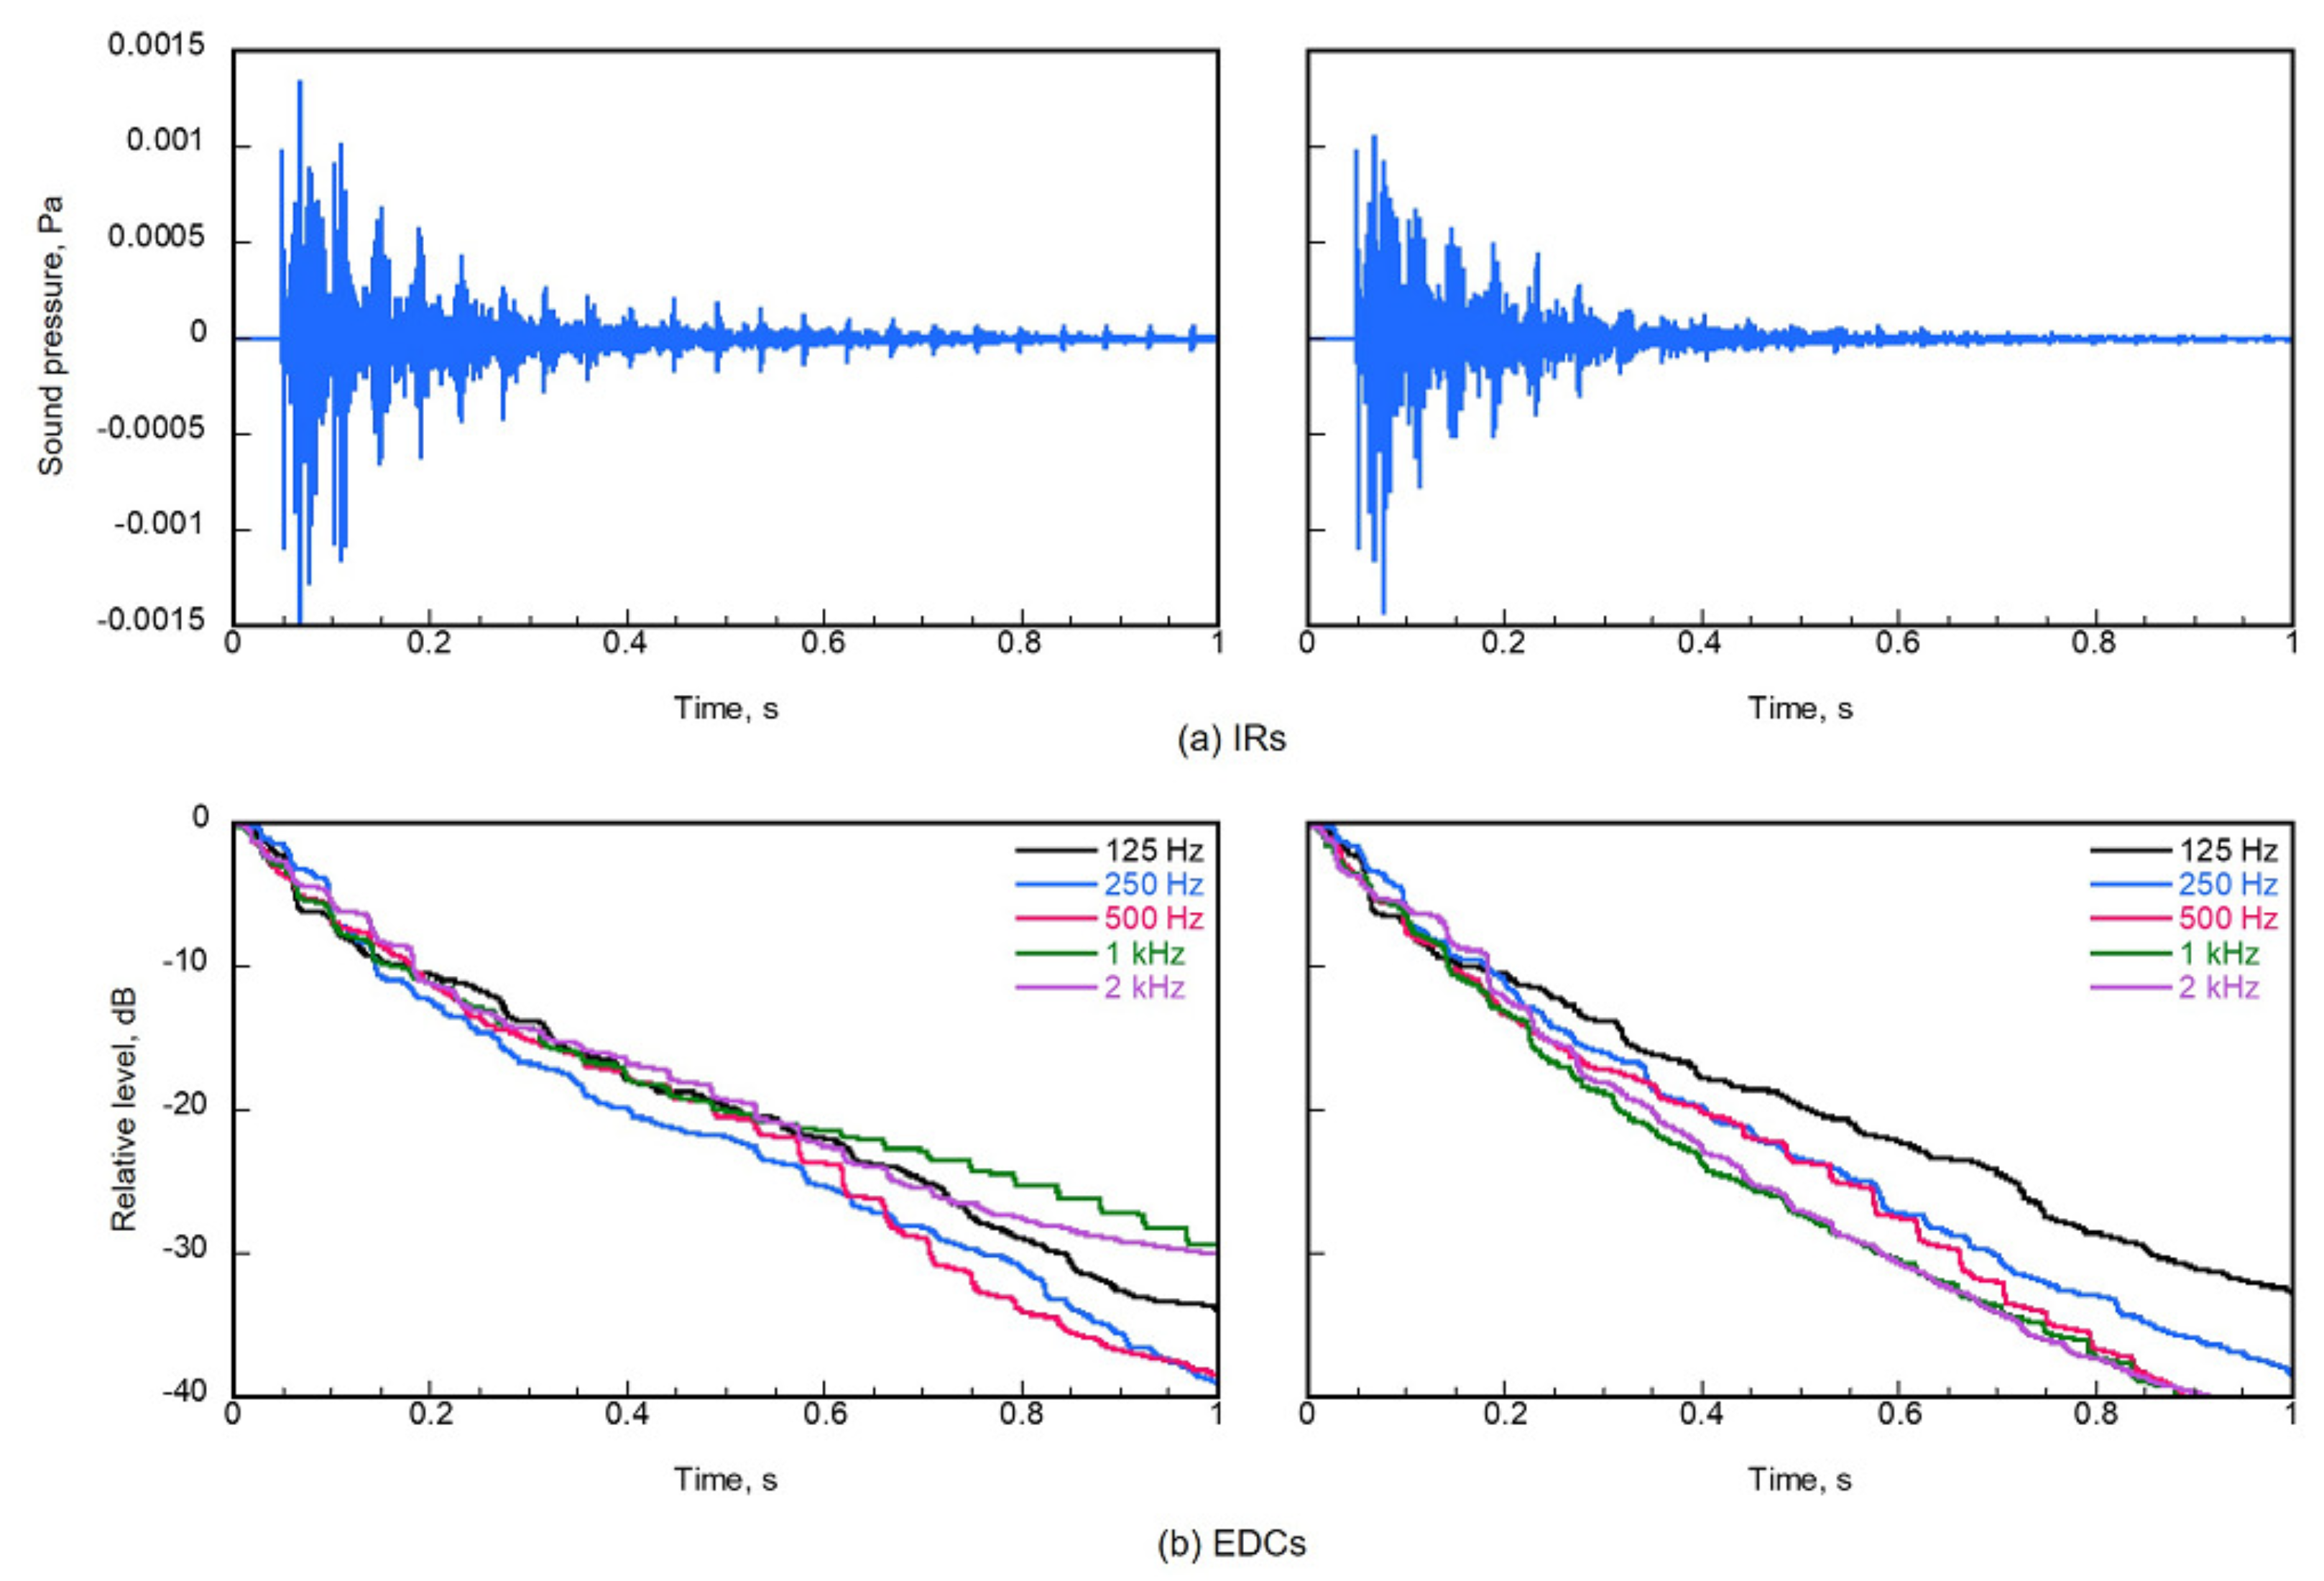
Figure 13a,b portray IRs and EDCs at a receiver R13 for Cond. 1 and Cond. 2. An acoustic defect called flutter echo is apparent for the Cond. 1 result. The reason for these multiple reflections is the low absorptivity of sidewalls. The time interval of 44.2 ms between strong reflections corresponds to the sound travel time between the side walls. One can also find multiple reflections effects in the EDCs, where nonlinear decay is observed at all frequencies. Especially, the EDCs at 1 kHz and 2 kHz are curved to a considerable degree because a high sound absorptive ceiling absorber gives only a small contribution to sound waves with a shorter wavelength propagating parallel to the absorber surface. The multiple reflections can be alleviated by the additional sound-absorbing panels as in Cond. 2 results. Furthermore, strong reflected sounds in early times were reduced. One can see smoother EDCs at frequencies higher than 500 Hz than those in Cond. 1. The decay properties at 1 kHz and 2 kHz were improved much more than at 500 Hz, which reflects the absorption property effects of additional sound-absorbing panels.
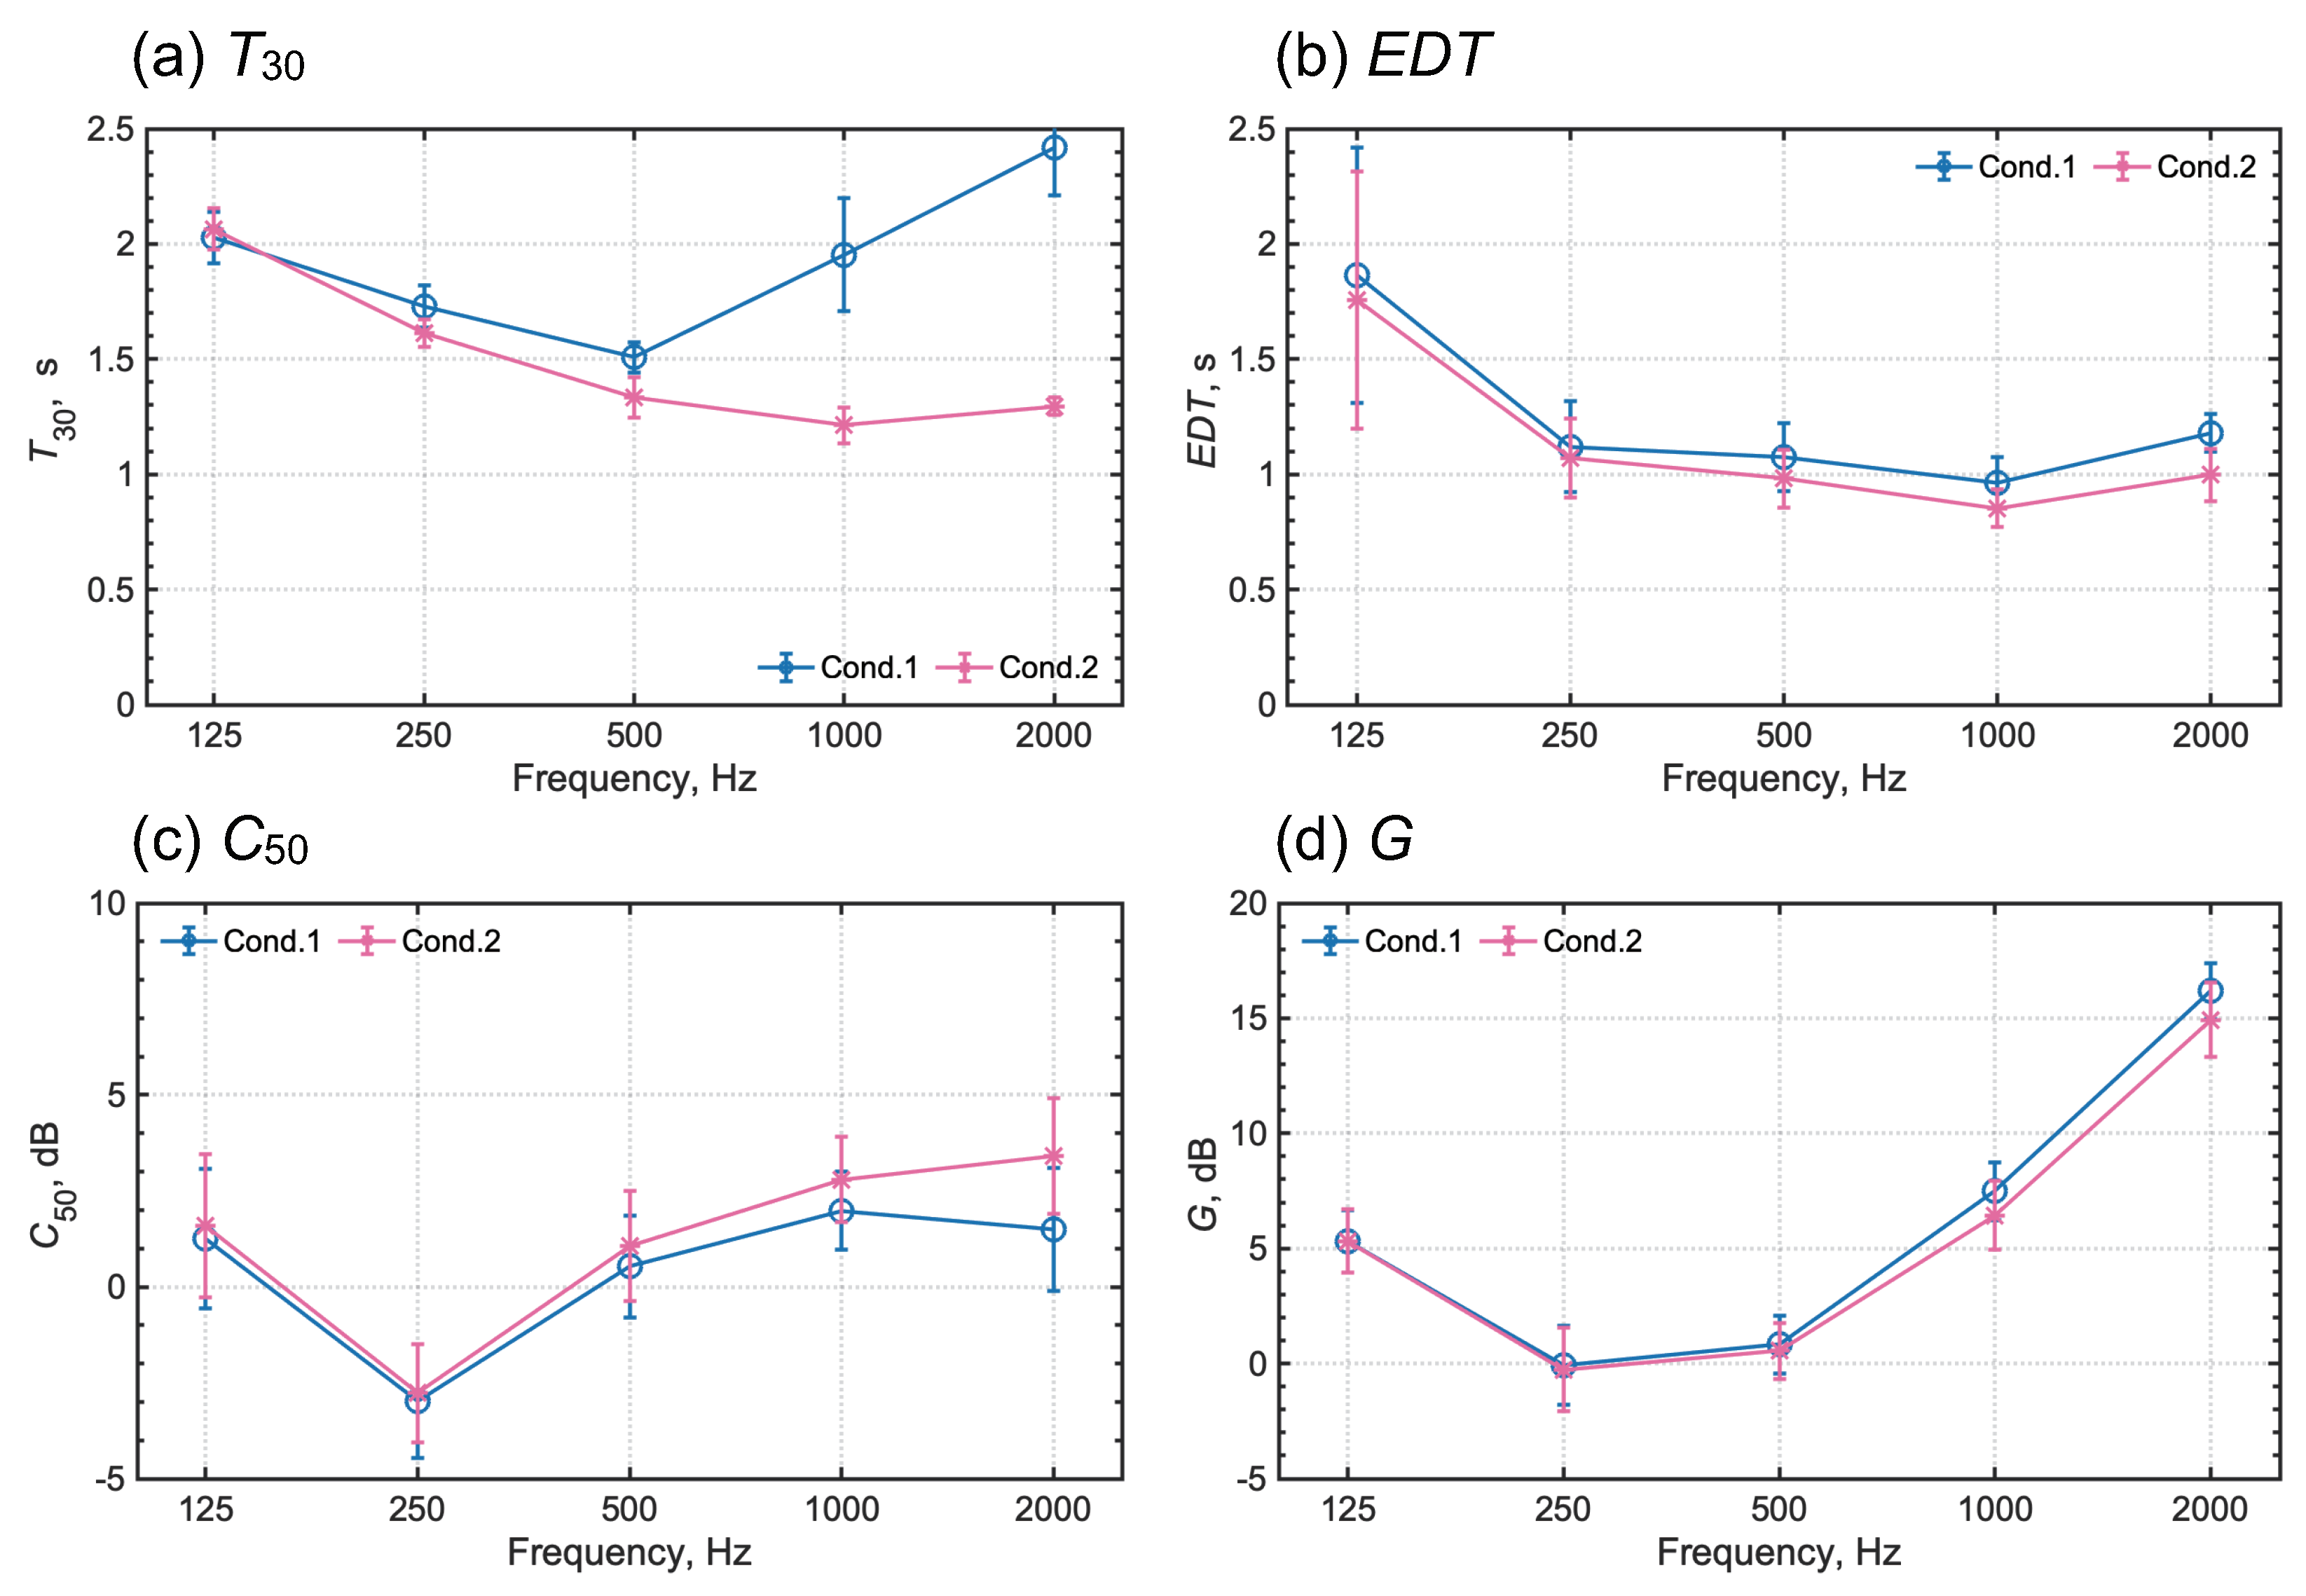
The acoustics improvement effects achieved using sound-absorbing panels can be observed further in four room acoustical parameters. Figure 14a–d, respectively show spatially averaged values of (a) T 30 , (b) E D T , (c) C 50 , and (d) G for Cond. 1 and Cond. 2. The figures also present the standard deviation over all receivers’ results in each acoustic parameter as an error bar. Figure 14a shows that T 30 in Cond. 1 decreases up to 500 Hz, and then it increases with frequency. This increase results from the above-explained effect of the nonlinear decay in EDCs. However, T 30 is reduced by the additional sound-absorbing panel. One can find T 30 in Cond. 2 decreases to about 1.3 s at 1 kHz and 2 kHz. Additionally, the spatial variances of T 30 at high frequencies were reduced thanks to the additional absorbers. The coefficient of variance in Cond. 2 is reduced from 12.6% to 6.4% at 1 kHz compared to the results in Cond. 1. At 2 kHz, it is reduced from 8.6% to 3.0%. That is because the effect of flutter echo differs on the receiver positions in Cond. 1. The other room acoustical parameters E D T and G at 1 kHz and 2 kHz and C 50 at 2 kHz in Cond. 2 are also changed considerably from Cond. 1 by more than each JND value, i.e., 5% for EDT, 1.1 dB for C 50 and 1 dB for G [70]. Those changes become greater with frequency. The results presented in this section demonstrate clearly that practicality of the proposed parallel Opt-E TD-FEM for practical room acoustic simulations including multiple sound absorbers.

6. Conclusions

As the most notable contribution of this study, we proposed a DDM-based parallel wave-based acoustics simulation method using dissipation-free and dispersion-optimized explicit TD-FEM for large-scale room acoustics problems. The proposed parallel solver can accommodate the sound absorption effects of various sound absorbers as the locally reacting frequency-dependent impedance BCs. This study used three numerical problems to assess its basic performance: an impedance tube problem, a small cubic room problem, and a large auditorium problem. The assessment includes (1) accuracy comparison with FD-FEM, which is a standard selection for acoustics simulation, and (2) performance comparison with existing TD-FEMs. It is noteworthy that the dissipation-free and dispersion-optimized explicit TD-FEMs abbreviated to the 4th-E and Opt-E TD-FEMs themselves have been proposed in the earlier work [37] for acoustics simulation with rigid boundaries. The novelty of the present study against earlier work is the proposal of a time-marching scheme that is able to address multiple frequency-dependent impedance BCs and the proposal of a DDM-based parallel solver for large-scale problems.
We first validated the proposed method using the impedance tube problem and a small cubic room problem, particularly addressing the 4th-E TD-FEM. The impedance tube problems with three sound absorbers of GW, NF, and MPP-GW demonstrated overall that the 4th-E TD-FEM can simulate their sound absorption characteristics accurately compared to theoretical results obtained using transfer matrix method. However, we found a future subject presenting difficulty: reproduction of the complex-valued surface impedance of MPP-GW at high frequencies. Small cubic room problems with multiple frequency-dependent impedance BCs that examines the accuracy of the 4th-E TD-FEM compared to the fourth-order accurate FD-FEM revealed that the 4th-E TD-FEM has a similar level of accuracy as that of FD-FEM.
Subsequently, we investigated the performance gain of the 4th-E TD-FEM and the Opt-E TD-FEM with four optimized setups against two existing implicit TD-FEMs: 4th-I TD-FEM and 2nd-I TD-FEM. Results demonstrated the outstanding computational speed of the Opt-E TD-FEM using the optimization at R = 6.25 , which is 1.4 times faster than the 4th-I TD-FEM and 76.4 times faster than the 2nd-I TD-FEM while maintaining equivalent accuracy.
Finally, we tested the parallel computational performance of the DDM-based parallel Opt-E TD-FEM using a large auditorium model of 2271 m 3 with multiple sound absorbers. The auditorium model has about one hundred fifty million DOFs. The results revealed that the parallel Opt-E TD-FEM can simulate impulse responses with a time length of 3 s, including frequency component up to 3 kHz within 9000 s under the use of 512 CPU-cores with MPI-OpenMP hybrid parallel computational framework. In addition, the parallel solver presented the notable speedup against the non-parallelized solver, with 336–341 times faster computational speed. To conclude, the present parallel wave-based solver has high potential for use with practical room acoustics design tools. It is also helpful for FD-FEM users because this method can be coded easily from standard linear FD-FEM code with a simple modification of integration points for element matrices and implementation of the three-step time integration method.

Author Contributions

Conceptualization, T.Y. and T.O.; funding acquisition, T.O.; investigation, T.Y.; methodology, T.Y.; project administration, K.S.; resources, T.O.; software, T.Y. and T.O.; supervision, T.O.; validation, T.Y.; visualization, T.Y.; writing—original draft, T.Y. and T.O.; writing—review & editing, T.Y., T.O. and K.S. All authors have read and agreed to the published version of the manuscript.

Funding

This work was supported in part by a Kajima Foundation Scientific Research Grant.

Institutional Review Board Statement

Not applicable.

Informed Consent Statement

Not applicable.

Data Availability Statement

Not applicable.

Acknowledgments

Computation were partly conducted using the computer resources offered by the Research Institute for Information Technology, Kyushu University.

Conflicts of Interest

The authors declare that they have no conflict of interest.

Appendix A. Detailed Parameters of Rational Functions for Modeled Sound Absorbers

For convenience of reproduction, Table A1, Table A2 and Table A3 respectively present parameters of y , λ i , α i , β i , A i , B i and C i required by rational function in Equation (12) for modeling GW, NF, and MPP-GW using ADE method.
Table A1. Values of y , λ i , α i , β i , A i , B i and C i for GW.
y 0.76
i 123
λ i 991.513251.475984.60
α i 3280.455588.5420,358.34
β i −7737.91−27,960.34−47,563.60
A i −14.72−139.29259.67
B i 4836.785968.063135.82
C i 2475.291231.0019,666.69
Table A2. Values of y , λ i , α i , β i , A i , B i and C i for NF.
y 0.64
i 12
λ i 1826.556395.53
α i 7171.0851,309.50
β i −30,096.80−144,303.73
A i −19.62−150.00
B i 19,006.7366,607.19
C i 5181.0269,809.40
Table A3. Values of y , λ i , α i , β i , A i , B i and C i for MPP-GW.
y 0.04
i 12345
λ i 215.00652.87736.621714.703141.91
α i 1023.083149.274579.255125.504557.33
β i −1560.72−8475.89−18,116.92−27,842.93−40,738.81
A i 8.68−206.20203.9868.56236.69
B i 581.928153.0419.74−10.12−4.20
C i 472.74−22.84−20.891.7712.02
i 678910
λ i 3851.027803.8810,222.9072,799.9976,374.16
A i −675.223049.80−3153.30119,285.58−124,761.19

Appendix B. Investigation Convergence Tolerance for Local Linear Equation Solver

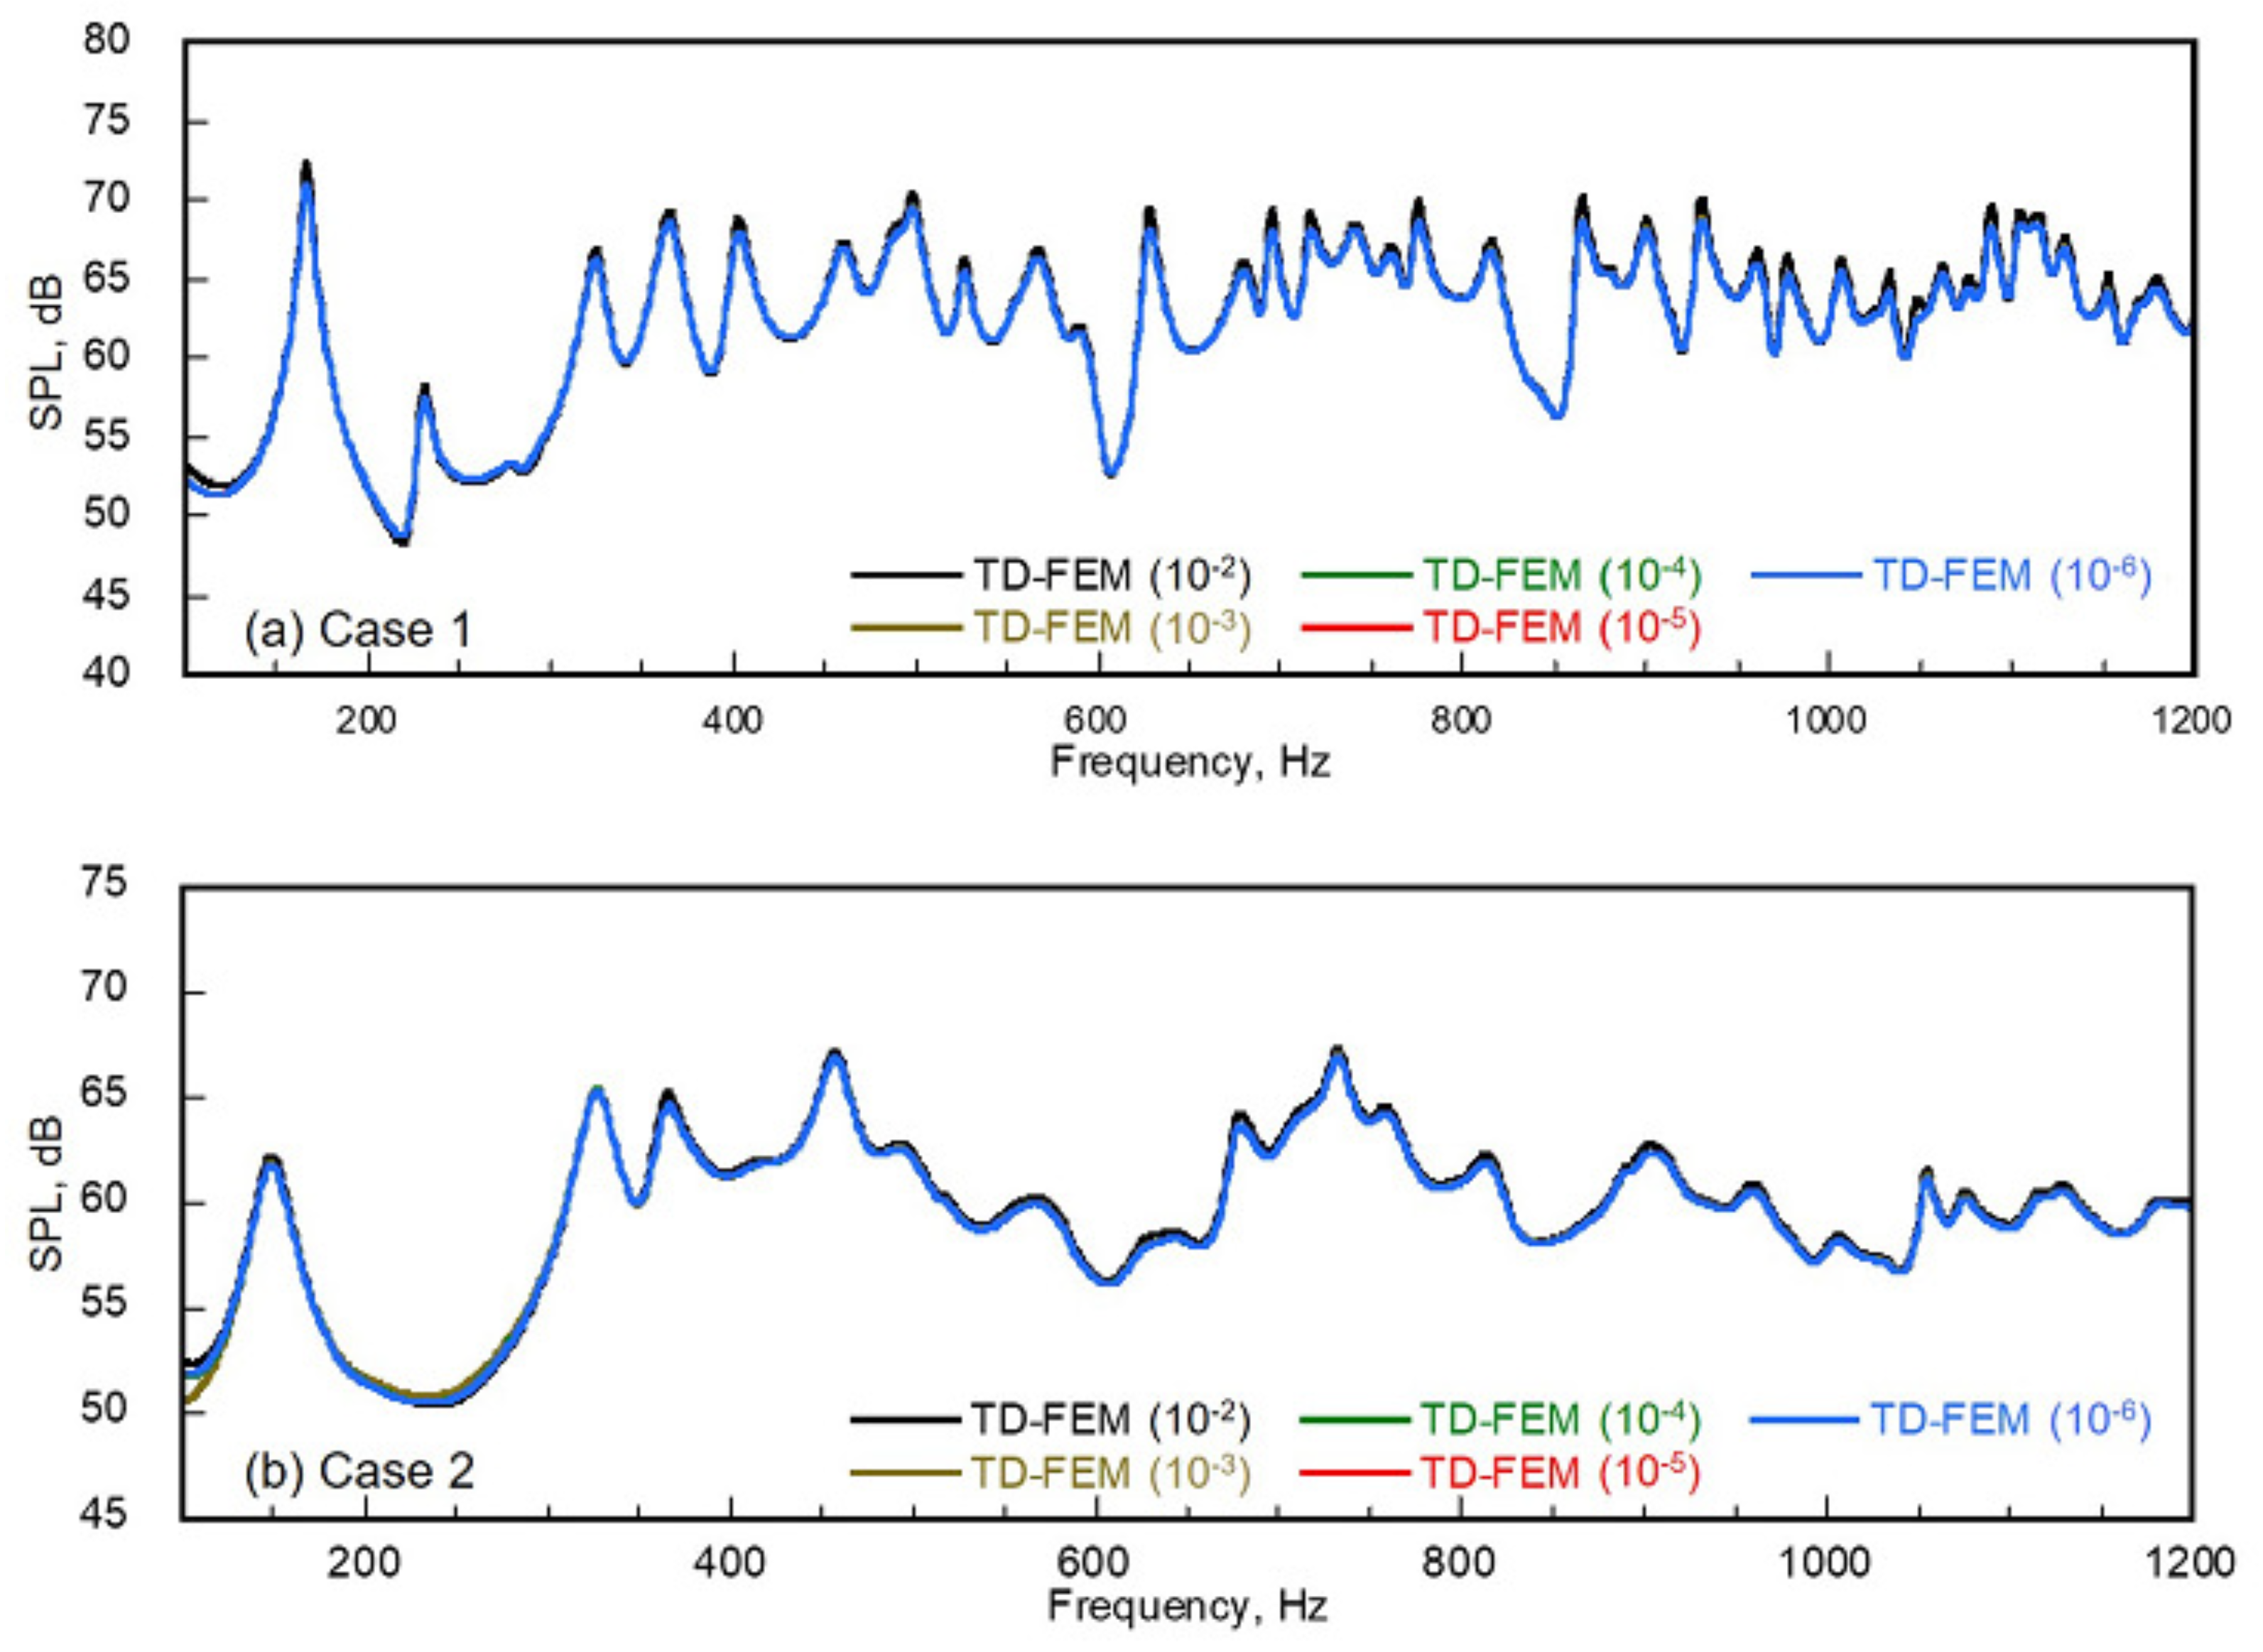
This appendix examines effects of tolerance value in the CR method for locally solving the linear equation of Equation (26) to the accuracy and efficiency of the 4th-E TD-FEM. For this purpose, we analyzed the cubic room of Figure 5 of two absorption boundary cases (Case 1 and Case 2) with same setting as Section 3.2 under five tolerance values of 10 6 , 10 5 , 10 4 , 10 3 , and 10 2 . In fact, with larger values, the resulting accuracy decreases with increasing efficiency. This investigation was undertaken to find a balanced tolerance value in terms of accuracy and efficiency for practical application.
Figure A1a,b demonstrate how the resulting accuracy of 4th-E TD-FEM change with larger tolerance values of the CR method for Case 1 and Case 2. We can find for Case 1 that the resulting SPL becomes higher for the tolerance value of 10 2 , whereas other tolerance values show good agreement. This is also true for Case 2, but a slight difference for the tolerance value of 10 3 is apparent. For quantitative evaluation, Figure A2 presents the absolute difference in the mean SPL between the lower accurate tolerance conditions of 10 2 to 10 5 and the sufficiently accurate condition of 10 6 . For Case 1, a significant difference that exceeds 1 dB appears for the result of 10 2 . For Case 2, the error becomes lower for 10 2 results, but it still exceeds 0.5 dB. One can also find that the error exceeds 1 dB at low frequencies for 10 3 results in Case 2. One can obtain sufficient accuracy for the tolerance values of 10 4 and 10 5 , where the differences were lower, respectively, than 0.16 dB and 0.005 dB. Table A4 shows a list that illustrates how the efficiency of 4th-E TD-FEM changes with the tolerance values for both cases. Efficiency estimation uses the mean iteration per time step: a smaller iteration represents higher efficiency with lower computational complexity. The use of 10 4 tolerance can reduce the computational complexities to 58–64% of those in 10 6 tolerance, i.e., the iteration numbers 5.61 and 6.60 in 10 6 reduce to 3.59 and 3.80 iterations for 10 4 . Additionally, one can find that Case 2 with multiple frequency-dependent BCs shows slightly larger iteration numbers than in Case 1 for the same tolerance value. Based on those results, we recommend using a tolerance value 10 4 that provides sufficient accuracy while maintaining efficiency for the proposed 4th-E method.
Figure A1. Comparisons of mean SPLs among the 4th-E TD-FEM with various tolerance values for (a) Case 1 and (b) Case 2, where the values in parentheses following TD-FEM represent the convergence tolerance for CR method.
Buildings 12 00105 g0a1
Figure A2. Absolute differences with respect to mean SPL in each tolerance condition from the sufficiently accurate condition of 10 6 in (a) Case 1 and (b) Case 2, where the values in parentheses following TD-FEM represent the convergence tolerance for CR method.
Buildings 12 00105 g0a2
Table A4. Mean iteration number per time step for each tolerance condition in Case 1 and Case 2.
CasesTolerance Value
10 6 10 5 10 4 10 3 10 2
Case 15.614.513.592.651.25
Case 26.605.233.802.821.78

References

  1. Sakuma, T.; Sakamoto, S.; Otsuru, T. (Eds.) Computational Simulation in Architectural and Environmental Acoustics: Methods and Applications of Wave-Based Computation; Springer: Tokyo, Japan, 2014. [Google Scholar]
  2. Okamoto, N.; Tomiku, R.; Otsuru, T.; Yasuda, Y. Numerical analysis of large-scale sound fields using iterative methods part II: Application of Krylov subspace methods to finite element analysis. J. Comput. Acoust. 2007, 15, 473–493. [Google Scholar] [CrossRef]
  3. Botteldooren, D. Finite-difference time-domain simulation of low-frequency room acoustics problems. J. Acoust. Soc. Am. 1995, 98, 3302–3308. [Google Scholar] [CrossRef]
  4. Sakamoto, S.; Nagatomo, H.; Ushiyama, A.; Tachibana, H. Calculation of impulse responses and acoustic parameters in a hall by the finite-difference time-domain method. Acoust. Sci. Technol. 2008, 29, 256–265. [Google Scholar] [CrossRef] [Green Version]
  5. Yasuda, Y.; Ueno, S.; Kadota, M.; Sekine, H. Applicability of locally reacting boundary conditions to porous material layer backed by rigid wall: Wave-based numerical study in non-diffuse sound field with unevenly distributed sound absorbing surfaces. Appl. Acoust. 2016, 113, 45–57. [Google Scholar] [CrossRef]
  6. Cox, T.J.; D’Antonio, P. Acoustic Absorbers and Diffusers: Theory, Design and Application, 3rd ed.; CRC Press: Boca Raton, FL, USA, 2016. [Google Scholar]
  7. Sanchez, G.M.E.; van Renterghem, T.; Sun, K.; De Coensel, B.; Botteldooren, D. Using virtual reality for assessing the role of noise in the audio-visual design of an urban public space. Landsc. Urban Plan. 2017, 167, 98–107. [Google Scholar] [CrossRef] [Green Version]
  8. Llopis, H.S.; Pind, F.; Jeong, C.H. Development of an auditory virtual reality system based on pre-computed B-format impulse responses for building design evaluation. Appl. Acoust. 2020, 169, 106553. [Google Scholar] [CrossRef]
  9. Mehra, R.; Rungta, A.; Golas, A.; Lin, M.; Manocha, D. WAVE: Interactive wave-based sound propagation for virtual environments. IEEE Trans. Vis. Comp. Graph. 2015, 21, 434–442. [Google Scholar] [CrossRef]
  10. Project Acoustics. Available online: https://docs.microsoft.com/en-us/gaming/acoustics/what-is-acoustics (accessed on 14 October 2021).
  11. Zotter, F.; Frank, M. Ambisonics: A Practical 3D Audio Theory for Recording, Studio Production, Sound Reinforcement, and Virtual Reality; Springer: Cham, Switzerlan, 2019. [Google Scholar]
  12. Jin, C.T. A tutorial on immersive three-dimensional sound technologies. Acoust. Sci. Technol. 2008, 41, 16–27. [Google Scholar] [CrossRef]
  13. Sheaffer, J.; van Walstijn, M.; Rafaely, B.; Kowalczyk, K. Binaural reproduction of finite difference simulations using spherical array processing. IEEE Trans. Audio Speech Lang. Process. 2015, 23, 2125–2135. [Google Scholar] [CrossRef] [Green Version]
  14. Bilbao, S.; Politis, A.; Hamilton, B. Local time-domain spherical harmonic spatial encoding for wave-based acoustic simulation. IEEE Signal Process. Lett. 2019, 26, 617–621. [Google Scholar] [CrossRef] [Green Version]
  15. Gorzel, M.; Allen, A.; Kelly, I.; Gungormusler, A.; Kammerl, J.; Yeh, H.; Boland, F. Efficient encoding and decoding of binaural sound with resonance audio. In Proceedings of the AES Conference on Immersive and Interactive Audio, York, UK, 27–29 March 2019. [Google Scholar]
  16. McCormack, L.; Politis, A. SPARTA & COMPASS: Real-Time implementations of linear and parametric spatial audio reproduction and processing methods. In Proceedings of the AES Conference on Immersive and Interactive Audio, York, UK, 27–29 March 2019. [Google Scholar]
  17. Sakamoto, S. Phase-error analysis of high-order finite difference time-domain scheme and its influence on calculation results of impulse response in closed sound field. Acoust. Sci. Technol. 2007, 28, 295–309. [Google Scholar] [CrossRef] [Green Version]
  18. Kowalczyk, K.; Van Walstijn, M. Room acoustics simulation using 3-D compact explicit FDTD schemes. IEEE Trans. Audio Speech Lang. Process. 2010, 19, 34–46. [Google Scholar] [CrossRef] [Green Version]
  19. Hamilton, B.; Bilbao, S. FDTD methods for 3-D room acoustics simulation with high-order accuracy in space and time. IEEE Trans. Audio Speech Lang. Process. 2017, 25, 2112–2124. [Google Scholar] [CrossRef]
  20. Otsuru, T.; Tomiku, R. Basic characteristics and accuracy of acoustic element using spline function in finite element sound field analysis. Acoust. Sci. Technol. 2000, 21, 87–95. [Google Scholar] [CrossRef] [Green Version]
  21. Simonaho, S.P.; Lähivaara, T.; Huttunen, T. Modeling of acoustic wave propagation in time-domain using the discontinuous Galerkin method—A comparison with measurements. Appl. Acoust. 2012, 73, 173–183. [Google Scholar] [CrossRef]
  22. Wang, H.; Sihar, I.; Muoz, R.P.; Hornikx, M. Room acoustics modeling in the time-domain with the nodal discontinuous Galerkin method. J. Acoust. Soc. Am. 2019, 145, 2650–2663. [Google Scholar] [CrossRef] [Green Version]
  23. Pind, F.; Engsig-Karup, A.P.; Jeong, C.H.; Hesthaven, J.S.; Mejling, M.S.; Strømann–Anderson, J. Time domain room acoustic simulations using the spectral element method. J. Acoust. Soc. Am. 2019, 145, 3299–3310. [Google Scholar] [CrossRef] [Green Version]
  24. Okuzono, T.; Mohamed, M.S.; Sakagami, K. Potential of room Acoustic solver with plane-wave enriched finite element method. Appl. Sci. 2020, 10, 1969. [Google Scholar] [CrossRef] [Green Version]
  25. Okuzono, T.; Otsuru, T.; Tomiku, R.; Okamoto, N. Fundamental accuracy of time domain finite element method for sound-field analysis of rooms. Appl. Acoust. 2010, 71, 940–946. [Google Scholar] [CrossRef] [Green Version]
  26. Okuzono, T.; Otsuru, T.; Tomiku, R.; Okamoto, N. A finite-element method using dispersion reduced spline elements for room acoustics simulation. Appl. Acoust. 2014, 79, 1–8. [Google Scholar] [CrossRef] [Green Version]
  27. Okuzono, T.; Otsuru, T.; Tomiku, R.; Okamoto, N. Application of modified integration rule to time-domain finite-element acoustic simulation of rooms. J. Acoust. Soc. Am. 2012, 132, 804–813. [Google Scholar] [CrossRef] [PubMed]
  28. Okuzono, T.; Yoshida, T.; Sakagami, K.; Otsuru, T. An explicit time-domain finite element method for room acoustics simulations: Comparison of the performance with implicit methods. Appl. Acoust. 2016, 104, 76–84. [Google Scholar] [CrossRef]
  29. Okuzono, T.; Sakagami, K. A frequency domain finite element solver for acoustic simulations of 3D rooms with microperforated panel absorbers. Appl. Acoust. 2018, 129, 1–12. [Google Scholar] [CrossRef] [Green Version]
  30. Yoshida, T.; Okuzono, T.; Sakagami, K. Numerically stable explicit time-domain finite element method for room acoustics simulation using an equivalent impedance model. Noise Control Engr. J. 2018, 66, 176–189. [Google Scholar] [CrossRef]
  31. Okuzono, T.; Sakagami, K.; Otsuru, T. Dispersion-reduced time domain FEM for room acoustics simulation. In Proceedings of the 23rd International Congress on Acoustics, Aachen, Germany, 9–13 September 2019. [Google Scholar]
  32. Okuzono, T.; Shimizu, N.; Sakagami, K. Predicting absorption characteristics of single-leaf permeable membrane absorbers using finite element method in a time domain. Appl. Acoust. 2019, 151, 172–182. [Google Scholar] [CrossRef]
  33. Hoshi, K.; Hanyu, T.; Okuzono, T.; Sakagami, K.; Yairi, M.; Harada, S.; Takahashi, S.; Ueda, Y. Implementation experiment of a honeycomb-backed MPP sound absorber in a meeting room. Appl. Acoust. 2020, 157, 107000. [Google Scholar] [CrossRef]
  34. Yoshida, T.; Okuzono, T.; Sakagami, K. Time domain room acoustic solver with fourth-order explicit FEM using modified time integration. Appl. Sci. 2020, 10, 3750. [Google Scholar] [CrossRef]
  35. Guddati, M.N.; Yue, B. Modified integration rules for reducing dispersion error in finite element methods. Comput. Methods. Appl. Mech. Eng. 2004, 193, 275–287. [Google Scholar] [CrossRef]
  36. Yue, B.; Guddati, M.N. Dispersion-reducing finite elements for transient acoustics. J. Acoust. Soc. Am. 2005, 118, 2132–2141. [Google Scholar] [CrossRef] [Green Version]
  37. Yoshida, T.; Okuzono, T.; Sakagami, K. Dissipation-free and dispersion-optimized explicit time-domain finite element method for room acoustic modeling. Acoust. Sci. Technol. 2021, 42, 270–281. [Google Scholar] [CrossRef]
  38. Scherer, P.O.J. Equation of motion. In Computational Physics: Simulation of Classical and Quantum Systems, 3rd ed.; Springer Nature: Heidelberg, Germany, 2017; pp. 306–308. [Google Scholar]
  39. Vorländer, M. Computer simulations in room acoustics: Concepts and uncertainties. J. Acoust. Soc. Am. 2013, 133, 1203–1213. [Google Scholar] [CrossRef] [PubMed]
  40. Thydal, T.; Pind, F.; Jeong, C.H.; Engsig-Karup, A.P. Experimental validation and uncertainty quantification in wave-based computational room acoustics. Appl. Acoust. 2021, 178, 107939. [Google Scholar] [CrossRef]
  41. Bilbao, S.; Hamilton, B.; Botts, J.; Savioja, L. Finite volume time domain room acoustics simulation under general impedance boundary conditions. IEEE Trans. Audio Speech Lang. Process. 2015, 24, 161–173. [Google Scholar] [CrossRef] [Green Version]
  42. Wang, H.; Hornikx, M. Time-domain impedance boundary condition modeling with the discontinuous Galerkin method for room acoustics simulations. J. Acoust. Soc. Am. 2020, 147, 2534–2546. [Google Scholar] [CrossRef]
  43. Pind, F.; Jeong, C.H.; Hesthaven, S.J.; Engsig-Karup, A.P.; Strømann-Anderson, J. A phenomenological extended-reaction boundary model for time-domain wave-based acoustic simulations under sparse reflection conditions using a wave splitting method. Appl. Acoust. 2021, 172, 107596. [Google Scholar] [CrossRef]
  44. Yoshida, T.; Okuzono, T.; Sakagami, K. Time-domain finite element formulation of porous sound absorbers based on an equivalent fluid model. Acoust. Sci. Technol. 2020, 41, 837–840. [Google Scholar] [CrossRef]
  45. Okuzono, T.; Yoshida, T.; Sakagami, K. Efficiency of room acoustic simulations with time-domain FEM including frequency-dependent absorbing boundary conditions: Comparison with frequency-domain FEM. Appl. Acoust. 2021, 182, 108212. [Google Scholar] [CrossRef]
  46. Dragna, D.; Pineau, P.; Blanc-Benon, P. A generalized recursive convolution method for time-domain propagation in porous media. J. Acoust. Soc. Am. 2015, 138, 1030–1042. [Google Scholar] [CrossRef] [Green Version]
  47. AWS ParallelCluster. Available online: https://aws.amazon.com/hpc/parallelcluster/ (accessed on 30 November 2021).
  48. Azure High-Performance Computing. Available online: https://azure.microsoft.com/en-us/solutions/high-performance-computing/ (accessed on 30 November 2021).
  49. High Performance Computing. Available online: https://cloud.google.com/solutions/hpc (accessed on 30 November 2021).
  50. Okuzono, T.; Otsuru, T.; Tomiku, R.; Okamoto, N.; Minokuchi, T. Speedup of time domain finite element sound field analysis of rooms. In Proceedings of the 37th International Congress and Exposition on Noise Control Engineering, Shanghai, China, 26–29 October 2008. [Google Scholar]
  51. López, J.J.; Carnicero, D.; Ferrando, N.; Escolano, J. Parallelization of the finite-difference time-domain method for room acoustics modelling based on CUDA. Math. Comput. Mod. 2013, 57, 1822–1831. [Google Scholar] [CrossRef]
  52. Morales, N.; Mehra, R.; Manocha, D. A parallel time-domain wave simulator based on rectangular decomposition for distributed memory architectures. Appl. Acoust. 2015, 97, 104–114. [Google Scholar] [CrossRef]
  53. Hamilton, B.; Webb, C.J.; Fletcher, N.; Bilbao, S. Finite difference room acoustics simulation with general impedance boundaries and viscothermal losses in air: Parallel implementation on multiple GPUs. In Proceedings of the International Symposium on Musical and Room Acoustics ISMRA 2016, La Plata, Argentine, 11–13 September 2016. [Google Scholar]
  54. Morales, N.; Chavda, V.; Mehra, R.; Manocha, D. MPARD: A high-frequency wave-based acoustic solver for very large compute clusters. Appl. Acoust. 2017, 121, 82–94. [Google Scholar] [CrossRef] [Green Version]
  55. Azad, H.; Siebein, G.W.; Ketabi, R. A study of diffusivity in concert halls using large scale acoustic wave-based modeling and simulation. In Proceedings of the 47th International Congress and Exposition on Noise Control Engineering, Chicago, IL, USA, 26–28 August 2018. [Google Scholar]
  56. van der Vorst, H.A.; Melissen, J. A Petrov–Galerkin type method for solving Ax=b, where A is symmetric complex. IEEE Trans. Magn. 1990, 26, 706–708. [Google Scholar] [CrossRef]
  57. Hughes, T.J.R. Algorithms for hyperbolic and parabolic–hyperbolic problems. In The Finite Element Method Linear Static and Dynamic Finite Element Analysis; Dover: New York, NY, USA, 2000; Chapter 9; pp. 490–569. [Google Scholar]
  58. Zienkiewicz, O.C.; Taylor, R.L.; Zhu, J.Z. The time dimension: Semi-discretization of field and dynamic problems. In The Finite Element Method: Its Basis and Fundamentals, 7th ed.; Butterworth–Heinemann: Oxford, UK, 2013; pp. 382–386. [Google Scholar]
  59. Yoshida, T.; Okuzono, T.; Sakagami, K. Locally implicit time-domain finite element method for sound field analysis including permeable membrane sound absorbers. Acoust. Sci. Technol. 2020, 41, 689–692. [Google Scholar] [CrossRef]
  60. Saad, Y. Krylov subspace methods, Part I. In Iterative Methods for Sparse Linear Systems, 2nd ed.; SIAM: Philadelphia, PA, USA, 2003; pp. 151–216. [Google Scholar]
  61. Miki, Y. Acoustical properties of porous materials-Modification of Delany-Bazley models. J. Acoust. Soc. Jpn. (E) 1990, 11, 19–24. [Google Scholar] [CrossRef]
  62. Allard, J.F.; Atalla, N. Acoustic impedance at normal incidence of fluids. Substitution of a fluid layer or a porous layer. In Propagation of Sound in Porous Media: Modeling Sound Absorbing Materials, 2nd ed.; John Wiley & Sons: Chichester, UK, 2009; pp. 15–27. [Google Scholar]
  63. Maa, D.-M. Microperforated-panel wideband absorbers. Noise Control. Eng. J. 1987, 29, 77–84. [Google Scholar] [CrossRef]
  64. Gustavsen, B.; Semlyen, A. Rational approximation of frequency domain responses by vector fitting. IEEE Trans. Power Deliv. 1999, 14, 1052–1061. [Google Scholar] [CrossRef] [Green Version]
  65. Gustavsen, B. Fast passivity enforcement for pole-residue models by perturbation of residue matrix eigenvalues. IEEE Trans. Power Deliv. 2008, 23, 2278–2285. [Google Scholar] [CrossRef]
  66. ISO 10534-2:1998; Acoustics—Determination of Sound Absorption Coefficient and Impedance in Impedance Tubes—Part 2: Transfer-Function Method. ISO: Geneva, Switzerland, 1998.
  67. Thompson, L.L. A review of finite-element methods for time-harmonic acoustics. J. Acoust. Soc. Am. 2009, 119, 1315–1330. [Google Scholar] [CrossRef] [Green Version]
  68. ITA-Toolbox. Open source MATLAB toolbox for acoustics developed by the Institute of Technical Acoustics of the RWTH Aachen University, Neustrasse 50, 52056, Aachen, Germany. In Proceedings of the DAGA 2017, Kiel, Germany, 6–9 March 2017. [Google Scholar]
  69. Yasuda, Y.; Ushiyama, A.; Sakamoto, S.; Tachibana, H. Experimental and numerical studies on reverberation characteristics in a rectangular room with unevenly distributed absorbers. Acoust. Sci. Technol. 2006, 27, 366–374. [Google Scholar] [CrossRef] [Green Version]
  70. ISO 3382-1:2009; Acoustics—Measurement of Room Acoustic Parameters—Part 1: Performance Spaces. ISO: Geneva, Switzerland, 2009.
  71. Bradley, J.S.; Reich, R.; Norcross, S.G. A just noticeable difference in C50 for speech. Appl. Acoust. 1999, 58, 99–108. [Google Scholar] [CrossRef]
  72. Karypis, G.; Kumar, V. A fast and highly quality multilevel scheme for partitioning irregular graphs. SIAM J. Sci. Comput. 1999, 20, 359–392. [Google Scholar] [CrossRef]
Figure 1. Dispersion errors of 4th-E and Opt-E TD-FEMs compared to 4th-I and 2nd-I TD-FEMs. The comparison is made as a function of the spatial resolution. Opt-E TD-FEMs use four optimized conditions in which the dispersion error is minimized at different spatial resolutions.
Buildings 12 00105 g001
Figure 2. Impedance tube model with a frequency-dependent impedance boundary.
Buildings 12 00105 g002
Figure 3. Modulated Gaussian pulse used as a source signal: (a) waveform of volume acceleration and (b) spectrum characteristic.
Buildings 12 00105 g003
Figure 4. Comparisons of normal incidence absorption coefficient (Left column) and surface impedance (Right column) among the theory, the fitted rational model and the 4th-E TD-FEM for (a) GW, (b) NF, and (c) MPP-GW.
Buildings 12 00105 g004
Figure 5. Analyzed cubic room of 1 m 3 , where the colored surfaces are, respectively, assigned frequency-dependent impedance of GW (red), NF (blue), and MPP-GW (green).
Buildings 12 00105 g005
Figure 6. Comparisons of mean SPLs between the FD-FEM and the 4th-E TD-FEM with convergence tolerance of 10 4 for (a) Case 1 and (b) Case 2, where the values in parentheses following TD-FEM represent the convergence tolerance for CR method.
Buildings 12 00105 g006
Figure 7. Comparisons of SPL spectra at receiver (x, y, z) = (0.6, 0.5, 0.5): (a) the reference solution vs. the Opt-E TD-FEM (optimized at R = 6.25), (b) the reference solution vs. the 4th-E TD-FEM, (c) the reference solution vs. the 4th-I TD-FEM, and (d) the reference solution vs. the 2nd-I TD-FEM.
Buildings 12 00105 g007
Figure 8. Comparisons of SPL spectra above 1.8 kHz at receiver (x, y, z) = (0.6, 0.5, 0.5): (a) the reference solution vs. Opt-E TD-FEM (optimized at R = 6.87) and (b) the reference solution vs. Opt-E TD-FEM (optimized at R = 6.25), (c) the reference solution vs. Opt-E TD-FEM (optimized at R = 5.5) and (d) the reference solution vs. Opt-E TD-FEM (optimized at R = 4.91).
Buildings 12 00105 g008
Figure 9. Analyzed auditorium model of 2271 m 3 : (Left) dimension and (Right) setting of boundary conditions where non-colored surfaces are reflective with frequency-independent impedance and where colored surfaces are absorptive with frequency-dependent impedance of GW (red, yellow), NF (blue), and MPP-GW (green), in which yellow surfaces are assigned absorption properties only in Cond. 2. The yellow surface size is 1.74 m × 1.2 m (x×z).
Buildings 12 00105 g009
Figure 10. Decomposed auditorium model with 256 subdomains.
Buildings 12 00105 g010
Figure 11. Distribution of workload on each subdomain. Blue line: DOF; Pink line: number of communication data per communication.
Buildings 12 00105 g011
Figure 12. Visualized z x plane (y = 0) sound fields at (a) 5 ms, (b) 12.5 ms, (c) 20 ms, and (d) 27.5 ms.
Buildings 12 00105 g012
Figure 13. Calculated results at receiver R13 in Cond. 1 (Left) and Cond. 2 (Right): (a) IRs and (b) EDCs.
Buildings 12 00105 g013
Figure 14. Comparisons of room acoustic parameters for Cond. 1 and Cond. 2: (a) T 30 , (b) E D T , (c) C 50 , and (d) G.
Buildings 12 00105 g014
Table 1. Comparison of C C values among various TD-FEMs.
Method4th-EOpt-E (R = 6.874)Opt-E (R = 6.25)Opt-E (R = 5.5)
C C 0.8430.9380.9450.918
MethodOpt-E ( r = 4.91)4th-I2nd-I
C C 0.8350.9640.802
Table 2. Comparison of e E D T (%) among various TD-FEMs.
MethodFrequency, kHz
11.251.622.5
4th-E1.031.171.334.407.26
Opt-E (R = 6.874)1.211.470.771.256.02
Opt-E (R = 6.25)1.531.760.961.264.05
Opt-E (R = 5.5)1.882.271.321.473.39
Opt-E (R = 4.91)2.583.321.862.725.41
4th-I1.301.491.102.369.98
2nd-I3.154.631.883.7210.26
Table 3. Comparison of e C (dB) among various TD-FEMs.
MethodFrequency, kHz
11.251.622.5
4th-E0.040.060.290.651.66
Opt-E (R = 6.874)0.100.190.260.391.26
Opt-E (R = 6.25)0.120.220.260.401.00
Opt-E (R = 5.5)0.160.260.250.540.47
Opt-E (R = 4.91)0.190.320.290.670.76
4th-I0.090.160.320.671.68
2nd-I0.170.330.440.611.63
Table 4. Mean numbers of iterations for explicit TD-FEMs.
Method4th-EOpt-E (R = 6.874)Opt-E (R = 6.25)
Mean iteration3.773.763.76
MethodOpt-E ( r = 5.5)Opt-E ( r = 4.91)
Mean iteration3.763.76
Table 5. Locations of receivers in the auditorium model.
Receiver(x, y, z)Receiver(x, y, z)
R1(8.07, 0, 0.9)R8(13.3, 4.6, 2.7)
R2(8.07, 4.6, 0.9)R9(15.0, 0, 3.3)
R3(9.81, 0, 1.5)R10(15.0, 4.6, 3.3)
R4(9.81, 4.6, 1.5)R11(16.8, 0, 3.9)
R5(11.6, 0, 2.1)R12(16.8, 4.6, 3.9)
R6(11.6, 4.6, 2.1)R13(18.5, 0, 4.5)
R7(13.3, 0, 2.7)R14(18.5, 4.6, 4.5)
Publisher’s Note: MDPI stays neutral with regard to jurisdictional claims in published maps and institutional affiliations.