
Shaking Table Test of a Base-Isolated Frame Structure under Near-Fault Ground Motions


Abstract
:1. Introduction
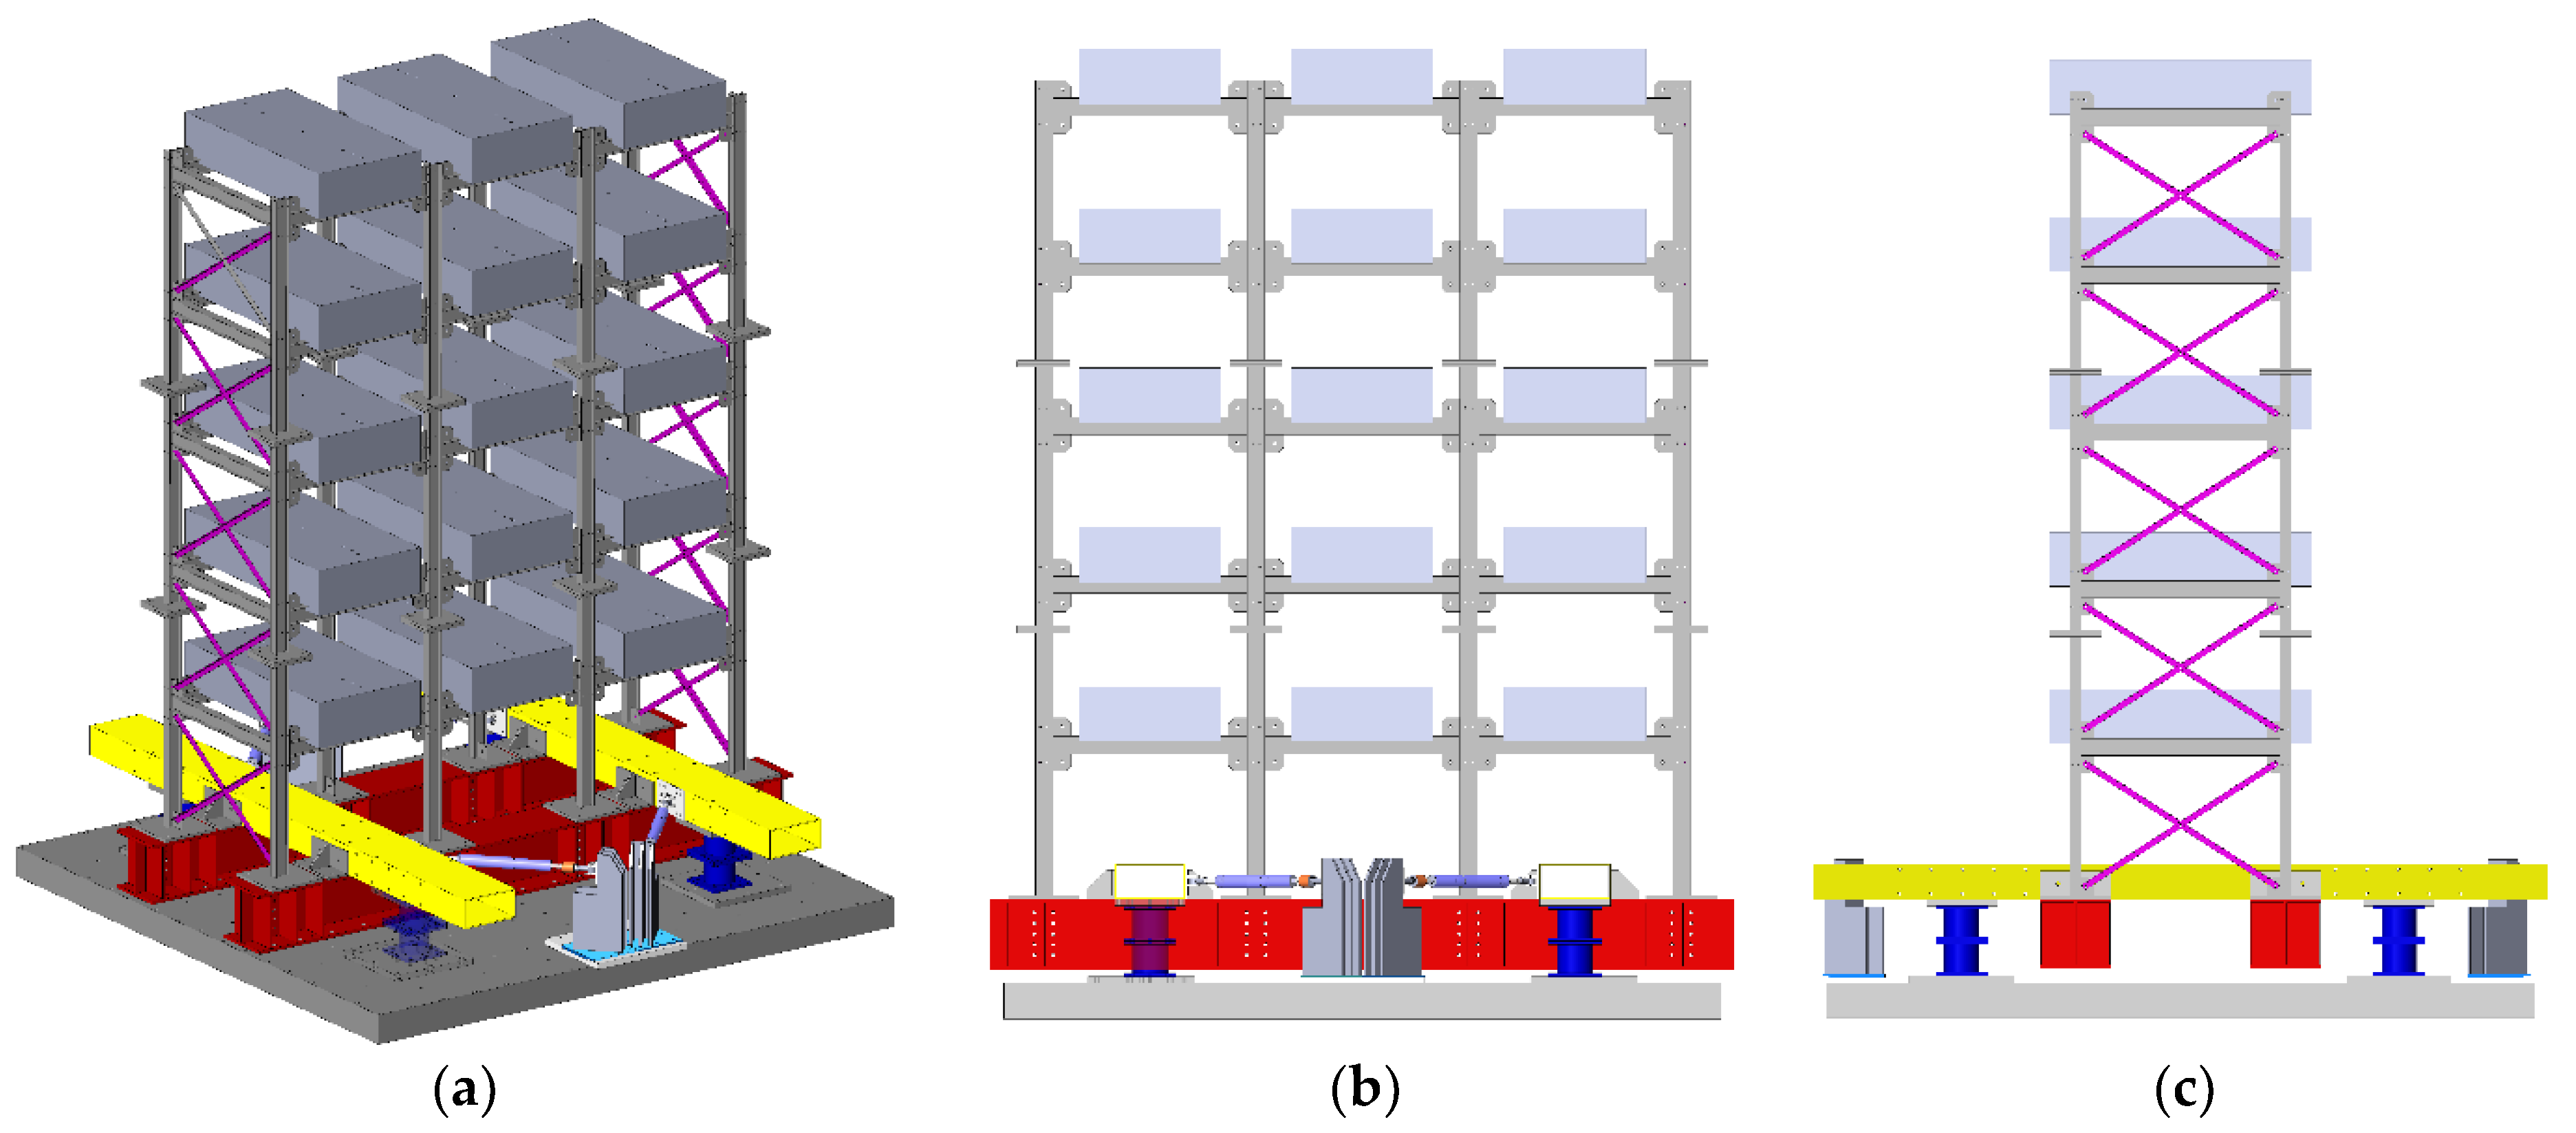
2. Shaking Table Test Model
2.1. Structural Model
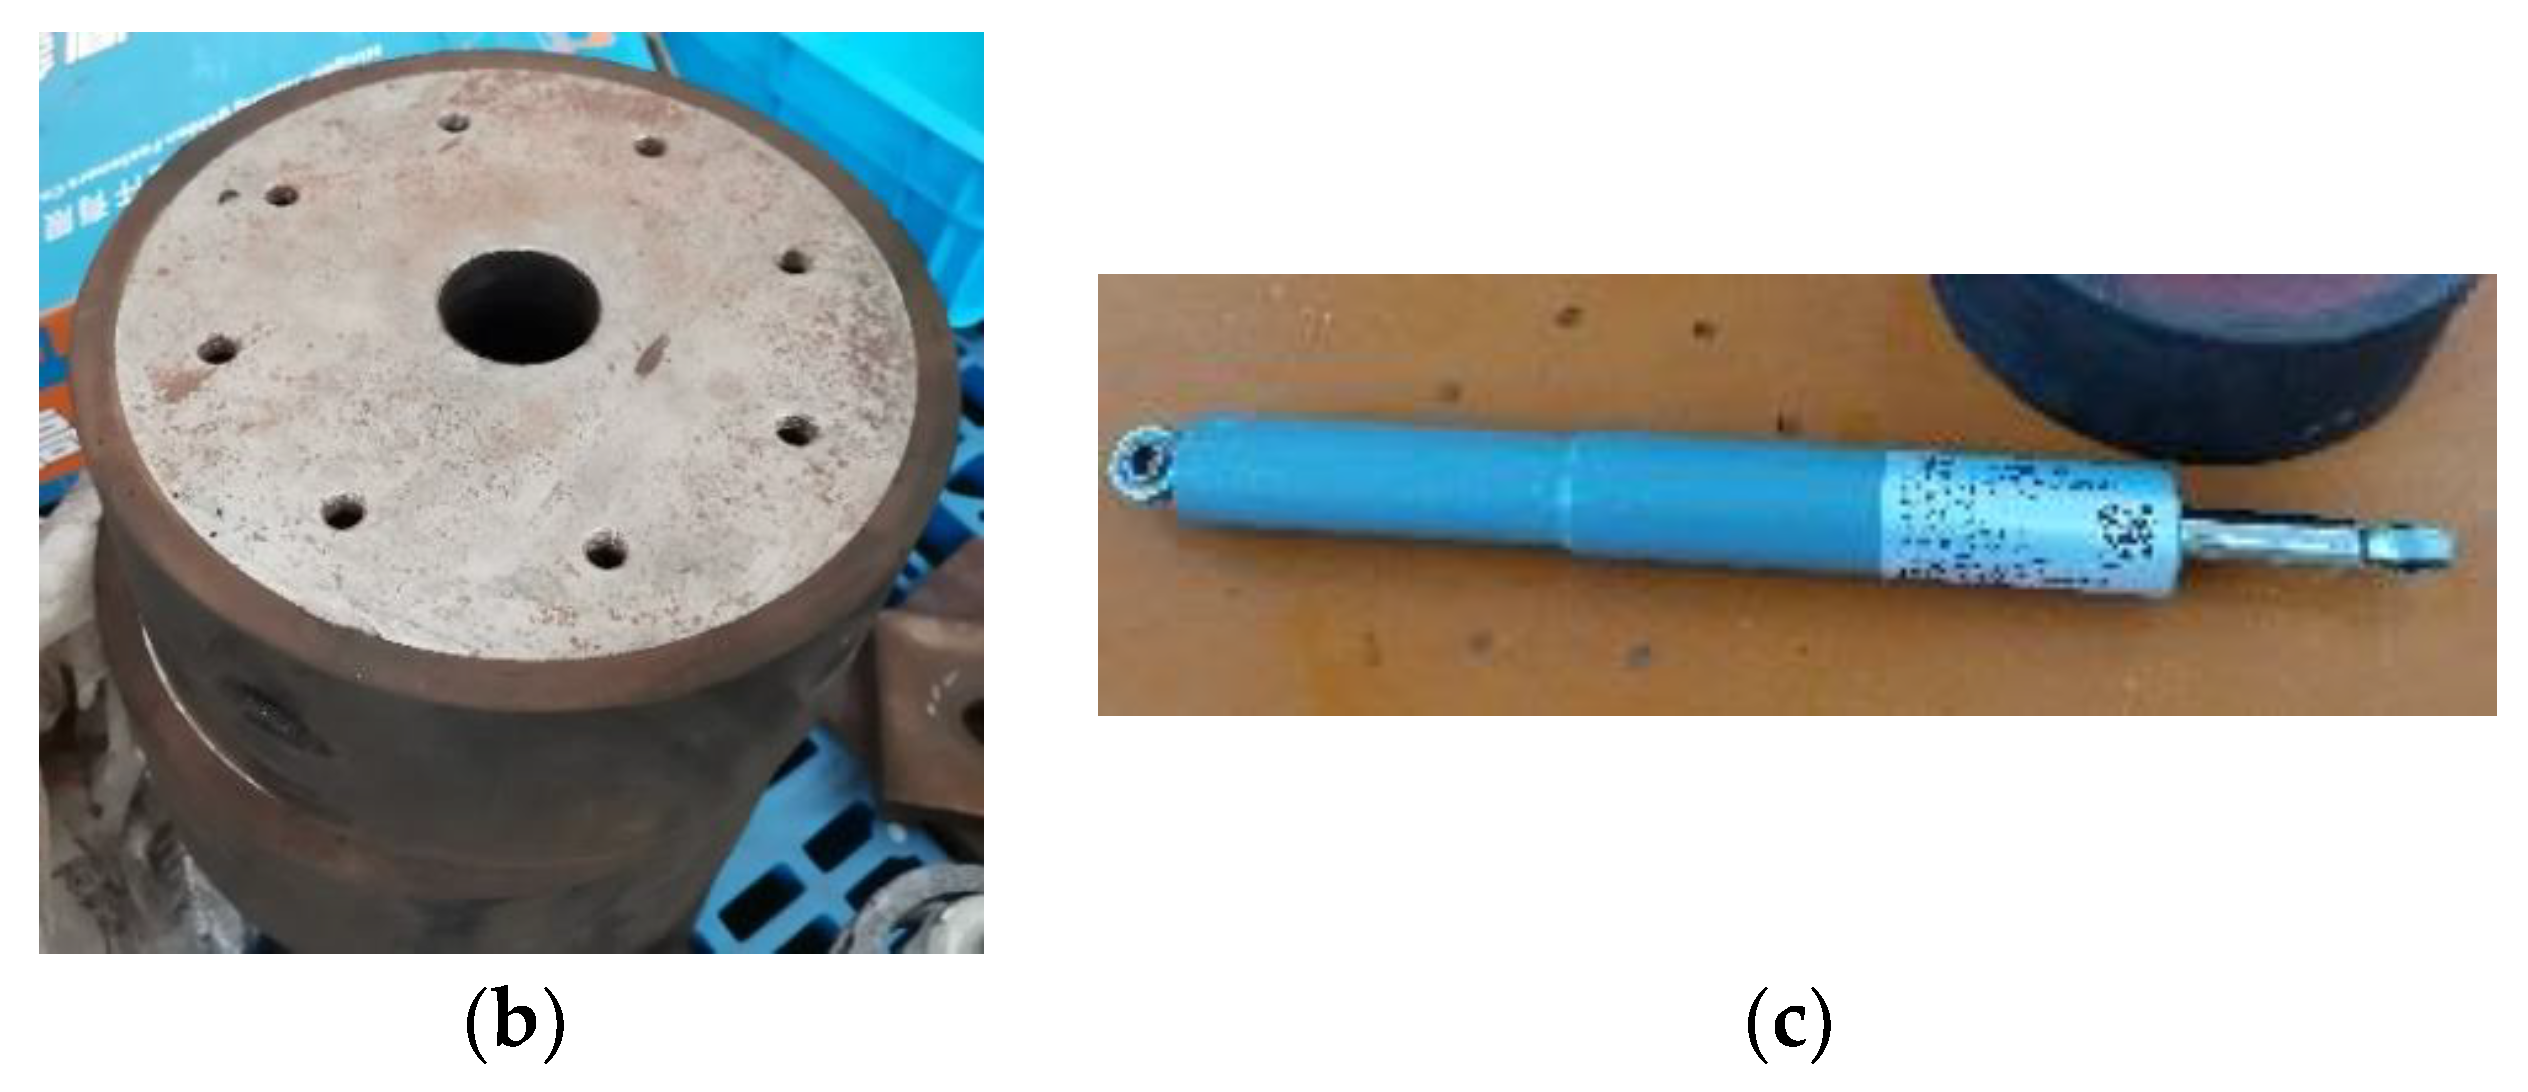
2.2. Base-Isolation Systems
3. Test Program and Sensor Set-Up
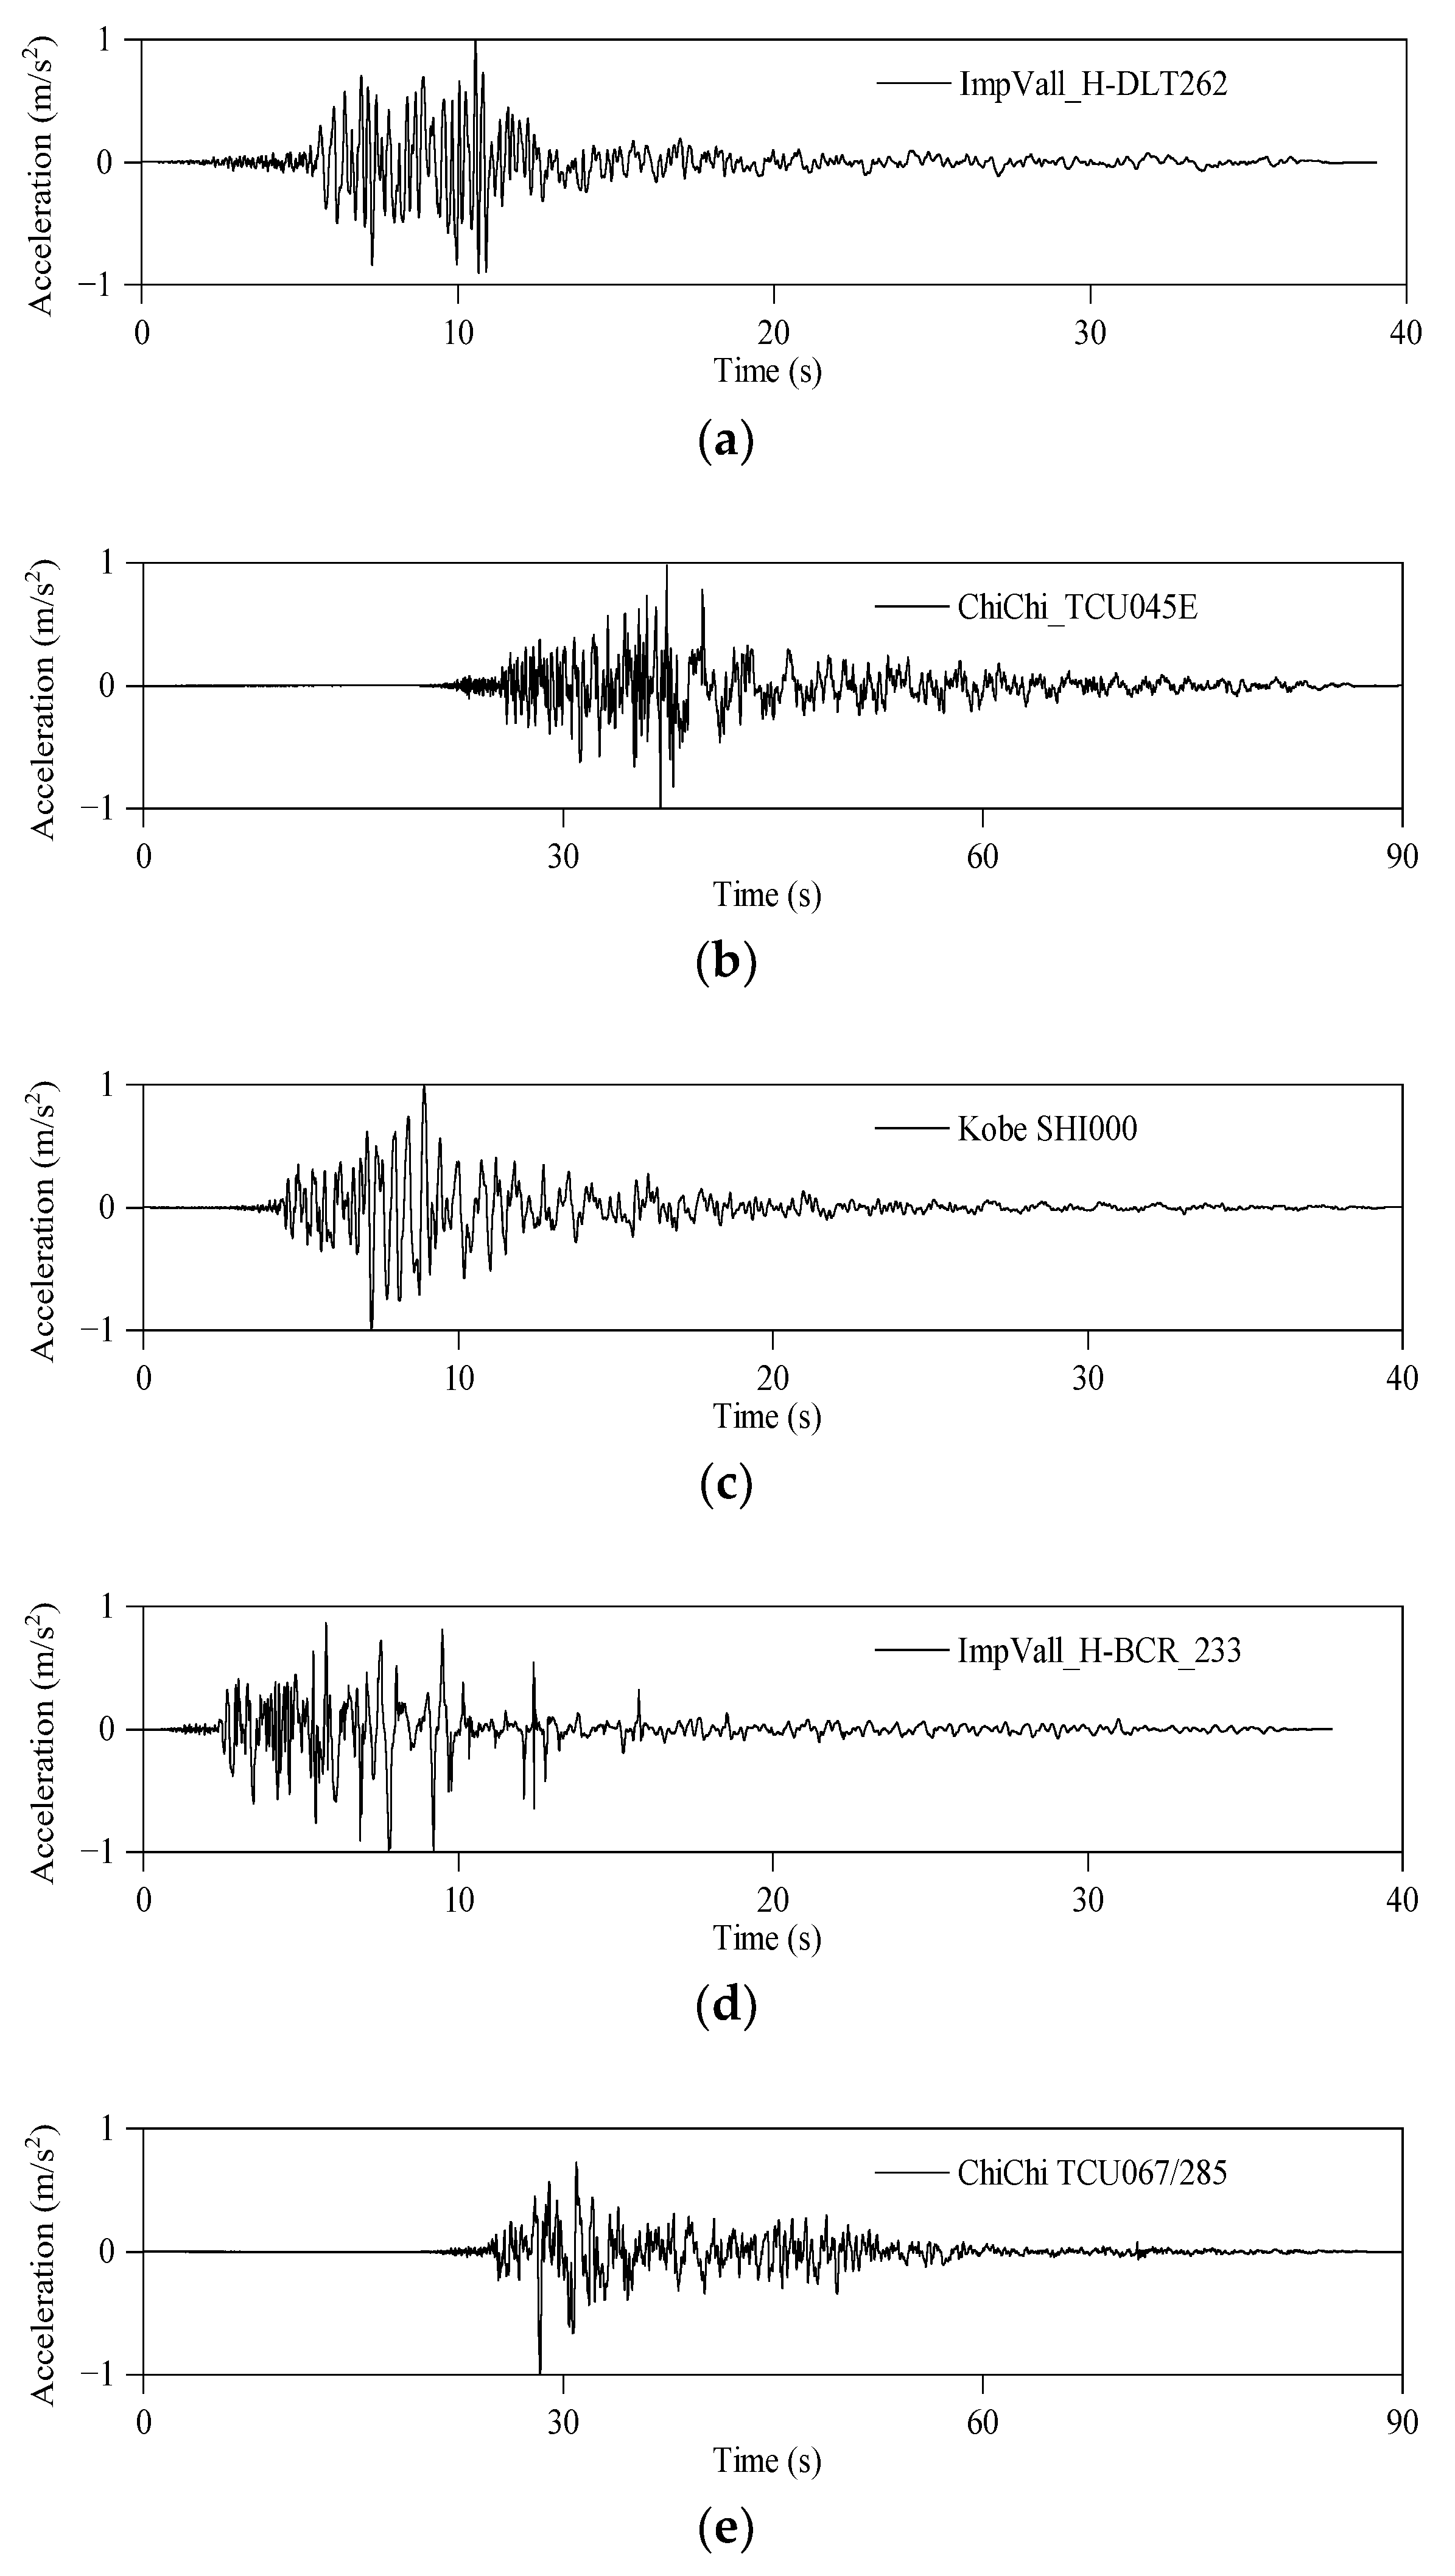
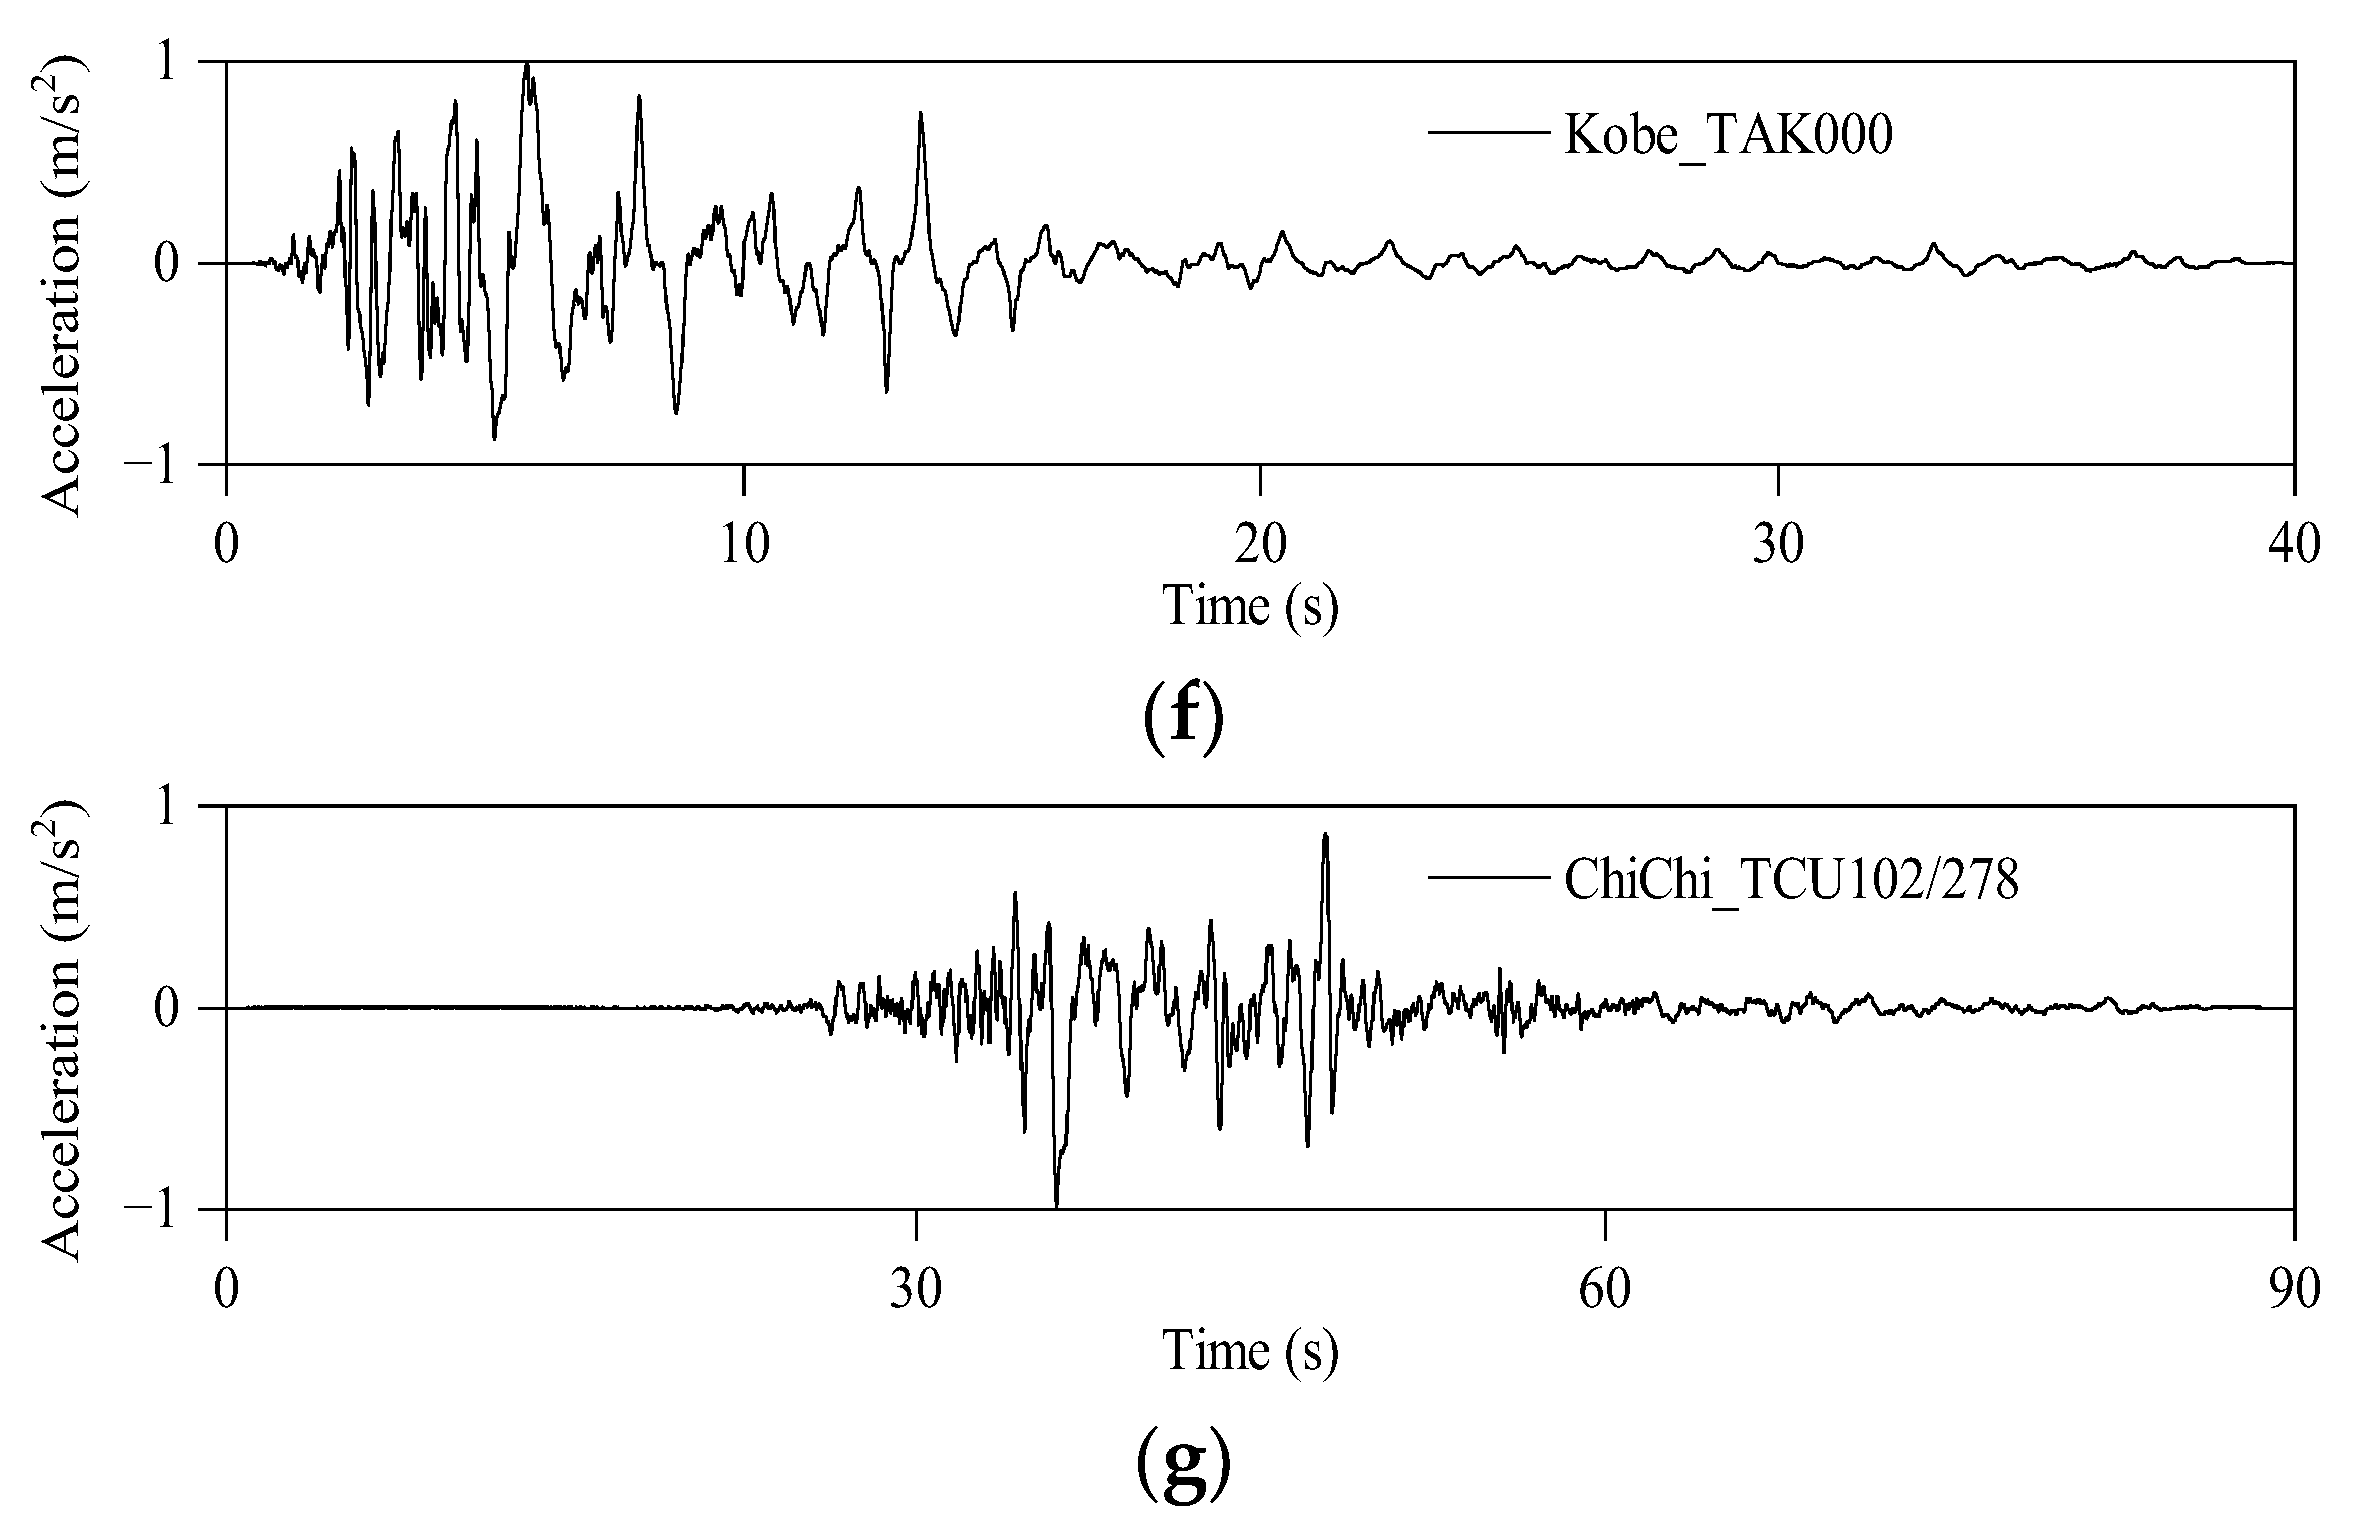
3.1. Input Ground Motions
3.2. Test Program
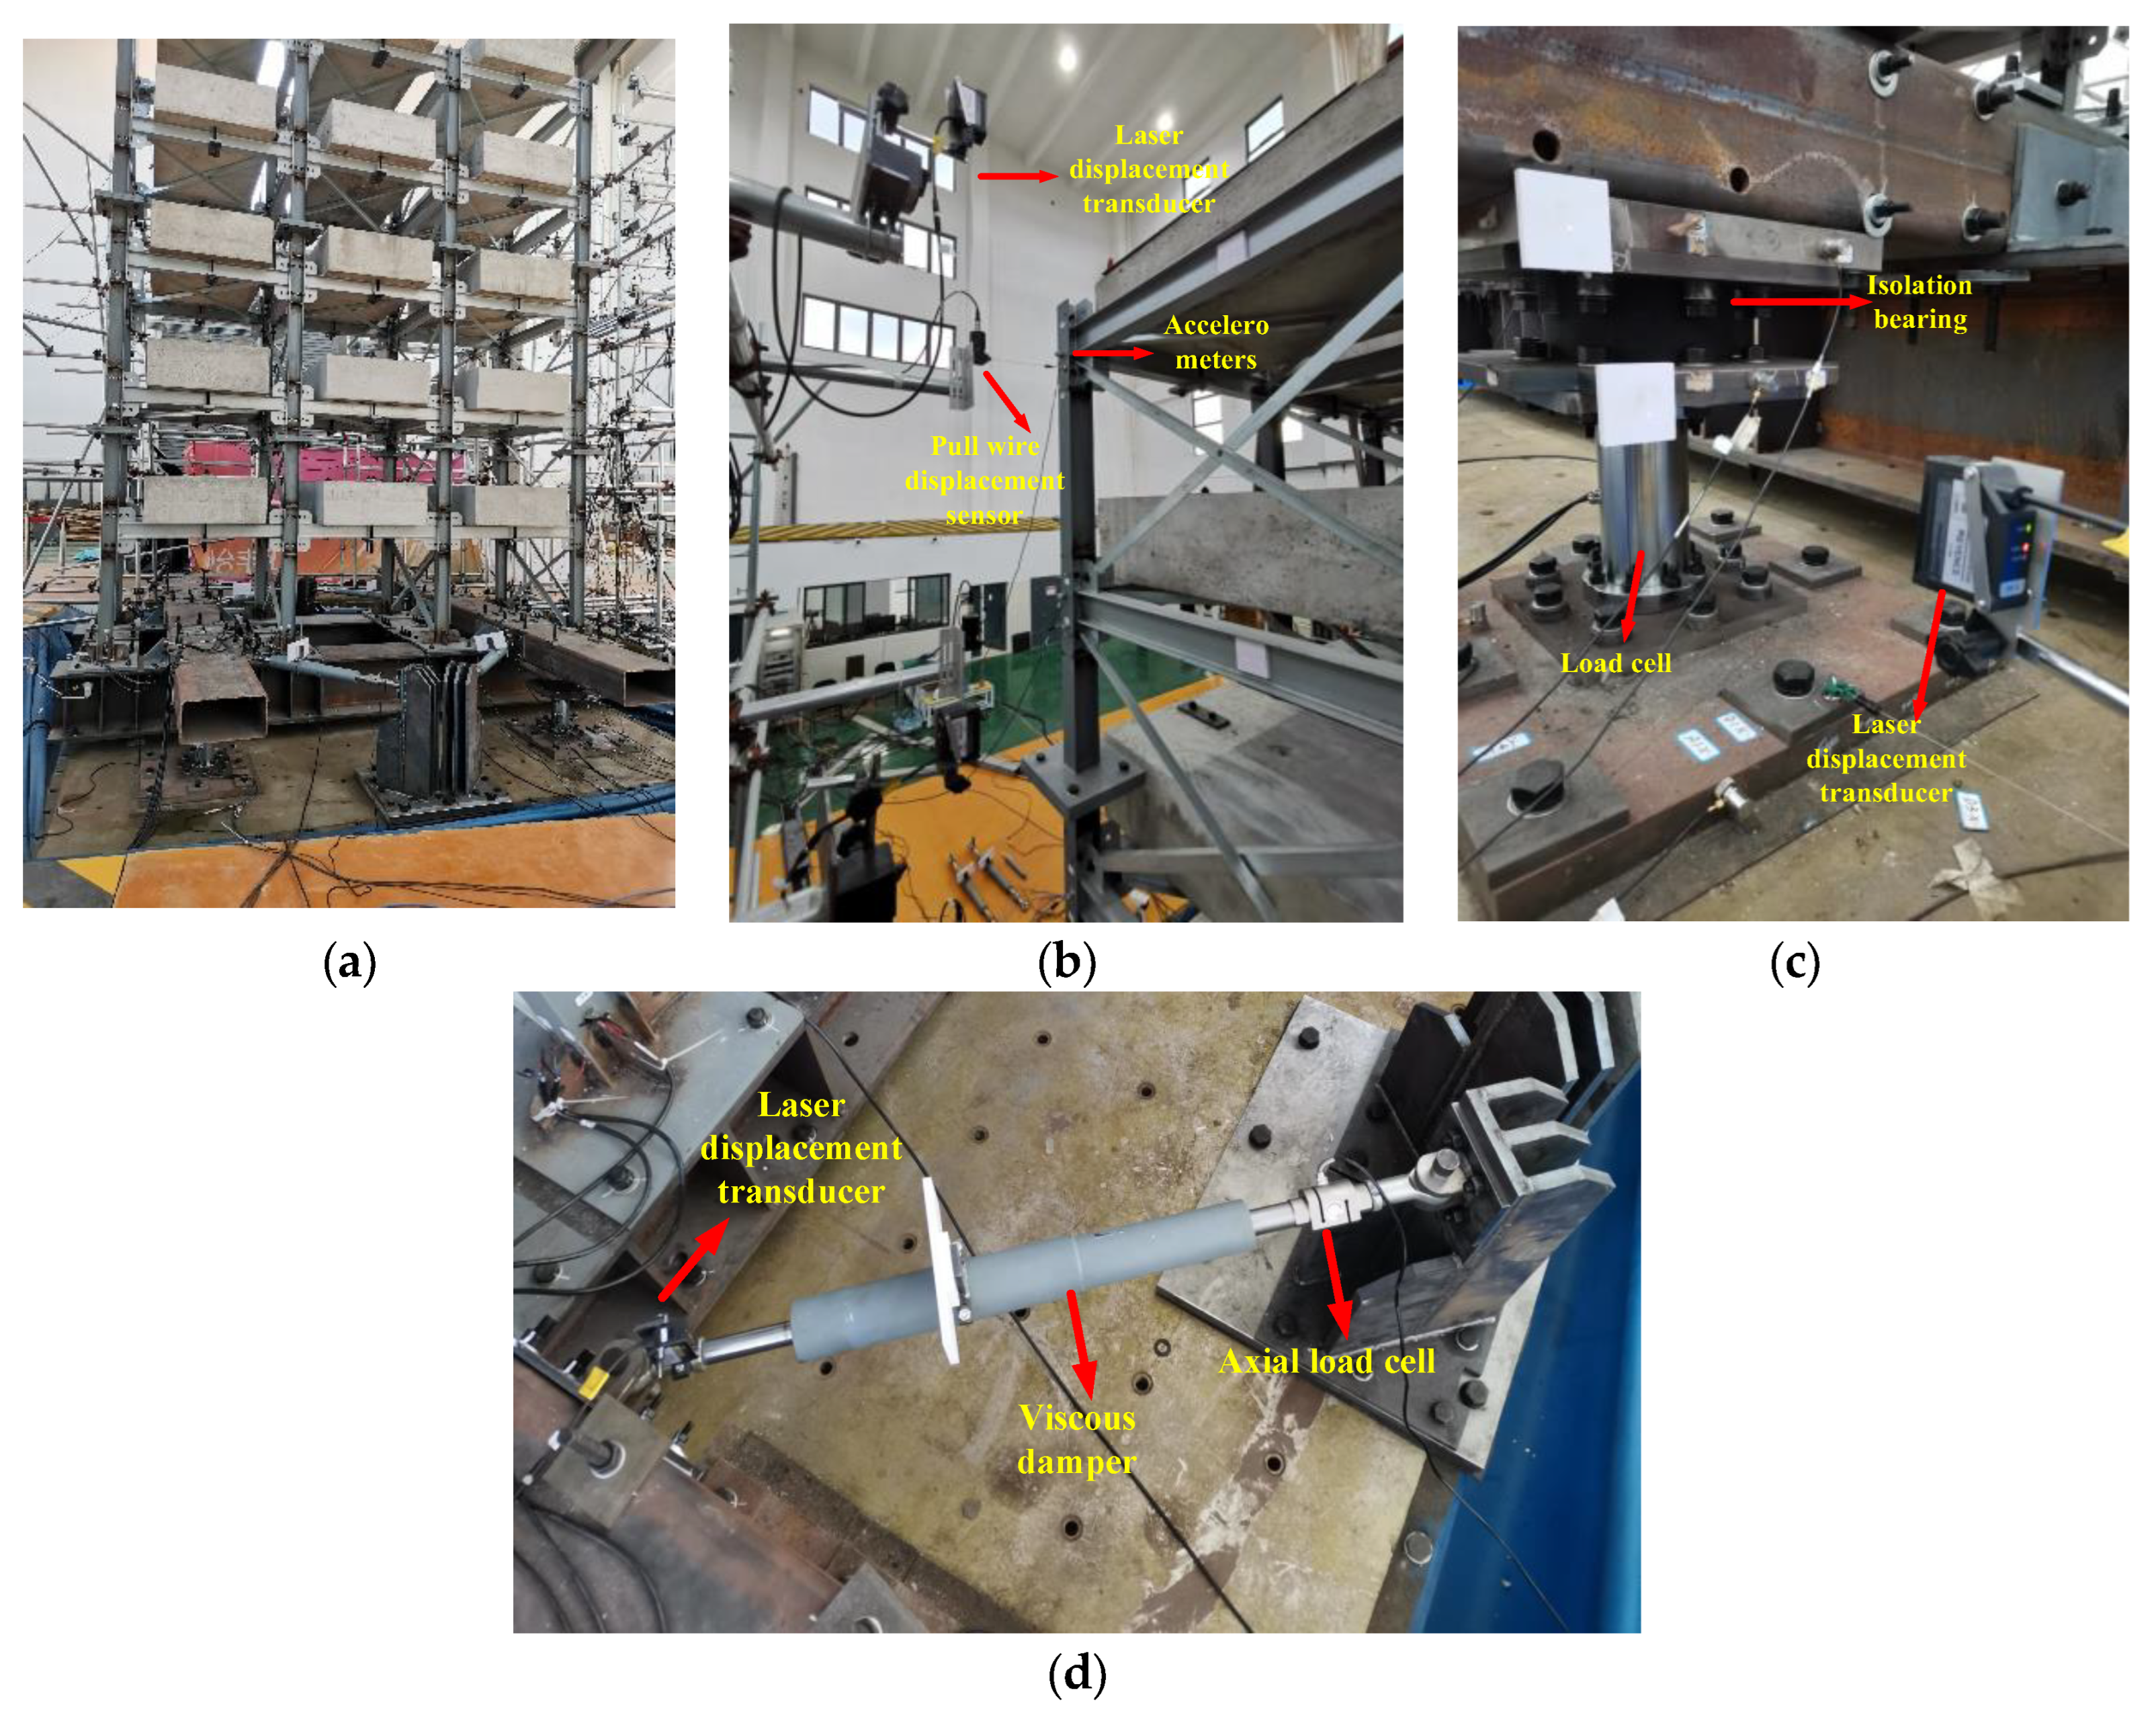
3.3. Sensor Set-Up
4. Shaking Table Test Results
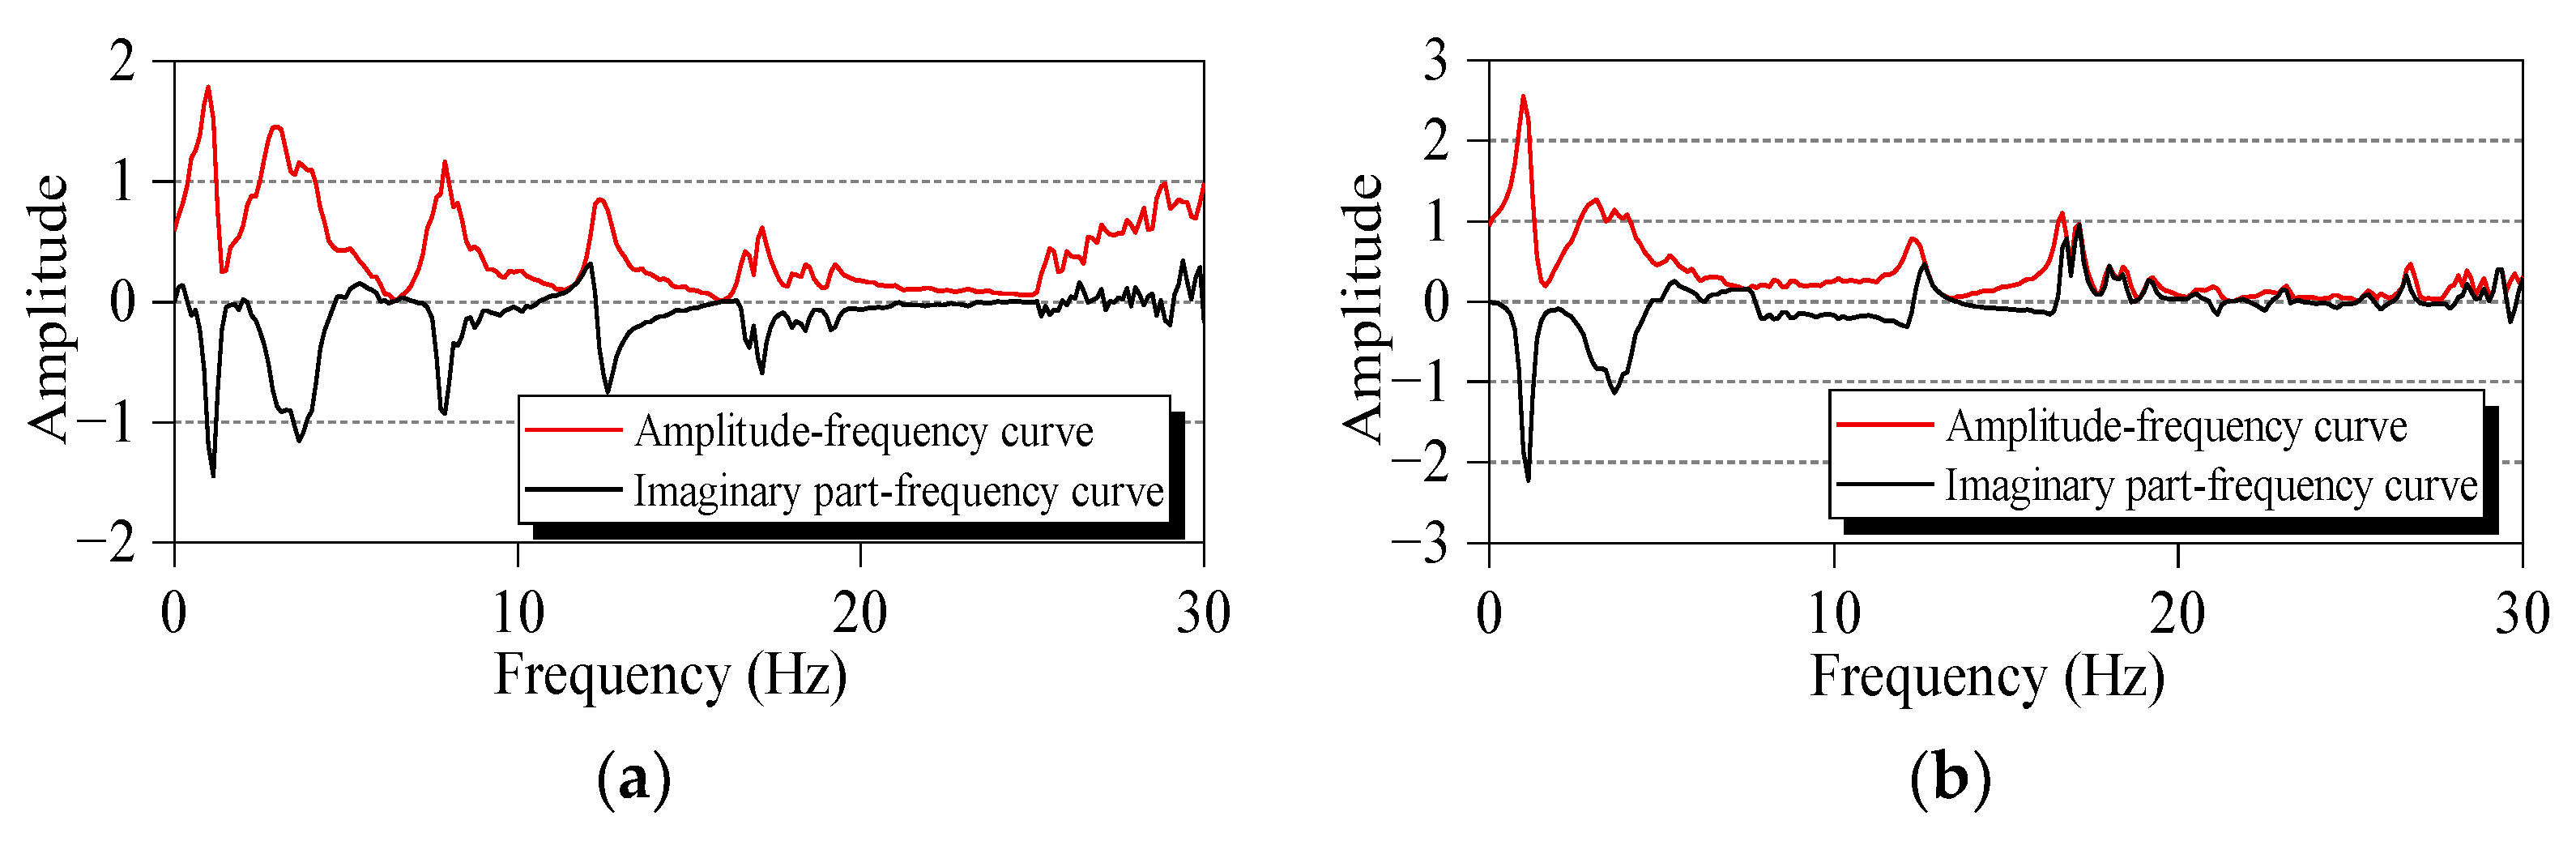
4.1. Dynamic Modes
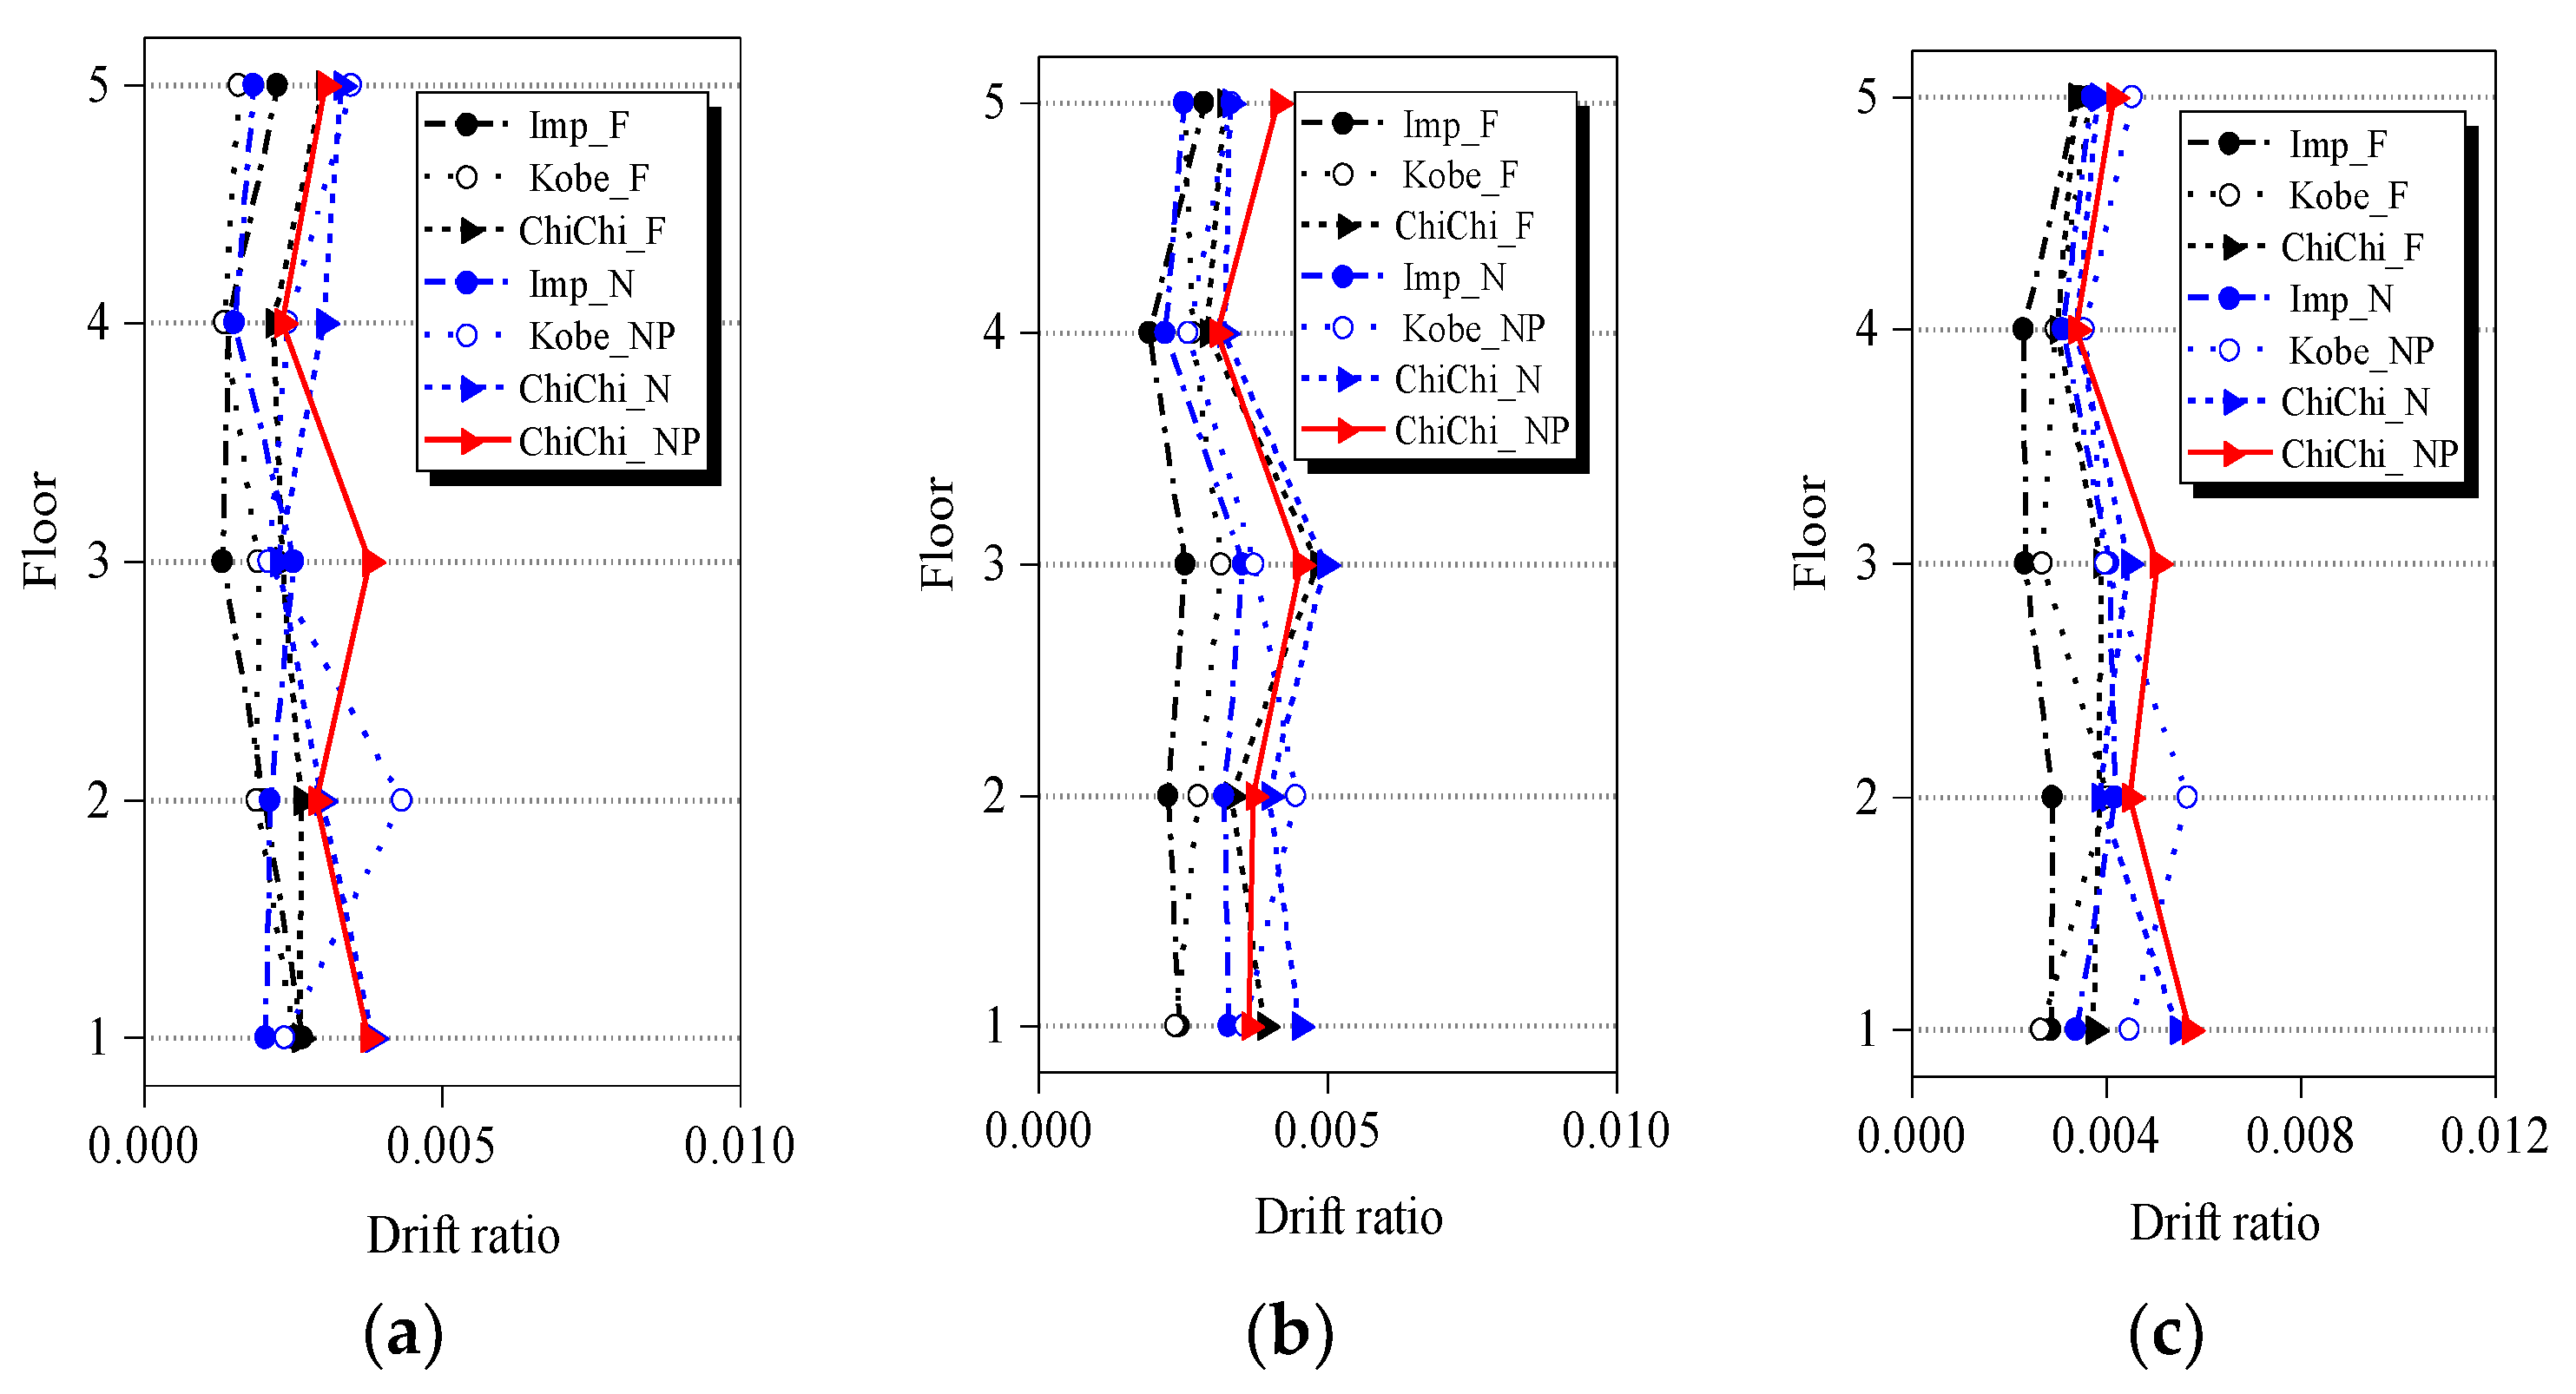
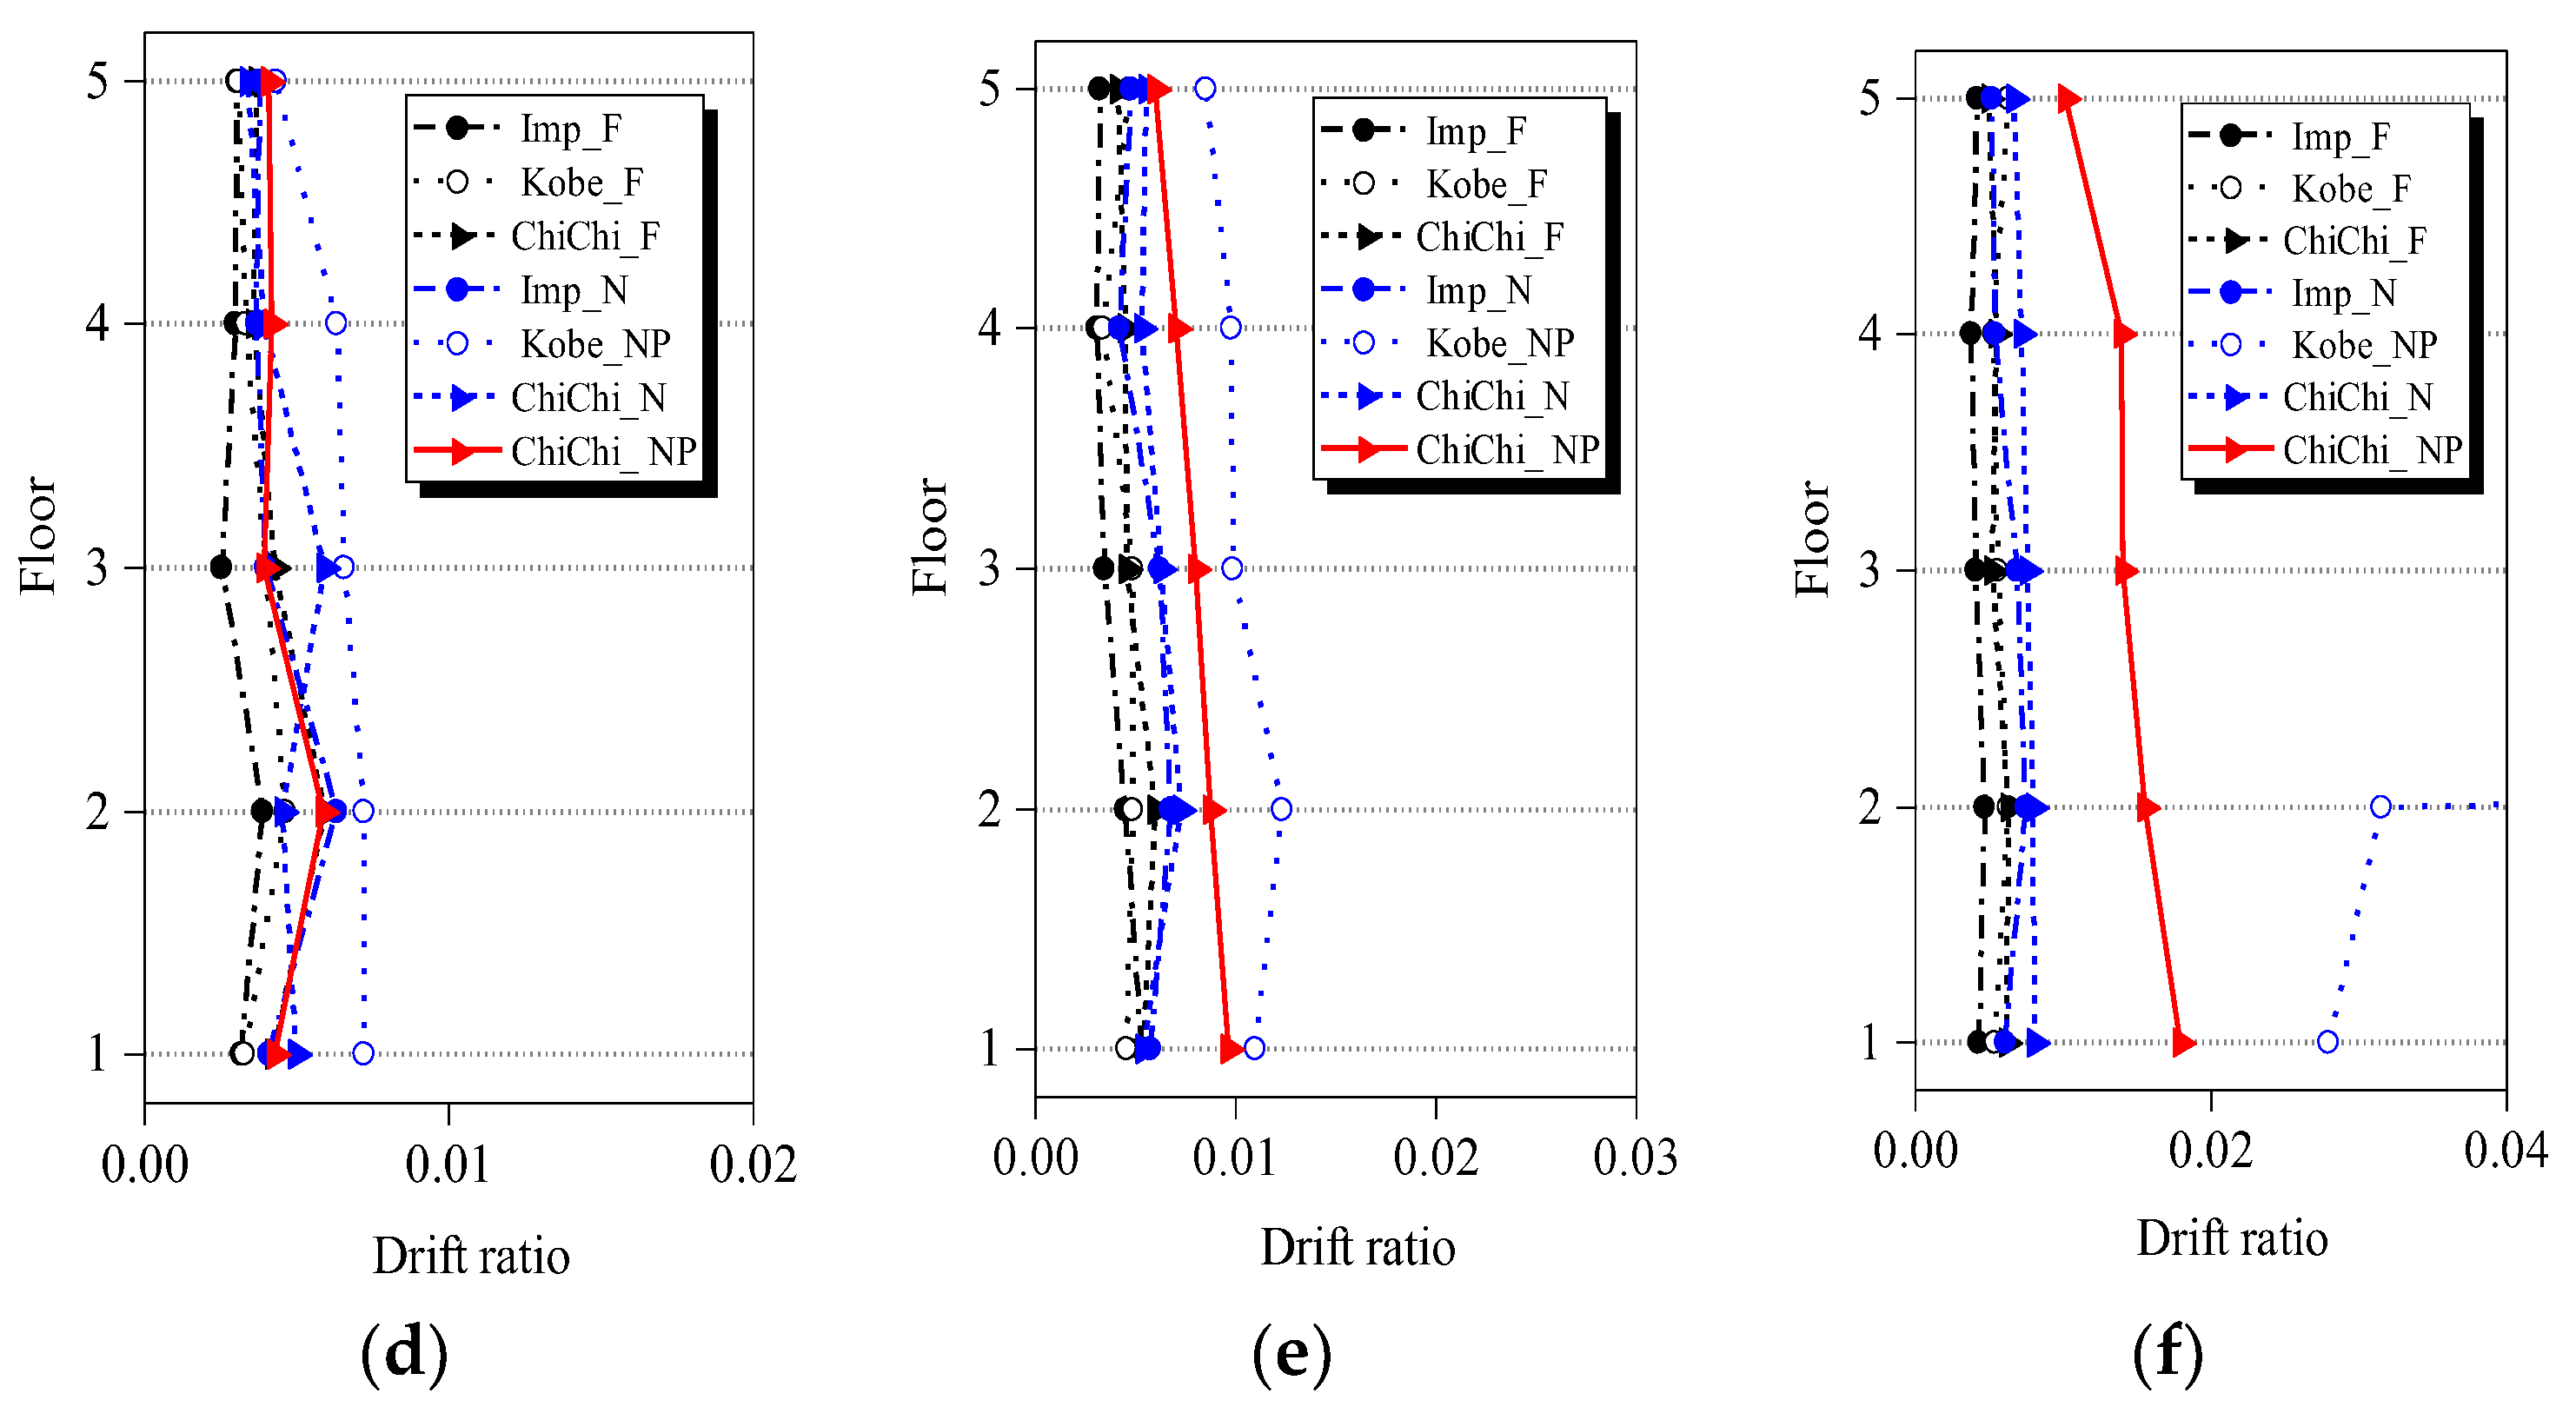
4.2. Seismic Responses of the Frame Structures
4.3. Performance Evaluation of the Isolation System under Earthquakes
5. Conclusions
- 1.
- NF ground motions caused larger inter-story drifts than FF ground motions, especially when the input PGA exceeded 0.4 g. The Kobe_NP NF ground motion with pulse period Tp neighboring the fundamental period of the isolated structure caused the largest inter-story drift and floor acceleration of the superstructure.
- 2.
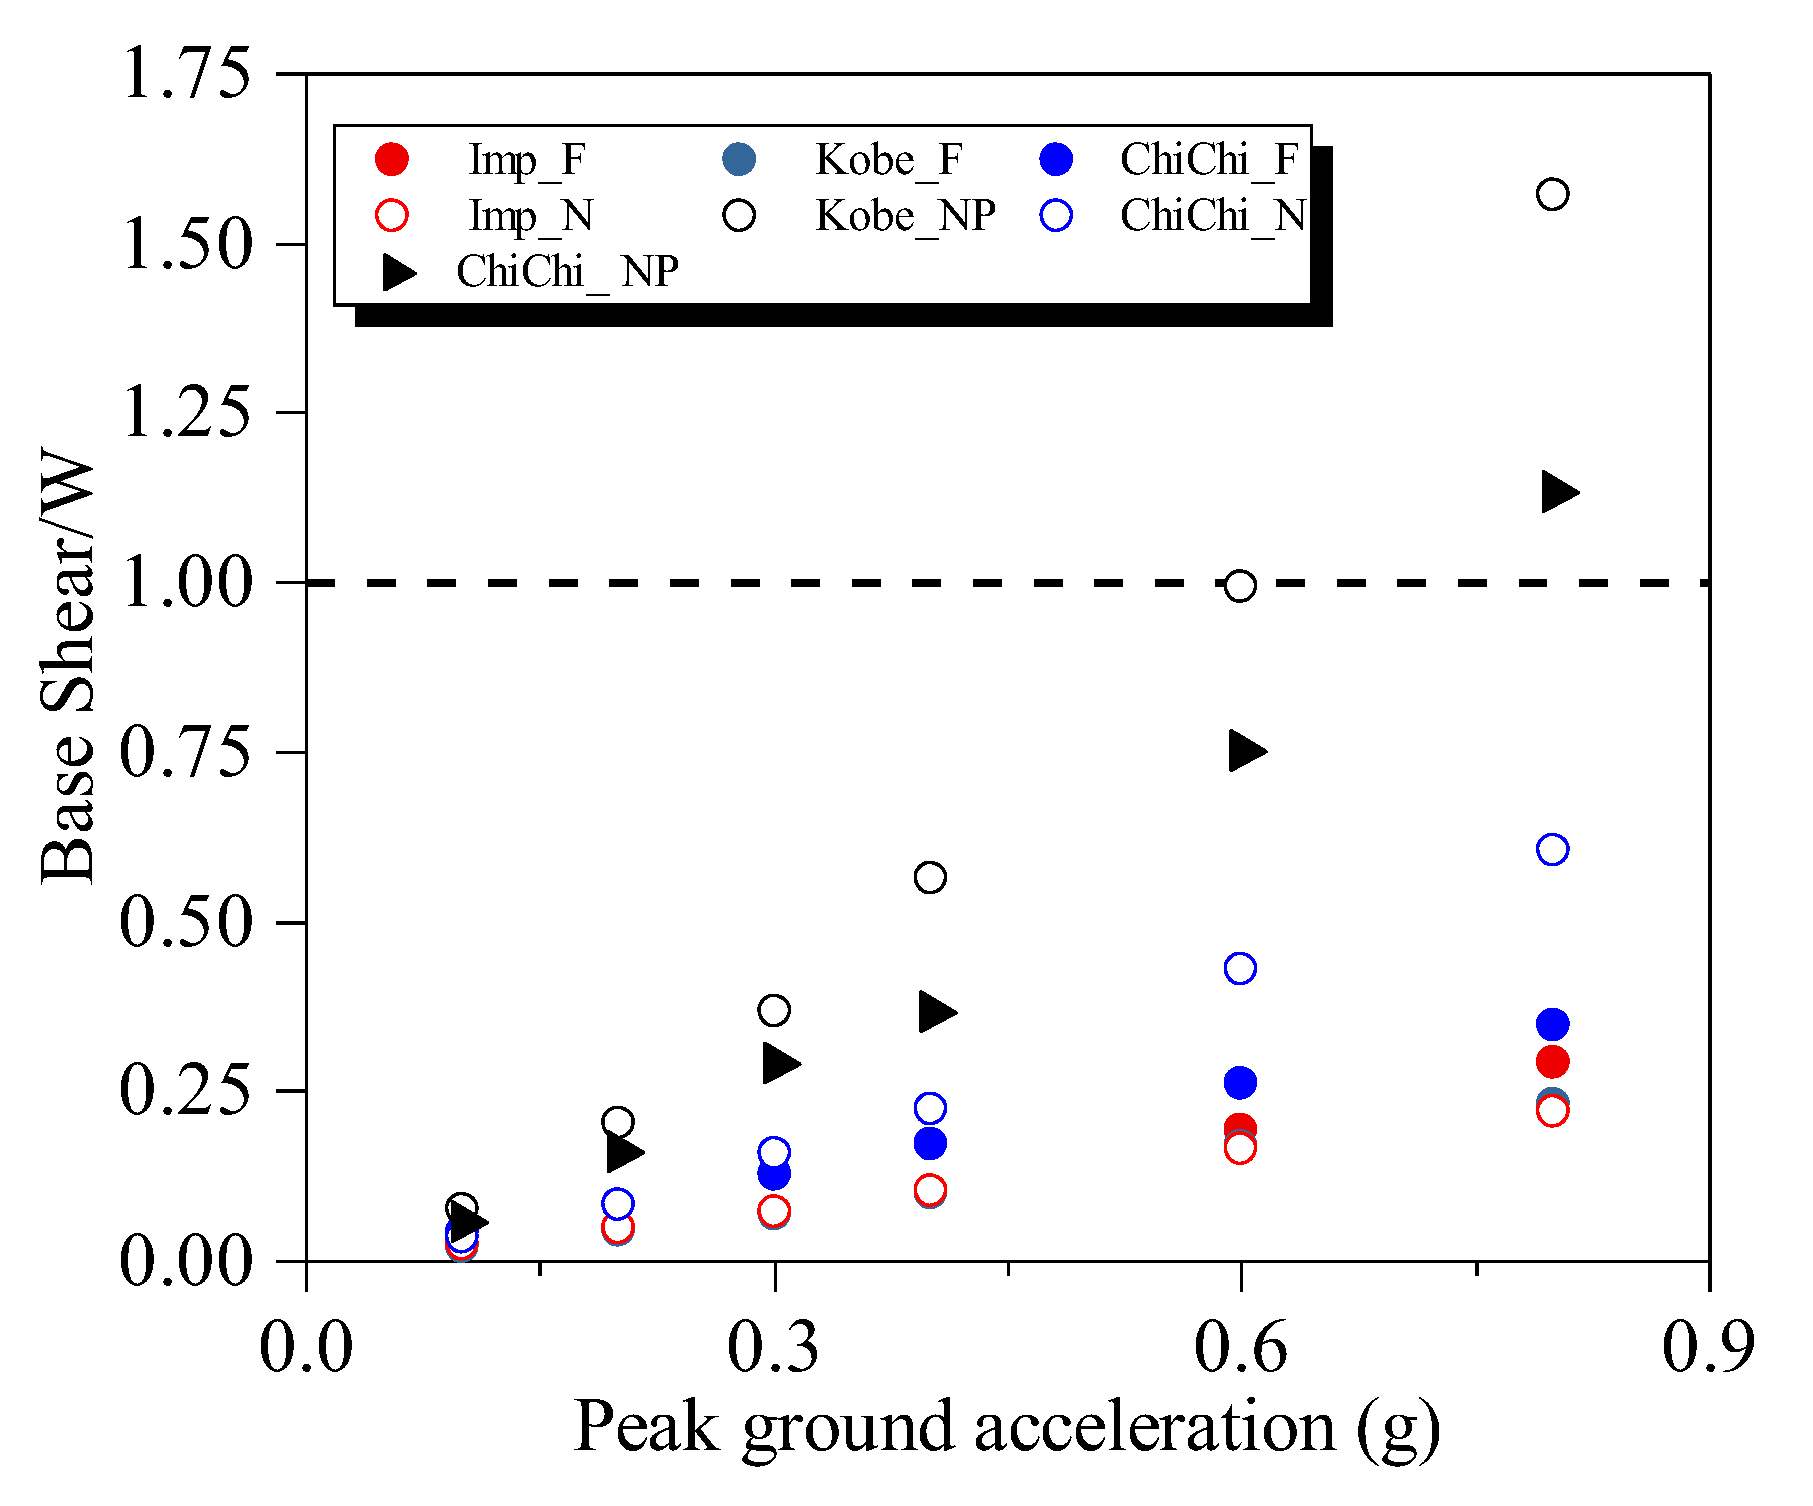
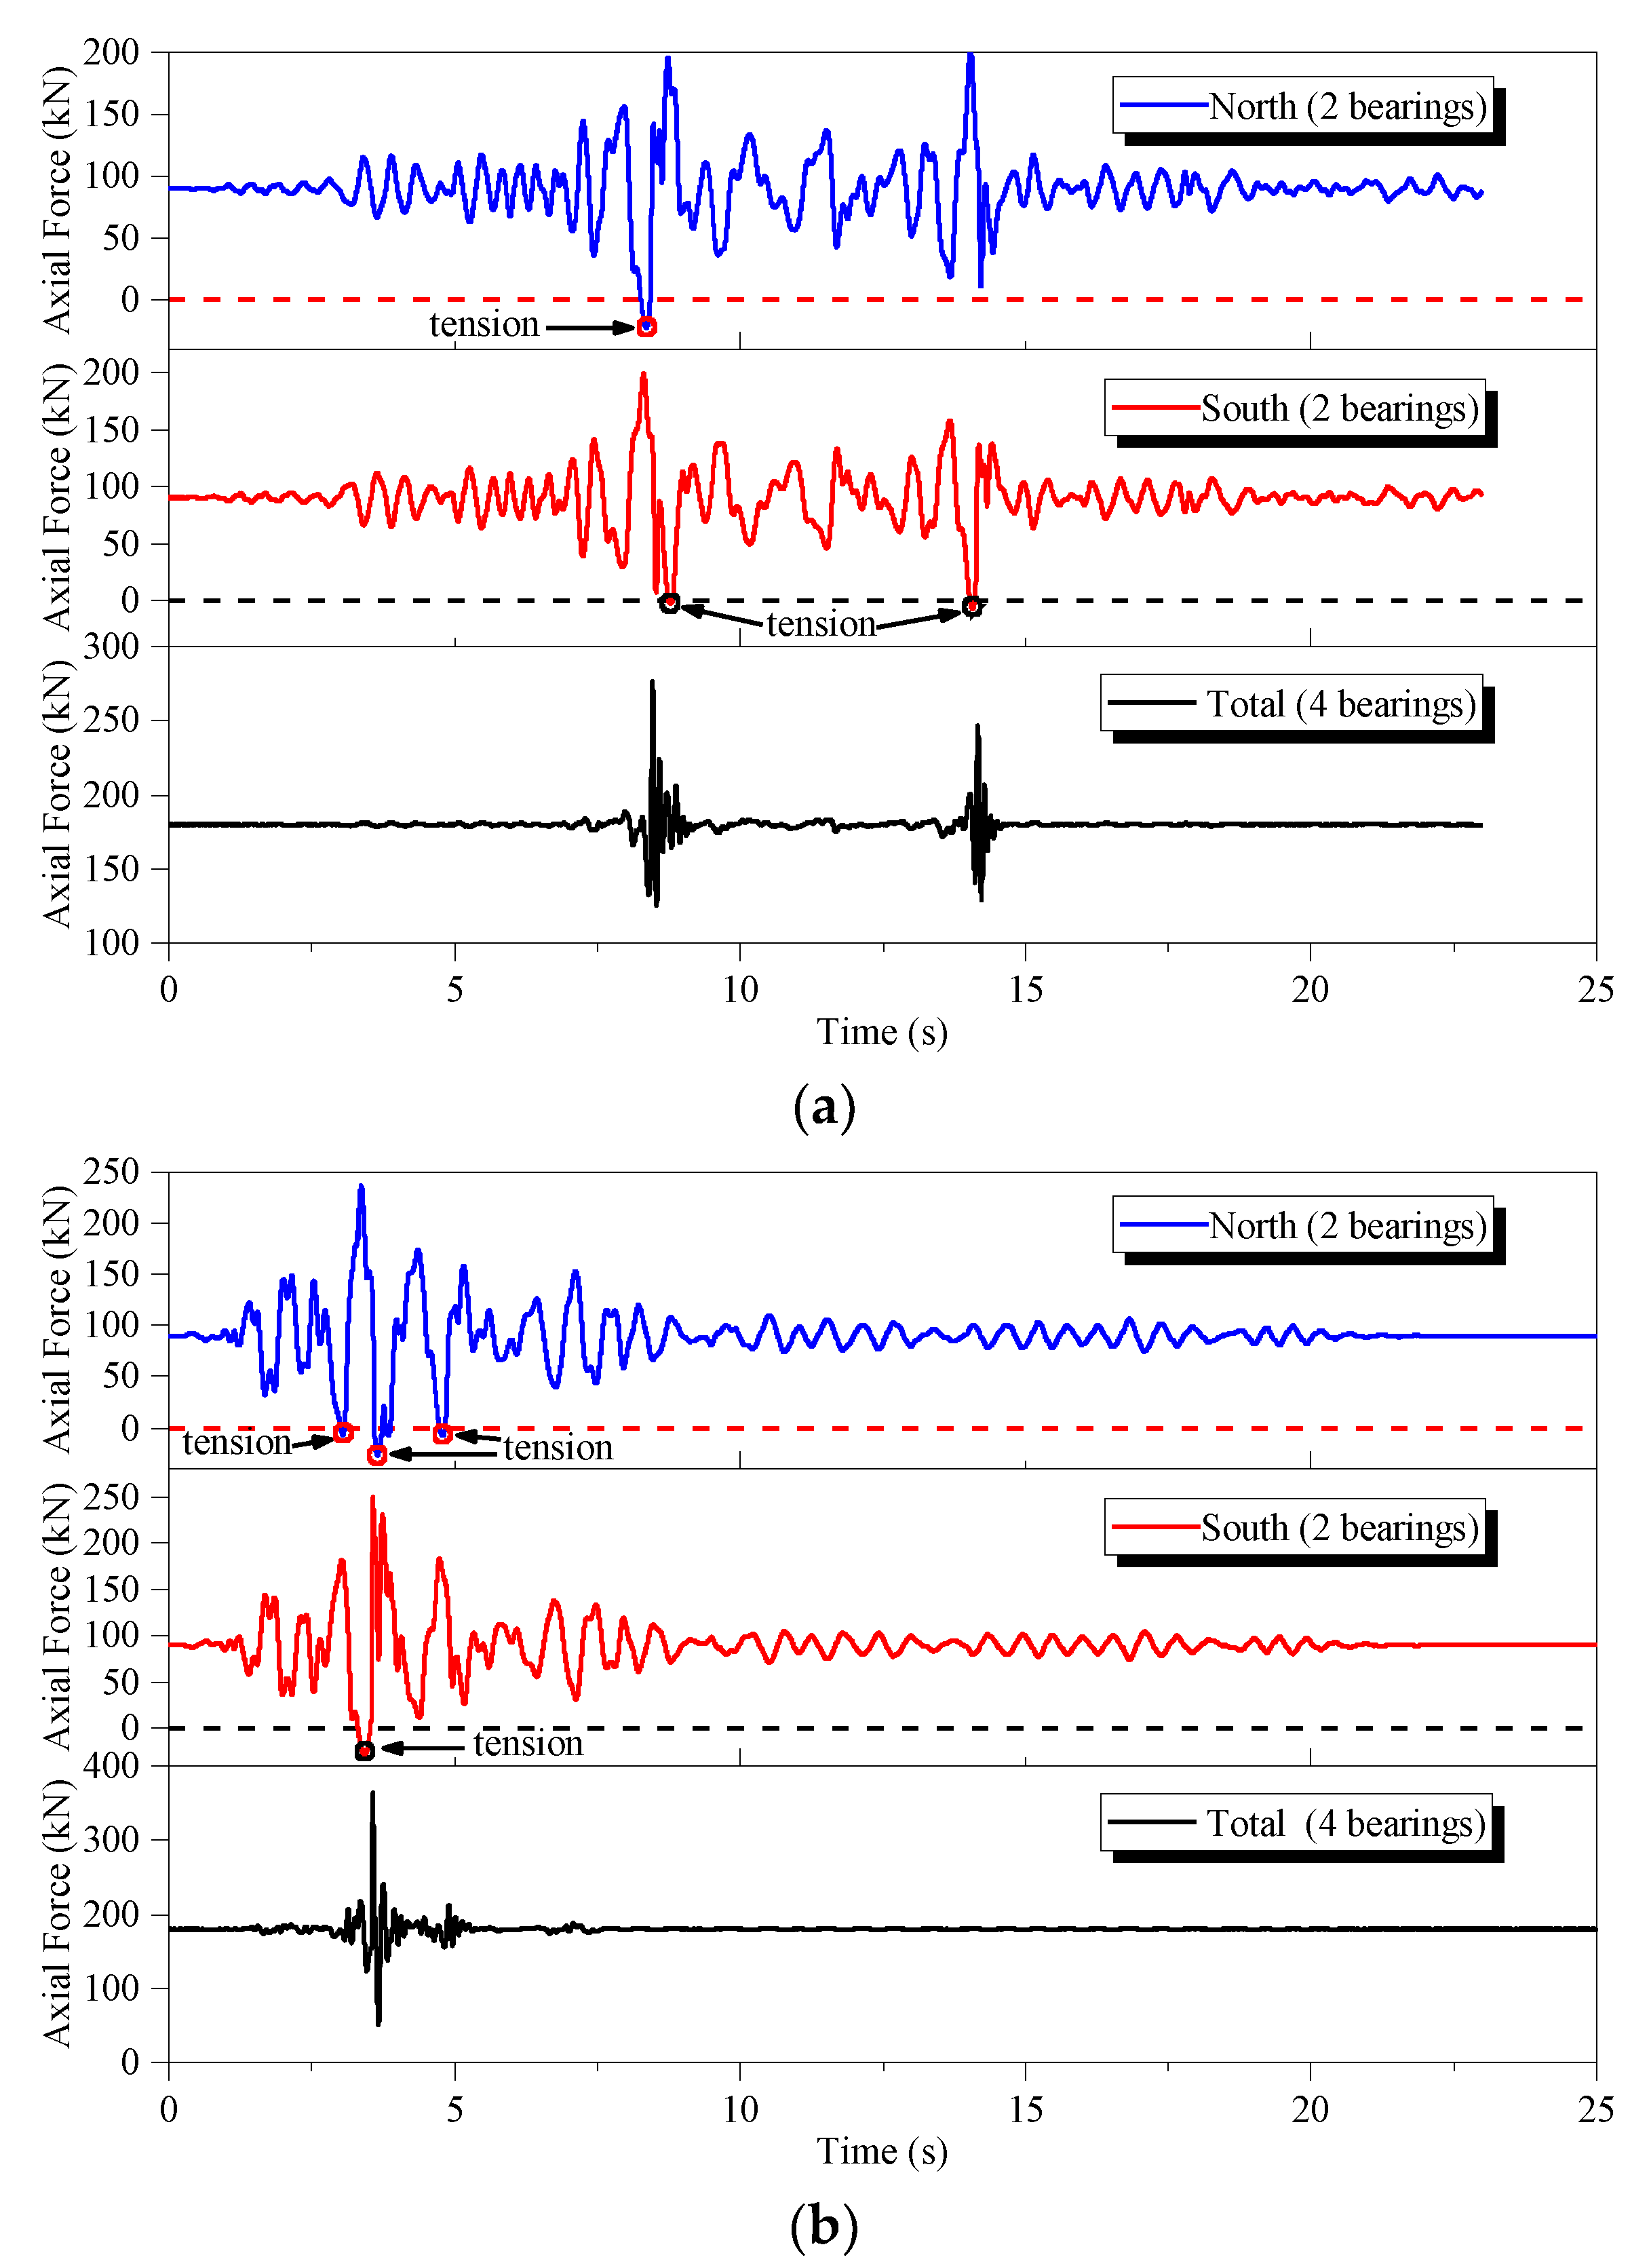
- NF ground motions cause larger base shear force of the isolation system compared with FF ground motions. Pulse-like NF ground motions, e.g., Kobe_NP and ChiChi_NP ground motions, caused a considerably large base shear for the isolation system. The base shear exceeded the total weight of the isolated structure. The axial load of the isolation bearings experienced tension under the pulse-like NF ground motion excitations because of a large overturning moment. The large overturning moment caused an uplift of the LNR when the isolated system was subjected to pulse-like NF ground motions with a large PGA value.
- 3.
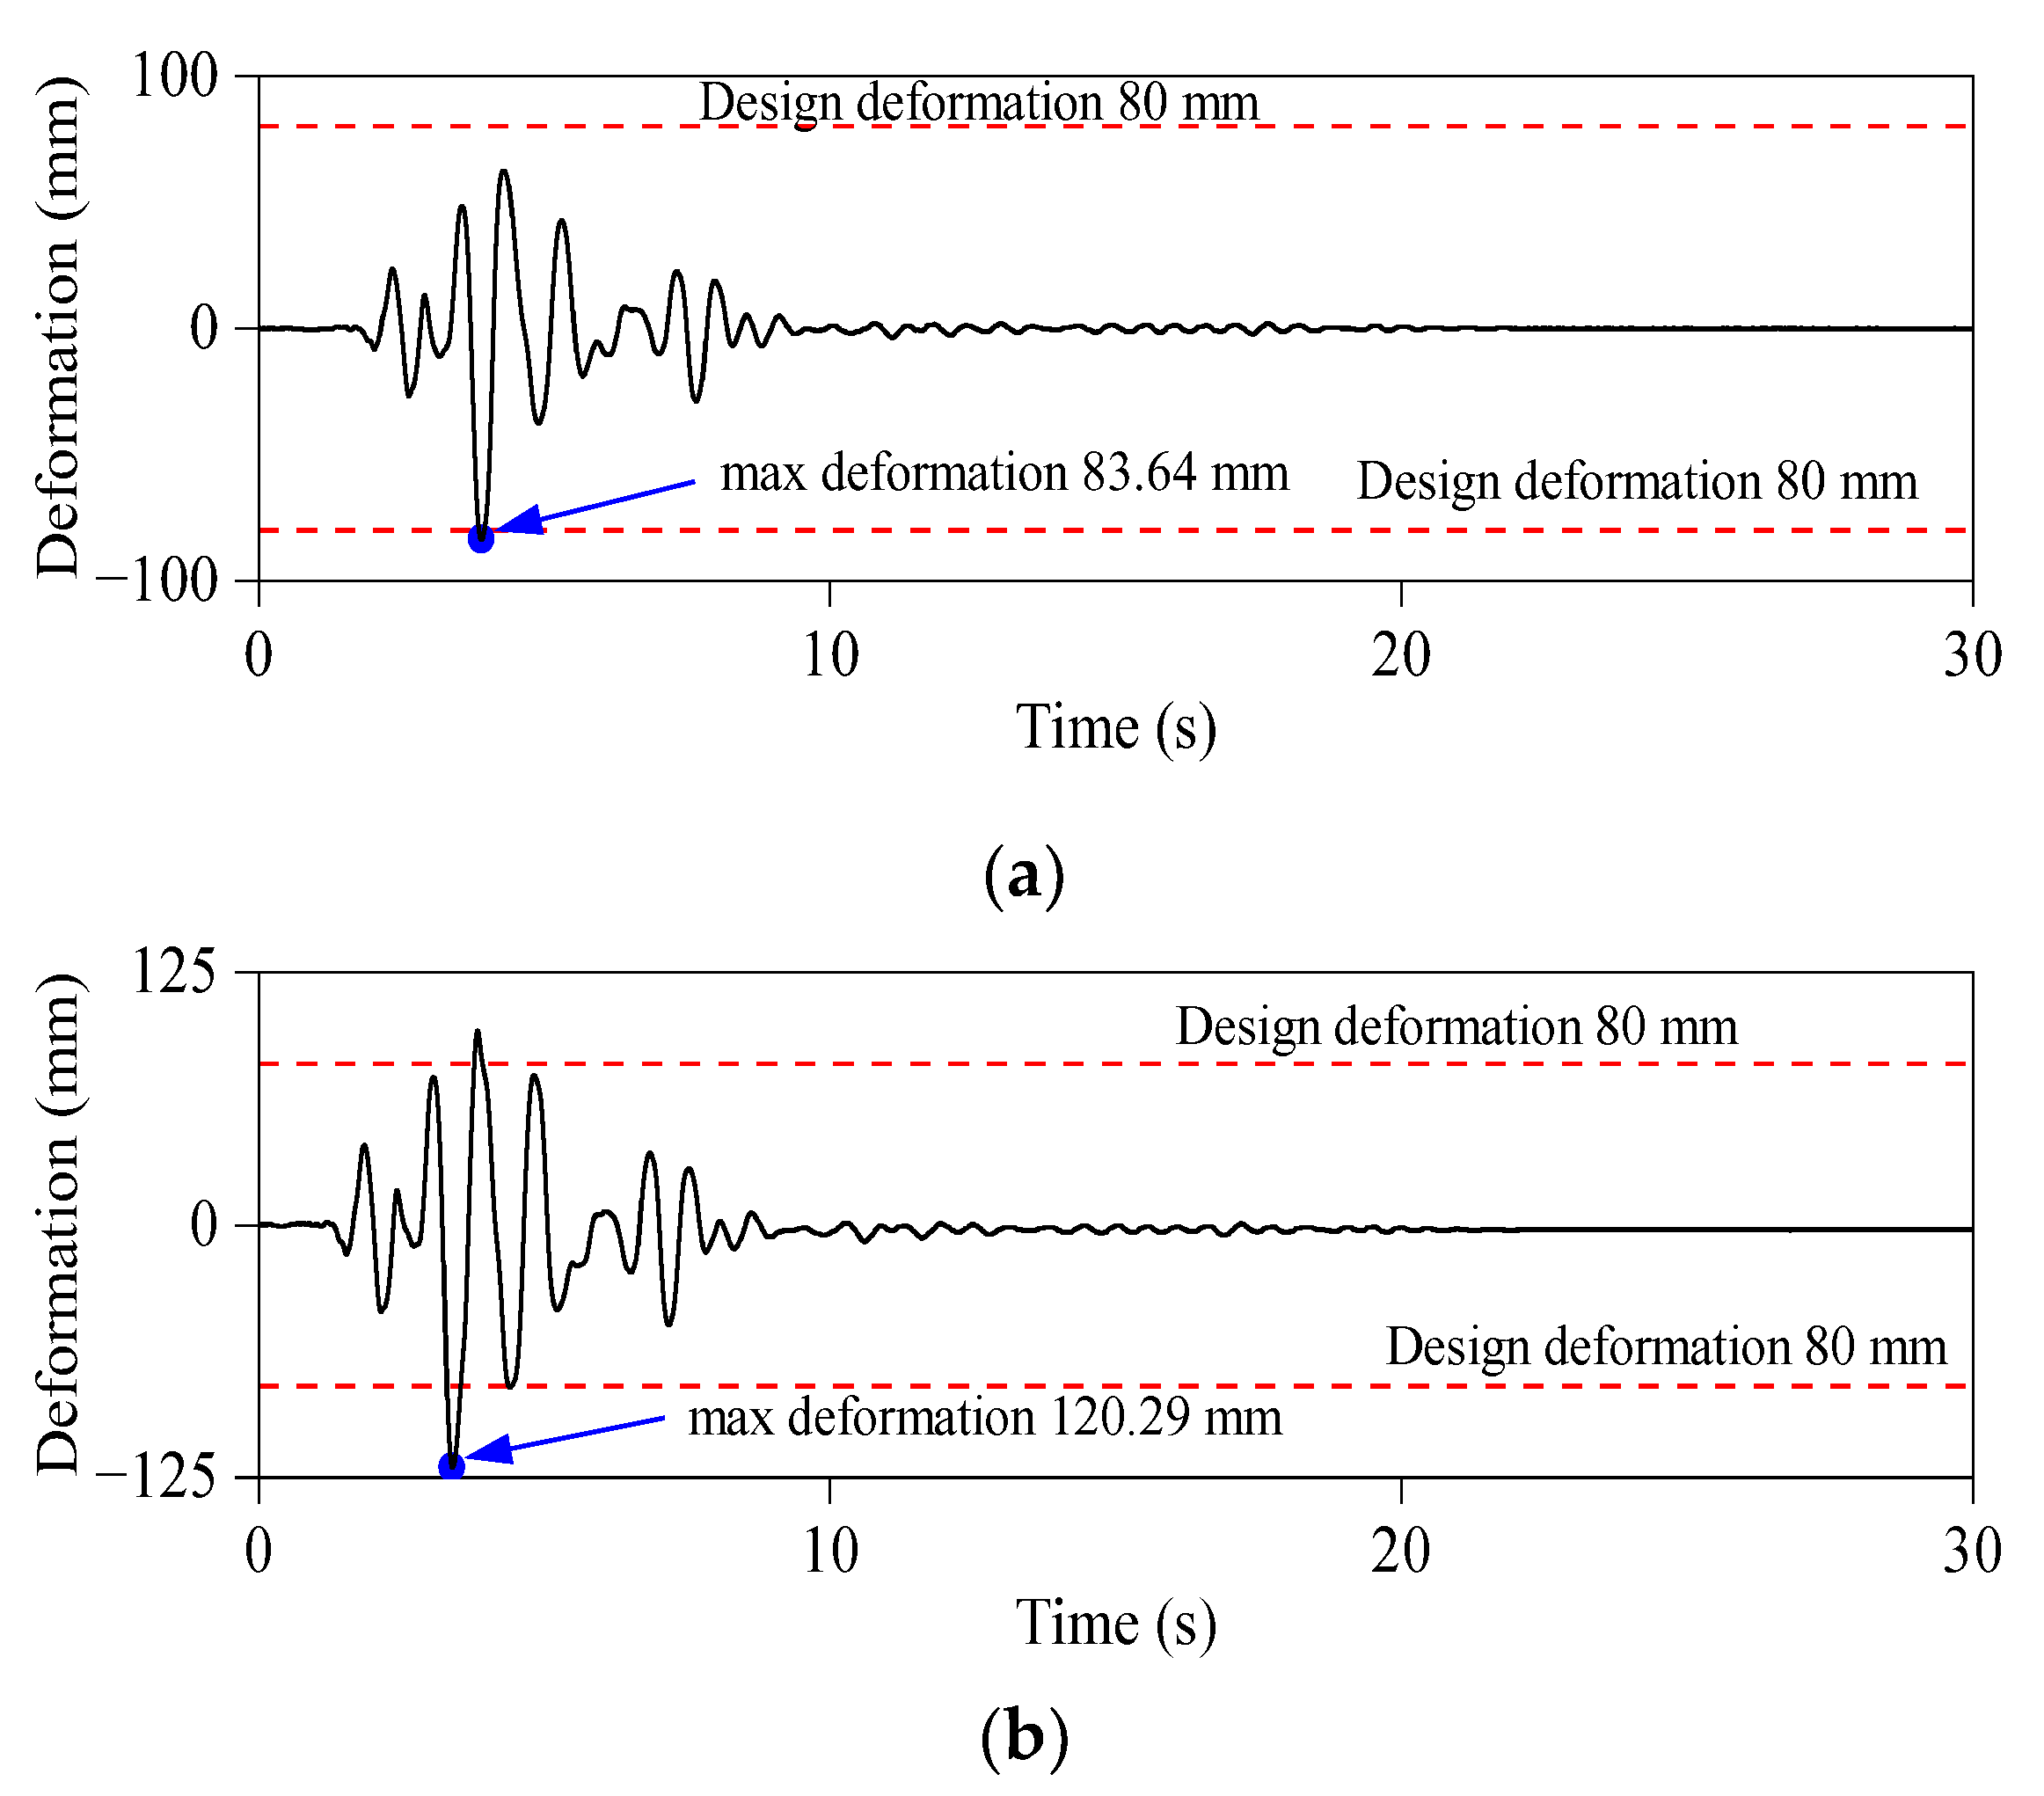
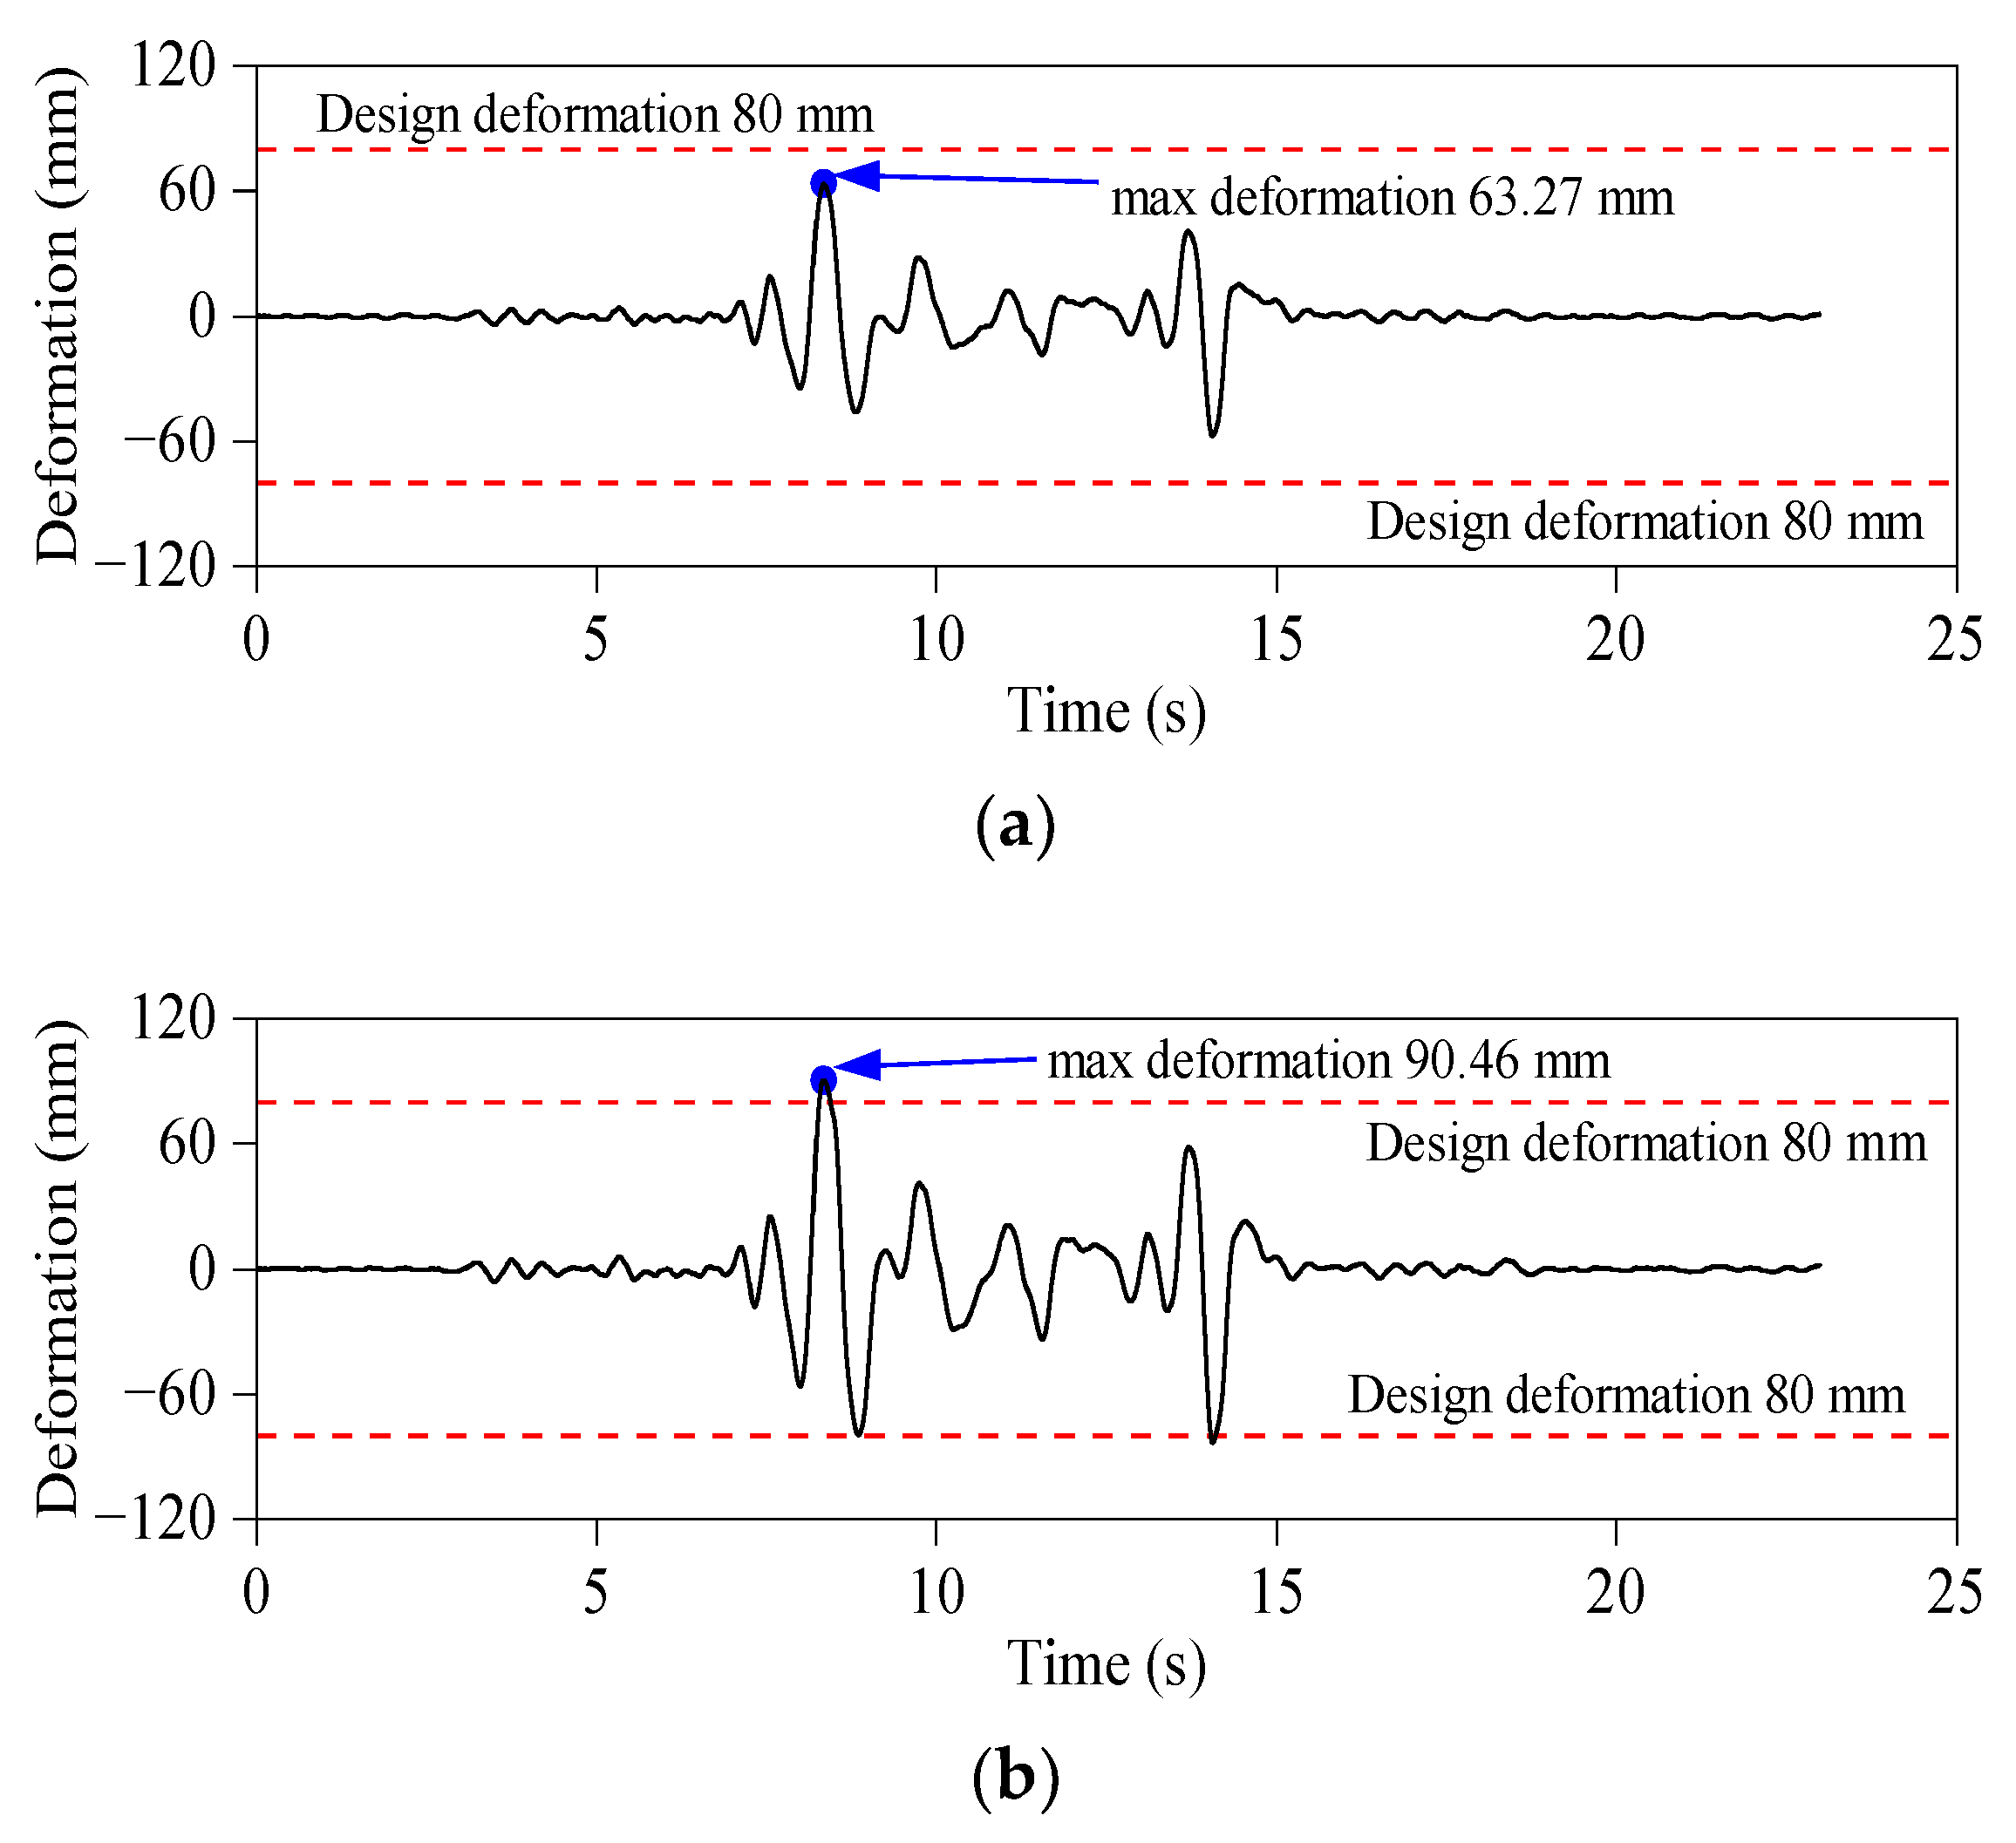
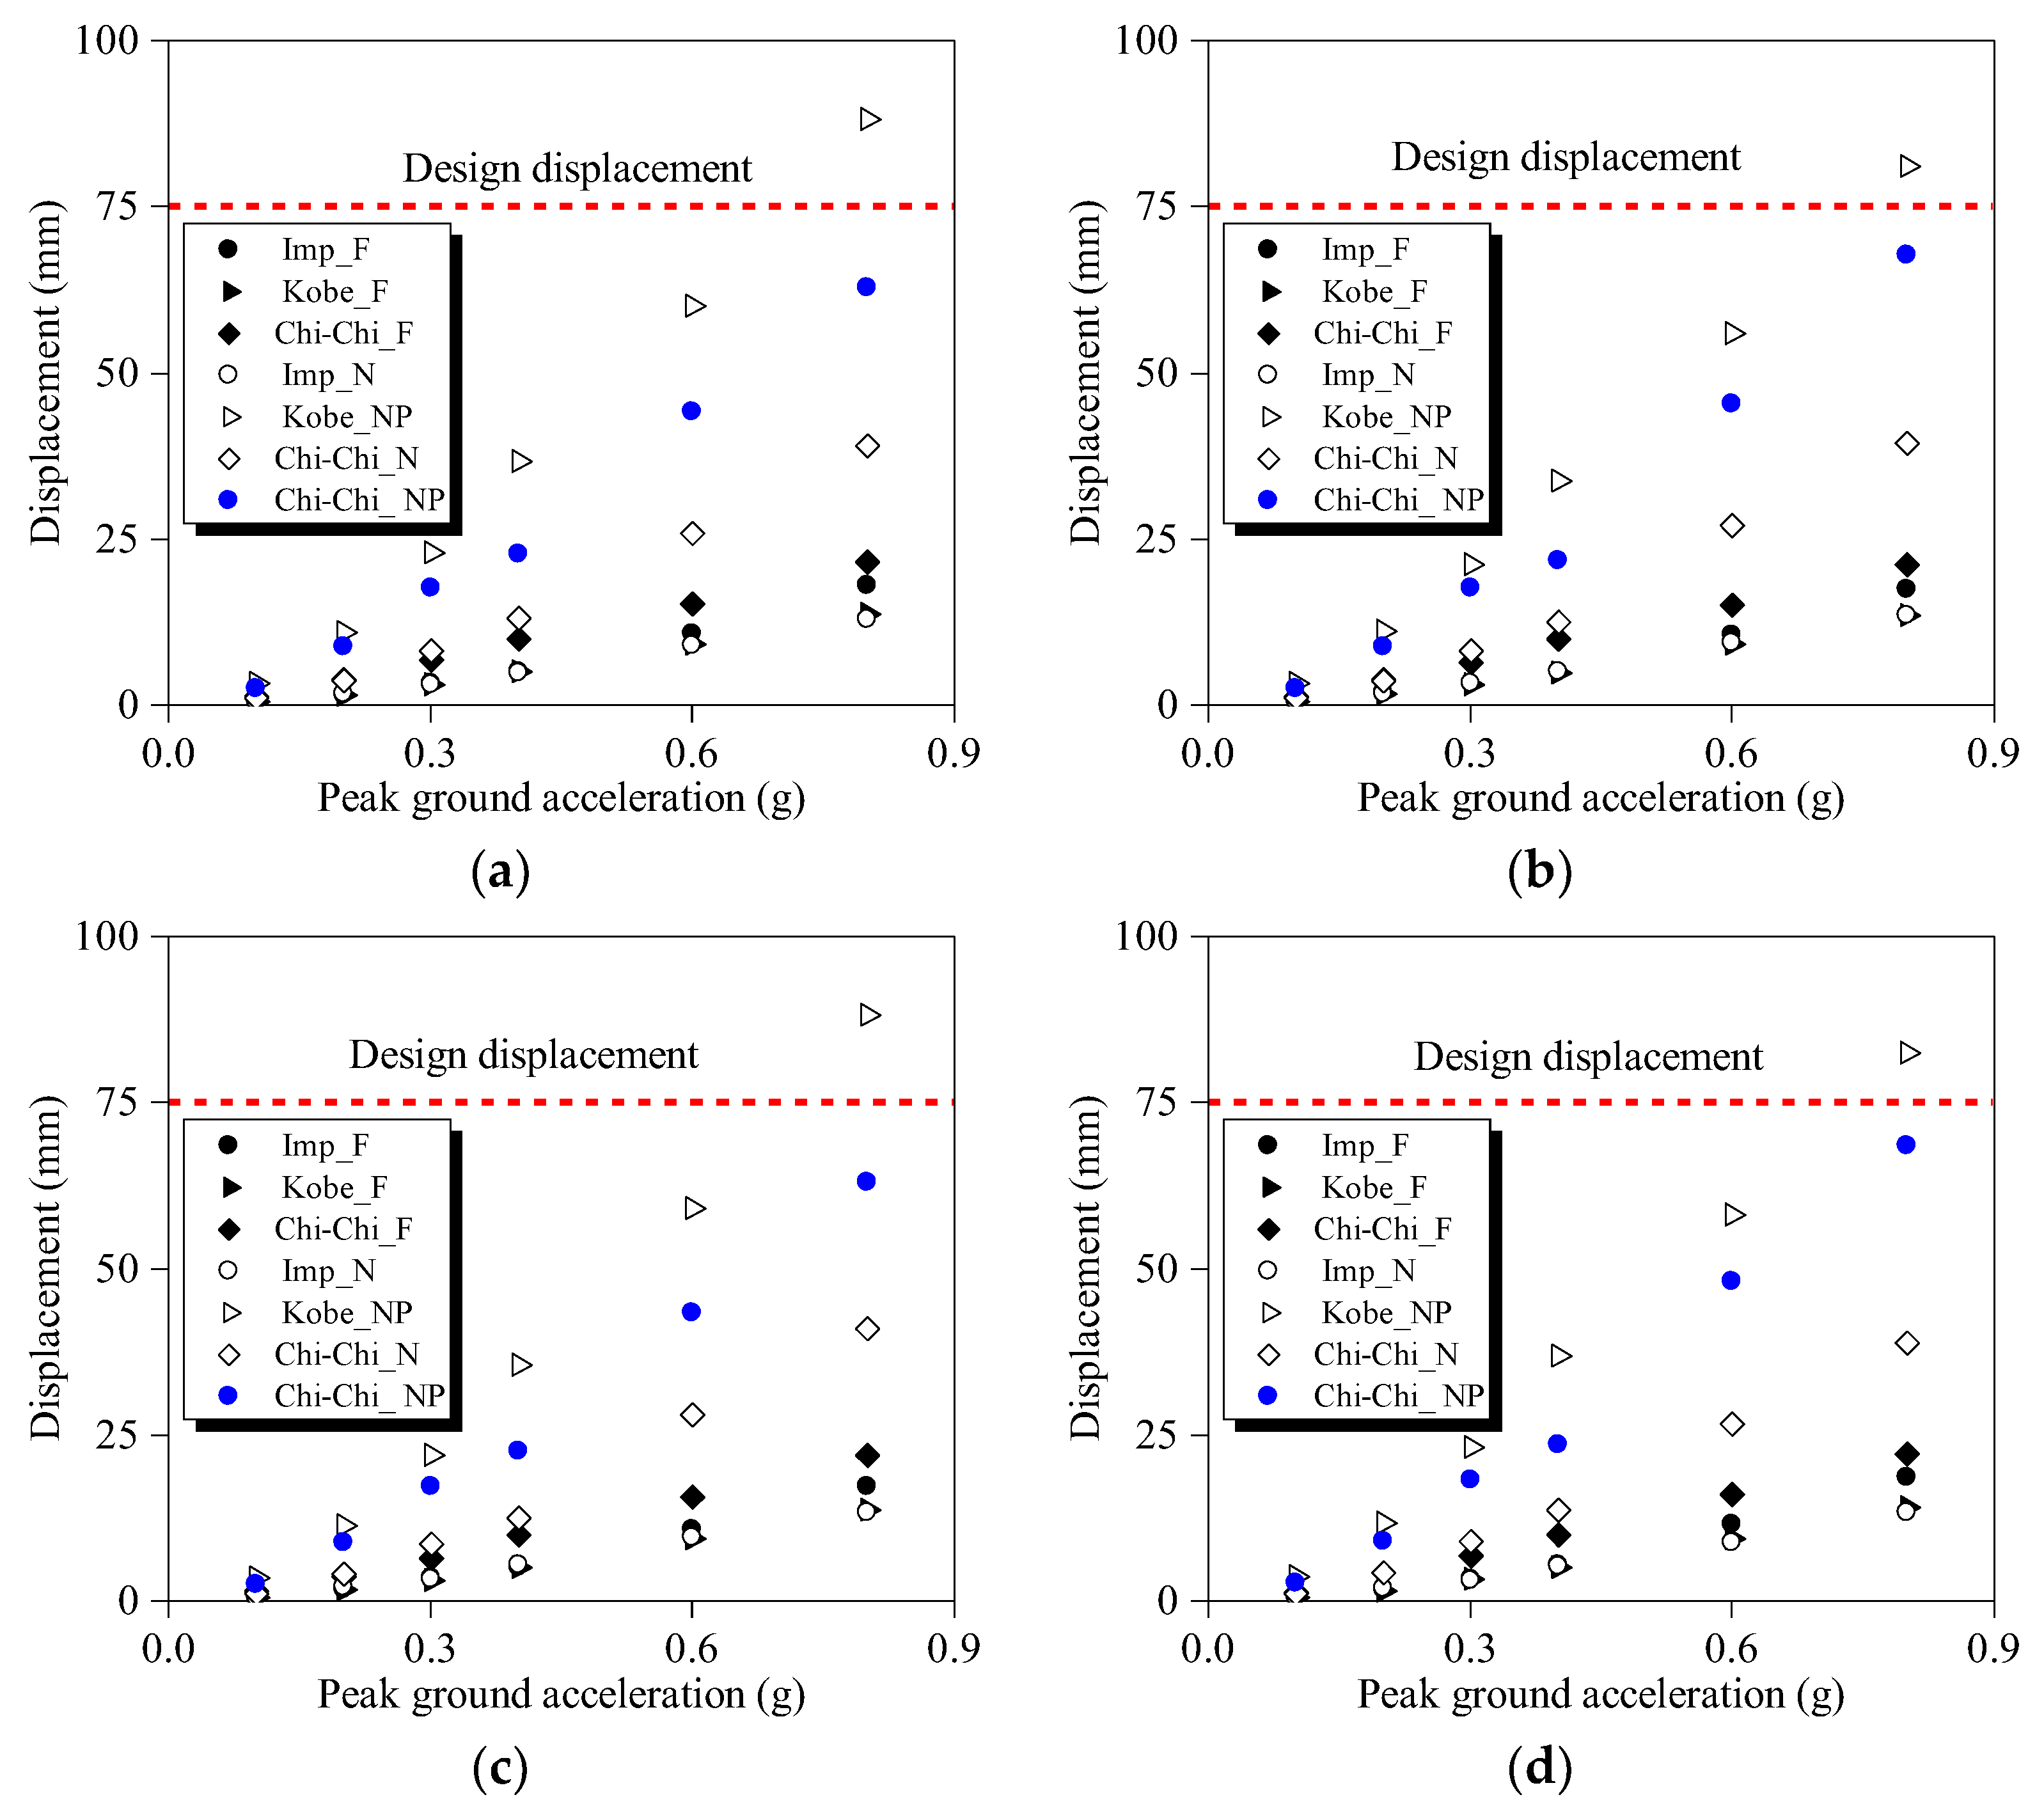
- The displacements of the LNRs caused by FF ground motions were smaller than those caused by NF ground motions. The displacement of all four bearings slightly exceeded the design displacement of 80 mm under Kobe_NP pulse-like NF ground motion excitation with a PGA of 0.6 g, and the displacement exceeded 100 mm when the PGA was increased to 0.8 g.
- 4.
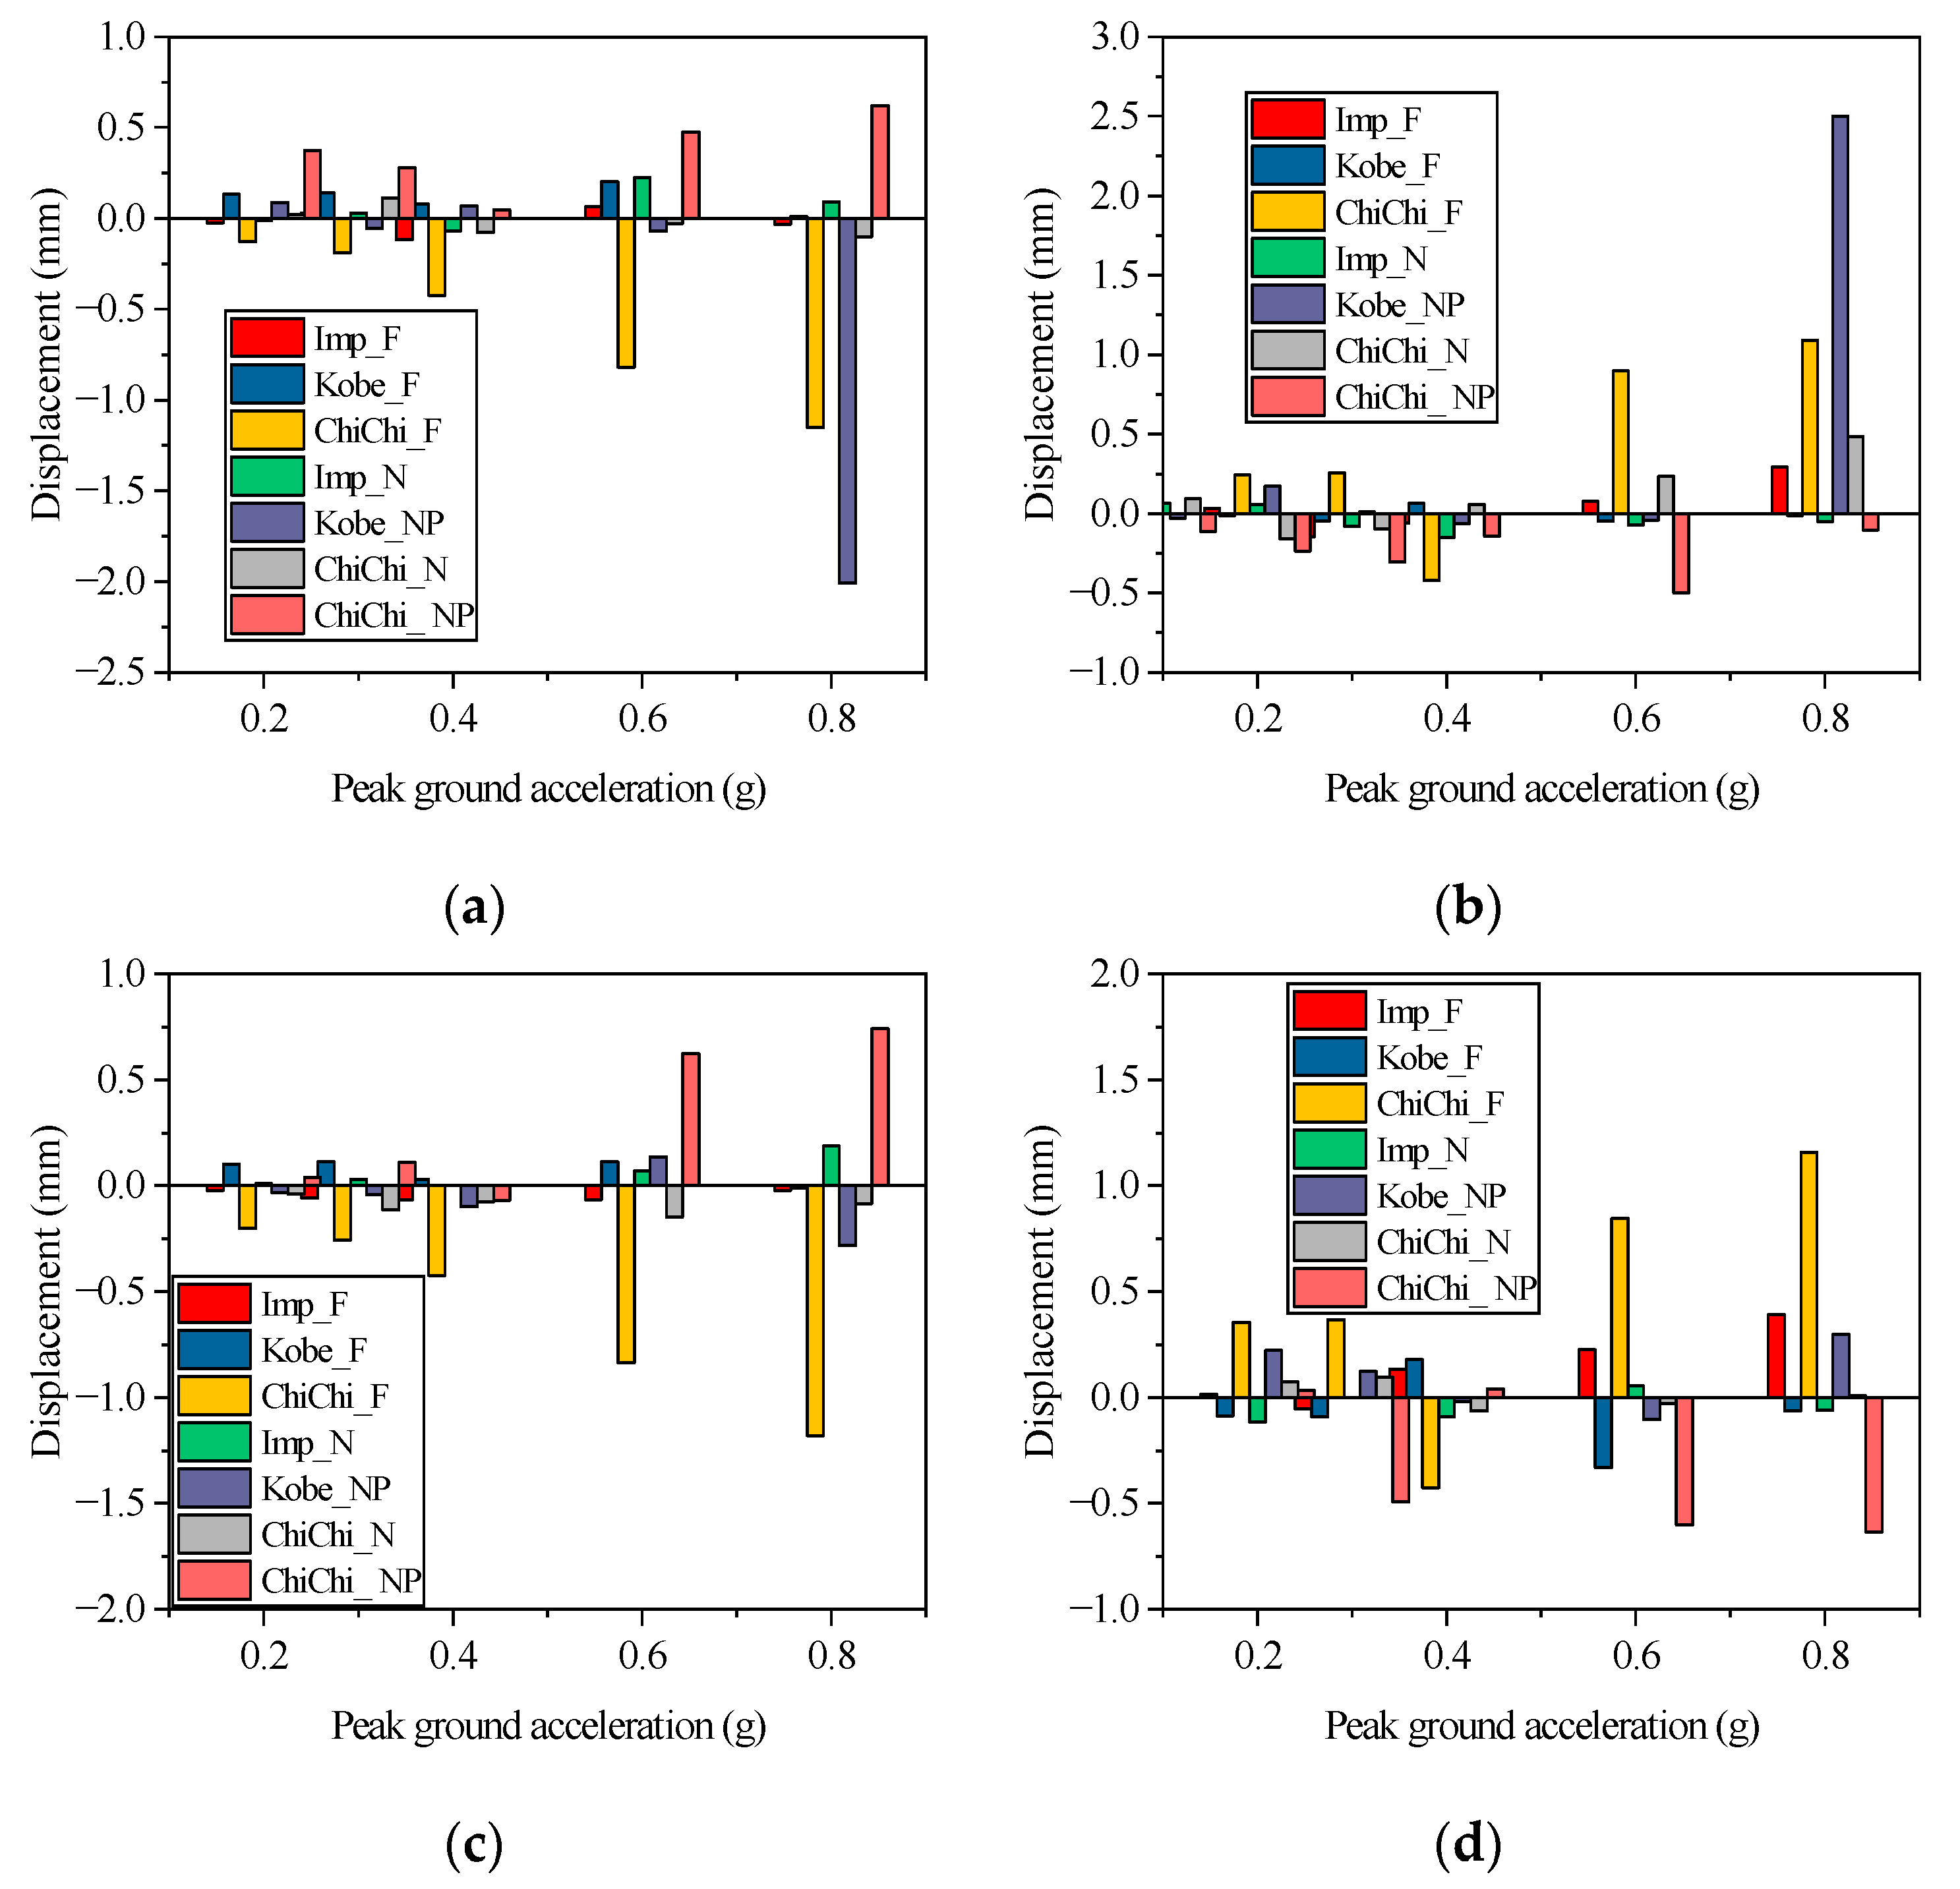
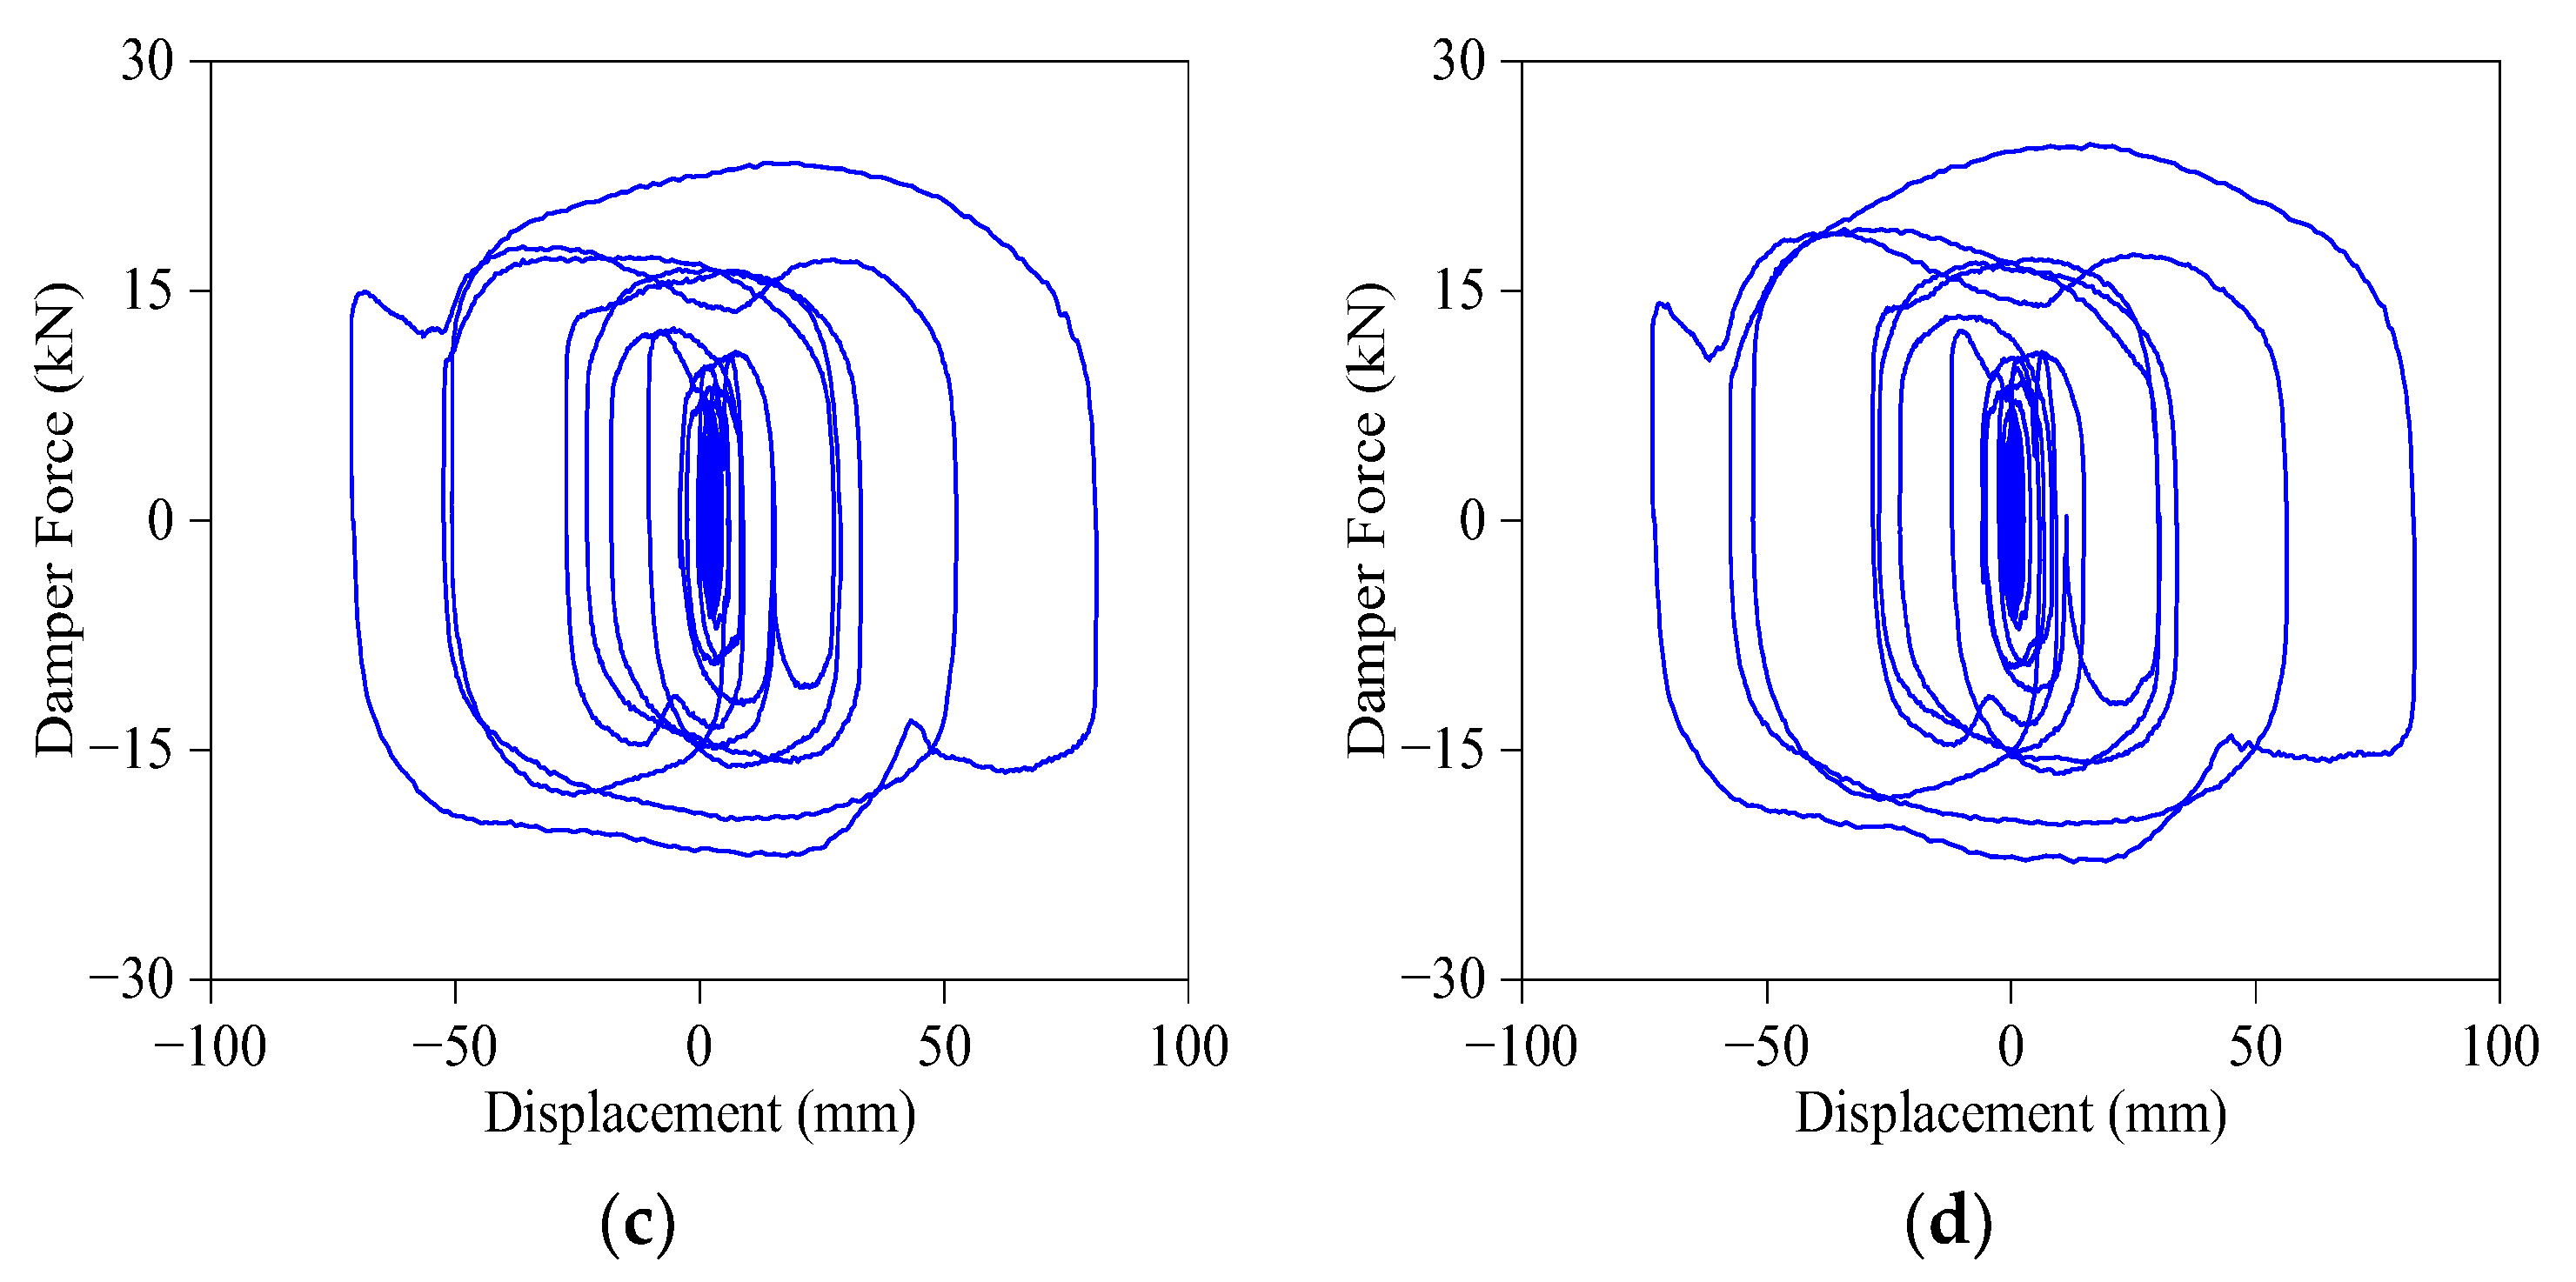
- Nonlinear viscous dampers performed well during the earthquake simulations; the maximum displacement and damper force were within the design value. The residual displacements of the viscous dampers were very small under NF ground motions. NLVDs protected the LNRs very under NF ground motions, but the severe responses of the LNRs could be caused by NF ground motion with pulse period Tp neighboring the fundamental period of the isolated structure.
Author Contributions
Funding
Data Availability Statement
Acknowledgments
Conflicts of Interest
References
- Rong, Q. Optimum parameters of a five-story building supported by lead-rubber bearings under near-fault ground motions. J. Low Freq. Noise, Vib. Act. Control 2020, 39, 98–113. [Google Scholar] [CrossRef]
- Bhandari, M.; Bharti, S.D.; Shrimali, M.K.; Datta, T.K. Seismic Fragility Analysis of Base-Isolated Building Frames Excited by Near- and Far-Field Earthquakes. J. Perform. Constr. Facil. 2019, 33, 1–16. [Google Scholar] [CrossRef]
- Hall, J.F.; Heaton, T.H.; Halling, M.W.; Wald, D. Near-Source Ground Motion and its Effects on Flexible Buildings. Earthq. Spectra 1995, 11, 569–605. [Google Scholar] [CrossRef] [Green Version]
- Jangid, R.S.; Kelly, J.M. Base isolation for near-fault motions. Earthq. Eng. Struct. Dyn. 2001, 30, 691–707. [Google Scholar] [CrossRef]
- Jangid, R. Optimum lead–rubber isolation bearings for near-fault motions. Eng. Struct. 2007, 29, 2503–2513. [Google Scholar] [CrossRef]
- Providakis, C. Pushover analysis of base-isolated steel–concrete composite structures under near-fault excitations. Soil Dyn. Earthq. Eng. 2008, 28, 293–304. [Google Scholar] [CrossRef]
- Mazza, F.; Vulcano, A. Nonlinear response of RC framed buildings with isolation and supplemental damping at the base subjected to near- fault earthquakes. J. Earthq. Eng. 2009, 13, 690–715. [Google Scholar] [CrossRef]
- Bhagat, S.; Wijeyewickrema, A.C. Seismic response evaluation of base-isolated reinforced concrete buildings under bidirectional excitation. Earthq. Eng. Eng. Vib. 2017, 16, 365–382. [Google Scholar] [CrossRef]
- Bhagat, S.; Wijeyewickrema, A.C. Seismic collapse probability considering pounding and financial loss estimation of base isolated reinforced concrete buildings. J. Earthq. Tsunami 2018, 12, 1–21. [Google Scholar] [CrossRef]
- Nagarajaiah, S.; Ferrell, K. Stability of elastomeric seismic isolation bearings. J. Struct. Eng. 1999, 125, 946–954. [Google Scholar] [CrossRef]
- Vestroni, F.; Vulcano, A.; Di Pasquale, G. Earthquake response analysis of a nonlinear model of a base-isolated structure. In Proceedings of the International Meeting on Earthquake Protection of Buildings, Ancona, Italy, 6–8 June 1991. [Google Scholar]
- Mazza, F.; Vulcano, A. Seismic response of buildings with isolation & supplemental dissipation at the base. In Proceedings of the 5th World Congress on Joints, Bearings and Seismic Systems for Concrete Structures, Rome, Italy, 7–11 October 2001. [Google Scholar]
- Kelly, J.M. The role of damping in seismic isolation. Earthq. Eng. Struct. Dyn. 1999, 28, 3–20. [Google Scholar] [CrossRef]
- Ahmet, H.D.; Huseyin, B. Effects of the isolation parameters on the seismic response of steel frames. Earthq. Struct. 2018, 15, 319–334. [Google Scholar]
- Kun, Y.; Yan, X.; Liang, H. A direct displacement-based design procedure for base-isolated building structures with lead rubber bearings (LRBs). Eng. Struct. 2019, 197, 1–9. [Google Scholar]
- Ayoub, S.; Gholamreza, G.A.; Mohammad, S. Effects of ductility and connection design on seismic responses of base-isolated steel moment-resisting frames. Soil Dyn. Earthq. Eng. 2021, 143, 1–19. [Google Scholar]
- Alataby, E.K.; Kadhim, J.A.; Ahmed, M.A. Study on the Effect of Distribution of Viscous Damper for Steel Frame Structure. J. Phys. Conf. Ser. 2021, 1973, 012220. [Google Scholar] [CrossRef]
- Makris, N.; Chang, S.P. Effect of viscous, viscoplastic and friction damping on the response of seismic isolated structures. Earthq. Eng. Struct. Dyn. 2000, 29, 85–107. [Google Scholar] [CrossRef]
- Palazzo, B.; Petti, L. Combined control strategy: Base isolation and tuned mass damping. ISET J. Earthq. Technol. 1999, 36, 121–137. [Google Scholar]
- Zhang, Y.; Iwan, W.D. Protecting base isolated structures from near-field ground motion by tuned interaction damper. J. Eng. Mech. 2002, 128, 287–295. [Google Scholar] [CrossRef]


| Quantity | Scaling Law | Similitude Factors | |
|---|---|---|---|
| Length | 1/4 | Controlling size | |
| Displacement | 1/4 | ||
| Elastic modulus | 1.0 | Controlling material | |
| Stress | 1.0 | ||
| Strain | 1.0 | ||
| Acceleration | 1.0 | Controlling acceleration | |
| Mass density | 4.0 | ||
| Mass | 1/16 | ||
| Force | 1/16 | ||
| Damping | 1/8 | ||
| Time | 0.5 | ||
| Frequency | 2.0 | ||
| Velocity | 1/2 |
| Bearing Properties | Characterized Value in Model Domain |
|---|---|
| Characteristic Strength | 7.53 kN |
| Post-yield Stiffness | 182 kN/m |
| Initial Stiffness | 2586 kN/m |
| Yield Displacement | 2.0 mm |
| Effective Stiffness | 200 kN/m |
| Designed displacement | 80 mm |
| Maximum displacement | 120 mm |
| Damper Properties | Characterized Value in Model Domain |
|---|---|
| Damping coefficient C | 30 kN s/m |
| 0.5 | |
| Designed displacement | 75 mm |
| Maximum displacement | 112.5 mm |
| Maximum Force | 30 kN |
| Maximum Velocity | 1 m/s |
| Earthquake | Station | Component Name | Component Name Abbreviation | Magnit-ude | PGA (g) | PGV (cm/s) | Tp (s) | Rrup (km) |
|---|---|---|---|---|---|---|---|---|
| Imperial Valley, 1979 | Delta | ImpVall_H-DLT262 | Imp_F | 6.5 | 0.35 | 33 | - | 22.03 |
| ChiChi, 1999 | TCU045 | ChiChi_TCU045E | ChiChi_F | 7.6 | 0.51 | 39 | - | 26 |
| Kobe, 1995 | Shin Osaka | Kobe SHI000 | Kobe_F | 6.9 | 0.24 | 38 | - | 19.15 |
| Imperial Valley, 1979 | Bonds Corner | ImpVall_H-BCR233 | Imp_N | 6.5 | 0.76 | 44.3 | - | 2.66 |
| ChiChi, 1999 | TCU067 | ChiChi_TCU067/285 | ChiChi_N | 7.6 | 0.56 | 91.8 | - | 0.62 |
| Kobe, 1995 | Takatori | Kobe_TAK000 | Kobe_NP | 6.9 | 0.28 | 120.67 | 1.554 | 1.47 |
| ChiChi, 1999 | TCU102 | ChiChi_TCU102/278 | ChiChi_NP | 7.6 | 0.29 | 106.6 | 9.632 | 1.49 |
| Case Number | Case Name | Input | Input PGA |
|---|---|---|---|
| 01 | WN_01 | White noise | 0.10 g |
| 02 | Imp_F_0.10 g | Imp_F | 0.10 g |
| 03 | ChiChi_F_0.10 g | ChiChi_F | 0.10 g |
| 04 | Kobe_F_0.10 g | Kobe_F | 0.10 g |
| 05 | Imp_N_0.10 g | Imp_N | 0.10 g |
| 06 | ChiChi_N_0.10 g | ChiChi_N | 0.10 g |
| 07 | Kobe_NP_0.10 g | Kobe_NP | 0.10 g |
| 08 | ChiChi _NP_0.10 g | ChiChi _NP | 0.10 g |
| 09 | WN 02 | White noise | 0.10 g |
| 10 | Imp_F_0.20 g | Imp_F | 0.20 g |
| 11 | ChiChi_F_0.20 g | ChiChi_F | 0.20 g |
| 12 | Kobe_F_0.20 g | Kobe_F | 0.20 g |
| 13 | Imp_N_0.20 g | Imp_N | 0.20 g |
| 14 | ChiChi_N_0.20 g | ChiChi_N | 0.20 g |
| 15 | Kobe_NP_0.20 g | Kobe_NP | 0.20 g |
| 16 | ChiChi _NP_0.20 g | ChiChi _NP | 0.20 g |
| 17 | WN 03 | White noise | 0.10 g |
| 18 | Imp_F_0.30 g | Imp_F | 0.30 g |
| 19 | ChiChi_F_0.30 g | ChiChi_F | 0.30 g |
| 20 | Kobe_F_0.30 g | Kobe_F | 0.30 g |
| 21 | Imp_N_0.30 g | Imp_N | 0.30 g |
| 22 | ChiChi_N_0.30 g | ChiChi_N | 0.30 g |
| 23 | Kobe_NP_0.30 g | Kobe_NP | 0.30 g |
| 24 | ChiChi _NP_0.30 g | ChiChi _NP | 0.30 g |
| 25 | WN 04 | White noise | 0.10 g |
| 26 | Imp_F_0.40 g | Imp_F | 0.40 g |
| 27 | ChiChi_F_0.40 g | ChiChi_F | 0.40 g |
| 28 | Kobe_F_0.40 g | Kobe_F | 0.40 g |
| 29 | Imp_N_0.40 g | Imp_N | 0.40 g |
| 30 | ChiChi_N_0.40 g | ChiChi_N | 0.40 g |
| 31 | Kobe_NP_0.40 g | Kobe_NP | 0.40 g |
| 32 | ChiChi _NP_0.40 g | ChiChi _NP | 0.40 g |
| 33 | WN 05 | White noise | 0.10 g |
| 34 | Imp_F_0.60 g | Imp_F | 0.60 g |
| 35 | ChiChi_F_0.60 g | ChiChi_F | 0.60 g |
| 36 | Kobe_F_0.60 g | Kobe_F | 0.60 g |
| 37 | Imp_N_0.60 g | Imp_N | 0.60 g |
| 38 | ChiChi_N_0.60 g | ChiChi_N | 0.60 g |
| 39 | Kobe_NP_0.60 g | Kobe_NP | 0.60 g |
| 40 | ChiChi _NP_0.60 g | ChiChi _NP | 0.60 g |
| 41 | WN 06 | White noise | 0.10 g |
| 42 | Imp_F_0.80 g | Imp_F | 0.80 g |
| 43 | ChiChi_F_0.80 g | ChiChi_F | 0.80 g |
| 44 | Kobe_F_0.80 g | Kobe_F | 0.80 g |
| 45 | Imp_N_0.80 g | Imp_N | 0.80 g |
| 46 | ChiChi_N_0.80 g | ChiChi_N | 0.80 g |
| 47 | Kobe_NP_0.80 g | Kobe_NP | 0.80 g |
| 48 | ChiChi _NP_0.80 g | ChiChi _NP | 0.80 g |
| 49 | WN 07 | White noise | 0.10 g |
| Dynamic Property | Mode | ||||
|---|---|---|---|---|---|
| 1 | 2 | 3 | 4 | 5 | |
| Frequency (Hz) | 1.1209 | 3.1053 | 7.8180 | 12.3631 | 16.7636 |
| Damping ratio (%) | 16.51 | 8.18 | 6.60 | 1.86 | 3.60 |
| Ground Motion | PGA (g) | |||||
|---|---|---|---|---|---|---|
| 0.10 | 0.20 | 0.30 | 0.40 | 0.60 | 0.80 | |
| Imp_F | 1.09 | 1.02 | 0.87 | 0.92 | 0.91 | 0.87 |
| Kobe_F | 1.51 | 1.25 | 1.25 | 1.26 | 1.24 | 1.20 |
| ChiChi_F | 1.65 | 1.68 | 1.79 | 1.70 | 1.58 | 1.46 |
| Imp_N | 1.86 | 1.69 | 1.67 | 1.66 | 1.64 | 1.38 |
| Kobe_N | 1.46 | 1.45 | 1.15 | 1.10 | 1.05 | 1.57 |
| ChiChi_N | 1.80 | 1.72 | 1.49 | 1.36 | 1.19 | 1.15 |
| ChiChi_NP | 1.69 | 1.38 | 1.19 | 1.13 | 1.00 | 1.06 |
| Bearings | Ground Motion | PGA(g) | |||||
|---|---|---|---|---|---|---|---|
| 0.1 | 0.2 | 0.3 | 0.4 | 0.6 | 0.8 | ||
| Bearing northeast | Imp_F | 2.0 | 3.2 | 5.4 | 7.2 | 16.3 | 25.7 |
| Kobe_F | 1.7 | 3.0 | 5.4 | 8.0 | 13.8 | 19.8 | |
| ChiChi_F | 3.2 | 6.3 | 10.2 | 14.5 | 23.2 | 32.3 | |
| Imp_N | 2.0 | 3.4 | 5.4 | 8.3 | 13.4 | 19.0 | |
| Kobe_NP | 5.6 | 17.0 | 32.3 | 51.0 | 83.6 * | 120.3 * | |
| ChiChi_N | 3.9 | 9.7 | 13.6 | 19.8 | 39.0 | 56.5 | |
| ChiChi_NP | 4.4 | 10.8 | 23.4 | 33.0 | 63.3 | 90.5 * | |
| Bearing southeast | Imp_F | 1.8 | 3.6 | 5.5 | 6.9 | 15.6 | 26.2 |
| Kobe_F | 2.3 | 3.7 | 6.0 | 8.0 | 14.2 | 19.3 | |
| ChiChi_F | 3.6 | 6.0 | 10.9 | 14.1 | 24.3 | 33.6 | |
| Imp_N | 2.1 | 4.2 | 5.8 | 7.4 | 14.2 | 19.1 | |
| Kobe_NP | 6.3 | 16.6 | 32.3 | 51.7 | 82.7 * | 118.8 * | |
| ChiChi_N | 4.7 | 9.9 | 13.3 | 20.2 | 38.9 | 57.0 | |
| ChiChi_NP | 5.3 | 12.1 | 24.0 | 33.0 | 64.4 | 90.4 * | |
| Bearing northwest | Imp_F | 3.2 | 4.1 | 6.7 | 7.8 | 15.8 | 34.0 |
| Kobe_F | 2.4 | 3.7 | 7.1 | 7.6 | 14.2 | 25.6 | |
| ChiChi_F | 4.4 | 6.8 | 11.9 | 14.7 | 23.1 | 33.3 | |
| Imp_N | 2.5 | 3.7 | 6.3 | 8.1 | 14.4 | 24.0 | |
| Kobe_NP | 5.4 | 15.2 | 30.4 | 50.2 | 82.4 * | 104.8 * | |
| ChiChi_N | 3.1 | 8.0 | 13.1 | 18.3 | 37.4 | 60.0 | |
| ChiChi_NP | 3.9 | 13.0 | 26.0 | 30.8 | 65.7 | 98.4 * | |
| Bearing southwest | Imp_F | 1.9 | 3.2 | 5.1 | 7.1 | 15.3 | 24.7 |
| Kobe_F | 1.7 | 3.0 | 5.6 | 8.2 | 14.8 | 21.2 | |
| ChiChi_F | 3.1 | 6.3 | 10.8 | 14.7 | 22.5 | 31.7 | |
| Imp_N | 2.1 | 3.8 | 5.8 | 8.3 | 14.5 | 20.5 | |
| Kobe_NP | 5.7 | 16.6 | 32.0 | 51.7 | 82.4 * | - | |
| ChiChi_N | 4.3 | 9.2 | 13.6 | 20.6 | 39.1 | 55.7 | |
| ChiChi_NP | 3.5 | 11.4 | 24.9 | 32.7 | 63.6 | 90.9 * | |
| NLVD Location | PGA (g) | |||||
|---|---|---|---|---|---|---|
| 0.10 | 0.20 | 0.30 | 0.40 | 0.60 | 0.80 | |
| northeast | 7.54 | 11.34 | 14.31 | 16.62 | 20.32 | 25.46 |
| southeast | 7.13 | 10.92 | 13.64 | 16.08 | 19.50 | 23.88 |
| northwest | 7.61 | 11.13 | 13.70 | 16.14 | 20.07 | 23.35 |
| southwest | 7.71 | 11.69 | 14.45 | 16.74 | 20.18 | 24.56 |
Publisher’s Note: MDPI stays neutral with regard to jurisdictional claims in published maps and institutional affiliations. |
© 2022 by the authors. Licensee MDPI, Basel, Switzerland. This article is an open access article distributed under the terms and conditions of the Creative Commons Attribution (CC BY) license (https://creativecommons.org/licenses/by/4.0/).
Share and Cite
Lyu, Q.; Zhu, B.; Lu, W.; Fu, B.; Liu, L.; Qian, W.; Zhou, M.; Zhang, Z. Shaking Table Test of a Base-Isolated Frame Structure under Near-Fault Ground Motions. Buildings 2022, 12, 2258. https://doi.org/10.3390/buildings12122258
Lyu Q, Zhu B, Lu W, Fu B, Liu L, Qian W, Zhou M, Zhang Z. Shaking Table Test of a Base-Isolated Frame Structure under Near-Fault Ground Motions. Buildings. 2022; 12(12):2258. https://doi.org/10.3390/buildings12122258
Chicago/Turabian StyleLyu, Qing, Baijie Zhu, Wensheng Lu, Bo Fu, Liangkun Liu, Wei Qian, Ming Zhou, and Zhenya Zhang. 2022. "Shaking Table Test of a Base-Isolated Frame Structure under Near-Fault Ground Motions" Buildings 12, no. 12: 2258. https://doi.org/10.3390/buildings12122258
APA StyleLyu, Q., Zhu, B., Lu, W., Fu, B., Liu, L., Qian, W., Zhou, M., & Zhang, Z. (2022). Shaking Table Test of a Base-Isolated Frame Structure under Near-Fault Ground Motions. Buildings, 12(12), 2258. https://doi.org/10.3390/buildings12122258