Article

Is 24.9 °C Too Hot to Think? A Call to Raise Temperature Setpoints in Australian Offices

1
School of Civil, Mining, Environmental and Architectural Engineering, Faculty of Engineering and Information Sciences, University of Wollongong, Wollongong, NSW 2522, Australia
2
Melbourne School of Design, Faculty of Architecture, Building and Planning, The University of Melbourne, Melbourne, VIC 3010, Australia
3
School of Architecture, Design and Planning, The University of Sydney, Sydney, NSW 2006, Australia
*
Author to whom correspondence should be addressed.
Buildings 2022, 12(12), 2259; https://doi.org/10.3390/buildings12122259
Submission received: 25 October 2022 / Revised: 5 December 2022 / Accepted: 13 December 2022 / Published: 19 December 2022
(This article belongs to the Collection Sustainable Buildings in the Built Environment)

Abstract

:
The current +−0.5 PMV (Predicted Mean Vote) targets adopted by NABERS (National Australian Built Environment Rating System) is the practical range deemed acceptable for 90% acceptability for commercial buildings in Australia, however thermal comfort satisfaction scores measured in office buildings still show high percentages of dissatisfied occupants. This paper aims to demonstrate the potential of curbing energy consumption from commercial buildings in Australia by increasing summer temperature set-points. A 10-year NABERS dataset, along with objective and subjective thermal comfort and air quality data from NABERS-certified offices are investigated in this study. Furthermore, different simulation scenarios are tested to investigate the discomfort hours and energy consumption for various summer temperature setpoints. Result analysis shows that occupants’ satisfaction in NABERS-certified buildings was not within the 90% satisfaction, with being too cold/hot as the main source of dissatisfaction. Objective measurements also showed temperature was out of recommended range for several datapoints. Simulation results indicate that, within the average range of 21–24.9 °C, there is not a significant difference in discomfort hours that could drive the selection of one temperature set-point over the other. Challenging the current practices, results suggest that a cooling set point temperature on the upper limit of the range indicated by the Australian standard AS 1837–1976 may minimize the energy consumption without significantly increasing discomfort, or even increasing the perceived satisfaction with the indoor environment.

1. Introduction

The scientific evidence compiled by the latest IPCC report [1] confirms that because of the catastrophic consequences of climate change humanity is at risk of extinction. Australians had first-hand experience of the rash climate-change induced impacts during the unpreceded bushfire season in 2020 when smoke travel across the globe reaching out as far as Brazil and then floods in 2021 and 2022 [2,3,4]. Australian researchers have been documenting the impact of extreme climate change-related events such as bushfires and floods and the overall vulnerability of buildings in face of extreme weather events and urgent need for action [2,3].
One of the significant contributors to carbon emissions and climate change around the globe is the built environment and as such the pressure to cementing a pathway towards carbon neutral solutions is mounting. One of the main drivers behind buildings’ energy consumption is Heating, Ventilation and Air-Conditioning (HVAC) systems designed to deliver comfort to people indoors. Links between our desire for comfort, energy consumption driven by HVAC systems and its subsequent carbon footprint of buildings have been established [5,6,7]. Further, this same link has been recognised for its vicious cycle nature—the more we use air-conditioning, the more we are likely to need it which then increases the demand of such refrigeration systems, thereby increasing the built environments’, the bigger the carbon footprint becomes which in turn increasing the frequency and magnitude of extreme weather events and inevitably then our need for dependency on air-conditioning to endure extreme weather events.
Australian commercial buildings, similar to the global trend, are responsible for 25% of total energy consumption and 10% of the total national carbon emissions [8]. HVAC systems in these buildings are the number one contributor with around 40% of the total energy consumption [9]. To decrease this negative contribution, NABERS (National Australian Built Environment Rating System) has long taken a leadership role which initially began in 1998, however it only became the rating system we know today in 2009. The widespread adaptation of NABERS demonstrated its success as a rating system which was not only adopted as a mandatory requirement for buildings over 2000 m2 [10], but as a tool that was welcomed by many industries [11]. Recently, with the launch of the Commercial Building Disclosure (CBD) Program, a mandatory certification for commercial office spaces of more than 1000 m2 in Australia, NABERS’s role in Australian building industry became even more prominent.
With the widespread use of NABERS, energy consumption and Indoor Environmental Quality (IEQ) in NABERS-certified commercial buildings have been the area of interest for many Australian researchers in the last few years. Data extracted from the CBD program datasheet show possible significant improvement in energy savings, and carbon emissions for NABERS-certified offices, although it is notable that 6-star NABERS-certified offices sometimes tend to consume more energy compared to their 4- and 5-star rated counterparts [12]. Similarly, evidence suggests significant energy savings have been made in NABERS-certified buildings, although the attribution to the certification alone, is uncertain [13]. A study by Burroughs [14] also reported 48% reduction in energy consumption when improving NABERS energy star rating from 3.6 to 5.3 for a case study in Sydney, Australia. Roumi et al. [15] showed NABERS-certified building with score equal or higher than 5 can deliver 12.6% better IEQ and 35.9% less energy consumption compared to buildings with lower NABERS scores. NABERS, compared with other major green building rating systems, could differentiate building performance more effectively using different certification levels [16].
In Australia, NABERS requirements for thermal services which is relevant to Base and Whole buildings ratings, recommends the adoption of ASHRAE 55 (2020). These make allowance for using the PMV model (air-conditioned buildings) or the adaptive model (naturally ventilated buildings). In practice, the vast majority of rated buildings are fully air-conditioned which then means +−0.5 PMV are current targets adopted by NABERS certified premisses and 21–24.9 °C for air temperature [17] is the practical range deemed acceptable for 90% acceptability. A study led by Zhang et al. [18] showed no significant differences between occupants’ cognitive performance and thermal comfort measured at 22 °C and 25 °C as the common temperature setpoints. Even with this guideline in place, thermal comfort satisfaction scores measured in office buildings show high percentages of dissatisfied occupants in winter and summer months [19], with the main reasons for dissatisfaction regarded as the office being “too cold” in summer or “too hot” in winter. In short, despite the great advances in the Australian commercial sector, the operational HVAC set-points seem to have the potential for adjustment in curbing higher satisfaction rates, lower energy consumption and carbon emissions.
This paper aims to demonstrate the potential of curbing energy consumption from commercial buildings in Australia by increasing summer temperature set-points. It looks at the 10-year NABERS dataset to map the trends in NABERS energy data and discusses the effectiveness of current policies in reducing energy and carbon intensity of NABERS-certified base buildings. It further explores the objective thermal comfort and air quality measured in NABERS-certified office buildings to investigate if there are any differences in measured air temperature. Subjective thermal comfort and air quality data are also investigated to test if current practice in Australian office building meet the 90% satisfaction target by the +−0.5 PMV targets from NABERS. Finally, different scenarios with various summer setpoints (21–26 °C) are tested to investigate the discomfort hours and energy consumption.

2. Methodology

2.1. The NABERS Energy Dataset

2.1.1. NABERS Overview

NABERS is a well-established measure to rate and benchmark energy and environmental performance of commercial office buildings. NABERS is a national initiative managed by the NSW Department of Planning, Industry and Environment, and it is performance based, rather than design based. NABERS rates a building’s operational impacts on the environment and provides a simple indication of how well buildings are managed, by rating their performance on a scale of one to six stars with six stars representing exceptional greenhouse performance.
There are three levels of NABERS Energy rating as depicted in Table 1:
  • Tenancy Rating—covers just the small power, lighting and any supplementary air-conditioning installed by the tenant
  • Base Building—covers just the common area services and the base building provided air-conditioning
  • Whole Building—Includes both of the above.

2.1.2. NABERS Energy

NABERS Energy is a performance-based rating that uses measured readings of electricity consumption 12 months after occupation. The NABERS Energy scheme awards stars based on the greenhouse performance of rated space, with a higher number of stars for better performance. The number of stars is determined from the normalised emissions figure in kgCO2/m², which is calculated from the type and quantity of energy consumed and the rated area, normalised for hours of use, equipment density and climate. The NABERS Energy rating rates the greenhouse performance of office buildings.
Following are the key items of data required to undertake an energy assessment:
The net lettable area of the office space being rated
  • The energy consumed by the tenants
  • Hours of occupancy
  • The number of computers
The process of calculating a NABERS Energy rating follows a strict validation protocol. The protocol assists in:
  • The production of a tenancy energy use estimate that can help inform the design, commissioning and operation of a new building; and
  • The conversion of a building’s energy use estimate into a NABERS Energy rating.
NABERS Energy scheme awards stars based on the greenhouse performance of rated space, with a higher number of stars for better performance (Table 2). The number of stars is determined from the normalised emissions figure in kgCO2/m², which is calculated from the type and quantity of energy consumed and the rated area, normalised for hours of use, equipment density and climate. The NABERS whole-building rating rates the combined greenhouse performance of base-building and tenancies.
For this study, the publicly available NABERS Energy dataset [20] has been analysed to map the trend of the increase in the number of certified base buildings in the last decade and to assess the improvements in the average energy consumption (in MJ/m2) and carbon intensity (in kgCO2/m2) among the buildings achieving 3 and more stars in NABERS rating system. Only base buildings are included in data analysis since NABERS Energy is mandatory certification for those.

2.2. Thermal Comfort and Air Quality

Thermal comfort and air quality data was collected from seven NABERS-certified commercial offices located in six different Australian capital cities (Sydney, Melbourne, Darwin, Perth, Adelaide and Canberra). All offices were fully air-conditioned, and the setpoints were following the Australian typical temperature range of 21–24.9 °C based on NABERS guide. The time period for data collection was January 2021 to March 2021 which is considered summer period in Australia. The measurements were conducted in 1 to 6 different floors depending on the size of the tenancy. The intervals for the data collection were 1 min, and for each floor around 103,000 data points were collected. The measurements devices were collecting data 24/7, however for the purpose of this study only data collected from 7 a.m. to 7 p.m. as a typical flexible workday were considered, and data collected on Saturdays and Sundays was excluded. All measurement devices were RESET Grade B certified. They were installed between 1.3–1.6 m from floor height within the open plan office spaces. Installation location covered perimeter and central zones of the open-plan offices.
The variables measured were related to thermal comfort and IAQ (air temperature, PM10, PM2.5, and CO2). For thermal comfort, the measured air temperature in 10 different floors within seven offices were studied. The acceptable air temperature range of 21–24.9 °C based on NABERS was used. Measured air temperature is used to assess thermal comfort levels since the assumption that operative temperature is equal to air temperature has been adopted by several studies [21,22,23,24,25]. For IAQ, 2–3 floors within 2–3 different offices were investigated and the measured values were compared against the acceptable IAQ-related thresholds. Regarding CO2, ASHRAE Standard 62.1–2019 [26] suggests a maximum of 1000 ppm for CO2 concentration in indoor spaces, however the national construction code of Australia has set the threshold to 850 ppm measured over an eight-hour time period [27]. The latter is used for this study. For PM10 and PM2.5, the World Health Organization [28] has set the threshold to 50 µg/m3 for PM10 and 25 µg/m3 for PM2.5. The 2016-update for Air NEPM [29] in Australia has set a similar threshold for a 24-h average, however the acceptable threshold for the annual average is 8 µg/m3 for PM10 and 25 µg/m3 for PM2.5 [2]. As the data for this study was collected from Jan to March, the 24-h threshold was used.

2.3. Post-Occupancy Evaluation (POE) Surveys

Data from a total of 273 SHE (Sustainable and Healthy Environments) POE (post-occupancy evaluation) surveys was collected from five NABERS-certified organizations in Australia and analysed in this study. Developed by the SHE lab at The University of Melbourne, the SHE survey is designed to collect data about human, organizational and environmental-related variables and is endorsed by WELL v2, Green Building Council of Australia (GBCA) and NABERS. The SHE survey designed for commercial office spaces was used for this study. The survey asks the occupants to rate their satisfaction levels with aspects related to the physical environment, organization, and human factors. These aspects include occupants’ sociodemographic, occupancy and working arrangement, transportation, IEQ, water, office layout, ergonomics and aesthetics, nutrition, sleep, workplace wellness and engagement, health and well-being. The satisfactions questions are asked based on a seven-point Likers scale (1 = lowest rating, 4 = neutral and 7 = highest rating), and if dissatisfaction is indicated, the occupants answer follow up questions to specify the reason(s) for their dissatisfaction. The survey also includes multiple choice and open-ended questions. For this study, POE surveys were deployed in five NABERS-certified Australian offices between July 2020 and June 2021 which covers summer and winter seasons.
Around half (45%) of the respondents were in Generation Y (born 1980–1994), followed by Generation X (35%, born 1965–1979) and Baby Boomers (11%, born 1946–1964). Majority of the respondents were male (54%) and 42% female. Out of 273 respondents 41% were working 41–50 h per week, followed by 33% working 31–40 h and 20% working 51–61 h per week. Professionals had the highest percentage of 42 and managers and administrators were the second group (40%). Table 3 summarizes the basic demographics of the survey respondents.

2.4. Simulation Model

Based on the findings of the POE analysis, one case study was selected to further explore the potential implications of indoor management strategies on energy loads and hours of discomfort, assessed based on the ASHRAE 55 Standard [30]. This step evaluated the thermal performance of a case study under varying conditions of cooling set-point (CSP), air change rate (ACH) and occupancy density (OCC) to investigate whether different management strategies aimed at decreasing the dissatisfaction with the indoor environment can be detrimental on the final energy consumption. The analysis undertook a transient hourly simulation campaign, performed with the software DesignBuilder®, to benchmark the different scenarios against a baseline, modelled following the relevant Australian building codes, as specified below.

2.4.1. Independent Variables

The independent variables are all the parameters that have been varied in the simulation to create the different scenarios. In this study, three parameters have been used:
  • Cooling set point (CSP): One of the major and more recurrent complaints in open offices relates to the thermal environment, hence one of the tested variables relates to the temperature set point. The current Australian Standard AS 1837–1976 recommends offices to maintain summer set point temperature in the range of 21 °C to 24 °C, range that is further extended by the government’s guideline for safety and health in workplaces up to 26 °C [31]. However, tenancy agreements often prescribe an indoor temperature of 22 °C all year around [32] despite evidence indicating the neutral temperature to be higher [18]. Hence, CSP was assumed ranging from 21 °C to 26 °C, with steps of 1 °C. It is important to note that hereby the setpoint temperature is defined as the operative temperature threshold at which the mechanical system will start to operate.
  • Air change rate (ACH): The National Construction Code (NCC) of Australia [33] requires a minimum air change per hours equal to 7.5 L/pers. However, this value is currently being discussed after the global COVID-19 pandemic, which challenged all pre-assumptions on ventilation and fresh air rates to maintain healthy indoors [34]. Based on the increasing number of evidence [35,36], this analysis compared two ACH values, the first corresponding to an average standard value of 3 ACH, and the second reflecting an augmented indoor ventilation with 6ACH.
  • Occupancy density (OCC): New open-plan and activity-based offices are designed to support social interactions, which can be correlated to an increased diversity and abundance of indoor microbes [37]. Social distancing as a way to avoid potential airborne transmissions may lead to different occupation profiles of spaces, which is further impacted by increased work from home practices. With a higher number of employees benefiting from remote working, offices are likely to implement flexible arrangements in the post-pandemic future. This analysis accounted for these potential changes in occupation profiles by considering three different scenarios: 100%, 70% and 50% of occupation density, starting from the UK National Calculation Method schedule [38].
The total simulation matrix assessed is the linear combination of the different parameters considered, resulting in 36 different simulation scenarios.

2.4.2. Dependent Variables

The outputs of this analysis were the cooling energy consumption, expressed in kWh/m2 per year, and the discomfort hours based on the calculation method given in the ASHRAE 55 [30] and expressed as percentage over the year.

2.4.3. Simulation Model

The typical floorplans for Office 4 have been used to generate a virtual model for the assessment, undertaken using the transient simulation software. Based on the documentation available, the construction has been assumed as a standard curtain wall typology with double glazed units and external vertical shading, properties are reported in Table 4.
Similarly, the thermal properties of the construction elements are reported in Table 5.
The building is located in Melbourne, Victoria, Australia, and the TMY climate file for the Melbourne airport was retrieved from the new climate database for energy simulation [39] developed by CSIRO, the Australia’s national science and research agency. Operating schedules for mechanical cooling and heating activation times, occupancy rate, office equipment and lighting were all based on the [38].

3. Results and Discussion

3.1. Mapping the Trends in NABERS Energy Data using NABERS 10-Year Dataset

To find the trend in the number of commercial buildings that have used NABERS Energy, a longitudinal dataset from NABERS is analysed (Figure 1). Looking at each state in Australia, it can be seen that the number of NABERS Energy certified buildings for base building has almost quadrupled in the last ten years across the country. Except for the decrease in 2016, the ratio of growth fluctuated between 1.6%–16.6% after 2011. However, there is a dramatic increase (127.7%) in the numbers of certified base buildings in 2010 and 2011. The states of Australia such as Tasmania (TAS), The Northern Territory (NT), and South Australia (SA) have a minor impact on this increase. On the other hand, New South Wales (NSW), Victoria (VIC), and Queensland (QLD) have the greatest contribution, respectively. On a nationwide basis, the number of certified base building rate in NSW is 36% of the total in 2021.
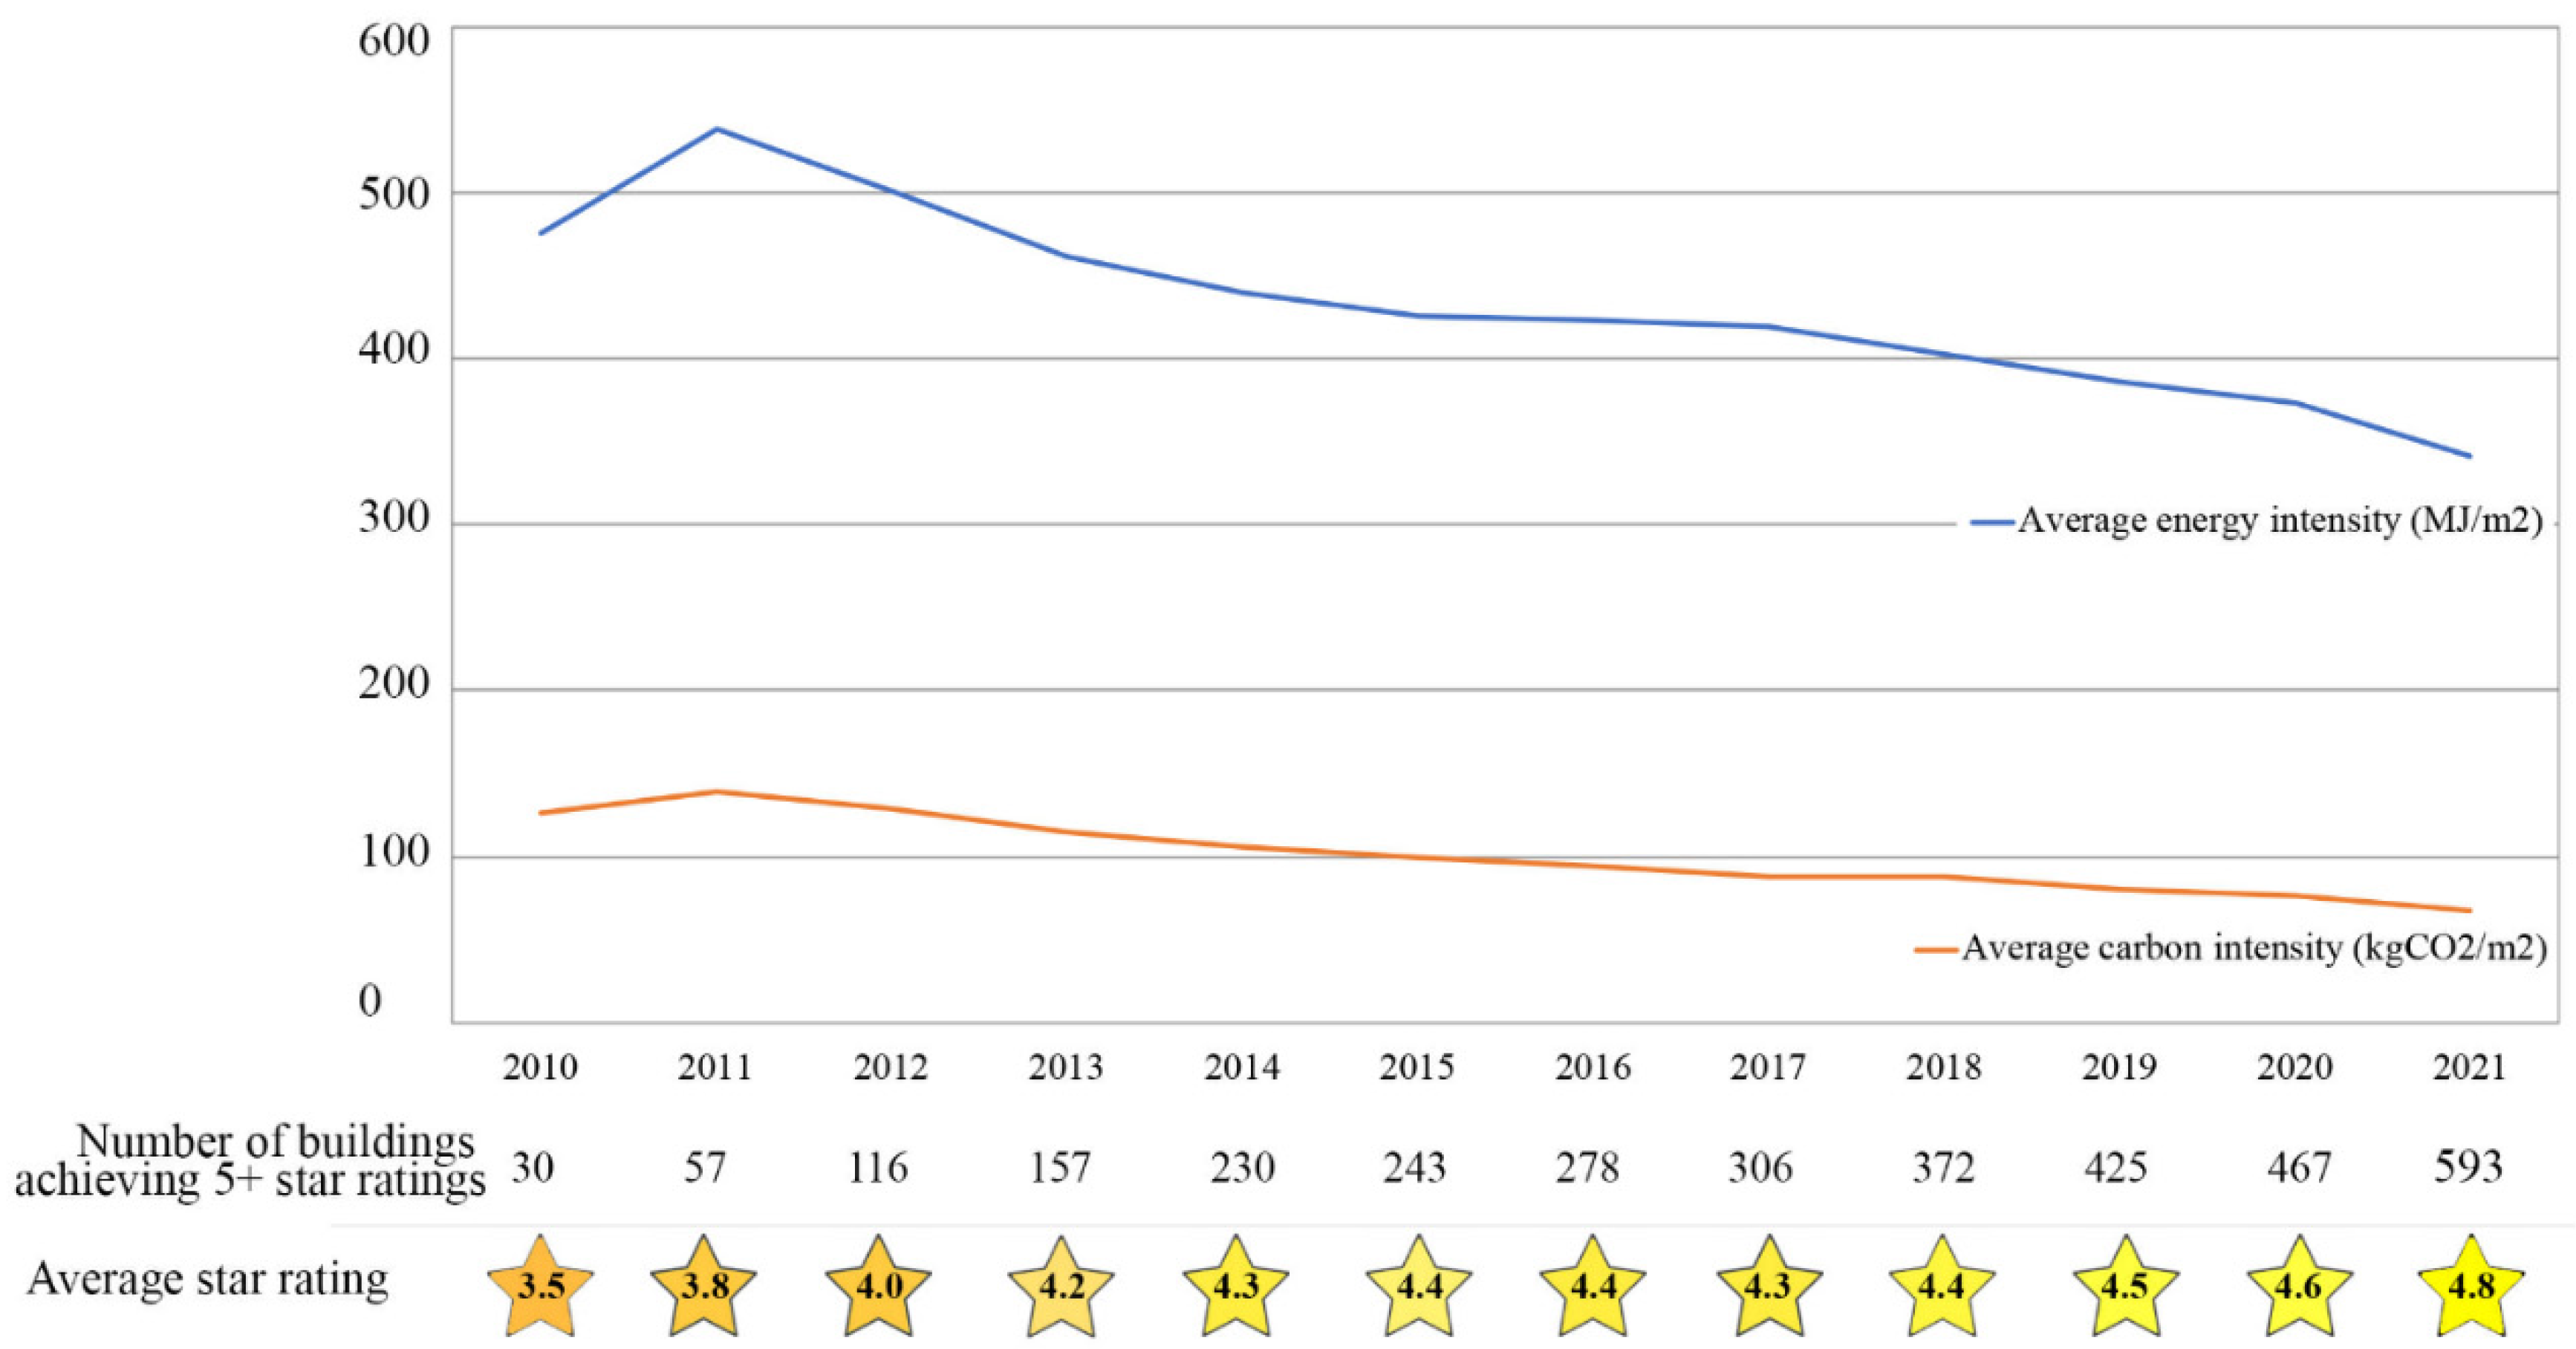
Figure 2 shows the trend in the average energy intensity (in MJ/m2) and carbon intensity (in kgCO2/m2) of the buildings achieving 5 and more star ratings in last ten years. In addition to the number of the buildings with 5 and more star ratings, the average star ratings were also included. This graph presents the slight decrease in average energy and carbon intensity of the buildings with 5 and more star ratings. The number of certified base buildings achieving 5 and more star ratings has been increased by almost 20 times. In parallel to this growth, the average star rating which was 3.5 in 2010 has been improved to 4.8 in 2021. While the number of high-performance buildings (from the aspects of energy ratings) and average star ratings were increasing dramatically, and despite the developments and adoption of high efficiency HVAC technologies and innovative material use, there was a slight decrease in average energy and carbon intensity of certified base buildings (5 stars and more) in the last ten years.
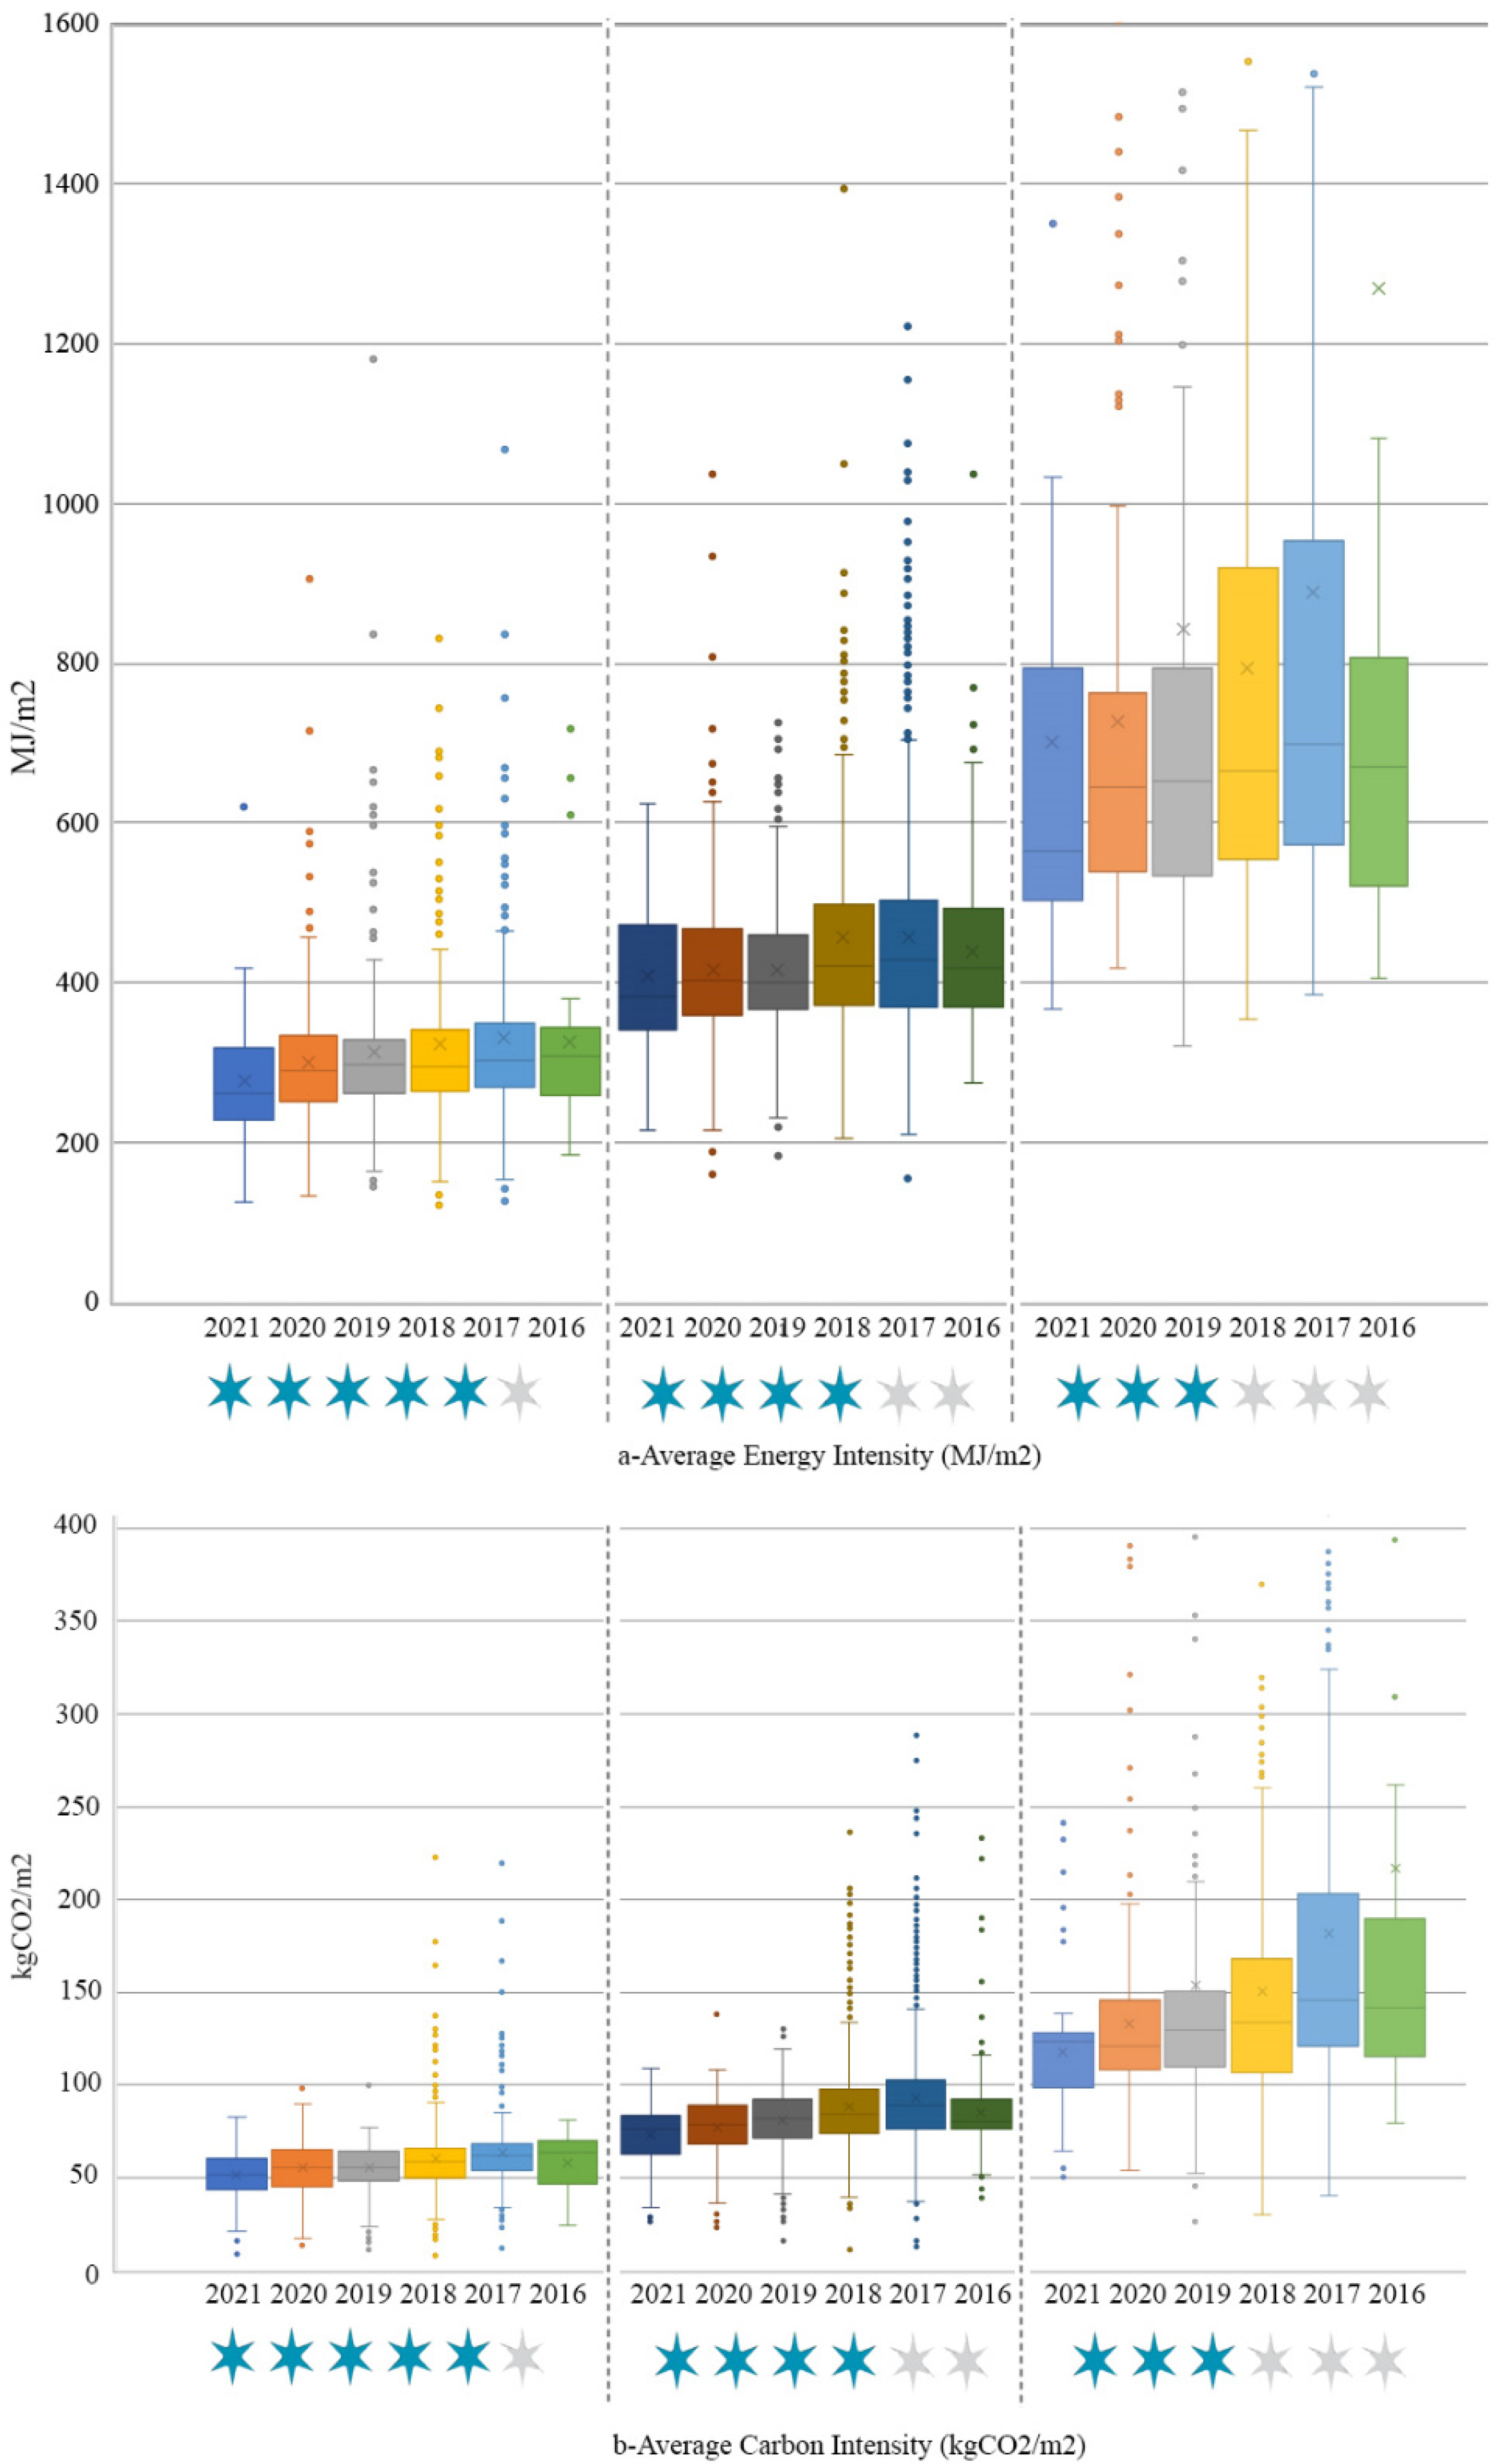
Figure 3 compares the change in average energy and carbon intensity of 5-, 4- and 3-stars rating certified base buildings in the last 5 years. The average energy intensities of 5-, 4-, and 3-stars rating base buildings in 2021 were recorded as 277.8, 407.4, and 700.4 MJ/m2, respectively. And in the same year, the carbon average intensities were listed as 117.8, 73.2 and 51.2 kgCO2/m2 for 5-, 4-, and 3- stars rating base buildings, respectively. As seen in the boxplot graph, the interquartile range of 3-stars rating certified base buildings is greater than other stars rating buildings. However, in both cases, there has been a slight decrease in the intensities over the last 5 years. The highest rate of decrease in average energy and carbon intensity has been recorded for 3-stars buildings as 81.2% and 84.0%, respectively. 5-stars rating base buildings have demonstrated a better performance than 4 stars rating base buildings for average energy intensity with the rate 17.3% (it was 7.6% for 4stars rating base buildings), however average carbon intensity decrease rate of 5-stars rating base buildings (12.8%) was lower than the 4-star rating base buildings (16.7%). Our findings further support the argument made by other studies [13,15,40] on the importance of NABERS as a compulsory building certification for commercial buildings specifically after the launch of CBDP. The increase in the number of NABERS energy-certified buildings and the improvement in the average start-rating for these building along with the enhance of energy and carbon-intensity have undoubtedly had an everlasting effect on the Australian built environment.

3.2. Thermal Comfort and Air Quality in NABERS-Certified Buildings

3.2.1. Thermal Comfort

The typical lease agreement in Australia imposes 21–24.9 °C as the acceptable indoor air temperature for commercial buildings to meet. As a mandatory certification for commercial office spaces of more than 1000 m2 in Australia under CBDP, all the studied offices held NABERS Energy rating for base building. Three offices had NABERS Energy 5 Star, three had NABERS Energy 5.5 Star, and one office had NABERS Energy 6 Star for the base building. Based on their NABERS rating, these offices are considered high-performance in terms of energy consumption.
In general, the average air temperature from 7 a.m. to 7 p.m. for majority of the studied floors (depicted in Table 6) fell within the 21–24.9 °C range. When looking at minimum recorded air temperature, most of the offices adhered to the guideline (21 °C), but the minimum temperature for some offices during the office hours were recorded between 17 to 19 °C which is lower than the recommendations by NABERS (21 °C). For maximum recorded temperature, majority of the offices recorded air temperature higher than NABERS’s recommendation of 24.9 °C. The difference between the maximum measured air temperature and the NABERS recommendation varied between 0.6 to 3.7 °C.
To understand the general fluctuation trend in air temperature for various days and hours, building 4, level 1 and building 7, level 11 were investigated in details. Figure 4 shows the temperature fluctuations for these two offices within the 7 a.m.–7 p.m. time period. In general, building 4 fell within the warmer side of the measured air temperature, meeting the recommendation in 87% of the occupied hours. Contrastingly, the measured air temperatures for building 7 were more inclined to cooler temperatures, meeting the recommendations for only 61% of the occupied hours. Although the average temperature fell within the recommendations, there are several data points with air temperature lower than 21 °C or higher than 24.9 °C. This was seen as a general trend for all offices investigated in this study.

3.2.2. Indoor Air Quality

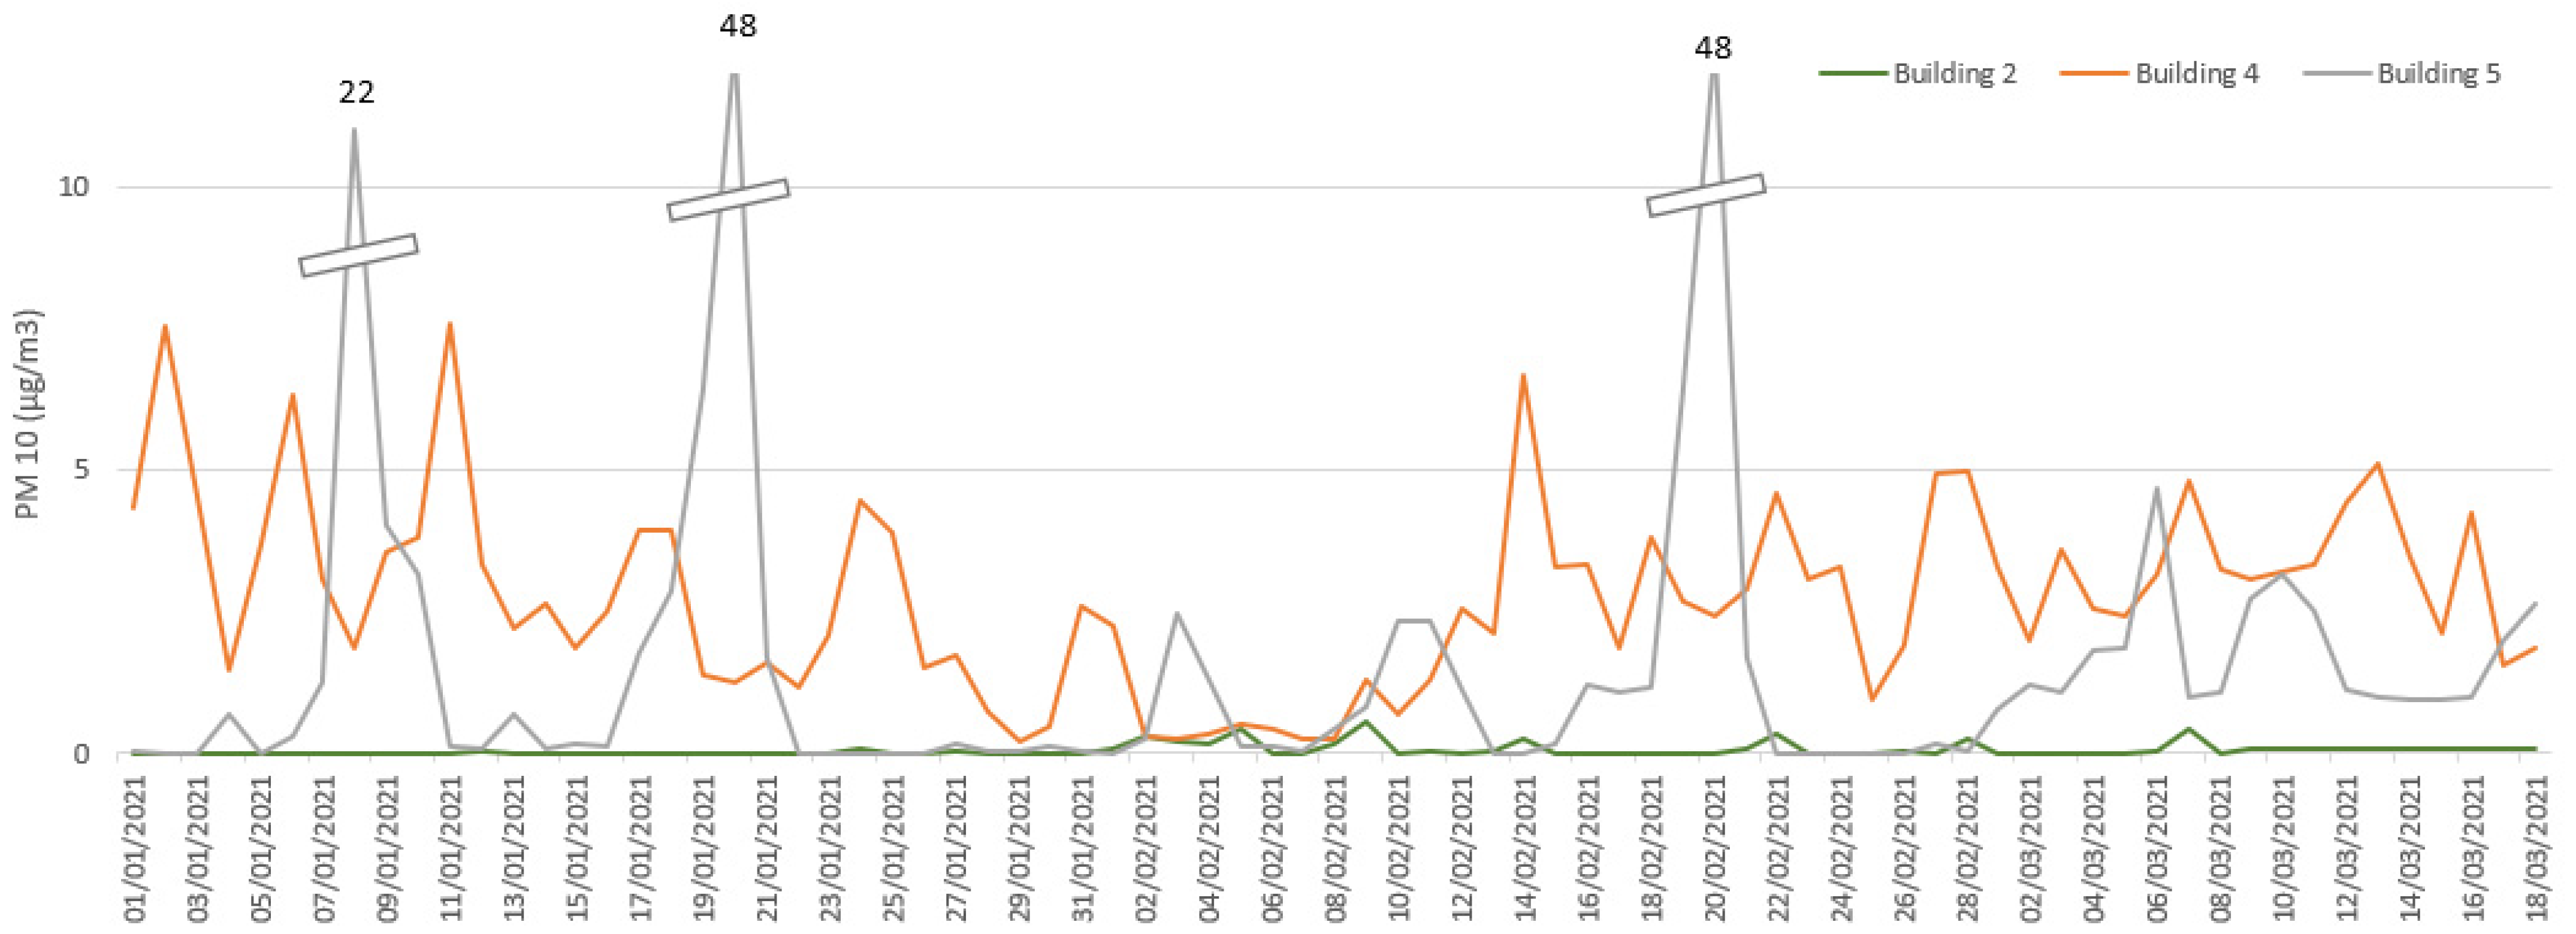
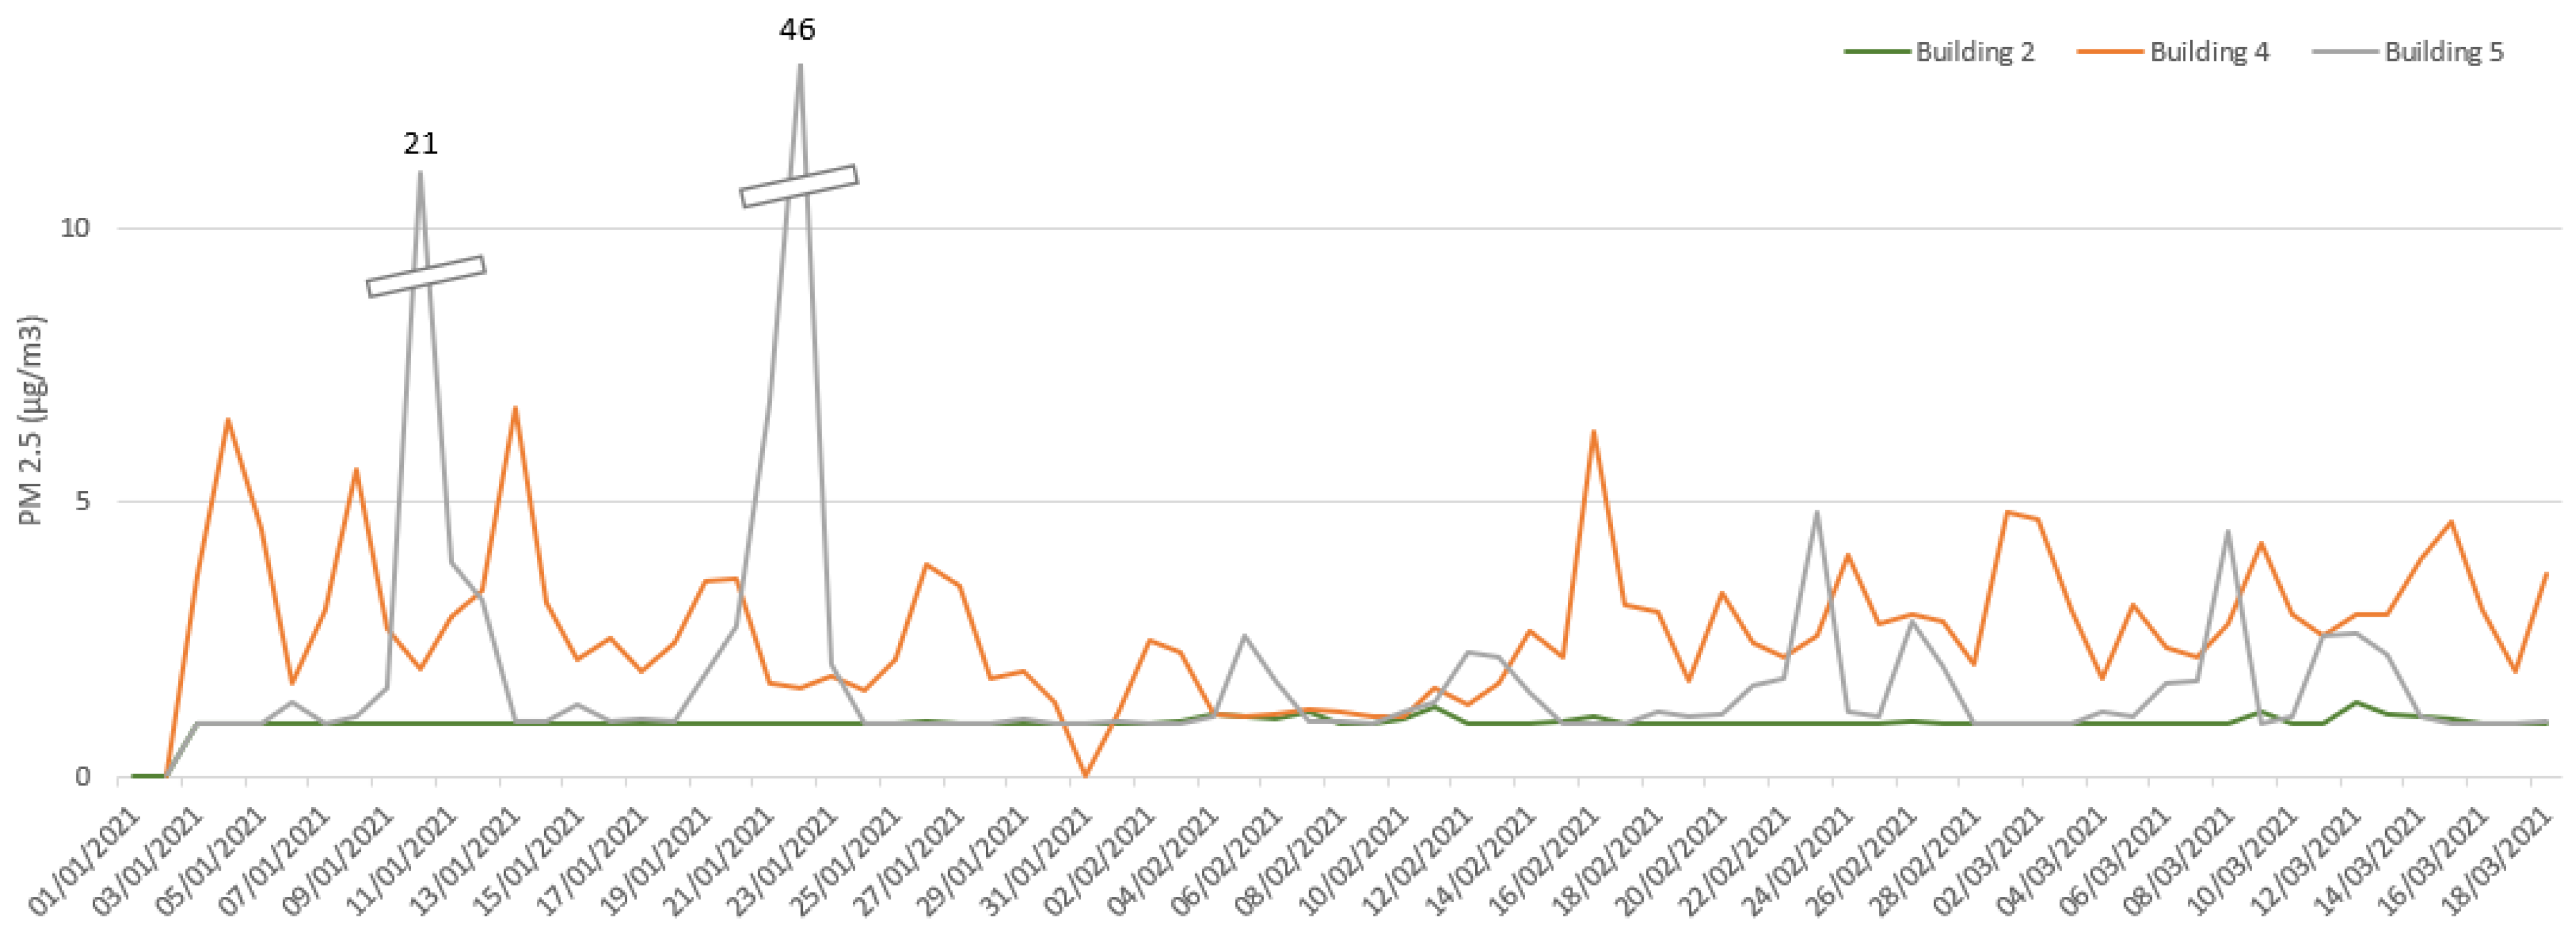
For IAQ, three variables of PM10, PM2.5, and CO2 were measured and explored in the NABERS energy-certified offices. For all floors and buildings, CO2 concentration levels fell within the suggested 850 ppm. As an example, Figure 5 shows the CO2 concentration levels in ppm for two floors located within two different buildings. The fluctuations were between 400 to 700 ppm with no measured data points beyond the recommended 850 ppm. For PM10, the measured values for majority of the offices were within the recommended 50 µg/m3. For a few offices the PM10 values were zero or near zero (Buildings 2, Figure 6). Other offices had several data points beyond the recommended threshold, but in general the average per day was within the recommendations (Building 4 and 5, Figure 6). For PM2.5, majority of the offices met the suggested threshold of 25 µg/m3 (Figure 7). Building 5 was among the very few offices for which the PM2.5 levels for a few days in the 2-month data collection period were higher than recommendations (25 µg/m3).

3.3. Satisfaction with Temperature and Air Quality in NABERS-Certified Buildings

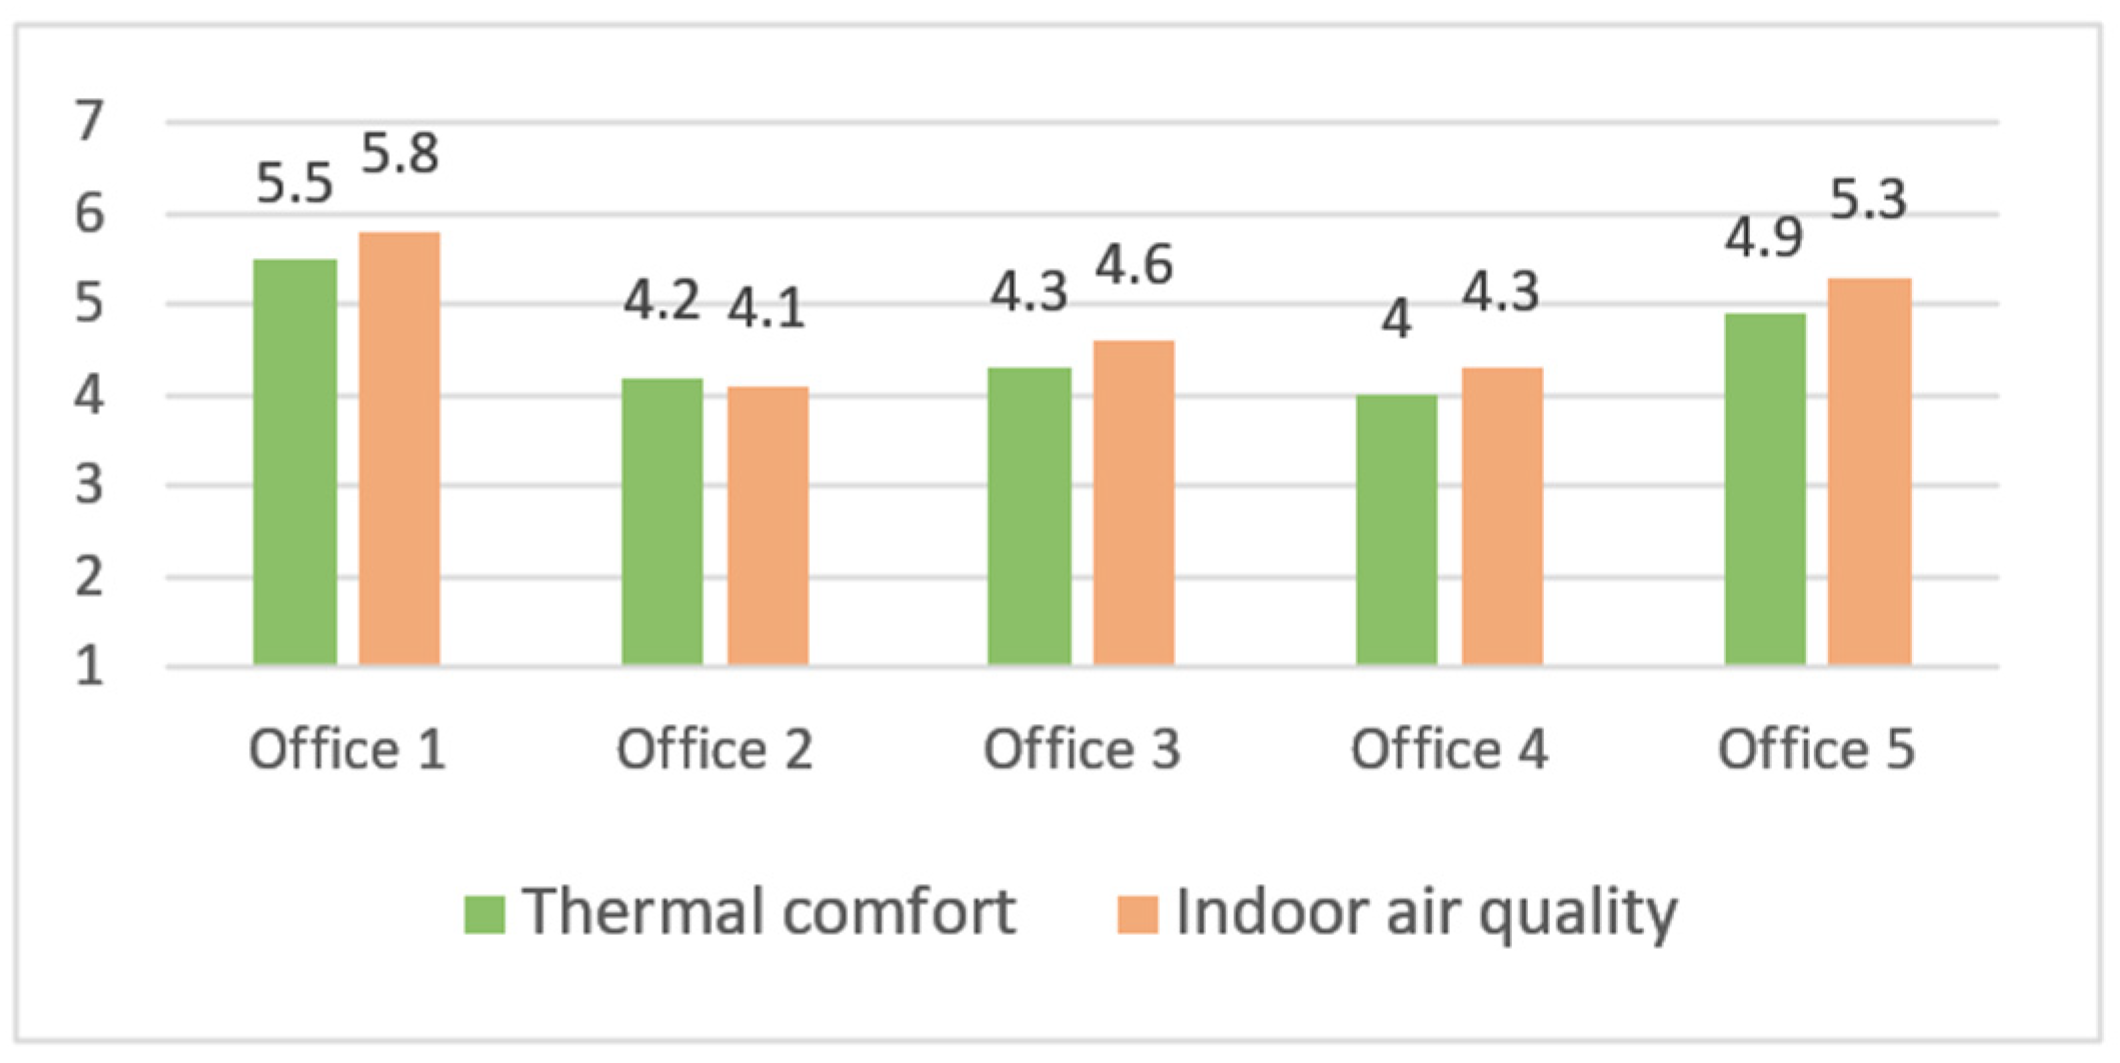
The average satisfaction scores for thermal comfort and IAQ considering all five NABERS-certified offices were 4.5 and 4.8 respectively on a seven-point Likert scale. When looking at thermal comfort for each individual office (Figure 8), the satisfaction scores for 4 out of 5 offices are less than 5 which is the average score for a none-high-performance office in our database. For office 1 this average is 5.5 out of 7 which is closer to the average score for high-performance offices. The satisfaction scores for indoor air quality (Figure 8) are in general higher compared to thermal comfort for all premises except office 2. Although all the studied offices held a NABERS base building rating for Energy consumption, the 20% dissatisfaction threshold for occupants’ satisfaction with thermal comfort was not observed in practice.
The average scores for thermal comfort and IAQ can give an overall view of the satisfaction levels, however the percentage of satisfied and dissatisfied occupants is a more accurate measure. Table 7 represents the percentage of people who reported being dissatisfied (1 = extremely dissatisfied, 2 = dissatisfied and 3 = somewhat dissatisfied on a 7-point Likert scale), neutral (4 = neither satisfied or dissatisfied) or satisfied (5 = somewhat satisfied, 6 = satisfied, and 7 = extremely satisfied on the Liker scale) for thermal comfort and IAQ. The percentage of dissatisfied occupants, as colour coded in the table, showed none of the offices met the 10% dissatisfaction threshold. Office 5 was the best performer with 18% dissatisfaction and the only office that met the common target of 20% dissatisfaction chased by corporate Australia, followed by office 1 and 3 with 22% and 34% dissatisfaction respectively. For office 2 and 4, 42% of the respondents reported dissatisfaction which is quite a high percentage. For IAQ, the dissatisfied percentages were slightly lower, with 2 offices (office 1 and 5) having less than 10% dissatisfied respondents, followed by offices 3,4, and 2 with 25%, 27% and 38% dissatisfied respondents respectively.
When investigating the reasons for the reported dissatisfaction with thermal comfort (Figure 9), “too cold” is indicated by 57% of the occupants, and office being “too hot” was indicated by 44% of the respondents. Other dissatisfaction reasons such as local discomfort (neck, hands or ankles are too hot/cold), incoming sun, draughty, hot or cold surrounding surfaces were reported by a small number of the respondents. For IAQ, not enough air movement was pointed out by 61% of the respondents, and air being “stuffy” was reported by more than half (54%) of the respondents. Other dissatisfaction reasons are “air too dry” (20%), “air too humid” (9%), “bad odour” (9%), and “too much air movement” (7%).
Although all these five offices are following the mandatory NABERS guidelines to meet the 20% dissatisfaction threshold for indoor comfort, what was reported by the respondents indicated that majority of these offices did not meet this threshold. These findings are aligned with the findings from the measured thermal comfort and IAQ variables discussed earlier which showed there were several data points below the NABERS recommended minimum (21 °C) or above the maximum recommended temperature (24.9 °C). Aligned with these findings, a study by [41] reported office environment being “too cold” as the main source of dissatisfaction for respondents in air-conditioned buildings, while low humidity (air too dry), too much air movement and incoming sun were not among the top sources of dissatisfaction with temperature and IAQ. A recent study [12] looked at POE and IEQ data from nine office buildings in United Arab Emirates (UAE). They reported temperature ranges slightly above or below the recommended range for these offices, with 55% of the respondents indicating being “too cold” as their dissatisfaction reason. Regarding air quality, “stuffy air” and “headache” were stated by 45% and 30% of the respondents respectively. Similarly, a study by Hua et al. (2014) reported cold offices and low air movement specifically in offices with higher concentration of CO2 as the key sources of dissatisfaction in office buildings.

3.4. Predicting Energy Consumption under Various Conditions of CSP, ACH and OCC

As depicted in Table 7, office 4 presents a significant high number of occupants rating the indoor environment “too cold” and, therefore, dissatisfying (42% of respondents are dissatisfied with their thermal environment). The office being “too cold” is stated by 70% of the respondents (Figure 10) in this office and it lies in the low set point cooling temperature suggested by the Australian lease agreements, despite recurring evidence in literature highlight that thermal neutrality in offices may be higher. Cascading effects of fixed thermostats span beyond the thermal comfort of the building’s users, directly impacting the final energy consumption and, hence, the ability of the built environment to meet the ambitious 2050 net-zero target. The transient simulation campaign investigated this issue by assessing comfort and energy impacts of different indoor management strategies and practices aimed at:
1-decreasing the dissatisfaction about the indoor thermal environment by adopting higher set point temperature;
And in the context of recent concerns for COVID-19:
2-accommodating remote working arrangements and supporting workers to work from home more frequently;
3-decreasing the potential airborne transmission of COVID-19 by employing higher fresh air ventilation rates.
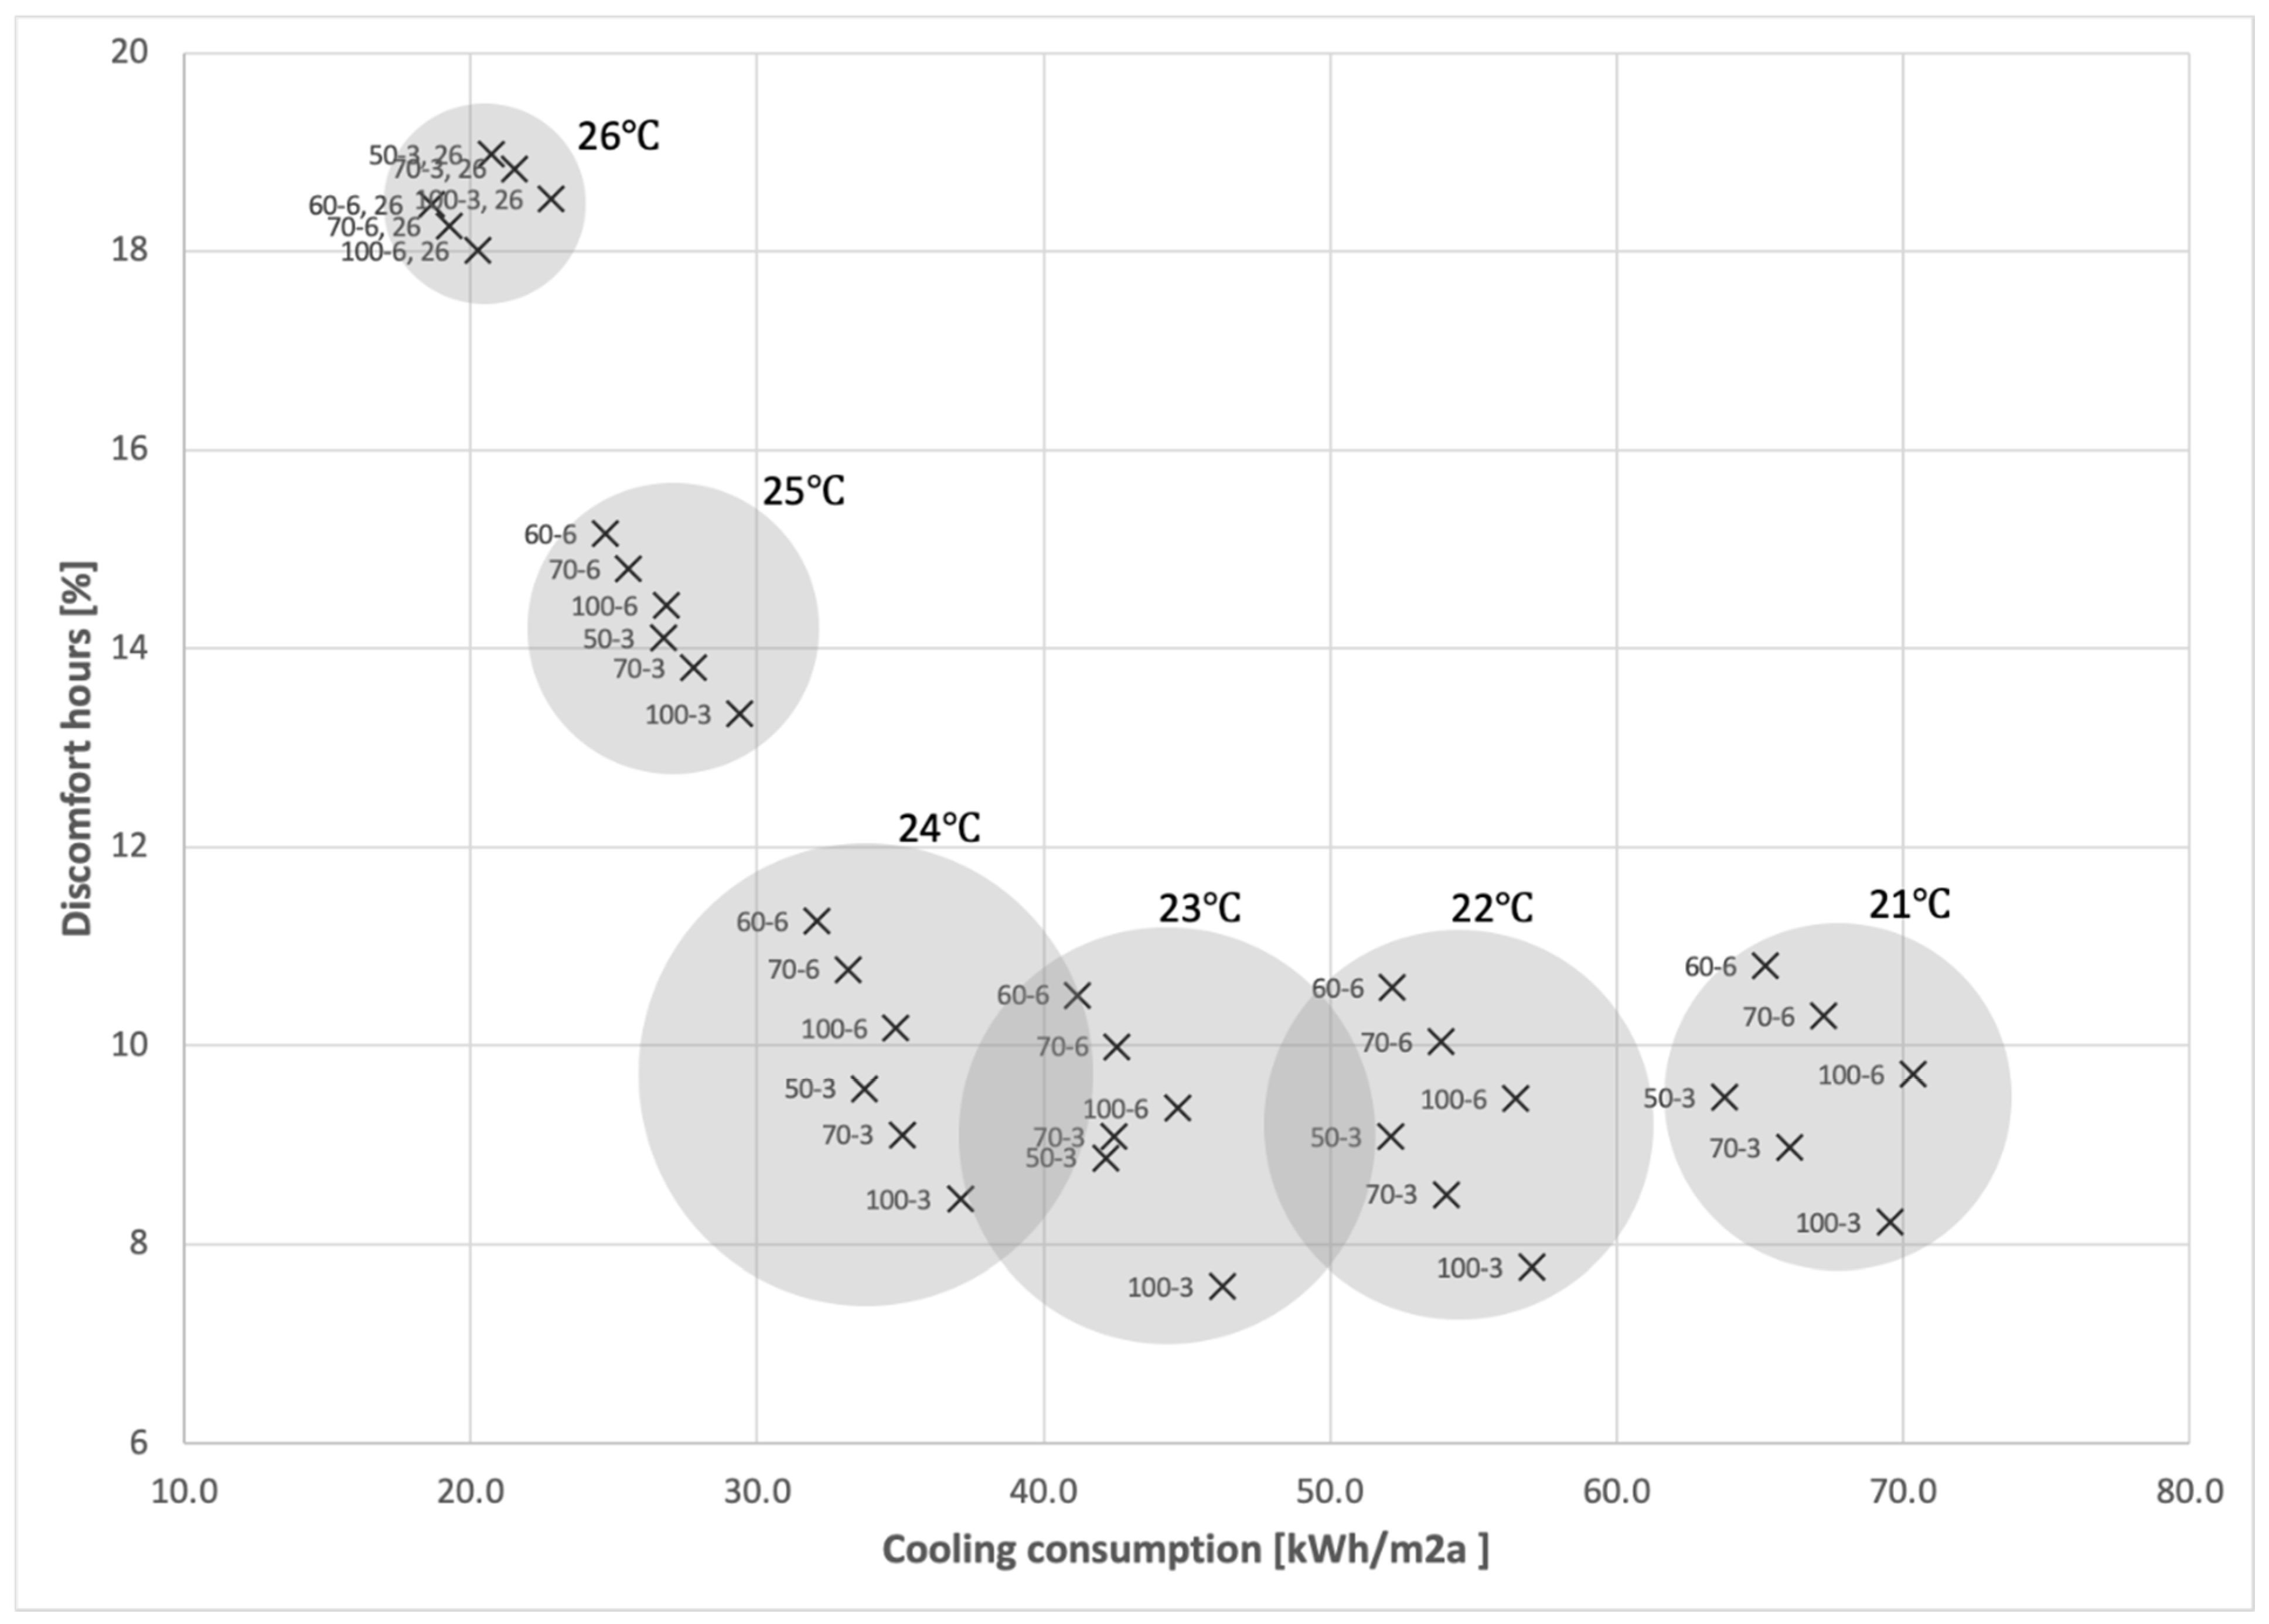
Figure 11 shows the results, where the horizontal axis reports the cooling consumption and the vertical axis the percentage of discomfort hours. Each X in the graph represents a scenario, and the names indicate the occupation density and ventilation rate: OCC-ACH. OCC varies form 100, 70 and 50%, while ACH between 3 and 6, as discussed in the methodology section. Additionally, the bubbles contain all scenarios with a specific set point temperature, and their radius visually indicates the dispersion of the results.
Predictably, higher set point temperatures of 25 °C and 26 °C are reflected into lower energy consumptions and higher discomfort hours. Referring to the CSP scenario, this graph reveals a clear tendency that can be observed regardless from ACH and OCC scenarios. The difference in discomfort hours found in the CSP range between 21 °C to 24 °C is not significant, varying in average of less than 4%, translated in 350 h over one year. This result indicates that, within the average range 21 °C to 24.9 °C, there is not a significant difference in discomfort hours that could drive the selection of one temperature set-point over the other. On the contrary, when cooling is considered, the lower operative temperature consumes two times more energy (from average of 35 kWh/m2a at 24 °C to 65 kWh/m2a at 21 °C), suggesting that higher set points are beneficial when optimizing both comfort and energy. Looking even beyond this value, from 24 °C to 26 °C, the number of discomfort hours doubles each CSP degree, while the energy consumption is reduced of less than 15 kWh/m2a. Considering the POE results for this office, the indoor operative temperature during occupied hours ranges from 22 °C to 28.6 °C, with an average of 24 °C, however, the majority of the occupants rated their thermal environment as “too cold”, revealing a significant discrepancy between the model currently employed to design, certify and operate buildings, and the real perception of people that occupy that building every day. Challenging the current practices, these results may suggest that a cooling set point temperature on the upper limit of the range indicated by the Australian standard may optimize both outputs, hence minimizing the energy consumption without significantly increasing discomfort, or even increasing the perceived satisfaction with the indoor environment.
Occupation seems to play an important role on both comfort and energy. Higher occupancy rates result in higher cooling consumption, yet lower percentage of discomfort hours. Clearly, occupancy relates to the internal heat gains and, the more workers are present in the office, the higher is the heat that needs to be discharged from the space. The comfort output lumps both summer and winter values of hours outside the comfort zone, which suggests that OCC variable can help to maintain a more stable temperature during winter, when the internal heat gain are beneficial to the overall building thermal performance. Looking at the specific ACH scenarios, it appears that lower ACH are associated to lower percentage of discomfort hours, regardless from the CSP and OCC values. This result suggest that the outside temperatures are often beyond the comfort thresholds and fresh air inlet must be carefully designed. However, the POE results highlighted a high frequency of complaints related to the IAQ, rated “too stuffy”. Increased ACH may, on one side, responds to the need for increased fresh air and ventilation rate resulting from novel safety concerns introduced by the COVID-19 pandemic, while, on the other side, optimize the occupant’s satisfaction with the IAQ. As discussed for the thermal environment, these results suggest that the current indoor management practices are based on aggregated models and assumptions that are no longer optimal in representing the needs, requirements and expectations of workers in regard to their workplace.

4. Conclusions

This study investigated the potential of curbing energy consumption from commercial buildings in Australia by increasing summer temperature set-points. It analysed the 10-year NABERS dataset, objective air temperature and air quality data and survey data from NABERS-certified commercial building and explored the different simulation scenarios for discomfort hours and energy consumption.
The historical data shows there has been a dramatic increase in uptake of NABERS rating tool in commercial buildings across all states of Australia, with the average star rating improving every year. However, there has been a very slight decrease in average energy and carbon intensity of NABERS-certified base buildings in the last ten years.
When exploring the temperature, air quality and occupants’ satisfaction data from NABERS-certified buildings, there are still a great number of occupants who are dissatisfied with thermal and air quality conditions of these building. The indoor environment being “too cold” is the main source of occupants’ dissatisfaction, followed by being “too hot”. Aligned with the survey data, objective measurements show that, although the average air temperature from 7 a.m. to 7 p.m. for majority of the studied offices was within the 21–24.9 °C range, there are many data points which are outside the recommended temperature range. In practical terms, occupant satisfaction found in NABERS-certified buildings was not within then 90% satisfaction. With several studies reporting occupants’ dissatisfaction with the temperature and air quality, it is doubtful that achieving this 90% satisfaction is even feasible in fully air-conditioned buildings.
Findings from simulation scenarios showed that there are no significant differences in discomfort hours within the average temperature setpoint of 21 °C to 24.9 °C. On the contrary, when cooling is considered, the lower temperature consumes two times more energy, suggesting that higher set points are beneficial when optimizing both comfort and energy. From 24 °C to 26 °C, the number of discomfort hours doubles for each CSP degree, while the energy consumption reduction is insignificant. Our study challenges the current practices of Australian commercial sector, suggesting that a CSP temperature on the upper limit of the recommended range can reduce energy consumption without sacrificing thermal comfort. This setpoint might even increase the overall satisfaction with thermal comfort within an office environment as the main source of occupants’ dissatisfaction was reported as a cold indoor environment.

Author Contributions

Conceptualization, C.C., S.M., A.B., O.G. and D.V.; methodology, C.C., S.M., A.B., O.G. and D.V.; software, A.B., S.M. and O.G.; formal analysis, A.B., S.M. and O.G.; investigation, A.B., S.M., O.G., C.C., D.V. and C.J.; data curation, A.B., S.M. and O.G.; writing—original draft preparation, S.M., A.B., C.C., O.G. and D.V.; writing—review and editing, S.M., A.B., C.C., O.G., D.V. and C.J.; visualization, A.B., S.M. and O.G.; supervision, C.C.; funding acquisition, C.C. All authors have read and agreed to the published version of the manuscript.

Funding

This research was funded by the Australian Government through the Australian Research Council’s Discovery Projects scheme (project DP190100705).

Data Availability Statement

For Section 3.1, publicly available dataset was analysed which can be found here: [https://www.nabers.gov.au/ratings/find-a-current-rating?buildingtype=office&ratingscope=tenancy&ratingtype=energy&starratings=4.5,5,5.5,6 accessed on 16 September 2022]. Data used for Section 3.2 and Section 3.3 cannot be shared due to confidentiality and ethics.

Acknowledgments

Authors thank all participants for taking the time completing the online survey. The authors also thank Alex Ellerman and AETMOS for contributions to this paper.

Conflicts of Interest

The authors declare no conflict of interest.

References

  1. IPCC. Climate Change 2022: Impacts, Adaptation and Vulnerability. 2022. Available online: https://www.ipcc.ch/report/ar6/wg2/ (accessed on 15 May 2022).
  2. Brambilla, A.; Candido, C.; Sangiorgio, M.F.; Gocer, O.; Gocer, K. Can commercial buildings cope with Australian bushfires? An IAQ analysis. Build. Cities 2021, 2, 583–598. [Google Scholar] [CrossRef]
  3. Jensen, C.A.; Yule, J. Response strategies used to mitigate the effect of extreme weather on rural and remote housing in Australia. IOP Conf. Ser. Mater. Sci. Eng. 2022, 1218, 012049. [Google Scholar] [CrossRef]
  4. Warner, R.F. The impacts of flood-mitigation structures on floodplain ecosystems: A review of three case studies from Australia and France. Aust. Geogr. 2022, 53, 265–295. [Google Scholar] [CrossRef]
  5. Azeem, A.; Chiranjeevi, C.; Sekhar, Y.R.; Natarajan, M.; Srinivas, T. Performance optimization of chiller used for commercial building air-conditioning. Green Energy Technol. 2023, 2, 509–522. [Google Scholar] [CrossRef]
  6. Dowling, R.; Carr, C.; McGuirk, P. Orchestrating energy transitions: From ‘eco-bling’ to tuning the building. Soc. Cult. Geogr. 2022, 1–20. [Google Scholar] [CrossRef]
  7. Hou, F.; Ma, J.; Kwok, H.H.L.; Cheng, J.C.P. Prediction and optimization of thermal comfort, IAQ and energy consumption of typical air-conditioned rooms based on a hybrid prediction model. Build. Environ. 2022, 225, 109576. [Google Scholar] [CrossRef]
  8. Department of Climate Change, Energy, the Environment and Water (CCEEW), Australian Government. Commercial Buildings. 2022. Available online: https://www.energy.gov.au/government-priorities/buildings/commercial-buildings#:~:text=The%20commercial%20building%20sector%20is,reduce%20operating%20costs (accessed on 21 July 2022).
  9. Residovic, C. The new NABERS indoor environment tool—The next frontier for Australian Buildings. Procedia Eng. 2017, 180, 303–310. [Google Scholar] [CrossRef]
  10. Bannister, P. NABERS: Lessons from 12 Years of Performance Based Ratings in Australia; Energy Systems Laboratory, Texas A&M University: College Station, TX, USA, 2012; Available online: http://esl.tamu.edu (accessed on 28 June 2022).
  11. AUSNVIRO. The Performance of NABERS. 2013. Available online: https://www.ausnviro.com.au/the-performance-of-nabers/#:~:text=A%20Brief%20History,a%20buildings%20energy%20efficiency%20system (accessed on 5 September 2022).
  12. Kim, Y.K.; Abdou, Y.; Abdou, A.; Altan, H. Indoor environmental quality assessment and occupant satisfaction: A post-occupancy evaluation of a UAE University Office Building. Buildings 2022, 12, 986. [Google Scholar] [CrossRef]
  13. Mallaburn, P.; Azhari, R.; Fawcett, T.; Topouzi, M. Australian non-domestic buildings policy as an international exemplar. Build. Cities 2021, 2, 318–335. [Google Scholar] [CrossRef]
  14. Burroughs, S. Improving office building energy-efficiency ratings using a smart-engineering–computer-simulation approach: An Australian case study. Adv. Build. Energy Res. 2018, 12, 217–234. [Google Scholar] [CrossRef]
  15. Roumi, S.; Stewart, R.; Zhang, F.; Santamouris, M. Unravelling the relationship between energy and indoor environmental quality in Australian office buildings. Sol. Energy 2021, 227, 190–202. [Google Scholar] [CrossRef]
  16. Gui, X.; Gou, Z. Association between green building certification level and post-occupancy performance: Database analysis of the National Australian Built Environment Rating System. Build. Environ. 2020, 179, 106971. [Google Scholar] [CrossRef]
  17. NABERS. NABERS Indoor Environment. 2015. Available online: https://www.nabers.gov.au/sites/default/files/_nabers_indoor_environment_guide_bv_edit.pdf (accessed on 30 May 2022).
  18. Zhang, F.; Haddad, S.; Nakisa, B.; Rastgoo, M.N.; Candido, C.; Tjondronegoro, T.; de Dear, R. The effects of higher temperature setpoints during summer on office workers’ cognitive load and thermal comfort. Build. Environ. 2017, 123, 176–188. [Google Scholar] [CrossRef] [Green Version]
  19. Hua, Y.; Göçer, Ö.; Göçer, K. Spatial mapping of occupant satisfaction and indoor environment quality in a LEED platinum campus building. Build. Environ. 2014, 79, 124–137. [Google Scholar] [CrossRef]
  20. NABERS. “Find a Current Rating” Tool. Available online: https://www.nabers.gov.au/ratings/find-a-current-rating (accessed on 6 October 2022).
  21. Olesen, B.W.; Parsons, K.C. Introduction to thermal comfort standards and to the proposed new version of EN ISO 7730. Energy Build. 2002, 34, 537–548. [Google Scholar] [CrossRef]
  22. Alfano, F.R.; Olesen, B.W.; Palella Bi, I.; Riccio, G. Thermal comfort: Design and assessment for energy saving. Energy Build. 2014, 81, 326–336. [Google Scholar] [CrossRef]
  23. Kantor, N.; Unger, J. The most problematic variable in the course of human-biometeorological comfort assessment-the mean radiant temperature. Cent. Eur. J. Geosci. 2011, 3, 90–100. [Google Scholar] [CrossRef] [Green Version]
  24. Langner, M.; Scherber, K.; Endlicher, W. Indoor heat stress: An assessment of human bioclimate using the UTCI in different buildings in Berlin. DIE ERDE–J. Geogr. Soc. Berl. 2013, 144, 260–273. [Google Scholar]
  25. Matzarakis, A.; Amelung, B. Physiological equivalent temperature as Indicator for impacts of climate change on thermal comfort of humans. In Seasonal Forecasts, Climatic Change and Human Health; Thomson, M., Garcia-Herrera, R., Beniston, M., Eds.; Springer: Cham, The Netherlands, 2008; pp. 61–72. [Google Scholar]
  26. ASHRAE. ASHRAE Standard 62.1-2019: Ventilation for Acceptable Indoor Air Quality. American Society of Heating, Refrigerating and Air-Conditioning Engineers (ASHRAE). 2019. Available online: https://www.ashrae.org/technicalresources/bookstore/standards-62-1-62-2 (accessed on 10 June 2022).
  27. ABCB (Australian Building Codes Board). Building Code of Australia 577 2019, Class 2 to 9 Buildings; National Construction Code Series; ABCB: Canberra, Australia, 2019; Volume 1. [Google Scholar]
  28. WHO (World Health Organization). WHO Guidelines for Indoor Air Quality: Dampness and Mould; WHO: Geneva, Switzerland, 2009. [Google Scholar]
  29. ADEE (Australia Department of Environment and Energy). National Air Quality Standards. 2016. Available online: https://soe.environment.gov.au/theme/ambient-air-quality/topic/2016/national-air-quality-standards (accessed on 5 February 2022).
  30. ANSI/ASHRAE Standard 55; American Society of Heating, Refrigerating and Air-Conditioning Engineers ASHRAE Standard: Thermal Environmental Conditions for Human, Ventilation. The Society: New York, NY, USA, 2020.
  31. Safework NSW, NSW Government. Safety Starts Here: Physical Safety at Work—The Basics, Facilities at Work. 2020. Available online: https://www.safework.nsw.gov.au/safety-starts-here/physical-safety-at-work-the-basics/facilities-at-work (accessed on 30 May 2022).
  32. Roussac, A.C.; Bright, S. Improving environmental performance through innovative commercial leasing: An Australian case study. Int. J. Law Built Environ. 2012, 4, 6–22. [Google Scholar] [CrossRef]
  33. National Construction Code. 2019. Available online: https://ncc.abcb.gov.au/ (accessed on 30 May 2022).
  34. WHO (World Health Organization). Roadmap to Improve and Ensure Good Indoor Ventilation in the Context of COVID-19; WHO: Geneva, Switzerland, 2021. [Google Scholar]
  35. Bhagat, R.K.; Wykes, M.D.; Dalziel, S.B.; Linden, P.F. Effects of ventilation on the indoor spread of COVID-19. J. Fluid Mech. 2020, 903. [Google Scholar] [CrossRef]
  36. Dietz, L.; Horve, P.F.; Coil, D.A.; Fretz, M.; Eisen, J.A.; Van Den Wymelenberg, K. 2019 novel coronavirus (COVID-19) pandemic: Built environment considerations to reduce transmission. Msystems 2020, 5, e00245-20. [Google Scholar] [CrossRef] [PubMed]
  37. Kembel, S.W.; Meadow, J.F.; O’Connor, T.K.; Mhuireach, G.; Northcutt, D.; Kline, J.; Moriyama, M.; Brown, G.Z.; Bohannan, B.J.M.; Green, J.L. Architectural design drives the biogeography of indoor bacterial communities. PLoS ONE 2014, 9, e87093. [Google Scholar] [CrossRef] [PubMed]
  38. UK NCM. UK’s National Calculation Method for Non Domestic Buildings. 2022. Available online: https://www.uk-ncm.org.uk (accessed on 30 May 2022).
  39. CSIRO Energy. Typical Meteorological Year Weather Files for Building Energy Modelling. Available online: https://acds.csiro.au/future-climate-typical-meteorological-year (accessed on 30 May 2022).
  40. Lee, C.L.; Gumulya, N. The role of mandatory building efficiency disclosure on green building price premium: Evidence from Australia. Buildings 2022, 12, 297. [Google Scholar] [CrossRef]
  41. Licina, D.; Yildirim, S. Occupant satisfaction with indoor environmental quality, sick building syndrome (SBS) symptoms and self-reported productivity before and after relocation into WELL-certified office buildings. Build. Environ. 2021, 204, 108183. [Google Scholar] [CrossRef]
Figure 1. The number of certified base buildings in the last decade.
Buildings 12 02259 g001
Figure 2. Comparison of certified base buildings’ average energy and carbon intensity, the number of buildings achieving 5 and more star ratings, and the average star ratings in the last decade.
Buildings 12 02259 g002
Figure 3. Comparative analysis of 5-, 4- and 3-stars rating certified base buildings’ performance in the last five years.
Buildings 12 02259 g003
Figure 4. Air temperature fluctuations from 7 a.m. to 7 p.m. in building 4, level 1 and building 7, level 11.
Buildings 12 02259 g004
Figure 5. The 24-h average for CO2 for two floors located in two different buildings.
Buildings 12 02259 g005
Figure 6. The measured PM10 for three floors located in three different buildings.
Buildings 12 02259 g006
Figure 7. The measured PM2.5 for three floors located in three different buildings.
Buildings 12 02259 g007
Figure 8. Average satisfaction scores for thermal comfort and indoor air quality in five NABERS offices.
Buildings 12 02259 g008
Figure 9. Sources of dissatisfaction with thermal comfort (left) and indoor air quality (right) for the dataset (n = 273) collected from 5 NABERS offices (percentages are within the dissatisfied respondents).
Buildings 12 02259 g009
Figure 10. Sources of dissatisfaction with thermal comfort (left) and indoor air quality (right) for office 4 (percentages are within the dissatisfied respondents).
Buildings 12 02259 g010
Figure 11. Cooling energy consumption and discomfort hours for 36 simulation scenarios.
Buildings 12 02259 g011
Table 1. Three levels of NABERS rating.
Type of Rating Component
TenancyTenancy energy consumption, including:
  • Lighting
  • Power to equipment (including computer servers and tenant installed signage within the building)
  • Tenant-controlled supplementary air-conditioning
  • Generator fuel for tenant usage.
Base Building
Energy consumed by building’s central services including:
  • Common area lighting,
  • Lifts
  • Air-conditioning and ventilation
  • Exterior lighting
  • Car park ventilation and lighting
  • Hydraulic systems and DHW systems
  • Safety and emergency systems
  • Miscellaneous fans (e.g., kitchens, toilets, refuse etc)
  • Supplementary services provided for tenants, e.g., chilled water / condenser water/ outside air
  • On-site generators.
Whole Building
  • Energy consumed in base building systems as listed above, plus
  • Tenant lighting,
  • Power and
  • Supplementary air-conditioning.
Table 2. NABERS ENERGY scheme.
6 Stars Market leading performance
5 Stars Excellent performance
4 Stars Good performance
3 Stars Average performance
2 StarsBelow average performance
1 StarPoor performance
Table 3. Basic demographics of the survey respondents.
Survey QuestionAnswersPercentage
When were you born?1946–1964 (Baby Boomers)11%
1965–1979 (Generation X)35%
1980–1994 (Generation Y)45%
1995–2012 (Generation Z)6%
2013–20250%
Prefer not to respond2%
Which gender do you identify with the most?Female42%
Male54%
Intersex, other and prefer not to respond3%
On a typical week, how many hours do you work?10 h or less1%
11 to 30 h2%
31–40 h33%
41–50 h41%
51–60 h20%
More than 60 h and prefer not to respond3%
Which one of the following best describes the type of work you do?Managers and administrators40%
Professionals42%
Tradespersons and related workers0%
Clerical7%
Sales and service5%
Other and prefer not to respond5%
Table 4. Properties detail for the standard curtain wall used in the simulation.
Component U-Value (W/m2K)Solar Heat Gain Transmittance (-)Light Transmittance (%)
High performance DGU (total system, including glazing and frame)2.80.465
Table 5. Thermal properties of the construction elements.
Component R-Value (m2K/W)
Horizontal spandrel panel1.0
Concrete slab3.7
Slab on grade2.0
Internal partitions1.4
Concrete floor 2.0
Table 6. Minimum, maximum and average air temperature measured in NABERS-certified Australian office in summer season (Jan-March 2021).
NABERS Energy Rating Measurement PeriodTemperature
7 a.m.–7 p.m. (A Typical Flexible Workday)
Exc. Saturday and Sunday
MinimumMaximumAverage
Building 15 StarLevel 424 January–14 March 202119.323.120.7
Level 824 January–14 March 202121.625.022.9
Building 26 StarLevel 61 January–18 March 202124.127.225.2
Level 101 January–18 March 202121.423.422.2
Building 35.5 StarLevel 21 January–24 February 202121.827.524.1
Level 41 January–17 March 202121.727.623.2
Building 45.5 StarLevel 11 January–18 March 202122.028.624.0
Building 55 StarLevel 71 January–17 March 202121.825.523.4
Building 65 StarLevel 11 January–17 March 202117.224.722.4
Building 75.5 StarLevel 111 January–18 March 202117.626.321.6
Blue colour shows air temperature lower than, and purple colour shows air temperature higher than the recommended air temperature by NABERS.
Table 7. Percentage of satisfied and dissatisfied occupants for five studied offices.
TemperatureIAQ
Office Dissatisfied %Neutral %Satisfied %Dissatisfied %Neutral %Satisfied %
3Office 1220789083
4Office 2421346382338
12Office 3341551252352
17Office 4421741272746
29Office 518146881478
Overall 301456212159
Dissatisfied percentage Buildings 12 02259 i001.
Publisher’s Note: MDPI stays neutral with regard to jurisdictional claims in published maps and institutional affiliations.