Article

Case-Study: Fully Prefabricated Wood Wall Connection to Improve Building Envelope and On-Site Efficiency

1
Department of Wood and Forest Sciences, Université Laval, Quebec City, QC G1V 0A6, Canada
2
Department of Mechanical Engineering, Université Laval, Quebec City, QC G1V 0A6, Canada
*
Author to whom correspondence should be addressed.
Buildings 2022, 12(12), 2185; https://doi.org/10.3390/buildings12122185
Submission received: 30 October 2022 / Revised: 19 November 2022 / Accepted: 24 November 2022 / Published: 9 December 2022
(This article belongs to the Topic Building Energy Efficiency)

Abstract

:
As fully prefabricated wood walls (FPWW) are envisioned to increase building envelope performance, the junction between panels becomes crucial. Since FPWW restricts access to the inter-panel joints, it is preferable to generate an upstream mechanism to complete the joint automatically on-site. This study aimed to design a self-sealing joint for FPWW that would achieve high energy standards and accelerate on-site construction. Airtightness tests and thermal bridge assessments were conducted in the laboratory to compare the developed self-sealing joints with different sealing materials. These same tests were conducted on-site, in addition to observations of the assembly speed of conventional prefabricated walls and FPWW. Of all the materials tested, butyl tape showed the tightest connections. This material helps the joint developed to automatically seal adjacent walls spaced up to 7 mm apart. FPWW maximize the industrialization of conventional prefabricated walls by realizing the sealing details and the installation of doors, windows and exterior siding offsite. This way, FPWW could reduce the duration of a conventional single-family residential project. FPWW maximize quality control while reducing transportation costs associated with conventional modular solutions.

1. Introduction

In 2020, construction and buildings consumed 36% of energy globally [1]. Energy consumption during the operating phase of a building is one of the largest contributors to climate change in the construction sector [2,3,4,5]. By developing and adopting high-performance system enclosures, it is possible to reduce heating and cooling demand [1,5,6,7], which still represents 66% of the total residential energy use in Canada in 2018 [8]. In cold climates, designing an energy-efficient building goes hand in hand with a highly insulated and airtight envelope [9].
As researchers seek to find significant building innovations to reduce energy consumption, the features that govern the construction industry must be taken into account. The necessity to reduce overall costs and manufacturing, construction, and delivery times is a real preoccupation and must be reflected in innovative construction methods. Among these methods, prefabrication can significantly accelerate the construction process while ensuring quality and reducing cost [10,11,12,13,14,15].
Since a significant proportion of the envelope defects come from on-site work, it is important to review the design, construction, and supervision methods [16]. It is important because these defects can lead to underperformance of the envelope through thermal bridges, thermal barrier discontinuity, and air leakage [17]. Of the envelope defects, air leakage can be responsible for about 25% of a building heating loads [18]. Air leakage can also affect the comfort of occupants since it impacts hygrothermal performance, air quality, and ventilation equipment performance [19,20,21,22].
The Canadian National Energy Code for Buildings [23] or other related regulations [24] state that opaque building assemblies separating the interior and exterior environments of a building must comply with CAN/ULC-S74 and have an air leakage rate of no more than 0.2 L/s·m2 measured at a pressure differential of 75 Pa. This regulation operates under the same philosophy as what the US General Services Administration recommends [9,25], i.e., comprehensive requirements for the air barrier such as:
  • Air permeance of no more than 0.02 L/s·m2 @ 75 Pa for air barrier materials in accordance with ASTM E2183.
  • Air permeance of no more than 0.2 L/s·m2 @ 75 Pa for air barrier systems in accordance with ASTM E2357 or E1677 or E283.
  • Air permeance of no more than 2.0 L/s·m2 @ 75 Pa for the entire building in accordance with ASTM E779.
Since these measures are recommended and do not require any mandatory on-site blower door testing, there is a large disparity between the performance of currently designed buildings and the recommended standards, with many buildings exhibiting air leakage two to ten times greater than the prescribed 2.0 L/s·m2 @ 75 Pa [9].
This situation seems to show that although codes focus on air barrier materials, unexpected defects affecting the airtightness of the whole building are still noticed on-site [9,16,22,26]. However, by developing appropriate testing and inspection measures, it is possible to achieve excellent leakage performance [22,27] as demonstrated by USACE’s newest buildings with their average leakage rate of 0.9 L/s·m2 @ 75 Pa [28]. The industrialized context of prefabricated structures favors the integration of more stringent monitoring as shown by the USACE buildings [13,27,28]. This is especially true for modular structures that are 90% complete in industry and can rely on a controlled environment for the total completion of more complex sealing details [10,29].
Fully prefabricated wood walls (FPWW) are closed structural panels that include exterior cladding, doors, and windows. Their manufacturing allows high-quality control, such as in modular structures, while simplifying transportation and the required on-site equipment [11,15,30]. With the potential for the increased envelope and sealing detail performance on the surface of FPWW, the junction between panels becomes a crucial issue for the envelope performance throughout the building [20,31,32,33].
Since FPWW restricts access to the inter-panel joints, it seems preferable to be able to generate an upstream mechanism to complete the joint automatically on-site. Scott et al. [32] developed this kind of connection for airtightness purposes while Orlowski et al. [33] focused on weather tightness. However, both studies did not quantify the performance in the laboratory or on-site. In the context of cold climates and accelerated on-site assembly, the connection must also take into account a multitude of criteria [34]. To ensure the integrity of the entire building envelope, the use of FPWW must be completed in sync with airtight and humidity-controlled joints. Ultimately, these joints must also be able to meet the industry’s demands stated before by allowing quick and easy assembly on-site.
The objective of this study was to design a self-sealing joint for FPWW that would achieve high energy standards and accelerate on-site construction.
Structural joints, in this case, FPWW joints, occur at different places in a building. In the case of prefabrication, these panel-to-panel joints can be either vertical or horizontal. As pointed out by Relander et al. [35], it is particularly difficult to ensure the continuity of the air barrier at the junction of external walls with the intermediate floor.
In Canada, the most common technique used for the insertion of the intermediate floor in light wood frame construction is the platform technique [36]. With platform construction, floors are installed and then walls can be erected. This step is repeated for each floor. On site, prefabricated walls installed on a platform system are then interrupted with floor structures (Figure 1).
Although in the Province of Quebec it is sometimes possible to seal the interior vapor barrier and exterior weather-barrier membranes to create an effective air barrier, it remains that interior sealing is laborious. With the platform technique, exterior sealing with sheathing tape is preferred and appears to be more effective. [16,35] Nevertheless, because walls and floors come separately, it is on-site that the airtightness details of their junction must be completed. Again, even if the sealing materials are adequate, the performance of the air barrier will be influenced by the ability of the workers to generate a compliant seal within the complex assemblies [35].
This study proposes a self-sealing horizontal connection that is factory generated. The development of this connection was completed by prioritizing energy efficiency, quality assurance, and ease of assembly. To evaluate the effectiveness of the connection, comparative tests were conducted in the laboratory with the same sealants as those used in the construction industry. The complete horizontal assembly was also tested in the laboratory with a conventional light wood frame assembly using the platform technique.
Finally, the conceptual development process not only generated this horizontal connection, but also developed a complete construction system using the connection principle and FPWW. A single-family house (House A) was constructed with this system and allowed the evaluation of the airtightness performance and the impact of thermal bridges. During its construction, this project also made it possible to determine the assembly speed of the system. This house was then compared to another house (House B) built with conventional prefabricated walls. Airtightness tests, thermal bridge assessments, and assembly speed observations were conducted in both houses for the sake of comparison.

2. Design Process

The mechanical design procedure [37,38] is a rigorous process that allows the generation of new innovative products. This study does not claim to have followed the entirety of this type of process but integrated some of its fundamentals such as design for assembly. The following section describes the conclusion of the design methodology that was followed in this project.

Proposed Design

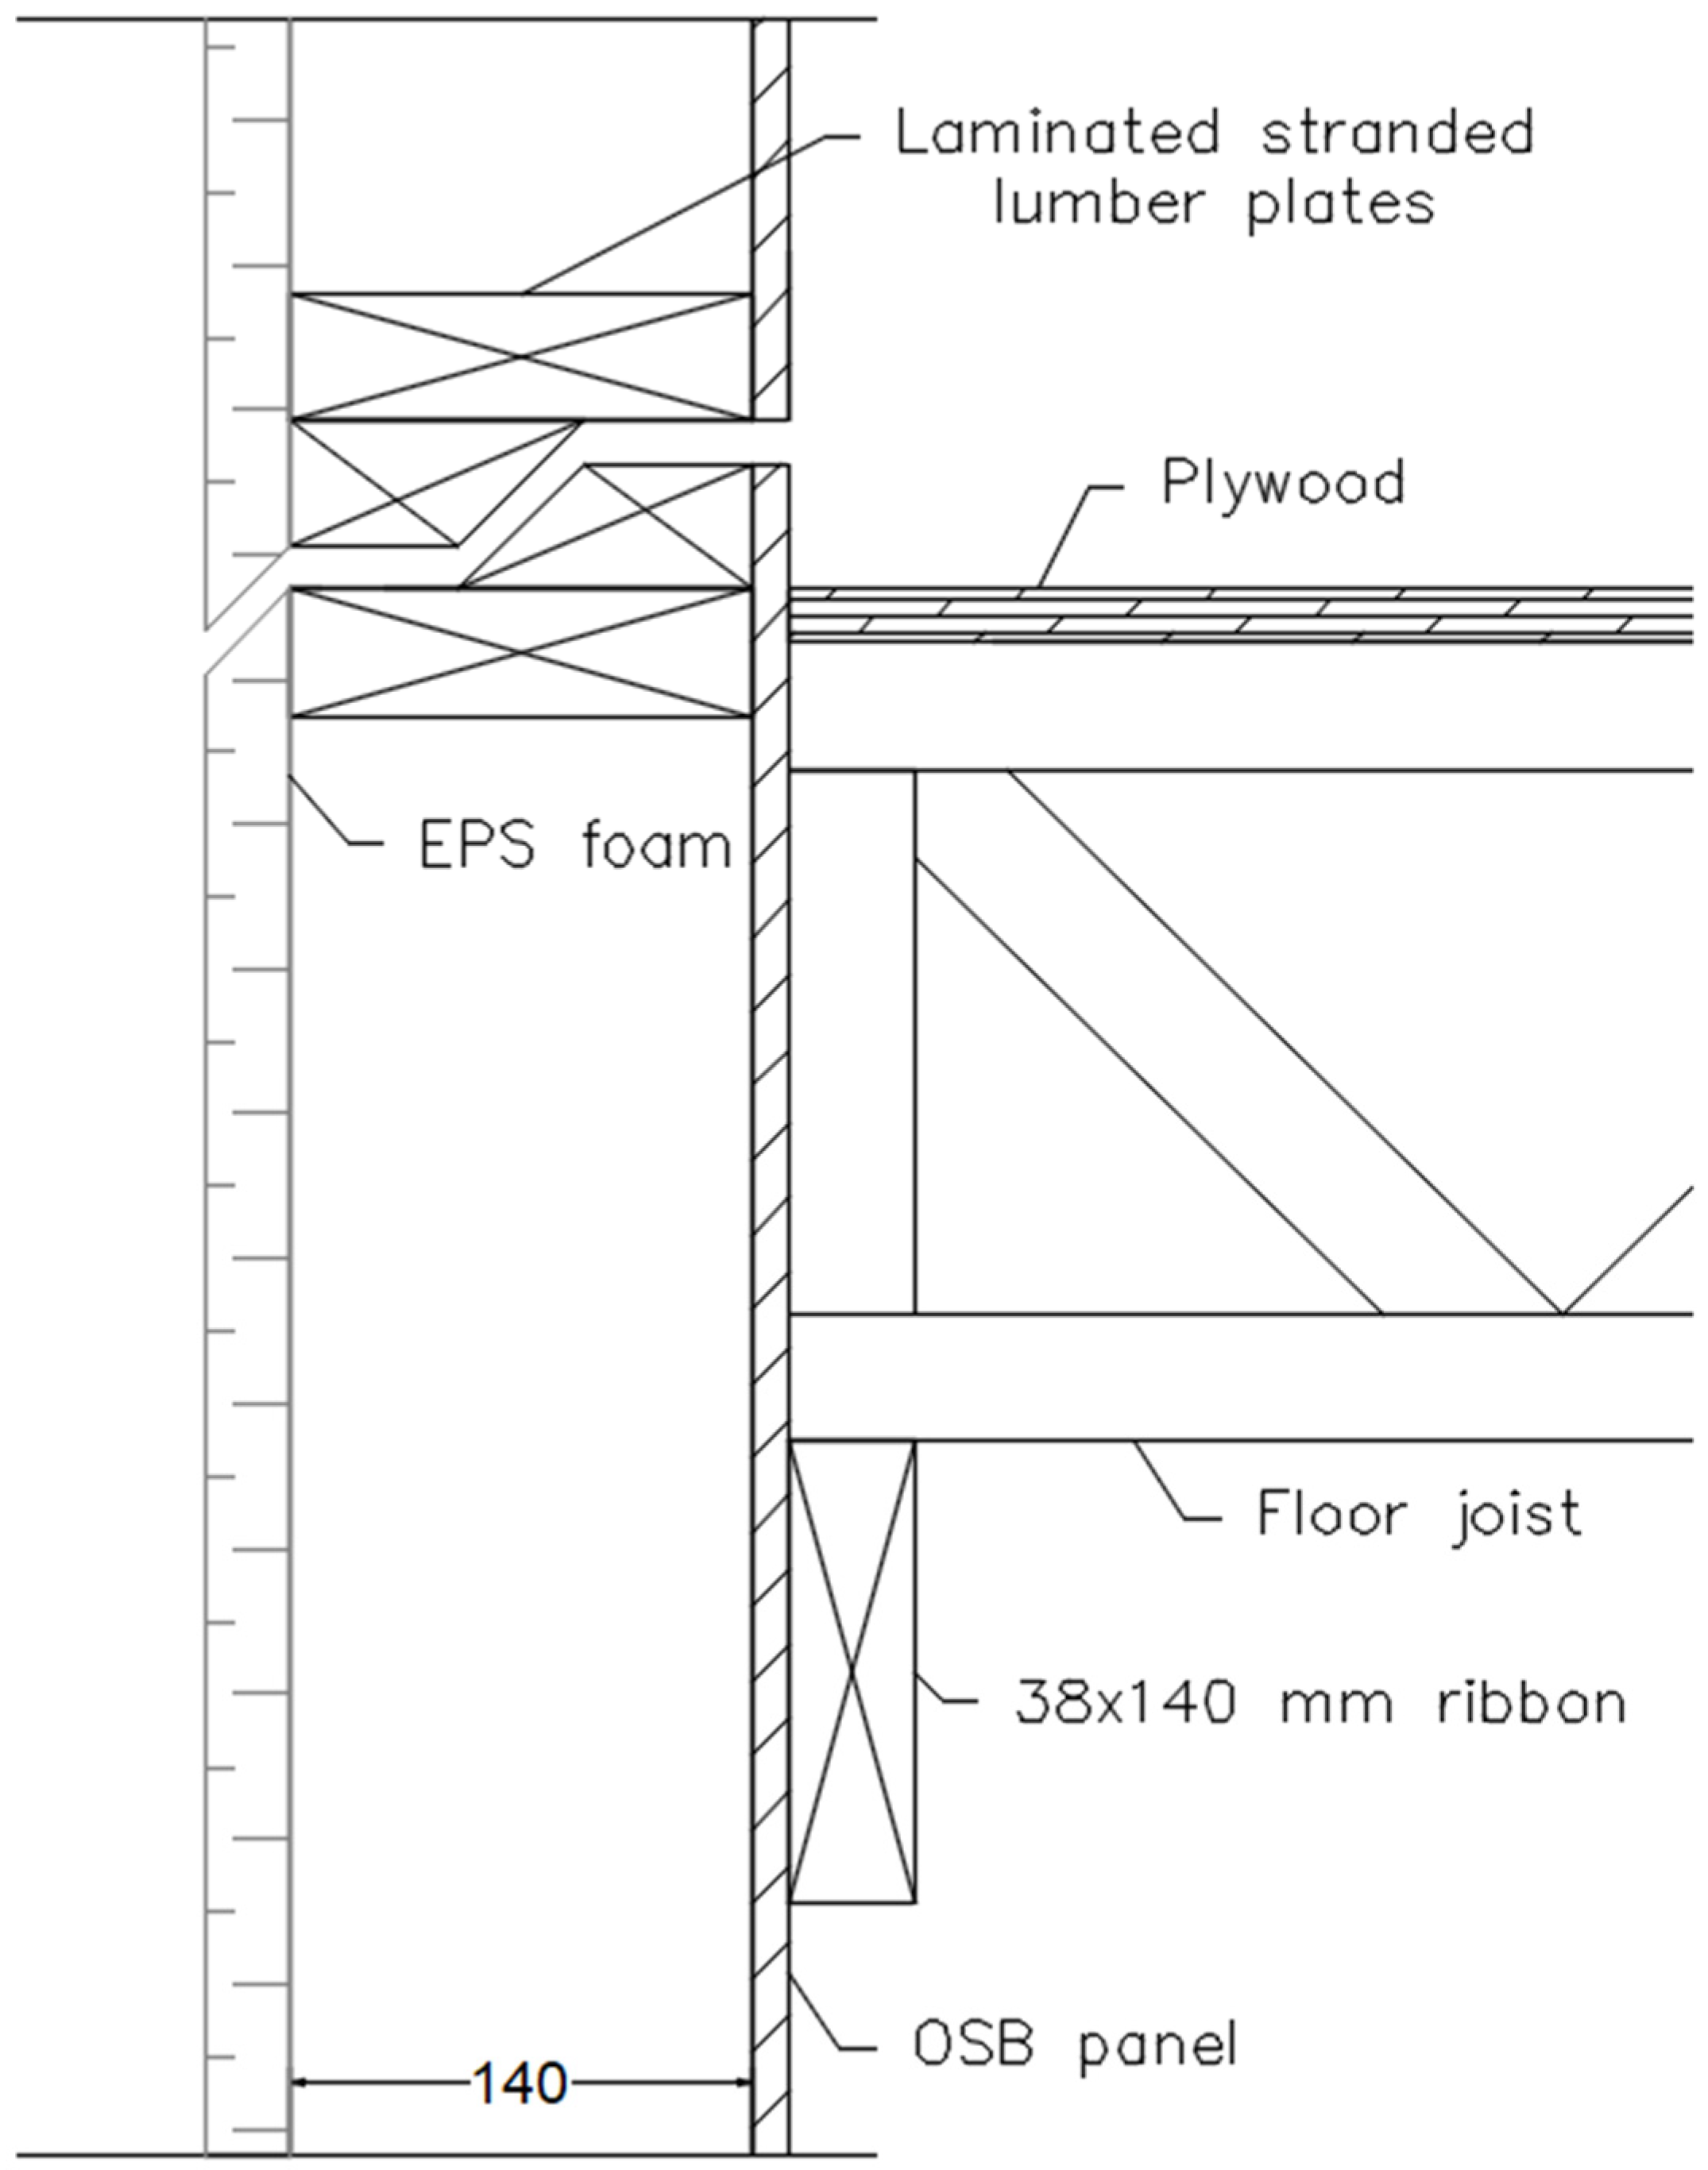
To avoid having to seal the structural joints of a conventional platform assembly on-site, it is necessary to be able to rely on a light wood frame system allowing the continuity of the building envelope. Inspired by the balloon frame technique and the structural joints used in cross-laminated timber (CLT) [36,39], a system was developed that allows one wall to be placed on top of another while generating the floor structure (Figure 2).
With a light wood frame structure, the concept relies on a well-known conventional structure. For better straightness within the connection, the concept also counts on a top and bottom plate in laminated stranded lumber, LSL. These plates have angles that, like chamfers, facilitate assembly on the job site. These plates are also disposed to allow FPWW to be inserted from the outside to the inside of the building.
Relying on a system that allows the walls to fit together, it was then possible to generate an upstream mechanism that would automatically seal the building envelope’s protection planes during assembly on-site. The mechanism had to be able to have an automatic sealing system generating the continuity of the air, vapor, and weather barriers.
Used in UL Canada’s Building Envelope Service airtightness test templates, butyl is a product used for its sealing capabilities. Integrated into a tape with an EPDM rubber core, the 7.0 mm thick butyl tape provides an air, vapor, and weather barrier. Used in the high-performance window industry, precompressed polyurethane foam is a self-expanding material that seals gaps that are impossible to reach on the job site. This foam impregnated with an acrylic resin is permeable to water vapor, impermeable to liquid water, and impermeable to air. It allows for generating an air and weather barrier that has the capacity to evacuate the water vapor that can be inserted within the connection. Different sizes of this material are available and each of these sizes is associated with a minimum and maximum expansion range for which this polyurethane foam has air barrier properties. In this study, the dimensional performance range of the polyurethane foam was between 3 and 7 mm.
The two sealing materials are arranged to ensure the continuity of the interior vapor barrier membrane and the exterior weather membrane. In this system, the sealing of the vapor barrier membrane is generated by the gravity compression of the upper wall on the butyl tape, attached and sealed to the lower wall vapor barrier membrane. On the exterior side, the sealing is generated when the polyurethane foam, attached and sealed to the weather barrier membrane of the lower wall, expands until it reaches and seals the same membrane of the upper wall.
The design developed for the laboratory tests and illustrated in the next section had the objective of maximizing the dimensional range for which the connection was sealed. To achieve this, the design development focused more on working on the individual performance of the materials while combining their operating dimensional range. To extend its sealing dimensional range, the butyl tape was placed within a 3.2 mm groove leaving more of the material available to be compressed by the upper wall. This groove was placed on the interior side of the bottom wall top plate to generate a continuous seal with the vapor barrier. Placed on the exterior side of the bottom wall top plate, the precompressed polyurethane foam was placed directly on the bottom wall top plate to generate a continuous seal with the weather barrier. Placed in this manner, the precompressed polyurethane foam seals the horizontal junction if the upper wall is not able to adequately compress the butyl tape. In this way, this new concept 1 relies on a first sealing level generated by the butyl tape, and then in the case of a defect, the precompressed polyurethane foam generates the second sealing level. Knowing that the dimensional range of performance of the polyurethane foam was between 3 and 7 mm, this concept allows the sealing of a horizontal joint where the adjacent walls would be spaced up to 7 mm apart.
Generated for the on-site construction of House A, the second design developed also used butyl and precompressed polyurethane foam. Designed to combine the sealing performance of both materials, this conceptual development resulted in the new concept 2. The new concept 2 arranges the sealing materials in the same way as the new concept 1, i.e., by arranging the butyl material on the inner side of the bottom wall top plate while the precompressed polyurethane foam is placed on the exterior side. However, to combine the sealing performance of both materials, this concept arranged the two materials within 4.8 mm deep grooves. This way, the groove ensured that the precompressed polyurethane foam was within its expansion range performance while the wall was compressing the butyl tape. Thus, both materials were effective in combination.

3. Methods

3.1. Laboratory Measurements

The building science laboratory at Université Laval, which includes a climatic test unit (designed and manufactured by Mekanic, Montreal, QC, Canada), was used to conduct airtightness and thermal bridge assessment tests. Composed of two conditioned chambers of 17.4 m3 each, the climatic test unit simulates the temperature and humidity conditions of the exterior and interior of a building. Experimental walls of at least 2.4 m high and 2.6 m can be inserted between the conditioned chambers.

3.1.1. Materials and Structures Studied

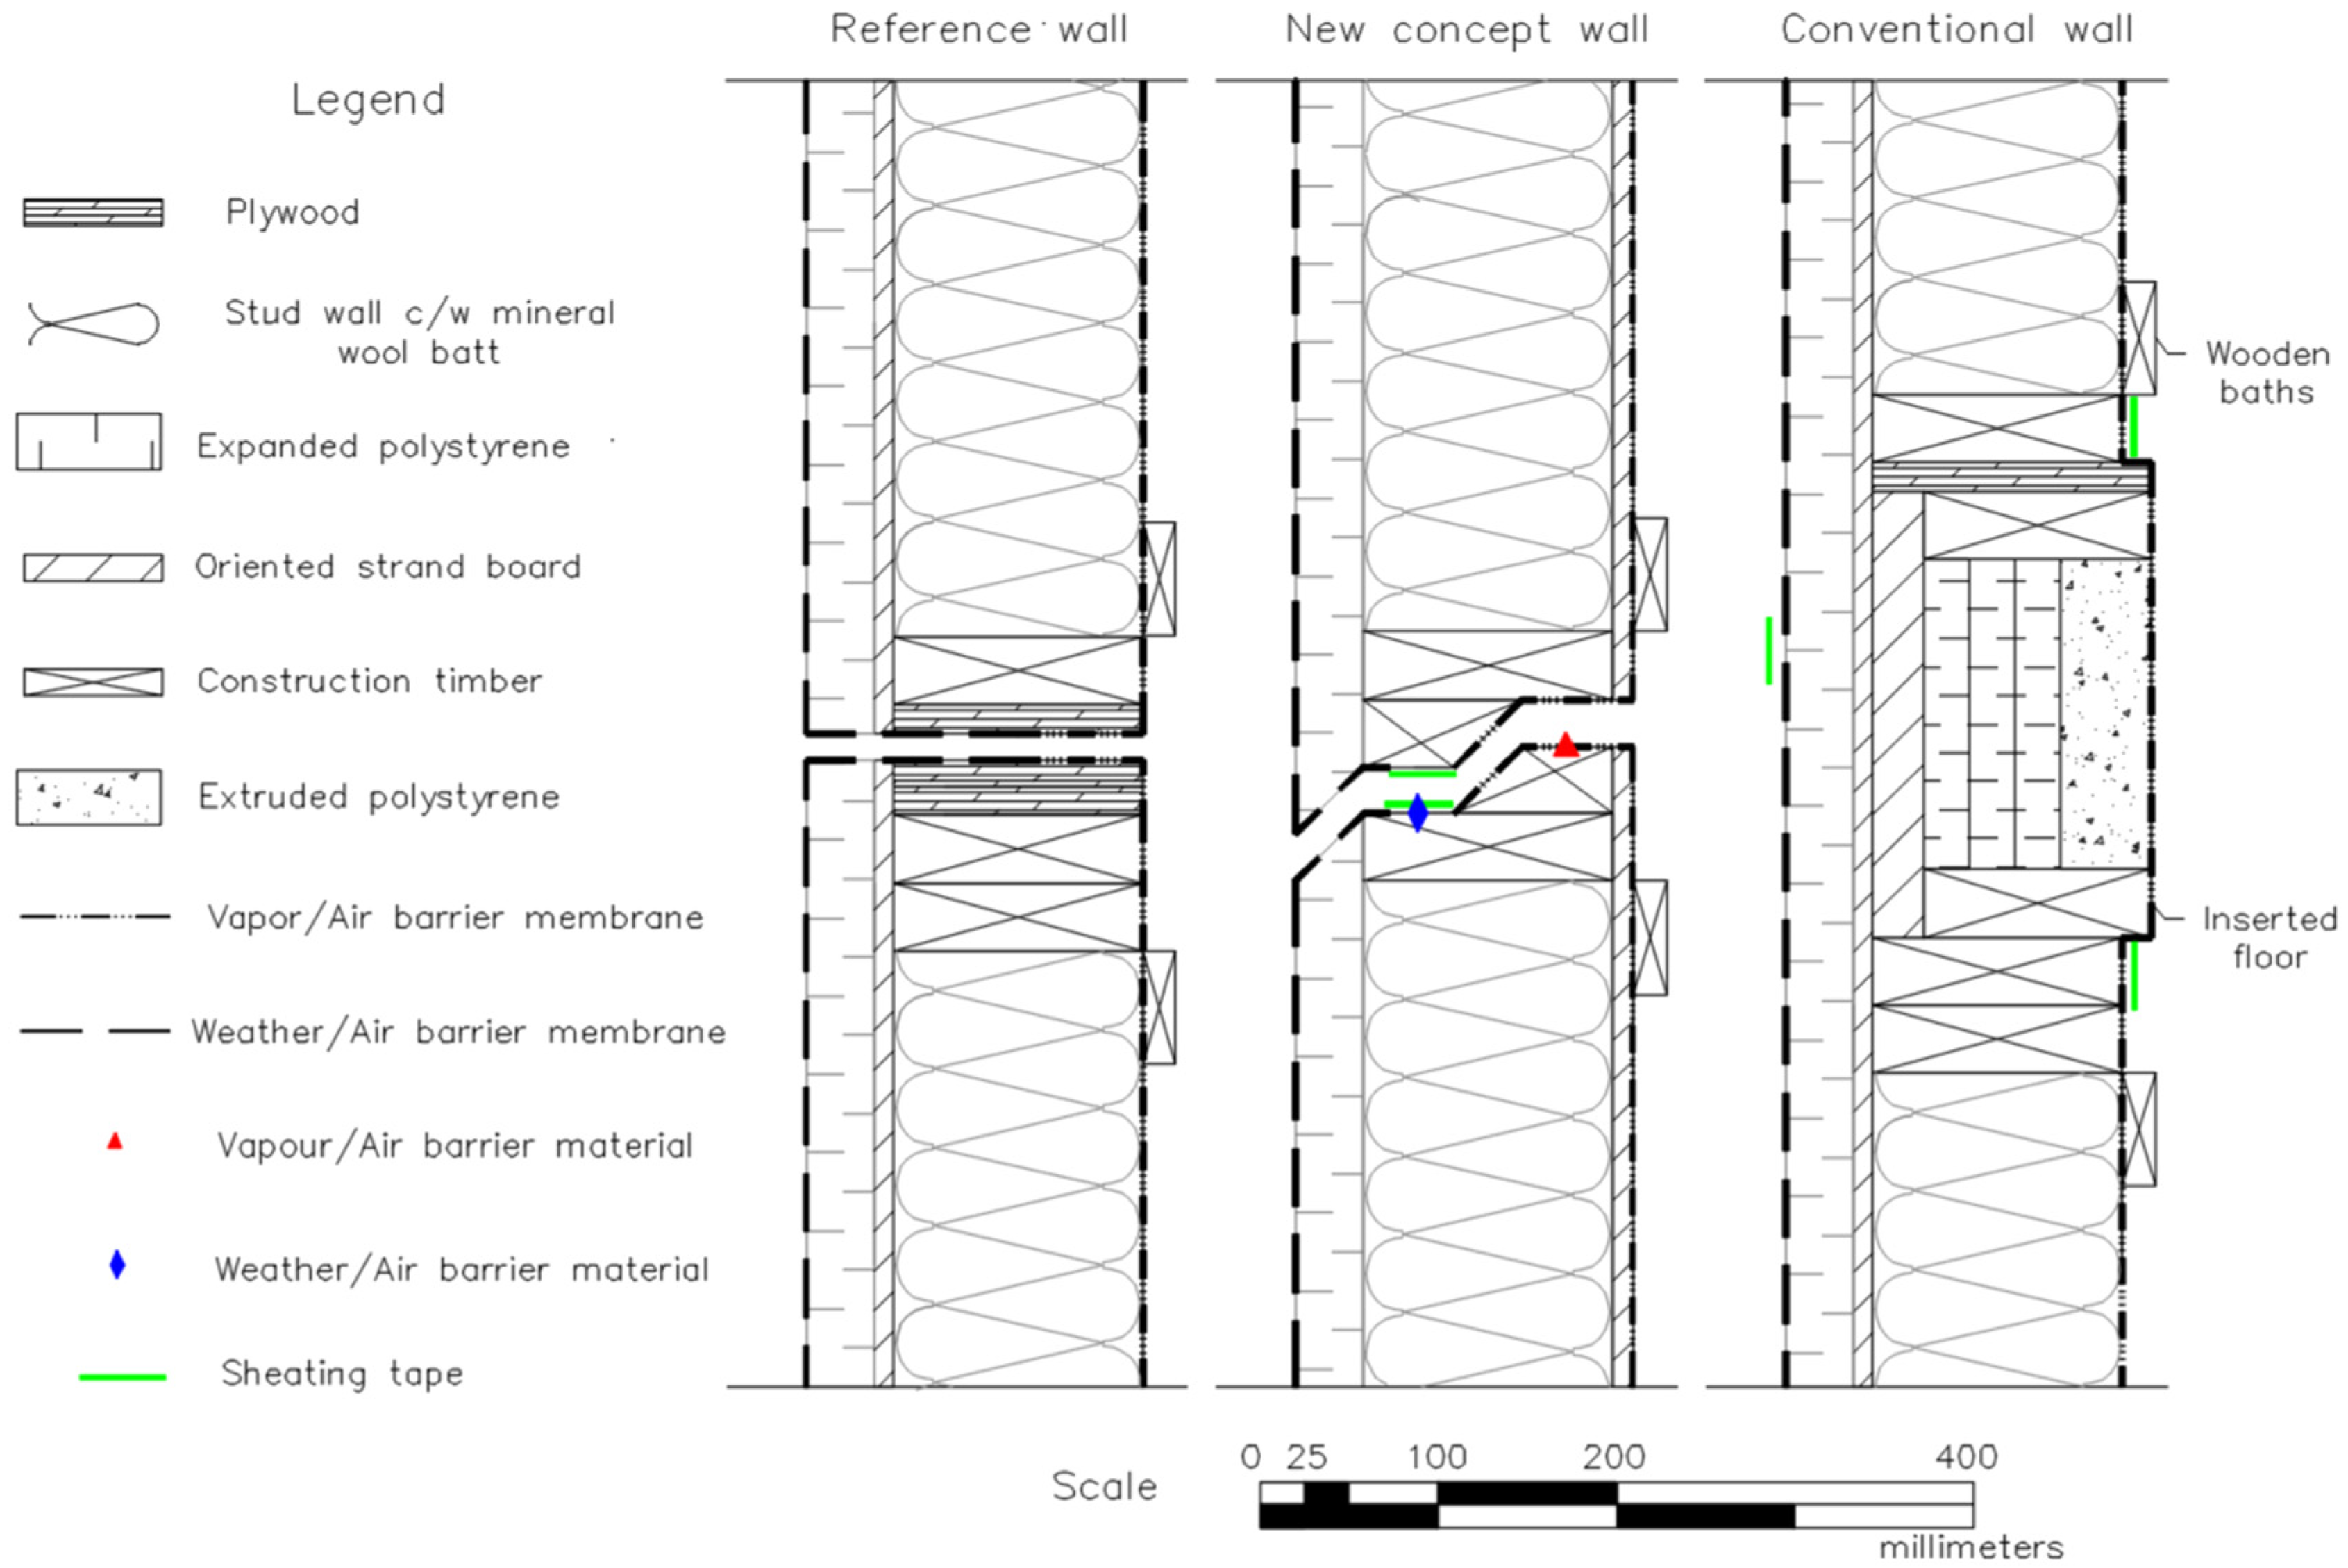
The laboratory tests were conducted in two sequences (Table 1). The first test sequence was performed within a conventional light wood frame structure, the reference wall. This sequence involved airtightness testing only. Complying with the requirements of Part 11 of the Province of Quebec Construction Code [40], for Quebec City, this structure proposed a total thermal resistance of 5.0 RSI and an effective thermal resistance of 3.7 RSI. This typical wall structure in Quebec residential construction consisted of two wall sections where 12.7 mm thick plywood was installed at their ends to ensure the straightness of the horizontal junction. It is within this junction that four sealing materials were placed (Table 1). Used for various construction applications, these materials all have the ability to generate a self-sealing joint. The term self-sealing is used here to express the action when an upper wall story sits on the wall of a lower story. The materials placed upstream allow the sealing of the building envelope barriers of its adjacent walls.
The butyl-precompressed polyurethane foam is the sealing system resulting from the conceptual development discussed earlier. Inside the reference wall (Figure 3a), the butyl tape is placed on the inside of the wall cavity. It is placed in a 3.2 mm groove between the two polyethylene membranes of the adjacent walls. The precompressed polyurethane foam was placed on the exterior side of the wall cavity between two weatherproof self-adhesive membranes.
The precompressed polyurethane foam was then placed separately within the reference wall to compare its own performance to the performance of butyl-precompressed polyurethane foam. This time, the foam was placed on the inside of the cavity between two weatherproof self-adhesive membranes (Figure 3b). The adjacent walls were placed to allow the foam to be in its effective dimensional range.
Polyurethane foam is another sealing material that is water, vapor, and airtight. Laid on an EPDM synthetic rubber substrate, two 20 mm thick elastic polyurethane foam modules with additives are placed to generate an adequate seal when compressed. In the reference assembly (Figure 3c), the EPDM synthetic rubber substrate has been sealed on both sides of the vapor and weather barrier membranes of the reference structure.
The last sealing material consists of two 10 mm diameter EPDM tubes. These tubes are attached to a polyethylene membrane and provide protection against water and air. Within the reference wall (Figure 3d), this polyethylene membrane has been sealed on both sides to the vapor and weather barrier membranes. The reference wall is also shown in Figure 4.
The second test sequence compared two types of junction of external walls with intermediate floor. This sequence allowed airtightness and thermal bridge assessment tests. In this case, the new concept wall was tested using the new concept 1 sealing method. With the same thermal resistance characteristics as the reference wall, the new concept wall has the OSB structural panel on the interior side for hygrothermal purposes that are not relevant to this study (Figure 4).
The new concept wall was then compared to a conventional assembly using a platform structure where the floor was generated with I-joists (OSB core with wood frame footings). This assembly, the conventional wall (Figure 4), also had the same thermal resistance characteristics as the reference wall. Typically sealed and insulated between the floor joists with sprayed polyurethane, this method was not viable in an experimental setting. An alternative, also used in Quebec residential construction, was used. A combination of different rigid insulation boards provided equivalent thermal resistance and the continuity of the interior polyethylene membrane allowed the air and vapor barriers to be sealed.

3.1.2. Air Leakage Rate

Used to install the experimental walls vertically, the climatic test unit does not allow airtightness tests at the level of accuracy needed for this study. Thus, an experimental system was developed to perform tests in the spirit of the standard test method ASTM E2357 for determining air leakage rate of air barrier assemblies [41]. This standard redirects specific air leakage testing to ASTM E283 for the determination of air leakage rates through exterior windows, skylights, curtain walls, and doors under a specified pressure differential across a specimen [42].
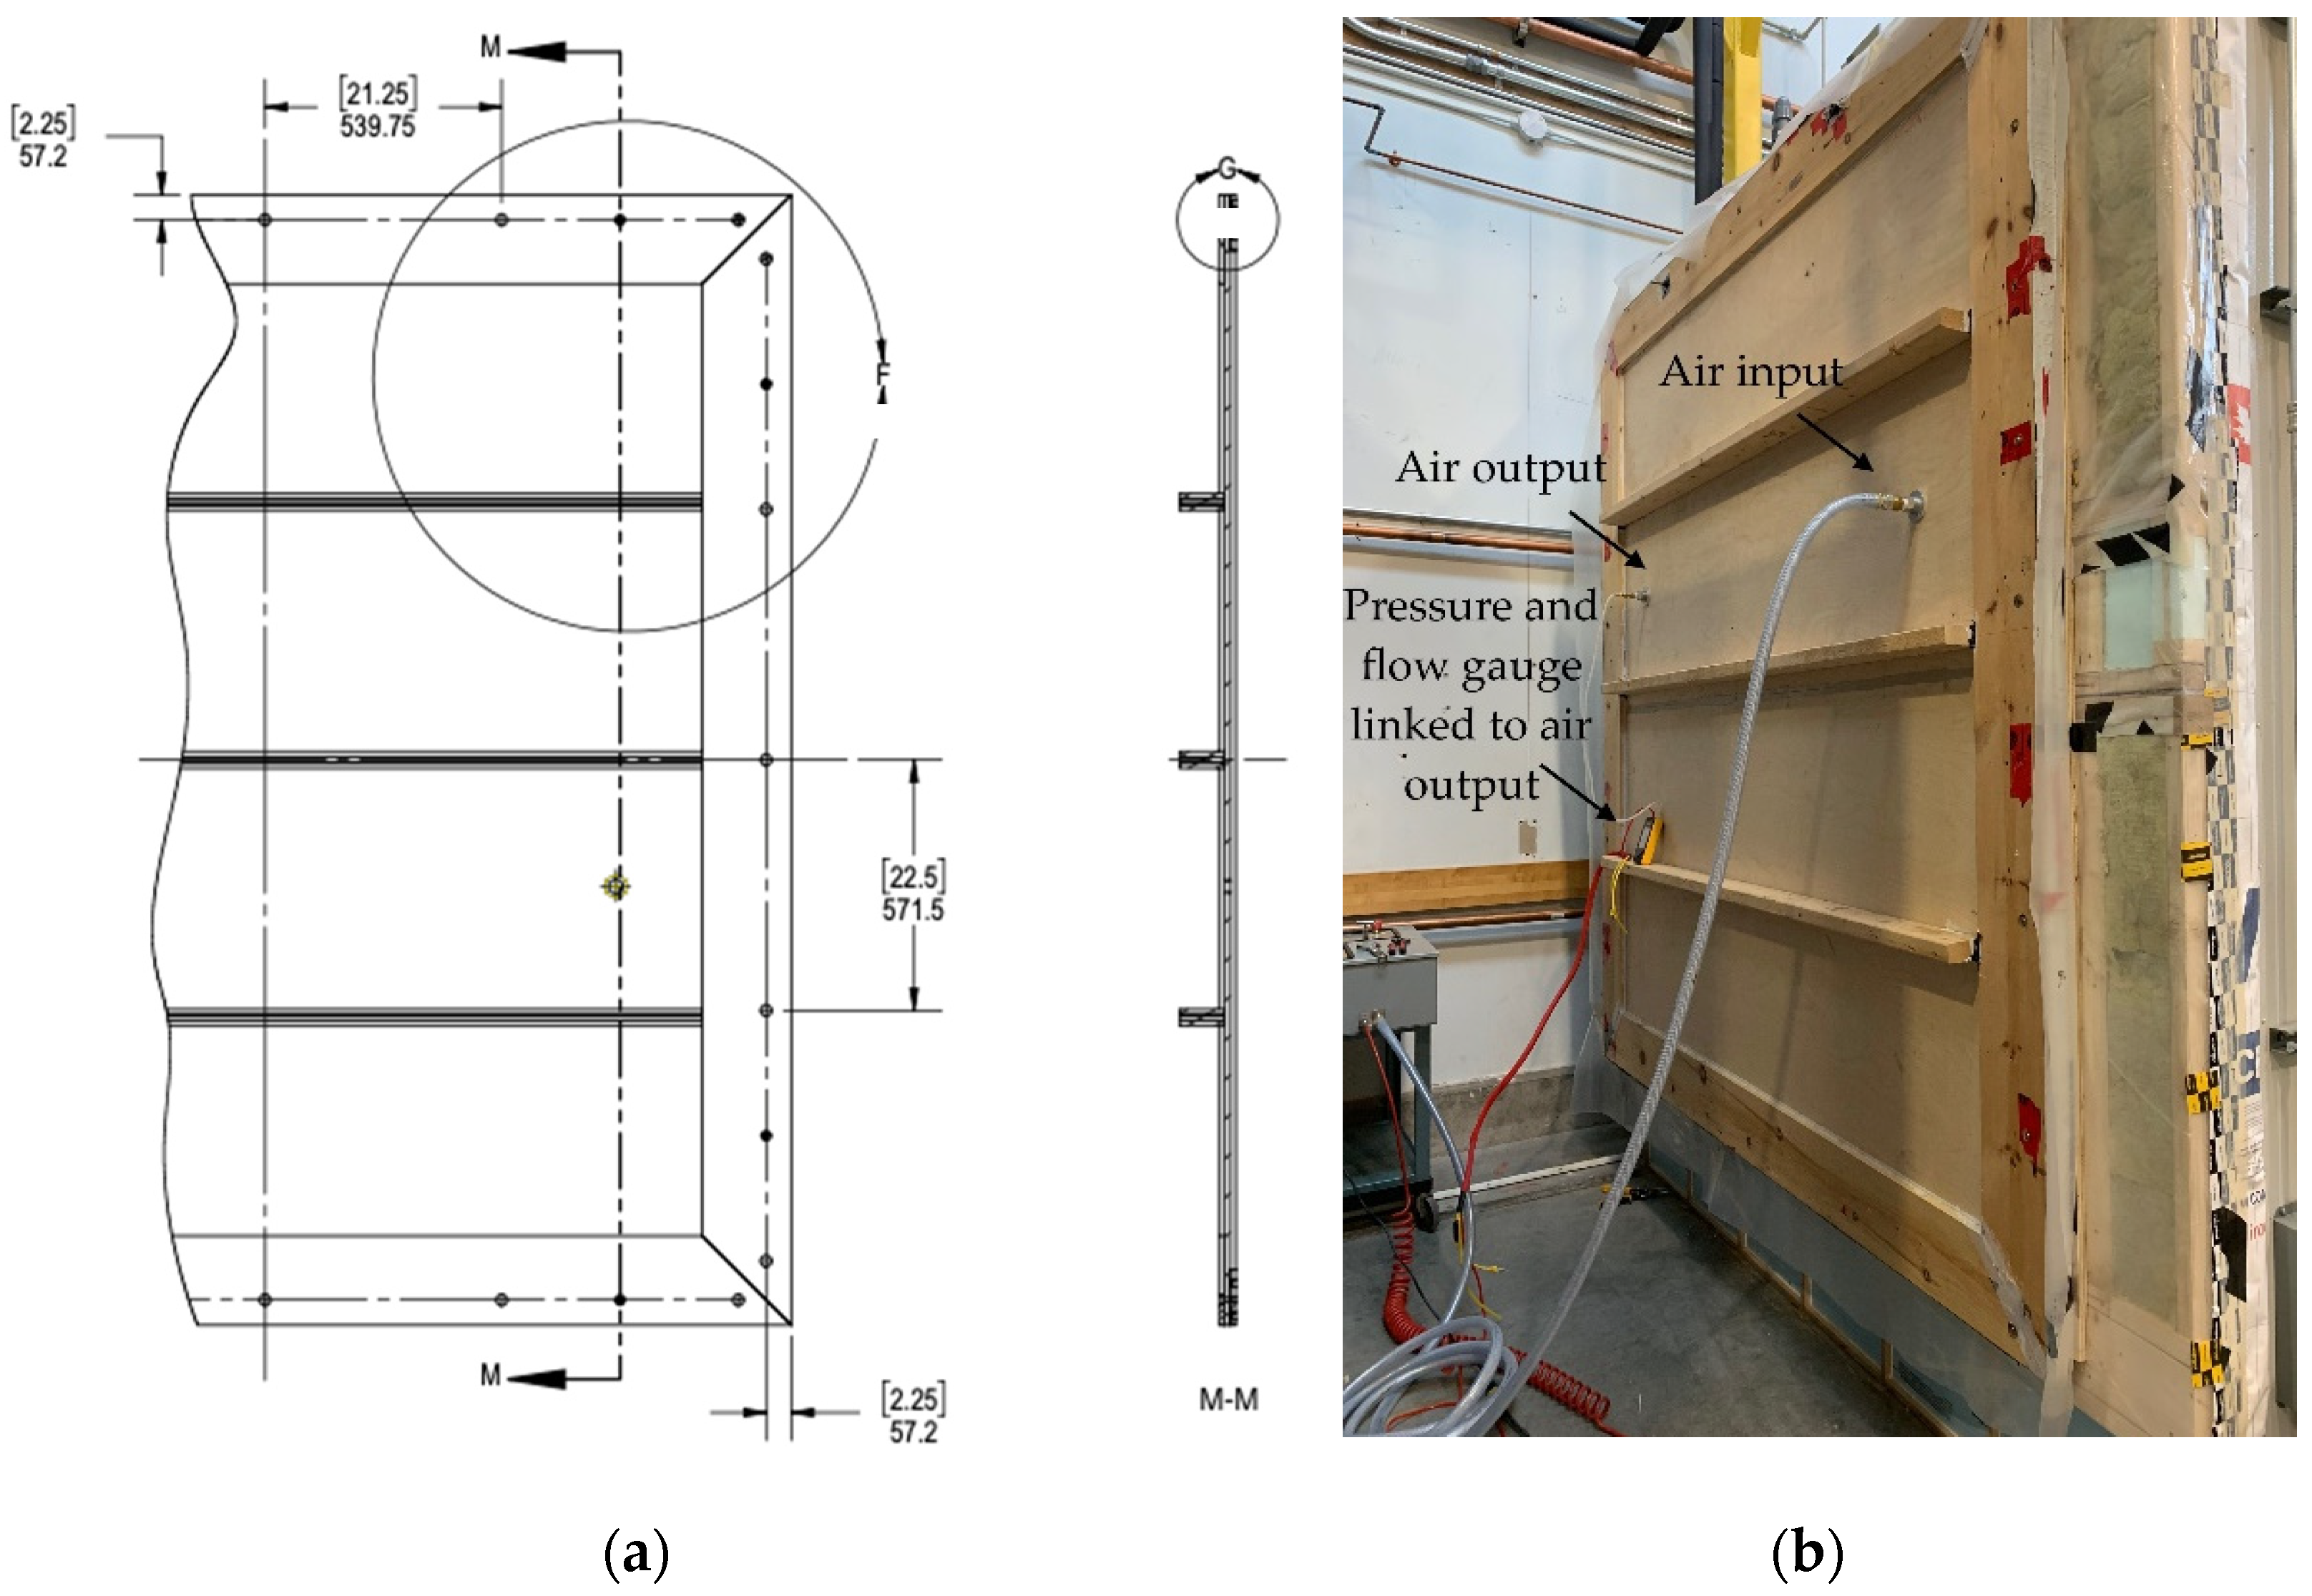
The experimental system (Figure 5) consists of the following components:
  • A 38 mm thick seal plywood board with a pressurization test cavity of 5.3 m2 and 2.03 m wide. This component will be called the test gauge.
  • A perforated contour to insert structural screws to assemble the test gauge to the experimental wall.
  • A sealed hole where compressed air is injected, and another sealed hole linked with an air cable to quantify the pressure in the pressurization test cavity.
  • A preformed butyl tape to seal the perimeter of the test gauge.
  • DM32 10A Retrotec pressure and flow gauge (Everson, WA, USA, range 0–20,000 Pa with the accuracy of ±0.01 Pa + 0.3% on the reading).
  • Bronkhorst mass flow meters and mass flow controllers F-112AC–M20/F-202AV–M20 (Ruurlo, Netherlands, range 1.4–250 Ln/min Air with the accuracy of ±0.5% on the reading + ±0.1% on full scale. Temperature and humidity variations affecting the flow meter were neglected as the tests were performed under a conditioned temperature in the laboratory).
Since the experimental walls were to be attached to the outer chamber, the test gauge was placed on the interior side of the experimental walls (Figure 5). Because of this constraint, the tests were carried out exclusively on the polyethylene membrane of the experimental walls. This membrane also has the capacity to generate an air barrier. For the tests of the first sequence, the membrane was sealed around the perimeter of the reference wall and fixed with wood battens. The same detail was applied to the new concept wall. Usually generated on the exterior side, the continuity of the polyethylene membrane on the floor structure of the conventional wall allowed to recreate the sealing of the air barrier on the interior side. This seal was generated at the top and bottom of the floor structure with sheathing tape. Like the reference and new concept wall, the membrane was sealed around the perimeter and secured with wood battens.
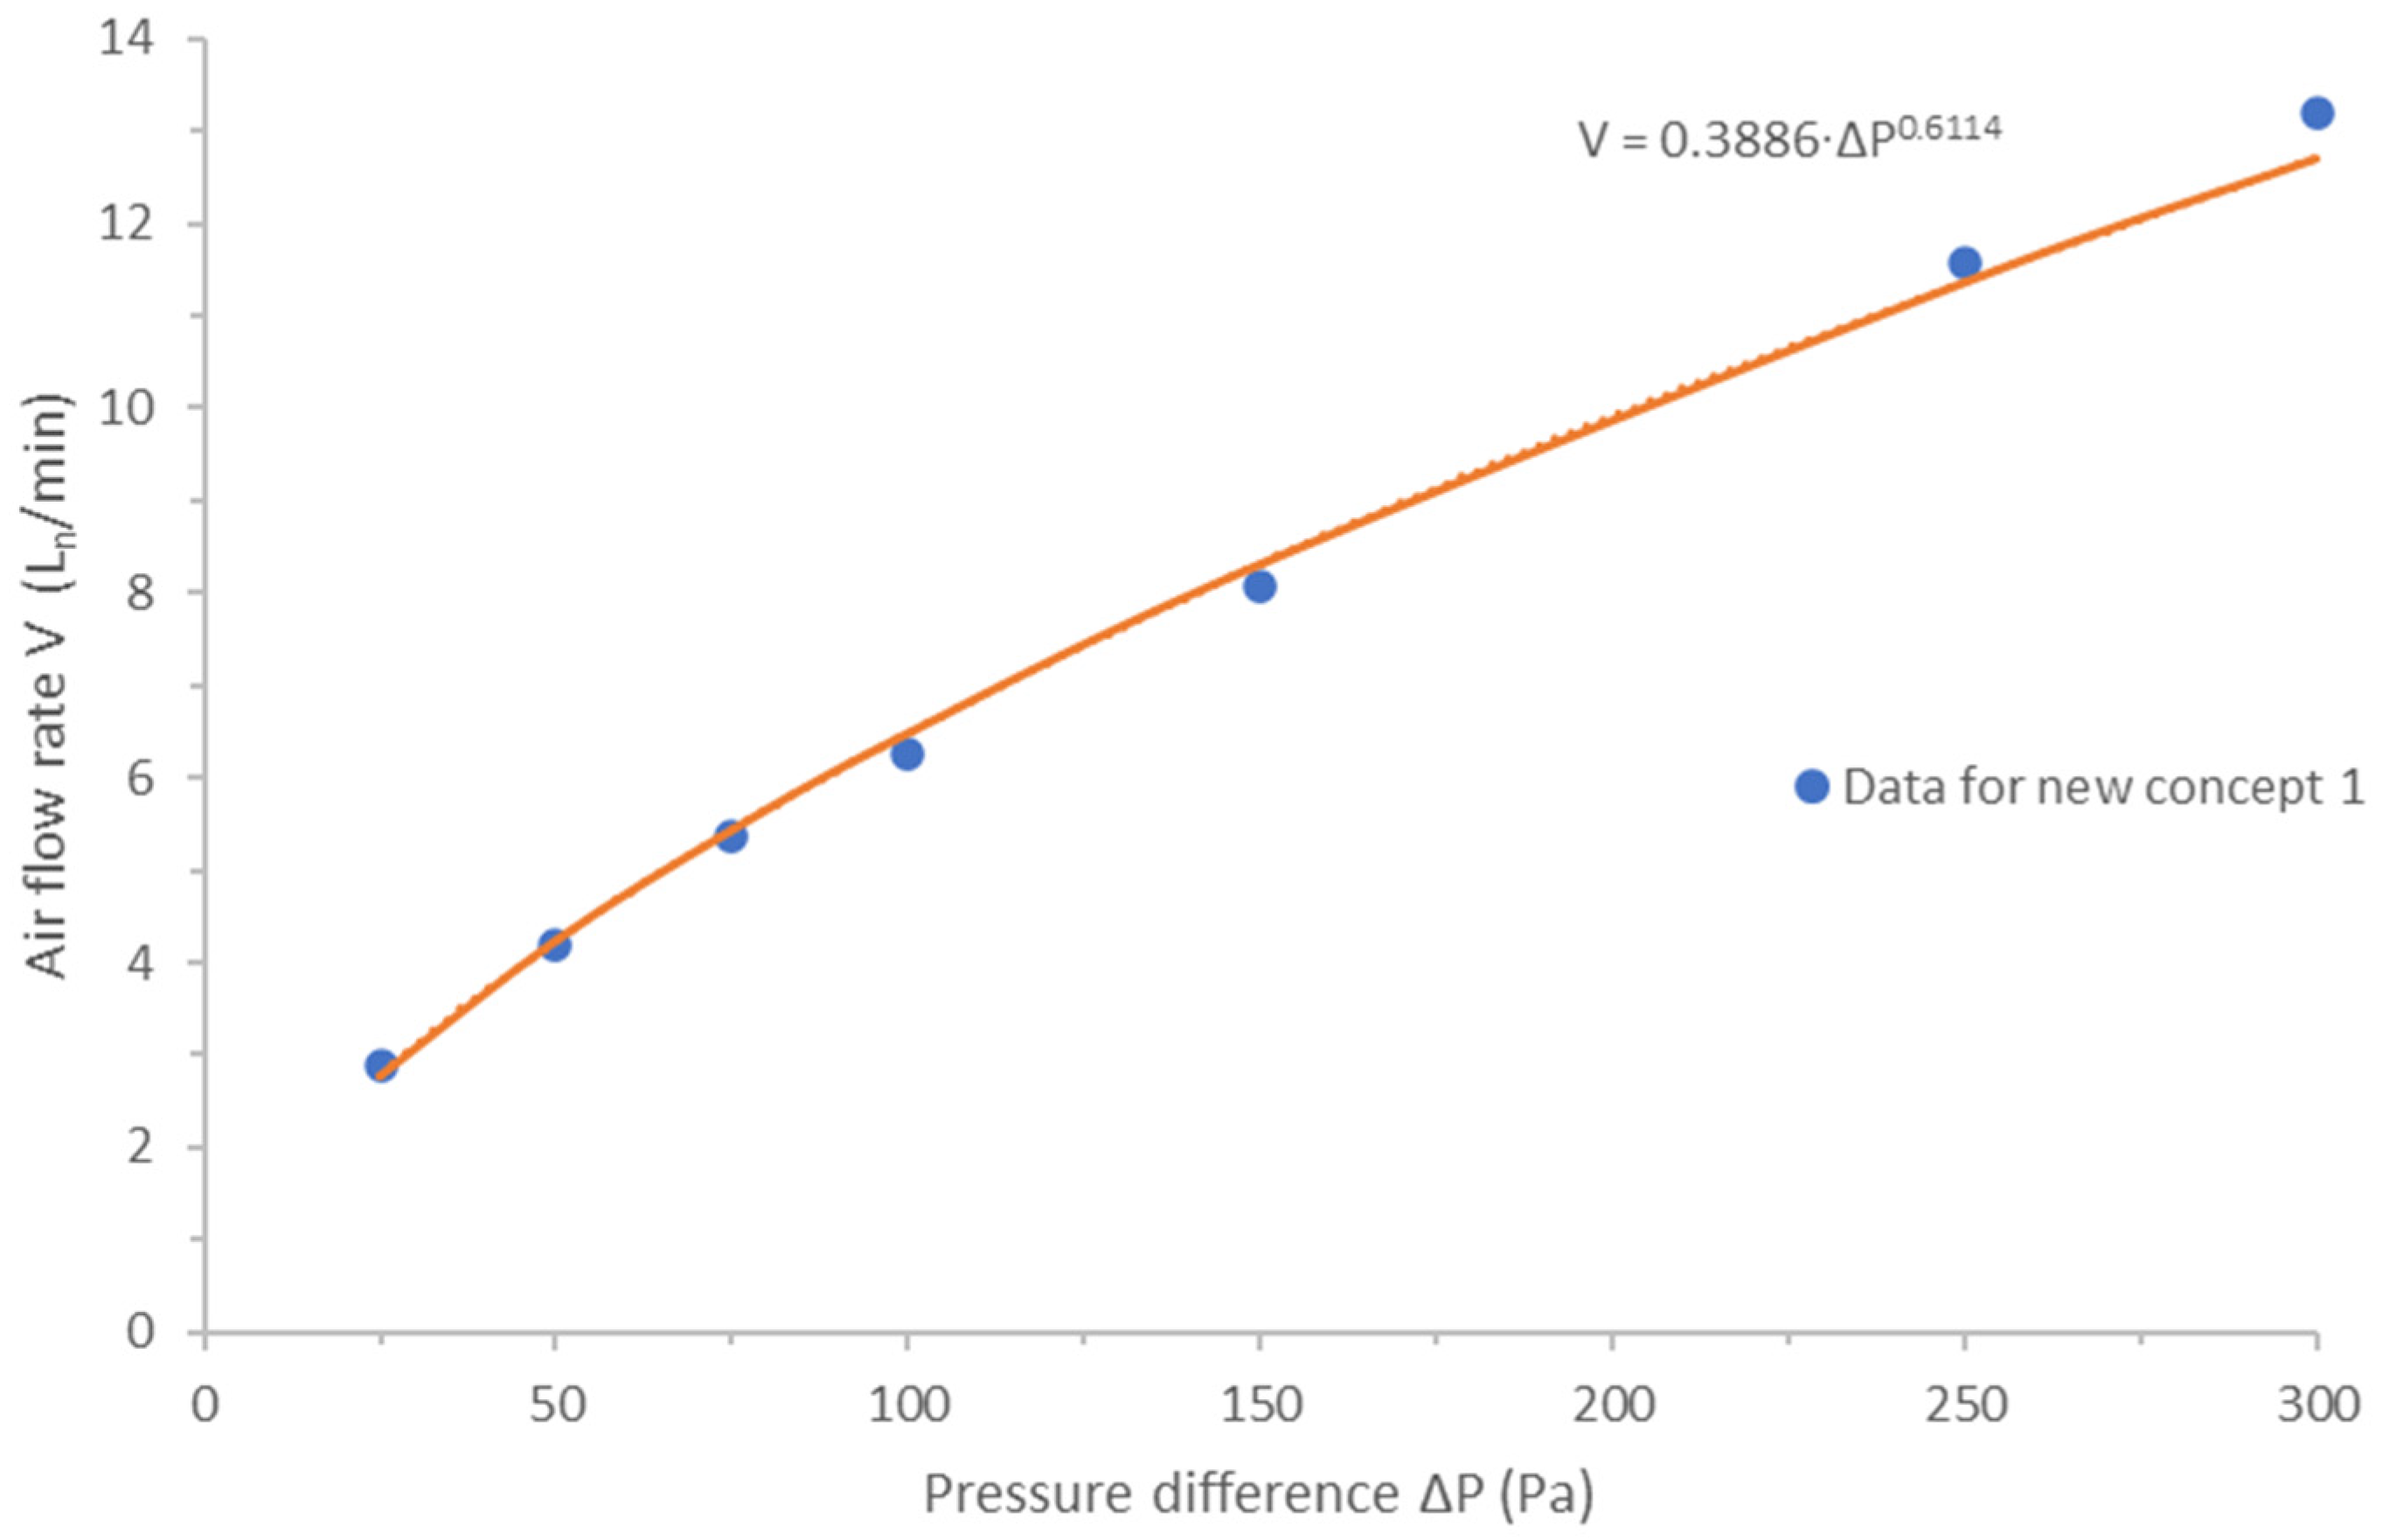
Each test wall was constructed to allow sufficient anchorage of the structural screws attaching the test gauge to the tested wall for proper sealing. To ensure that no abnormal air leakage was detected around the test gauge, a qualitative observation was made under a pressure of 300 Pa prior to each test. Data acquisition was then performed manually at the following positive pressures: 300, 250, 150, 100, 75, 50, and 25 Pa. As detailed by ASTM E2357, during air leakage testing, the relation between the pressure, Δ P   [ P a ] , and the airflow rate through the assembly, V ˙   [ L n m i n ] , must be determined.
V ˙ = C   ·   Δ P n
This relation can be described with the power law [35], Equation (1), where C   [ L n / ( m i n   ·   P a n ) ] is the air leakage coefficient and n   [ ] is an exponent. These constants are found by curve fitting with n lying between 0.5 and 1.0, which allows the relation of Equation (1) to be presented in Figure 6.

3.1.3. Thermal Bridges

Following the second sequence of laboratory tests, a method was developed to analyze the effect of airtightness on thermal bridges. Inspired by the tests performed by Kalamees et al. [16,43], this method was developed in the spirit of ISO 6781:1983. The objective here was to capture the evolution of the thermal behavior of the horizontal joint in cold conditions under air pressure. To achieve this, thermographic analyses were performed.
Arranged and sealed on both sides of the two conditioning chambers, the new concept and conventional experimental walls were exposed to outdoor conditions of −20 °C and indoor conditions of 22 °C and 40% relative humidity. Outdoor humidity conditions were stabilized at 50% above 0 °C but could not be controlled below freezing point. These conditions were maintained for at least 48 h [44,45,46]. After this period, an initial thermographic image was captured. Next, the experimental walls were exposed to 50 Pa (32 km/h) wind pressures applied in the outdoor chamber. Once the structural elements of the respective junctions were sufficiently cooled, typically after a period of 30 min, a second data capture was taken.
All thermographic analyses were conducted with a Fluke TiX500 camera (Everett, WA, USA, thermal sensitivity of ≤0.05 °C within a target temperature of 30 °C, accuracy of ±2 °C or 2%, range (not calibrated below −10 °C) −20 °C to +650 °C). Due to the inaccuracy of the single point temperatures captured by the thermal camera and the use of an estimated emissivity of 0.9 (standard for building materials), the absolute temperature values may vary, but give a reasonable estimate for comparison purposes. The single-point temperatures recorded represented the coldest temperature zones.
The thermographic analyses allow calculating the temperature factor f R s i for the two assemblies under test:
f R s i = T s i T e T i T e
The temperature factor f R s i characterizes the relation between the temperature of the internal surface of the envelope ( T s i , °C) and the interior ( T i , °C) and exterior ( T e , °C) temperatures of the building. T s i is a reading from the thermographic camera, and the temperatures T i and T e are obtained from the indoor (range +5 °C to +60 °C, accuracy of ±1.7 °C) and outdoor (range −30 °C to +30 °C, accuracy of ±1.7 °C) chamber sensors.
Under wind pressure (50 Pa), the thermographic analyses allowed us to determine the influence of the airtightness on the thermal performance according to:
Δ T s = T s i 1 T s i 2 T i T e
In Equation (3), the relative decrease in surface temperature Δ T s characterizes the difference of the internal envelope surface temperature before pressurization ( T s i 1 , °C) and after pressurization ( T s i 2 , °C) to the internal ( T i , °C) and external ( T e , °C) temperature difference.
To clearly see the temperature contrasts within the structure of the experimental walls, the wood battens were removed from the new concept and conventional walls.

3.2. Field Measurements

Field tests were conducted to allow a comparison with the laboratory tests. These tests were made possible through the construction of two single-family residential building by the industrial partner of this project in 2021. These two houses were built on two stories with a habitable basement. They were built in Beaupré, Québec, Canada.
House A relied on the FPWW developed within the conceptual development of Section 2. The sealing method also came from this process using the new concept 2 sealing method. As described, in the proposed design, this sealing method is slightly different from the laboratory sealing method. This time, the butyl and precompressed polyurethane foam were placed within 4.8 mm deep grooves. The wall assembly for this project was very similar to the one that was used in the laboratory with the new concept wall. In addition to the exterior and interior cladding (exterior wood cladding and interior gypsum), the walls of House A relied on a 38 mm exterior expanded polystyrene panel instead of the 25.4 mm used in the laboratory. This project, with a living area of 116 m2, also used completely prefabricated roof boxes using essentially the same sealing methods.
House B, with a living area of 71 m2, was built of partially prefabricated walls. Delivered to the site stacked one on top of the other, these open walls provide access to the interior of the structure. At the time of delivery, these walls consisted of a wood frame, an exterior structural insulated panel and a weather barrier membrane. Once completed on-site, these walls have essentially the same composition as the conventional wall used in the laboratory. These walls relied on the interior and exterior sealing of the vapor and weather barrier membranes to generate the air barrier. This sealing was completed on-site with sheathing tape.

3.2.1. Air Leakage Rate

To characterize the airtightness of the two residential buildings, standardized tests were performed according to the ASTM E779 standard to determine air leakage rate by fan pressurization [21]. These tests were conducted using Retrotec Model 6000 (Everson, WA, USA) equipment. The airflow measuring system was calibrated in accordance with Test Method E1258.
To analyze the airtightness performance over time of the junction implemented within House A, several tests were performed. For all these tests, the range of the induced pressure difference was from 50 to 15 Pa taking measurements at each 5 Pa increment. Data acquisition was completed manually and the average over at least a 10 sec span was used. Windows and ventilation ducts were closed to allow accurate interpretation of the results.
These tests allow measuring the air leakage over the whole building and not only for the specific air barrier system. Knowing the volume of the building ( V , a test provides readings in cubic meter per minute ( V ˙ Δ P ) and allow calculating the number of air changes per hour (ACH) at a given pressure ( Δ P ):
A C H Δ P = V ˙ Δ P V ·   ( 60   m i n h r )

3.2.2. Thermal Bridges

Following the objective of analyzing the effect of airtightness on thermal bridges in the field, the methodology of thermographic analysis in the laboratory was reused [16,43]. With a temperature difference of at least 20 K between the exterior and interior of the buildings, a first thermographic data capture was performed under normal conditions. Then, to force air infiltration into the structural joints, the fan pressurization equipment was used to generate a 50 Pa depressurization within the buildings. After the structural elements of the joints had cooled, which took around 30 min, a second thermographic image was taken. Equations (2) and (3) were reused for these measurements where the outdoor and indoor temperatures are no longer associated with the conditioning chambers, but with the outside and inside temperatures of the studied buildings.

3.2.3. Speed of Assembly

As discussed in the design process section, speed of assembly is an indented benefit of the developed connection. The erection of House A was an opportunity to evaluate the ability of the horizontal connection to assemble FPWW quickly. As the construction industry is looking to reduce construction times of conventional solutions, House B was also an opportunity to evaluate the assembly time of conventional prefabricated light wood frame walls.
To compare these two construction solutions, a time-motion study of the assembly of one story was carried out. This study is based on the manual compilation of time data according to a time grid for all the stages of completion for both sites. For each wall installed, the time count began with the lifting of the wall from the transport system to the detachment of the lifting system following the installation of the wall. The detachment of the lifting system was achieved when a wall was properly anchored, squared, and braced. Although the number of components between the two sites differed, the total linear measurement of installed walls presented in Table 2 allowed for this study to compare the two assembly methods.

4. Results

4.1. Laboratory Measurements

4.1.1. Air Leakage Rate

In accordance with ASTM E283, the air leakage test results were calculated per unit of length of the horizontal joint within the pressurization test cavity (Table 3). The uncertainty in the results is based on the uncertainty in the airflow readings proposed by the manufacturer. Unable to determine the extraneous airflow, i.e., the air leakage between the test gauge and the experimental wall, a reference test was performed on a continuous and damage-free polyethylene membrane. Since the polyethylene membrane is the interior air barrier of all the systems studied, this reference test allowed us to compare its performance to those of the systems under the same test conditions. For the sake of comparison, Table 3 also presents the performance of air barrier systems required by the Canadian standard CAN/ULC-S74.
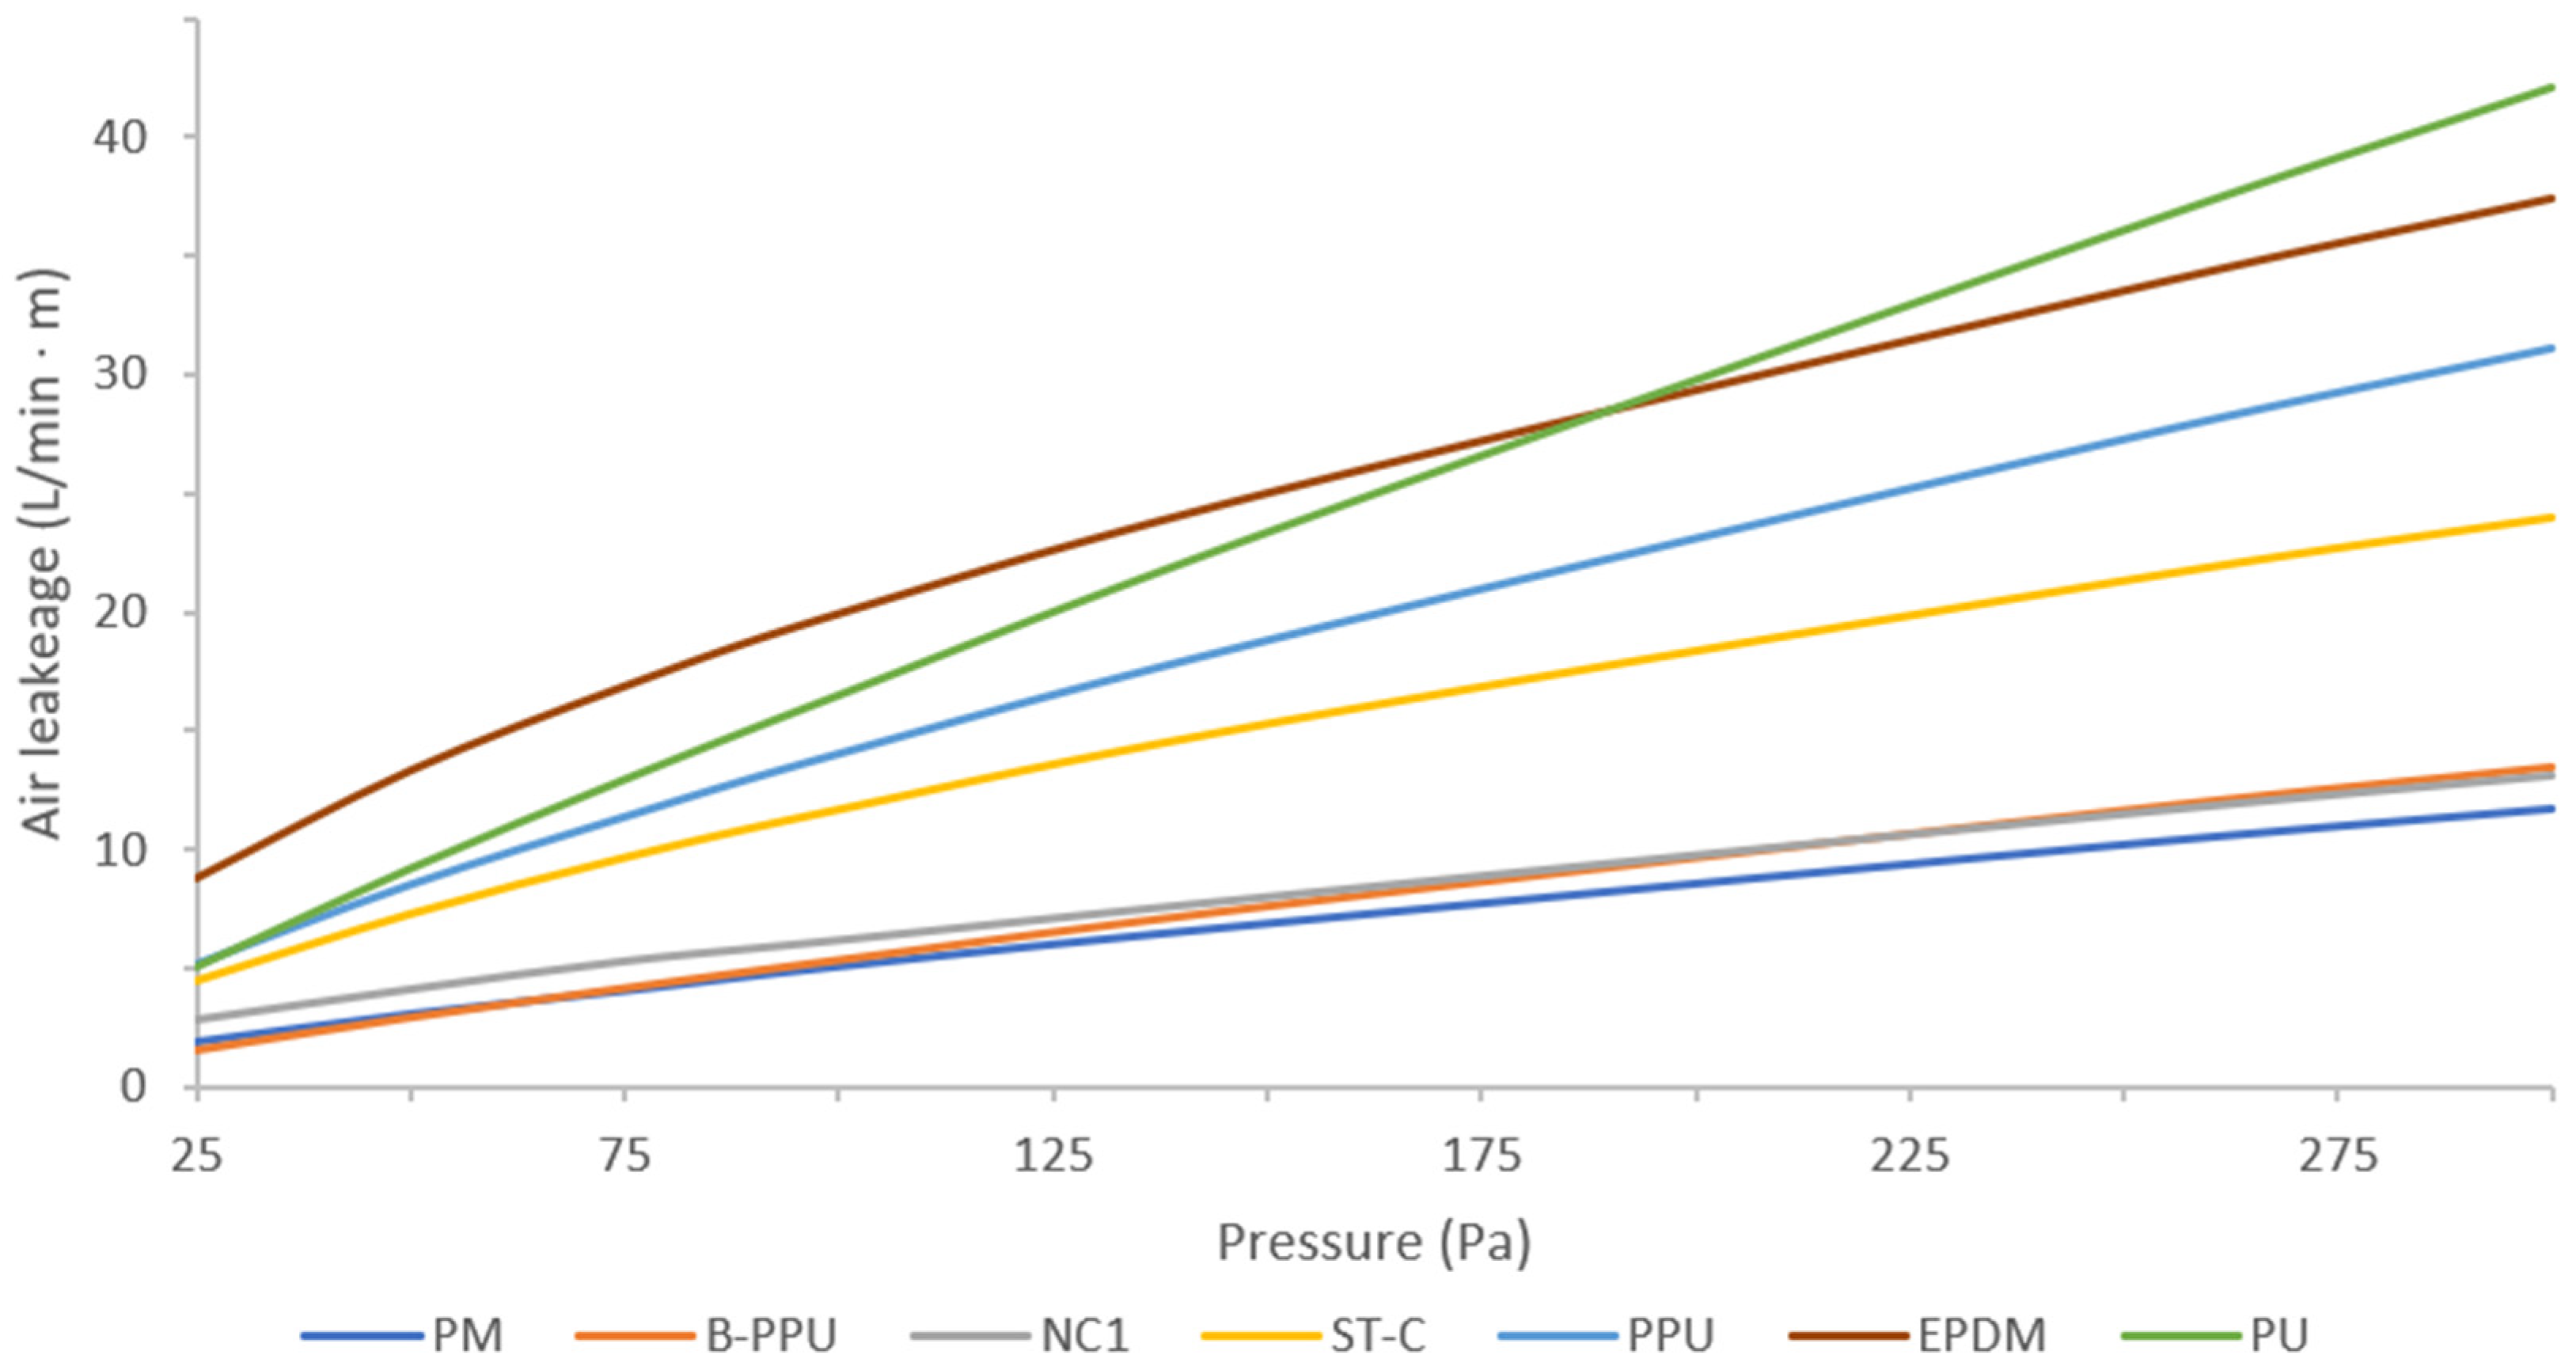
Of all the materials and systems studied, the tightest connection came from the tests involving the butyl tape. When tested in the reference wall, the butyl-precompressed polyurethane foam system (B-PPU) overlaps the performance of the polyethylene membrane (PM) and allows the new concept 2 (NC1) to be almost two times tighter at 75 Pa than the conventional wall using sheathing tape. The results of the precompressed polyurethane foam (PPU) enhance the importance of the butyl tape as the B-PPU is 2.7 times tighter than the PPU at 75 Pa. The least airtight solution at pressures below 150 Pa is the EPDM solution. Proposed in the construction field as a low-cost material to generate water and air protection, it remains that this system placed in laboratory conditions is almost two times tighter than the Canadian standard CAN/ULC-S74 at 75 Pa. Under high air pressures, i.e., 200 Pa and more, the polyurethane foam (PU) becomes the least airtight solution as shown in the graph below (Figure 7).
The airtightness results for the B-PPU suggest that the wood battens nailed through the air barrier have little impact on the airtightness of the system. Indeed, the results for the B-PPU are close to the results of the continuous and damage-free polyethylene membrane while the B-PPU was tested within the reference wall composed of nailed wood battens.
Finally, excluding solutions using butyl tape, the conventional solution with sheathing tape (ST-C) sealed in laboratory conditions remains the tightest solution.

4.1.2. Thermal Bridges

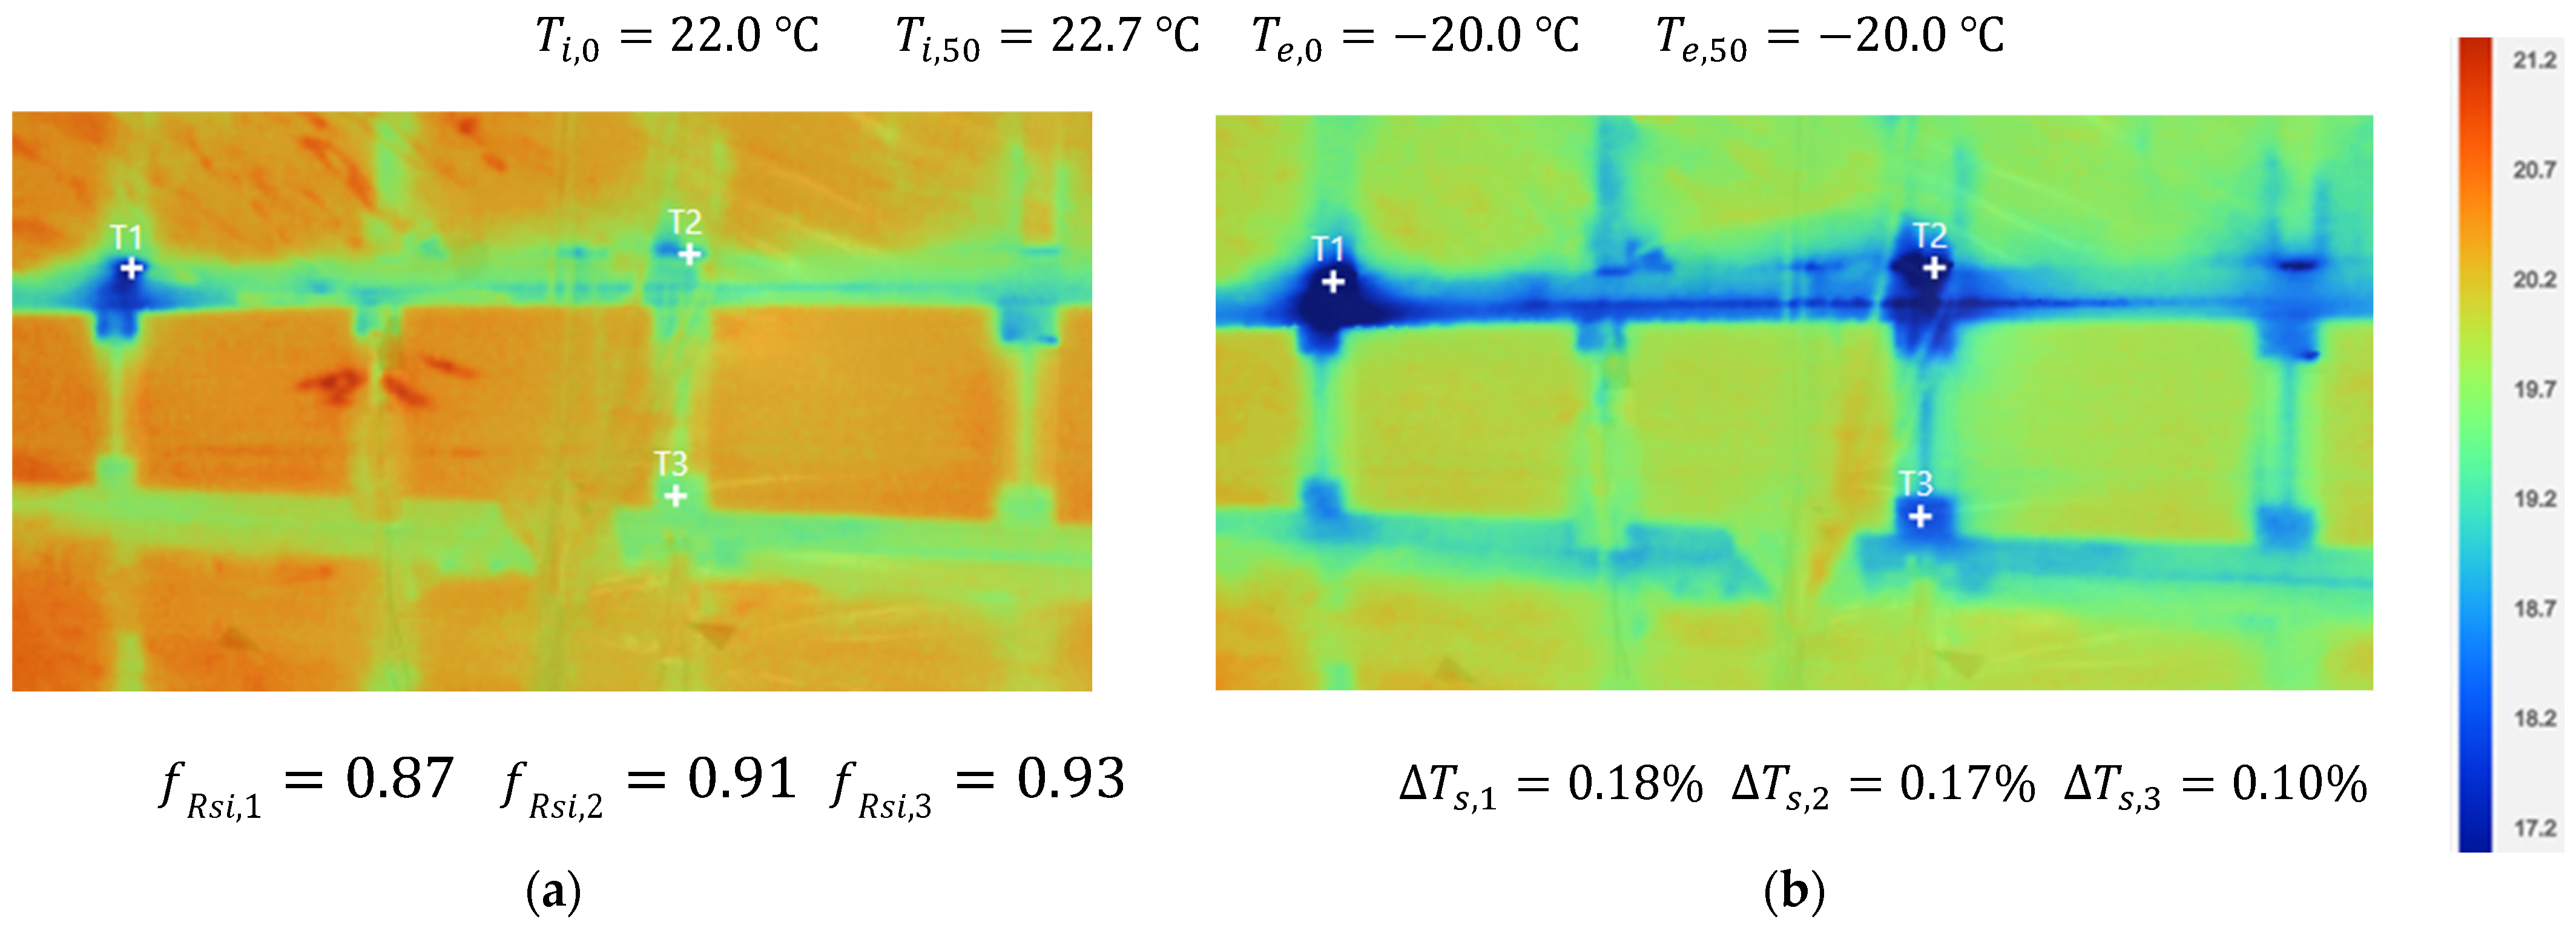
Normally generated in the field to locate the worst air leaks, thermographic analyses performed in the laboratory were used to analyze the thermal behavior of horizontal assemblies under wind pressure. Under normal conditions, the two assemblies under test shown in Figure 8 and Figure 9 have similar temperature factors. However, it is possible to notice in Figure 8 that the T 2 and T 3 points of the new concept 1 assembly are part of a linear thermal bridge. This linear thermal bridge is observed at the junction sealed by the butyl-precompressed polyurethane foam system. This phenomenon, at 0 Pa, does not seem to be present in the conventional assembly. Nevertheless, even if this difference is observed within the assemblies, the linear thermal bridge of the new concept 1 has a temperature factor of about f R s i = 0.90 . According to Kalamees et al. [43], Finnish instructions for housing health report that temperature factors of f R s i 0.87 reflect good performance for walls and tolerable performance for floors. Generating its floor structure on the interior side of walls, it can be suggested that even if it is possible to observe a linear thermal bridge within the new concept 1 assembly, this does not reflect poor performance.
It is under pressurization that it is possible to appreciate the differences between the two systems. Under 50 Pa, the new concept 1 system shows a very small relative decrease in the surface temperature, and this is at the most cooled points (Figure 8). The same linear thermal bridge previously analyzed is still present, but it has not become more important. The conventional system seems to be more affected by the pressure (Figure 9). For example, surface temperatures T 1 and T 2 dropped to T s i , 1 = 14.1   ° C and T s i , 2 = 15.6   ° C for temperature factors of f R s i , 1 = 0.80 and f R s i , 2 = 0.83 . In addition to these points, it is possible to see the appearance of a linear thermal bridge following the plywood screwed to the I-joist between T 1 and T 2 points.

4.2. Field Measurements

4.2.1. Air Leakage Rate

The results from the depressurization and pressurization tests including the accuracy uncertainty were obtained using the FanTestic data management software Table 4. Developed by Retrotec, this software complies with the ASTM E779 test standard.
The new concept 2 developed in House A is, according to the April 2022 tests, two times tighter than the conventional solution of House B. With a percentage difference of 16% over a 9-month period, the airtightness system of House A is relatively constant. This result suggests that the system is resilient following the installation of the FPWW, and this, after experiencing winter conditions that could reach average temperatures of −20 °C. Although this wood frame system relies on the engineered wood bottom and top plates, this system is susceptible to post-construction dimensional deformations. These deformations can operate on wood pieces relative to their hygroscopic behavior and their resistance to compression perpendicular to the grain. Nevertheless, over the time scale studied, the airtightness performance remained within the targets of the most demanding standards in terms of energy efficiency in Canada (Table 5).

4.2.2. Thermal Bridges

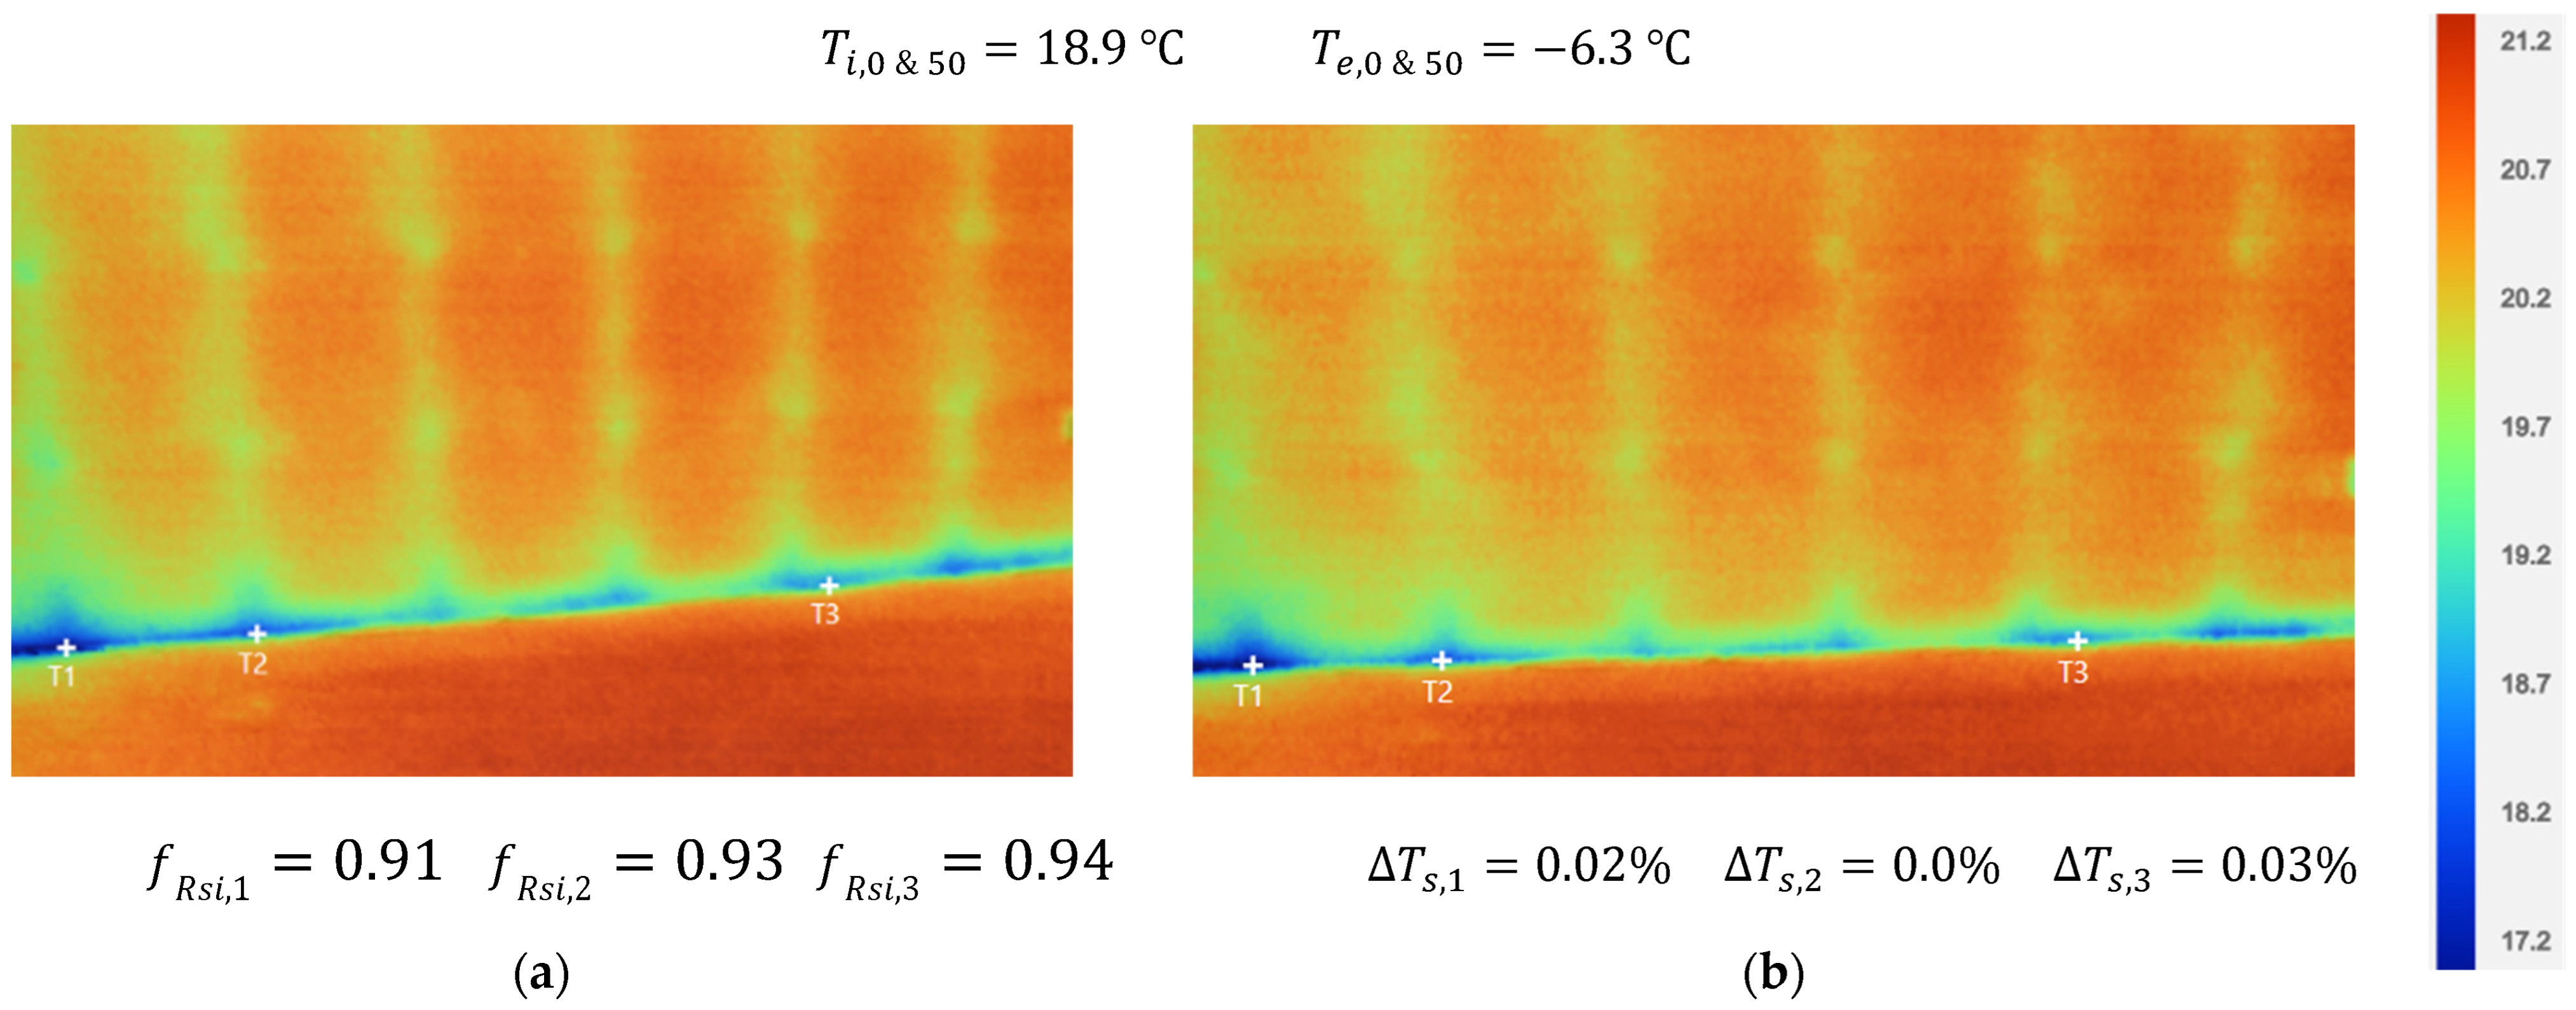
Contrary to the results obtained in the laboratory, House B and the conventional platform system showed consistency between the tests under normal conditions and under depressurization conditions for the junction of the exterior wall with the intermediate floor. Figure 10 is an example of this consistency where the measurements taken resulted in average temperature factors of f R s i = 0.92 at both 0 Pa and 50 Pa. Other junctions analyzed within House B seem to show greater air leakage, particularly in corners of external walls.
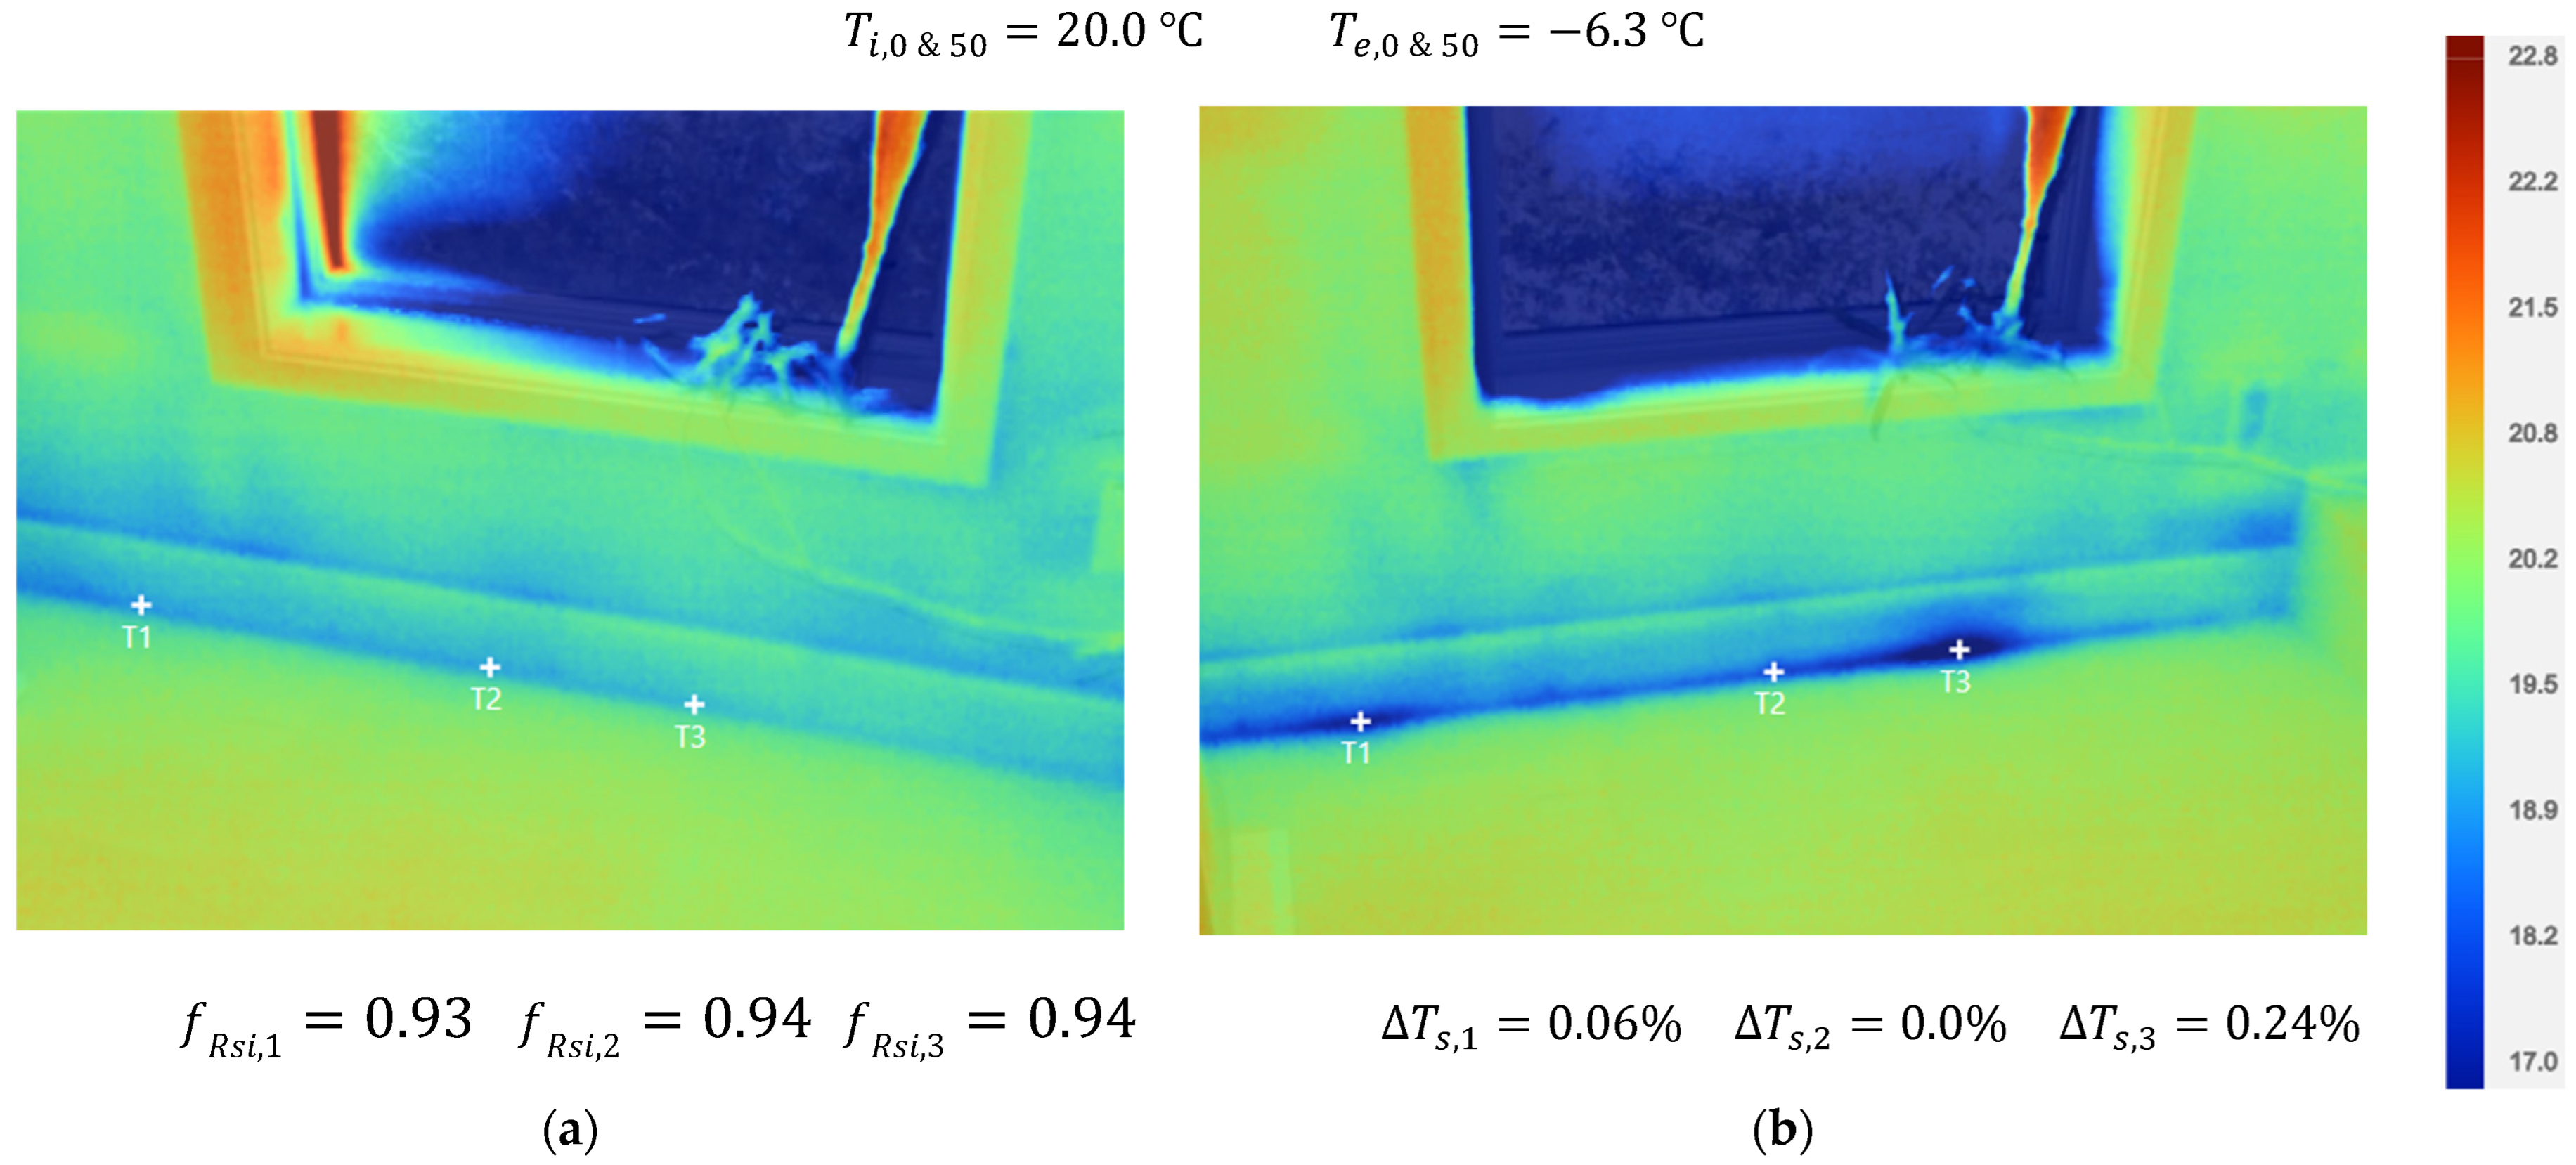
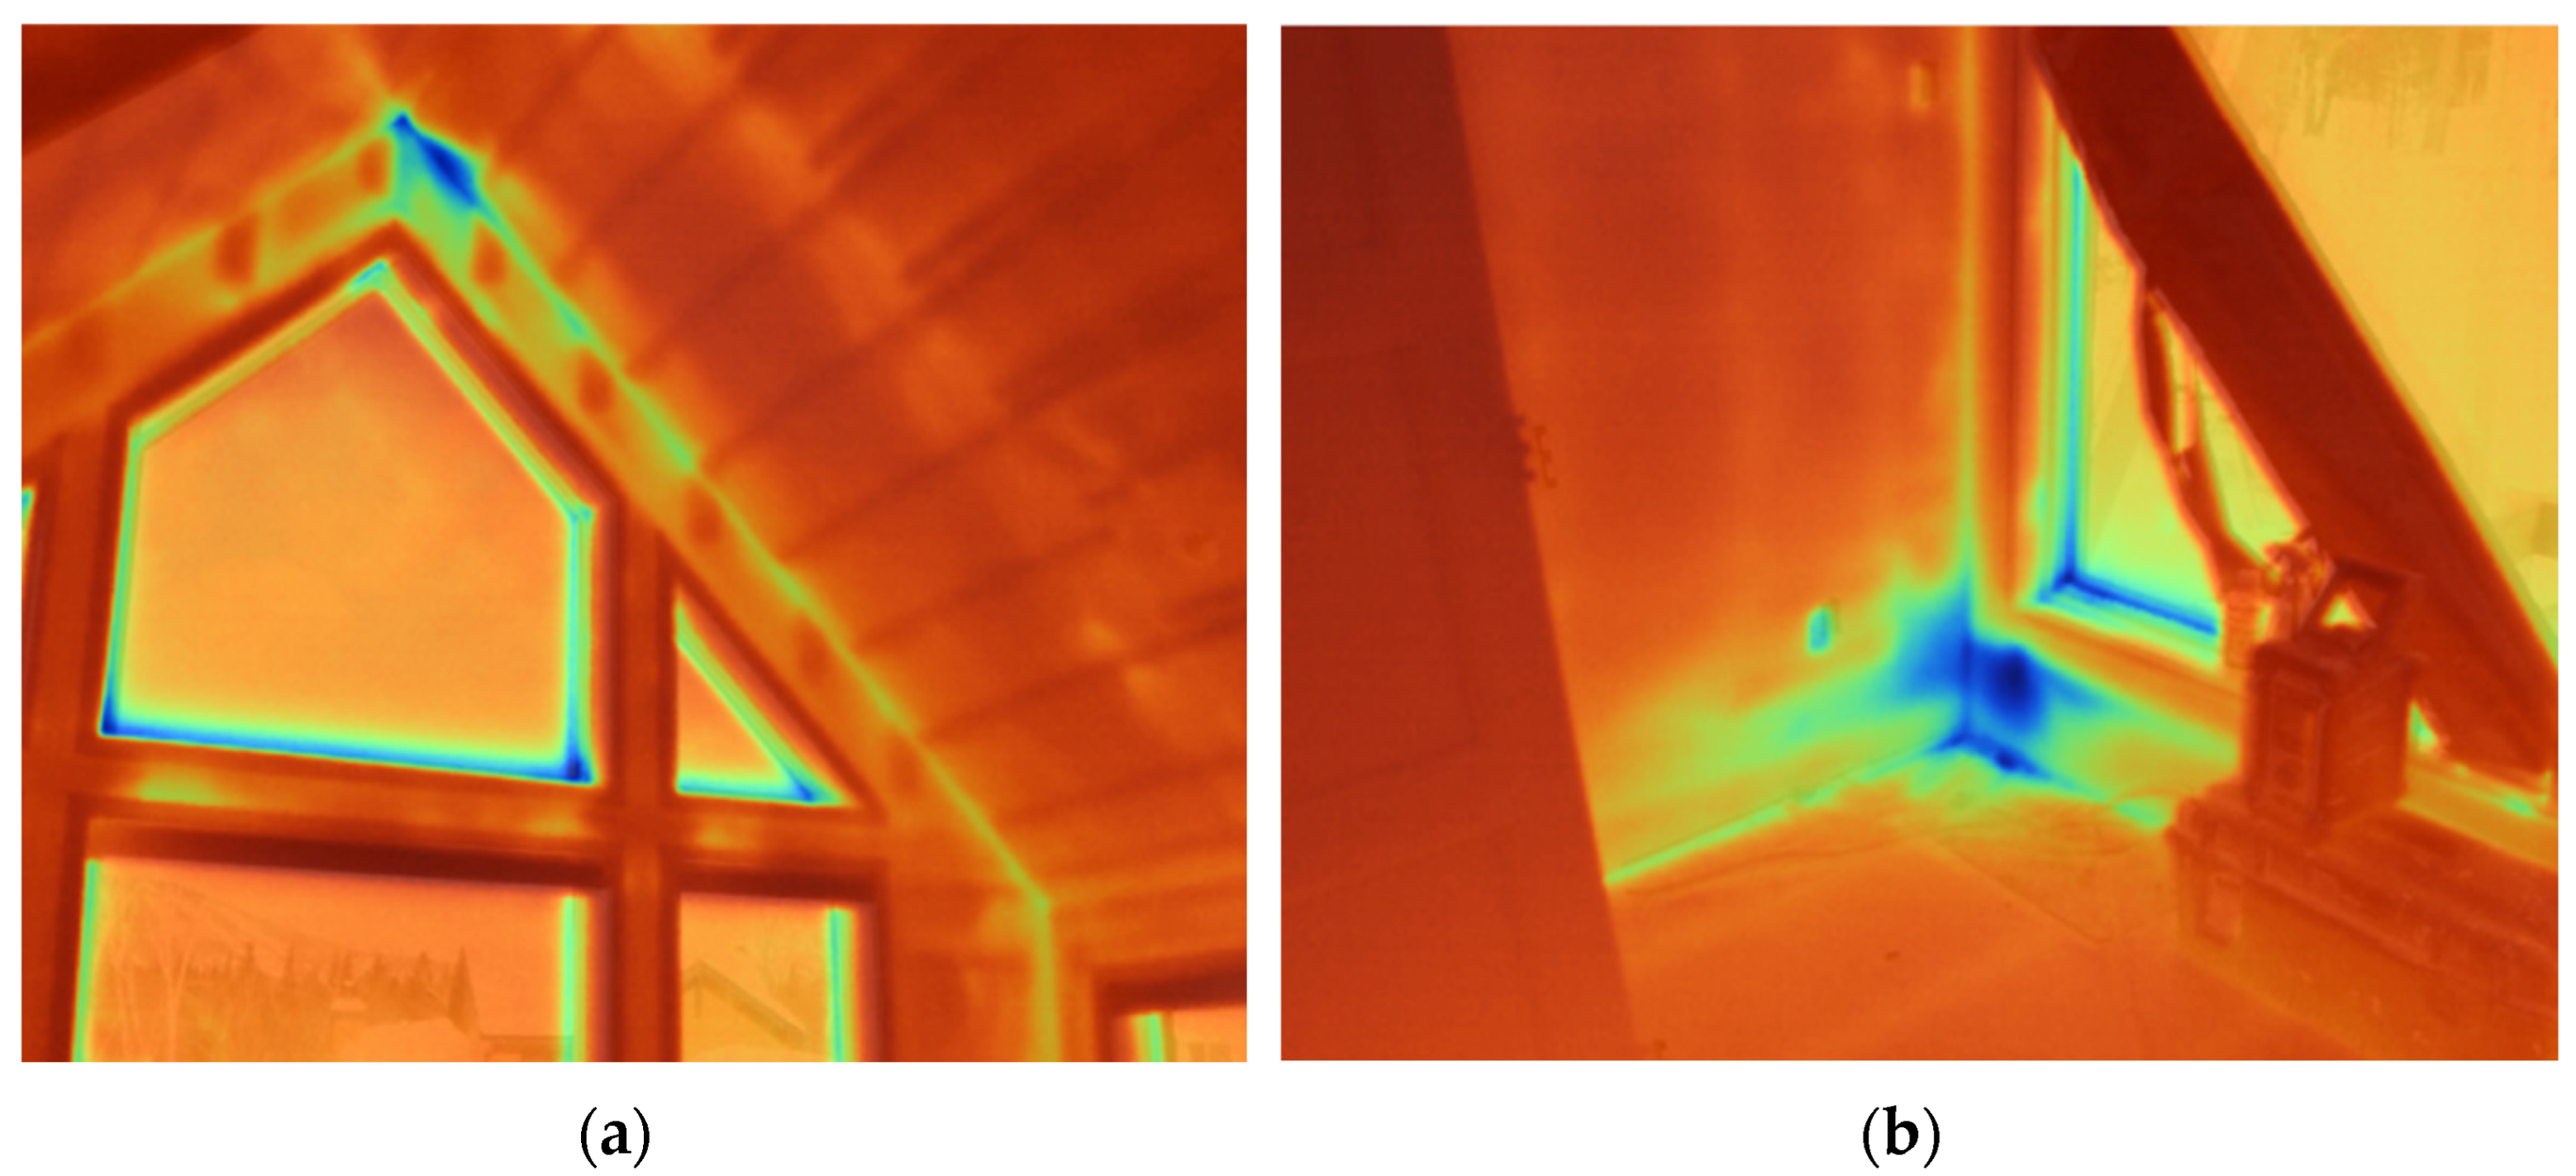
Thermographic analysis within House A and the new concept 2 sealing system provided two types of results. Like the results obtained in the laboratory, some of the thermographic images revealed horizontal junctions to be very tight, showing no thermal change following depressurization (Figure 11). On the other hand, other images revealed small air leaks within this same junction. Figure 12 shows one of these images where at point T 3 , a surface temperature of T s i , 3 = 16.75   ° C could be found for a temperature factor of f R s i , 3 = 0.88 at 50 Pa. Still not representing a critical temperature factor, this observation may still be a weakness within the new concept 2 sealing system. This result is also consistent with field observations where some upper wall sections appeared not to compress effectively adjacent to lower walls. Nevertheless, similar to what was observed in House B, other structural joints seemed to be leakier. From the thermographic observations collected, the connection between the cathedral roof boxes and the front facade wall appeared to be one of the least airtight connections (Figure 13).

4.2.3. Assembly Speed

The results from the time-motion study for Houses A and B are presented in Table 6. Counting on the construction of 8 walls totaling 47.1 m, House B presented an average of 5.9 m per prefabricated wall, regrouping all these walls between 4.3 and 8 m in length. As for House A, it required the construction of six walls totaling 44.2 m in length. Grouping all these walls between 1.4 and 12.5 m, it is possible to see that the project of House A had two quite distinct sequences of walls. The first three site-assembled walls averaged 11.1 m while the last three walls averaged 3.7 m. This noticeable difference seems to have had an impact on the construction times, as the first three walls could be assembled in an average of 23.3 min, compared to an average of 16.3 min for the last three walls.
However, even if the dimensions of the second assembly sequence of House A are more similar to those of House B, the average time for the construction of House B was 6.8 min per prefabricated wall, which is 2.4 times faster than House A. Furthermore, this measure between the two sites does not consider the number of workers on each site. With three workers instead of five like House A, House B and its conventional prefabricated walls are thus significantly more efficient on-site as shown in Table 7.
As a result, for the assembly of a prefabricated light wood frame story, House B is almost four times more efficient than House A.

5. Discussion

The developed sealing systems, the new concept 1 in the laboratory, and the new concept 2 on-site, both exhibited airtight connections. Compared to different materials and systems in the laboratory and on-site, the butyl-precompressed polyurethane foam system was at least twice as airtight as any materials or systems tested, even though some systems performed very well compared to the literature. As a matter of fact, the conventional sheathing tape solution showed laboratory results similar to what Kalamees et al. [16] found. However, with a team of workers that was very attentive to the sealing details, House B exhibited an airtightness level 3.6 times higher than that of the average single-family home tested by Kalamees et al. [16]. This result can be explained by the quality of the job completed by the workers on-site. This specific context, which deviates from what is usually measured on a construction site [9], can be taken up and standardized within an industrial environment. It is in this type of environment, controlled and supervised, that the FPWW intended for the laboratory and for the construction on-site, could be completed. This industrial context allows for quality control that limits defects and standardizes sealing methods regardless of the experience of the workers.
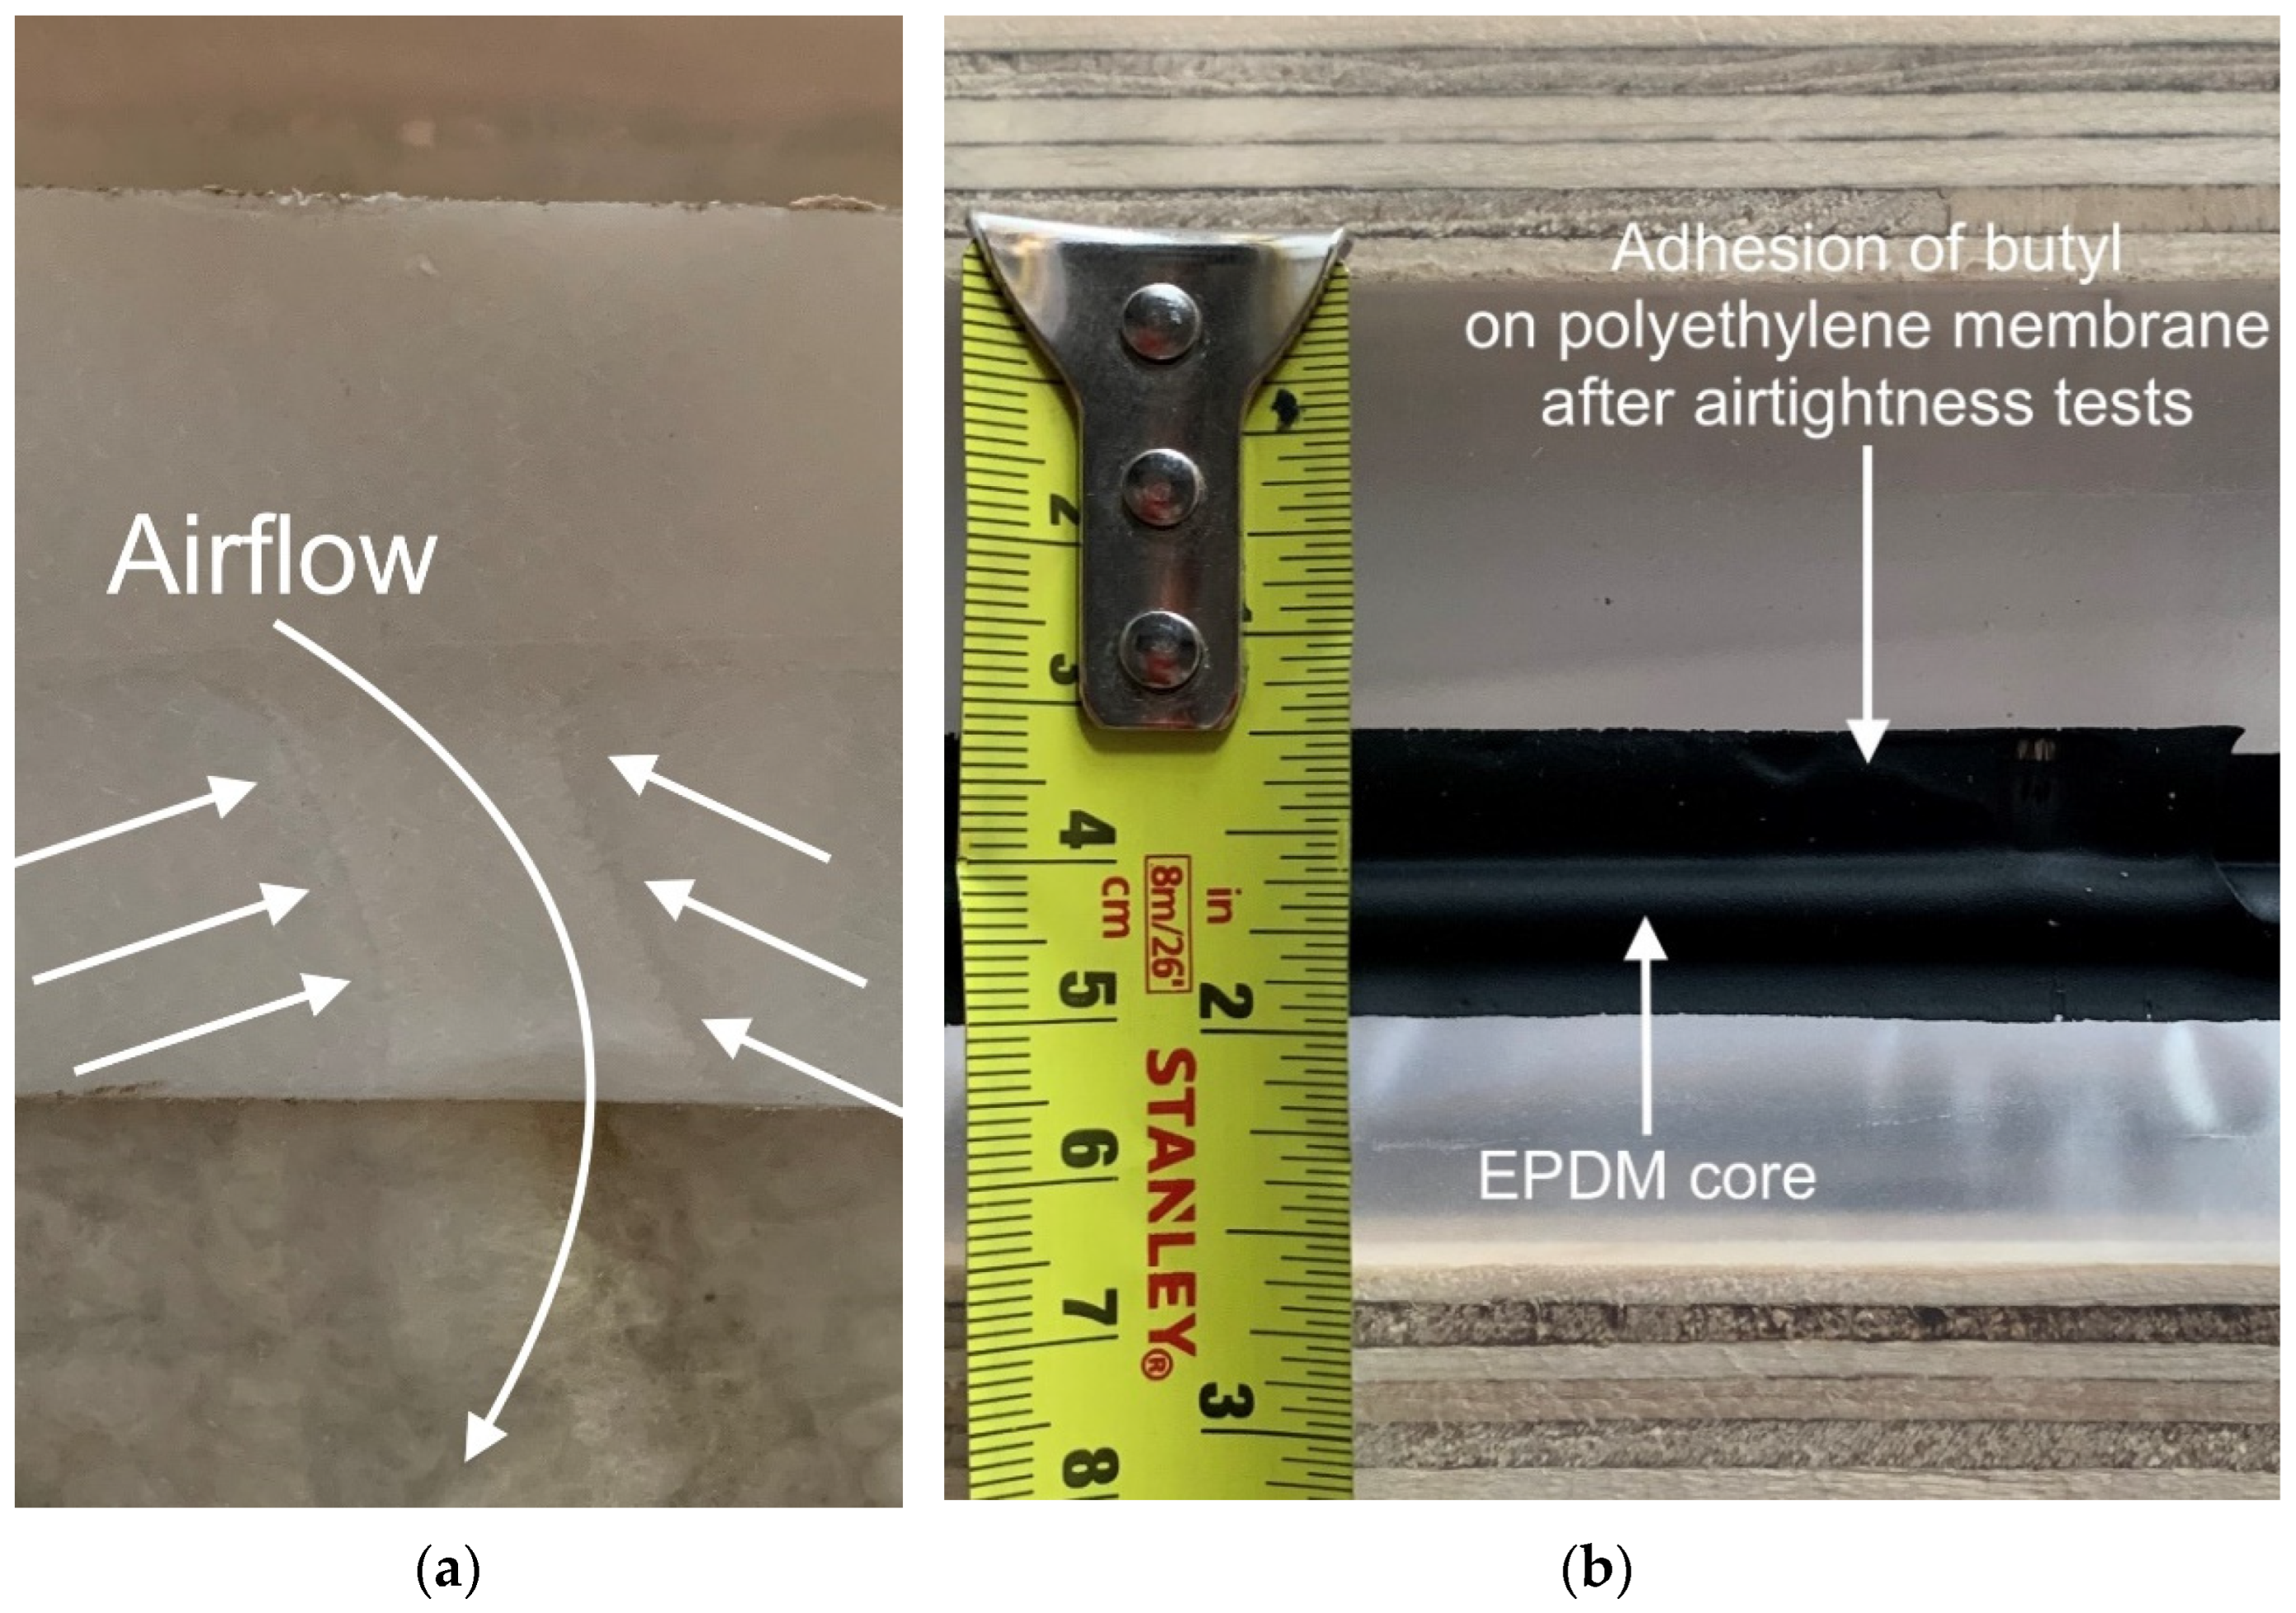
Of these sealing methods, FPWW is designed to rely on continuous vapor and weather barrier membranes over the entire wall surface. No joints are therefore made on the surface of these walls. Knowing that the majority of construction tapes use pressure-sensitive adhesives and adhere well to surfaces such as plywood or OSB [48], it seems efficient to seal the membranes to solid wood substrates. These substrates, LSL plates on the perimeter of the panel, allow good pressure to be applied to the adhesives during installation. These solid substrates also made it possible to seal the membranes on uniform surfaces. This minimizes the possibility of air channels due to inappropriate adhesion of tapes on irregular surfaces (Figure 14a). On-site sealing joints such as those at the junction of the exterior walls with the intermediate floor are most likely completed on non-rigid surfaces with membranes exposed to the weather. These can thus be altered and present irregularities favoring air leaks.
Since the prefabricated elements of a platform structure arrive separately on-site, the seals must be made at several points on the exterior walls and floor structure. Applied to the top and bottom of the floor joists, the sealing between the exterior walls and the intermediate floor coincides with the wood structure of the floor. Thermographic images in the laboratory illustrated the phenomenon where under the effect of air pressure, wood structure influences the thermal behavior of the junction of the exterior walls with the intermediate floor. The new concept wall structure allows two things. First, the wood structure of the floor is now placed on the warm side of the building envelope. Second, since it is now two FPWWs that are joining directly, the seal is isolated in a horizontal line all along the junction of those two FPWWs. In this way, the airtightness performance of this system is a function of this horizontal self-sealing joint and is no longer of several points on the exterior walls and floor structure. Of these self-sealing joints tested in the laboratory, the butyl tape allowed the new concept 1 developed to present the most airtight results. When properly compressed, the butyl tape adheres really well to adjacent polyethylene membranes as shown in Figure 14b. It also helps limit thermal effects within the joint under air pressure.
Even though butyl material was used in the new concept 1 (laboratory) and 2 (on-site), the two systems were different. Nevertheless, it is difficult to adequately judge the distinction between the two systems in the laboratory. The horizontal joint tested was much shorter and therefore possibly straighter than in the field. This situation maximized the chances of obtaining an adequate and constant compression of the butyl material. However, the airtightness laboratory results still show a difference between the performance of the butyl-precompressed polyurethane foam joint tested in the reference wall and the new concept 1 joint tested in the new concept wall. This result may suggest that the precompressed polyurethane foam material contributed to the sealing of the new concept 1. The on-site thermographic results also showed a contrast between the two systems. The thermographic images show that some sections of the joint using the new concept 2 were very tight and some other sections appeared to be leaky. This difference seems to illustrate the inability of the new concept 2 system to generate an effective seal if the adjacent walls are spaced more than 2.2 mm apart. The wood prefabrication industry in the Province of Quebec generally has a dimensional tolerance between 3.2 mm and 6.4 mm. Of course, the bottom and top plates made of engineered wood help to reduce this inaccuracy, but it is difficult to imagine that all the walls of House A, especially the very long ones, could be perfectly straight.
Although the new concept 1 offers a wider dimensional range of effectiveness, up to 7 mm spacing between adjacent walls, it is generated using two separate materials. This can burden the manufacturing process. In addition, despite butyl being possibly suitable for factory execution, its highly adhesive surface must not come into contact with other materials. Similar considerations apply to precompressed polyurethane foam. Because of its precompressed nature, this material contributes to the air barrier system within a specific dimensional interval. This means that if the material is applied too early in the manufacturing process, it may result in a dimensional deployment that would exceed its specific dimensional interval once on-site and prevent the system from relying on an air barrier material. To avoid this problem, the application of this foam was completed on-site prior to the FPWW assembly for House A. However, manufacturing initiatives could allow this material to be applied in the factory before being sent to the job site.
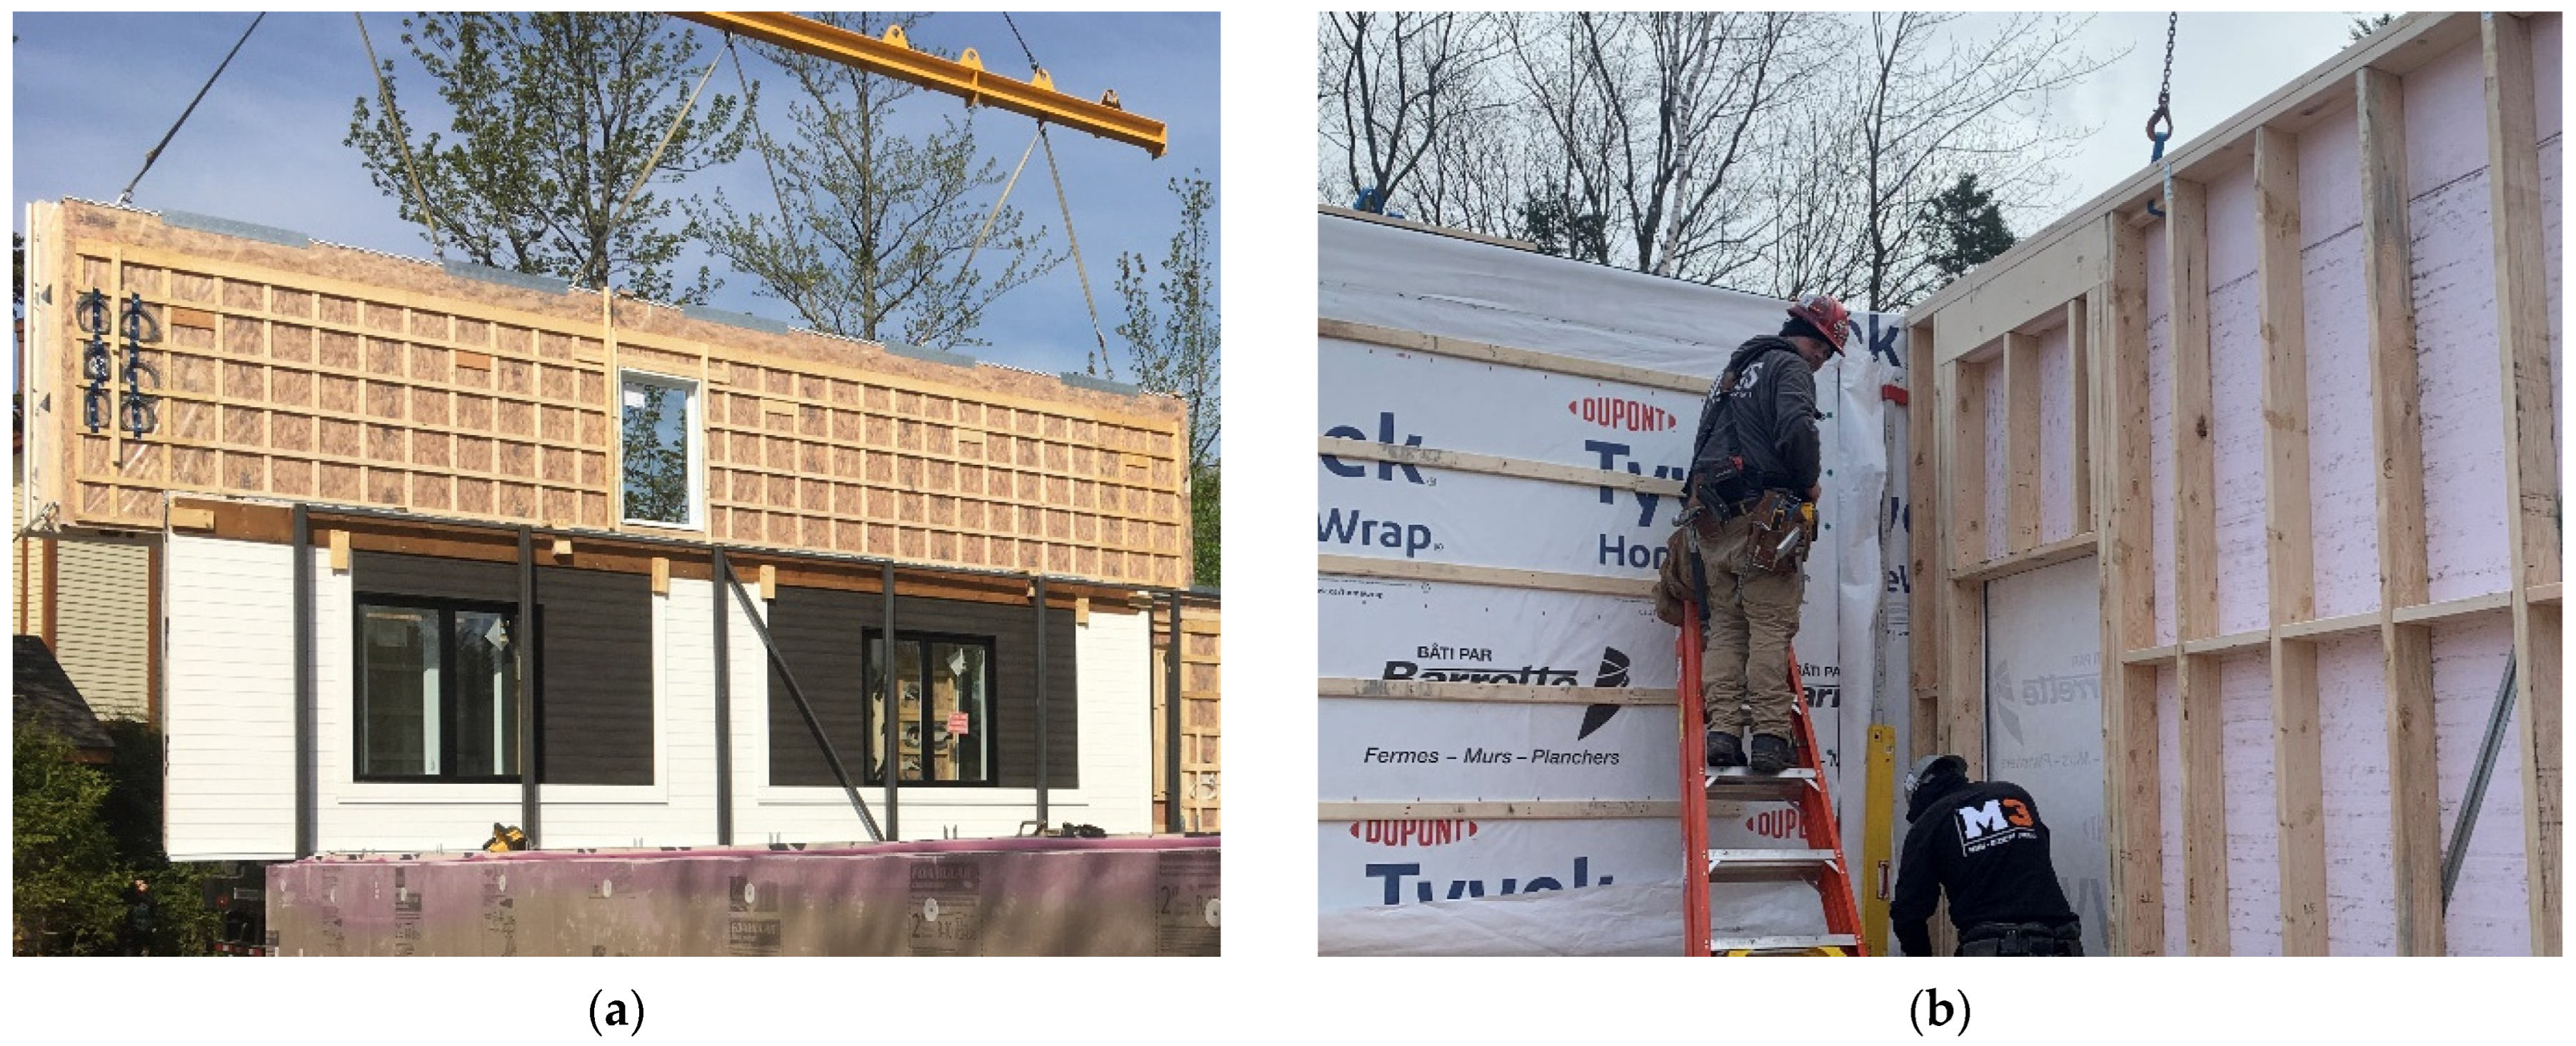
While the productivity measure for the assembly of houses A and B seems to show an assembly difficulty for FPWW, it is important to understand what is causing this difference and whether the impact on the overall construction project is also negative. In fact, conventional prefabricated light wood frame walls and closed FPWW were two completely different systems (Figure 15). While conventional prefabricated walls are equipped with the structure, a structural insulating panel and a weather barrier membrane, FPWW are equipped with the interior wood battens, the isolated structure, a vapor barrier membrane, a rigid insulation panel, a weather barrier membrane, windows/doors and the exterior cladding.
Structurally open and lighter, conventional prefabricated walls are more flexible and easily manipulated. With access to the structure, workers can also alter and increment dimensional changes to the walls easily to allow them to fit on-site. Stacked on top of each other on the job site, conventional prefabricated walls are also easier to handle during lifting operations. Lighter, they require fewer lifting anchors, which also speeds up the assembly process. All these elements explain the speed of the installation of conventional prefabricated walls.
Heavier, more rigid, and requiring special attention during the lifting stages [30], the assembly of the FPWW on the site of House A was nevertheless carried out without any major error. No modification or alteration of the walls was necessary to assemble the two floors of House A. Moreover, supported by the airtightness results obtained on-site, the joints do not seem to have complicated the assembly of FPWW compared to Scott [32] who encountered alignment difficulties when connecting closed prefabricated walls. In fact, while the installation of the structural system complementary to the joint takes time, other elements seem to have made the FPWW assembly more time-consuming. As the time-motion study presented, the speed difference between the long and short walls of House A was important. Standardization of the wall dimensions could simplify the lifting procedures and speed up the whole assembly process. Transported vertically with a transport system adapted to FPWW, it could also be useful to review this system to allow the crane operator to accelerate the launching of the lifting as special attention was devoted to limiting the alteration of the exterior cladding and the windows.
Overall, the FPWW developed in this project was able to maximize the industrialization of conventional prefabricated walls and to get closer to the modular industry and its advantages. Spread over different days, the construction of House A took place over 4 days, 2 half days for the walls of the two stories, and 3 days for the prefabricated roof. To estimate the benefits of this project as a whole, a comparison between a conventional schedule and a possible schedule using FPWW is in order. The Canada Mortgage and Housing Corporation (CMHC) estimates that for a conventional single-family residential project, the installation of the structure, doors, windows, exterior cladding, insulation, and building envelope barriers takes 7 weeks (Figure 16) [36]. All of these steps are completed industrially in the context of FPWW such as in the House A project. Bekdik et al. [15] estimate that off-site construction would reduce the time associated with conventional on-site construction by 20 to 50%. Thus, the 7 weeks associated with the steps that can be performed industrially using FPWW could be reduced by almost a week and a half to possibly 3.5 weeks (Figure 17). Combining these reductions with the possibility of completing the initial stages in parallel with the fabrication of the prefabricated elements, it would be possible to project a schedule that would last between 11,5 to 13,5 weeks compared to the conventional 16 weeks proposed by the CMHC [36]. This would represent a potential schedule reduction for this type of single-family residential project of 16% to 28%. Although this estimation is made in a single-family residential context, it is possible to suggest that these time reductions are quite possible for non-residential and multi-family buildings. As discussed by Bekdik et al. [15], for a distance of about 250 km, shipping FPWW, as opposed to prefabricated modules, could reduce transportation costs by 5.6 times.
Of the self-sealing materials tested, the system consisting solely of precompressed polyurethane foam was the most economical material at CAD 3.28 per meter (all amounts presented are in Canadian dollars). Due to its precompressed nature, this material needs to be placed in a groove to be effective between two adjacent walls. For the effectiveness range used in this study, this material could seal joints of 4 mm. The second most economical system is the one consisting of two 10 mm diameter EPDM tubes for a price of CAD 4.91 per meter. The butyl precompressed polyurethane foam system, which can seal joints up to 7 mm apart, was CAD 5.62 per meter. Finally, having the widest dimensional range of sealing possible with 20 mm thick foam modules, polyurethane foam was the most expensive material at CAD 7.63 per meter.

6. Conclusions

A self-sealing joint for the junction of the exterior walls with the intermediate floor was developed within a system of fully prefabricated light wood frame walls (FPWW). These FPWWs include sealing details, doors, windows, and exterior cladding. The sealants used at this junction were tested in the laboratory to compare their airtightness performance to other sealants used in the construction industry. FPWW were also tested in the laboratory and on-site to compare their airtightness and thermal performances to a conventional light wood frame system. Assembly speed observations were also conducted on-site.
Of all the materials tested, butyl tape achieved the tightest connections. When used in the joint, this material allows the developed system to be twice as airtight as the conventional sealing tape system. In addition to these airtightness performances, it was possible to determine that this system must be able to generate an effective seal, even if the joint is spaced more than 2.2 mm apart. To this effect, the new concept 1, able to seal adjacent walls spaced by 7 mm, allowed us to generate a very tight sealing and limit the thermal effects under pressurization.
Heavier, stiffer, and requiring special attention, the assembly of FPWW for one story was almost four times slower than the assembly of conventional prefabricated light wood frame walls. This measure of inefficiency, however, appears to be due not to the sealing method developed, but rather to the constraints that a totally closed prefabricated wall implies.
Nevertheless, these walls maximize the industrialization of conventional prefabricated walls and allow for the installation of more finished walls on-site. This solution would combine the advantages of the modular and panelized models by maximizing quality control while simplifying transportation and on-site equipment. FPWW developed in this study could reduce transportation costs associated with conventional modular solutions. These walls could also reduce the duration of a conventional single-family residential project by 16 to 28%.

7. Patents

This project was completed using fully prefabricated wood patented walls. The patent application ((N°: 16/771.545) generated by the industrial partner of this research has been accepted by the United States Patent Office in 2022.

Author Contributions

Conceptualization, E.J., L.G. and P.B.; methodology, E.J., L.G. and P.B.; analysis, E.J.; writing—original draft preparation, E.J.; writing—review and editing, E.J., L.G. and P.B.; supervision, L.G. and P.B.; project administration, P.B.; funding acquisition, P.B. All authors have read and agreed to the published version of the manuscript.

Funding

This project was funded in part by the Natural Sciences and Engineering Research Council of Canada through its CRD program (RDCPJ 533629-18) and its IRC program (IRCPJ 461745-18). Funding was also provided by the Ministère des Forêts, de la Faune et des Parcs through its PVT program (PVT-29) and by the Société d’habitation du Québec through its PADIQH program (PS-2019-01085).

Data Availability Statement

Some or all data, models, or code that support the findings of this study are available from the corresponding author upon reasonable request.

Acknowledgments

The authors are grateful to Natural Sciences and Engineering Research Council of Canada for the financial support through its CRD program (RDCPJ 533629-18) and IRC program (IRCPJ 461745-18). The authors want also to acknowledge the industrial partner involved in the project as well as Rotho Blaas SRL for their donation.

Conflicts of Interest

The authors declare no conflict of interest.

References

  1. United Nations Environment Programme. 2021 Global Status Report for Buildings and Construction: Towards a Zero-emissions, Efficient and Resilient Buildings and Construction Sector. 2021. Available online: www.globalabc.org (accessed on 11 January 2022).
  2. Chayer, J.-A. Les impacts environnementaux d’un bâtiment et les outils pour les évaluer. In Colloque Gestionnaires Techniques—Société D’habitation du Québec. 2018. Available online: http://www.habitation.gouv.qc.ca/fileadmin/internet/documents/SHQ/colloque_gestionnaire_technique/2017/CGT-2018-10-impacts-environnement-batiments.pdf (accessed on 24 November 2021).
  3. Chau, C.K.; Leung, T.M.; Ng, W.Y. A review on Life Cycle Assessment, Life Cycle Energy Assessment and Life Cycle Carbon Emissions Assessment on buildings. Appl. Energy 2015, 143, 395–413. [Google Scholar] [CrossRef]
  4. Beccali, M.; Cellura, M.; Fontana, M.; Longo, S.; Mistretta, M. Energy retrofit of a single-family house: Life cycle net energy saving and environmental benefits. Renew. Sustain. Energy Rev. 2013, 27, 283–293. [Google Scholar] [CrossRef]
  5. Hong, S.J.; Arehart, J.H.; Asce, S.M.; Srubar, W.V.; Asce, A.M. Embodied and Operational Energy Analysis of Passive House-Inspired High-Performance Residential Building Envelopes. J. Archit. Eng. 2020, 26, 04020010. [Google Scholar] [CrossRef]
  6. IPCC. Global Warming of 1.5 °C An IPCC Special Report on the Impacts of Global Warming of 1.5 °C above Pre-Industrial Levels and Related Global Greenhouse gas Emission Pathways, in the Context of Strengthening the Global Response to the Threat of Climate Change, Sustainable Development, and Efforts to eradicate Poverty; Masson-Delmotte, V., Zhai, P., Pörtner, H.-O., Roberts, D., Skea, J., Shukla, P.R., Pirani, A., Moufouma-Okia, W., Péan, C., Pidcock, R., Connors, S., Matthews, J.B.R., Chen, Y., Zhou, X., Gomis, M.I., Lonnoy, E., Maycock, T., Tignor, M., Waterfield, T., Eds.; Intergovernmental Panel on Climate Change: Genève, Switzerland, 2018.
  7. Wu, M.H.; Ng, T.S.; Skitmore, M.R. Sustainable building envelope design by considering energy cost and occupant satisfaction. Energy Sustain. Dev. 2016, 31, 118–129. [Google Scholar] [CrossRef] [Green Version]
  8. Natural Resources Canada. Residential Sector—Energy Use Analysis. National Energy Use Database. 2018. Available online: https://oee.nrcan.gc.ca/corporate/statistics/neud/dpa/showTable.cfm?type=AN&sector=res&juris=00&rn=11&page=0 (accessed on 20 March 2022).
  9. Straube, J. High Performance Enclosures: Design Guide for Institutional Commercial and Industrial Buildings in Cold Climates; Building Science Press: Somerville, MA, USA, 2012. [Google Scholar]
  10. Boafo, F.E.; Kim, J.H.; Kim, J.T. Performance of modular prefabricated architecture: Case study-based review and future pathways. Sustainability 2016, 8, 558. [Google Scholar] [CrossRef] [Green Version]
  11. K Orlowski. Assessment of manufacturing processes for automated timber-based panelised prefabrication. Buildings 2019, 9, 125. [Google Scholar] [CrossRef] [Green Version]
  12. Sanna, F.; Hairstans, R.; Leitch, K.; Crawford, D.; Menendez, J.; Turnbull, D. Structural optimisation of timber offsite modern methods of construction. In Proceedings of the World Conference on Timber Engineering 2012, WCTE 2012, Auckland, New Zealand, 15 July 2012; Volume 3, pp. 369–377. [Google Scholar]
  13. Sosa, A.S.; Riola-Parada, F.; Santana-Sosa, A. A Theoretical Approach Towards Ressource Efficiency in Multi-Story Timber Buildings Through BIM and LEAN. 2018. Available online: https://www.researchgate.net/publication/331354920 (accessed on 1 November 2021).
  14. Said, H.M.; Chalasani, T.; Logan, S. Exterior prefabricated panelized walls platform optimization. Autom. Constr. 2017, 76, 1–13. [Google Scholar] [CrossRef]
  15. Bekdik, B.; Pörzgen, J.; Bull, S.S.; Thuesen, C. Modular construction: From projects to products. Archit. Eng. Des. Manag. 2018, 14, 95–108. [Google Scholar] [CrossRef]
  16. Kalamees, T.; Alev, Ü.; Pärnalaas, M. Air leakage levels in timber frame building envelope joints. Build. Environ. 2017, 116, 121–129. [Google Scholar] [CrossRef]
  17. Alencastro, J.; Fuertes, A.; de Wilde, P. The relationship between quality defects and the thermal performance of buildings. Renew. Sustain. Energy Rev. 2021, 81, 883–894. Available online: https://pearl.plymouth.ac.uk (accessed on 21 April 2021). [CrossRef]
  18. Kalamees, T. Air tightness and air leakages of new lightweight single-family detached houses in Estonia. Build. Environ. 2007, 42, 2369–2377. [Google Scholar] [CrossRef]
  19. Prignon, M.; van Moeseke, G. Factors Influencing Airtightness and Airtightness Predictive Models: A Literature Review. Energy Build. 2017, 146, 87–97. [Google Scholar] [CrossRef]
  20. Amigo, J.M.M. Optimisation of Timber Frame Closed Panel Systems for Low Energy Buildings. Ph.D. Thesis, Edinburgh Napier University, Edinburgh, Scotland, 2017. [Google Scholar]
  21. ASTM E779—19; Standard Test Method for Determining Air Leakage Rate by Fan Pressurization. ASTM International: West Conshohocken, PA, USA,, 2019; pp. 1–11. [CrossRef]
  22. Housing, B.C. Illustrated Guide: Achieving Airtight Buildings; BC Housing, BC Hydro: City of Vancouver, BC, Canada, 2017; p. 56. [Google Scholar]
  23. Canadian Commission on Building and Fire Codes and Natural Resources Canada. National Energy Code of Canada for Buildings: 2017, 4th ed.; National Research Council Canada: Ottawa, ON, Canada, 2017.
  24. Québec, R.d.b.d.; Lessard, N. Règlement en Efficacité Énergétique—Code de Construction Chapitre I.1—Printemps 2021; Régie du Bâtiment: Québec City, QC, Canada, 2021. [Google Scholar]
  25. Emmerich, S.J.; Persily, A.K. Analysis of U.S. commercial building envelope air leakage database to support sustainable building design. Int. J. Vent. 2014, 12, 331–343. [Google Scholar] [CrossRef]
  26. Bell, M.; Wingfield, J.; Miles-Shenton, D.; Seavers, J. Low carbon housing: Lessons from Elm Tree Mews. Project Report. Joseph Rowntree Found 2010, 1, 119. [Google Scholar]
  27. Middleton, B.; Moelis, D. Designing and Building the World’s Largest & Tallest Passive House Building—The House at Cornell Tech, Roosevelt Island, New York City. New York, 2017. Available online: www.handelarchitects.com (accessed on 1 April 2020).
  28. Zhivov, A.; Herron, D.; Durston, J.L.; Heron, M.; Lea, G. Airtightness in New and Retrofitted U.S. Army Buildings. Int. J. Vent. 2014, 12, 317–330. [Google Scholar] [CrossRef]
  29. Kalamees, T. Airtightness and Thermal Bridges of 32 Lightweight Detached Houses. 2005. Available online: https://www.researchgate.net/publication/266276074 (accessed on 30 April 2021).
  30. Lopes, G.C.; Vicente, R.; Azenha, M.; Ferreira, T.M. A systematic review of Prefabricated Enclosure Wall Panel Systems: Focus on technology driven for performance requirements. Sustain. Cities Soc. 2018, 40, 688–703. [Google Scholar] [CrossRef]
  31. Asiz, A.; Smith, I.; Menendez, V. Air leakage and moisture deposition of prefabricated light-frame wood building. In Proceedings of the 10th World Conference on Timber Engineering, Miyazak, Japan, 2–5 June 2008. [Google Scholar]
  32. Scott, L. Developments in Closed Panel Timber Frame Connection. 2013. Available online: https://www.researchgate.net/publication/283497196 (accessed on 10 November 2021).
  33. Orlowski, K.; Shanaka, K.; Mendis, P. Manufacturing, modeling, implementation and evaluation of a weatherproof seal for prefabricated construction. Buildings 2018, 8, 120. [Google Scholar] [CrossRef] [Green Version]
  34. Orlowski, K.; Shanaka, K.; Mendis, P. Design and Development of weatherproof seals for prefabricated construction: A methodological approach. Buildings 2018, 8, 117. [Google Scholar] [CrossRef] [Green Version]
  35. Relander, T.O.; Bauwens, G.; Roels, S.; Thue, J.V.; Uvsløkk, S. The influence of structural floors on the airtightness of wood-frame houses. Energy Build. 2011, 43, 639–652. [Google Scholar] [CrossRef]
  36. Burrows, John, and Canada Mortgage and Housing Corporation. Canadian Wood-Frame House Construction; Canada Mortgage and Housing Corporation: Ottawa, ON, Canada, 2013; Volume 3. [Google Scholar]
  37. Ullman, D.G. The Mechanical Design Process, 6th ed.; Oregon State University: Independence, OR, USA, 2018. [Google Scholar]
  38. Pahl, G.; Beitz, W.; Feldhusen, J.; Grote, K.-H. Engineering Design: A systematic Approach, 3rd ed.; Springer: Berlin/Heidelberg, Germany, 2007. [Google Scholar]
  39. Karacabeyli, E.; Gagnon, S. Canadian CLT Handbook, 2019 Edition: Volume I, Volume II; National Library of Canada: Ottawa, ON, Canada, 2020. [Google Scholar]
  40. National Research Council Canada and Régie du Bâtiment du Québec. Code de Construction du Québec: Chapitre I: Bâtiment, et Code National du Bâtiment: Canada 2010 (Modifié); National Research Council Canada: Ottawa, ON, Canada, 2015.
  41. ASTM E2357—18; Standard test Method for Determining Air Leakage Rate of Air Barrier Assemblies. ASTM International: West Conshohocken, PA, USA, 2018; pp. 1–11. [CrossRef]
  42. ASTM E283/283M-19; Standard Test Method for Determining Rate of Air Leakage Through Exterior Windows, Skylights, Curtain Walls, and Doors Under Specified Pressure Differences Across the Specimen. ASTM International: West Conshohocken, PA, USA, 2019; pp. 1–7. [CrossRef]
  43. Kalamees, T.; Eskola, L.; Kurnitski, J.; Vinha, J.; Korpi, M. The distribution of the air leakage places and thermal bridges in Finnish detached houses and apartment buildings. ResearchGate. 2014. Available online: https://www.researchgate.net/publication/228674844 (accessed on 15 June 2022).
  44. Pinterić, M. Building Physics: From Physical Principles to International Standards; Springer International Publishing: New York, NY, USA, 2017. [Google Scholar]
  45. Lu, X.; Memari, A.M. Comparative study of Hot Box Test Method using laboratory evaluation of thermal properties of a given building envelope system type. Energy Build. 2018, 178, 130–139. [Google Scholar] [CrossRef]
  46. Rafidiarison, H.; Mougel, E.; Nicolas, A. Laboratory experiments on hygrothermal behaviour of real-scale timber walls. Maderas Cienc. Y Tecnol. 2012, 14, 389–401. [Google Scholar] [CrossRef] [Green Version]
  47. Ministère de l’Énergie et des Ressources naturelles du Québec. Novo-climat: Exigences Techniques: Maison et Petit Bâtiment Multilogement; Ministère de l’Énergie et des Ressources Naturelles duL: Québec City, QC, Canada, 2018; Revised. [Google Scholar]
  48. Jucienė, M.; Dobilaitė, V. Impact of climatic effects and various surfaces on the tack of adhesive tapes for building & construction. J. Build. Eng. 2021, 42, 102825. [Google Scholar] [CrossRef]
Figure 1. Junction of external walls with intermediate floor in a platform system prior to sealing (a) and after (b).
Buildings 12 02185 g001
Figure 2. System developed using light wood frame structure.
Buildings 12 02185 g002
Figure 3. Materials tested in the first sequence: butyl-precompressed polyurethane foam (a), precompressed polyurethane foam (b), polyurethane foam (c), and EPDM tubes (d).
Buildings 12 02185 g003
Figure 4. Tested structures: All composed of a 140 mm insulated wall cavity, 11 mm OSB panel, 25.4 mm rigid insulation panel, a polyethylene vapor barrier membrane, and a non-woven olefin weather barrier membrane.
Buildings 12 02185 g004
Figure 5. Test gauge (a) applied against an experimental wall for an airtightness assessment (b).
Buildings 12 02185 g005
Figure 6. Example of flow rate equation, Equation (1), established through fitting of data.
Buildings 12 02185 g006
Figure 7. Airflow versus pressure data for materials and structures tested in laboratory.
Buildings 12 02185 g007
Figure 8. Thermographic analysis of the new concept 1 system at 0 Pa (a) and 50 Pa (b).
Buildings 12 02185 g008
Figure 9. Thermographic analysis of the conventional wall at 0 Pa (a) and 50 Pa (b).
Buildings 12 02185 g009
Figure 10. Thermographic analysis of House B and its conventional sealing method at 0 Pa (a) and 50 Pa (b)—photo taken inside house B of a junction of external walls with intermediate floor.
Buildings 12 02185 g010
Figure 11. Thermographic analysis of House A and its new concept 2 sealing method at 0 Pa (a) and 50 Pa (b)—photo taken inside house A in the staircase showing the junction between two exterior walls with windows (top and bottom of the photo).
Buildings 12 02185 g011
Figure 12. Thermographic analysis of House A and its new concept 2 sealing method at 0 Pa (a) and 50 Pa (b)—photo taken inside house A of a junction of external walls with intermediate floor.
Buildings 12 02185 g012
Figure 13. Larger air leakage observed from House A (a) and House B (b).
Buildings 12 02185 g013
Figure 14. Air channels found within sheathing tape installed on a non-rigid surface (a) and the strong adhesion of butyl on polyethylene membranes (b).
Buildings 12 02185 g014
Figure 15. Composition of the prefabricated walls of House A during lifting (a) and House B (b).
Buildings 12 02185 g015
Figure 16. Schedule for a single-family residential project as proposed and sourced by: Canada Mortgage and Housing Corporation (CMHC) [36].
Buildings 12 02185 g016
Figure 17. Projection of a schedule for a fully prefabricated house like House A.
Buildings 12 02185 g017
Table 1. Performed test sequences in the laboratory.
1st Sequence (Airtightness Tests Only)2nd Sequence (Airtightness and Thermal Bridges Tests)
MaterialsSystems
Butyl—Precompressed polyurethane foamNew concept 1
Precompressed polyurethane foamSheathing tape—Conventional solution
Polyurethane foam
EPDM tubes
Table 2. Length of the walls for houses A and B.
Wall Length (m)
House12345678Total
A: FPWWs 12.59.611.14.31.45.3N/AN/A44.2
B: Open structural prefabricated light wood walls 3.77.34.36.14.986.76.147.1
Table 3. Air leakage rate in horizontal junction between 2 walls tested in laboratory.
Air Leakage Rate, L/(min·m)
Tested Materials25 Pa50 Pa75 Pa100 Pa150 Pa250 Pa300 Pacn
Polyethylene membrane1.9±3%3.1±2%4.0±2%5.1±1%6.9±1%10.2±1%11.8±1%0.170.74
Butyl-precompressed polyurethane1.6±3%3.0±2%4.2±1%5.4±1%7.7±1%11.7±1%13.5±1%0.110.85
Precompressed polyurethane5.2±1%8.5±1%11.4±1%14.0±1%18.8±1%27.3±1%31.1±1%0.500.72
Polyurethane5.1±1%9.3±1%13.0±1%16.5±1%23.4±1%36.1±1%42.1±1%0.340.85
EPDM8.8±1%13.3±1%16.9±1%19.9±1%25.0±1%33.5±1%37.4±1%1.380.58
Tested systems
New concept 12.9±2%4.2±1%5.4±1%6.3±1%8.1±1%11.6±1%13.2±1%0.390.61
Sheathing tape—Conventional4.5±1%7.3±1%9.7±1%11.7±1%15.3±1%21.3±1%24.0±1%0.530.67
Canadian regulations—CAN/ULC-S74--31.3------
Table 4. Air leakage rate by fan pressurization through House A and House B.
HouseMonths after ConstructionAir Change Rate at 50 Pa (ACH50)
m3/(h·m3)
House A; new concept 20 (July 21)0.44 ± 1.3% 1
Internal volume: 1236.4 m3; max indoor/outdoor air temperature differential: 10 °C; building height: 13 m3 (October 21)0.46 ± 1.8% 1
9 (April 22)0.38 ± 5.9%
House B; conventional solution3 (April 22)0.79 ± 4.6%
Internal volume: 568.9 m3; max indoor/outdoor air temperature differential: 9.5 °C; building height: 8.5 m
1 The first airtightness tests performed on House A were depressurization tests only.
Table 5. Building airtightness targets in Codes and Standards across Canada [22,23,47].
StandardsBuilding Airtightness (ACH50)
Novo-climat 2.01.5
Net Zero Energy1.0
Passive House0.6
NECCB 2017No mandatory values for whole building
Table 6. Speed of assembly of 8 prefabricated walls for one story of House A and House B.
Walls 12345678Total
House A: FPWWs assembled by 5 workersTime (min)222226161419N/AN/A119
Wall length (m)12.59.611.14.31.45.3N/AN/A44.2
House B: Open prefabricated light-wood walls assembled by 3 workersTime (min)56735912747
Wall length (m)3.77.34.36.14.986.76.141
Table 7. Productivity rate for the assembly of House A and House B.
Productivity Measure (m/min·Worker)
House AHouse B
0.0740.291
Publisher’s Note: MDPI stays neutral with regard to jurisdictional claims in published maps and institutional affiliations.