Article

Degradation Behavior of the Preload Force of High-Strength Bolts after Corrosion

1
Department of Civil Engineering, Anhui University of Technology, Ma’anshan 243032, China
2
Department of Civil and Environmental Engineering, Sejong University, Seoul 143747, Republic of Korea
3
Faculty of Civil Engineering, Vietnam Maritime University, Hai Phong 180000, Vietnam
*
Authors to whom correspondence should be addressed.
Buildings 2022, 12(12), 2122; https://doi.org/10.3390/buildings12122122
Submission received: 31 October 2022 / Revised: 23 November 2022 / Accepted: 28 November 2022 / Published: 2 December 2022
(This article belongs to the Special Issue High Performance Steel Structures)

Abstract

:
Corrosion significantly affects the structural behavior of members in a connection (i.e., the thickness of steel plates, the preload force of bolts, and the friction factor of steel plates). Safety assessment of corroded steel frames (i.e., beam-to-column connection, beams, or columns) has been a major concern in engineering. In this work, an experiment of accelerated corrosion testing is carried out to obtain corroded specimens connected with high-strength bolts, and the preload force of high-strength bolts (PF-HSB) is monitored throughout the whole stage of the corrosion testing. Before the corrosion testing, the PF-HSB caused by the stress relaxation is also recorded. The PF-HSB decreases rapidly in the first five hours after the final screwing of bolts and it keeps stable after 100 h. The PF-HSB is seriously affected by corrosion, which decreases by 30.0% of the original preload force when the corrosion rate of steel plate reaches 3.5%. A finite element method for predicting the PF-HSB after corrosion is proposed. An estimation model for the PF-HSB considering the stress relaxation is established. A degradation model for predicting the PF-HSB after corrosion is also suggested, and is in good agreement with experimental data. The results of this research are of great significance for the safety assessment of in-service steel structures.

1. Introduction

Due to the advantages of high stiffness, good seismic resistance, and convenient assembly, high-strength bolted connections have been extensively utilized in steel structures [1,2]. Generally, high-strength bolted connections can be divided into friction-type connections and bearing-type connections. Friction-type connections include multiple bolts with the preload force and the relative sliding of steel plates is taken as the ultimate state of this type of connections [3]. As a result, the preload force is a very important parameter affecting the mechanical behavior of friction-type connections [4,5,6,7]. Details for the preload force of high-strength bolts (PF-HSB) are provided for guiding the construction of buildings in AISC 360-16 [8], Eurocode 3 [9], and GB 50017-2017 [10]. For example, the value for the preload force in GB 50017-2017 [10] is suggested as 0.61 fub where fub is the tensile strength of high-strength bolts and the value suggested in AISC 360-16 [8] and Eurocode 3 [9] is 0.70 fub.
In conventional design of a building, the PF-HSB is considered as constant in service. However, several factors (i.e., friction and creep deformation) can affect the stress relaxation of high-strength bolts, which is no negligible problem in engineering [11]. Previously, Shi et al. [12,13] experimentally investigated the variation law of the PF-HSB and they found that the PF-HSB gradually decreased with the increase in time after the final screwing of bolts. After 45 h of the final screwing of high-strength bolts, the preload force decreased slowly and it was stable after 100 h of the final screwing of high-strength bolts [12,13]. Cavallaro et al. [14], Zhang [15], and Hu [16] discussed the effects of multiple-pass tightening methods on the preload force. By introducing nodal spring elements, Li and Liu et al. [17] proposed a model for the preload force considering the stress relaxation based on Saint Venant’s principle. Wang et al. [18] analyzed the influence of twisting sequence and ways of surface clearance on the PF-HSB. Caccess et al. [19] investigated the influences of environment (i.e., temperature and humidity) on the PF-HSB and they proposed a model of the PF-HSB.
As described above, there are some investigations on the PF-HSB. However, these investigations only consider the PF-HSB without corrosion. In fact, corrosion is normal in engineering and it significantly influences the structural behavior of steel structures [20,21], even leads to serious engineering accidents, for example, the corrosion on the interior of the gondola leaded to the catastrophic failure of the ride in KMG Fireball in 2017. Therefore, it is necessary and important to monitor and assess in-service corroded steel structures. Connections, an important part in a steel frame, influence the structural behavior of a building. The assessment of an in-service corroded steel structure needs the estimation of the structural performance of corroded connections. As far as the author knows, only Zhang [22] carried out the experiment to research the performance of corroded friction-type connections by accelerated corrosion testing. However, the loss of the preload force is not considered in this study, which may not reflect the real situation of connections. Ahn et al. [23] simulated the sectional loss of nuts after corrosion by cutting parts of nuts and analyzed the loss of PF-HSB. The PF-HSB decreases by 50% when the volume loss ratio of bolts head reaches 12%. From Wang et al.’s experiment [24], the PF-HSB is mainly dependent on the corrosion rate of specimens, and the value for the PF-HSB is 50% of the original value of the preload force when the corrosion rate reaches 20%. Jiang et al. [25] found the loss of PF-HSB reached 41.2% when the weight loss ratio is 10%.
Though a big step forward has been made regarding the PF-HSB in corroded connections, the experimental data on the PF-HSB after corrosion are limited. To evaluate the mechanical behavior of in-service friction-type connections, the accurate estimation for the PF-HSB in corroded connections is important, which is the objective of this paper. The experiment of accelerated corrosion testing is performed, and the PF-HSB is monitored in the whole stage of the corrosion testing. A finite element method validated by experimental results is developed to predict the PF-HSB after corrosion using Abaqus. Empirical models for estimating the PF-HSB considering the effects of stress relaxation and corrosion are proposed, and the models make good agreement with experimental data.

2. Experimental Program

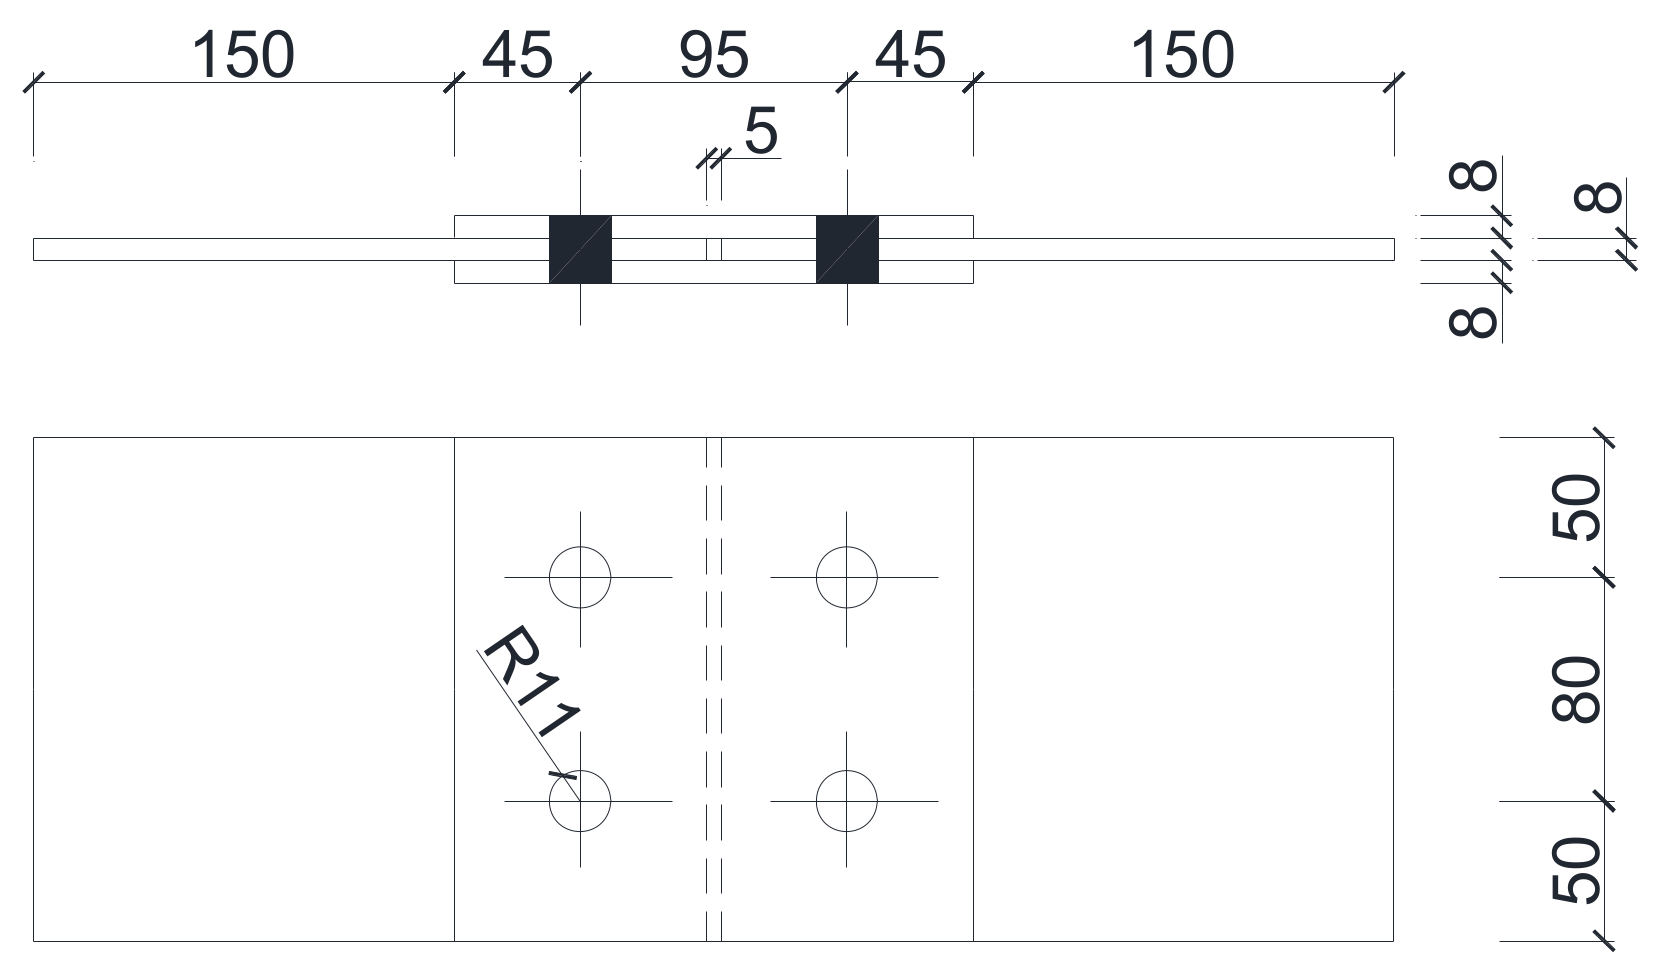
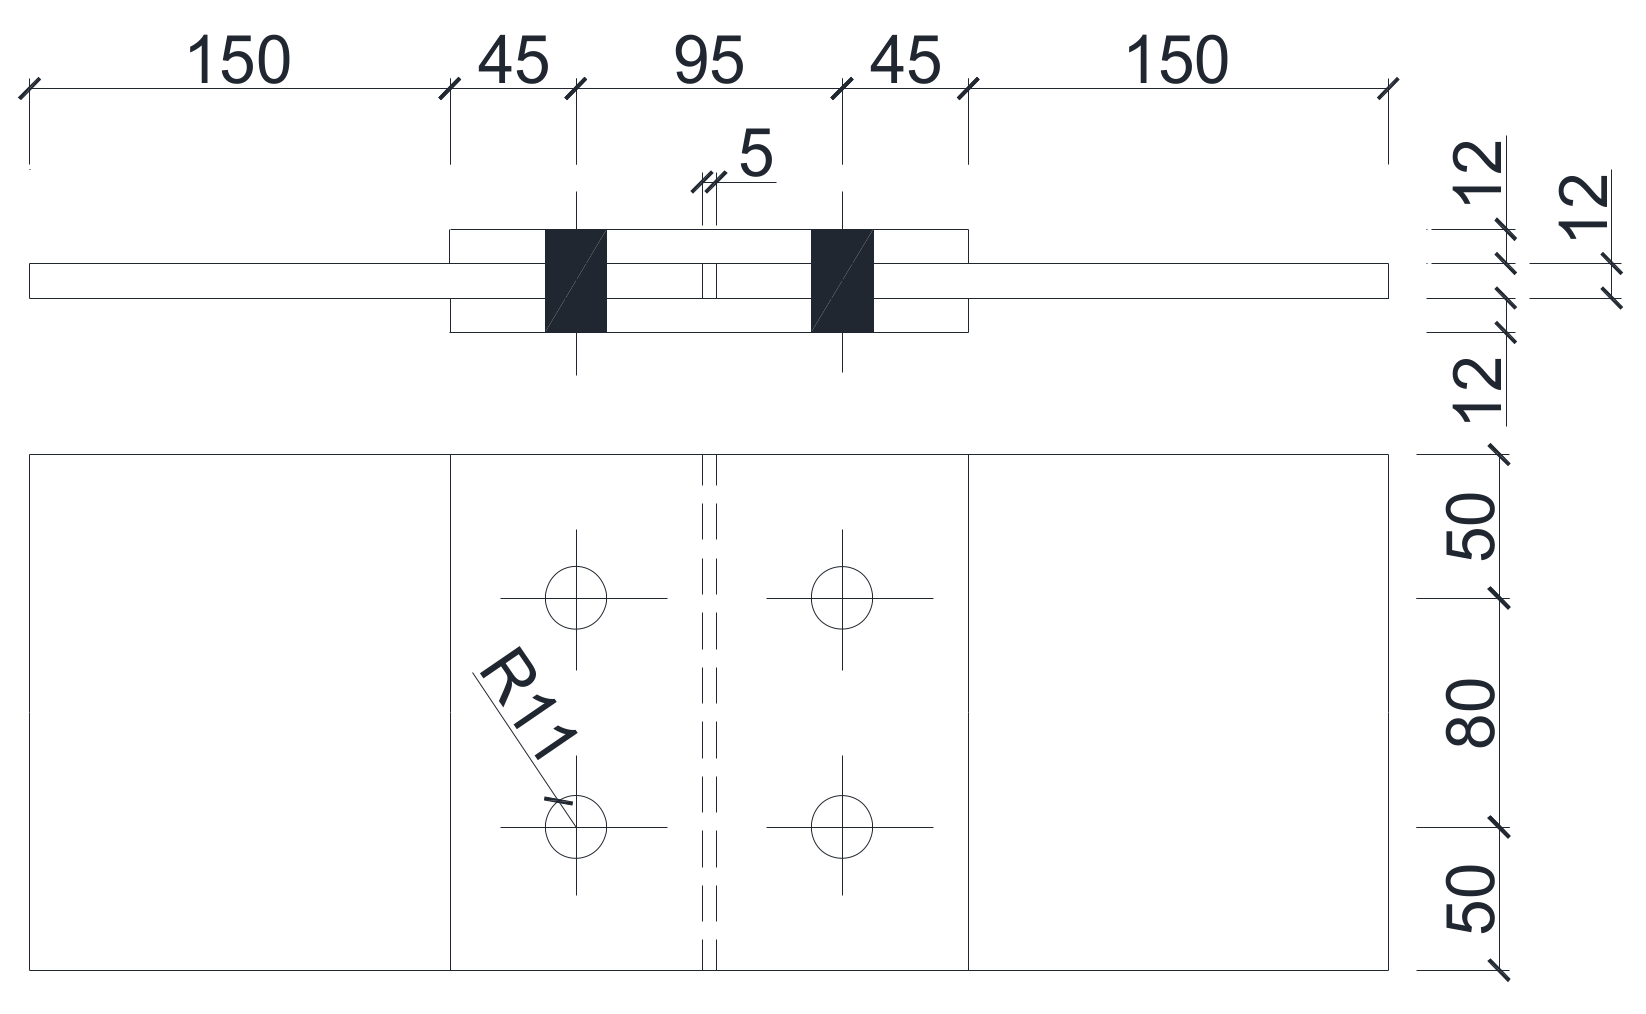
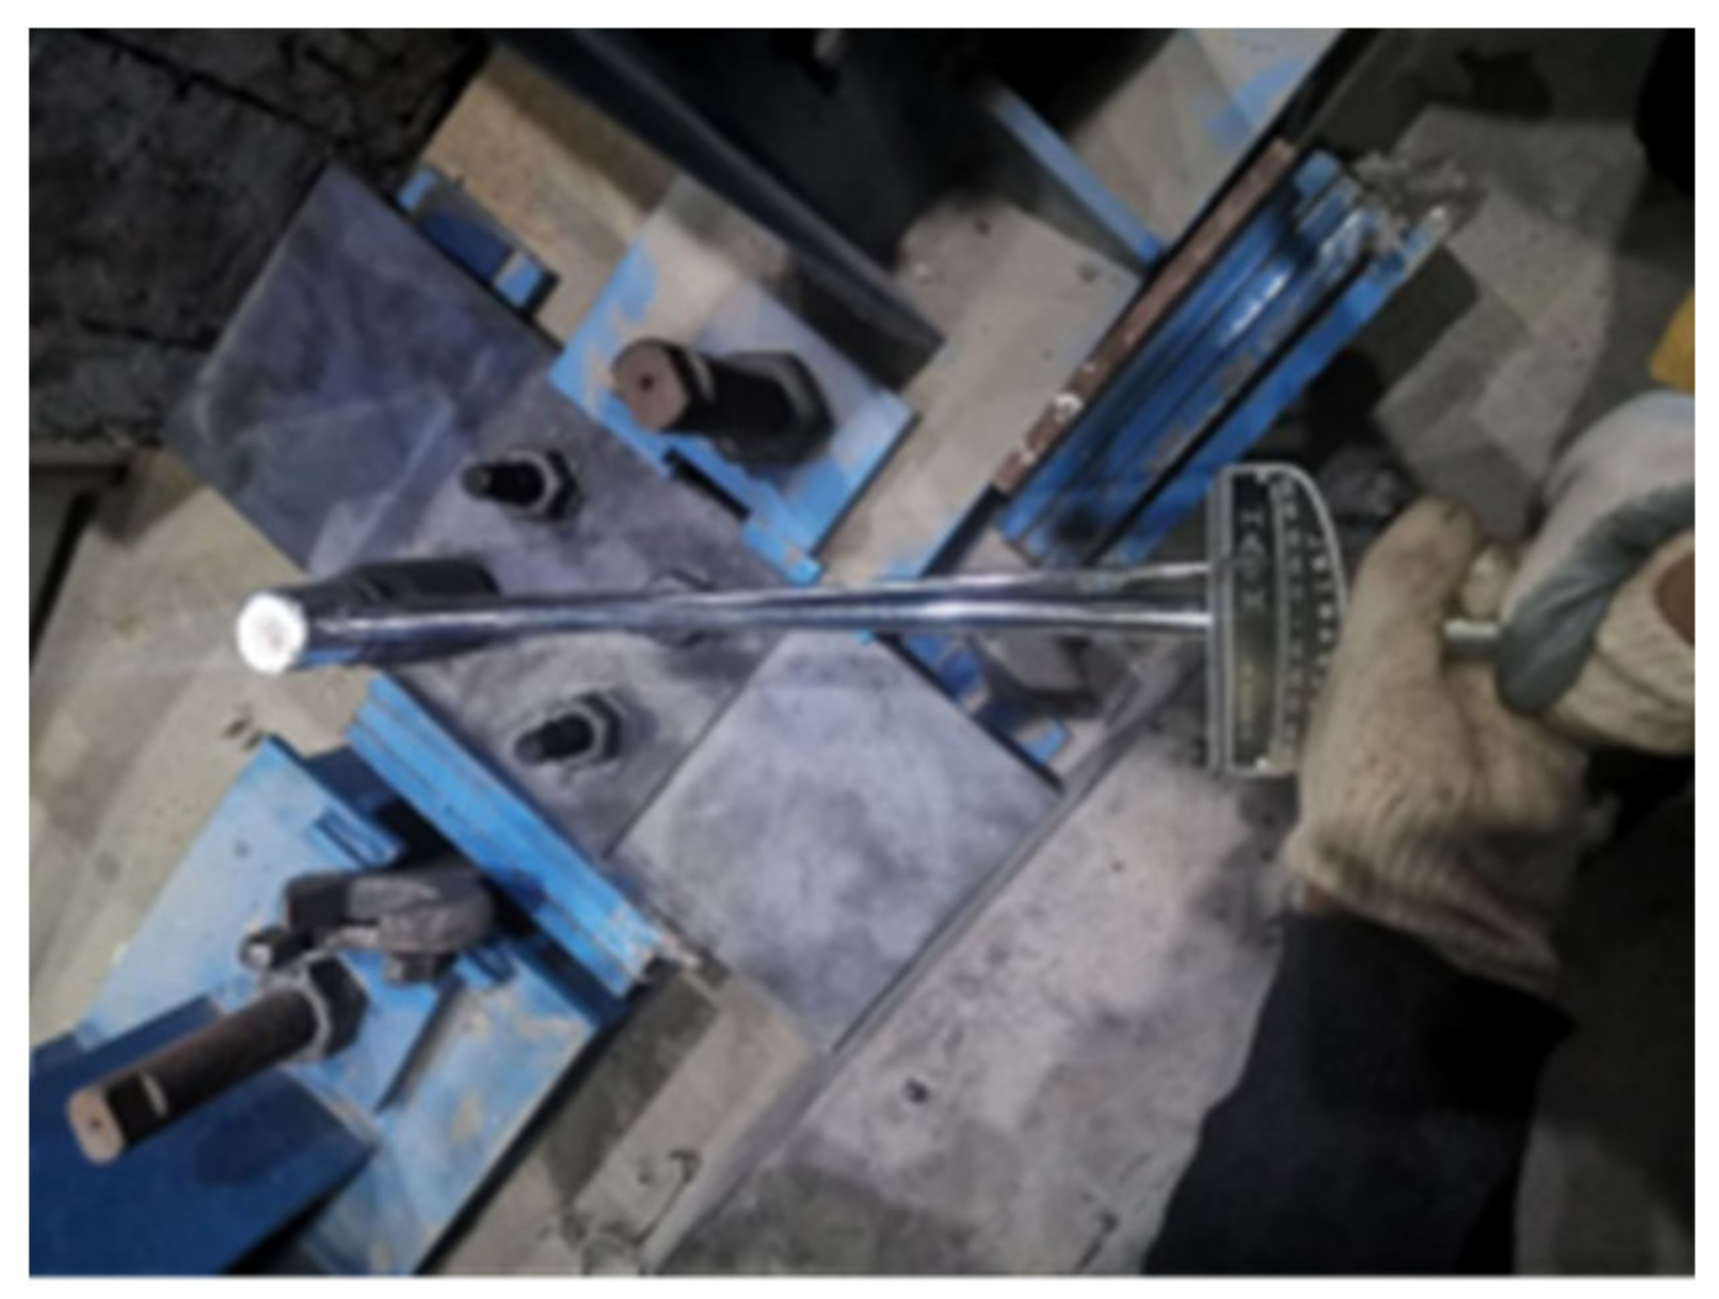
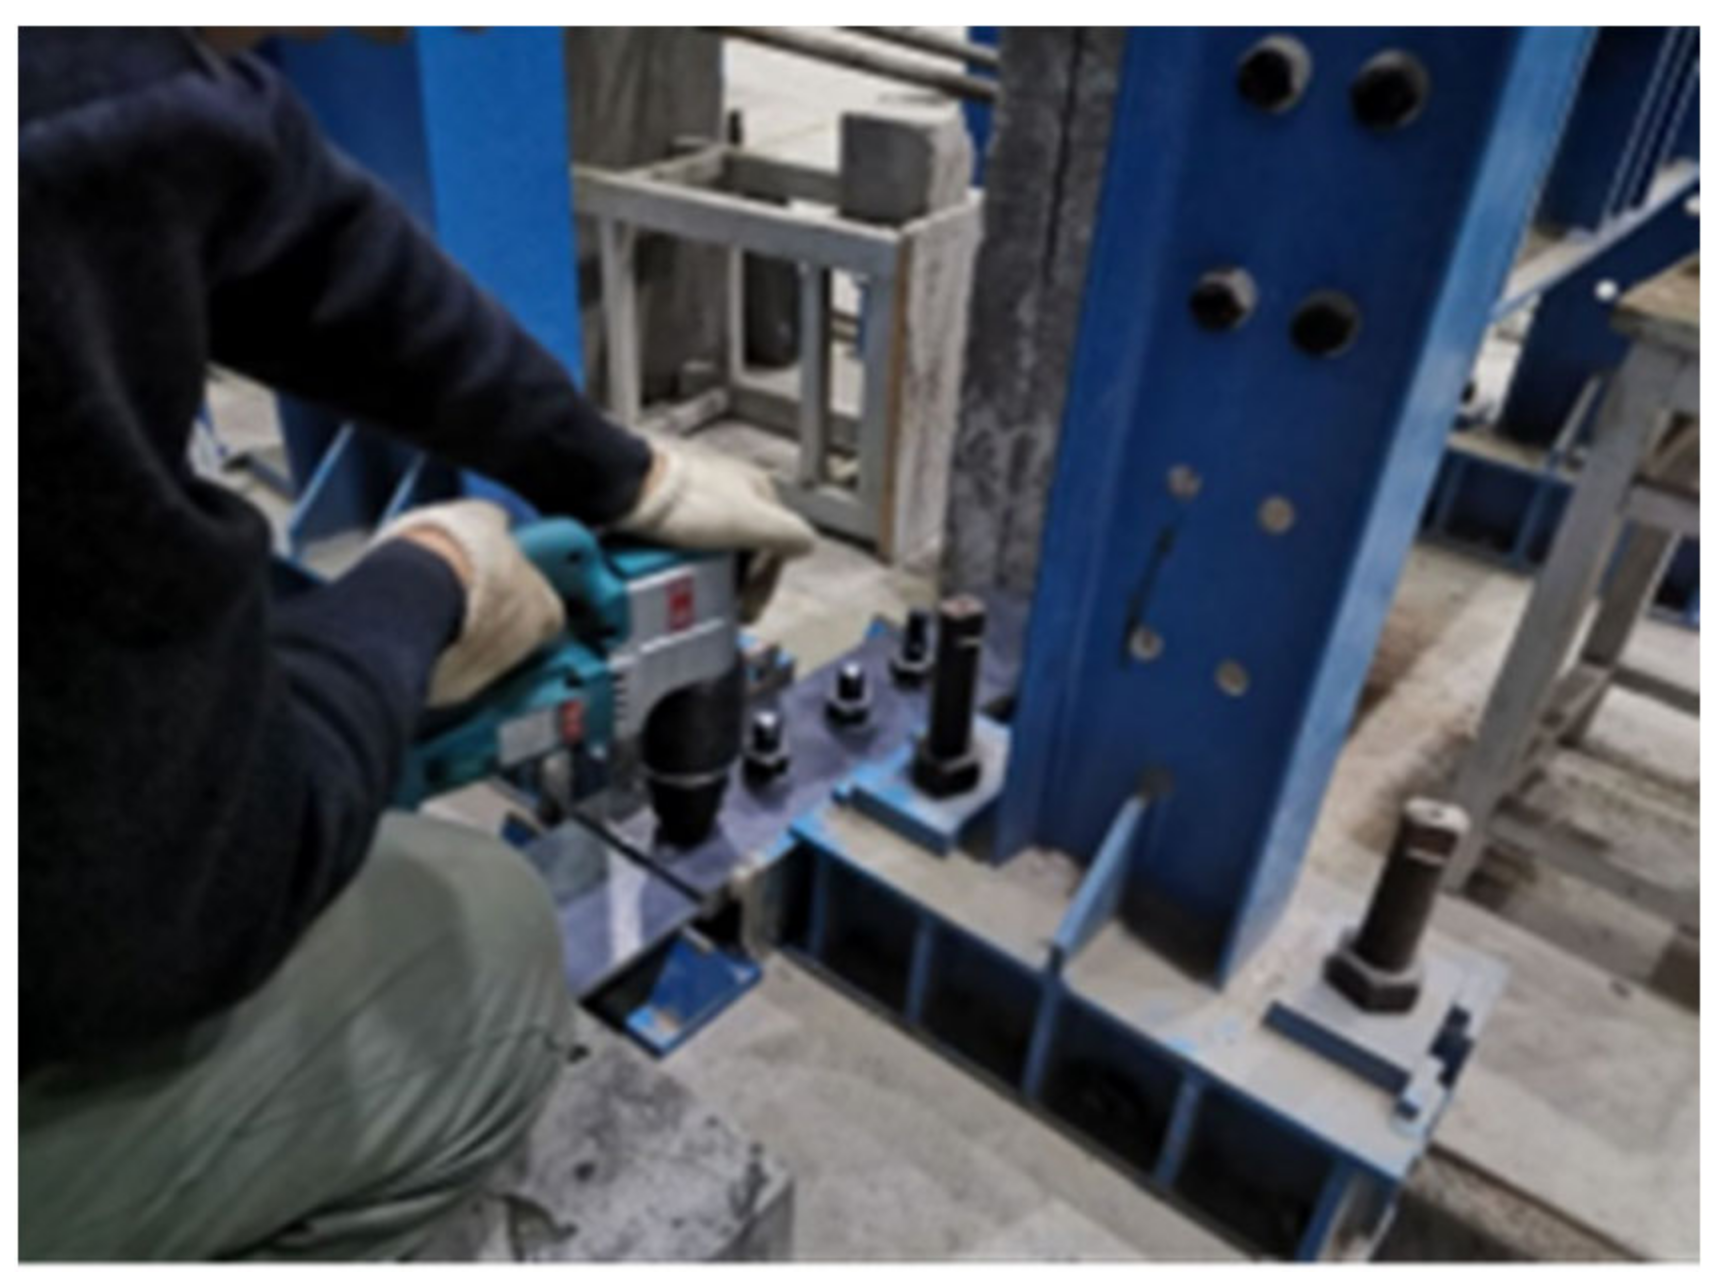
2.1. Assembly of High-Strength Bolted Connections

According to GB50017-2017 [10] and JGJ82-2011 [26], two different types of high-strength bolted connections (TX Series and TY Series) with double friction surfaces were considered, as shown in Figure 1 and Figure 2. The bolts with diameter of 20 mm was used, and the diameter of bolt holes was 22 mm. Torsional shear high-strength bolts with Grade 10.9, normally utilized in engineering, were adopted. In TX Series (Figure 1), all steel plates including two cover plates and two inner plates were fabricated from Q235 with 8 mm thickness. The length and width of the cover plate were 185 × 180 mm, and the inner plate was 240 × 180 mm. In TY Series (Figure 2), Q345 steel with 12 mm thickness was utilized for all steel plates. The width and length of steel plates and the diameter bolts were same with those in TX. All surfaces of these steel plates in TX Series and TY Series kept original status and phosphating was used to treat bolts. The yield strength and the ultimate strength of Grade 10.9 high-strength bolts were 940 MPa and 1040 MPa according to the coupon testing, respectively. The yield and ultimate strengths of Q235 were 288 MPa and 434 MPa, respectively, and the yield and ultimate strengths of Q345 were 389 MPa and 533 MPa, respectively.
For monitoring the strain variation of bolts, strain gauges were arranged in bolts. First, a 2 mm diameter circular hole was drilled at the center of the nut. Then, BTM strain gauges were embedded in the hole using epoxy resin, as shown in Figure 3a. Figure 3b shows high-strength bolts with embedded BTM strain gauges. After that, the calibration process was carried out to establish the relation between the preload force and the value of strain using a tensile testing machine, as depicted in Figure 4, and Table 1 lists the values of calibration coefficient for each bolt. Finally, the preload force was applied and high-strength bolted connections were assembled. According to JGJ82-2011 [26], the preload force of 50% of the design value (155 kN) of high-strength bolts was firstly applied using a pointer torque wrench (Figure 5). Then, an electric torque wrench (Figure 6) was utilized to apply the preload force and the screwing of the preload force was finished when the plum blossom-shaped head of the twist-off tension-control high-strength bolts fractured. After the assembly of connections, they were arranged in salt-spray chamber. In order to avoid the failure of wires connected to strain gauges in the corrosion testing, all wires were surrounded by the epoxy resin, as shown in Figure 7.

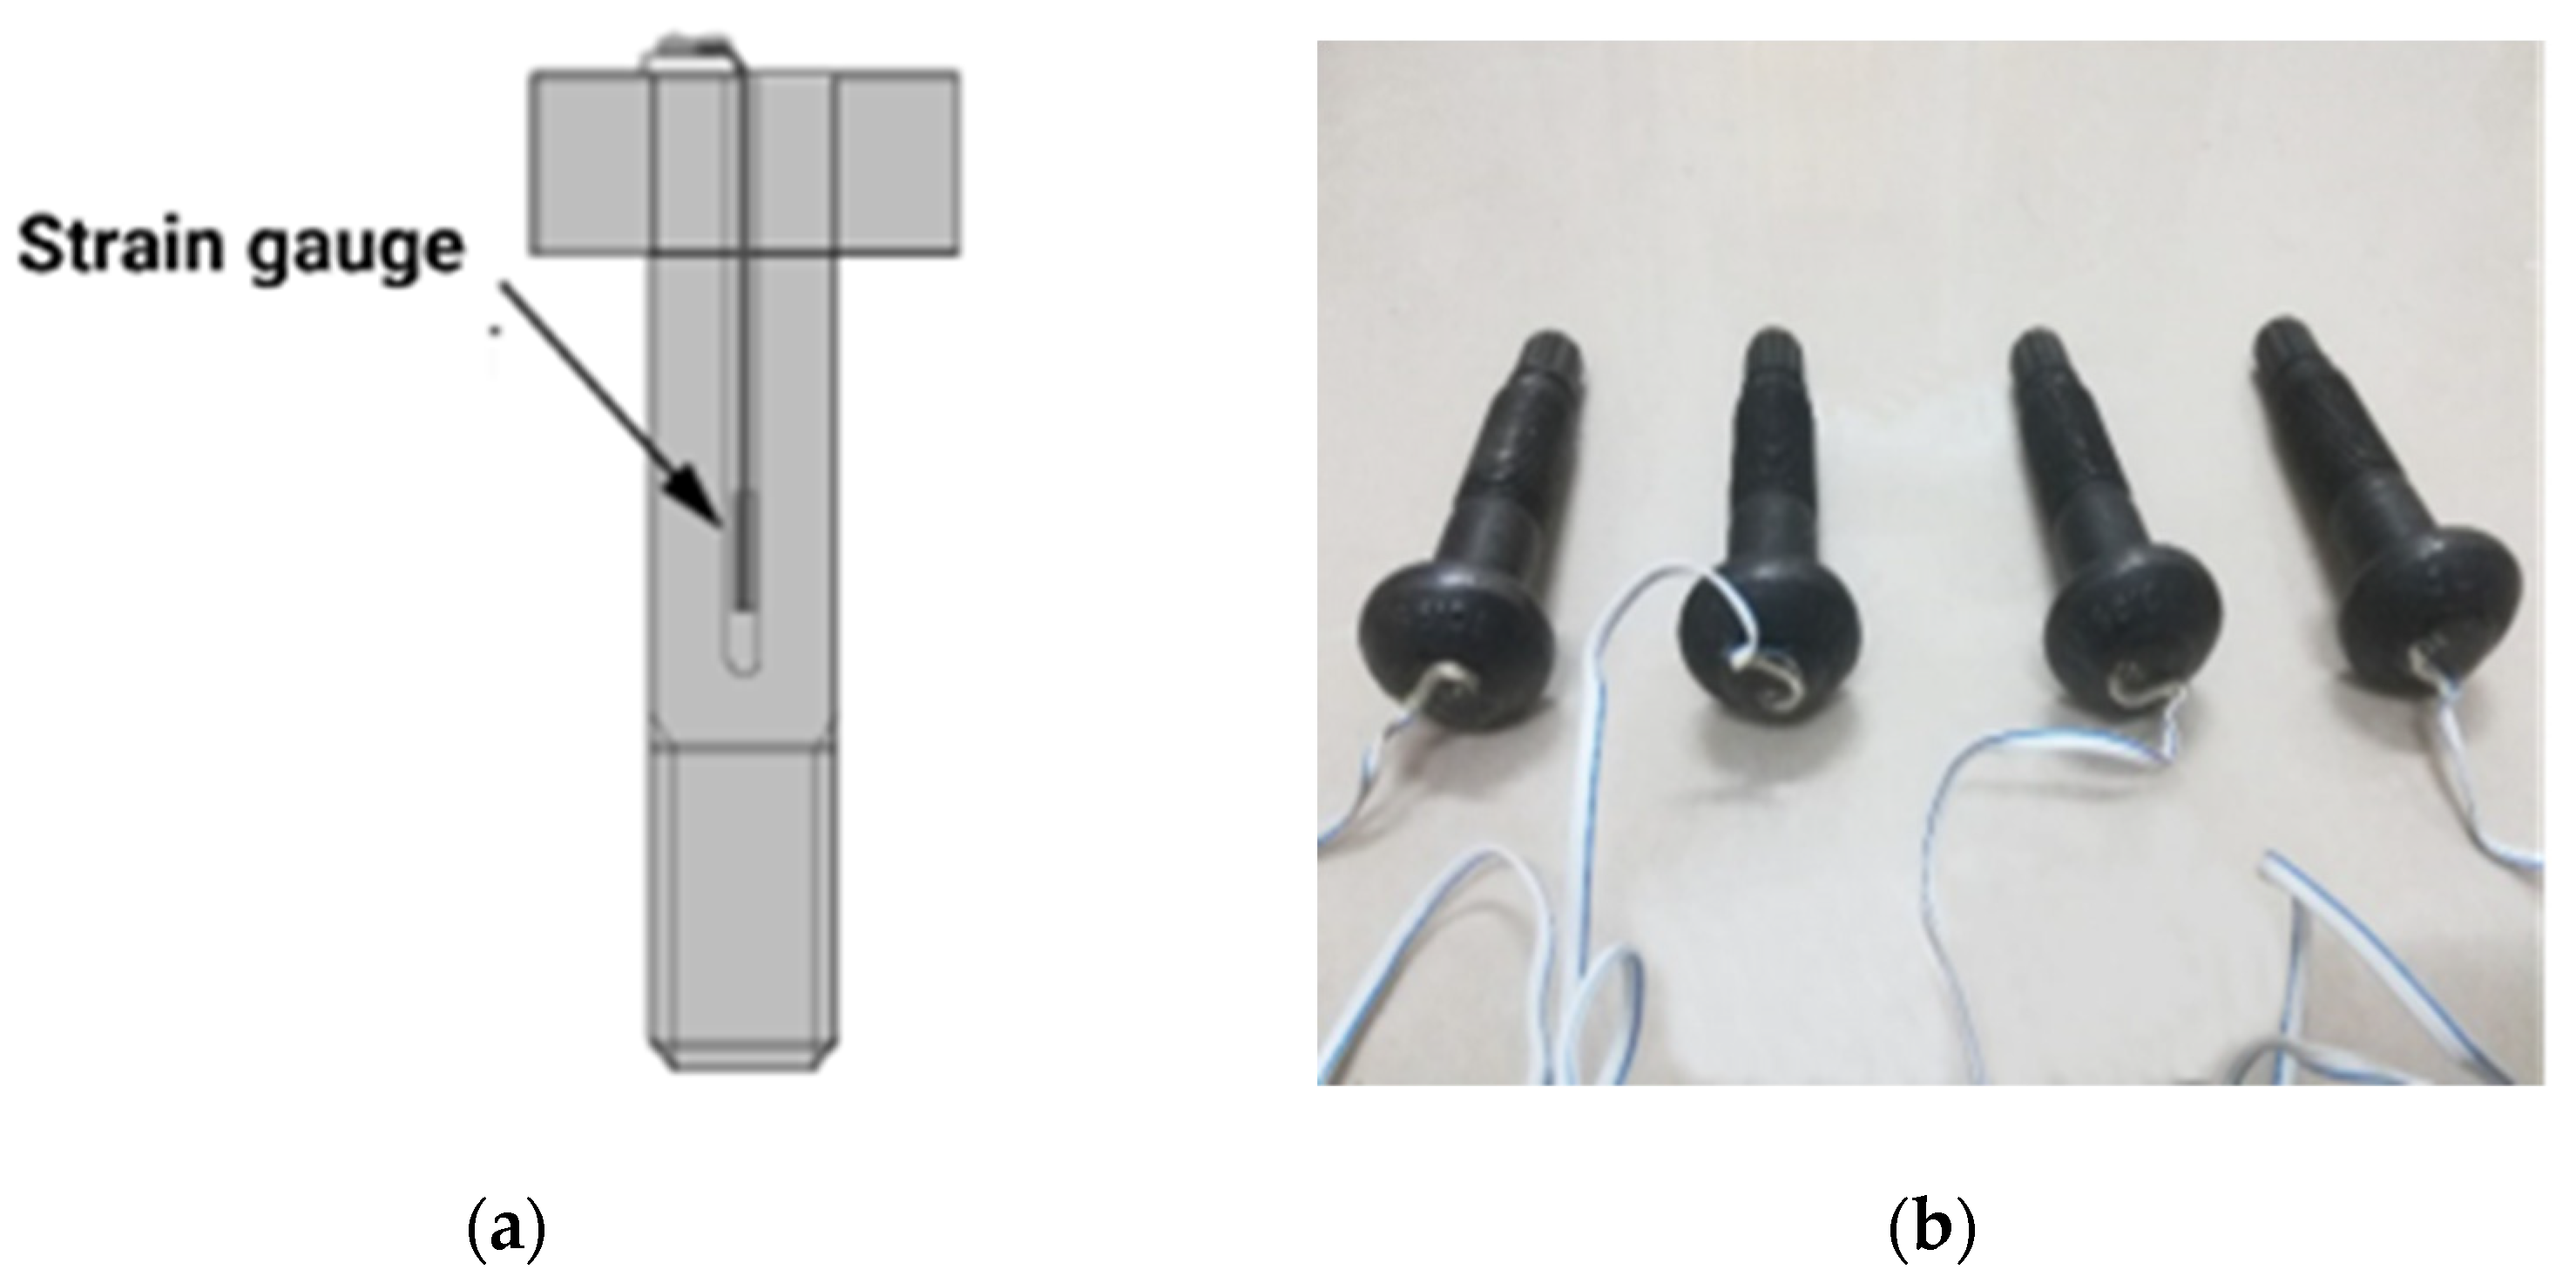
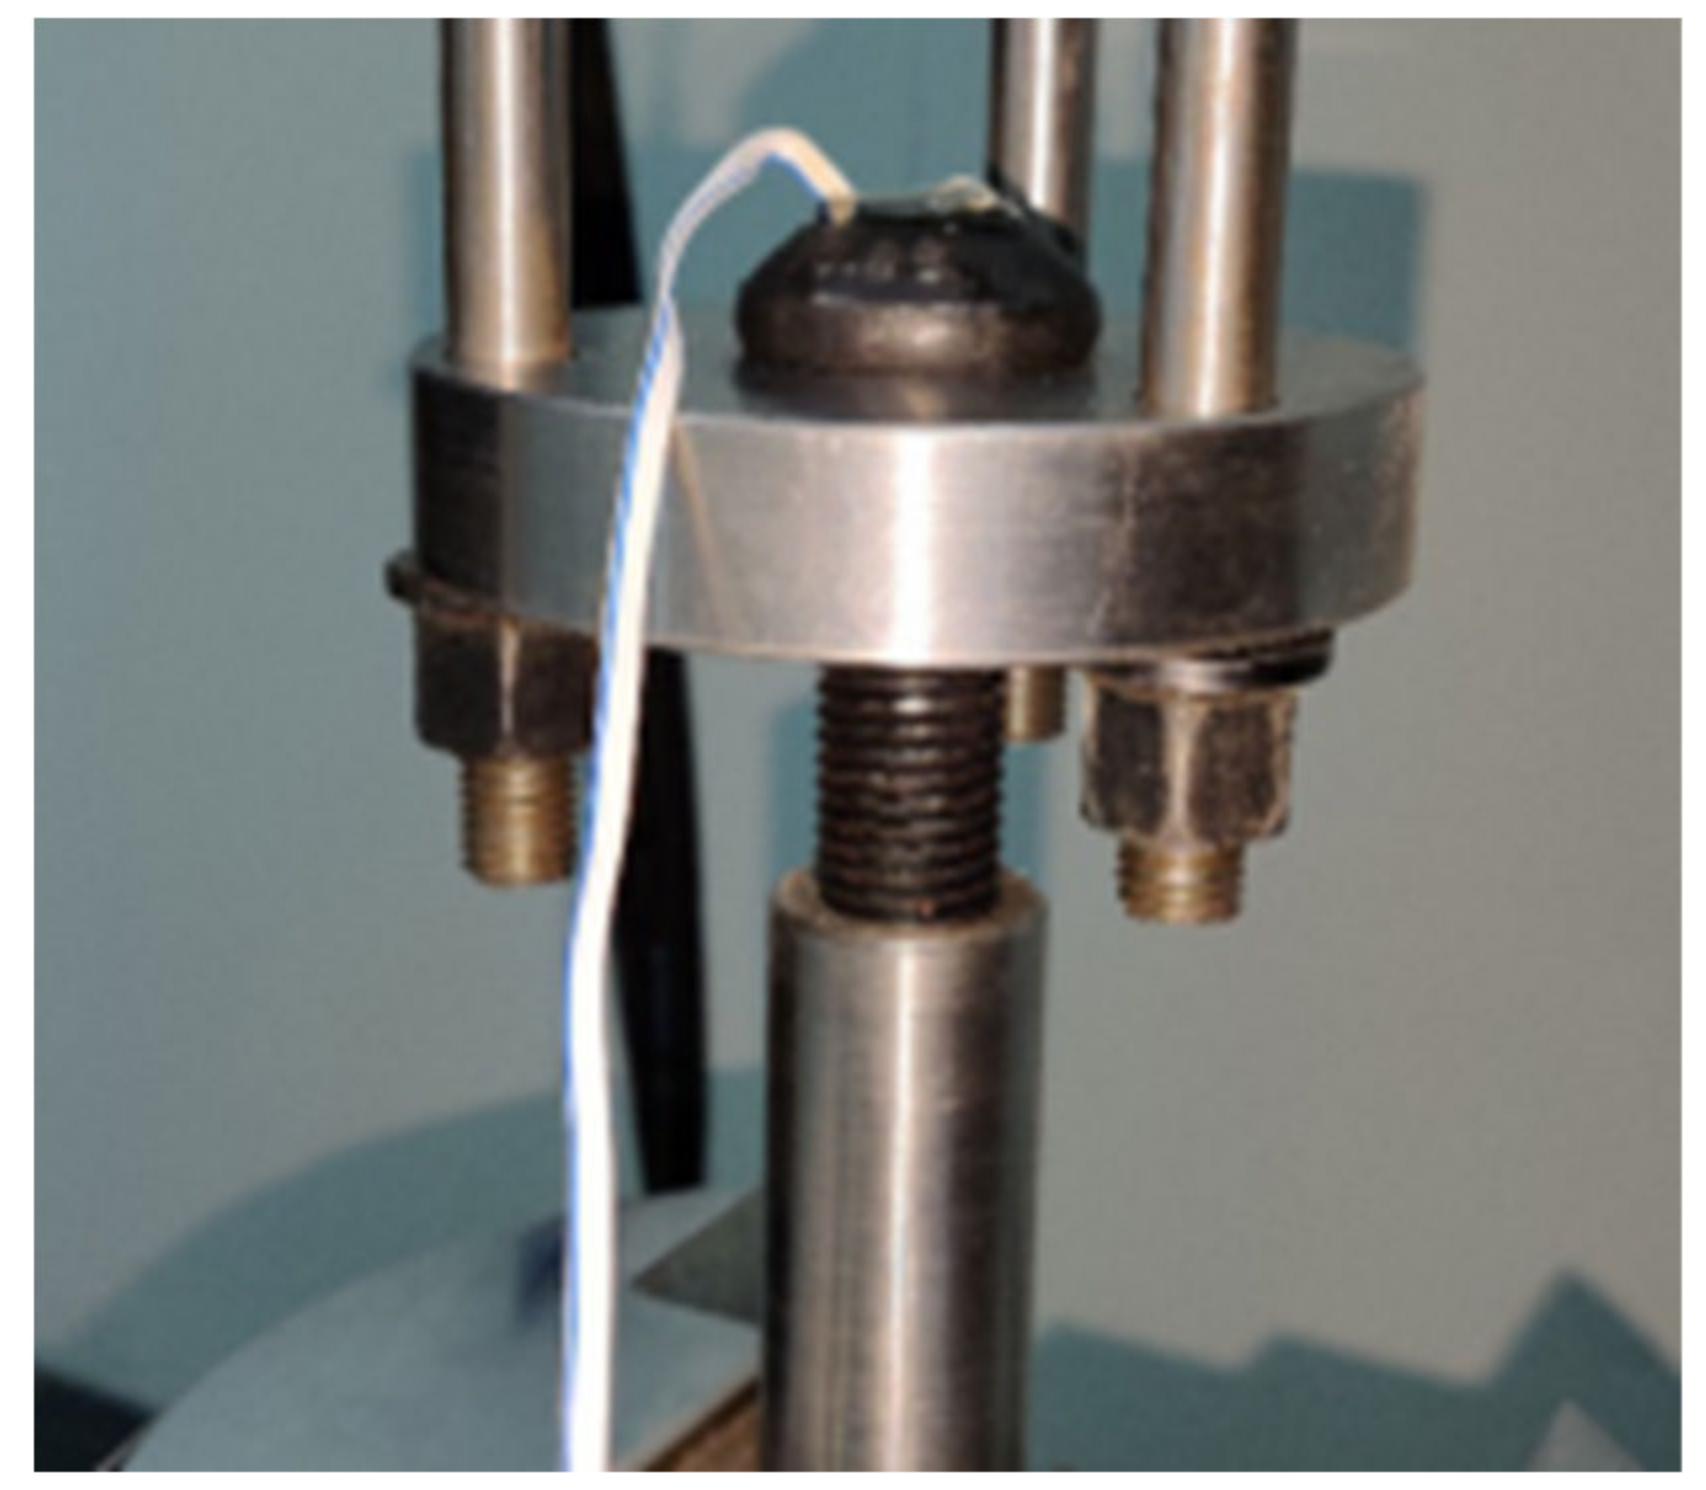
2.2. Monitoring of the Preload Force

To monitor the strain variation of the preload force, a DH3818Y static strain sensor before the screwing was connected to the wires, as shown in Figure 8. After stress relaxation of bolts was finished, which was exhibited by the stable status of the preload force, all connections were placed in the salt-spray chamber to perform the accelerated corrosion testing, as described in Section 2.3. Table 2 presents the details for the PF-HSB.

2.3. Accelerated Corrosion Testing

In this study, two types of specimens with different corrosion levels were obtained by accelerated corrosion testing. As the copper accelerated spray can simulate natural corrosion condition and it can obtain specimens with high corrosion rate in a short time, it was employed to investigate the PF-HSB in corroded connections in this work. According to GB/T 10125-2012 [27], 500 g NaCl was firstly added to each 9.5 L distilled water, and the salt solution with the concentration of 50 g/L ± 5 g/L was prepared. After stirring evenly, 2.47 g copper chloride (CuCl2·2H2O) was added to the salt solution. The concentration for the copper chloride was 0.26 g/L ± 0.02 g/L. Finally, pH value of the solution was adjusted by glacial acetic acid and it kept between 3.0 and 3.1. According to GB/T 10125-2012 [27], the pH value of the collected solution varies from 3.1 to 3.3. More details can be found in authors’ previous study [28]. Note that accelerated corrosion testing started after the PF-HSB had stabilized. Figure 9 shows specimens in the accelerated corrosion testing in the salt-spray chamber.

3. Experimental Results and Discussion

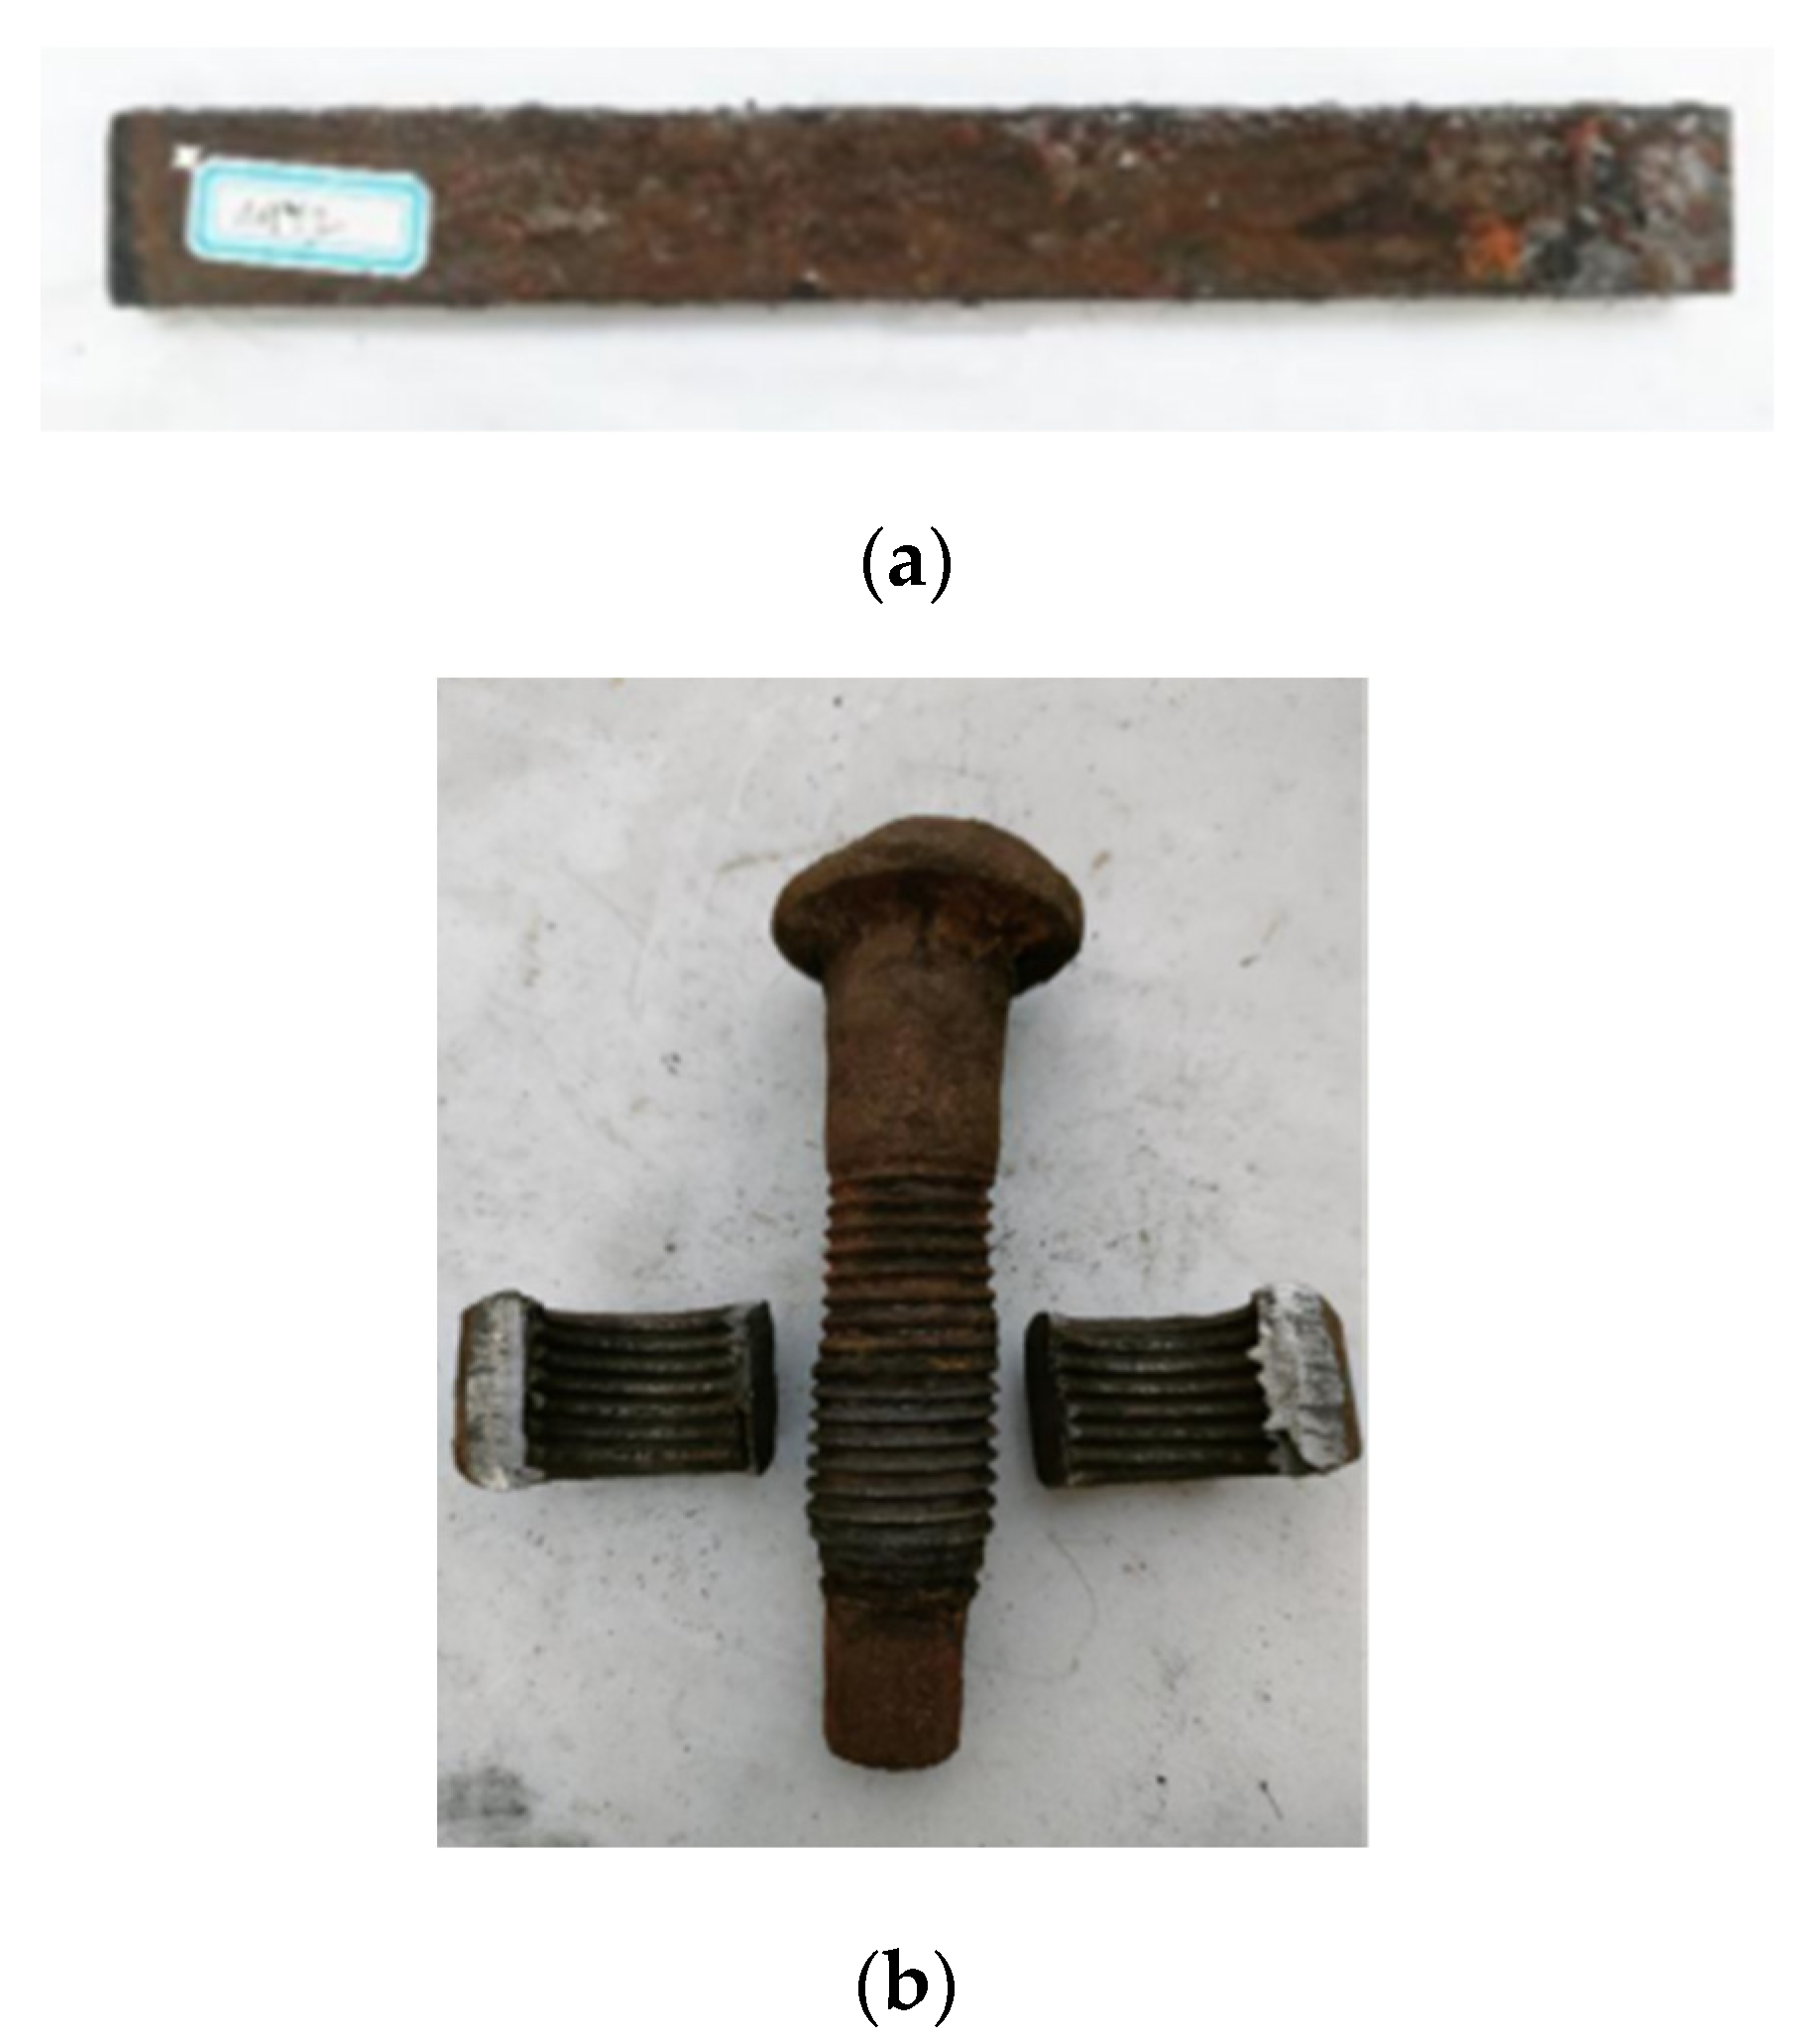
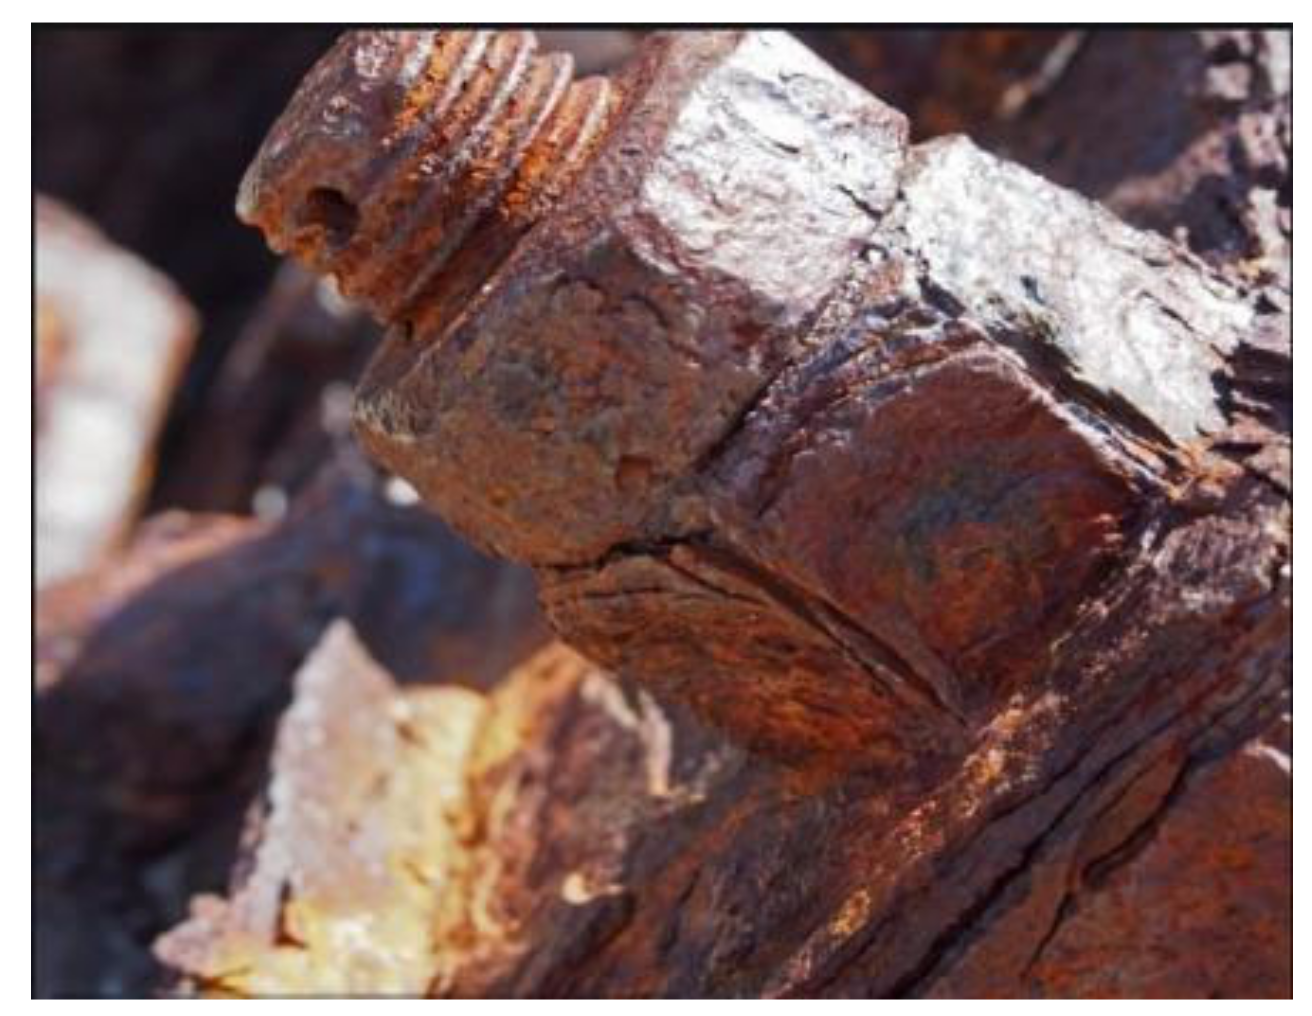
3.1. Corrosion Degree

The accelerated corrosion testing lasted six months, and a batch of specimens were taken out to get the corrosion rate every two months. The mass of the steel plates and bolts were measured and recorded prior to the accelerated corrosion testing. After being taken out, the yellow and black corrosion product on the surface of specimens was found, as depicted in Figure 10. The corrosion product on the surface of steel plates and bolts were then cleared using physical method, as shown in Figure 11. The mass of each sample was then measured and recorded again. Finally, the corrosion degree (the mass loss ratio) for each sample was established, as shown in Equation (1), and Table 3 and Table 4.
η = m 0 m m 0 × 100 %
where m0 is the primitive mass of samples; m is the mass of samples after clearing the rust; and η is the corrosion rate of samples. Corrosion rate for high-strength bolts and steel plates is shown in Table 3 and Table 4.
According to Xia et al.’s investigations [29], the average thickness loss of Q235 steel is 2.35 mm/a, which corresponds to the thickness loss of Q235 steel in 6.5 years in Beijing, China. In contrast, the average thickness loss of Q345 steel is 4.15 mm/a, which is 19 times of that in natural atmospheric corrosion environment of Beijing, China.

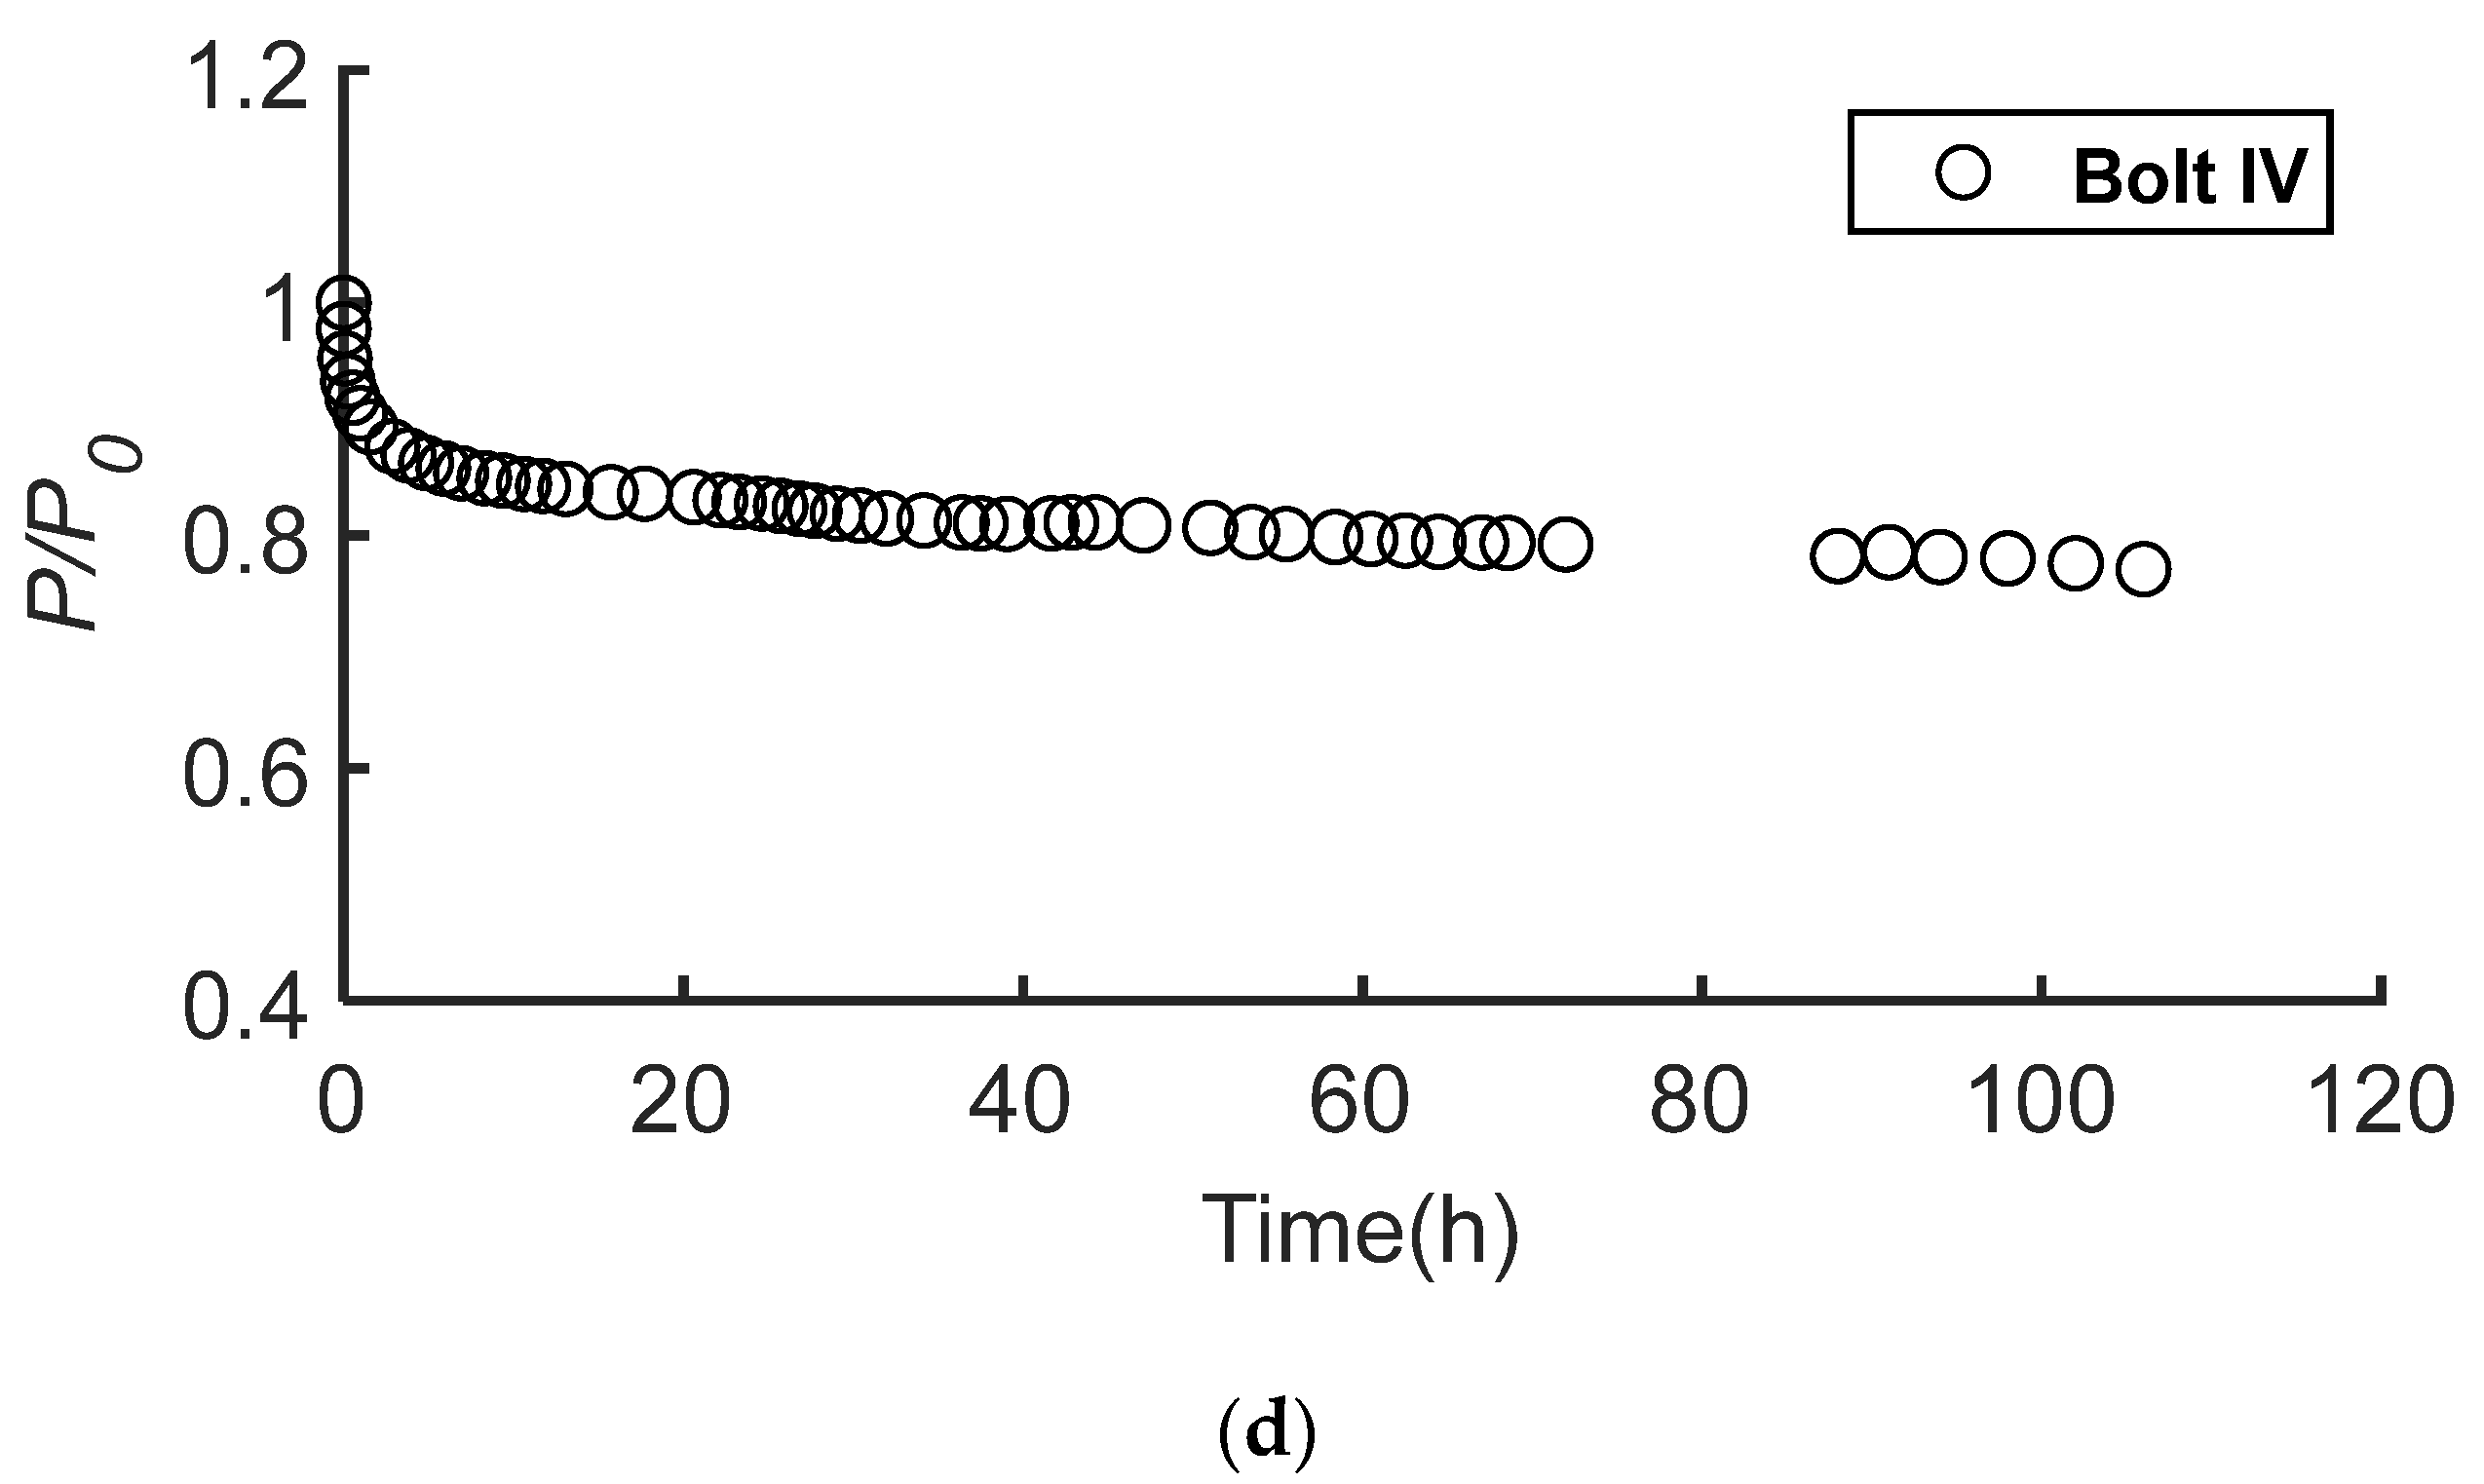
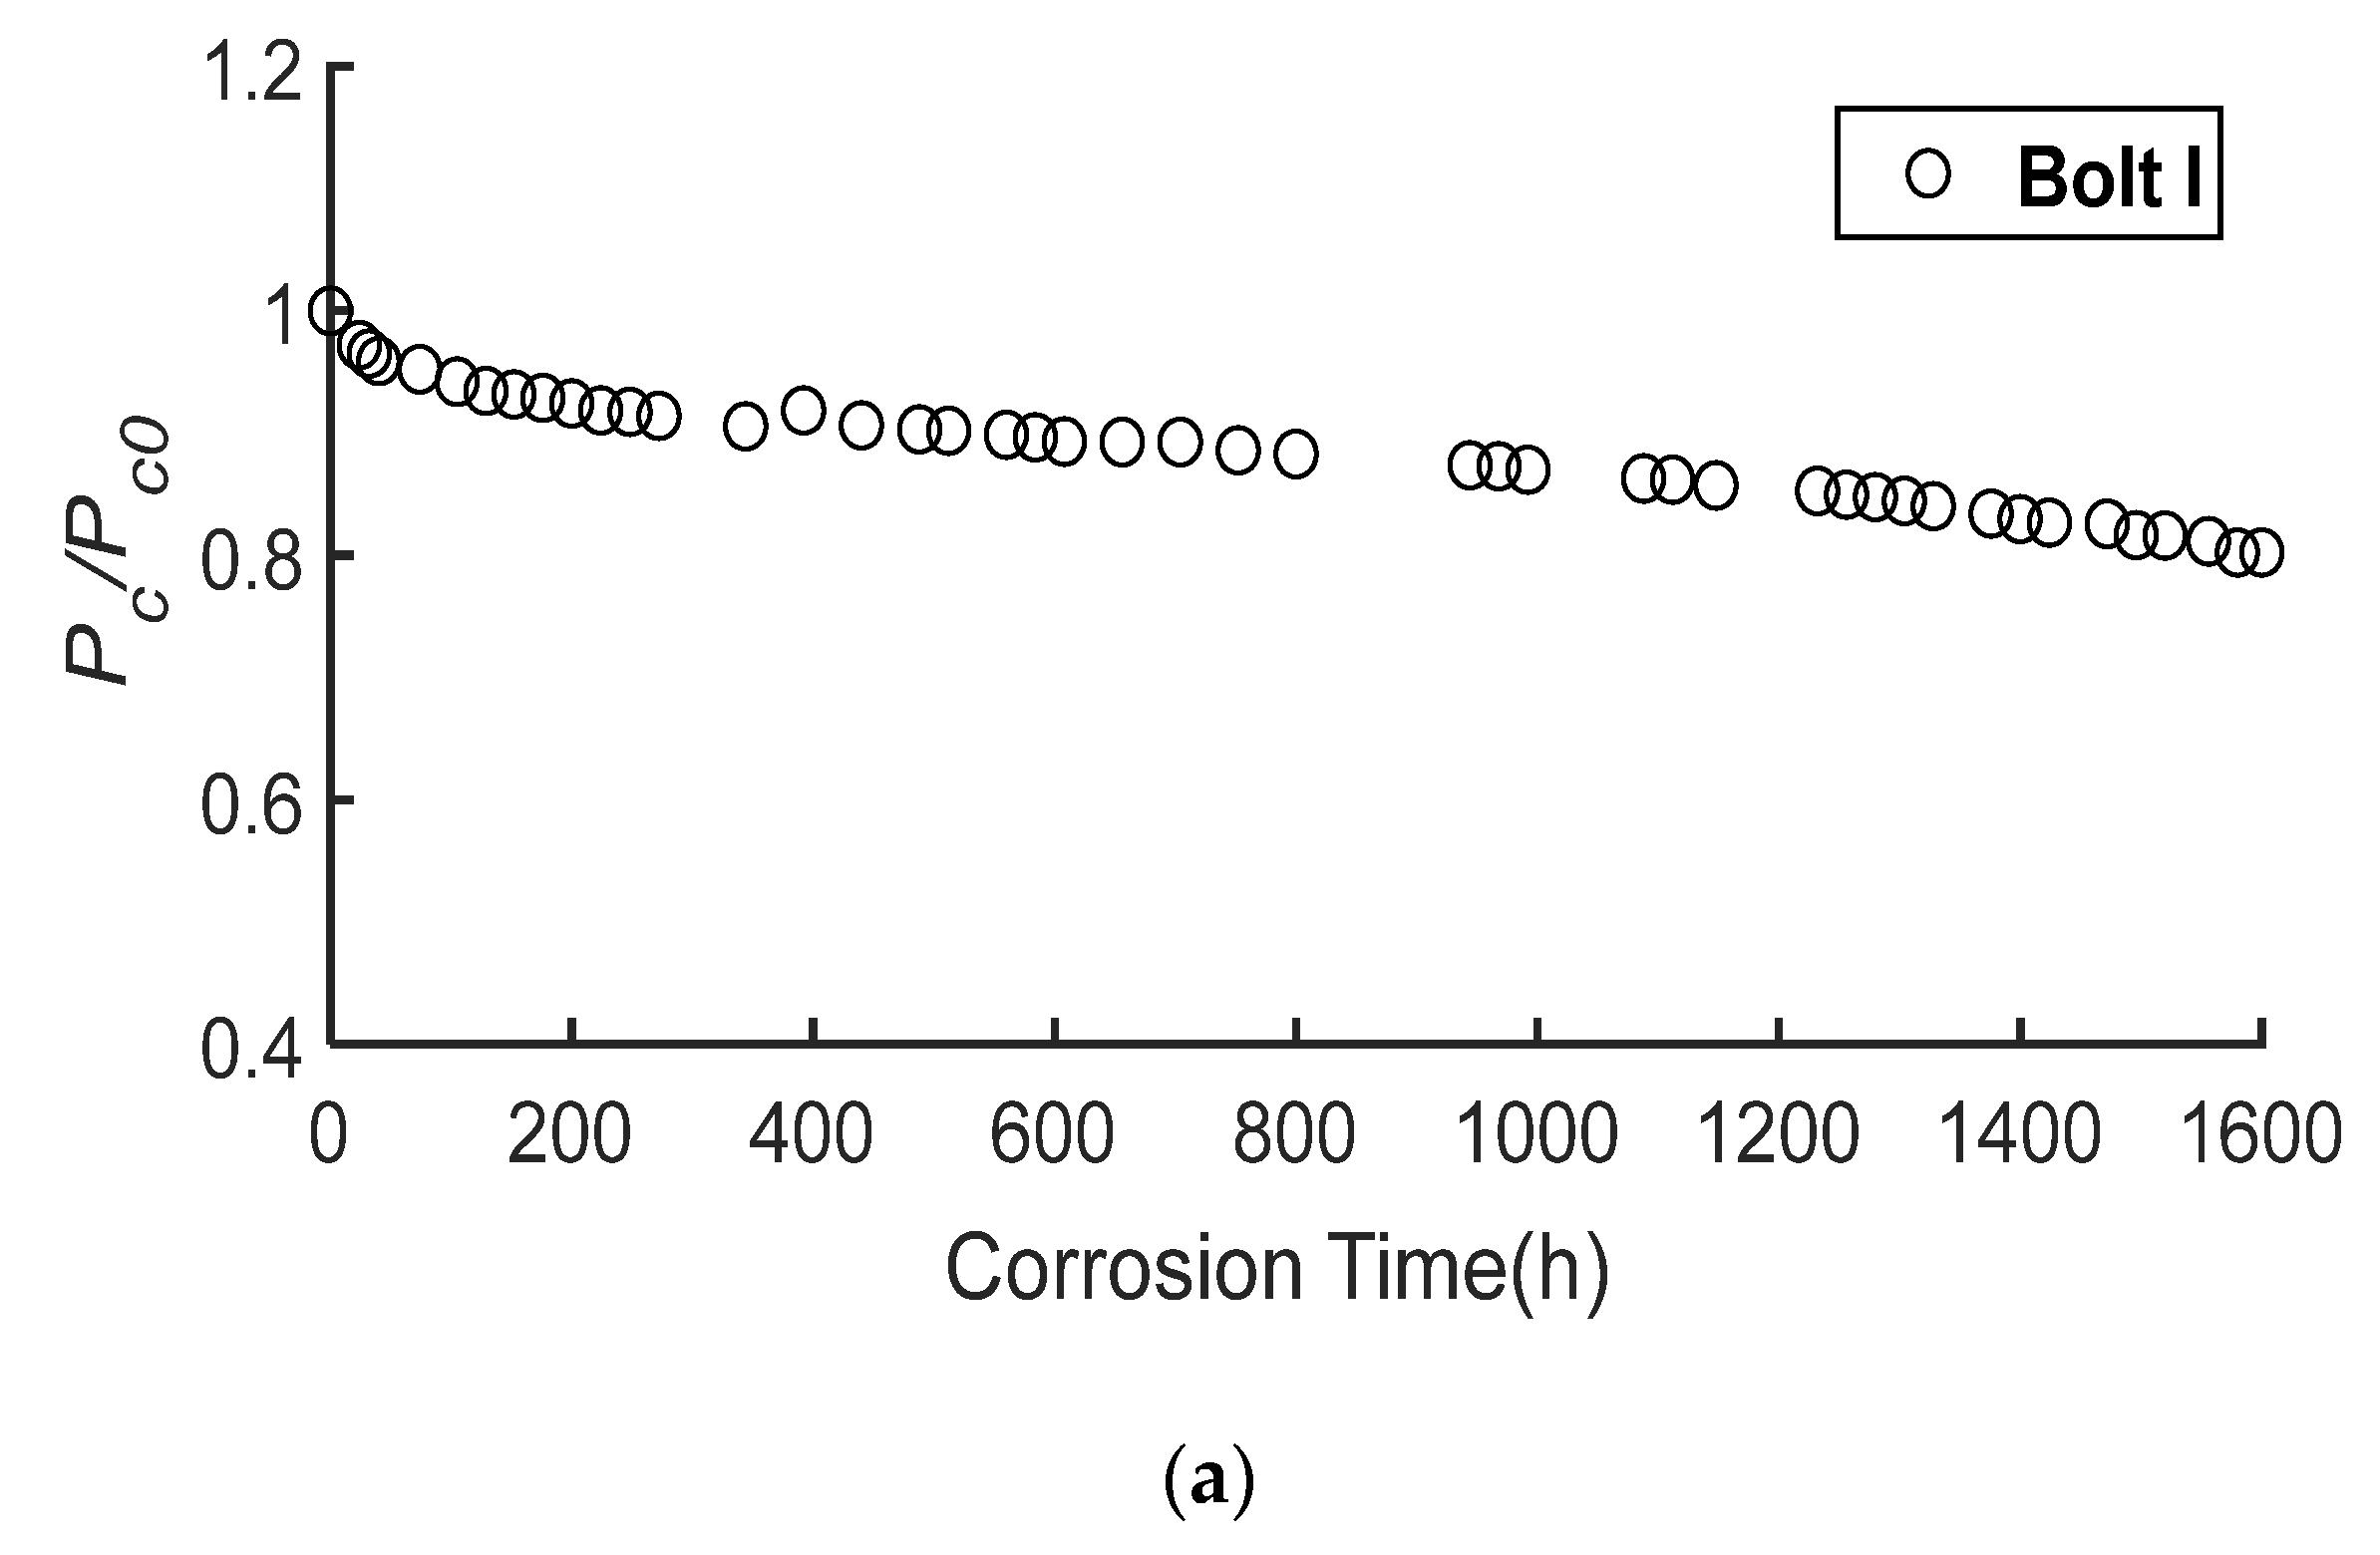
3.2. Degradation of the Preload Force

3.2.1. Stress Relaxation

Similar to Shi et al.’s experimental results [12], the stress relaxation of high-strength bolts is found after the final screwing of the preload force, as shown in Figure 12 and Table 5. Here, P 0 is the applied PF-HSB, and P is the real-time PF-HSB. Clearly, the PF-HSB decreased rapidly in the first five hours after the final screwing of the preload force. For example, the preload force of Bolt I decreased to 81.4%, and that of Bolt III decreased by 15.4%. After 45 h of the final screwing of the preload force, it gradually became stable. The average loss of the preload force in TX Series was 27.8%, and that of the preload force in TY Series wass 19.8%. After 100 h, the process of stress relaxation was finished and the preload force became stable. A similar conclusion was also reached by Shi et al. [12].

3.2.2. Effect of Corrosion on the Preload Force

According to the test results, the relations between the PF-HSB and corrosion time are obtained, as depicted in Figure 13. Here, P c is the real-time PF-HSB and P c 0 is the PF-HSB after stress relaxation. Note that values of strain gauges at Bolt I, Bolt II, and Bolt III were not effective after 1600 h, so only the PF-HSB in 1600 h are shown in Figure 13. As the wire connected to Bolt IV was broken in the accelerated corrosion testing, the strain variation of Bolt IV is not captured. From the results of test, corrosion had significant influences on the PF-HSB, as reflected in Figure 13 and Table 6. The PF-HSB decreased by 30.0% when the corrosion degree of steel plates reached 3.5%. This may be mainly attributed to the softness of corrosion product on steel plates.

4. Finite Element Analysis

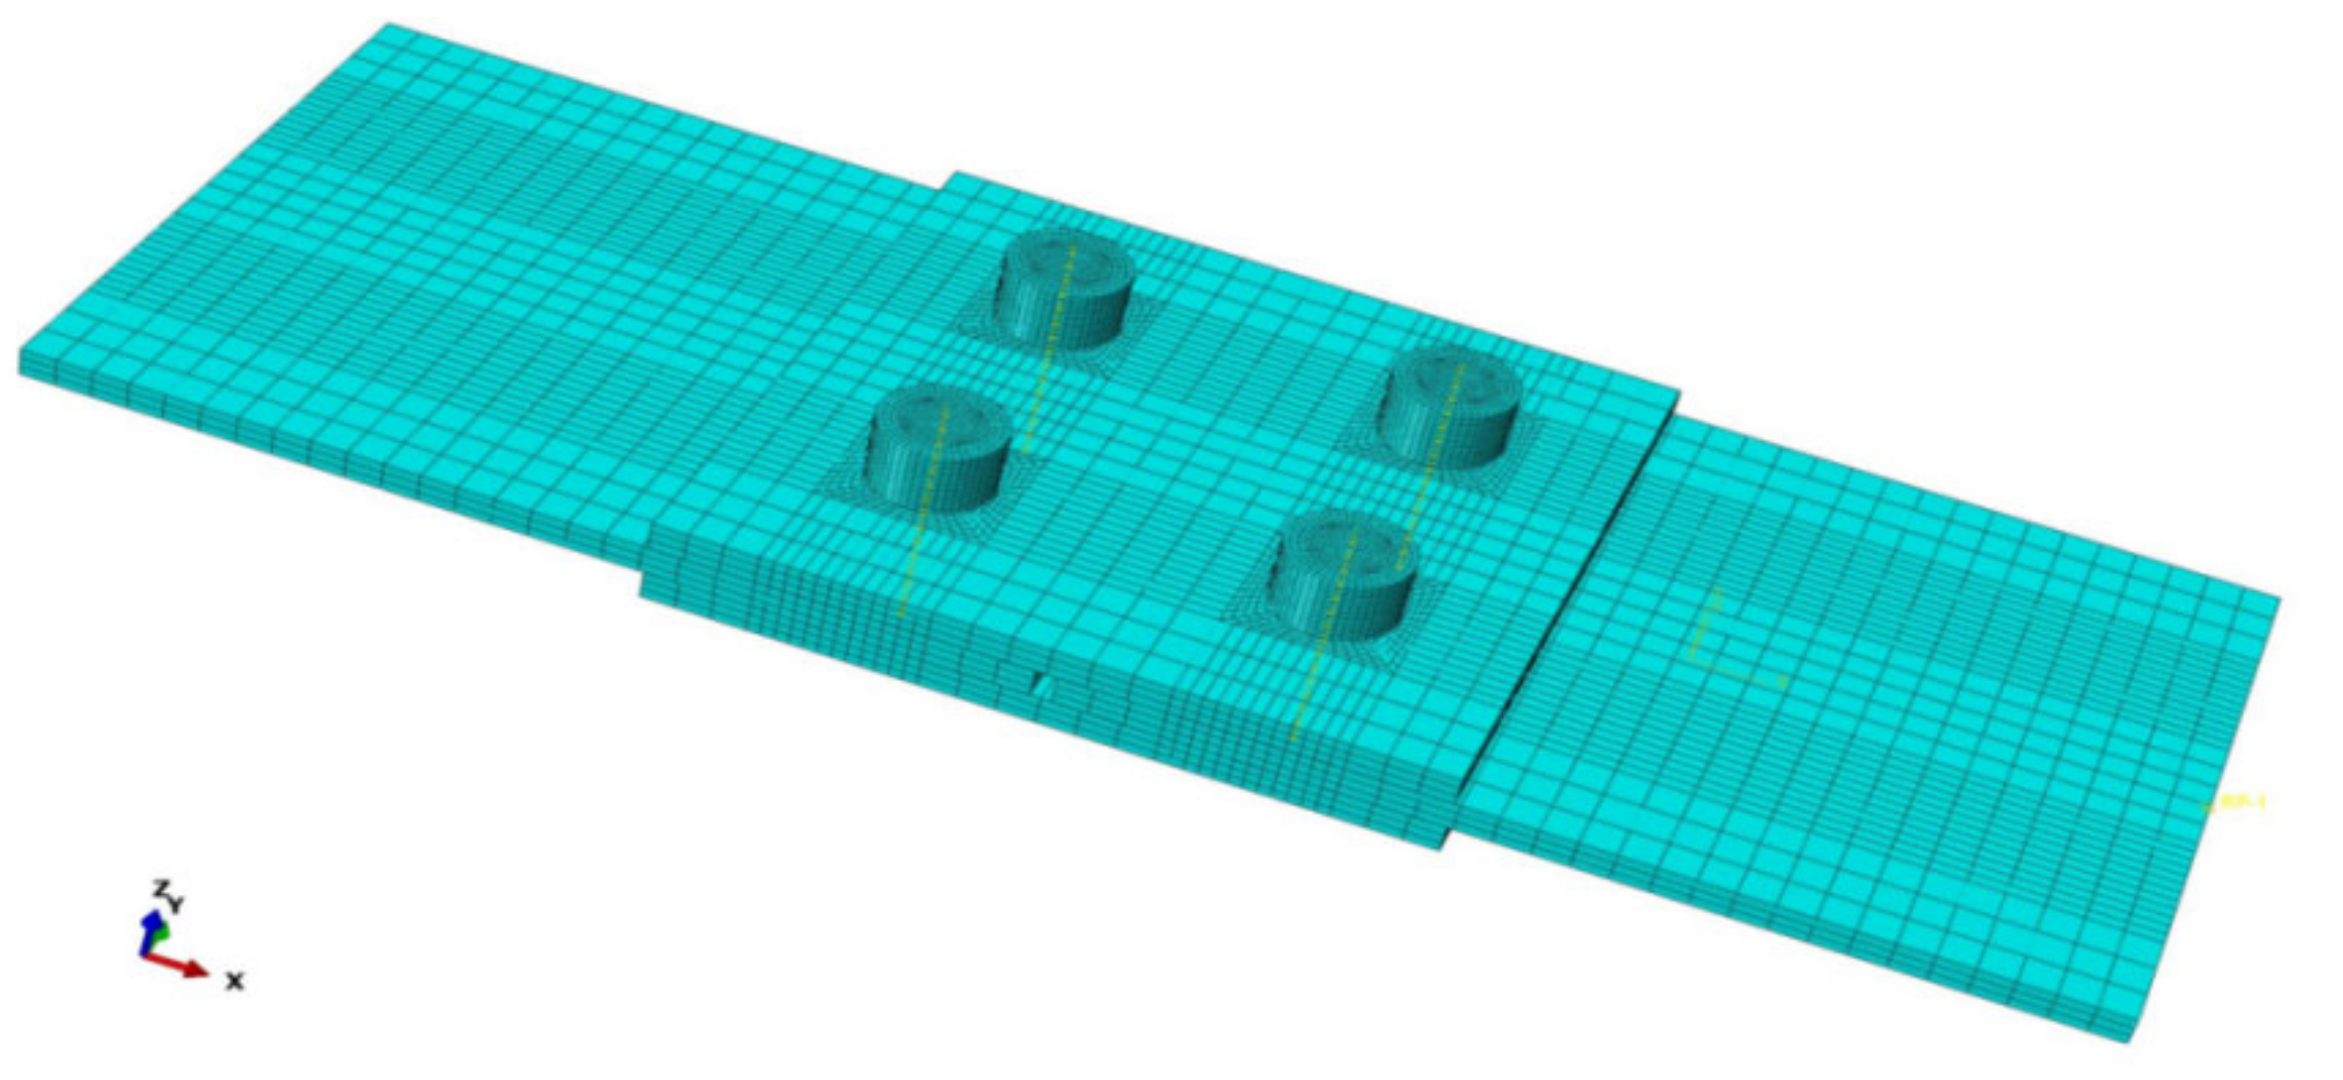
4.1. Finite Element Method

In order to investigate the loss of PF-HSB caused by corrosion, a three-dimensional finite element method was developed using Abaqus [30]. All members for high-strength bolted connections were simulated using C3D8R Element [31,32,33]. All contacts (i.e., bolt heads and steel plates, bolt nuts and steel plates, bolt shanks and bolt holes, and contacts between steel plates) were simulated, and surface-to-surface contact with hard contact was selected. The influences of corrosion was considered in three aspects: the friction factor of steel plates after corrosion, the constitutive model of steel plate after corrosion, and the stiffness reduction in cover plates. The friction factor for the contact was adopted according to Hong’s test [34]. The influences of corrosion on mechanical properties of steel plate were considered, and the corresponding constitutive model of steel plate after corrosion was adopted according to authors’ previous study [28]. The “Predefined filed” was used to control the variation of mechanical properties of steel before and after corrosion. As the surface of the bolts was treated by the phosphating method, the corrosion extent of bolts was not serious in this work. As a result, the effect of corrosion on bolts was not considered in the finite element analysis. Mesh sizes for the steel plates and bolts were 8 mm and 2 mm, respectively, as shown in Figure 14. The reason for the choice of the mesh sizes is that they can accurately predict the behavior of connections, as discussed in Section 3.2 in this work.
Note that the preload force loss caused by stress relaxation was not considered. As discussed in Section 3.2.1, the preload force will keep stable after 100 h of the final screwing of the preload force. Therefore, the stable preload force (124 kN for TX Series and 121 kN for TY Series) was considered as the initial value for the PF-HSB in the finite element analysis. The preload force was applied by “Bolt load” on each bolt, as shown in Figure 15. To handle the difficulties of convergence, the whole process is composed of a series of different analysis steps [35,36,37]. Firstly, each bolt was subjected to a tensile load of 10 N, so that all the parts could contact with each other. Secondly, all the preload force was applied to each bolt in accordance with JGJ 82-2011 [26]. Thirdly, all bolts were fixed at current length [38]. On the basis of the corrosion rate in the test, the corrosion depth (the thickness loss of steel plates) can be obtained. As shown in Figure 15, the surface of steel plate became soft after the accumulation of the corrosion product. For this reason, a stiffness reduction method was employed to consider the corrosion damage on the high-strength bolt. The corrosion depth is firstly calculated according to corrosion degree, and reduced field variable method, which is considered by the reduction in elasticity modulus, is then applied to the corrosion depth of the cover plates. To solve the converge problem, the process of reducing stiffness is divided into several steps, and the corrosion depth for each step is less than 0.5 mm.

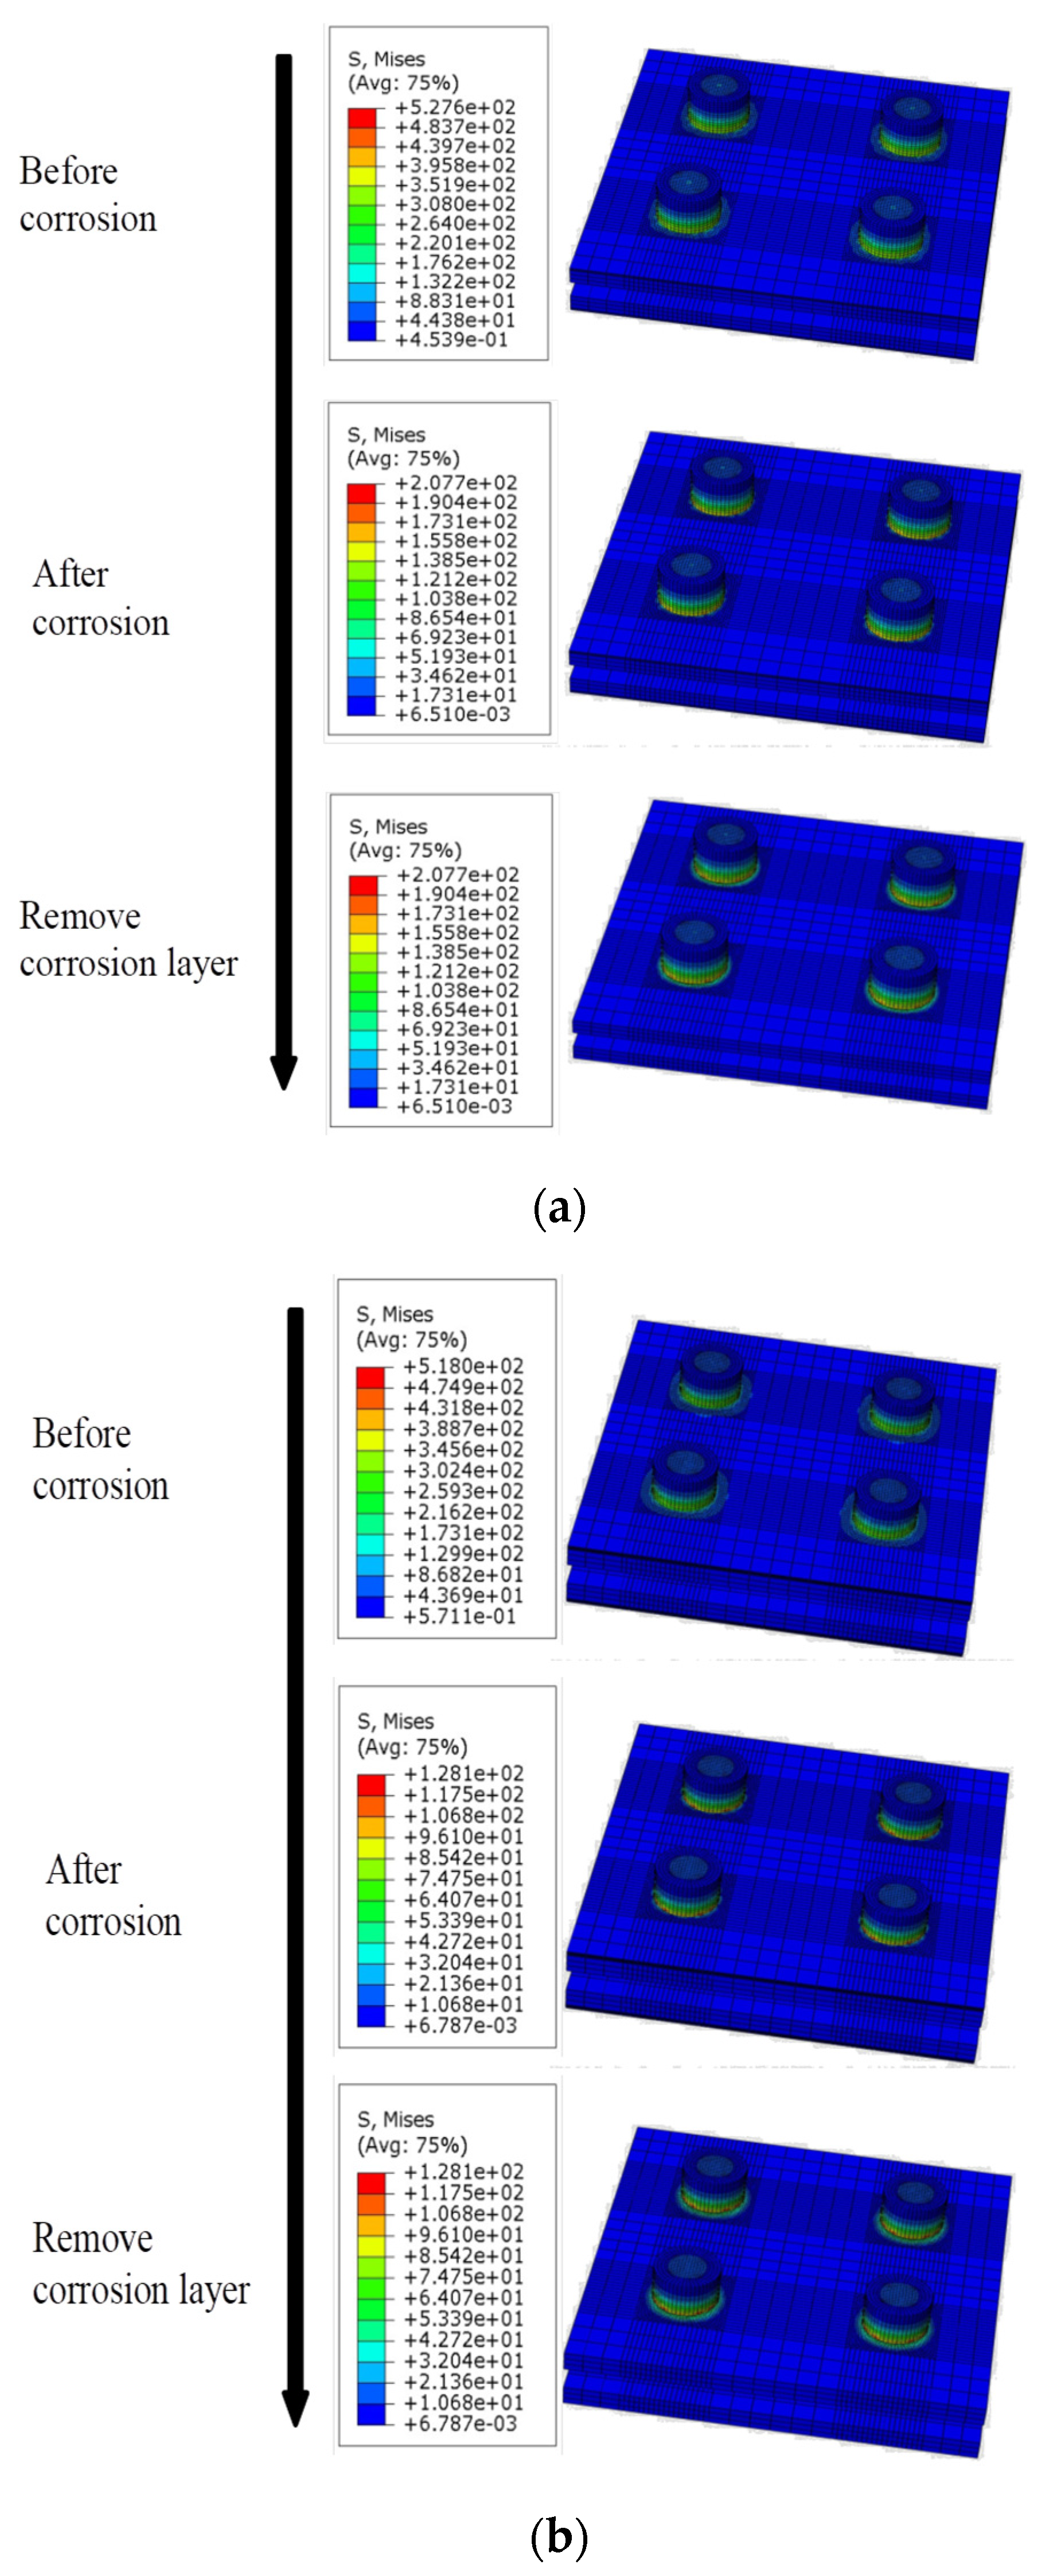
4.2. Validation of Finite Element Analysis

Based on the stiffness reduction method, the PF-HSB at different corrosion rates was obtained. To verify the reliability of the stiffness reduction method, the test data in this study were utilized as listed in Table 7. Clearly, the developed stiffness reduction method accurately captured the PF-HSB after corrosion as the average error between results from the stiffness reduction method and experimental results is only 3.52% (TX Series) and 3.58% (TY Series).

4.3. Parametric Study

As the corrosion rate in the experiment only reached 3.537%, a parametric study is carried out to investigate the PF-HSB of specimens with relatively large corrosion rate, as listed in Table 8. The maximum corrosion rates for TX series and TY series in the finite element analysis are identical with those in the experiment, as shown in Table 4. From Zhang et al.’s investigations [39], the value of 15.56% for the corrosion rate of Q235 steel corresponds to the corrosion rate of specimens after exposure at ambient environment in Shanghai, China for 65 years. For this reason, the maximum corrosion rate in the analysis may be enough to envelope the corrosion extent of in-service steel structures.
Figure 16 shows the stress distribution in high-strength bolted connections before and after corrosion. Clearly, the maximum stress distributed on the connection decreased from 527.6 Mpa to 207.7 Mpa when the corrosion rate reached 15.15% for TX series. In contrast, the maximum stress on the connection decreased by 75% after the corrosion rate increased to 17.17%.

5. Model for the PF-HSB

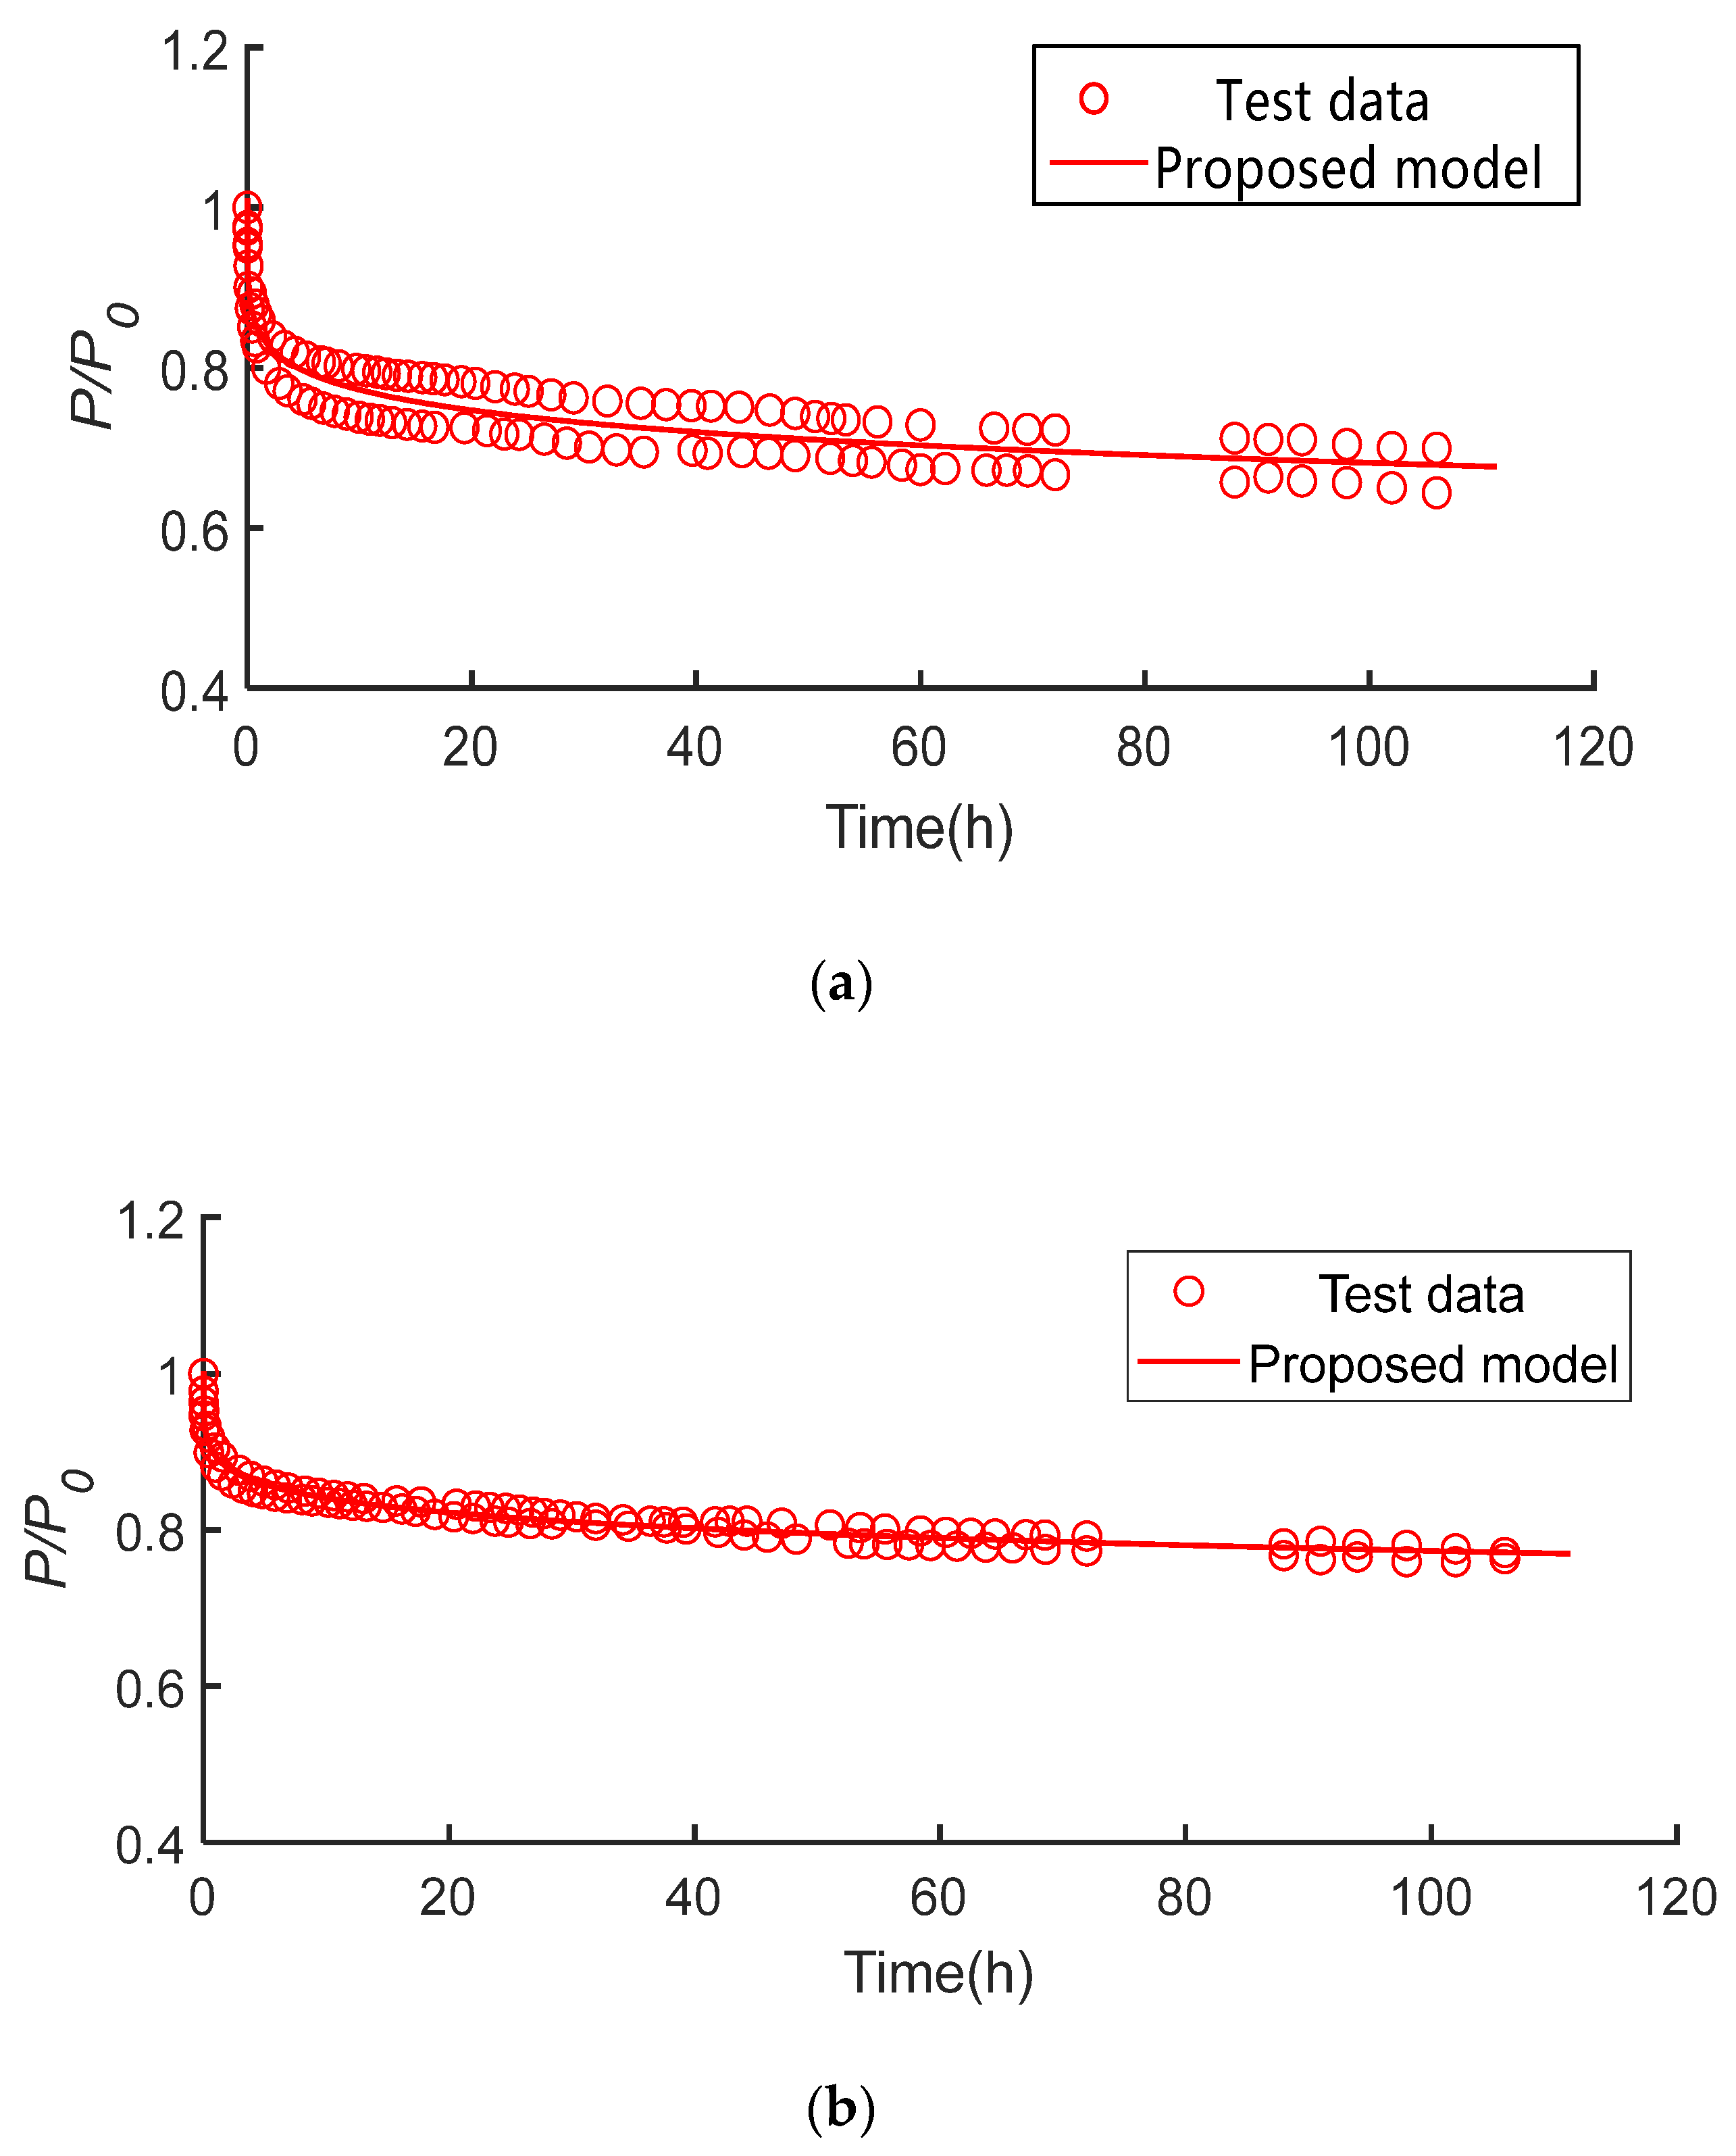
5.1. Stress Relaxation of High-Strength Bolts

For predicting the stress relaxation of high-strength bolts after final screwing, models for the stress relaxation are suggested based on the results of the monitoring test, as shown in Equations (2) and (3) and Figure 17.
P P 0 = 0.32 t 0.10 + 1.00       R 2 = 0.95   for   TX   series
P P 0 = 0.19 t 0.11 + 1.00       R 2 = 0.96   for   TY   series
where P 0 is the applied PF-HSB according to JGJ82-2011 [26], and P is the real-time PF-HSB.

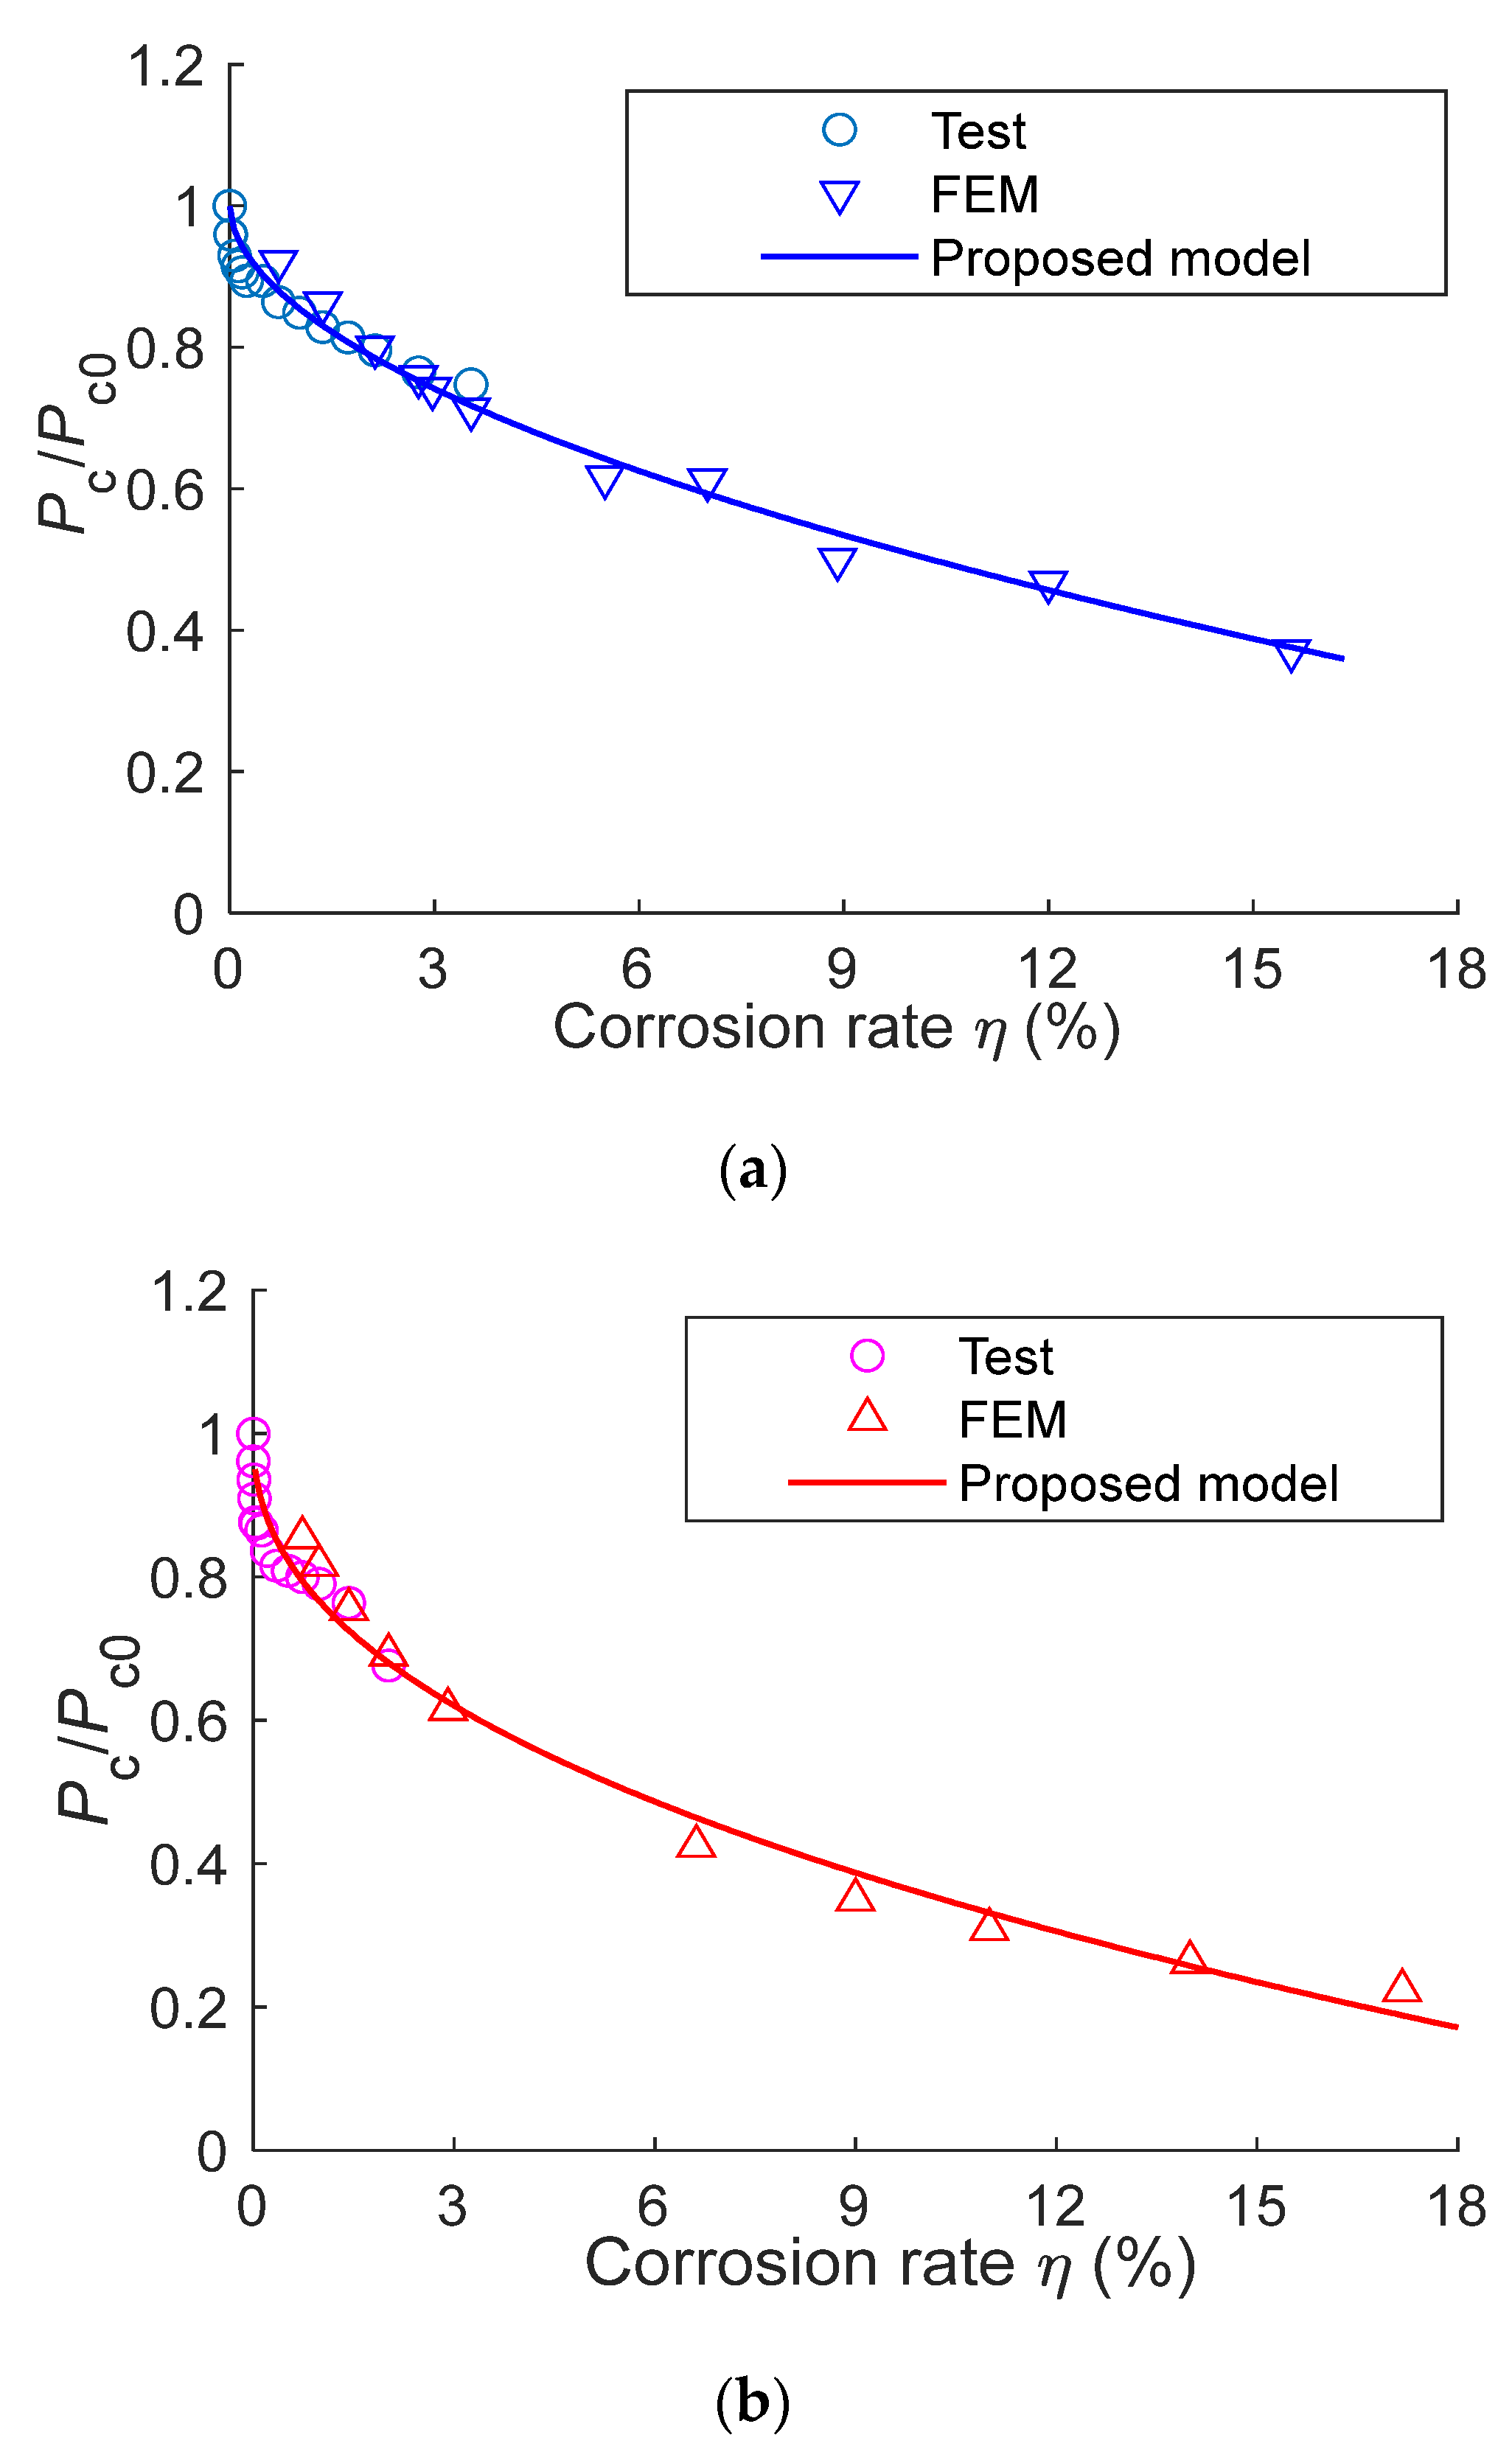
5.2. Degradation Model for the Preload Force of Corroded High-Strength Bolts

To estimate the PF-HSB after corrosion, the experimental and numerical results are employed, as shown in Equations (4) and (5) and Figure 18. Here, the experimental results are divided into two groups: predicting group and verifying group, as shown in Table 6. The predicting group is incorporated with numerical results to develop the degradation model of corroded high-strength bolts, and the verifying group is utilized to validate the veracity of the degradation model, as discussed in Section 5.3.
P c P c 0 = 0.144 η 0.535 + 1.00       R 2 = 0.976   for   TX   Series
P c P c 0 = 0.235 η 0.436 + 1.00       R 2 = 0.974   for   TY   Series
where P c is the real-time PF-HSB after corrosion, η is the corrosion rate, and P c 0 is the PF-HSB after stress relaxation, which is 124 kN for TX Series and 121 kN for TY Series, respectively.
As depicted in Figure 19, the loss of PF-HSB in TX Series reaches 65% when the corrosion rate is 15.56%, while the loss of PF-HSB in TY Series reaches 80% when the corrosion rate is 17.17%.

5.3. Evaluation of the Proposed Model

To assess the accuracy of the proposed models, the other group of experimental results is utilized, as shown in Table 9. Clearly, the proposed degradation model can accurately estimate the PF-HSB after corrosion as the average error between the proposed model and test data in TX series is 1.97%, and the average error in TY series is 2.97%.

6. Conclusions

In this study, the degradation behavior of the PF-HSB after corrosion was investigated. The accelerated corrosion testing and the monitoring test for the PF-HSB were performed. The finite element method for estimating the loss of PF-HSB after corrosion was developed using ABAQUS. The main conclusions are made as follows:
(1)
The PF-HSB decreases rapidly in the first five hours after the final screwing, and it tends to be stable after 45 h. A model that can predicts the stress relaxation of high-strength bolts after final screwing is suggested.
(2)
Corrosion has significant influences on the PF-HSB. The PF-HSB decreases by 30.0% when the corrosion degree of steel plates reaches 3.5%.
(3)
A finite element method is developed to predict the loss of PF-HSB after corrosion.
(4)
Accurate models for predicting the loss of PF-HSB after corrosion are proposed.

Author Contributions

Z.K.: Language Editing, Project management, Conceptualization and Supervision; Y.J.: Writing—Original draft preparation, Software, Data curation and analysis and Figures; S.H.: Experiment and Investigation; Q.L.: Experiment and Investigation; Q.-V.V.: Investigation and Formal analysis; S.-E.K.: Conceptualization and Supervision. All authors have read and agreed to the published version of the manuscript.

Funding

This work was supported by the Natural Science Foundation of Anhui Province, China (No. 1908085ME171) and University Outstanding Youth Talent of Anhui Province, China (gxyq2022015).

Data Availability Statement

Data will be available upon reasonable request.

Conflicts of Interest

We declare that we have no conflict of interest.

References

  1. Gresnigt, A.M.; Steenhuis, C.M. Stiffness of Lap Joints with Preloaded Bolts; Springer: Dordrecht, The Netherlands, 2000. [Google Scholar] [CrossRef]
  2. Man, Z.; Yang, D.; Hassanein, M.F.; Zhang, J.; Lin, A. Failure analysis of high-strength bolts in steel truss bridges. Civ. Eng. 2017, 170, 175–179. [Google Scholar] [CrossRef]
  3. Huang, D.; Gao, X.; An, Y. The Influence of Thickness of Steel Plate on Bearing Capacity of Friction-Type High-Strength Bolts. Technol. Highw. Transp. 2018, 34, 74–78. [Google Scholar] [CrossRef]
  4. Kulak, G.L.; Fisher, J.W.; Struik, J.H.A. Guide to Design Criteria for Bolted and Riveted Joints, 2nd ed.; AISC: Chicago, IL, USA, 2001. [Google Scholar]
  5. Korean Society of Steel construction (KSSC). Design of Steel Structures, 3rd ed.; Gumiseogwan: Seoul, Korea, 2008. [Google Scholar]
  6. Korea Road and Transportation Association (KRTA). Korean Bridge Design Specification; Korea Road and Transportation Association (KRTA): Seoul, Republic of Korea, 2010. [Google Scholar]
  7. Kim, I.T.; Lee, J.M.; Huh, J.; Ahn, J.H. Tensile behaviors of friction bolt connection with bolt head corrosion damage: Experimental research B. Eng. Fail. Anal. 2016, 59, 526–543. [Google Scholar] [CrossRef]
  8. AISC 360-16; Specification for Structural Steel Buildings. American Institute of Steel Construction: Chicago, IL, USA, 2016.
  9. European Committee for Standardization (CEN). Eurocode 3: Design of Steel Structures—Part 1–8: Design of Joints; CEN: Brussels, Belgium, 1993. [Google Scholar]
  10. GB50017-2017; Design Standard for Steel Structures. China Building Industry Press: Beijing, China, 2018.
  11. Braithwaite, J.; Goenaga, I.G.; Tafazzolimoghaddam, B.; Mehmanparast, A. Sensitivity analysis of friction and creep deformation effects on preload relaxation in offshore wind turbine bolted connections. Appl. Ocean. Res. 2020, 101, 102225. [Google Scholar] [CrossRef]
  12. Shi, G.; Shi, Y.; Wang, Y.; Li, S.; Chen, H. Experimental Research On Strain Relaxation Of High-Strength Bolts In End-Plate Connections. Constr. Technol. 2003, 11, 15–17. (In Chinese) [Google Scholar]
  13. Shi, Y.; Shi, G.; Wang, Y.; Li, S. Long-time Monitoring on Strain Relaxation of High Strength Bolts in End-plate Connections. Constr. Technol. 2004, 11, 11–13. (In Chinese) [Google Scholar]
  14. Cavallaro, G.F.; Latour, M.; Francavilla, A.B.; Piluso, V.; Rizzano, G. Standardised friction damper bolt assemblies time-related relaxation and installed tension variability. J. Constr. Steel Res. 2018, 141, 145–155. [Google Scholar] [CrossRef]
  15. Zhang, X. Valve Ring Bolt Group Assembly Process Optimization and Experimental Research; Harbin Institute of Technology: Harbin, China, 2013. [Google Scholar]
  16. Hu, M. Research of Bolt Group Assembly Process on the Body-in-White Door; Tianjin University of Technology: Tianjin, China, 2018. [Google Scholar]
  17. Li, Y.; Liu, Z.; Wang, Y.; Cai, L.; Xu, W. Research on preload of bolted joints tightening sequence-related relaxation considering elastic interaction between bolts. J. Constr. Steel Res. 2019, 160, 45–53. [Google Scholar] [CrossRef]
  18. Wang, X.; Yi, Y.; Liu, D.; Zhang, J. Experimental Study on Pre-tension Relaxation of High-Strength Bolts of Joint Plate. Steel Struct. 2019, 11, 40–44. [Google Scholar] [CrossRef]
  19. Caccese, V.; Berube, K.A.; Fernandez, M.; Melo, J.D.; Kabche, J.P. Influence of stress relaxation on clamp-up force in hybrid composite-to-metal bolted joints. Compos. Struct. 2009, 89, 285–293. [Google Scholar] [CrossRef]
  20. Li, A.; Xu, S.; Wang, Y.; Wu, C.; Nie, B. Fatigue behavior of corroded steel plates strengthened with CFRP plates. Constr. Build. Mater. 2022, 314, 125707. [Google Scholar] [CrossRef]
  21. Wang, Y.; Zhou, X.; Wang, H.; Kong, D.; Xu, S. Stochastic constitutive model of structural steel based on random field of corrosion depth. Case. Stud.Constr. Mat. 2022, 16, e00972. [Google Scholar] [CrossRef]
  22. Zhang, M. Experimental Study on Performance Degradation of Friction Type Joints of Corroded Steel Structure with High-Strength Bolts; Xi’an University of Architecture and Technology: Xi’an, China, 2011. [Google Scholar]
  23. Ahn, J.H.; Lee, J.M.; Cheung, J.H.; Kim, I.T. Clamping force loss of high-strength bolts as a result of bolt head corrosion damage: Experimental research A. Eng. Fail. Anal. 2016, 59, 509–525. [Google Scholar] [CrossRef]
  24. Wang, H.; Tang, F.; Qin, S.; Tu, K.; Guo, J. Corrosion-Induced Mechanical Degradation of High-Strength Bolted Steel Connection. J. Mater. Civ. Eng. 2020, 32, 04020203. [Google Scholar] [CrossRef]
  25. Jiang, C.; Xiong, W.; Cai, C.; Zhu, Y.; Wang, J. Preload force loss of high-strength bolts in friction connections considering corrosion damage and fatigue loading. Eng. Fail. Anal. 2022, 137, 106416. [Google Scholar] [CrossRef]
  26. JGJ 82-2011; Technical Specification for High Strength Bolt Connection of Steel Structure. China Building Industry Press: Beijing, China, 2011.
  27. GB/T 10125-2012; Corrosion Test of Artificial Atmosphere Salt Spray Test. Standards Press of China: Beijing, China, 2013.
  28. Kong, Z.; Jin, Y.; Hossen, G.M.S.; Hong, S.; Wang, Y.; Vu, Q.; Truong, V.; Tao, Q.; Kim, S.E. Experimental and theoretical study on mechanical properties of mild steel after corrosion. Ocean. Eng. 2022, 246, 110652. [Google Scholar] [CrossRef]
  29. Xia, X.; Xing, L.; Song, H.; Tong, H.; Zhou, J.; Sun, M. Corrosion Resistance of Weathering Steels in Simulated South China Sea Atmospheric Environment. Equip. Environ. Eng. 2018, 15, 39–44. [Google Scholar] [CrossRef]
  30. ABAQUS. ABAQUS Analysis User’s Manual; Version 2016; Dassault Systems Simulia Corp: Providence, RI, USA, 2016. [Google Scholar]
  31. Kong, Z.; Jin, Y.; Yang, F.; Vu, Q.; Truong, V.; Yu, B.; Kim, S.E. Numerical simulation for structural behaviour of stainless steel web cleat connections. J. Constr. Steel Res. 2021, 183, 106706. [Google Scholar] [CrossRef]
  32. Kim, T.S.; Kuwamura, H. Numerical investigation on strength design and curling effect of mechanically fastened joints in cold-formed austenitic stainless steel. Mater. Des. 2011, 32, 3942–3956. [Google Scholar] [CrossRef]
  33. Jiang, K.; Zhao, O.; Tan, K. Experimental and numerical study of S700 high strength steel double shear bolted connections in tension. Eng. Struct. 2020, 225, 111175. [Google Scholar] [CrossRef]
  34. Hong, S. Research on Carrying Capacity of Corroded High-Strength Bolt Shear Connections; Anhui University of Technology: Anhui, China, 2021. (In Chinese) [Google Scholar]
  35. Kong, Z.; Hong, S.; Vu, Q.-V.; Cao, X.; Kim, S.-E.; Yu, B. New equations predicting initial stiffness and ultimate moment of flush end-plate connections. J. Constr. Steel Res. 2019, 175, 1–12. [Google Scholar] [CrossRef]
  36. Kong, Z.; Kim, S.-E. Numerical estimation for initial stiffness and ultimate moment of T-stub connections. J. Constr. Steel Res. 2018, 141, 118–131. [Google Scholar] [CrossRef]
  37. Qiang, X.; Bijlaard, F.S.; Kolstein, H.; Jiang, X. Behaviour of beam-to-column high strength steel endplate connections under fire conditions—Part 2: Numerical study. Eng. Struct. 2014, 64, 39–51. [Google Scholar] [CrossRef]
  38. Shi, Y.; Zhou, Y. Explain of Finite Element Analysis with Examples Using Abaqus; China Machine Press: Beijing, China, 2004. [Google Scholar]
  39. Zhang, S.; Zhao, D.; Xing, K.; Zhuang, J.; Wang, F.; Yang, J. Study on material mechanical performance of corroded cold-formed 2 millimetre thin-walled steel. Ind. Constr. 2016, 46, 114–119. (In Chinese) [Google Scholar] [CrossRef]
Figure 1. High-strength bolts connection (TX series).
Buildings 12 02122 g001
Figure 2. High-strength bolts connection (TY series).
Buildings 12 02122 g002
Figure 3. Installation of strain gauge. (a) Scheme for strain gauge; (b) High-strength bolts with strain gauges.
Buildings 12 02122 g003
Figure 4. Calibration of high-strength bolts.
Buildings 12 02122 g004
Figure 5. Initial twist of high-strength bolts.
Buildings 12 02122 g005
Figure 6. Final twist of high-strength bolts.
Buildings 12 02122 g006
Figure 7. High-strength bolts connections with strain gauges.
Buildings 12 02122 g007
Figure 8. Monitoring scheme for the PF-HSB.
Buildings 12 02122 g008
Figure 9. Accelerated corrosion testing.
Buildings 12 02122 g009
Figure 10. Corroded specimens. (a) Steel plate; (b) High-strength bolts.
Buildings 12 02122 g010
Figure 11. Specimens after removing corrosion product. (a) Steel plate; (b) High-strength bolts.
Buildings 12 02122 g011
Figure 12. Stress relaxation of high-strength bolts. (a) Bolt I; (b) Bolt II; (c) Bolt III; (d) Bolt IV.
Buildings 12 02122 g012aBuildings 12 02122 g012bBuildings 12 02122 g012c
Figure 13. Preload (Pc/Pc0) versus corrosion time. (a) Bolt I; (b) Bolt II; (c) Bolt III.
Buildings 12 02122 g013aBuildings 12 02122 g013b
Figure 14. Finite element model.
Buildings 12 02122 g014
Figure 15. Application of preload force on bolt.
Buildings 12 02122 g015
Figure 16. Corrosion product on steel plate.
Buildings 12 02122 g016
Figure 17. Stress distribution state of connections. (a) Stress distribution state of TX series; (b) Stress distribution state of TY series.
Buildings 12 02122 g017
Figure 18. Proposed model for stress relaxation. (a) TX Series; (b) TY Series.
Buildings 12 02122 g018
Figure 19. Proposed model for the PF-HSB after corrosion. (a) TX Series; (b) TY Series.
Buildings 12 02122 g019
Table 1. Calibration parameters of high-strength bolts.
Applied Force (kN)03691215Calibration Coefficient (kN/μ)
Bolt I02548761181540.098
Bolt II032681061421760.084
Bolt III032681021421800.081
Bolt IV050941421862360.065
Table 2. Monitoring scheme of the PF-HSB.
Specimen NumberBolt GradeDiameter of Bolt (mm)Steel PlateNumbers of Bolts in Monitoring
S235-110.9S20Q2352 (Bolt I and Bolt II)
S355-110.9S20Q3552 (Bolt III and Bolt IV)
Table 3. Corrosion rate of high-strength bolts.
Bolts
Number
Corrosion Time (h)Mass before Corrosion(g)Mass after Corrosion(g)Corrosion Rate (%)Average Corrosion Rate (%)
MZ111440263.50254.503.423.55
MZ12263.50254.003.61
MZ13263.50254.003.61
MZ212880263.50245.007.026.78
MZ22262.00246.006.11
MZ23263.00244.007.22
MZ314320262.00224.5014.3117.05
MZ32263.50217.5017.46
MZ33263.00212.0019.39
Table 4. Corrosion rate of steel plates.
Specimen NumberCorrosion Time (h)Mass before Corrosion (g)Mass after Corrosion (g)Corrosion Rate (%)Average Corrosion Rate (%)Average Thickness Loss of Steel Plate (mm)
MX111440441.50428.502.942.970.22
MX12444.00430.503.04
MX13442.50429.502.94
MY11706.50686.002.902.910.35
MY12697.50676.503.01
MY13711.00691.002.81
MX212880440.00401.008.868.910.67
MX22443.00404.508.69
MX23442.00401.509.16
MY21712.00665.006.606.620.80
MY22706.50659.506.65
MY23704.50658.006.60
MX314320444.00375.0015.5415.561.17
MX32441.00373.0015.42
MX33445.50375.5015.71
MY31706.00588.0016.7117.172.07
MY32716.00590.0017.60
MY33706.50585.0017.20
Table 5. Stress relaxation of high-strength bolts in real-time.
TimeBolt IBolt IIBolt IIIBolt IVAverage
0 h100.00%100.00%100.00%100.00%100.00%
5 h81.41%75.89%84.56%86.16%82.01%
10 h79.66%73.53%83.55%84.42%80.29%
15 h78.79%72.69%82.82%83.76%79.52%
20 h78.05%72.33%81.74%83.41%78.88%
25 h77.02%71.37%80.98%82.66%78.01%
30 h76.04%70.12%80.71%81.71%77.15%
35 h75.52%69.38%80.48%81.21%76.65%
40 h75.23%69.24%80.06%80.99%76.38%
45 h74.93%69.47%79.22%81.11%76.18%
50 h74.03%68.60%78.80%80.45%75.47%
60 h72.92%67.18%78.34%79.38%74.46%
70 h72.34%66.66%77.81%78.96%73.94%
88 h71.17%65.68%76.74%78.18%72.94%
90 h71.34%66.06%76.74%78.36%73.13%
100 h70.45%65.17%76.32%77.68%72.41%
Table 6. Details of specimens in test.
SpecimensMaterial of Plates Corrosion Rate
η (%)
Test Data
Pc/Pc0
Group
TX SeriesQ2350.0750.930Predicting group
Q2350.1230.915
Q2350.1830.906
Q2350.2500.894
Q2350.4850.894
Q2351.7330.814
Q2350.7140.864Verifying group
Q2351.3630.829
Q2352.1290.796
Q2352.7680.765
Q2353.5370.747
TY SeriesQ3550.0470.874Predicting group
Q3550.1200.865
Q3550.2080.836
Q3550.3470.816
Q3550.5220.809
Q3550.7340.800Verifying group
Q3550.9830.790
Q3551.4280.764
Q3552.0220.676
Table 7. Comparison of PF-HSB after corrosion between test and FEM.
Specimens Corrosion   Rate   η (%) Test ResultsFEM ResultsError (%)Average Error (%)
Preload Force (kN)Pc/Pc0Preload Force (kN)Pc/Pc0
TX10.7137107.110.864114.200.9216.60%3.36%
TX21.363102.730.828106.910.8624.10%
TX32.12998.640.79699.180.8000.50%
TX42.76894.800.76593.990.7580.92%
TX53.53792.680.74783.310.7124.69%
TY10.73496.760.800103.460.8556.92%3.45%
TY20.98395.620.79098.810.8173.33%
TY31.42892.410.76491.330.7551.17%
TY42.02281.830.67683.710.6922.37%
Table 8. Details of specimens in FEM.
SpecimensMaterial of Plates Plate Thickness (mm) Corrosion   Rate   η (%) Corrosion Depth (mm)Young’s Modulus (Gpa)Poisson’s Ratio
TX0Q23580.0000.0002060.3
TX1Q23580.7140.053204.70.3
TX2Q23581.3630.101203.540.3
TX3Q23582.1290.158202.160.3
TX4Q23582.7680.206201.010.3
TX5Q23583.5370.263200.650.3
TX 6Q23582.970.220199.620.3
TX 7Q23585.5000.408196.080.3
TX 8Q23587.0000.520193.380.3
TX 9Q23588.9100.670189.940.3
TX 10Q235812.0000.891184.370.3
TX 11Q235815.5601.175177.950.3
TY0Q355120.0000.000 2060.3
TY1Q355120.7340.090204.210.3
TY2Q355120.9830.120203.020.3
TY3Q355121.4280.175201.020.3
TY4Q355122.0220.247198.590.3
TY 5Q355122.9100.350195.400.3
TY 6Q355126.6200.800186.480.3
TY 7Q355129.0001.101183.210.3
TY 8Q3551211.0001.346181.380.3
TY 9Q3551214.0001.713179.610.3
TY 10Q3551217.1702.070178.540.3
Table 9. Comparison of the PF-HSB after corrosion between the proposed model and test data.
Specimens Corrosion   Rate   η (%) Test Data
Pc/Pc0
Proposed Model
Pc/Pc0
Error (%)Average
Error (%)
TX10.7140.8640.8801.85%1.12%
TX21.3630.8280.8310.36%
TX32.1290.7960.78571.29%
TX42.7680.7640.7521.57%
TX53.5370.7470.7430.54%
TY10.7340.8000.7940.75%2.34%
TY20.9830.7900.7672.91%
TY31.4280.7640.7255.10%
TY42.0220.6760.6800.59%
Publisher’s Note: MDPI stays neutral with regard to jurisdictional claims in published maps and institutional affiliations.

