Article

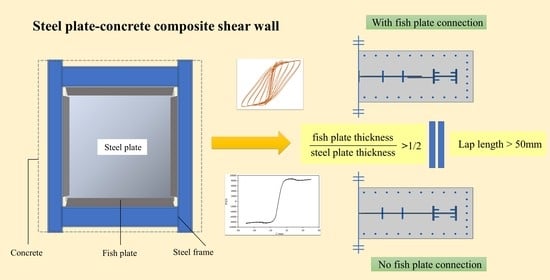
Study on the Seismic Behavior of a Steel Plate–Concrete Composite Shear Wall with a Fishplate Connection

1
Beijing Construction Engineering Group Co., Ltd., Beijing 100055, China
2
Department of Civil Engineering, China Agricultural University, Beijing 100091, China
*
Author to whom correspondence should be addressed.
Buildings 2022, 12(12), 2245; https://doi.org/10.3390/buildings12122245
Submission received: 13 November 2022 / Revised: 3 December 2022 / Accepted: 14 December 2022 / Published: 16 December 2022
(This article belongs to the Special Issue High Performance Steel Structures)

Abstract

:
The steel plate–concrete composite shear wall (SPCSW), having been widely applied to several super high-rise buildings, is currently regarded as a new type of lateral load-resisting structure. The SPCSW design does not consider the connection to the surrounding structure, normally envisaged as a buttweld connection, while the fishplate lap connection tends to be applied in construction. To explore the fishplate lap connection to achieve the performance standard of SPCSW, in this paper, an SPCSW with a fishplate connection is modeled using ABAQUS to investigate the hysteretic behavior under constant axial force and horizontal cyclic loads. Through the hysteresis curve and a load–displacement skeleton curve, the effects of fishplate thickness and lap length on its hysteretic behavior are studied. The results show that increasing the fishplate thickness contributes to a slight increase in the bearing capacity and energy dissipation and has little influence on stiffness degradation. When the fishplate thickness is more than half the steel plate thickness, the strength and energy dissipation of an SPCSW with a fishplate connection can reach the level of an SPCSW without a fishplate connection. The bearing capacity and stiffness of the SPCSW increase with the increase in lap length. When the lap length is greater than 50 mm, the strength, stiffness and energy dissipation capacity of an SPCSW with a fishplate connection are superior to those without fishplate connections. Finally, engineering suggestions on fishplate connections are put forward.

Graphical Abstract

1. Introduction

The steel plate–concrete composite shear wall (SPCSW) is a new type of lateral load-resisting component developed from steel plate shear walls (SPSWs), which effectively combines steel plate and concrete plate together to form a common force. As early as the 1960s, a bus station in Japan took the lead in designing and using a concrete composite shear wall with an embedded steel plate [1]. Since then, innovative SPCSWs have been put forward, and studies have been carried out on slotted steel plate composite shear walls [2], single steel plate–concrete composite shear walls [3], profiled steel plate composite shear walls [4], shear walls with concrete slabs on both sides of the slotted steel plates [5], shear walls filled with concrete inside steel box units [6], etc., all showing desirable seismic performance. Guo et al. [7] proposed a buckling-resistant energy dissipation SPSW whose steel plate wall and precast concrete cover slabs on both sides are connected by bolts penetrating three plates, restraining the internal steel plate buckling and preventing local instability and overall instability. The bracing system, an innovative design of an anti-seismic steel frame system proposed by Giannuzzi et al. [8], comprised concentric X-braces designed to remain elastic during seismic events and rectangular shear plates sized and configured to dissipate sufficient energy through stable hysteretic behavior induced by plastic deformation.
Several previous studies revealed the ductility, stiffness, bearing capacity and energy dissipation properties of various SPCSW systems to further evaluate their seismic performance. A parametric analysis of the seismic property of steel plate shear walls and composite shear walls was conducted by Li [9], including the steel plate height thickness ratio, span height ratio, concrete slab thickness and other parameters. Cui et al. [10] carried out a comparative study on the seismic performance of SPCSWs with embedded steel plates and embedded steel trusses, concluding that the former is more suitable for structures with larger a wall-height width ratio. The calculation formula of the shear capacity of an embedded steel plate–concrete composite shear wall with high-strength concrete (C80) was modified by studying its seismic performance [11]. In the successive experimental research on the seismic performance of SPCSWs with different shear span ratios and axial compression ratios based on quasistatic tests, the mechanical properties and failure modes of various SPCSWs under low cyclic lateral loads were investigated, as well as the effects of shear span ratio, axial compression ratio and other factors relating to seismic performance [12,13,14,15]. It was observed that the opening size and location have insignificant influence on SPCSW behavior; the opening will decrease the strength, and openings at the sides and corners weaken resistance more than those at the center [16]. Wang et al. [17,18] conducted seismic performance tests on corrugated steel plate shear walls and corresponding steel plate–concrete composite shear walls and proposed design formulas for these two types of shear walls. Long [19] and Chen [20], respectively, studied the seismic performance of new modularly assembled single-layer and double-layer composite shear walls, considering parameters such as the height–width ratio, height–thickness ratio, bolt spacing and bolt length–diameter ratio. Furthermore, the performance variations of composite shear walls with two-sided connections and four-sided connections were simultaneously analyzed. Shallan et al. [21] studied the influences of panel type, stiffener cross-section shapes and stiffener direction on the bearing capacity, stiffness and energy dissipation capacity of plane walls and stiffened plane walls.
Setting shear connectors between steel plates and reinforced concrete slabs can enhance the coordination of force between them and give full play to the material performance [22]. Using bolts to connect the steel plates and concrete slabs of shear walls is believed to contribute to good seismic performance [23]. There is a possibility of energy dissipation in the shear connection between the lateral load-resisting system and the slab, which further increases the energy dissipation capacity of the system. The effects of a partial combination and a partial strength connection between concrete slabs and steel beams on the seismic response of composite frames were evaluated through experimental and numerical analysis and it was found that specimens with intermedium and low-shear connection degrees showed the most advantageous performances in terms of ductility and energy dissipation [24]. The mechanical properties of single and double fishplate connectors between SPSW structures and steel frames were investigated using monotonic and cyclic loading tests [25]. The ultimate results show that the specimens connected with double fish connectors have better energy dissipation capacity and ductility. El-Sisi et al. [26] studied the impact of different types of welding separations between infill plates and beams or columns on the seismic performance of SPSWs and found that different welding separations would cause different degrees of energy dissipation capacity loss. Paslar et al. [27] explored the influence of changes in the type of interconnections between infill plate and boundary elements on changes in the ultimate strength, energy absorption and stiffness of SPCSWs. Wang et al. [28] proposed a new prefabricated steel plate–concrete composite shear wall with prefabricated joints connected by fishplates. Finite element analysis was used to explore the bearing performance of composite shear walls with fishplate bite connections and fishplate butting connections, and a calculation method for the bearing capacity of a prefabricated composite shear wall was proposed.
Most of the studies that have improved the understanding of the mechanical properties of SPCSWs focus on the influence of the steel plate shape, material strength and material combination on the performance of shear walls, and there are relevant studies on the connection between the shear wall and the surrounding structure. However, the current fact is that there are few studies on SPCSWs with fishplate connections and no studies on the relationship between lap length and the performance of SPCSWs. In addition, SPCSW design does not consider the connection to the surrounding structure, generally envisaged as buttweld connections, while the fishplate lap connection tends to be applied in construction. Therefore, the main research purpose of this paper is to explore the use of fishplate lap connections to achieve the performance standard of SPCSWs by studying the influence of fishplate thickness and fishplate lap length on the seismic performance of SPCSWs with fishplate connections, which has engineering innovation significance.

2. Finite Element Model of Steel Plate—Concrete Composite Shear Wall

2.1. Parameter Design of Shear Wall

A steel plate–concrete composite shear wall and a steel plate–concrete composite shear wall with a fishplate connection that use C40 concrete and Q345 steel are modeled as GBSW and YWBSW. The main parameters and the cross-sections of the models are shown in Table 1 and Figure 1, respectively, where H, L and b, respectively, represent the height, section length and section width (wall thickness) of the shear wall, and Hs, Ls and bs, respectively, represent the height, section length and section width of the steel plate. The fishplate thickness (tf) is 12 mm, the width is 300 mm and the lap length between the fishplate and the steel plate is 150 mm. n is the axial compression ratio calculated according to reference [29], as shown in Equation (1):
n = N f c A c + f a A a
where n is the design value of the axial compression ratio; N is the design value of axial pressure; fc is the design value of the concrete axial compressive strength; fa is the design value of the steel plate compressive strength; Ac is concrete sectional area; and Aa is the steel plate sectional area. As the limit value of the axial compression ratio of the steel plate composite shear wall is 0.6 [29], n = 0.3 is adopted in this paper for safety.
The distribution spacing of the steel bar with a diameter of 25 mm along the section length is 142 mm, and along the section width, it is 95 mm. A stud with a diameter of 9 mm is arranged on the I-steel and steel plate. The distribution spacing along the height of the I-steel is 200 mm, and along the section width, it is 100 mm; the stud spacing on the steel plate is 300 mm.

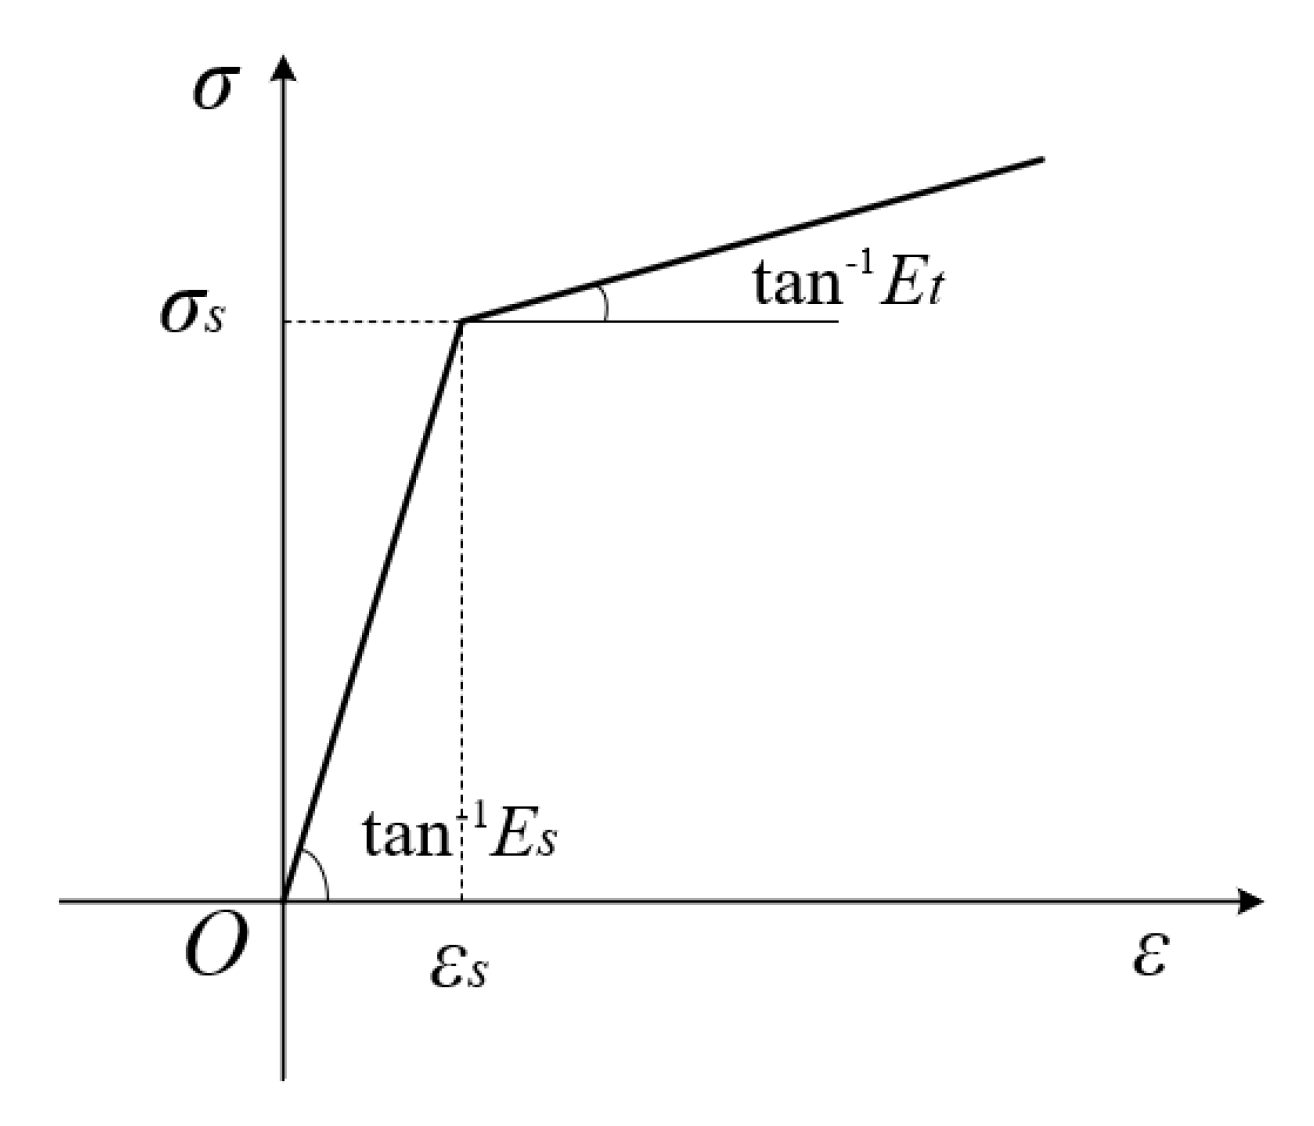
2.2. Establishment of Finite Element Model

In the two shear wall models, solid element C3D8R is adopted for the concrete; the shell element S4R is adopted for the steel plate, fishplate and weld; and the truss element T3D2 is adopted for the steel bar and stud.
The density of the Q345 steel is 7850 kg/m3, the elastic modulus is Es = 2.06 × 10⁵ N/mm2 and the yield stress is fy = 345 N/mm2. The ideal linear hardening elastoplastic model, plotted in Figure 2, is selected for its constitutive relationship, where the tangent modulus of the hardening stage is Et = 0.01 Es.
The concrete damaged plasticity model provided by ABAQUS is adopted for concrete, and its basic parameters are shown in Table 2. The flow potential used for this model is the Drucker–Prager hyperbolic function, where φ is the dilation angle measured in the p–q plane at high confining pressure, ε is the flow potential eccentricity and the default value is 0.1, which implies that the material has almost the same dilation angle over a wide range of confining pressure stress values. In addition, the model uses the yield function of Lubliner et al. (1989), plus the modification proposed by Lee and Fenves (1998), where fb0/fc0 is the ratio of biaxial ultimate compressive strength to uniaxial ultimate compressive strength (the default value is 1.16), and K is the ratio of the second stress invariant on the tensile meridian to that on the compressive meridian (the default value is 2/3). In ABAQUS/Standard, the concrete damage plastic model is regularized by allowing the stress outside the yield surface and using the generalization of Duvaut–Lions viscoplastic regularization, where η is the viscosity parameter representing the relaxation time of the viscoplastic system. Using the viscoplastic regularization with a small viscosity parameter value, set as 0.0002 in this study (small compared with the characteristic time increment), usually helps improve the convergence rate of the model in the softening regime without compromising results. The uniaxial stress–strain relationship of concrete provided in Appendix C.2 of reference [30] is adopted.
In the shear wall model, the steel plate, fishplate, stud and reinforcement are embedded into the concrete wall as embedded bodies. The “Tie” constraint is used between the shear stud and the embedded steel plate and between the steel plate and fishplate to simulate welding. The mesh size is determined to be 100 mm with an aspect ratio of 1.0 through a trial control of the mesh division.
According to the existing relevant tests [31], during the test loading process, the stiffness of the loading beam at the top of the shear wall and the foundation beam at the bottom is relatively large and is not within the scope of analysis. To simplify the model and improve the analysis speed, no loading beam is set at the top of the model. As shown in Figure 3, a reference point is set at the center of the upper part of the shear wall and coupled with the top surface. The boundary condition U1 = UR2 = UR3 = 0 is applied at the reference point; that is, the displacement of the top along the X-direction and the rotation angles in the Y- and Z-directions are constrained, and the vertical concentrated force load and lateral cyclic load are added. The bottom of the shear wall is completely fixed.
In this paper, the applied vertical load is mainly determined by the axial compression ratio of the shear walls. The loading method is referred to in reference [32], declaring that the displacement is used to control the loading. First, by studying the stress condition of the shear wall under monotonic loading, the yield displacement is calculated to be about 8 mm according to the obtained load–displacement curve. Hence, the loading displacement, Δy, of each model is set to be 8 mm to facilitate the comparison between the two types of shear wall models. The displacement is applied according to 2 mm, −2 mm, 4 mm, −4 mm, 8 mm, −8 mm, 16 mm, −16 mm, …, −40 mm for loading. Before the displacement is 16 mm, each stage is loaded once, and each stage is loaded twice after 16 mm.

2.3. Simulation Test Verification

In order to verify the accuracy of the model in this paper, the test method and parameters in reference [31] are used to establish shear wall model SPRCW3 according to the same size and material parameters. The wall size is 2060 mm × 800 mm × 150 mm; the steel plate size is 2460 mm × 700 mm × 5 mm; and axial pressure is 3050 kN.
The skeleton curve of the model is compared with the peak horizontal displacement–load curve obtained by finite element simulation, as shown in Figure 4. It can be seen that the load–displacement curve of the simulation results is almost consistent with the test results, and their initial stiffness, ultimate axial compression-bearing capacity and yield point displacement are close. However, after reaching the peak point, the descending curve amplitude of the finite element model is smaller than that of the test, which is due to the fact that the finite element model is too ideal to fully simulate the material properties of concrete after cracking failure. In general, the simulation results are in good agreement with the test results to a certain extent, and the simulation results are reliable.

3. Parametric Analysis

3.1. Effect of Fishplate Thickness on the Performance of the Composite Wall

In order to consider the influence of fishplate thickness on the performance of the composite shear wall, the fishplate thicknesses, tf, are set as 4 mm, 5 mm, 6 mm, 8 mm, 10 mm, 12 mm, 14 mm, 16 mm and 18 mm, and the steel plate–concrete composite shear wall model with a steel plate thickness of 12 mm (GBSW-12) is added for comparison. Model size, shear-span ratio λ, axial compression ratio n, lap length lo and other parameters remain unchanged as shown in Table 3.

3.1.1. Hysteresis Curve and Skeleton Curve

The hysteresis curves and skeleton curves of models with different fishplate thicknesses obtained by finite element analysis are shown in Figure 5 and Figure 6. The results of yield load, yield displacement and peak load are shown in Table 4.
The following can be seen in Figure 5 and Figure 6 and Table 4:
(1) As fishplate thickness increases, the yield loads and peak loads of the models increase gradually. Compared with the model with a fishplate thickness of 4 mm, the yield load of the YWBSW models with a fishplate thickness of 5~18 mm increases by 0.8%, 1.3%, 2.7%, 3.1%, 4.7%, 5.3%, 5.6% and 6.0%, and the peak load increases by 0.9%, 1.5%, 2.6%, 3.4%, 5.1%, 5.7%, 6.2% and 6.0%, indicating that increasing fishplate thickness can slightly increase the bearing capacity of an SPCSW with a fishplate connection.
(2) When the model enters the yield stage, the yield point displacement of the YWBSW model has few differences and is controlled within 6.68~7.17 mm, gradually increasing with the increase in fishplate thickness. The yield displacement of the YWBSW models with a fishplate thickness of 5~18 mm increased by 1.2%, 1.9%, 3.0%, 4.0%, 6.0%, 6.3%, 6.7% and 7.3% compared with those with a fishplate thickness of 4 mm.
(3) The maximum bearing capacity of YWBSW-06 with a fishplate thickness of 6 mm and a steel plate thickness of 12 mm is greater than that of GBSW-12 with a steel plate thickness of 12 mm, indicating that when the fishplate thickness is not less than 6 mm the strength of the shear wall can be guaranteed to achieve equal strength with the core steel plate.

3.1.2. Stiffness Degradation

The stiffness results of models with different fishplate thicknesses are shown in Table 5. The following can be observed:
(1) Under the same loading mode, the stiffnesses of shear walls with different fishplate thicknesses have the same change trend and decrease with the increase in displacement.
(2) The change in fishplate thickness has little effect on the stiffnesses of shear walls, which increases with the increase in fishplate thickness. The initial stiffness range of the test model is 1648~1679 kN/mm, and the final stiffness range is 204~216 kN/mm. Compared with the model with a thickness of 4 mm, the initial stiffness of the model with a thickness of 18 mm increases by 1.9%, and the final stiffness increases by 5.9%.

3.1.3. Energy Dissipation

Figure 7 shows the energy dissipation capacity curve of the YWBSW model. The energy dissipation coefficient and energy dissipation at various levels for models with different fishplate thicknesses at different displacement times are shown in Table 6 and Table 7.
The following can be seen in Figure 7 and Table 6 and Table 7:
(1) With the increase in loading displacement, the energy dissipation coefficient of models with different fishplate thicknesses increases gradually, and the energy dissipation coefficient at the final displacement ranges from 1.6220 to 1.7314.
(2) The change in fishplate thickness has little effect on the cumulative energy dissipation of a shear wall, which increases with the increase in fishplate thickness and ranges from 2.716 × 10⁶ kN·mm to 2.976 × 10⁶ kN·mm. Compared with the model with a thickness of 4 mm, the cumulative energy dissipation of the model with a thickness of 18 mm increases by 5.8%.
(3) When the fishplate is larger than 6 mm, the energy dissipation values of the YWBSW models are higher than those of GBSW-12, which has the same steel plate thickness of 12 mm.

3.2. Effect of Lap Length of Fishplate on Performance of Composite Wall

In order to consider the effect of the length of the lap part of the fishplate and the embedded steel plate on the performance of the SPCSW with a fishplate connection, the lap lengths, lo, are changed to 50 mm, 75 mm, 100 mm, 125 mm, 150 mm, 175 mm, 200 mm, 225 mm and 250 mm. Model size; shear–span ratio, λ; axial compression ratio, n; fishplate thickness, tf; and other parameters remain unchanged, as shown in Table 8.

3.2.1. Hysteresis Curve and Skeleton Curve

The hysteresis curves and skeleton curves of models with different lap lengths obtained via finite element analysis are shown in Figure 8 and Figure 9. The results of yield load, yield displacement and peak load are shown in Table 9.
The following can be seen in Figure 8 and Figure 9 and Table 9:
(1) The yield load and peak load of a shear wall increase with the increase in lap length. Compared with the models with a lap length of 50 mm, the yield load of YWBSW models with lap lengths of 75 mm, 100 mm, 125 mm, 150 mm, 175 mm, 200 mm, 225 mm and 250 mm increases by 0.5%, 1.5%, 2.3%, 2.4%, 2.9%, 2.9%, 3.2% and 4.3%, respectively, and the peak load increases by 0.2%, 1.1%, 2.0%, 2.5%, 2.8%, 3.0%, 3.2% and 4.2%, respectively, illustrating that increasing lap length can slightly increase the bearing capacity of an SPCSW with a fishplate connection.
(2) When the model enters the yield stage, the yield point displacement of the YWBSW model has few differences and is controlled within 6.86~7.19 mm, increasing with the increase in the lap length. The yield displacement of YWBSW models with lap lengths of 75 mm, 100 mm, 125 mm, 150 mm, 175 mm, 200 mm, 225 mm and 250 mm increases by 0.0%, 1.2%, 2.3%, 3.2%, 3.2%, 3.5%, 3.6% and 4.8%, respectively, compared with models with a lap length of 50 mm.

3.2.2. Stiffness Degradation

The stiffness results of models with different lap lengths are shown in Table 10. The following can be observed:
(1) Under the same loading mode, the stiffnesses of shear walls with different lap lengths have the same change trends and decrease with an increase in displacement.
(2) The change in lap length has little effect on the stiffness of shear walls, which increases with the increase in lap length. The initial stiffness range of the test model is 1661~1674 kN/mm, and the final stiffness range is 209~216 kN/mm. Compared with the model with a lap length of 50 mm, the initial stiffness and final stiffness of the model with a lap length of 250 mm increase by 0.8% and 3.4%, respectively.

3.2.3. Energy Dissipation

Figure 10 shows the correlation curve of the energy dissipation capacity of the YWBSW model. The energy dissipation coefficient and energy dissipation at various levels of models with different lap lengths at different displacement times are shown in Table 11 and Table 12.
The following can be seen in Figure 10 and Table 11 and Table 12:
(1) As loading displacement increases, the energy dissipation coefficient of the models with different lap lengths gradually increases, and the energy dissipation coefficient at the final displacement ranges from 1.6465 to 1.7260.
(2) The change in lap length has little effect on the cumulative energy dissipation of the shear wall, which increases with the increase in lap length and ranges from 2.817 × 10⁶ kN·mm to 2.984 × 10⁶ kN·mm. Compared with the model with a lap length of 50 mm, the cumulative energy dissipation of the model with a lap length of 250 mm increases by 6.3%.

4. Conclusions and Future Research

In this paper, the hysteretic behavior of steel plate–concrete composite shear walls with fishplate connections under constant axial force and a lateral cyclic load is analyzed using the finite element method. The hysteresis curve, skeleton curve and bearing capacity of the models are compared and analyzed, and the effects of fishplate thickness and lap length on the hysteretic behavior of steel plate–concrete composite shear walls with fishplate connections are investigated. The following conclusions are obtained:
(1) The change in fishplate thickness has little effect on the seismic performance of an SPCSW with a fishplate connection. Increasing fishplate thickness contributes to the slight increase in the bearing capacity and energy dissipation of the SPCSW and has little influence on stiffness degradation. When fishplate thickness is more than half the steel plate thickness, the strength and energy dissipation of the SPCSW with a fishplate connection can reach the level of an SPCSW without a fishplate connection.
(2) The lap length of the steel plate and fishplate has a certain influence on the seismic performance of an SPCSW with a fishplate connection. The bearing capacity and stiffness of the SPCSW increase with the increase in lap length. When lap length is greater than 50 mm, the strength, stiffness and energy dissipation capacity of an SPCSW with a fishplate connection are superior to those without fishplate connections.
(3) Engineering suggestions on fishtail plate connections are put forward. A fishplate that helps improve the strength, stiffness and energy dissipation of an SPCSW can be as thick as the core steel plate of the SPCSW at most in practice. Considering the convenience of fishplate welding construction, it is recommended that the lap length should be 100~150 mm.
Suggested lines of future research are as follows:
(1) Further discussion is needed on which loading system can be used to study the stability performance of specimens under a constant axial force and horizontal cyclic load in a more realistic and convenient manner.
(2) Tests on the bearing capacity, stiffness and energy dissipation of an SPCSW with a fishplate connection should be carried out to furtherly improve the calculation formula.

Author Contributions

Conceptualization, Y.W., K.S. and J.J.; data curation, Y.W., X.S., K.S. and J.J.; formal analysis, J.J.; funding acquisition, X.S. and K.S.; investigation, Y.W., X.S. and K.S.; methodology, Y.W. and J.J.; project administration, Y.W. and J.J.; resources, Y.W., X.S., K.S. and J.J.; software, Y.W., Y.Z. and J.J.; supervision, X.S.; Validation, Y.W. and J.J.; writing—original draft, Y.W., Y.Z. and J.J.; writing—review and editing, Y.Z. All authors have read and agreed to the published version of the manuscript.

Funding

This research received no external funding.

Institutional Review Board Statement

Not applicable.

Informed Consent Statement

Not applicable.

Data Availability Statement

Not applicable.

Conflicts of Interest

The authors declare no conflict of interest.

References

  1. Japan Association of Building Construction Technicians. 100 Typical Examples of Japanese Structural Technology; China Building Industry Press: Beijing, China, 2005. [Google Scholar]
  2. Ghomi, T. Hysteretic characteristics of unstiffened plate shear panels. Thin. Wall. Struct. 1995, 12, 145–162. [Google Scholar]
  3. Li, G.Q.; Zhang, X.G.; Shen, Z.Y. Experimental study on shear hysteretic behavior of steel plate encased concrete shear wall panels. Ind. Build. 1995, 30, 32–35. [Google Scholar]
  4. Wright, H.D. The behaviour of composite walling under construction and service loading. J. Const. Steel. Res. 1995, 35, 257–275. [Google Scholar] [CrossRef]
  5. Hitaka, T.; Matsui, C. Strength and behavior of steel-concrete composite bearing wall. In Proceedings of the 6th ASCCS Conference on Composite and Hybrid Structures, Los Angeles, CA, USA, 22–24 March 2000. [Google Scholar]
  6. Emori, K. Compressive and shear strength of concrete filled steel box wall. J. Steel Struct. 2002, 26, 29–40. [Google Scholar]
  7. Guo, Y.L.; Dong, Q.L. Research and application of steel plate shear wall in high-rise buildings. Steel Constr. 2005, 20, 1–6. [Google Scholar]
  8. Giannuzzi, D.; Ballarini, R.; Huckelbridge, A., Jr.; Pollino, M.; Valente, M. Braced ductile shear panel: New seismic-resistant framing system. J. Struct. Eng. 2014, 140, 04013050. [Google Scholar] [CrossRef] [Green Version]
  9. Li, R. Study on Hysteretic Behavior of Steel Plate Shear Wall and Composite Shear Wall. Master Thesis, Harbin Institute of Technology, Harbin, China, 2011. [Google Scholar]
  10. Cui, L.F.; Jiang, H.J.; Lv, S.W. Comparative study on seismic performance of built-in steel plate and built-in steel truss concrete composite shear wall. J. Build. Struct. 2013, 34, 132–140. [Google Scholar]
  11. Zhu, A.P. Seismic Behavior of Embedded Steel Plate Reinforced C80 Concrete Composite Shear Walls. Ph.D. Thesis, China Academy of Building Research, Beijing, China, 2015. [Google Scholar]
  12. Nie, J.G.; Bu, F.M.; Fan, J.S. Experimental research on seismic behavior of low shear-span ratio composite shear wall with double steel plates and infill concrete. J. Build. Struct. 2011, 32, 74–81. [Google Scholar]
  13. Nie, J.G.; Bu, F.M.; Fan, J.S. Quasi-static test on low shear-span ratio composite shear wall with double steel plates and infill concrete under high axial compression ratio. Eng. Mech. 2013, 30, 60–66. [Google Scholar]
  14. Bu, F.M.; Nie, J.G.; Fan, J.S. Experimental study on seismic behavior of medium and high shear-span ratio composite shear wall with double steel plates and infill concrete under high axial compression ratio. J. Archit. Struct. 2013, 34, 91–98. [Google Scholar]
  15. Zhu, A.P.; Xiao, C.Z.; Chen, T.; Tian, C.Y. Experimental study on seismic behavior of embedded steel plate reinforced concrete shear walls with 1.0 shear-span-ratio. China Civ. Eng. J. 2016, 49, 49–56. [Google Scholar]
  16. Arabzadeh, A.; Hamid, R.K.N.K. Numerical and experimental investigation of composite steel shear wall with opening. Int. J. Steel Struct. 2017, 17, 1379–1389. [Google Scholar] [CrossRef]
  17. Wang, W.; Wang, Y.; Lu, Z. Experimental study on seismic behavior of steel plate reinforced concrete composite shear wall. Eng. Struct. 2018, 160, 281–292. [Google Scholar] [CrossRef]
  18. Wang, W.; Ren, Y.Z.; Lu, Z.; Song, J.J.; Han, B.; Zhou, Y. Experimental study of the hysteretic behaviour of corrugated steel plate shear walls and steel plate reinforced concrete composite shear walls. J. Constr. Steel. Res. 2019, 160, 136–152. [Google Scholar] [CrossRef]
  19. Long, J.T. Study on Seismic Performance of Newly Modular Assembled Single-Layer Composite Shear Wall. Master Thesis, Guangzhou University, Guangzhou, China, 2019. [Google Scholar]
  20. Chen, Y. Study on Seismic Performance of New Modular Assembled Double-Layer Composite Shear Wall. Master Thesis, Guangzhou University, Guangzhou, China, 2019. [Google Scholar]
  21. Shallan, O.A.; Maaly, H.M.; Elgiar, M.M.; El-Sisi, A.A. Effect of stiffener characteristics on the seismic behavior and fracture tendency of steel shear walls. Fract. Struct. Integr. 2020, 14, 104–115. [Google Scholar] [CrossRef]
  22. Guo, Y.L.; Dong, Q.L.; Zhou, M. Elastic behavior and minimum restraining stiffness of buckling-restrained steel plate shear wall. J. Build. Struct. 2009, 30, 40–47. [Google Scholar]
  23. Astaneh-Asl, A. Seismic Behavior and Design of Composite Steel Plate Shear Walls; Structural Steel Educational Council: Moraga, CA, USA, 2002; pp. 7–8. [Google Scholar]
  24. Vasdravellis, G.; Valente, M.; Castiglioni, C.A. Dynamic response of composite frames with different shear connection degree. J. Const. Steel. Res. 2009, 65, 2050–2061. [Google Scholar] [CrossRef]
  25. Li, G.; Qiu, Z.; Yang, Z. Behavior of double fish plate connector between steel plate shear wall structure and steel frame. In Proceedings of the Modular and Offsite Construction (MOC) Summit, Edmonton, AB, Canada, 19–23 May 2015. [Google Scholar]
  26. El-Sisi, A.A.; Elgiar, M.M.; Maaly, H.M.; Shallan, O.A.; Salim, H.A. Effect of Welding Separation Characteristics on the Cyclic Behavior of Steel Plate Shear Walls. Buildings 2022, 12, 879. [Google Scholar] [CrossRef]
  27. Paslar, N.; Farzampour, A. Effects of Infill Plate’s Interconnection and Boundary Element Stiffness on Steel Plate Shear Walls’ Seismic Performance. Materials 2022, 15, 5487. [Google Scholar] [CrossRef] [PubMed]
  28. Wang, Y.; Wang, Z.C.; Zhao, J.; Qu, S.Z. Analysis of mechanical properties of prefabricated composite shear wall connected with fishtail plate. J. China Three Gorges Univ. (Nat. Sci.) 2021, 43, 47–53. [Google Scholar]
  29. Ministry of Housing and Urban-Rural Development of the People’s Republic of China. JGJ/T380-2015 Technical Specification for Steel Plate Shear Walls; China Building Industry Press: Beijing, China, 2015. [Google Scholar]
  30. GB50010-2010; Code for Design of Concrete Structures. China Building Industry Press: Beijing, China, 2010.
  31. Jiang, D.Q. Experimental Study on the Flexural Behavior of High Strength Concrete Steel Plate Composite Shear Wall. Master Thesis, China Academy of Building Research, Beijing China, 2011. [Google Scholar]
  32. Wu, S.Y. Specification of Testing Methods for Earthquake Resistant Building JGJ101-96; China Academy of Building Research: Beijing, China, 2005. [Google Scholar]
Figure 1. Cross-sections of shear wall models (mm): (a) GBSW; (b) YWBSW.
Buildings 12 02245 g001
Figure 2. Stress–strain curve of steel.
Buildings 12 02245 g002
Figure 3. Boundary conditions.
Buildings 12 02245 g003
Figure 4. Skeleton curve of test and simulation.
Buildings 12 02245 g004
Figure 5. Hysteresis curve of models with different fishplate thicknesses. (a) tf = 4 mm; (b) tf = 5 mm; (c) tf = 6 mm; (d) tf = 8 mm; (e) tf = 10 mm; (f) tf = 12 mm; (g) tf = 14 mm; (h) tf = 16 mm; (i) tf = 18 mm; (j) GBSW-12.
Buildings 12 02245 g005aBuildings 12 02245 g005b
Figure 6. Skeleton curve of models with different fishplate thicknesses. (a) Fishplate thickness, 4~10 mm; (b) fishplate thickness, 10~18 mm.
Buildings 12 02245 g006
Figure 7. Correlation curve of the energy dissipation capacity of models with different fishplate thicknesses. (a) Equivalent damping coefficient; (b) energy dissipation coefficient; (c) cumulative energy dissipation coefficient; (d) energy dissipation at each stage.
Buildings 12 02245 g007
Figure 8. Hysteresis curve of models with different lap lengths. (a) lo = 50 mm; (b) lo = 75 mm; (c) lo = 100 mm; (d) lo = 125 mm; (e) lo = 150 mm; (f) lo = 175 mm; (g) lo = 200 mm; (h) lo = 225 mm; (i) lo = 250 mm.
Buildings 12 02245 g008aBuildings 12 02245 g008b
Figure 9. Skeleton curve of models with different lap lengths. (a) Lap length 50~150 mm; (b) lap length 150~250 mm.
Buildings 12 02245 g009
Figure 10. Correlation curve of the energy dissipation capacity of models with different lap lengths. (a) Equivalent damping coefficient; (b) energy dissipation coefficient; (c) cumulative energy dissipation coefficient; (d) energy dissipation at each stage.
Buildings 12 02245 g010
Table 1. Main parameters of shear wall models.
Model NumberConcrete StrengthSteel TypeShear Wall
H × L × b
(mm × mm × mm)
Steel Plate
Hs × Ls × bs
(mm × mm × mm)
tf (mm)I-Steel Typen
GBSWC40Q3454200 × 2850 × 7004200 × 1850 × 12--300 × 200 × 16 × 200.3
YWBSWC40Q3454200 × 2850 × 7004200 × 1550 × 1212300 × 200 × 16 × 200.3
Table 2. Parameters of concrete damaged plasticity constitutive model.
φεfb0/fc0Kη
300.11.160.66670.0002
Table 3. Parameters of shear wall models with different fishplate thicknesses.
Model NumberH/mmL/mmb/mm λ ntf/mmlo/mm
YWBSW-04420028507001.50.34150
YWBSW-05420028507001.50.35150
YWBSW-06420028507001.50.36150
YWBSW-08420028507001.50.38150
YWBSW-10420028507001.50.310150
YWBSW-12420028507001.50.312150
YWBSW-14420028507001.50.314150
YWBSW-16420028507001.50.316150
YWBSW-18420028507001.50.318150
GBSW-12420028507001.50.30150
Table 4. Mechanical performance of models with different fishplate thicknesses.
Model NumberYield Load (kN)Yield Displacement (mm)Peak Load (kN)
YWBSW-047255.366.688375.60
YWBSW-057310.486.768450.20
YWBSW-067348.796.818499.36
YWBSW-087449.606.888592.40
YWBSW-107477.376.958661.64
YWBSW-127595.497.088800.54
YWBSW-147642.377.108852.78
YWBSW-167661.607.138894.12
YWBSW-187693.877.178931.64
GBSW-127320.136.778470.39
Table 5. Stiffness of models with different fishplate thicknesses.
Model NumberStiffness at Each Stage (kN/mm)
2 mm4 mm8 mm16 mm24 mm32 mm40 mm
YWBSW-041648.901441.33969.71505.80324.92246.96204.26
YWBSW-051651.231443.05972.67510.74327.54248.77205.68
YWBSW-061653.281444.42974.03514.13329.70250.18206.69
YWBSW-081657.861447.85981.56520.47333.96253.07208.73
YWBSW-101662.381452.51982.04525.32337.34255.48210.60
YWBSW-121666.831455.97988.60532.60340.54258.11212.74
YWBSW-141672.391463.60994.47535.56342.66259.61213.76
YWBSW-161676.721467.83994.78536.13344.56260.66214.77
YWBSW-181679.921465.21995.46540.90347.05262.70216.37
GBSW-121653.521447.09969.62510.68327.66249.48206.48
Table 6. Energy dissipation coefficient for models with different fishplate thicknesses.
Model NumberEnergy Dissipation Coefficient at Each Stage
2 mm4 mm8 mm16 mm24 mm32 mm40 mm
YWBSW-040.00220.19570.75091.13921.34911.50791.6220
YWBSW-050.00230.19590.74641.12061.34011.50341.6236
YWBSW-060.00230.19660.74781.11231.33301.50071.6292
YWBSW-080.00250.19710.74201.09491.32301.49671.6358
YWBSW-100.00260.19830.74181.08431.31761.49491.6409
YWBSW-120.00270.19880.73041.06771.31811.49591.6465
YWBSW-14000240.20640.75681.12931.37531.56621.7264
YWBSW-160.00250.20800.76601.13631.37391.57171.7314
YWBSW-180.00310.19970.73771.05341.31021.50121.6613
GBSW-120.00240.19690.75311.11701.34001.50111.6267
Table 7. Energy dissipation at all levels for models with different fishplate thicknesses.
Model NumberEnergy Dissipation at Each Stage (kN·mm)Cumulative
Energy Dissipation
2 mm4 mm8 mm16 mm24 mm32 mm40 mm
YWBSW-0415512193,396289,837503,515764,0161,060,53827,164,39
YWBSW-0515512893,255288,005504,441767,8831,069,7482,728,477
YWBSW-0615515093,480287,54450,180771,1691,078,7732,741,311
YWBSW-0816516793,481286,741508,147778,1011,093,9152,765,568
YWBSW-1017521693,464286,656511,544784,7251,107,3892,789,011
YWBSW-1218525292,610286,151516,601793,7231,122,8782,817,234
YWBSW-1416541496,548301,020540,135831,5421,178,5512,953,227
YWBSW-1616554497,659303,573543,467837,9701,187,4862,975,716
YWBSW-1820534993,921286,436524,278811,1471,152,6442,873,797
GBSW-1216518893,822287,285504,169768,9201,076,8562,736,256
Table 8. Parameters of shear wall models with different lap lengths.
Model NumberH/mmL/mmb/mm λ lo/mmntf/mm
YWBSW-50420028507001.5500.312
YWBSW-75420028507001.5750.312
YWBSW-100420028507001.51000.312
YWBSW-125420028507001.51250.312
YWBSW-150420028507001.51500.312
YWBSW-175420028507001.51750.312
YWBSW-200420028507001.52000.312
YWBSW-225420028507001.52250.312
YWBSW-250420028507001.52500.312
GBSW-12420028507001.500.312
Table 9. Mechanical performance of models with different lap lengths.
Model NumberYield Load (kN)Yield Displacement (mm)Peak Load (kN)
YWBSW-507414.346.868588.51
YWBSW-757450.316.868606.01
YWBSW-1007524.806.948685.84
YWBSW-1257581.477.028762.45
YWBSW-1507595.497.088800.54
YWBSW-1757625.777.088827.03
YWBSW-2007632.247.108842.33
YWBSW-2257650.077.118861.74
YWBSW-2507733.607.198945.86
GBSW-127320.136.778470.39
Table 10. Stiffnesses of models with different lap lengths.
Model NumberStiffness at Each Stage (kN/mm)
2 mm4 mm8 mm16 mm24 mm32 mm40 mm
YWBSW-501661.291455.76978.85519.25334.04253.95209.57
YWBSW-751662.791456.75982.41520.04334.29254.26210.00
YWBSW-1001664.631458.12988.50525.19337.33256.30211.68
YWBSW-1251666.581459.59990.17529.61339.05257.11212.20
YWBSW-1501666.831455.97988.60532.60340.54258.11212.74
YWBSW-1751669.901461.70991.80534.07341.47258.76213.35
YWBSW-2001671.181462.39992.28534.87341.85259.04213.68
YWBSW-2251672.721463.61993.21536.26343.15259.93214.44
YWBSW-2501674.441465.171000.44541.97347.03262.40216.65
GBSW-121653.521447.09969.62510.68327.66249.48206.48
Table 11. Energy dissipation coefficients of models with different lap lengths.
Model NumberEnergy Dissipation Coefficient at Each Stage
2 mm4 mm8 mm16 mm24 mm32 mm40 mm
YWBSW-500.00200.20420.78121.16491.38181.55951.7020
YWBSW-750.00200.20470.77201.16781.38661.56351.7049
YWBSW-1000.00210.20510.76281.15701.38121.56101.7076
YWBSW-1250.00220.20530.76281.14321.37751.56251.7133
YWBSW-1500.00270.19880.73041.06771.31811.49591.6465
YWBSW-1750.00230.20620.76011.13211.38021.56771.7278
YWBSW-2000.00240.20660.75821.13171.38241.57111.7245
YWBSW-2250.00240.20680.75771.12891.38011.57111.7260
YWBSW-2500.00250.20690.74981.12031.37301.56881.7205
GBSW-120.00240.19690.75311.11701.34001.50111.6267
Table 12. Energy dissipation at all levels of models with different lap lengths.
Model NumberEnergy Dissipation at Each Stage (kN·mm)Cumulative
Energy Dissipation
2 mm4 mm8 mm16 mm24 mm32 mm40 mm
YWBSW-5013533797,823300,527528,315809,2401,138,5992,879,853
YWBSW-7513536297,558301,911530,504812,2221,058,0732,805,643
YWBSW-10014537796,931302,532533,457818,0491,153,8452,910,203
YWBSW-12514548596,895301,554535,034821,5231,161,0902,921,595
YWBSW-15018525292,610286,151516,601793,7231,122,8782,817,234
YWBSW-17515541796,540301,152540,103829,4641,173,6622,946,353
YWBSW-20016541896,365301,472541,586832,1841,176,7202,953,761
YWBSW-22516544196,399301,549542,895835,3441,182,5912,964,236
YWBSW-25017544995,958302,268546,391842,3431,191,0892,983,515
GBSW-1216518893,822287,285504,169768,9201,076,8562,736,256
Publisher’s Note: MDPI stays neutral with regard to jurisdictional claims in published maps and institutional affiliations.

