

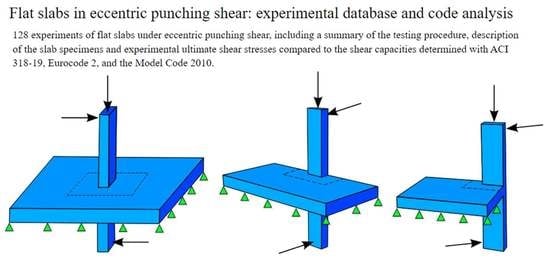
Flat Slabs in Eccentric Punching Shear: Experimental Database and Code Analysis


Abstract
:
1. Introduction
2. Methods
2.1. Overview of Code Provisions
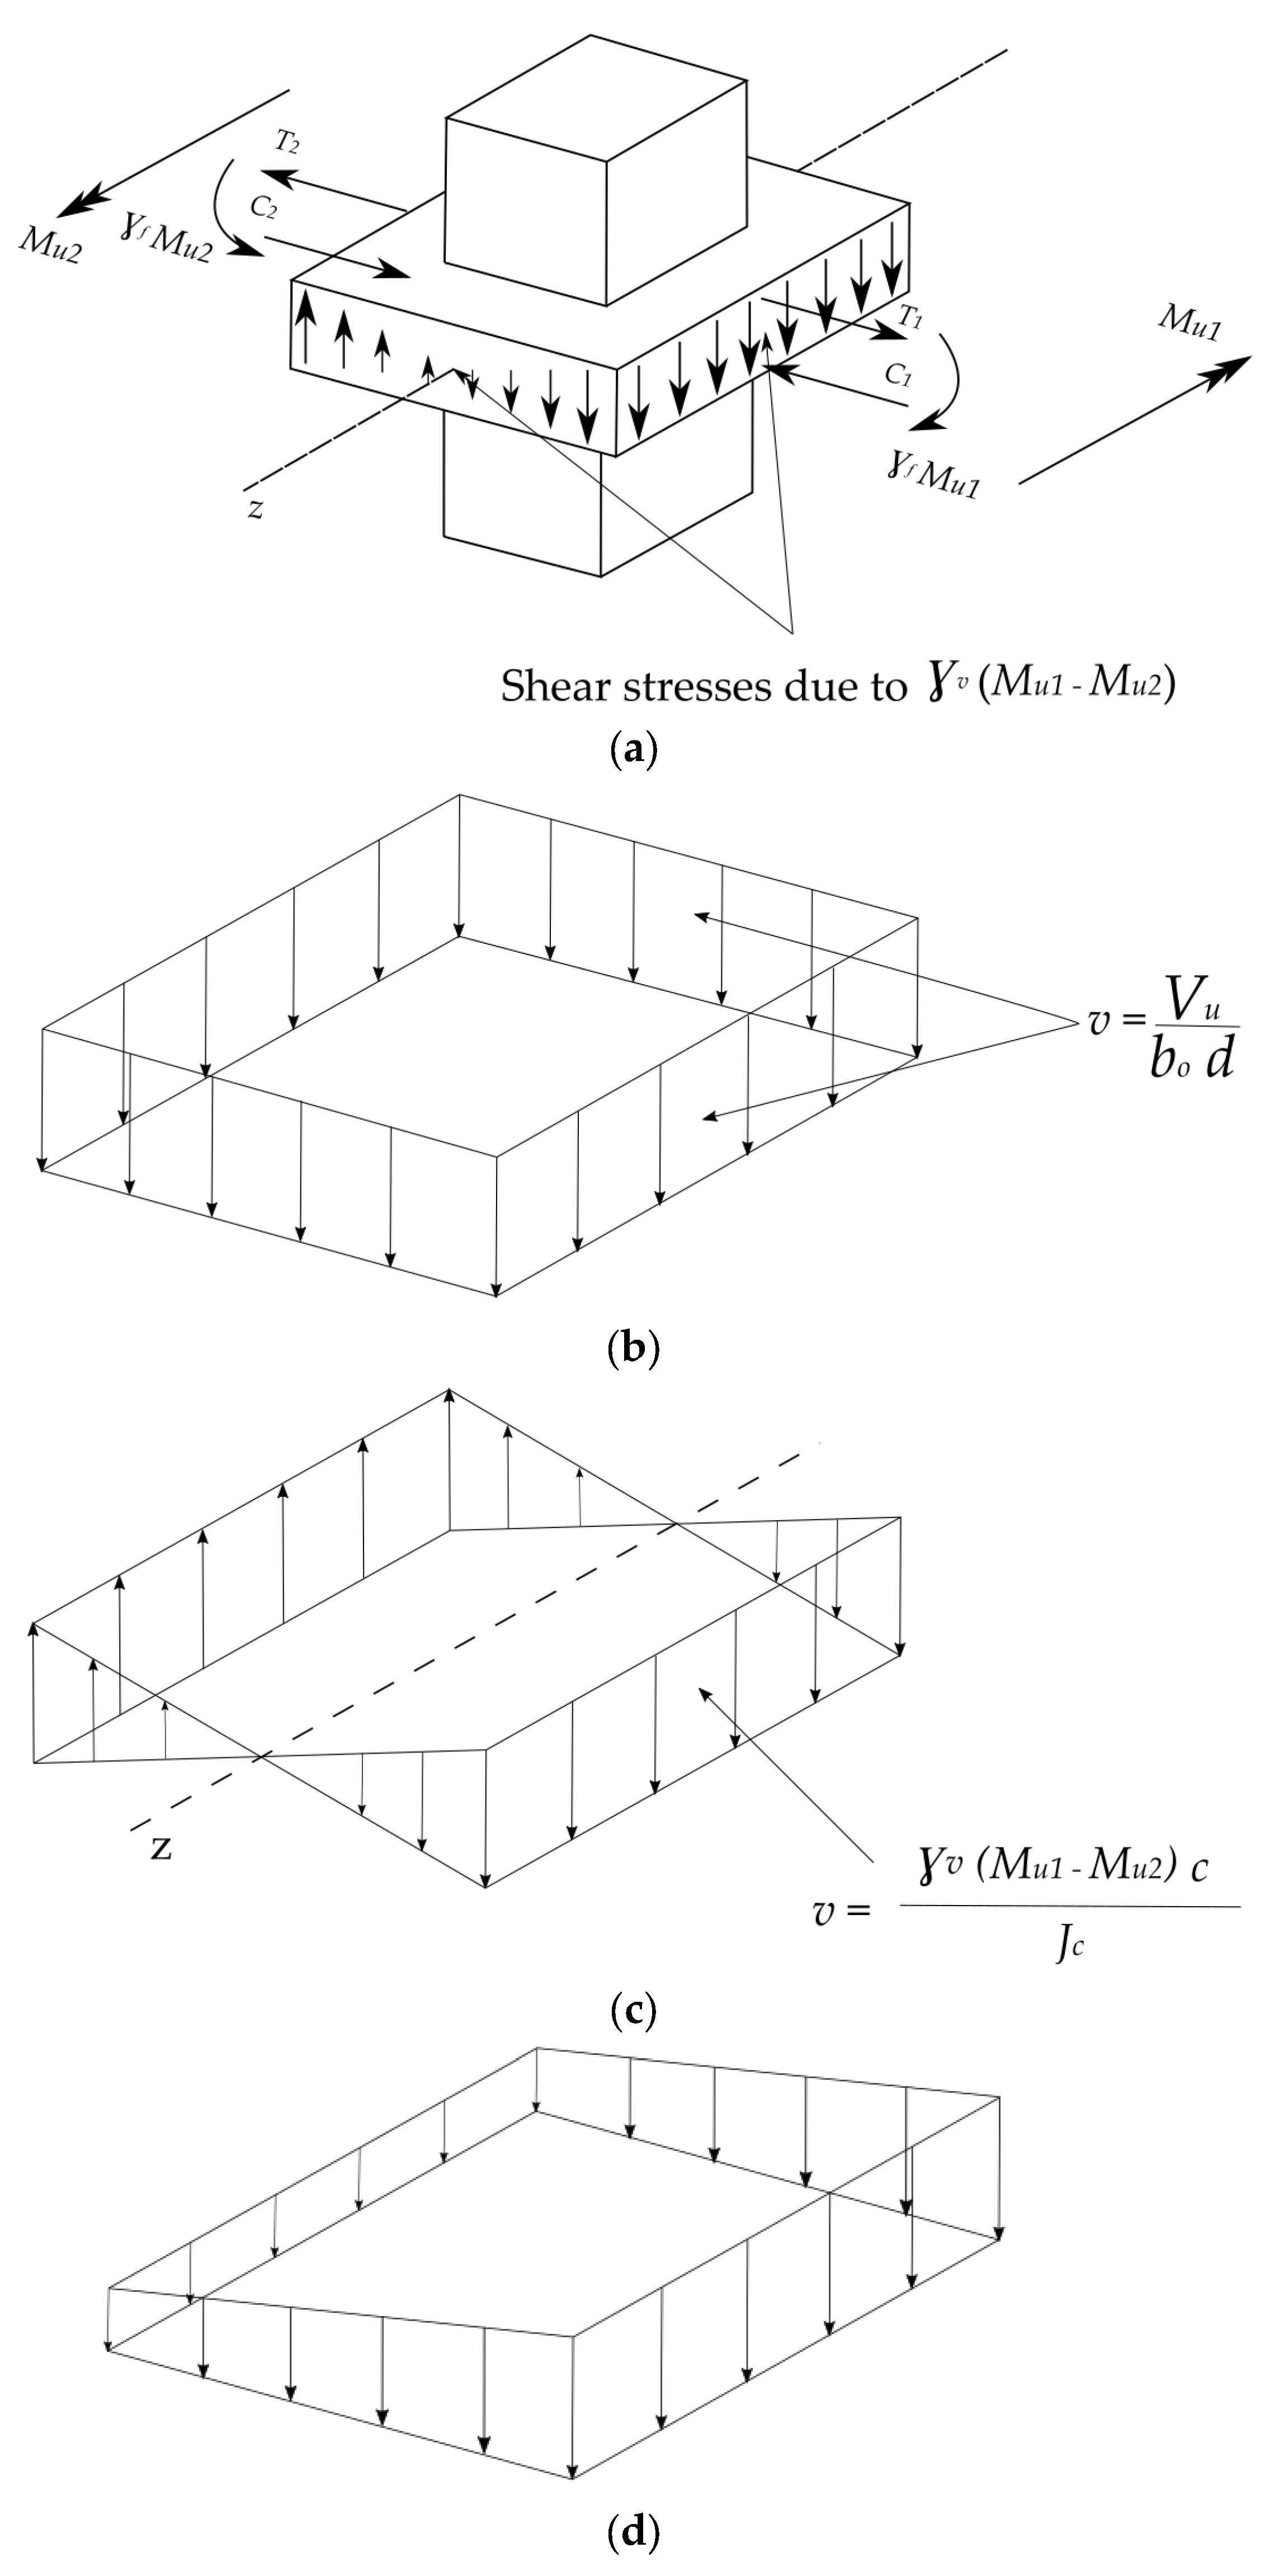
2.1.1. ACI-318-19
2.1.2. NEN-EN 1992-1-1:2005
2.1.3. Model Code 2010
2.2. Database of Eccentric Punching Shear Experiments
2.2.1. Development of the Database
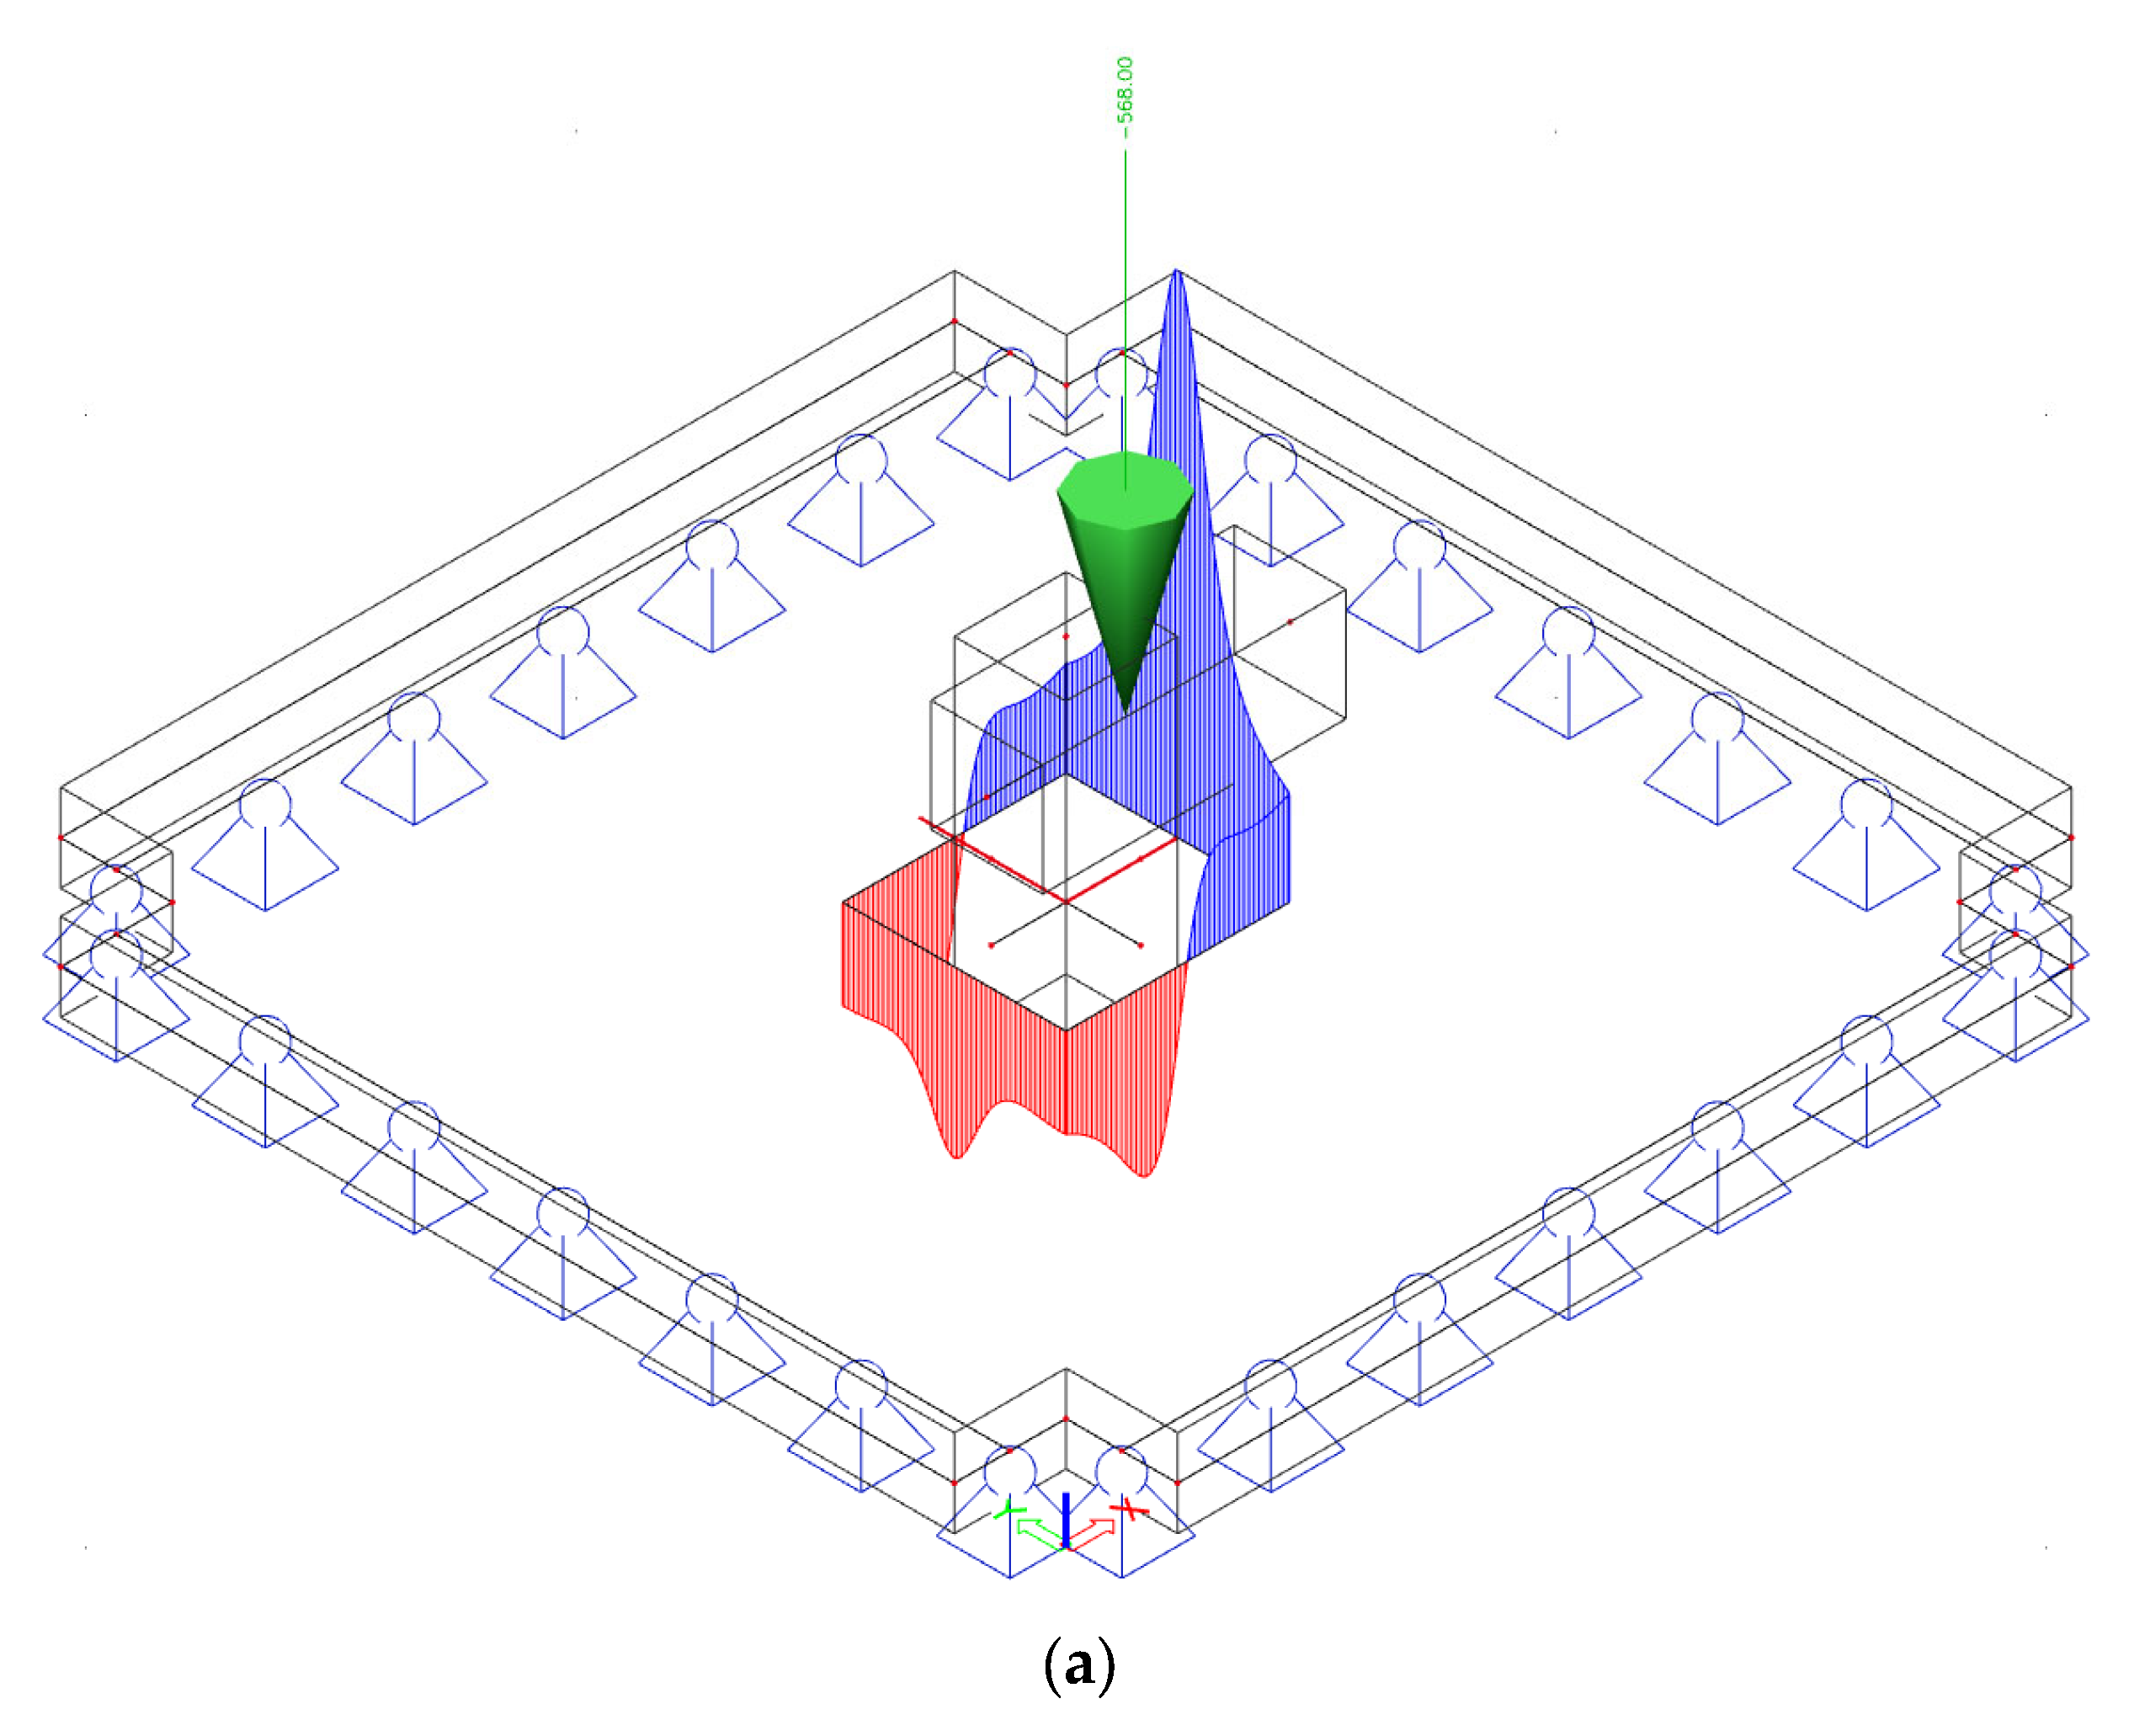
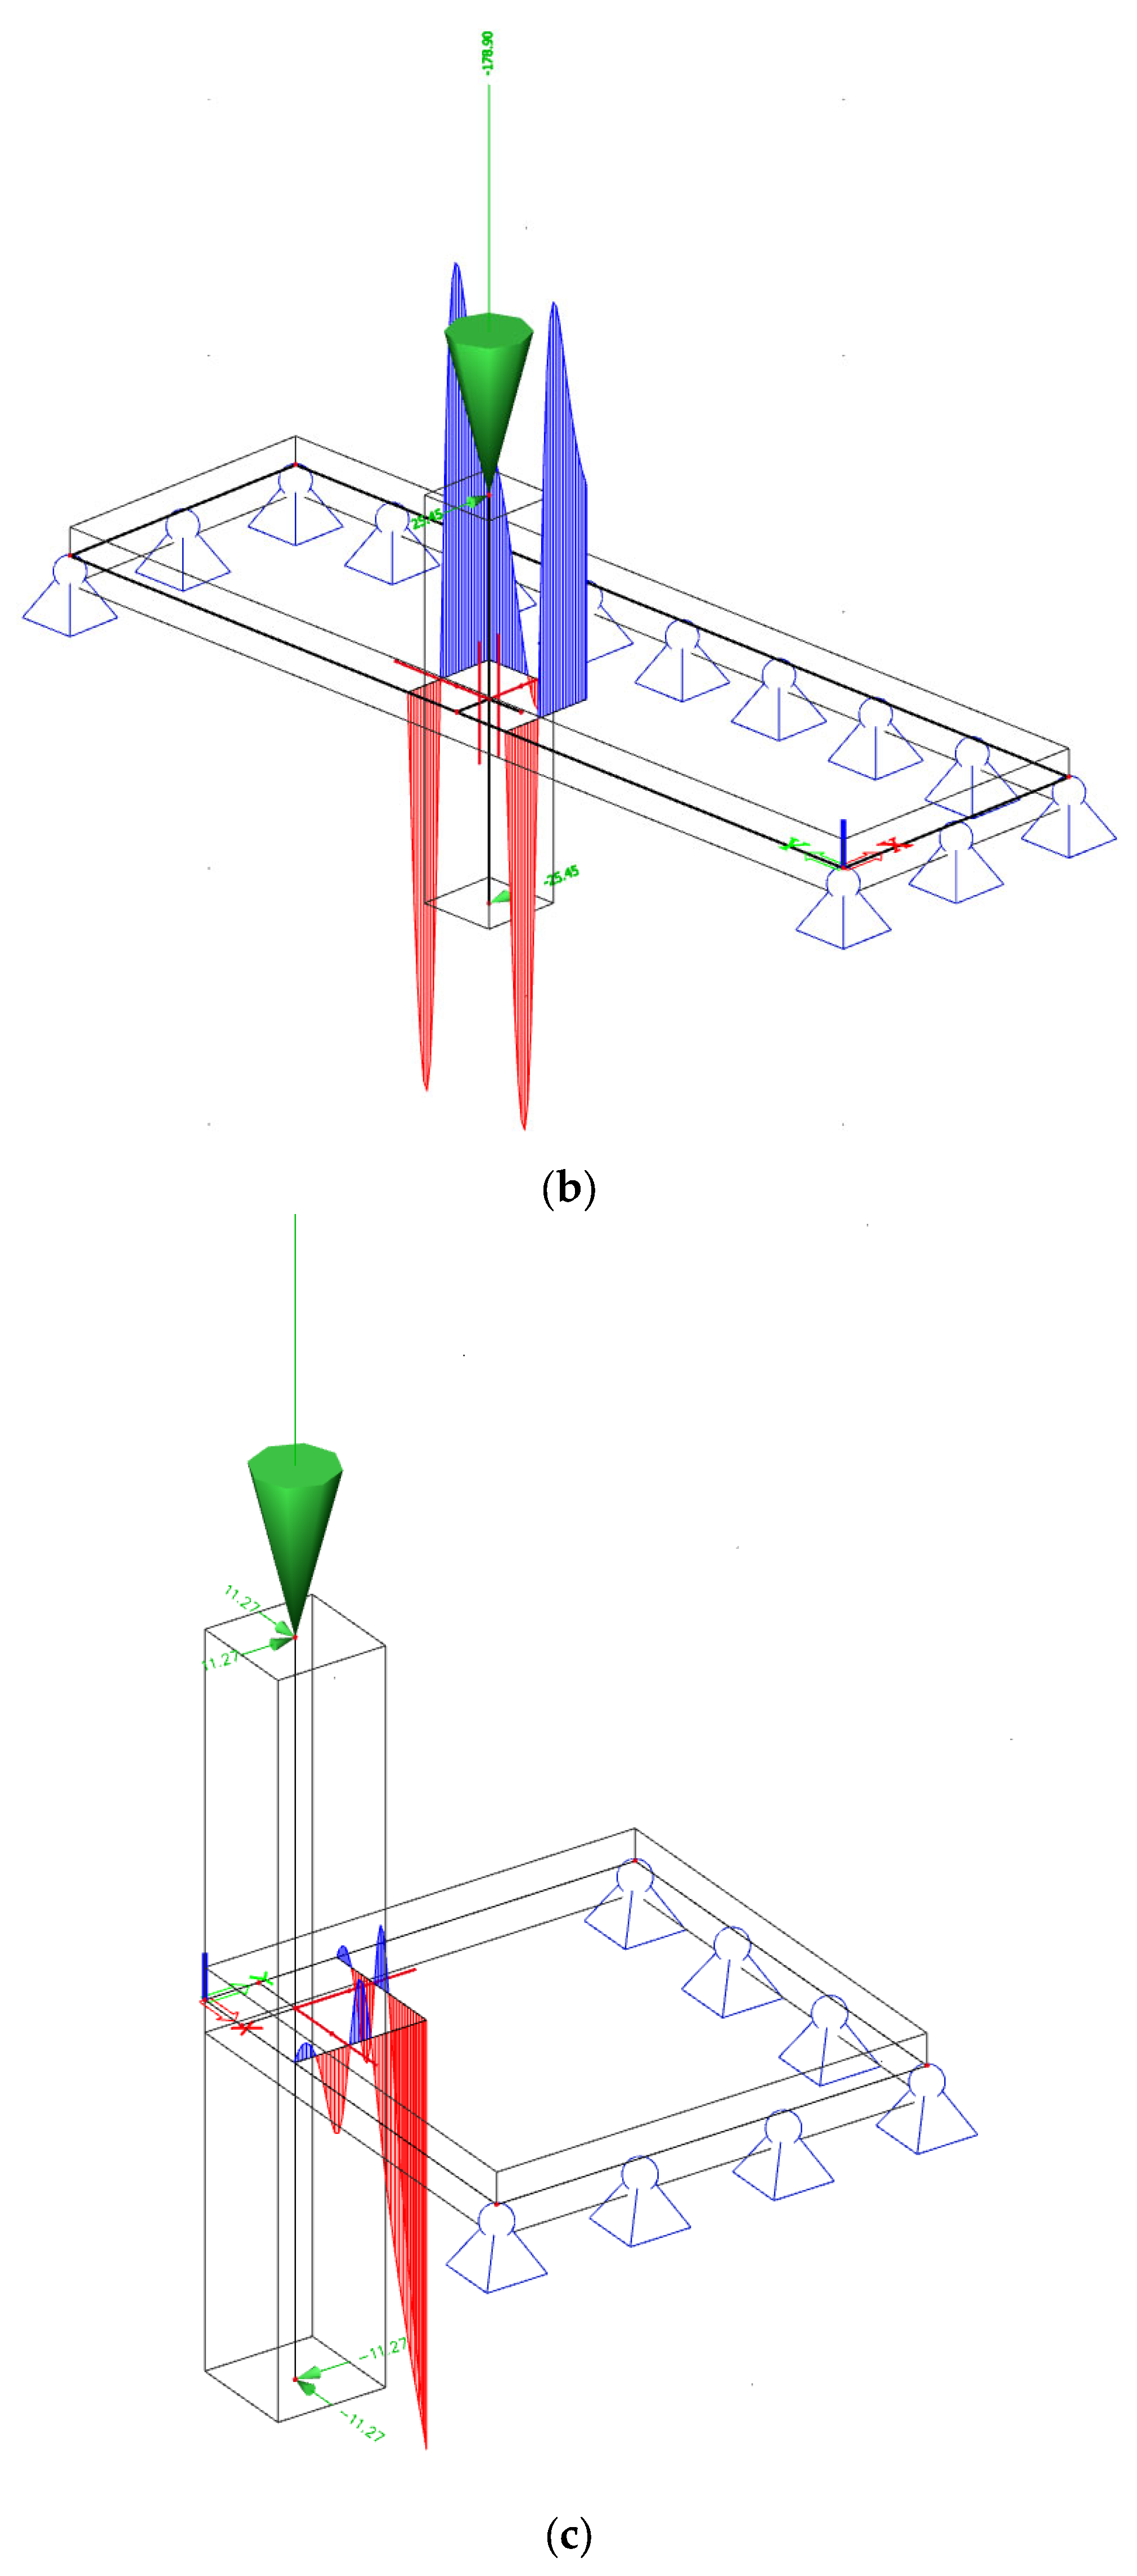
2.2.2. FEM Modeling Process
2.2.3. Parameter Ranges in the Database
3. Results
3.1. Parameters Studied
3.2. Comparison with Code Predictions
3.3. Influence of Parameters on Tested to Predicted Punching Capacities
4. Discussion
5. Conclusions
- There is a lack of experiments on eccentric punching shear.
- All experiments are carried out on slabs of under 200 mm in depth. As such, the experiments cannot be used to evaluate the size effect in shear.
- Most specimens have large reinforcement ratios to avoid a flexural failure before reaching the punching shear capacity of the slab and are not representative of typical floor slabs.
- All specimens are cast using normal-strength concrete.
- The presence of unbalanced moments has a large impact on the capacity of the codes to accurately predict the performance of slab–column connections, especially for edge and corner connections.
- The closest to 1.0 average value for tested to predicted shear capacity is obtained with the Model Code 2010 [9] provisions, although the results are on the unsafe side (average of tested/predicted = 0.82).
- In general, the coefficient of variation of the tested to predicted shear capacities is lower for the experiments without shear reinforcement than for the experiments with shear reinforcement. This observation indicates that further studies should address the distribution of shear stresses for shear-reinforced slab–column connections with unbalanced moments, as well as the contribution of the various shear-carrying mechanisms for the case with shear reinforcement.
- For eccentricities over 1000 mm, the use of NEN-EN 1992-1-1:2005 [8] becomes unsafe for inward eccentricities at edge slab–column connections.
- Using a more refined calculation method to determine the acting shear stresses does not improve the results in terms of tested to predicted shear stresses when using the ACI 318-19 [7] shear capacities. This observation indicates that the shear stress distribution that follows from a linear finite element analysis does not correspond to the slab at failure when cracking and redistribution of stresses occur.
- Further research is necessary on the capacity methods that can be combined with a linear finite element analysis.
Author Contributions
Funding
Data Availability Statement
Acknowledgments
Conflicts of Interest
Nomenclature
| Asw | area of the shear reinforcement for NEN-EN 1992-1-1:2005 |
| Av | area of the shear reinforcement for ACI 318-19 |
| CRd, c | constant used for determining the shear capacity |
| Es | modulus of elasticity of the steel |
| Jc | polar moment of inertia of the critical section |
| Lx | dimension of the slab |
| Ly | dimension of the slab |
| MEd | design moment |
| Mmu | model ultimate internal moment |
| Mu | factored moment applied on the slab |
| U1 | control perimeter for NEN-EN 1992-1-1:2005 |
| U1* | reduced critical control perimeter for NEN-EN 1992-1-1:2005 |
| VEd | design shear strength |
| VRd | punching resistance for Model Code 2010 |
| VRd,c | punching resistance provided by the concrete for Model Code 2010 |
| VRd,s | punching resistance provided by the steel for Model Code 2010 |
| Vu | factored shear applied on the slab |
| Vmu | model ultimate internal shear |
| Wsup | width of the support |
| W1 | plastic modulus of control perimeter for NEN-EN 1992-1-1:2005 |
| a | shear span |
| av | clear shear span |
| b0 | control perimeter for Model Code 2010 |
| b0,int | critical perimeter inside the shear-reinforced zone for CSCT |
| b1 | dimension of the critical perimeter for NEN-EN 1992-1-1:2005 |
| b1,MC | basic control perimeter for Model Code 2010 |
| b2 | dimension of the critical perimeter for Model Code 2010 |
| bo | perimeter of the critical perimeter for ACI 318-19 |
| bu | diameter of the circle with the same area as the region inside b1, MC |
| by | dimension of the critical perimeter U1 |
| bz | dimension of the critical perimeter U1 |
| c | distance to the centroid of the critical perimeter |
| c1 | dimension of the column |
| c2 | dimension of the column |
| d | average effective depth of the slab |
| dg | maximum aggregate size |
| dv | average effective depth of the slab for Model Code 2010 |
| e | eccentricity M/V |
| epar | eccentricity parallel to the edge of the slab |
| eu | eccentricity of the resultant forces |
| ey | eccentricity caused by a moment acting on the y-axis |
| ez | eccentricity caused by a moment acting on the x-axis |
| fbd | bond strength |
| fc | compressive strength of the concrete for ACI 318-19 |
| fck | compressive strength of the concrete for Model Code 2010 |
| fct | tensile strength of the concrete |
| fyt | yield strength of the reinforcement |
| fywd | design yield strength of the shear reinforcement |
| fywd,ef | effective design strength of shear reinforcement |
| h | depth of the slab |
| k | size effect factor |
| kc | column size effect factor |
| kdg | coefficient of aggregate size |
| ke | coefficient of eccentricity |
| kψ | coefficient of rotation |
| mrd | average flexural strength per unit length in the support strip |
| msd | average moment per unit length for calculation of flexural reinforcement in the support strip |
| rs | distance from column axis to line of contra-flexure of the radial bending moments |
| mxD | model design moment on the x-axis |
| myD | model design moment on the y-axis |
| sr | radial spacing of the reinforcement |
| vc | punching resistance provided by the concrete for ACI 318-19 |
| vEd | design shear stress |
| vn | nominal shear strength for ACI 318-19 |
| vRd, c | shear resistance provided by the concrete |
| vRd | shear resistance for Model Code 2010 |
| vRd,cs | shear resistance for NEN-EN 1992-1-1:2005 |
| vRd s | shear resistance provided by the steel |
| vs | punching resistance provided by the steel reinforcement for ACI 318-19 |
| vu | maximum shear stress for ACI 318-19 |
| vpred | shear capacity predicted for all the models |
| vFEM | maximum shear stress resulting from the FEM model |
| ϒf | fraction of the unbalanced moment transmitted by flexure |
| ϒv | fraction of the unbalanced moment transmitted by shear |
| α | angle between shear reinforcement and horizontal plane of the slab |
| αs | constant used for determining shear capacity according to ACI 318-19 |
| β | column dimension factor according to ACI 318-19 |
| βEC | enhancement factor for eccentric shear for NEN-EN 1992-1-1:2005 |
| ρl | longitudinal steel reinforcement ratio |
| ρv | shear steel reinforcement ratio |
| σswd | shear reinforcement stress |
| ϕw | shear reinforcement diameter |
| ψ | rotation of the slab |
Appendix A

| Reference | Name | Lx (mm) | Lx (mm) | c1 (mm) | c2 (mm) | h (mm) | d (mm) | a (mm) | av (mm) |
|---|---|---|---|---|---|---|---|---|---|
| Narayani [19] | L1 | 2280 | 2280 | 305 | 305 | 178 | 151 | 1026 | 874 |
| L3 | 2280 | 2280 | 305 | 305 | 178 | 151 | 1026 | 874 | |
| L4 | 2280 | 2280 | 305 | 305 | 178 | 151 | 1026 | 874 | |
| L5 | 2280 | 2280 | 305 | 305 | 178 | 151 | 1026 | 874 | |
| L6 | 2280 | 2280 | 305 | 305 | 178 | 151 | 1026 | 874 | |
| L10 | 2280 | 2280 | 305 | 305 | 178 | 151 | 1026 | 874 | |
| Krüger [2] | P16A | 3000 | 3000 | 300 | 300 | 150 | 121 | 1375 | 1225 |
| P30A | 3000 | 3000 | 300 | 300 | 150 | 121 | 1375 | 1225 | |
| PP16B | 3000 | 3000 | 300 | 300 | 150 | 121 | 1375 | 1225 | |
| Moe [11] | M2A | 1829 | 1829 | 305 | 305 | 152 | 114 | 787 | 635 |
| M4A | 1829 | 1829 | 305 | 305 | 152 | 114 | 787 | 635 | |
| M2 | 1829 | 1829 | 305 | 305 | 152 | 114 | 787 | 635 | |
| M3 | 1829 | 1829 | 305 | 305 | 152 | 114 | 787 | 635 | |
| M6 | 1829 | 1829 | 254 | 254 | 152 | 114 | 787 | 660 | |
| M7 | 1829 | 1829 | 254 | 254 | 152 | 114 | 787 | 660 | |
| M8 | 1829 | 1829 | 254 | 254 | 152 | 114 | 787 | 660 | |
| M9 | 1829 | 1829 | 254 | 254 | 152 | 114 | 787 | 660 | |
| M10 | 1829 | 1829 | 254 | 254 | 152 | 114 | 787 | 660 | |
| Anis [21] | B.3 | 1524 | 1524 | 203 | 203 | 102 | 76 | 737 | 635 |
| B.4 | 1524 | 1524 | 203 | 203 | 102 | 76 | 737 | 635 | |
| B.5 | 1524 | 1524 | 203 | 203 | 102 | 76 | 737 | 635 | |
| B.6 | 1524 | 1524 | 203 | 203 | 102 | 76 | 737 | 635 | |
| Stamenkovic [23] | C/I/1 | 914 | 914 | 127 | 127 | 76 | 56 | 419 | 355 |
| C/I/2 | 914 | 914 | 127 | 127 | 76 | 56 | 419 | 355 | |
| C/I/3 | 914 | 914 | 127 | 127 | 76 | 56 | 419 | 355 | |
| C/I/4 | 914 | 914 | 127 | 127 | 76 | 56 | 419 | 355 | |
| C/Ir/1 | 914 | 914 | 152 | 76 | 76 | 56 | 419 | 343 | |
| C/Ir/2 | 914 | 914 | 152 | 76 | 76 | 56 | 419 | 343 | |
| C/Ir/3 | 914 | 914 | 152 | 76 | 76 | 56 | 419 | 343 | |
| C/Ir/4 | 914 | 914 | 152 | 76 | 76 | 56 | 419 | 343 | |
| Hanson [22] | A12 | 2134 | 1219 | 152 | 152 | 76 | 62 | 1067 | 991 |
| B16 | 2134 | 1219 | 152 | 305 | 76 | 62 | 1067 | 991 | |
| C17 | 2134 | 1219 | 305 | 152 | 76 | 62 | 1067 | 914 | |
| Pina Ferreira [24] | S3 | 2500 | 2500 | 300 | 300 | 180 | 145 | 1250 | 1100 |
| S4 | 2500 | 2500 | 300 | 300 | 180 | 143 | 1250 | 1100 | |
| S6 | 2500 | 2500 | 300 | 300 | 180 | 144 | 1250 | 1100 | |
| S8 | 2500 | 2500 | 300 | 300 | 180 | 144 | 1250 | 1100 |
| Reference | Name | ρ (%) | fy (MPa) | Es (GPa) | fc (MPa) | Age (Days) | fct (MPa) | dg (mm) |
|---|---|---|---|---|---|---|---|---|
| Narayani [19] | L1 | 1.78% | 398 | 188 | 32.80 | 28 | 2.70 | 19.00 |
| L3 | 1.78% | 398 | 188 | 33.10 | 28 | 2.66 | 19.00 | |
| L4 | 1.78% | 398 | 188 | 45.80 | 28 | 3.45 | 19.00 | |
| L5 | 1.78% | 398 | 188 | 35.00 | 28 | 2.98 | 19.00 | |
| L6 | 1.78% | 398 | 188 | 42.10 | 28 | 3.07 | 19.00 | |
| L10 | 1.78% | 398 | 188 | 41.80 | 28 | 2.47 | 19.00 | |
| Krüger [2] | P16A | 1.30% | 480 | 200 | 35.00 | 28 | 4.50 | 16.00 |
| P30A | 1.30% | 480 | 200 | 35.00 | 28 | 4.50 | 16.00 | |
| PP16B | 1.30% | 480 | 200 | 35.00 | 28 | 4.50 | 16.00 | |
| Moe [11] | M2A | 1.50% | 481 | 196 | 15.51 | 25 | 2.99 | 38.10 |
| M4A | 1.50% | 481 | 196 | 17.65 | 23 | 3.19 | 38.10 | |
| M2 | 1.50% | 481 | 196 | 25.72 | 22 | 3.85 | 38.10 | |
| M3 | 1.50% | 481 | 196 | 22.72 | 20 | 3.62 | 38.10 | |
| M6 | 1.34% | 328 | 196 | 26.48 | 26 | 3.91 | 38.10 | |
| M7 | 1.34% | 328 | 196 | 24.96 | 24 | 3.80 | 38.10 | |
| M8 | 1.34% | 328 | 196 | 24.61 | 24 | 3.77 | 38.10 | |
| M9 | 1.34% | 328 | 196 | 23.24 | 22 | 3.66 | 38.10 | |
| M10 | 1.34% | 328 | 196 | 21.10 | 25 | 3.49 | 38.10 | |
| Anis [21] | B.3 | 2.19% | 331 | 205 | 38.06 | 28 | 4.69 | 9.53 |
| B.4 | 2.19% | 331 | 205 | 37.23 | 28 | 4.64 | 9.53 | |
| B.5 | 2.19% | 331 | 205 | 36.20 | 28 | 4.57 | 9.53 | |
| B.6 | 2.19% | 331 | 205 | 39.16 | 28 | 4.76 | 9.53 | |
| Stamenkovic [23] | C/I/1 | 1.17% | 413 | 192 | 45.02 | 7 | 5.10 | 9.53 |
| C/I/2 | 1.17% | 413 | 192 | 37.09 | 7 | 4.63 | 9.53 | |
| C/I/3 | 1.17% | 413 | 192 | 31.92 | 7 | 4.29 | 9.53 | |
| C/I/4 | 1.17% | 413 | 192 | 31.37 | 7 | 4.26 | 9.53 | |
| C/Ir/1 | 1.17% | 413 | 192 | 28.27 | 7 | 4.04 | 9.53 | |
| C/Ir/2 | 1.17% | 413 | 192 | 36.54 | 7 | 4.59 | 9.53 | |
| C/Ir/3 | 1.17% | 413 | 192 | 35.71 | 7 | 4.54 | 9.53 | |
| C/Ir/4 | 1.17% | 413 | 192 | 33.23 | 7 | 4.38 | 9.53 | |
| Hanson [22] | A12 | 1.36% | 372 | 192 | 33.23 | 28 | 4.38 | 9.53 |
| B16 | 1.36% | 341 | 192 | 30.41 | 28 | 4.19 | 9.53 | |
| C17 | 1.36% | 341 | 192 | 35.99 | 28 | 4.56 | 9.53 | |
| Pina Ferreira [24] | S3 | 1.46% | 540 | 213 | 50.30 | 28 | 4.30 | 9.50 |
| S4 | 1.48% | 540 | 213 | 49.20 | 28 | 4.40 | 9.50 | |
| S6 | 1.47% | 540 | 213 | 50.10 | 28 | 4.90 | 9.50 | |
| S8 | 1.47% | 540 | 213 | 48.40 | 28 | 4.00 | 9.50 |
| Reference | Name | Lx (mm) | Lx (mm) | c1 (mm) | c2 (mm) | h (mm) | d (mm) | a (mm) | av (mm) |
|---|---|---|---|---|---|---|---|---|---|
| Albuquerque [17] | L1 | 2350 | 1700 | 300 | 300 | 180 | 147 | 2000 | 1850 |
| L2 | 2350 | 1700 | 300 | 300 | 180 | 146 | 2000 | 1850 | |
| L3 | 2350 | 1700 | 300 | 300 | 180 | 146 | 2000 | 1850 | |
| L4 | 2350 | 1700 | 300 | 300 | 180 | 146 | 2000 | 1850 | |
| L5 | 2350 | 1700 | 300 | 300 | 180 | 146 | 2000 | 1850 | |
| L6 | 2350 | 1700 | 300 | 300 | 180 | 146 | 2000 | 1850 | |
| L7 | 2350 | 1700 | 300 | 300 | 180 | 146 | 2000 | 1850 | |
| L8 | 2350 | 1700 | 300 | 300 | 180 | 146 | 2000 | 1850 | |
| L9 | 2350 | 1700 | 300 | 300 | 180 | 146 | 2000 | 1850 | |
| L10 | 2350 | 1700 | 300 | 300 | 180 | 146 | 2000 | 1850 | |
| L11 | 2350 | 1700 | 300 | 300 | 180 | 146 | 2000 | 1850 | |
| L12 | 2350 | 1700 | 300 | 300 | 180 | 146 | 2000 | 1850 | |
| L13 | 2350 | 1700 | 300 | 300 | 180 | 146 | 2000 | 1850 | |
| Narayani [19] | ES1 | 1295 | 2280 | 305 | 305 | 178 | 151 | 1029 | 876 |
| ES2 | 1295 | 2280 | 305 | 305 | 178 | 151 | 1029 | 876 | |
| ES3 | 1295 | 2280 | 305 | 305 | 178 | 151 | 1029 | 876 | |
| ES4 | 1295 | 2280 | 305 | 305 | 178 | 151 | 1029 | 876 | |
| ES5 | 1295 | 2280 | 305 | 305 | 178 | 151 | 1029 | 876 | |
| ES6 | 1295 | 2280 | 305 | 305 | 178 | 151 | 1029 | 876 | |
| ES7 | 1295 | 2280 | 305 | 305 | 178 | 151 | 1029 | 876 | |
| Zaghlool [20] | Z—IV (1) | 965 | 1829 | 178 | 178 | 152 | 121 | 870 | 781 |
| Z—V (1) | 965 | 1829 | 267 | 267 | 152 | 121 | 826 | 692 | |
| Z—V (2) | 965 | 1829 | 267 | 267 | 152 | 121 | 826 | 692 | |
| Z—V (3) | 965 | 1829 | 267 | 267 | 152 | 118 | 826 | 692 | |
| Z—V (4) | 965 | 1829 | 267 | 267 | 152 | 121 | 826 | 692 | |
| Z—V (5) | 965 | 1829 | 267 | 267 | 152 | 121 | 826 | 692 | |
| Z—V (6) | 965 | 1829 | 267 | 267 | 152 | 121 | 826 | 692 | |
| Z—VI (1) | 965 | 1829 | 356 | 356 | 152 | 121 | 781 | 603 | |
| Stamenkovic [23] | M(T)/E/1 | 914 | 914 | 127 | 127 | 76 | 56 | 812 | 749 |
| M(T)/E/2 | 914 | 914 | 127 | 127 | 76 | 56 | 812 | 749 | |
| C(T)/E/1 | 914 | 914 | 127 | 127 | 76 | 56 | 812 | 749 | |
| C(T)/E/2 | 914 | 914 | 127 | 127 | 76 | 56 | 812 | 749 | |
| C(T)/E/3 | 914 | 914 | 127 | 127 | 76 | 56 | 812 | 749 | |
| C(T)/E/4 | 914 | 914 | 127 | 127 | 76 | 56 | 812 | 749 | |
| V/E/1 | 914 | 914 | 127 | 127 | 76 | 56 | 812 | 749 | |
| M(II)/E/1 | 914 | 914 | 127 | 127 | 76 | 56 | 812 | 749 | |
| C(II)/E/1 | 914 | 914 | 127 | 127 | 76 | 56 | 812 | 749 | |
| C(II)/E/2 | 914 | 914 | 127 | 127 | 76 | 56 | 812 | 749 | |
| C(II)/E/3 | 914 | 914 | 127 | 127 | 76 | 56 | 812 | 749 | |
| C(II)/E/4 | 914 | 914 | 127 | 127 | 76 | 56 | 812 | 749 | |
| Hanson [22] | D15 | 1143 | 1219 | 152 | 152 | 76 | 62 | 1067 | 991 |
| Ritchie [25] | 1 | 1350 | 1900 | 250 | 250 | 150 | 122 | 1175 | 1050 |
| Sudarsana [26] | E1 | 711 | 1219 | 203 | 203 | 140 | 105 | 610 | 508 |
| E2 | 711 | 1219 | 203 | 203 | 140 | 105 | 610 | 508 | |
| E4 | 711 | 1219 | 203 | 203 | 140 | 105 | 610 | 508 | |
| E1-1 | 1571 | 1719 | 203 | 203 | 140 | 105 | 1220 | 1118 | |
| E1-2 | 1571 | 1719 | 203 | 203 | 140 | 105 | 1220 | 1118 | |
| E1-3 | 1571 | 1719 | 203 | 203 | 140 | 105 | 1220 | 1118 | |
| E1-4 | 1571 | 1719 | 203 | 203 | 140 | 105 | 1220 | 1118 | |
| E2-1 | 961 | 2940 | 203 | 203 | 140 | 105 | 610 | 508 | |
| E2-2 | 961 | 2940 | 203 | 203 | 140 | 105 | 610 | 508 | |
| E2-3 | 961 | 2940 | 203 | 203 | 140 | 105 | 610 | 508 | |
| E2-4 | 961 | 2940 | 203 | 203 | 140 | 105 | 610 | 508 | |
| Zaghloul [27] | ZJESSS | 1060 | 1770 | 250 | 250 | 150 | 119 | 850 | 725 |
| ZJES | 1060 | 1770 | 250 | 250 | 150 | 119 | 850 | 725 |
| Reference | Name | ρ (%) | fy (MPa) | Es (GPa) | fc (MPa) | Age (Days) | fct (MPa) | dg (mm) |
|---|---|---|---|---|---|---|---|---|
| Albuquerque [17] | L1 | 1.00% | 558 | 192 | 46.80 | 28 | 3.40 | 9.50 |
| L2 | 1.30% | 558 | 192 | 44.70 | 28 | 3.00 | 9.50 | |
| L3 | 1.30% | 558 | 192 | 45.10 | 28 | 3.10 | 9.50 | |
| L4 | 1.30% | 558 | 192 | 46.00 | 28 | 3.30 | 9.50 | |
| L5 | 1.30% | 558 | 192 | 51.40 | 28 | 4.10 | 9.50 | |
| L6 | 1.30% | 558 | 192 | 52.10 | 28 | 4.30 | 9.50 | |
| L7 | 1.50% | 558 | 192 | 50.00 | 28 | 3.70 | 9.50 | |
| L8 | 1.40% | 558 | 192 | 50.50 | 28 | 3.90 | 9.50 | |
| L9 | 1.50% | 558 | 192 | 57.60 | 28 | 3.20 | 9.50 | |
| L10 | 1.50% | 558 | 192 | 59.30 | 28 | 3.60 | 9.50 | |
| L11 | 1.50% | 558 | 192 | 43.10 | 28 | 3.10 | 9.50 | |
| L12 | 1.50% | 558 | 192 | 43.60 | 28 | 3.30 | 9.50 | |
| L13 | 1.50% | 558 | 192 | 44.10 | 28 | 3.40 | 9.50 | |
| Narayani [19] | ES1 | 0.88% | 398 | 188 | 33.80 | 28 | 2.70 | 19.00 |
| ES2 | 0.88% | 398 | 188 | 32.80 | 28 | 2.70 | 19.00 | |
| ES3 | 0.88% | 398 | 188 | 51.30 | 28 | 3.10 | 19.00 | |
| ES4 | 0.88% | 398 | 188 | 50.00 | 28 | 3.31 | 19.00 | |
| ES5 | 0.88% | 398 | 188 | 37.60 | 28 | 2.63 | 19.00 | |
| ES6 | 0.88% | 398 | 188 | 40.40 | 28 | 2.23 | 19.00 | |
| ES7 | 0.88% | 398 | 188 | 45.80 | 28 | 3.38 | 19.00 | |
| Zaghlool [20] | Z—IV (1) | 1.23% | 476 | 207 | 27.34 | 28 | 2.99 | 19.05 |
| Z—V (1) | 1.23% | 474 | 207 | 34.34 | 28 | 3.52 | 19.05 | |
| Z—V (2) | 1.65% | 474 | 207 | 40.47 | 28 | 3.61 | 19.05 | |
| Z—V (3) | 2.23% | 475 | 207 | 38.75 | 28 | 3.79 | 19.05 | |
| Z—V (4) | 1.23% | 475 | 207 | 35.03 | 28 | 4.10 | 19.05 | |
| Z—V (5) | 1.23% | 476 | 207 | 35.16 | 28 | 3.58 | 19.05 | |
| Z—V (6) | 1.23% | 476 | 207 | 31.30 | 28 | 3.63 | 19.05 | |
| Z—VI (1) | 1.23% | 476 | 207 | 25.99 | 28 | 2.83 | 19.05 | |
| Stamenkovic [23] | M(T)/E/1 | 1.17% | 413 | 192 | 30.34 | 7 | 4.19 | 9.53 |
| M(T)/E/2 | 1.17% | 413 | 192 | 33.09 | 7 | 4.37 | 9.53 | |
| C(T)/E/1 | 1.17% | 413 | 192 | 38.47 | 7 | 4.71 | 9.53 | |
| C(T)/E/2 | 1.17% | 413 | 192 | 32.41 | 7 | 4.33 | 9.53 | |
| C(T)/E/3 | 1.17% | 413 | 192 | 33.99 | 7 | 4.43 | 9.53 | |
| C(T)/E/4 | 1.17% | 413 | 192 | 34.34 | 7 | 4.45 | 9.53 | |
| V/E/1 | 1.17% | 413 | 192 | 35.85 | 7 | 4.55 | 9.53 | |
| M(II)/E/1 | 1.17% | 413 | 192 | 36.20 | 7 | 4.57 | 9.53 | |
| C(II)/E/1 | 1.17% | 413 | 192 | 34.82 | 7 | 4.48 | 9.53 | |
| C(II)/E/2 | 1.17% | 413 | 192 | 35.51 | 7 | 4.53 | 9.53 | |
| C(II)/E/3 | 1.17% | 413 | 192 | 34.89 | 7 | 4.49 | 9.53 | |
| C(II)/E/4 | 1.17% | 413 | 192 | 36.54 | 7 | 4.59 | 9.53 | |
| Hanson [22] | D15 | 1.15% | 365 | 192 | 31.10 | 28 | 4.24 | 9.53 |
| Ritchie [25] | 1 | 1.12% | 432 | 192 | 26.20 | 28 | 3.89 | 9.50 |
| Sudarsana [26] | E1 | 0.90% | 420 | 183 | 43.62 | 28 | 5.02 | 10.00 |
| E2 | 0.90% | 420 | 183 | 42.41 | 28 | 4.95 | 10.00 | |
| E4 | 0.90% | 420 | 183 | 43.62 | 28 | 5.02 | 10.00 | |
| E1-1 | 1.60% | 420 | 183 | 52.80 | 28 | 5.52 | 10.00 | |
| E1-2 | 1.60% | 420 | 183 | 52.80 | 28 | 5.52 | 10.00 | |
| E1-3 | 1.60% | 420 | 183 | 55.00 | 28 | 5.64 | 10.00 | |
| E1-4 | 1.60% | 420 | 183 | 52.80 | 28 | 5.52 | 10.00 | |
| E2-1 | 0.80% | 420 | 183 | 52.80 | 28 | 5.52 | 10.00 | |
| E2-2 | 0.80% | 420 | 183 | 52.80 | 28 | 5.52 | 10.00 | |
| E2-3 | 0.80% | 420 | 183 | 55.00 | 28 | 5.64 | 10.00 | |
| E2-4 | 0.80% | 420 | 183 | 55.00 | 28 | 5.64 | 10.00 | |
| Zaghloul [27] | ZJESSS | 1.40% | 400 | 192 | 42.00 | 28 | 4.93 | 10.00 |
| ZJES | 1.40% | 400 | 192 | 42.00 | 28 | 4.93 | 10.00 |
| Reference | Name | Lx (mm) | Lx (mm) | c1 (mm) | c2 (mm) | h (mm) | d (mm) | a (mm) | av (mm) |
|---|---|---|---|---|---|---|---|---|---|
| Zaghlool [20] | Z—I (1) | 1067 | 1067 | 178 | 178 | 152 | 121 | 965 | 1067 |
| Z—II (1) | 1067 | 1067 | 267 | 267 | 152 | 121 | 921 | 1067 | |
| Z—II (2) | 1067 | 1067 | 267 | 267 | 152 | 121 | 921 | 1067 | |
| Z—II (3) | 1067 | 1067 | 267 | 267 | 152 | 118 | 921 | 1067 | |
| Z—II (4) | 1067 | 1067 | 267 | 267 | 152 | 121 | 921 | 1067 | |
| Z—II (6) | 1067 | 1067 | 267 | 267 | 152 | 121 | 921 | 1067 | |
| Z—III (1) | 1067 | 1067 | 356 | 356 | 152 | 121 | 876 | 1067 | |
| Sudarsana [26] | C5 | 711 | 711 | 305 | 305 | 140 | 105 | 559 | 711 |
| C6 | 711 | 711 | 305 | 305 | 140 | 105 | 559 | 711 | |
| C7 | 711 | 711 | 305 | 305 | 140 | 105 | 559 | 711 | |
| C8 | 711 | 711 | 305 | 305 | 140 | 105 | 559 | 711 | |
| Desayi [28] | S101 | 530 | 530 | 100 | 100 | 100 | 80 | 480 | 530 |
| S201 | 530 | 530 | 100 | 100 | 100 | 80 | 480 | 530 | |
| S301 | 530 | 530 | 100 | 100 | 100 | 80 | 480 | 530 | |
| S102 | 530 | 530 | 100 | 100 | 100 | 80 | 480 | 530 | |
| S202 | 530 | 530 | 100 | 100 | 100 | 80 | 480 | 530 | |
| S302 | 530 | 530 | 100 | 100 | 100 | 80 | 480 | 530 | |
| Walker [29] | SC1 | 1525 | 1525 | 300 | 300 | 125 | 100 | 1375 | 1525 |
| SC2 | 1525 | 1525 | 300 | 300 | 125 | 100 | 1375 | 1525 | |
| SC3 | 1525 | 1525 | 300 | 300 | 125 | 100 | 1375 | 1525 | |
| SC4 | 1525 | 1525 | 220 | 220 | 125 | 100 | 1415 | 1525 | |
| SC5 | 1525 | 1525 | 220 | 220 | 125 | 100 | 1415 | 1525 | |
| SC7 | 1525 | 1525 | 220 | 220 | 125 | 100 | 1415 | 1525 | |
| SC8 | 1000 | 1000 | 160 | 160 | 80 | 64 | 920 | 1000 | |
| SC9 | 1000 | 1000 | 160 | 160 | 80 | 64 | 920 | 1000 | |
| SC11 | 1000 | 700 | 160 | 160 | 80 | 60 | 920 | 1000 | |
| SC12 | 1000 | 700 | 300 | 300 | 80 | 60 | 850 | 1000 | |
| Stamenkovic [30] | C/C/1 | 914 | 914 | 127 | 127 | 76 | 56 | 813 | 914 |
| C/C/2 | 914 | 914 | 127 | 127 | 76 | 56 | 813 | 914 | |
| C/C/3 | 914 | 914 | 127 | 127 | 76 | 56 | 813 | 914 | |
| C/C/4 | 914 | 914 | 127 | 127 | 76 | 56 | 813 | 914 | |
| Ghali [18] | NH1 | 1075 | 1075 | 250 | 250 | 150 | 114 | 910 | 1075 |
| NH2 | 1075 | 1075 | 250 | 250 | 150 | 114 | 910 | 1075 | |
| NH3 | 1075 | 1075 | 250 | 250 | 150 | 114 | 910 | 1075 | |
| NH4 | 1075 | 1075 | 250 | 250 | 150 | 114 | 910 | 1075 | |
| NH5 | 1075 | 1075 | 250 | 250 | 150 | 114 | 910 | 1075 |
| Reference | Name | ρ (%) | fy (MPa) | Es (GPa) | fc (MPa) | Age (Days) | fct (MPa) | dg (mm) |
|---|---|---|---|---|---|---|---|---|
| Zaghlool [20] | Z—I (1) | 1.23% | 379 | 207 | 32.68 | 28 | 4.34 | 19.05 |
| Z—II (1) | 1.23% | 389 | 207 | 33.03 | 28 | 4.37 | 19.05 | |
| Z—II (2) | 1.65% | 405 | 207 | 33.44 | 28 | 4.39 | 19.05 | |
| Z—II (3) | 2.23% | 451 | 207 | 27.72 | 28 | 4.00 | 19.05 | |
| Z—II (4) | 1.23% | 389 | 207 | 30.75 | 28 | 4.21 | 19.05 | |
| Z—II (6) | 1.23% | 381 | 207 | 33.58 | 28 | 4.40 | 19.05 | |
| Z—III (1) | 1.23% | 379 | 207 | 33.65 | 28 | 4.41 | 19.05 | |
| Sudarsana [26] | C5 | 1.11% | 420 | 183 | 44.40 | 28 | 5.06 | 10.00 |
| C6 | 1.11% | 420 | 183 | 44.40 | 28 | 5.06 | 10.00 | |
| C7 | 1.11% | 420 | 183 | 44.40 | 28 | 5.06 | 10.00 | |
| C8 | 1.11% | 420 | 183 | 44.40 | 28 | 5.06 | 10.00 | |
| Desayi [28] | S101 | 0.53% | 720 | 192 | 45.00 | 28 | 5.10 | 9.50 |
| S201 | 0.80% | 720 | 192 | 45.00 | 28 | 5.10 | 9.50 | |
| S301 | 1.07% | 720 | 192 | 25.00 | 28 | 3.80 | 9.50 | |
| S102 | 0.53% | 720 | 192 | 31.00 | 28 | 4.23 | 9.50 | |
| S202 | 0.80% | 720 | 192 | 34.00 | 28 | 4.43 | 9.50 | |
| S302 | 1.07% | 720 | 192 | 28.00 | 28 | 4.02 | 9.50 | |
| Walker [29] | SC1 | 1.14% | 595 | 192 | 43.30 | 28 | 5.00 | 20.00 |
| SC2 | 1.11% | 595 | 192 | 47.90 | 28 | 5.26 | 20.00 | |
| SC3 | 1.13% | 595 | 192 | 37.40 | 28 | 4.65 | 20.00 | |
| SC4 | 1.14% | 595 | 192 | 40.80 | 28 | 4.85 | 20.00 | |
| SC5 | 1.71% | 595 | 192 | 46.50 | 28 | 5.18 | 20.00 | |
| SC7 | 1.71% | 595 | 192 | 43.80 | 28 | 5.03 | 20.00 | |
| SC8 | 1.37% | 595 | 192 | 37.40 | 28 | 4.65 | 20.00 | |
| SC9 | 1.24% | 595 | 192 | 34.30 | 28 | 4.45 | 20.00 | |
| SC11 | 1.27% | 595 | 192 | 27.20 | 28 | 3.96 | 20.00 | |
| SC12 | 1.18% | 595 | 192 | 40.70 | 28 | 4.85 | 20.00 | |
| Stamenkovic [30] | C/C/1 | 1.17% | 413 | 192 | 38.06 | 28 | 4.69 | 9.50 |
| C/C/2 | 1.17% | 413 | 192 | 35.37 | 28 | 4.52 | 9.50 | |
| C/C/3 | 1.17% | 413 | 192 | 32.27 | 28 | 4.32 | 9.50 | |
| C/C/4 | 1.17% | 413 | 192 | 38.27 | 28 | 4.70 | 9.50 | |
| Ghali [18] | NH1 | 1.45% | 440 | 200 | 41.50 | 28 | 4.90 | 9.50 |
| NH2 | 1.45% | 440 | 200 | 42.20 | 28 | 4.94 | 9.50 | |
| NH3 | 1.45% | 440 | 200 | 36.40 | 28 | 4.59 | 9.50 | |
| NH4 | 1.45% | 440 | 200 | 36.90 | 28 | 4.62 | 9.50 | |
| NH5 | 1.45% | 440 | 200 | 33.20 | 28 | 4.38 | 9.50 |
| Reference | Name | Type | fy (MPa) | Es (GPa) | Φw (mm) | s (mm) |
|---|---|---|---|---|---|---|
| Narayani [19] | L3 | Shear hats | 309.00 | 207.00 | 9.50 | 90.00 |
| L4 | Shear hats | 238.00 | 207.00 | 6.50 | 90.00 | |
| L5 | Shear hats | 355.00 | 207.00 | 13.00 | 90.00 | |
| L6 | Shear hats | 355.00 | 207.00 | 8.00 | 90.00 | |
| L10 | Shear hats | 355.00 | 207.00 | 8.00 | 90.00 | |
| Krüger [2] | PP16B | Stirrups | 480.00 | 200.00 | 10.00 | 120.00 |
| Pina Ferreira [24] | S3 | Shear studs | 535.00 | 211.00 | 10.00 | 100.00 |
| S4 | Shear studs | 535.00 | 211.00 | 10.00 | 100.00 | |
| S8 | Shear studs | 518.00 | 204.00 | 12.00 | 100.00 | |
| Albuquerque [17] | L9 | Shear heads | 587.00 | 188.00 | 8.00 | 100.00 |
| L10 | Shear heads | 587.00 | 188.00 | 8.00 | 100.00 | |
| ES3 | Stirrups | 238.00 | 207.00 | 6.50 | 70.00 | |
| ES4 | Stirrups | 309.00 | 207.00 | 9.50 | 70.00 | |
| ES6 | Stirrups | 238.00 | 207.00 | 6.50 | 70.00 | |
| ES7 | Stirrups | 238.00 | 207.00 | 6.50 | 70.00 | |
| Zaghloul [27] | ZJESSS | Shear stud | 345.00 | 192.00 | 12.70 | 90.00 |
| Ghali [18] | NH3 | Shear heads | 440.00 | 200.00 | 6.00 | 57.00 |
| NH5 | Shear heads | 440.00 | 200.00 | 6.00 | 85.00 |
Appendix B
| Reference | Name | ACI [7] | EC2 [8] | MC 2010 [9] | ||||||
|---|---|---|---|---|---|---|---|---|---|---|
| Test (MPa) | Pred (MPa) | Test/Pred | Test (MPa) | Pred (MPa) | Test/Pred | Test (MPa) | Pred (MPa) | Test/Pred | ||
| Narayani [19] | L1 | 2.58 | 1.89 | 1.37 | 1.34 | 1.40 | 0.96 | 2.49 | 3.44 | 0.73 |
| L3 | 3.23 | 2.98 | 1.08 | 1.68 | 1.34 | 1.25 | 1.23 | 1.40 | 0.88 | |
| L4 | 3.67 | 2.25 | 1.63 | 1.91 | 1.50 | 1.28 | 1.40 | 1.62 | 0.87 | |
| L5 | 3.23 | 4.41 | 0.73 | 1.68 | 1.37 | 1.23 | 1.23 | 1.46 | 0.84 | |
| L6 | 3.02 | 2.88 | 1.05 | 1.64 | 1.45 | 1.13 | 1.48 | 1.92 | 0.77 | |
| L10 | 3.22 | 2.87 | 1.12 | 1.75 | 1.45 | 1.21 | 1.57 | 1.92 | 0.82 | |
| Krüger [2] | P16A | 2.51 | 1.95 | 1.28 | 1.46 | 1.29 | 1.13 | 2.54 | 3.47 | 0.73 |
| P30A | 2.67 | 1.95 | 1.37 | 1.49 | 1.29 | 1.16 | 2.65 | 3.49 | 0.76 | |
| PP16B | 3.22 | 3.41 | 0.95 | 1.87 | 2.73 | 0.69 | 0.61 | 0.75 | 0.82 | |
| Moe [11] | M2A | 1.75 | 1.30 | 1.35 | 1.03 | 1.03 | 1.00 | 1.74 | 2.36 | 0.74 |
| M4A | 1.73 | 1.39 | 1.25 | 0.98 | 1.07 | 0.91 | 1.66 | 2.52 | 0.66 | |
| M2 | 2.43 | 1.67 | 1.45 | 1.43 | 1.22 | 1.17 | 2.39 | 3.04 | 0.79 | |
| M3 | 2.17 | 1.57 | 1.38 | 1.24 | 1.17 | 1.06 | 2.09 | 2.86 | 0.73 | |
| M6 | 2.25 | 1.70 | 1.33 | 1.25 | 1.18 | 1.05 | 2.25 | 3.09 | 0.73 | |
| M7 | 2.28 | 1.65 | 1.38 | 1.32 | 1.16 | 1.14 | 2.36 | 3.00 | 0.79 | |
| M8 | 2.19 | 1.64 | 1.34 | 1.14 | 1.15 | 0.99 | 2.12 | 2.98 | 0.71 | |
| M9 | 2.30 | 1.59 | 1.44 | 1.29 | 1.13 | 1.14 | 2.32 | 2.89 | 0.80 | |
| M10 | 2.16 | 1.52 | 1.43 | 1.15 | 1.10 | 1.05 | 2.11 | 2.76 | 0.77 | |
| Anis [21] | B.3 | 3.20 | 2.04 | 1.57 | 1.91 | 1.53 | 1.25 | 3.17 | 3.70 | 0.86 |
| B.4 | 3.01 | 2.01 | 1.49 | 1.74 | 1.51 | 1.15 | 2.86 | 3.66 | 0.78 | |
| B.5 | 3.48 | 1.99 | 1.75 | 1.95 | 1.50 | 1.30 | 3.20 | 3.61 | 0.89 | |
| B.6 | 4.08 | 2.07 | 1.98 | 2.24 | 1.54 | 1.46 | 3.65 | 3.75 | 0.97 | |
| Stamenkovic [23] | C/I/1 | 3.25 | 2.21 | 1.47 | 1.81 | 1.35 | 1.34 | 3.19 | 4.03 | 0.79 |
| C/I/2 | 3.20 | 2.01 | 1.59 | 1.71 | 1.27 | 1.35 | 3.01 | 3.65 | 0.82 | |
| C/I/3 | 3.00 | 1.86 | 1.61 | 1.52 | 1.20 | 1.26 | 2.67 | 3.39 | 0.79 | |
| C/I/4 | 3.16 | 1.85 | 1.71 | 1.55 | 1.20 | 1.29 | 2.72 | 3.36 | 0.81 | |
| C/Ir/1 | 3.68 | 1.75 | 2.10 | 1.98 | 1.16 | 1.72 | 3.58 | 3.09 | 1.16 | |
| C/Ir/2 | 3.87 | 1.99 | 1.94 | 2.01 | 1.26 | 1.60 | 3.61 | 3.63 | 0.99 | |
| C/Ir/3 | 1.92 | 1.97 | 0.98 | 1.02 | 1.25 | 0.82 | 1.85 | 3.59 | 0.51 | |
| C/Ir/4 | 1.65 | 1.90 | 0.87 | 0.84 | 1.22 | 0.69 | 1.50 | 3.46 | 0.43 | |
| Hanson [22] | A12 | 2.64 | 1.90 | 1.39 | 1.35 | 1.28 | 1.06 | 2.63 | 3.46 | 0.76 |
| B16 | 2.21 | 1.82 | 1.22 | 1.12 | 1.24 | 0.90 | 1.98 | 3.31 | 0.60 | |
| C17 | 1.94 | 1.98 | 0.98 | 1.21 | 1.32 | 0.92 | 1.81 | 3.60 | 0.50 | |
| Pina Ferreira [24] | S3 | 4.63 | 3.16 | 1.47 | 2.45 | 1.72 | 1.42 | 1.87 | 1.74 | 1.08 |
| S4 | 4.83 | 2.70 | 1.79 | 2.57 | 2.34 | 1.10 | 1.33 | 1.18 | 1.13 | |
| S6 | 3.52 | 2.34 | 1.51 | 1.86 | 1.51 | 1.23 | 3.50 | 3.95 | 0.89 | |
| S8 | 5.62 | 3.05 | 1.84 | 3.03 | 2.32 | 1.31 | 1.71 | 1.42 | 1.21 | |
| Reference | Name | ACI [7] | EC2 [8] | MC 2010 [9] | ||||||
|---|---|---|---|---|---|---|---|---|---|---|
| Test (MPa) | Pred (MPa) | Test/Pred | Test (MPa) | Pred (MPa) | Test/Pred | Test (MPa) | Pred (MPa) | Test/Pred | ||
| Albuquerque [17] | L1 | 2.66 | 2.26 | 1.18 | 1.65 | 1.30 | 1.27 | 3.07 | 3.49 | 0.88 |
| L2 | 2.94 | 2.21 | 1.33 | 2.52 | 1.39 | 1.81 | 1.91 | 3.80 | 0.50 | |
| L3 | 4.98 | 2.22 | 2.25 | 3.14 | 1.40 | 2.24 | 2.57 | 4.03 | 0.64 | |
| L4 | 4.80 | 2.24 | 2.14 | 2.87 | 1.41 | 2.04 | 2.39 | 4.07 | 0.59 | |
| L5 | 4.75 | 2.37 | 2.01 | 3.52 | 1.46 | 2.41 | 2.76 | 3.99 | 0.69 | |
| L6 | 5.31 | 2.38 | 2.23 | 3.58 | 1.47 | 2.44 | 2.88 | 4.19 | 0.69 | |
| L7 | 6.58 | 2.33 | 2.82 | 3.94 | 1.52 | 2.60 | 3.28 | 4.24 | 0.77 | |
| L8 | 7.31 | 2.35 | 3.12 | 4.38 | 1.49 | 2.94 | 3.64 | 4.26 | 0.85 | |
| L9 | 4.57 | 2.72 | 1.68 | 3.91 | 2.59 | 1.51 | 1.34 | 1.93 | 0.69 | |
| L10 | 7.16 | 2.75 | 2.60 | 4.82 | 2.61 | 1.85 | 1.22 | 1.41 | 0.86 | |
| L11 | 6.62 | 2.17 | 3.06 | 4.06 | 1.44 | 2.81 | 3.35 | 3.94 | 0.85 | |
| L12 | 5.24 | 2.18 | 2.41 | 3.69 | 1.45 | 2.54 | 2.93 | 3.81 | 0.77 | |
| L13 | 7.55 | 2.19 | 3.45 | 4.63 | 1.46 | 3.18 | 3.82 | 3.95 | 0.97 | |
| Narayani [19] | ES1 | 2.83 | 1.92 | 1.48 | 2.95 | 1.12 | 2.64 | 2.36 | 3.42 | 0.69 |
| ES2 | 2.02 | 1.89 | 1.07 | 1.74 | 1.11 | 1.57 | 2.29 | 3.27 | 0.70 | |
| ES3 | 2.61 | 1.61 | 1.62 | 1.88 | 1.14 | 1.65 | 1.80 | 2.43 | 0.74 | |
| ES4 | 3.00 | 2.29 | 1.31 | 2.16 | 1.13 | 1.92 | 2.07 | 2.42 | 0.85 | |
| ES5 | 3.28 | 2.02 | 1.62 | 3.31 | 1.16 | 2.86 | 2.76 | 3.68 | 0.75 | |
| ES6 | 3.39 | 1.47 | 2.30 | 3.53 | 1.05 | 3.37 | 1.51 | 1.98 | 0.76 | |
| ES7 | 3.85 | 1.54 | 2.50 | 3.88 | 1.09 | 3.55 | 1.26 | 1.59 | 0.79 | |
| Zaghlool [20] | Z—IV (1) | 2.91 | 1.73 | 1.69 | 1.06 | 1.16 | 0.91 | 3.24 | 3.14 | 1.03 |
| Z—V (1) | 2.93 | 1.93 | 1.51 | 0.98 | 1.25 | 0.78 | 2.83 | 3.52 | 0.81 | |
| Z—V (2) | 3.72 | 2.10 | 1.77 | 1.91 | 1.46 | 1.31 | 4.03 | 3.82 | 1.06 | |
| Z—V (3) | 4.24 | 2.05 | 2.07 | 2.17 | 1.53 | 1.41 | 4.57 | 3.73 | 1.22 | |
| Z—V (4) | 4.38 | 1.95 | 2.24 | - | - | - | - | - | - | |
| Z—V (5) | 3.59 | 1.96 | 1.84 | 3.13 | 1.26 | 2.48 | 2.34 | 3.56 | 0.66 | |
| Z—V (6) | 3.24 | 1.85 | 1.75 | 0.91 | 1.22 | 0.75 | 2.83 | 3.36 | 0.84 | |
| Z—VI (1) | 2.95 | 1.68 | 1.75 | 1.86 | 1.14 | 1.63 | 3.16 | 3.06 | 1.03 | |
| Stamenkovic [23] | M(T)/E/1 | 4.43 | 1.82 | 2.44 | - | - | - | - | - | - |
| M(T)/E/2 | 4.35 | 1.90 | 2.29 | - | - | - | - | - | - | |
| C(T)/E/1 | 3.25 | 2.05 | 1.59 | 2.62 | 1.28 | 2.04 | 3.92 | 3.39 | 1.16 | |
| C(T)/E/2 | 3.62 | 1.88 | 1.93 | 1.96 | 1.21 | 1.62 | 3.94 | 3.30 | 1.20 | |
| C(T)/E/3 | 3.77 | 1.92 | 1.96 | 0.89 | 1.23 | 0.73 | 2.98 | 3.50 | 0.85 | |
| C(T)/E/4 | 3.95 | 1.93 | 2.05 | 0.39 | 1.23 | 0.32 | 2.21 | 3.52 | 0.63 | |
| V/E/1 | 4.37 | 1.98 | 2.21 | 3.84 | 1.25 | 3.07 | 2.85 | 3.33 | 0.86 | |
| M(II)/E/1 | 2.64 | 1.99 | 1.33 | - | - | - | - | - | - | |
| C(II)/E/1 | 3.74 | 1.95 | 1.92 | 1.64 | 1.24 | 1.32 | 2.73 | 3.53 | 0.77 | |
| C(II)/E/2 | 3.28 | 1.97 | 1.67 | 1.25 | 1.25 | 1.00 | 2.48 | 3.58 | 0.69 | |
| C(II)/E/3 | 3.42 | 1.95 | 1.76 | 0.84 | 1.24 | 0.68 | 2.79 | 3.54 | 0.79 | |
| C(II)/E/4 | 2.96 | 1.99 | 1.48 | 0.46 | 1.26 | 0.37 | 2.54 | 3.63 | 0.70 | |
| Hanson [22] | D15 | 3.89 | 1.84 | 2.11 | 0.34 | 1.19 | 0.29 | 1.80 | 3.35 | 0.54 |
| Ritchie [25] | 1 | 1.61 | 1.69 | 0.95 | 1.10 | 1.11 | 0.99 | 1.35 | 3.07 | 0.44 |
| Sudarsana [26] | E1 | 2.60 | 2.18 | 1.19 | 1.36 | 1.22 | 1.11 | 2.92 | 3.96 | 0.74 |
| E2 | 4.18 | 2.15 | 1.94 | 3.53 | 1.21 | 2.91 | 2.71 | 3.73 | 0.73 | |
| E4 | 1.61 | 2.18 | 0.74 | 1.24 | 1.22 | 1.01 | 1.99 | 3.96 | 0.50 | |
| E1-1 | 1.13 | 2.40 | 0.47 | 0.85 | 1.58 | 0.54 | 1.13 | 4.36 | 0.26 | |
| E1-2 | 3.26 | 2.40 | 1.36 | 0.94 | 1.58 | 0.59 | 3.04 | 4.36 | 0.70 | |
| E1-3 | 3.99 | 2.45 | 1.63 | 3.27 | 1.60 | 2.04 | 5.04 | 3.73 | 1.35 | |
| E1-4 | 2.79 | 2.40 | 1.16 | 1.21 | 1.58 | 0.77 | 3.02 | 4.36 | 0.69 | |
| E2-1 | 2.64 | 2.40 | 1.10 | 1.39 | 1.25 | 1.11 | 2.97 | 4.36 | 0.68 | |
| E2-2 | 2.62 | 2.40 | 1.09 | 1.90 | 1.25 | 1.52 | 3.19 | 4.31 | 0.74 | |
| E2-3 | 5.28 | 2.45 | 2.16 | 3.49 | 1.27 | 2.75 | 4.41 | 3.86 | 1.14 | |
| E2-4 | 2.39 | 2.45 | 0.98 | 2.12 | 1.27 | 1.67 | 3.10 | 4.35 | 0.71 | |
| Zaghloul [27] | ZJESSS | 4.93 | 4.02 | 1.23 | 1.76 | 2.02 | 0.87 | 1.21 | 1.07 | 1.13 |
| ZJES | 2.52 | 2.14 | 1.18 | 1.52 | 1.40 | 1.09 | 2.87 | 3.89 | 0.74 | |
| Reference | Name | ACI [7] | EC2 [8] | MC 2010 [9] | ||||||
|---|---|---|---|---|---|---|---|---|---|---|
| Test (MPa) | Pred (MPa) | Test/Pred | Test (MPa) | Pred (MPa) | Test/Pred | Test (MPa) | Pred (MPa) | Test/Pred | ||
| Zaghlool [20] | Z—I (1) | 2.89 | 1.89 | 1.53 | 1.46 | 1.23 | 1.18 | 2.69 | 3.43 | 0.78 |
| Z—II (1) | 3.38 | 1.90 | 1.78 | 2.50 | 1.24 | 2.02 | 3.20 | 3.45 | 0.93 | |
| Z—II (2) | 4.62 | 1.91 | 2.42 | 3.21 | 1.37 | 2.34 | 4.26 | 3.47 | 1.23 | |
| Z—II (3) | 5.13 | 1.74 | 2.95 | 3.38 | 1.37 | 2.46 | 4.57 | 3.16 | 1.45 | |
| Z—II (4) | 2.00 | 1.83 | 1.09 | - | - | - | - | - | - | |
| Z—II (6) | 3.14 | 1.91 | 1.64 | 1.49 | 1.24 | 1.20 | 2.48 | 3.48 | 0.71 | |
| Z—III (1) | 3.06 | 1.91 | 1.60 | 3.01 | 1.25 | 2.42 | 3.01 | 3.48 | 0.86 | |
| Sudarsana [26] | C5 | 1.69 | 2.20 | 0.77 | 1.38 | 1.32 | 1.04 | 1.52 | 4.00 | 0.38 |
| C6 | 2.99 | 2.20 | 1.36 | 2.41 | 1.32 | 1.83 | 2.68 | 4.00 | 0.67 | |
| C7 | 2.78 | 2.20 | 1.26 | 2.08 | 1.32 | 1.58 | 2.41 | 4.00 | 0.60 | |
| C8 | 2.42 | 2.20 | 1.10 | 2.18 | 1.32 | 1.65 | 2.29 | 4.00 | 0.57 | |
| Desayi [28] | S101 | 3.86 | 2.21 | 1.74 | 1.49 | 1.04 | 1.44 | 3.44 | 4.02 | 0.86 |
| S201 | 5.56 | 2.21 | 2.51 | 2.15 | 1.19 | 1.81 | 4.96 | 4.02 | 1.23 | |
| S301 | 6.52 | 1.65 | 3.95 | 2.52 | 1.08 | 2.34 | 5.82 | 3.00 | 1.94 | |
| S102 | 4.87 | 1.84 | 2.65 | 2.39 | 0.92 | 2.61 | 4.78 | 3.34 | 1.43 | |
| S202 | 3.80 | 1.92 | 1.98 | 1.86 | 1.08 | 1.72 | 3.73 | 3.50 | 1.07 | |
| S302 | 3.99 | 1.75 | 2.29 | 1.95 | 1.12 | 1.75 | 3.92 | 3.17 | 1.23 | |
| Walker [29] | SC1 | 2.38 | 2.17 | 1.10 | 1.98 | 1.32 | 1.49 | 2.14 | 3.95 | 0.54 |
| SC2 | 2.25 | 2.28 | 0.99 | 1.81 | 1.35 | 1.34 | 2.00 | 4.15 | 0.48 | |
| SC3 | 2.82 | 2.02 | 1.40 | 1.80 | 1.25 | 1.44 | 2.28 | 3.67 | 0.62 | |
| SC4 | 2.53 | 2.11 | 1.20 | 1.69 | 1.30 | 1.30 | 2.29 | 3.83 | 0.60 | |
| SC5 | 2.92 | 2.25 | 1.30 | 2.17 | 1.55 | 1.40 | 2.78 | 4.09 | 0.68 | |
| SC7 | 4.02 | 2.18 | 1.84 | 2.17 | 1.52 | 1.43 | 3.34 | 3.97 | 0.84 | |
| SC8 | 2.35 | 2.02 | 1.16 | 2.06 | 1.34 | 1.54 | 2.31 | 3.67 | 0.63 | |
| SC9 | 2.82 | 1.93 | 1.46 | 2.06 | 1.26 | 1.64 | 2.55 | 3.51 | 0.72 | |
| SC11 | 2.02 | 1.72 | 1.17 | 2.30 | 1.17 | 1.96 | 2.47 | 3.13 | 0.79 | |
| SC12 | 1.97 | 2.02 | 0.98 | 3.56 | 1.31 | 2.72 | 1.83 | 3.83 | 0.48 | |
| Stamenkovic [30] | C/C/1 | 2.67 | 2.04 | 1.31 | 2.09 | 1.28 | 1.64 | 3.65 | 3.70 | 0.99 |
| C/C/2 | 2.52 | 1.96 | 1.28 | 1.34 | 1.25 | 1.07 | 3.16 | 3.57 | 0.88 | |
| C/C/3 | 2.27 | 1.87 | 1.21 | 0.67 | 1.21 | 0.55 | 2.61 | 3.41 | 0.77 | |
| C/C/4 | 1.99 | 2.04 | 0.98 | 0.30 | 1.28 | 0.24 | 2.16 | 3.71 | 0.58 | |
| Ghali [18] | NH1 | 4.43 | 2.13 | 2.08 | 2.99 | 1.41 | 2.12 | 4.04 | 3.87 | 1.05 |
| NH2 | 4.15 | 2.14 | 1.94 | 2.83 | 1.42 | 2.00 | 3.80 | 3.90 | 0.98 | |
| NH3 | 4.28 | 2.58 | 1.66 | 2.98 | 2.13 | 1.40 | 1.58 | 1.48 | 1.07 | |
| NH4 | 2.79 | 2.00 | 1.39 | - | - | - | - | - | - | |
| NH5 | 5.69 | 1.95 | 2.93 | 3.64 | 2.01 | 1.82 | 1.35 | 0.94 | 1.44 | |
| Reference | Name | ACI [7] | SCIA (FEM) [33] | |||
|---|---|---|---|---|---|---|
| Pred (MPa) | Tested (MPa) | Result (MPa) | FEM Result/Pred | Tested/FEM Result | ||
| Narayani [19] | L1 | 1.89 | 2.58 | 4.24 | 2.24 | 0.61 |
| L3 | 2.98 | 3.23 | 2.48 | 0.83 | 1.30 | |
| L4 | 2.25 | 3.67 | 2.83 | 1.26 | 1.30 | |
| L5 | 4.41 | 3.23 | 2.48 | 0.56 | 1.30 | |
| L6 | 2.88 | 3.02 | 2.33 | 0.81 | 1.30 | |
| L10 | 2.87 | 3.22 | 2.48 | 0.86 | 1.30 | |
| Krüger [2] | P16A | 1.95 | 2.51 | 2.90 | 1.49 | 0.86 |
| P30A | 1.95 | 2.67 | 2.96 | 1.51 | 0.90 | |
| PP16B | 3.41 | 3.22 | 3.77 | 1.11 | 0.85 | |
| Moe [11] | M2A | 1.30 | 1.75 | 2.54 | 1.95 | 0.69 |
| M4A | 1.39 | 1.73 | 2.89 | 2.09 | 0.60 | |
| M2 | 1.67 | 2.43 | 3.58 | 2.14 | 0.68 | |
| M3 | 1.57 | 2.17 | 3.51 | 2.23 | 0.62 | |
| M6 | 1.70 | 2.25 | 3.23 | 1.90 | 0.70 | |
| M7 | 1.65 | 2.28 | 2.84 | 1.72 | 0.80 | |
| M8 | 1.64 | 2.19 | 3.66 | 2.24 | 0.60 | |
| M9 | 1.59 | 2.30 | 3.15 | 1.98 | 0.73 | |
| M10 | 1.52 | 2.16 | 3.42 | 2.26 | 0.63 | |
| Anis [21] | B.3 | 2.04 | 3.20 | 3.80 | 1.87 | 0.84 |
| B.4 | 2.01 | 3.01 | 3.28 | 1.63 | 0.92 | |
| B.5 | 1.99 | 3.48 | 3.77 | 1.90 | 0.92 | |
| B.6 | 2.07 | 4.08 | 4.47 | 2.17 | 0.91 | |
| Stamenkovic [23] | C/I/1 | 2.21 | 3.25 | 3.92 | 1.77 | 0.83 |
| C/I/2 | 2.01 | 3.20 | 3.91 | 1.95 | 0.82 | |
| C/I/3 | 1.86 | 3.00 | 3.72 | 2.00 | 0.81 | |
| C/I/4 | 1.85 | 3.16 | 3.96 | 2.14 | 0.80 | |
| C/Ir/1 | 1.75 | 3.68 | 3.20 | 1.83 | 1.15 | |
| C/Ir/2 | 1.99 | 3.87 | 3.31 | 1.66 | 1.17 | |
| C/Ir/3 | 1.97 | 1.92 | 1.64 | 0.83 | 1.17 | |
| C/Ir/4 | 1.90 | 1.65 | 1.37 | 0.72 | 1.20 | |
| Hanson [22] | A12 | 1.90 | 2.64 | 3.40 | 1.79 | 0.78 |
| B16 | 1.82 | 2.21 | 4.53 | 2.49 | 0.49 | |
| C17 | 1.98 | 1.94 | 2.70 | 1.37 | 0.72 | |
| Pina Ferreira [24] | S3 | 3.16 | 4.63 | 2.13 | 0.67 | 2.17 |
| S4 | 2.70 | 4.83 | 1.88 | 0.70 | 2.57 | |
| S6 | 2.34 | 3.52 | 12.76 | 5.46 | 0.28 | |
| S8 | 3.05 | 5.62 | 2.41 | 0.79 | 2.33 | |
| Reference | Name | ACI [7] | SCIA (FEM) [33] | |||
|---|---|---|---|---|---|---|
| Pred (MPa) | Tested (MPa) | Result (MPa) | FEM Result/Pred | Tested/FEM Result | ||
| Albuquerque [17] | L1 | 2.26 | 2.66 | 2.59 | 1.15 | 1.03 |
| L2 | 2.21 | 2.94 | 2.50 | 1.13 | 1.18 | |
| L3 | 2.22 | 4.98 | 2.92 | 1.32 | 1.71 | |
| L4 | 2.24 | 4.80 | 2.70 | 1.21 | 1.78 | |
| L5 | 2.37 | 4.75 | 3.33 | 1.41 | 1.43 | |
| L6 | 2.38 | 5.31 | 3.33 | 1.40 | 1.60 | |
| L7 | 2.33 | 6.58 | 3.67 | 1.57 | 1.79 | |
| L8 | 2.35 | 7.31 | 4.07 | 1.74 | 1.80 | |
| L9 | 2.72 | 4.57 | 2.59 | 0.95 | 1.76 | |
| L10 | 2.75 | 7.16 | 2.77 | 1.01 | 2.58 | |
| L11 | 2.17 | 6.62 | 3.77 | 1.74 | 1.76 | |
| L12 | 2.18 | 5.24 | 3.46 | 1.59 | 1.51 | |
| L13 | 2.19 | 7.55 | 4.28 | 1.95 | 1.76 | |
| Narayani [19] | ES1 | 1.92 | 2.83 | 2.68 | 1.40 | 1.06 |
| ES2 | 1.89 | 2.02 | 2.23 | 1.18 | 0.91 | |
| ES3 | 1.61 | 2.61 | 1.37 | 0.85 | 1.91 | |
| ES4 | 2.29 | 3.00 | 1.56 | 0.68 | 1.92 | |
| ES5 | 2.02 | 3.28 | 3.01 | 1.49 | 1.09 | |
| ES6 | 1.47 | 3.39 | 1.61 | 1.09 | 2.11 | |
| ES7 | 1.54 | 3.85 | 2.02 | 1.31 | 1.91 | |
| Zaghlool [20] | Z—IV (1) | 1.73 | 2.91 | 1.71 | 0.99 | 1.70 |
| Z—V (1) | 1.93 | 2.93 | 1.85 | 0.96 | 1.58 | |
| Z—V (2) | 2.10 | 3.72 | 2.13 | 1.02 | 1.74 | |
| Z—V (3) | 2.05 | 4.24 | 3.67 | 1.79 | 1.16 | |
| Z—V (4) | 1.95 | 4.38 | 1.20 | 0.61 | 3.66 | |
| Z—V (5) | 1.96 | 3.59 | 2.99 | 1.53 | 1.20 | |
| Z—V (6) | 1.85 | 3.24 | 1.56 | 0.85 | 2.07 | |
| Z—VI (1) | 1.68 | 2.95 | 4.30 | 2.56 | 0.69 | |
| Stamenkovic [23] | M(T)/E/1 | 1.82 | 4.43 | 3.41 | 1.87 | 1.30 |
| M(T)/E/2 | 1.90 | 4.35 | 3.34 | 1.76 | 1.30 | |
| C(T)/E/1 | 2.05 | 3.25 | 2.92 | 1.43 | 1.11 | |
| C(T)/E/2 | 1.88 | 3.62 | 3.87 | 2.06 | 0.93 | |
| C(T)/E/3 | 1.92 | 3.77 | 4.11 | 2.14 | 0.92 | |
| C(T)/E/4 | 1.93 | 3.95 | 3.57 | 1.85 | 1.11 | |
| V/E/1 | 1.98 | 4.37 | 4.22 | 2.13 | 1.04 | |
| M(II)/E/1 | 1.99 | 2.64 | 3.20 | 1.61 | 0.82 | |
| C(II)/E/1 | 1.95 | 3.74 | 6.91 | 3.55 | 0.54 | |
| C(II)/E/2 | 1.97 | 3.28 | 5.63 | 2.86 | 0.58 | |
| C(II)/E/3 | 1.95 | 3.42 | 5.78 | 2.97 | 0.59 | |
| C(II)/E/4 | 1.99 | 2.96 | 4.26 | 2.14 | 0.70 | |
| Hanson [22] | D15 | 1.84 | 3.89 | 1.67 | 0.91 | 2.32 |
| Ritchie [25] | 1 | 1.69 | 1.61 | 1.35 | 0.80 | 1.19 |
| Sudarsana [26] | E1 | 2.18 | 2.60 | 5.02 | 2.30 | 0.52 |
| E2 | 2.15 | 4.18 | 2.53 | 1.18 | 1.65 | |
| E4 | 2.18 | 1.61 | 2.37 | 1.09 | 0.68 | |
| E1-1 | 2.40 | 1.13 | 0.83 | 0.35 | 1.36 | |
| E1-2 | 2.40 | 3.26 | 6.63 | 2.76 | 0.49 | |
| E1-3 | 2.45 | 3.99 | 5.29 | 2.16 | 0.75 | |
| E1-4 | 2.40 | 2.79 | 5.64 | 2.35 | 0.50 | |
| E2-1 | 2.40 | 2.64 | 5.19 | 2.16 | 0.51 | |
| E2-2 | 2.40 | 2.62 | 4.37 | 1.82 | 0.60 | |
| E2-3 | 2.45 | 5.28 | 3.57 | 1.46 | 1.48 | |
| E2-4 | 2.45 | 2.39 | 3.18 | 1.30 | 0.75 | |
| Zaghloul [27] | ZJESSS | 4.02 | 4.93 | 2.20 | 0.55 | 2.24 |
| ZJES | 2.14 | 2.52 | 4.80 | 2.24 | 0.52 | |
| Reference | Name | ACI [7] | SCIA (FEM) [33] | |||
|---|---|---|---|---|---|---|
| Pred (MPa) | Tested (MPa) | Result (MPa) | FEM Result/Pred | Tested/FEM Result | ||
| Zaghlool [20] | Z—I (1) | 1.89 | 2.89 | 1.83 | 0.97 | 1.58 |
| Z—II (1) | 1.90 | 3.38 | 3.77 | 1.99 | 0.90 | |
| Z—II (2) | 1.91 | 4.62 | 4.28 | 2.24 | 1.08 | |
| Z—II (3) | 1.74 | 5.13 | 4.13 | 2.38 | 1.24 | |
| Z—II (4) | 1.83 | 2.00 | 4.03 | 2.20 | 0.49 | |
| Z—II (6) | 1.91 | 3.14 | 2.16 | 1.13 | 1.45 | |
| Z—III (1) | 1.91 | 3.06 | 5.08 | 2.65 | 0.60 | |
| Sudarsana [26] | C5 | 2.20 | 1.69 | 2.44 | 1.11 | 0.69 |
| C6 | 2.20 | 2.99 | 4.32 | 1.96 | 0.69 | |
| C7 | 2.20 | 2.78 | 4.21 | 1.91 | 0.66 | |
| C8 | 2.20 | 2.42 | 3.59 | 1.63 | 0.68 | |
| Desayi [28] | S101 | 2.21 | 3.86 | 3.72 | 1.68 | 1.04 |
| S201 | 2.21 | 5.56 | 5.36 | 2.42 | 1.04 | |
| S301 | 1.65 | 6.52 | 6.29 | 3.81 | 1.04 | |
| S102 | 1.84 | 4.87 | 7.89 | 4.29 | 0.62 | |
| S202 | 1.92 | 3.80 | 6.16 | 3.20 | 0.62 | |
| S302 | 1.75 | 3.99 | 6.46 | 3.70 | 0.62 | |
| Walker [29] | SC1 | 2.17 | 2.38 | 3.88 | 1.79 | 0.61 |
| SC2 | 2.28 | 2.25 | 3.56 | 1.56 | 0.63 | |
| SC3 | 2.02 | 2.82 | 3.53 | 1.75 | 0.80 | |
| SC4 | 2.11 | 2.53 | 2.70 | 1.28 | 0.94 | |
| SC5 | 2.25 | 2.92 | 3.49 | 1.55 | 0.84 | |
| SC7 | 2.18 | 4.02 | 3.49 | 1.60 | 1.15 | |
| SC8 | 2.02 | 2.35 | 5.06 | 2.50 | 0.47 | |
| SC9 | 1.93 | 2.82 | 5.06 | 2.62 | 0.56 | |
| SC11 | 1.72 | 2.02 | 5.23 | 3.04 | 0.39 | |
| SC12 | 2.02 | 1.97 | 3.61 | 1.79 | 0.55 | |
| Stamenkovic [30] | C/C/1 | 2.04 | 2.67 | 6.69 | 3.29 | 0.40 |
| C/C/2 | 1.96 | 2.52 | 6.13 | 3.12 | 0.41 | |
| C/C/3 | 1.87 | 2.27 | 5.37 | 2.87 | 0.42 | |
| C/C/4 | 2.04 | 1.99 | 4.66 | 2.28 | 0.43 | |
| Ghali [18] | NH1 | 2.13 | 4.43 | 3.59 | 1.69 | 1.24 |
| NH2 | 2.14 | 4.15 | 1.39 | 0.65 | 2.99 | |
| NH3 | 2.58 | 4.28 | 7.72 | 2.99 | 0.55 | |
| NH4 | 2.00 | 2.79 | 5.36 | 2.67 | 0.52 | |
| NH5 | 1.95 | 5.69 | 8.91 | 4.58 | 0.64 | |
References
- Wight, J.; MacGregor, J. Analysis, and Design. In Reinforced Concrete Mechanics & Design, 6th ed.; Pearson: London, UK, 2010; Volume 1. [Google Scholar]
- Krüger, G. Résistance au Poinçonnement Excentré des Planchers-Dalles; EPFL: Écublens, Switzerland, 1999. [Google Scholar]
- Muttoni, A.; Ruiz, M.F.; Simões, J.T. The theoretical principles of the critical shear crack theory for punching shear failures and derivation of consistent closed-form design expressions. Struct. Concr. 2018, 19, 174–190. [Google Scholar] [CrossRef] [Green Version]
- Mirzaei, Y. Post punching behaviour of reinforced concrete slab-column connections. In Proceedings of the 7th International FIB PhD Symposium, Stuttgart, Germany, 11–13 September 2008. [Google Scholar]
- Kinnunen, S.; Nylander, H. Punching of concrete slabs without shear reinforcement. Elander 1960, 158, 112. [Google Scholar]
- Muttoni, A.; Ruiz, M.F. The levels-of-approximation approach in MC 2010: Application to punching shear provisions. Struct. Concr. 2012, 13, 32–41. [Google Scholar] [CrossRef] [Green Version]
- ACI Committee 318. ACI CODE-318-19: Building Code Requirements for Structural Concrete and Commentary; American Concrete Institute: Farmington Hills, MI, USA, 2019. [Google Scholar]
- European Committee for Standardization and British Standards Institution. Eurocode 2: Design of Concrete Structures; British Standards Institution: London, UK, 2005. [Google Scholar]
- The International Federation for Structural Concrete. fib Bulletin 55. Model Code 2010 First Complete Draft; fib: Lausanne, Switzerland, 2010; Volume 1. [Google Scholar] [CrossRef]
- Park, H.; Choi, K. Improved Strength Model for Interior Flat Plate-Column Connections Subject to Unbalanced Moment. ASCE J. Struct. Eng. 2006, 694, 694–704. [Google Scholar] [CrossRef]
- Moe, J. Shearing Strength of Reinforced Concrete Slabs and Footings under Concentrated Loads; Development Department Bulletin No. D47; Portland Cement Association: Skokie, IL, USA, 1961. [Google Scholar]
- ACI-ASCE Committee 426. The Shear Strength of Reinforced Concrete Members. Chapter 5, Shear Strength of Slabs. Proc. ASCE J. Struct. Div. 1974, 100, 1543–1591. [Google Scholar] [CrossRef]
- Mast, P.E. Stresses in Flat Plates Near Columns. J. Proc. 1970, 67, 761–768. [Google Scholar]
- The International Federation for Structural Concrete. fib Bulleting 2. Textbook on Behavior, Design and Performance Updated Knowledge of the CEB/FIP Model Code 1990; fib: Lausanne, Switzerland, 1999; Volume 2. [Google Scholar] [CrossRef]
- Muttoni, A. Punching Shear Strength of Reinforced Concrete Slabs without Transverse Reinforcement. ACI Struct. J. 2008, 105, 440–450. [Google Scholar]
- Fernández Ruiz, M.; Muttoni, A. Application of Critical Shear Crack Theory to Punching of Reinforced Concrete Slabs with Transverse Reinforcement. ACI Struct. J. 2009, 106, 485–494. [Google Scholar]
- Albuquerque, N.G.B.; Melo, G.S.; Vollum, R.L. Punching Shear Strength of Flat Slab-Edge Column Connections with Outward Eccentricity of Loading. ACI Struct. J. 2016, 113, 1117–1129. [Google Scholar] [CrossRef]
- Hammil, N.; Ghali, A. Punching Shear Resistance of Corner Slab-Column Connections. ACI Struct. J. 1994, 91, 697–707. [Google Scholar] [CrossRef]
- Narayani, N. Shear Reinforcement in Reinforced Concrete Column Heads. Ph.D. Thesis, Faculty of Engineering, Imperial College of Science and Technology, London, UK, 1971. [Google Scholar]
- Zaghlool, E.E.-D.R.F. Strength and Behaviour of Corner and Edge Column-Slab Connections in Reinforced Concrete Flat Plates. Ph.D. Thesis, University of Calgary, Calgary, AB, Canada, 1971. [Google Scholar]
- Anis, N.N. Shear Strength of Reinforced Concrete Flat Slabs without Shear Reinforcement. Ph.D. Thesis, Imperial College London, London, UK, 1970. [Google Scholar]
- Hanson, N.W.; Hanson, J.M. Shear and Moment Transfer between Concrete Slabs and Columns. J. PCA Res. Dev. Lab. 1968, 11, 2–16. Available online: https://www.concrete.org/publications/internationalconcreteabstractsportal/m/details/id/19463 (accessed on 3 April 2022).
- Stamenkovic, A. Local Strength of Flat Slabs At Column Heads. Ph.D. Thesis, Imperial College London, London, UK, 1970. [Google Scholar]
- De Pina Ferreira, M.; Oliveira, M.H.; Melo, G.S.S.A. Tests on the punching resistance of flat slabs with unbalanced moments. Eng. Struct. 2019, 196, 109311. [Google Scholar] [CrossRef]
- Ritchie, M.; Ghali, A.; Dilger, W.; Gayed, R.B. Unbalanced Moment Resistance by shear in Slab-Column Connections: Experimental Assessment. ACI Struct. J. 2006, 103, 74–82. [Google Scholar]
- Sudarsana, I.K. Punching Shear in Edge and Corner Column Slab Connections of Flat Plate Structures. Ph.D. Thesis, Department of Civil Engineering, University of Ottawa, Ottawa, ON, Cananda, December 2001. [Google Scholar]
- Zaghloul, A. Punching Shear Strength of Interior and Edge Column-Slab Connections in CFRP Reinforced Flat Plate Structures Transferring Shear and Moment. Ph.D. Thesis, Department of Civil and Environmental Engineering, University of Ottawa, Ottawa, ON, Canada, February 2007. [Google Scholar]
- Desayi, P.; Seshadri, H.K. Punching shear strength of flat slab corner column connections. In Part 1. Reinforced Concrete Connections; Department of Civil Engineering, Indian Institute of Science: Bangalore, India, 1997. [Google Scholar]
- Walker, P.R.; Regan, P.E. Corner column-slab connections in concrete flat plates. ASCE J. Struct. Eng. 1987, 113, 704–720. [Google Scholar] [CrossRef]
- Stamenkovic, A.; Chapman, J.C. Local strength at column heads in flat slabs subjected to a combines vertical and horizontal loading. Proc. ICE 1974, 57, 205–232. [Google Scholar]
- Vargas, D.; Lantsoght, E.; Genikomsou, K. Spreadsheet for Flat Slabs in Eccentric Punching Shear: Experimental Database and Analysis; Zenodo: Quito, Ecuador, 2022. [Google Scholar] [CrossRef]
- Sarveghadi, M.; Gandomi, A.H.; Bolandi, H.; Alavi, A.H. Development of prediction models for shear strength of SFRCB using a machine learning approach. Neural Comput. Appl. 2019, 31, 2085–2094. [Google Scholar] [CrossRef]
- Nemetschek Group. SCIA Downloads. 17 May 2022. Available online: https://www.scia.net/en/scia-engineer/downloads (accessed on 3 April 2022).
- Lantsoght, E. Database of Shear Experiments on Steel Fiber Reinforced Concrete Beams without Stirrups. Materials 2019, 12, 917. [Google Scholar] [CrossRef] [PubMed] [Green Version]
- Vargas, D.; Lantsoght, E.; Genikomsou, K. Spreadsheet Validation for Flat slabs in Eccentric Punching Shear Experimental Database and Analysis; Zenodo: Quito, Ecuador, 2022. [Google Scholar] [CrossRef]
- Ngo, T. Punching shear resistance of high-strength concrete slabs. Electron. J. Struct. Eng. 2001, 1, 52–59. Available online: https://ejsei.com/EJSE/article/view/14 (accessed on 3 April 2022). [CrossRef]
- Guandallini, S.; Burdet, O.L.; Muttoni, A. Punching Tests of Slabs with Low Reinforcement Ratios. ACI Struct. J. 2009, 106, 87–95. [Google Scholar]
- Carrera, B.; Lantsoght, E.O.L.; Alexander, S.D.B. Application of Strip Model to Edge Column-Lab Connections Loaded with Outward Eccentricity; ACI: Farmington Hills, MI, USA, 2022; Volume 353, pp. 124–141. Available online: https://www.concrete.org/publications/internationalconcreteabstractsportal.aspx?m=details&id=51737115 (accessed on 3 April 2022).


| Parameter | Min | Max | Mean | Median | STD |
|---|---|---|---|---|---|
| Lx (mm) | 530 | 3000 | 1275 | 1075 | 631 |
| Ly (mm) | 530 | 3000 | 1383 | 1525 | 632 |
| h (mm) | 76 | 180 | 126 | 150 | 39 |
| d (mm) | 56 | 151 | 98 | 114 | 33 |
| ρl (%) | 0.53% | 2.23% | 1.3% | 1.2% | 0.3% |
| fc (MPa) | 15.5 | 59.3 | 37.4 | 37.0 | 8.8 |
| dg (mm) | 9.5 | 38.1 | 13.2 | 10.0 | 7.8 |
| a (mm) | 419 | 2000 | 905 | 860 | 422 |
| av (mm) | 343 | 1850 | 788 | 749 | 405 |
| All Results | |||
|---|---|---|---|
| AVG | STD | COV (%) | |
| ACI (128) | 1.65 | 0.58 | 35.39 |
| EC2 (122) | 1.52 | 0.69 | 45.38 |
| MC2010 (122) | 0.82 | 0.24 | 29.63 |
| Internal slab–column connections | |||
| AVG | STD | COV (%) | |
| ACI (37) | 1.41 | 0.31 | 22.27 |
| EC2 (37) | 1.15 | 0.22 | 19.00 |
| MC2010 (37) | 0.81 | 0.17 | 20.47 |
| Edge slab–column connections | |||
| AVG | STD | COV (%) | |
| ACI (55) | 1.79 | 0.61 | 33.78 |
| EC2 (51) | 1.70 | 0.88 | 51.93 |
| MC2010 (51) | 0.79 | 0.21 | 26.20 |
| Corner slab–column connections | |||
| AVG | STD | COV (%) | |
| ACI (36) | 1.67 | 0.69 | 41.18 |
| EC2 (34) | 1.66 | 0.54 | 32.75 |
| MC2010 (34) | 0.88 | 0.34 | 38.70 |
| Slabs without Shear Reinforcement | |||
|---|---|---|---|
| AVG | STD | COV (%) | |
| ACI (110) | 1.65 | 0.58 | 35.24 |
| EC2 (104) | 1.51 | 0.68 | 45.17 |
| MC2010 (104) | 0.80 | 0.25 | 30.70 |
| Internal slab–column connections | |||
| AVG | STD | COV (%) | |
| ACI (28) | 1.45 | 0.28 | 19.43 |
| EC2 (28) | 1.15 | 0.23 | 19.71 |
| MC2010 (28) | 0.77 | 0.15 | 19.25 |
| Edge slab–column connections | |||
| AVG | STD | COV (%) | |
| ACI (48) | 1.78 | 0.62 | 34.60 |
| EC2 (44) | 1.64 | 0.86 | 52.58 |
| MC2010 (44) | 0.79 | 0.22 | 27.57 |
| Corner slab–column connections | |||
| AVG | STD | COV (%) | |
| ACI (34) | 1.63 | 0.67 | 41.16 |
| EC2 (32) | 1.66 | 0.56 | 33.56 |
| MC2010 (32) | 0.86 | 0.34 | 39.07 |
| Shear-Reinforced Slabs | |||
|---|---|---|---|
| AVG | STD | COV (%) | |
| ACI (18) | 1.64 | 0.61 | 37.32 |
| EC2 (18) | 1.59 | 0.75 | 47.54 |
| MC2010 (18) | 0.93 | 0.20 | 21.35 |
| Internal slab–column connections | |||
| AVG | STD | COV (%) | |
| ACI (9) | 1.30 | 0.40 | 30.64 |
| EC2 (9) | 1.18 | 0.21 | 17.65 |
| MC2010 (9) | 0.93 | 0.16 | 17.14 |
| Edge slab–column connections | |||
| 1.89 | 0.57 | 30.02 | |
| ACI (7) | 2.10 | 0.99 | 46.99 |
| EC2 (7) | 0.83 | 0.14 | 17.27 |
| MC2010 (7) | 1.89 | 0.57 | 30.02 |
| Corner slab–column connections | |||
| AVG | STD | COV (%) | |
| ACI (2) | 2.29 | 0.90 | 39.09 |
| EC2 (2) | 1.61 | 0.29 | 18.30 |
| MC2010 (2) | 1.25 | 0.26 | 20.88 |
| AVG | STD | COV (%) | |
|---|---|---|---|
| All specimens | 1.81 | 0.85 | 46.94 |
| Internal slab–column connections | 1.70 | 0.85 | 50.02 |
| Edge slab–column connections | 1.57 | 0.66 | 42.15 |
| Corner slab–column connections | 2.30 | 0.93 | 40.18 |
| AVG | STD | COV (%) | |
|---|---|---|---|
| All specimens | 1.09 | 0.59 | 54.37 |
| Internal slab–column connections | 0.99 | 0.49 | 49.09 |
| Edge slab–column connections | 1.33 | 0.63 | 47.85 |
| Corner slab–column connections | 0.82 | 0.48 | 58.59 |
Publisher’s Note: MDPI stays neutral with regard to jurisdictional claims in published maps and institutional affiliations. |
© 2022 by the authors. Licensee MDPI, Basel, Switzerland. This article is an open access article distributed under the terms and conditions of the Creative Commons Attribution (CC BY) license (https://creativecommons.org/licenses/by/4.0/).
Share and Cite
Vargas, D.; Lantsoght, E.O.L.; Genikomsou, A.S. Flat Slabs in Eccentric Punching Shear: Experimental Database and Code Analysis. Buildings 2022, 12, 2092. https://doi.org/10.3390/buildings12122092
Vargas D, Lantsoght EOL, Genikomsou AS. Flat Slabs in Eccentric Punching Shear: Experimental Database and Code Analysis. Buildings. 2022; 12(12):2092. https://doi.org/10.3390/buildings12122092
Chicago/Turabian StyleVargas, Daniel, Eva O. L. Lantsoght, and Aikaterini S. Genikomsou. 2022. "Flat Slabs in Eccentric Punching Shear: Experimental Database and Code Analysis" Buildings 12, no. 12: 2092. https://doi.org/10.3390/buildings12122092
APA StyleVargas, D., Lantsoght, E. O. L., & Genikomsou, A. S. (2022). Flat Slabs in Eccentric Punching Shear: Experimental Database and Code Analysis. Buildings, 12(12), 2092. https://doi.org/10.3390/buildings12122092