Article

Shear Behavior of T-Shaped Concrete Beams Reinforced with FRP

1
Hebei Key Laboratory for Diagnosis, Reconstruction and Anti-Disaster of Civil Engineering, Zhangjiakou 075000, China
2
School of Civil Engineering, Shenyang Jianzhu University, Shenyang 110168, China
3
School of Materials Science and Engineering, Shenyang Jianzhu University, Shenyang 110168, China
4
School of Science, Shenyang Jianzhu University, Shenyang 110168, China
5
Science and Technology Innovation Center of Smart Water and Resource Environment, Northeastern University, Shenyang 110819, China
6
Automobile Branch of Shenyang Polytechnic College, Shenyang 110015, China
*
Author to whom correspondence should be addressed.
Buildings 2022, 12(12), 2062; https://doi.org/10.3390/buildings12122062
Submission received: 8 October 2022 / Revised: 14 November 2022 / Accepted: 17 November 2022 / Published: 24 November 2022
(This article belongs to the Special Issue Materials in Sustainable Buildings)

Abstract

:
The calculation formula for bearing capacity was verified and further corrected through the current study of the influences of different parameters on the shear behavior of concrete T-beams reinforced with surface-embedded FRP. Tests were conducted on 14 beams reinforced with FRP tendons, including assessments of different concrete strength grades, longitudinal reinforcement ratios, surface characteristics, types, diameters, reinforcement modes, FRP spacings, and specimen shear span ratios. The results show that surface-embedded FRP reinforcement technology can be utilized to improve the overall stiffness and shear strength of beams, delay the development of oblique cracking, reduce the width of diagonal cracking, and improve the bite cooperation between concrete aggregates, thus improving the manifestation of reinforcement. The shear failure mechanism of reinforced concrete beams, strengthened with surface-embedded FRP, seemed to be similar to that of ordinary reinforced concrete beams. The mechanism of action was identical to that of stirrups, and the utilization factor of FRPs was determined.

1. Introduction

Reinforced concrete (RC) beams often need to be upgraded during building retrofits due to inadequate reinforcement designs, changes in building codes, and changes in building use [1,2,3]. An innovative method for shear reinforcement of reinforced concrete beams is the use of externally bonded fiber-reinforced polymer (FRP) composites [4,5,6]. This enhancement technique has been studied extensively. Compared with beams without FRPs, this technique has been shown to increase the maximum shear strength of structures by between 15.4% to 42.2%. The increase in shear strength depends on the type of FRP and the amount of internal shear reinforcement [7]. Hawley et al. studied the influence of the reinforcement ratio on the FRP reinforcement effect [8].
A previous study [9] evaluated the shear strength of concrete beams and slabs reinforced with different reinforced polymer (FRP) bars. The impact of the low elastic modulus and nonyielding characteristics of FRP on the shear strength of concrete was discussed. Seven concrete beams, reinforced with glass-fiber-reinforced polymer (GFRP) and carbon-fiber-reinforced polymer (CFRP), were subjected to four-point loading until failure. Steel stirrups were used as shear reinforcement bars for all beams. A simplified expression of shear capacity was derived for FRP-reinforced concrete members. Hu et al. [10] proposed and tested two shear reinforcement techniques and effective anchoring devices, using U-shaped carbon-fiber-reinforced plastic (CFRP) to improve existing RC beams’ shear strength and ductility. The results show that both reinforcement systems enhanced RC beams’ shear capacity and flexibility.
Almost all shear failures of RC beams reinforced with FRP cladding are due to FRP fractures. Therefore, the failure process of these beams is related to FRP debonding and fracture failure. Despite extensive research over the past decade, there is still a lack of understanding of failure development in FRP-reinforced beams and how it affects the shear behavior of beams [11,12]. A previous study [13] showed that fracture process zones and fiber-reinforced polymer sheets positively affected fracture toughness and played an essential role in preventing shear crack growth. In the case of U-shaped schemes, several researchers have introduced different FRP anchorage types that effectively increase the FRPs’ shear contribution [14,15]. Alam et al. [16] also studied the effect of size on the shear strength and properties of fiber-reinforced polymer (FRP)-reinforced concrete beams. Ahmed et al. [17] showed that the section shape, FRP dip angle, and FRP anchorage efficiency significantly affect the shear strength of beams. The shear interaction between the inner and outer transverse reinforcement was also key to shear performance [18,19].
However, many factors related to the shearing response affect concrete beams were strengthened with embedded FRPs. The research on failure mode, shear deformation performance, and shear capacity is still insufficient, and further research is needed. The purpose of this study was to consider the impacts of concrete strength grade, longitudinal reinforcement ratio, FRP surface characteristics, type, diameter, reinforcement method, FRP spacing, and specimen shear span ratio on the shear performance of surface-embedded FRP-reinforced concrete T-shaped beams. The shear failure mechanisms of the concrete beam with FRP bars and the supporting concrete parameters (type, diameter, reinforcement, FRP bar spacing, shear span of the specimen) are analyzed comprehensively based on truss theory. The utilization factor of the FRP was determined.

2. Experimental Procedure

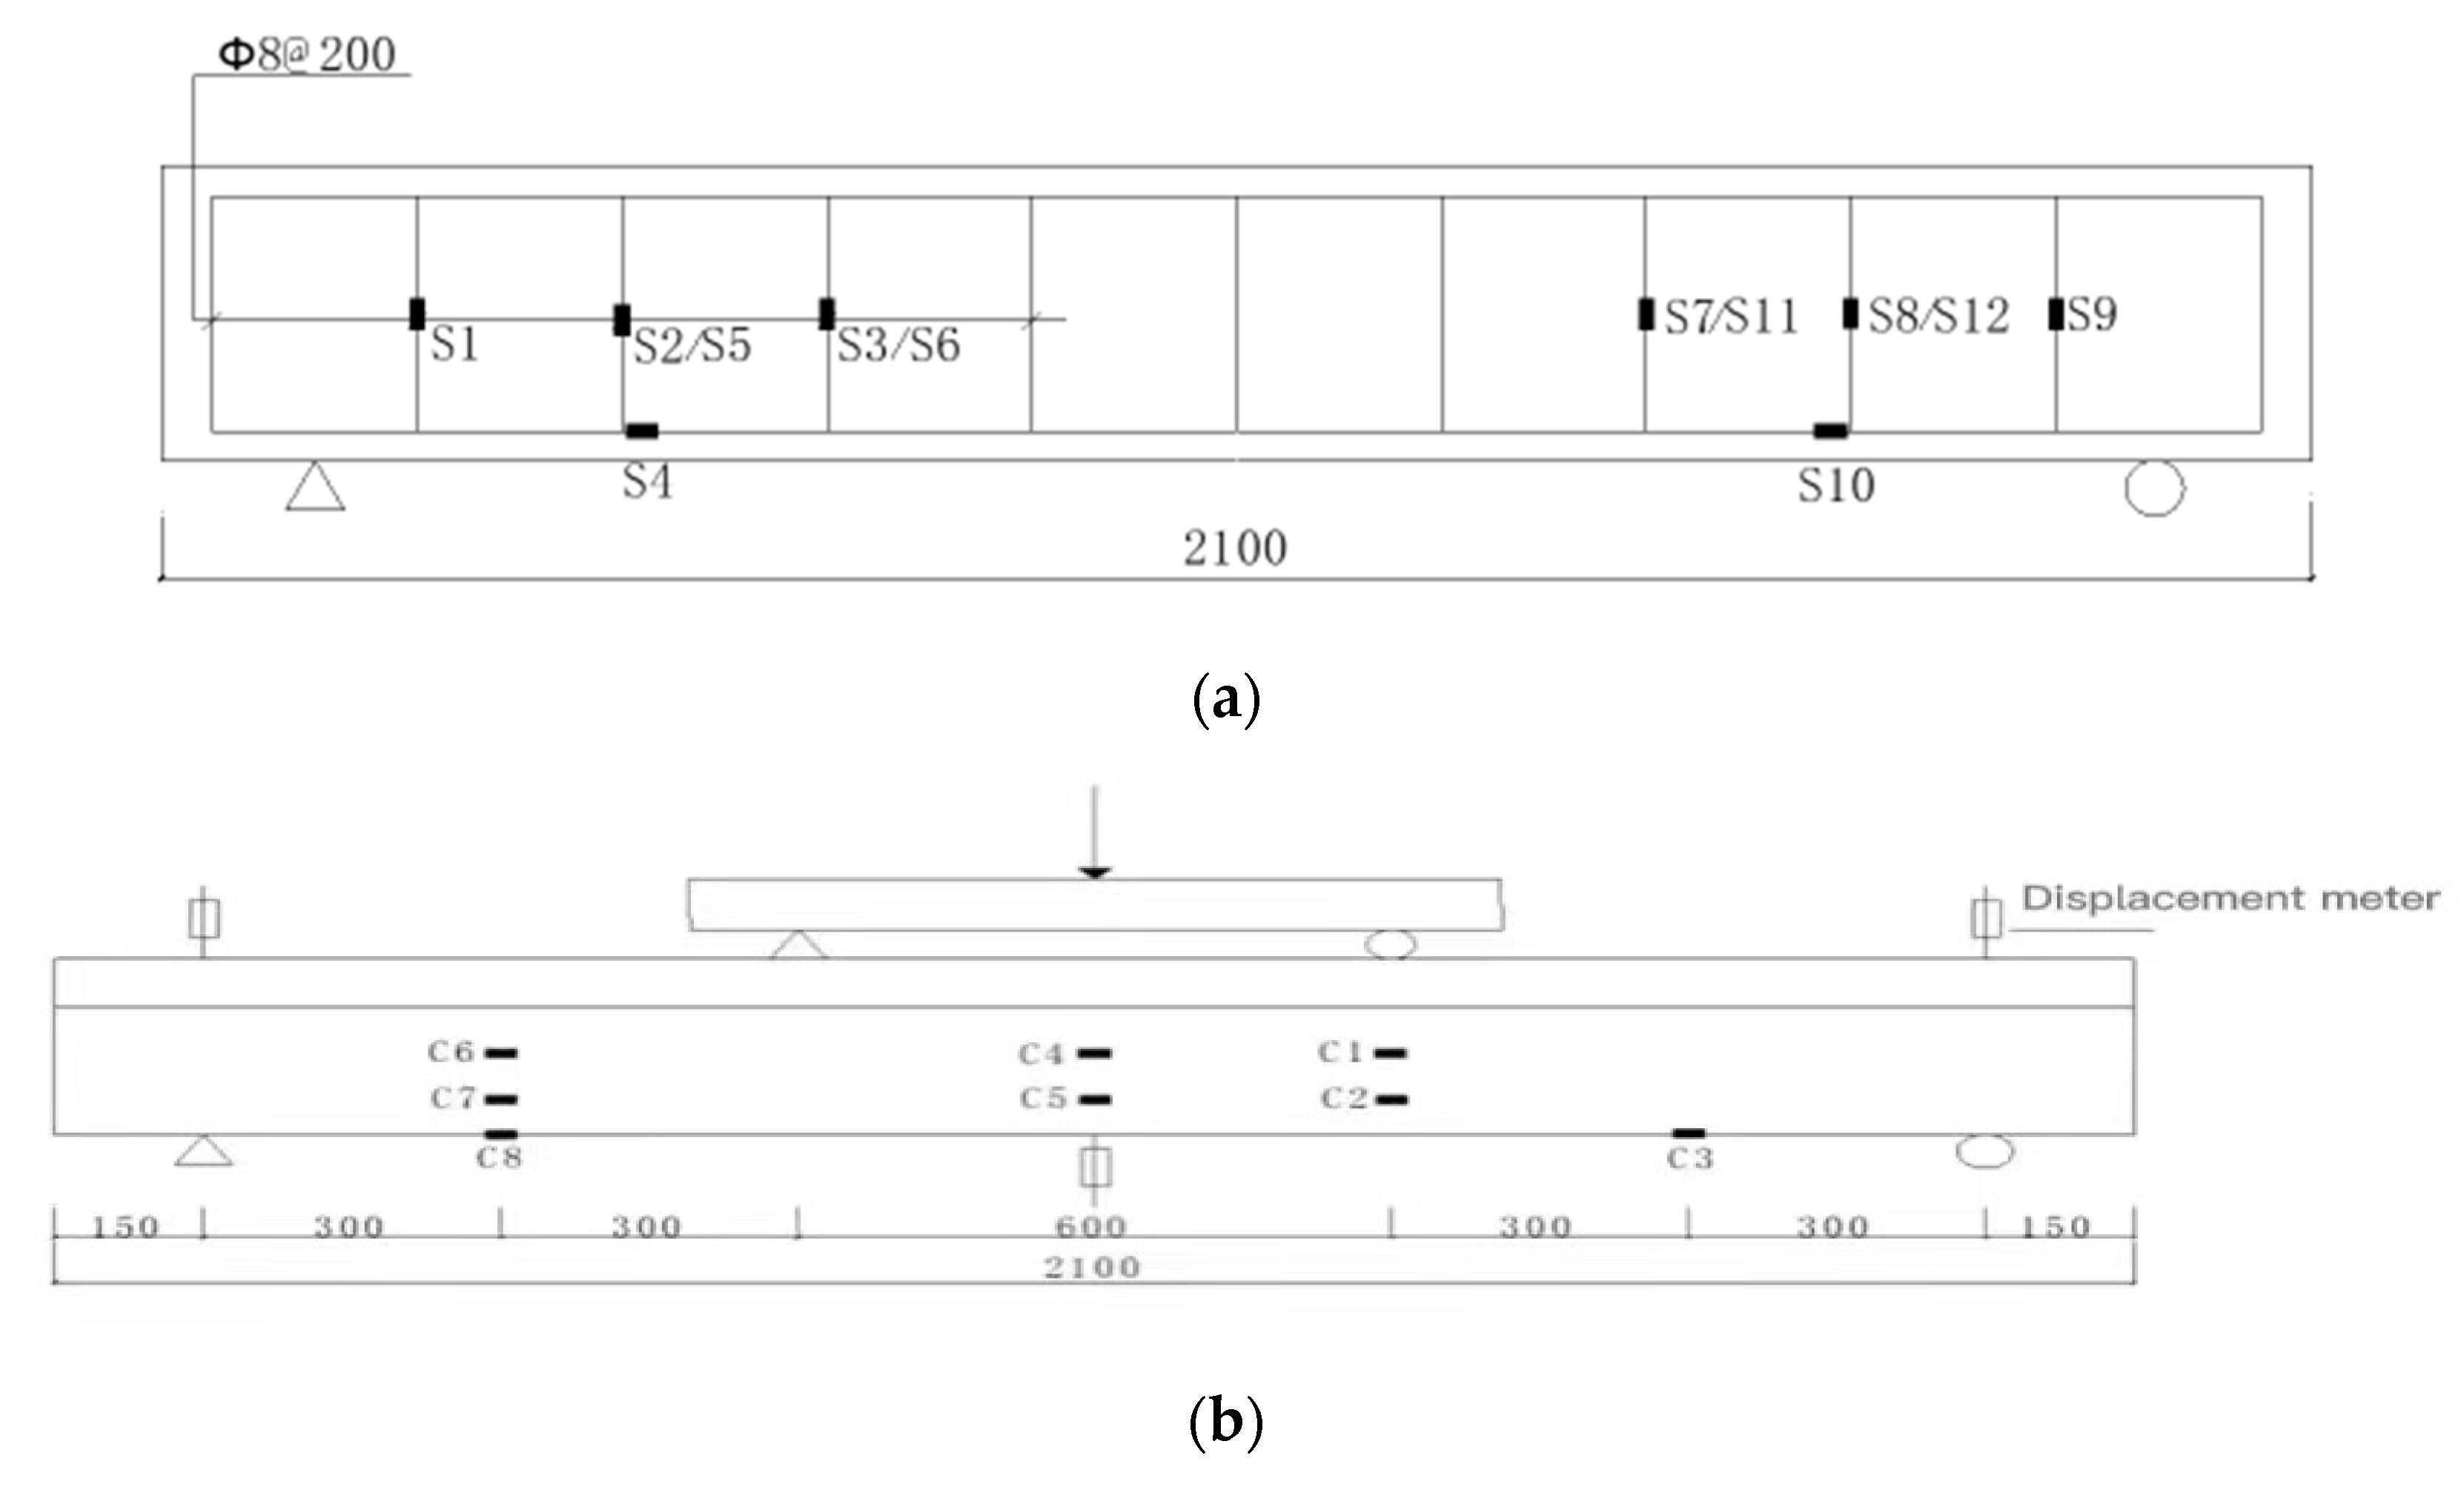
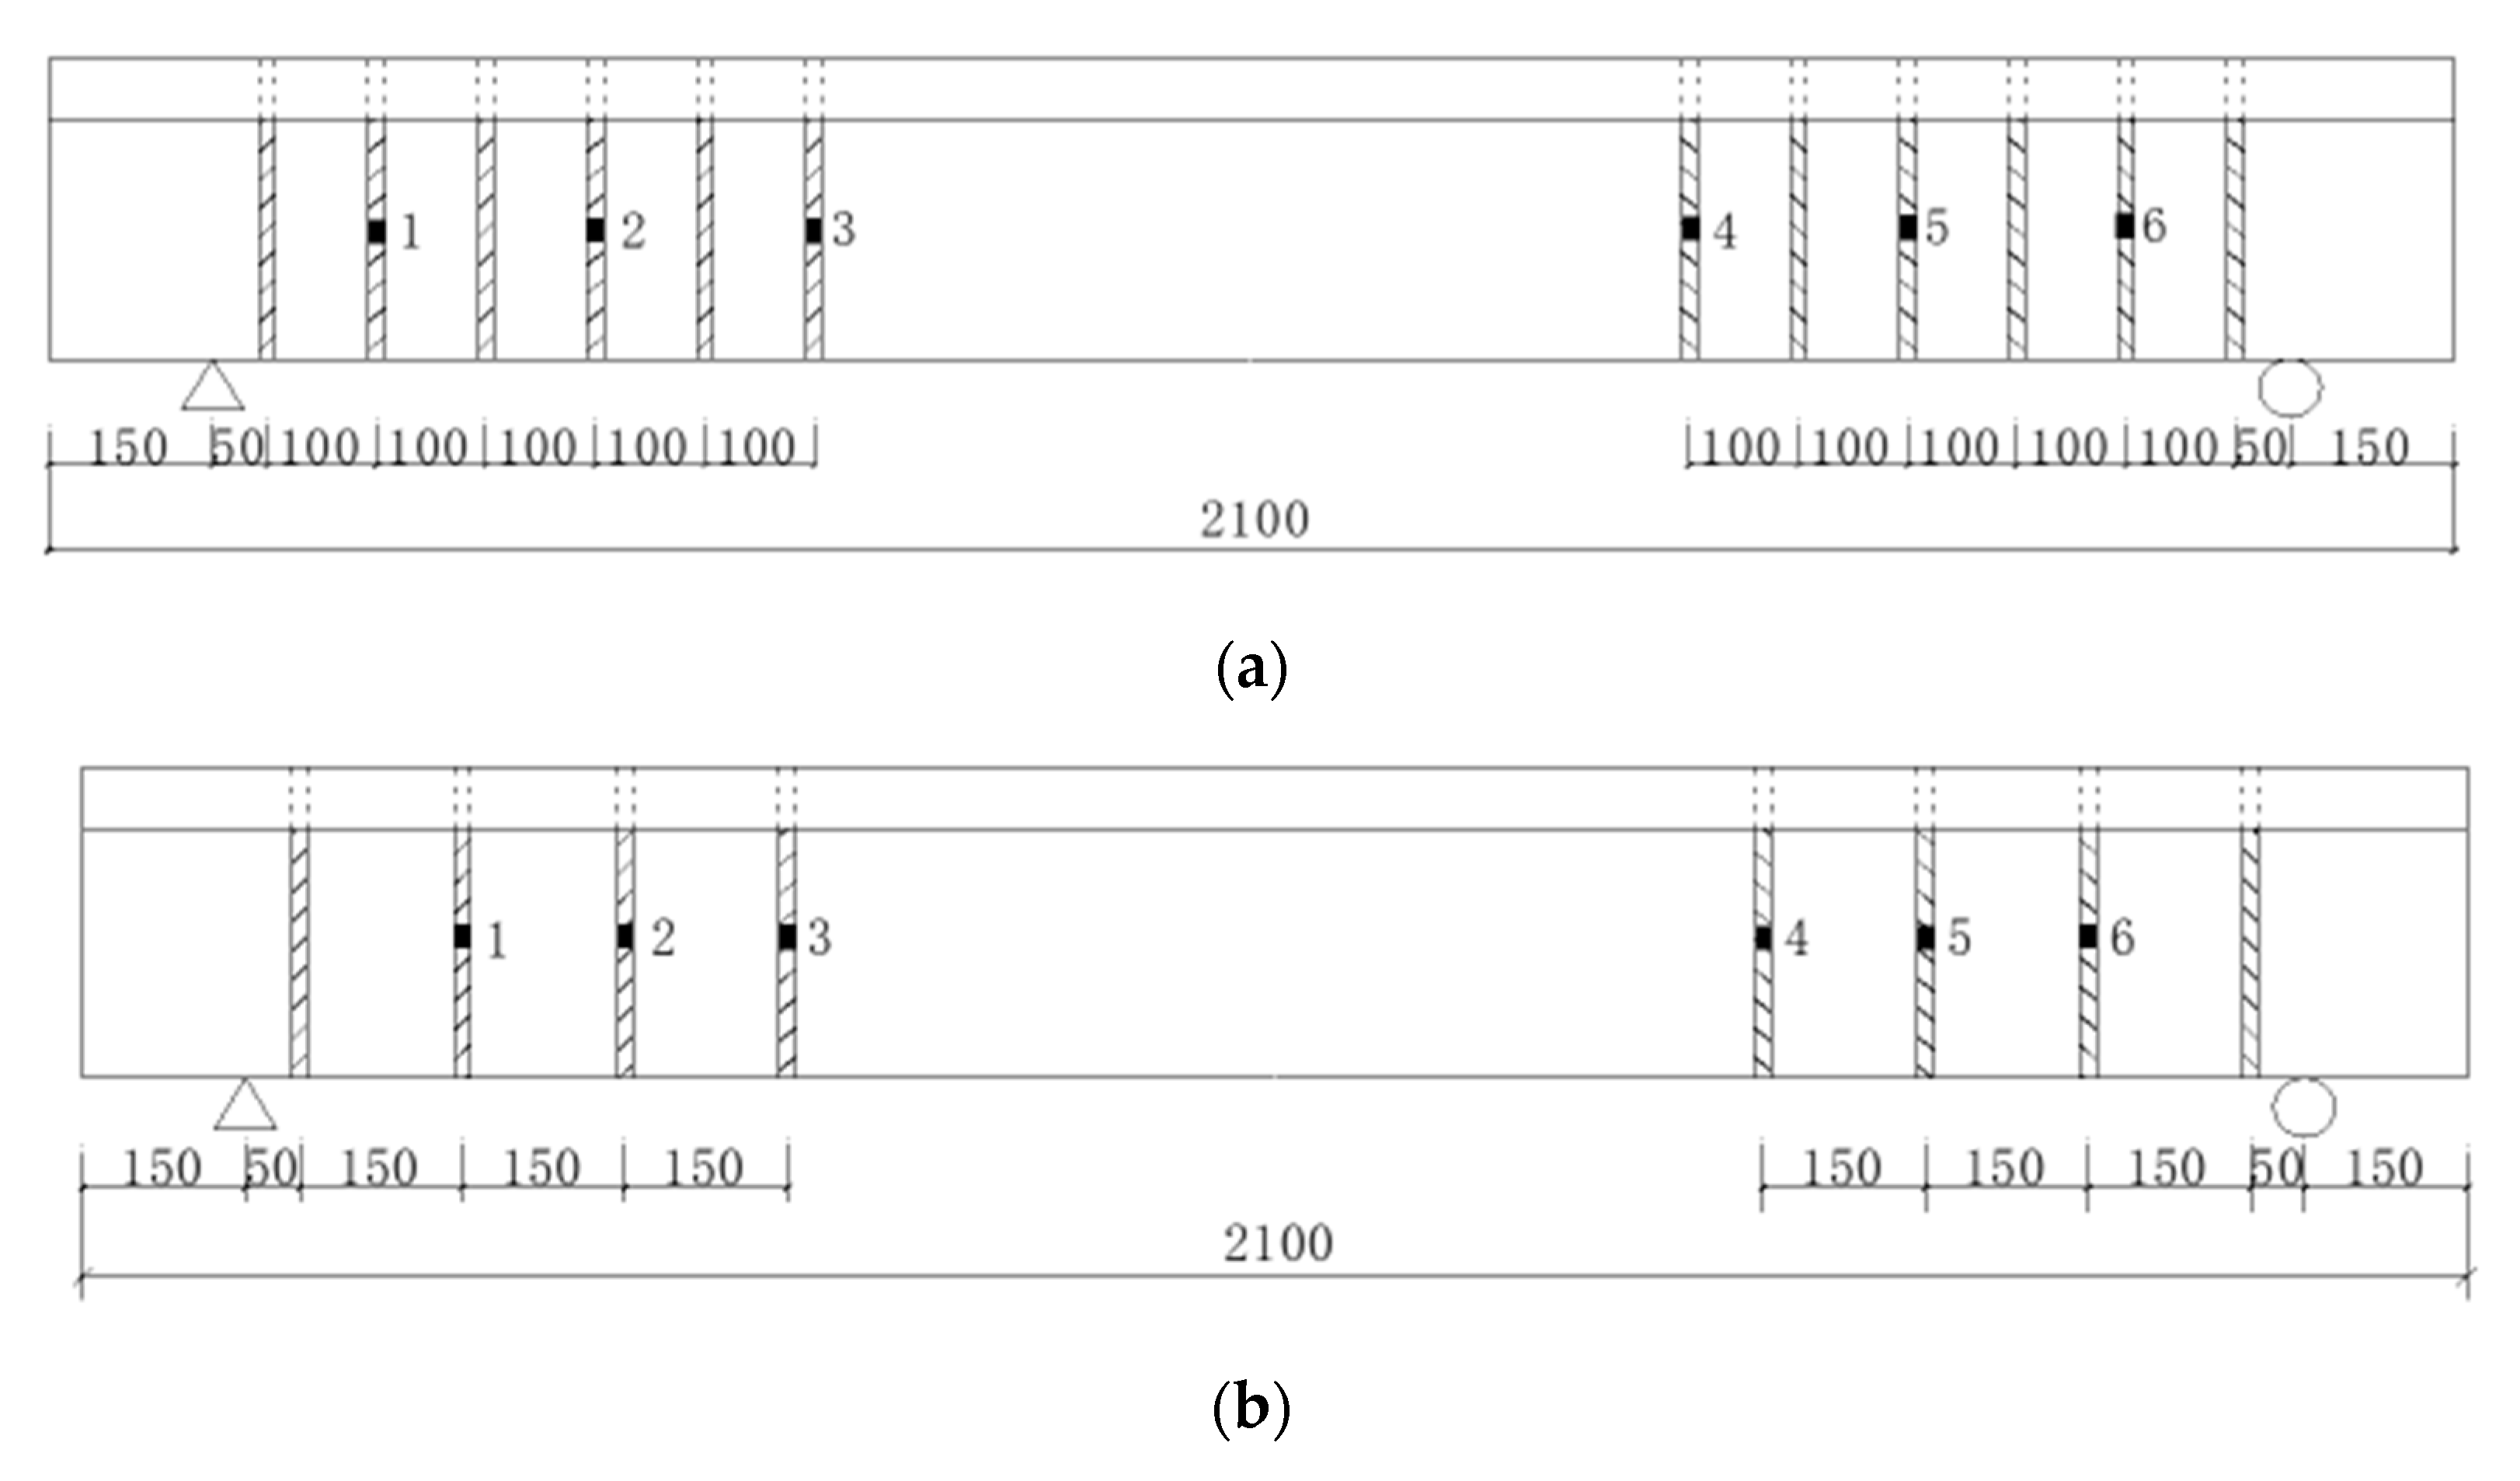
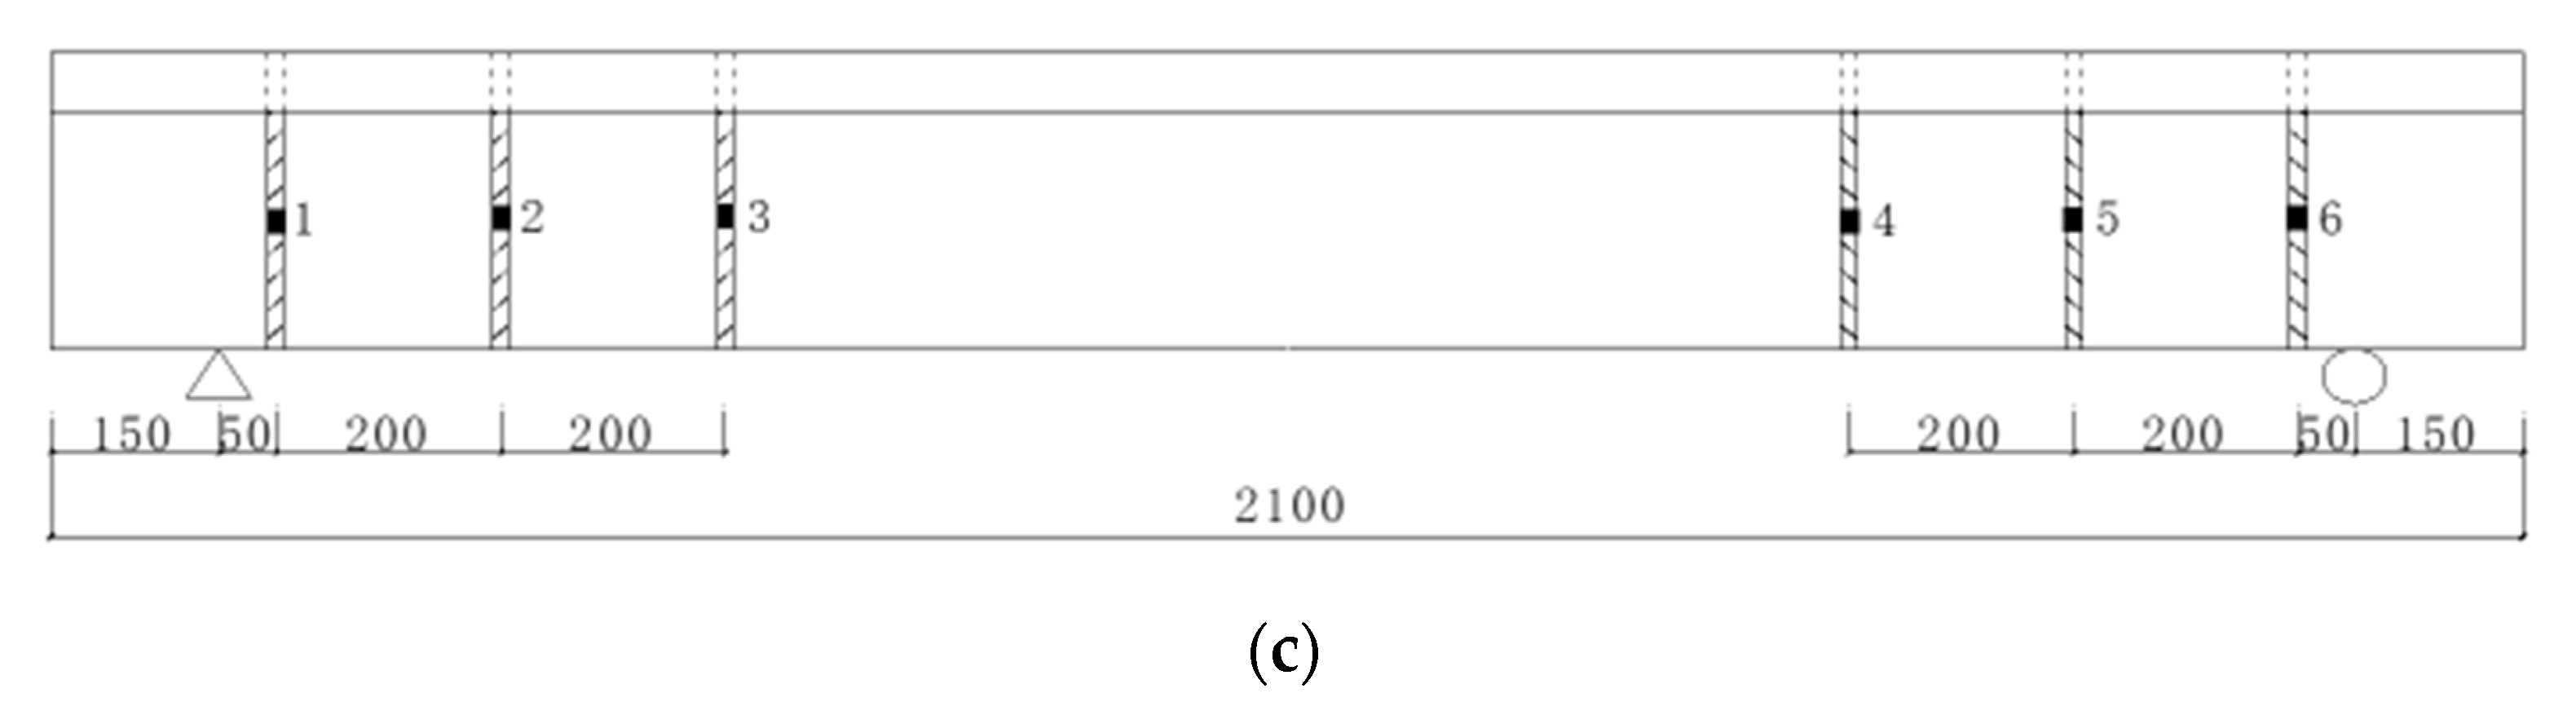
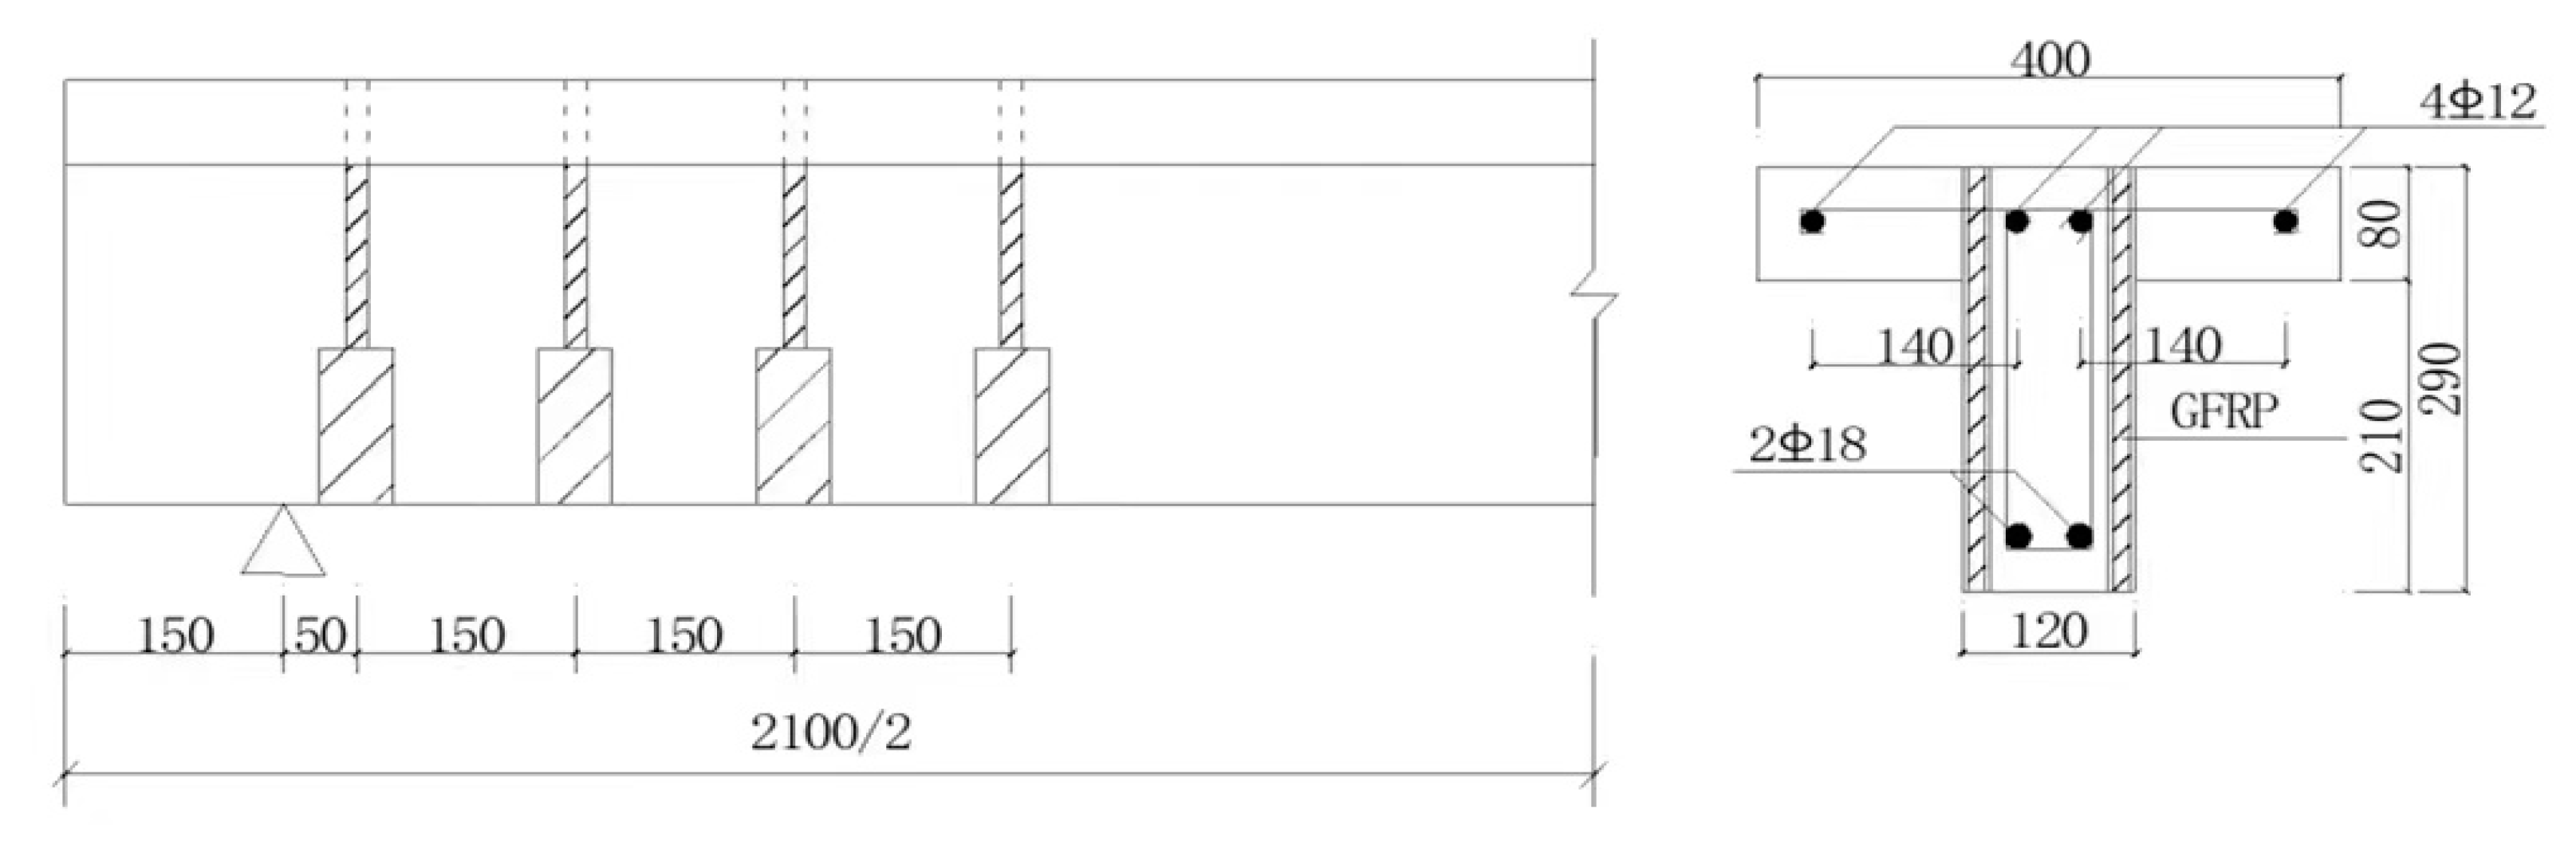
2.1. Specimen Making and Reinforcement

First, a steel cage was constructed according to the reinforcement diagram of the specimen, then a strain gauge was bonded with an epoxy resin. After the epoxy was allowed to dry for 1–2 days, the concrete was poured. A day after pouring, the mold was released, and the concrete was watered and cured. The specimen was reinforced after 15 days of curing. A strain gauge was pasted onto the part of the FRP where the strain was to be measured. Then, the dust in the tank was removed and the inner wall of the tank was wiped with acetone. Once the tank was dry, the reinforcement was applied. JGN planting glue was used in the experiment, and the mass ratio of A to B was 3:1. After mixing, about 1/2 of the planting reinforcement glue was injected into the tank and the FRP was immediately embedded into the tank. Injection of the planting reinforcement glue then continued until the tank was full, and the contents of the tank were then compacted and smoothed. In order to ensure the reinforcement effect and avoid colloid hardening, the whole process from mixing to colloid smoothing was not allowed to exceed 20 min. After the reinforcement with surface-embedded FRPs was completed, a U-shaped hoop made of CFRP cloth was pasted onto the bottom and side of the specimen, reaching 1/2 of the height of the side mesh of the specimen.

2.2. Test Setup and Process

The first step in the test process was preloading. Preloading was divided into three levels of loading, each of which consisted of 3 kN, held for 2 min and then unloaded. The purpose of preloading was to check whether the contact with each part of the specimen was good and whether the instruments and equipment were working properly, as well as to familiarize the test personnel with their tasks to ensure that the testing could be carried out smoothly. The specimen was loaded with a full load until it collapsed. Each stage load was 5 kN; it was loaded for 2 min, after the instrument stability began to record the measured data, while observing the crack development and mark the corresponding load size. When the specimen was close to failure, the load was changed to 2 kN per level until failure.
A strain gauge of 3 × 2 mm is attached to the longitudinal bars on the stirrups and the 1/4 span in the reinforcement zone to measure the strain shift law of the stirrups. A concrete strain gauge is arranged in full-force, mid-span, and tempered shear sections to detect th concrete’s strain variation law when loaded. Figure 1 illustrates the strain gauge layout. To observe the strain variation in the FRPs of the reinforcement zone, a strain gauge of 3 × 2 mm was attached. Figure 2 shows the strain gauge arrangement.
To measure the test piece’s load–span deflection curve and better understand the displacement shift of the test piece after reinforcement, displacement meters were placed in the span and support of the test piece. Displacement values, corresponding to each stage of load, were recorded.

2.3. Materials, Properties and Specimens

The materials used in the experiments are steel rods of HPB235 and HRB335 grades. The diameter of the stirrups and bars is 8 mm and 12 mm, respectively. One longitudinal strip has a diameter of 18 mm and the other has a diameter of 20 mm. The concrete strength grades are C20 and C30, and JGN-type construction structures are planted with rubber and all tested reinforced concrete beams are cast simultaneously. Table 1 lists the mechanical properties of the rods used in this test procedure, Table 2 shows the mechanical properties of the concrete, Table 3 shows the mechanical properties of the adhesive, and Table 4 shows the mechanical properties of the FRP strip. The test piece has 17 concrete T-beams, 3 being standard and 14 being reinforced test pieces. The concrete T-beam is 290 mm high, with a flange width of 400 mm, a thickness of 80 mm, and a web thickness of 120 mm, with a standard span of 2.1 m and a calculated span of 1.8 m. Figure 3 illustrates the cross-sectional dimension of the test piece and the specific reinforcement. The sides of the curved section of the reinforced test piece are slotted with grooves of the same height as the T-beam, and the tracks are spaced 100 mm, 150 mm and 200 mm apart. CFRP cloth was used for the 50 × 320 mm strip to produce the cross-section and match the U-clamped test piece. The bars are shown in Figure 4. The parameters of the study are concrete strength class, longitudinal reinforcement ratio, surface characteristics, type and diameter of FRP, FRP spacing, different reinforcement methods and shear span ratio, which are all listed in Table 5 along with the test piece reinforcement scheme and grouping. In the table, BZ stands for the standard test piece, S stands for longitudinal reinforcement in the test piece, C stands for concrete, L-G8 stands for threaded GFRPs with a diameter of 8 mm, GG stands for light circle GFRPs, LC stands for thread CFRPs, D150 stands for FRP spacing 150 mm, and U stands for sticking U-hoop reinforcement.

3. Experimental Test Results
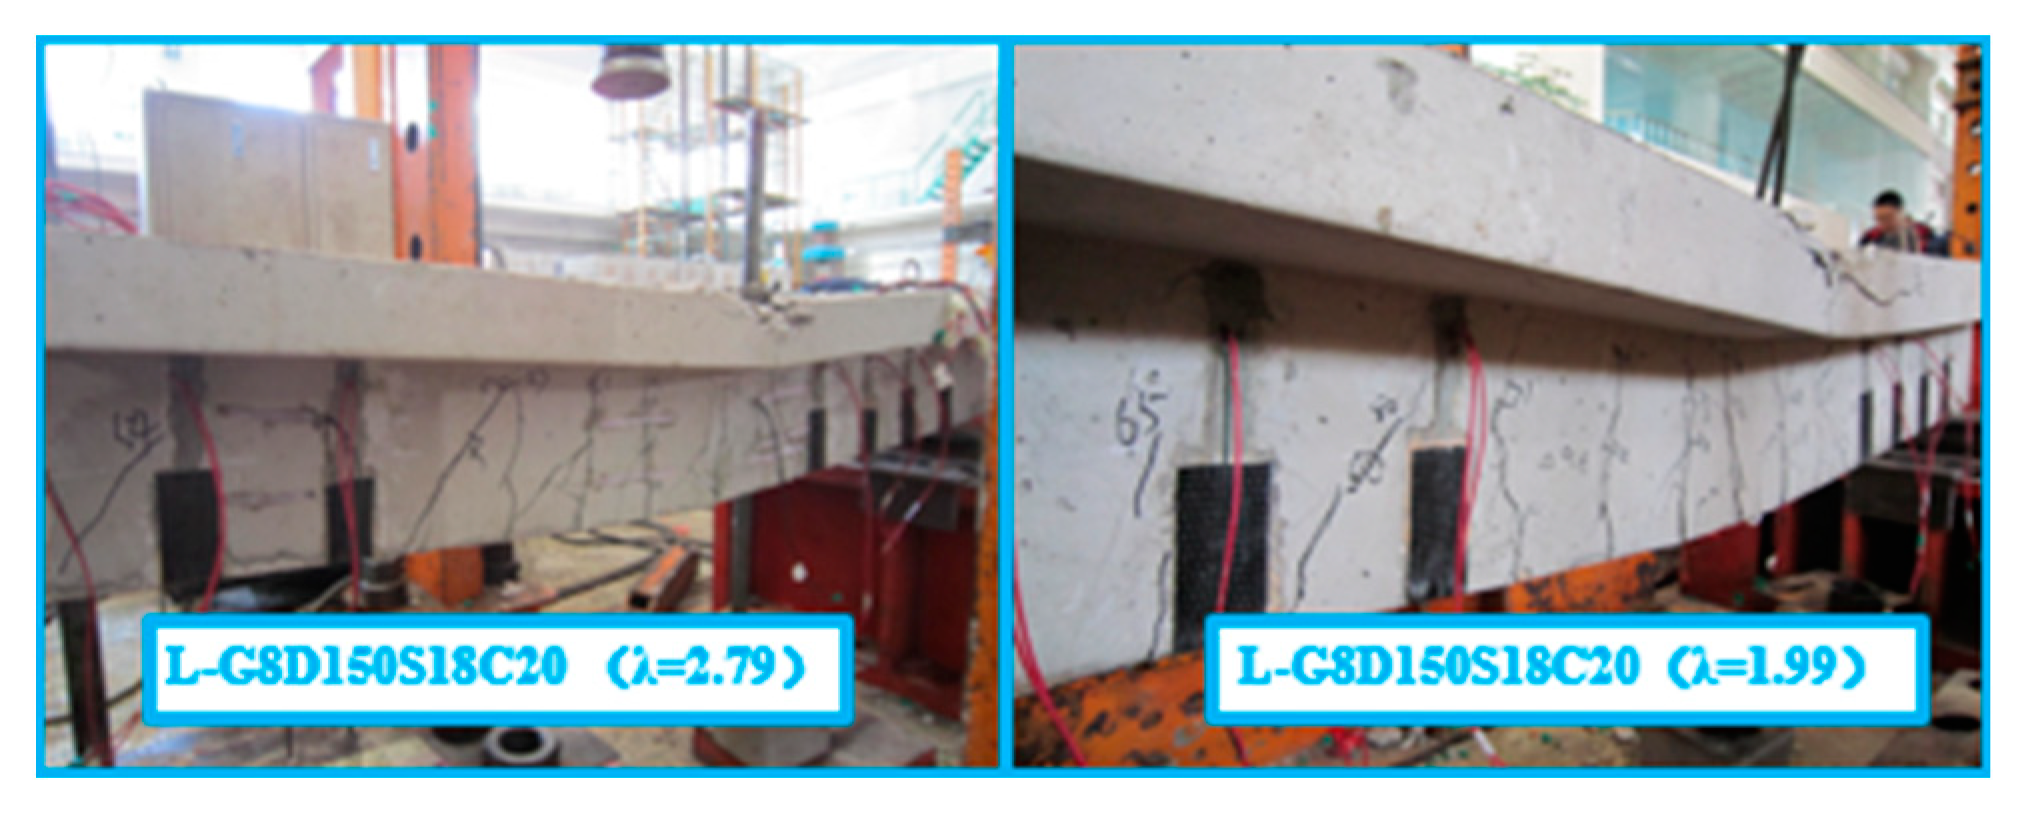
3.1. Failure Modes

Figure 5 shows the photos of the failure modes of all specimens. In addition, Table 6 summarizes the failure mode, the maximum mid-span displacement and the maximum crack width of the bending-shear section. It can be summarized as the following three categories: (1) all bending failure: standard specimens, threaded GFRP reinforcement specimens, threaded CFRP reinforcement specimens, different diameter threaded GFRP reinforcement specimens and different shear span ratio threaded GFRP reinforcement specimens are all bending failure modes; (2) all shear failure: without U-hoop thread GFRP reinforcement specimens for shear failure; (3) partial shear failure: with the G-G8D150S18C20U in the GFRP-reinforced specimen being a flexural failure, and with G-G8D150S20C20U and G-G8D150S18C30U being shear failures. L-G8D100S18C20U and L-G8D200S18C20U are GFRP-reinforced specimens with different spacing, and flexural failure and shear failure occurrence, respectively.
It is well known that shear failure is a kind of brittle failure, which should be avoided in practical engineering. The above results show that in the standard specimen or the specimen reinforced by threaded GFRP, the width of the inclined crack can be reduced by appropriately increasing the concrete strength grade. In the GFRP-reinforced specimens, the C30 specimen did not show an advantage over the C20 specimen. The reinforcement effect of threaded GFRP is generally better than that of plain GFRP, but the GFRP spacing should not exceed 200 mm. The role of the U-bolt thread is crucial, otherwise the reinforcement of the thread GFRP cannot make the specimen avoid shear failure.
Because the specimen shape of the bending failure is basically the same, the failure form of L-G8D150S20C20U is described. When the load reaches 9.3 kN, the first vertical bending crack appears in the mid-span. With the increase in load, the number of cracks in the pure bending section also increases and develops like the bending-shear section. When loaded to 32.9 kN, the first shear diagonal crack appears between the two slots near the concentrated force in the bending-shear section, which is 55 degrees from the longitudinal axis of the specimen. When the load continues to increase to 50.6 kN, the second oblique crack appears, which is 45 degrees from the longitudinal axis of the specimen. When loaded to 51 kN, the first shear diagonal crack appeared in the symmetrical bending-shear section of the same side of the specimen, which was 50 degrees from the longitudinal axis of the specimen. When loaded to 58 kN, a slight sound of concrete tearing can be heard, the reinforcement specimen slot inside the colloid has a slight ‘crack’ cracking sound, and oblique cracks appear through the slot inside the colloid, focusing on the development of the action point. When loaded to 82 kN, the diagonal cracks all reach the bottom of the flange, and this continues to increase until the number of load cracks no longer increases. However, the width will continue to increase, until the crushing of compression zone concrete causes specimen damage. The failure process of specimen G-G8D150S20C20U is described. When loaded to 13.2 kN, the first small vertical crack appears in the pure bending section. Continuing to load, the number of cracks increases and continues to develop in the bending-shear section. When loading to 54 kN, the first diagonal crack appears in the bending-shear section. With the increase in load, the number of diagonal cracks also increases, and one of them develops rapidly and extends longer. Continuing to load, the number of cracks stops increasing, but the width still increases. At the same time, the crack penetrates the colloid in the groove and extends to the loading point. The ‘crack’ cracking sound of the colloid and the sound of the CFRP strip opening can be heard. When loaded to about 90 kN, a main crack suddenly develops rapidly, the deflection on one side of the specimen changes obviously, accompanied by a ‘bang’ sound, the web and flange part of the concrete undergo shear failure. At this time, the load quickly falls back, the specimen is declared a failure, the final bearing capacity of the specimen is 111.5 kN.

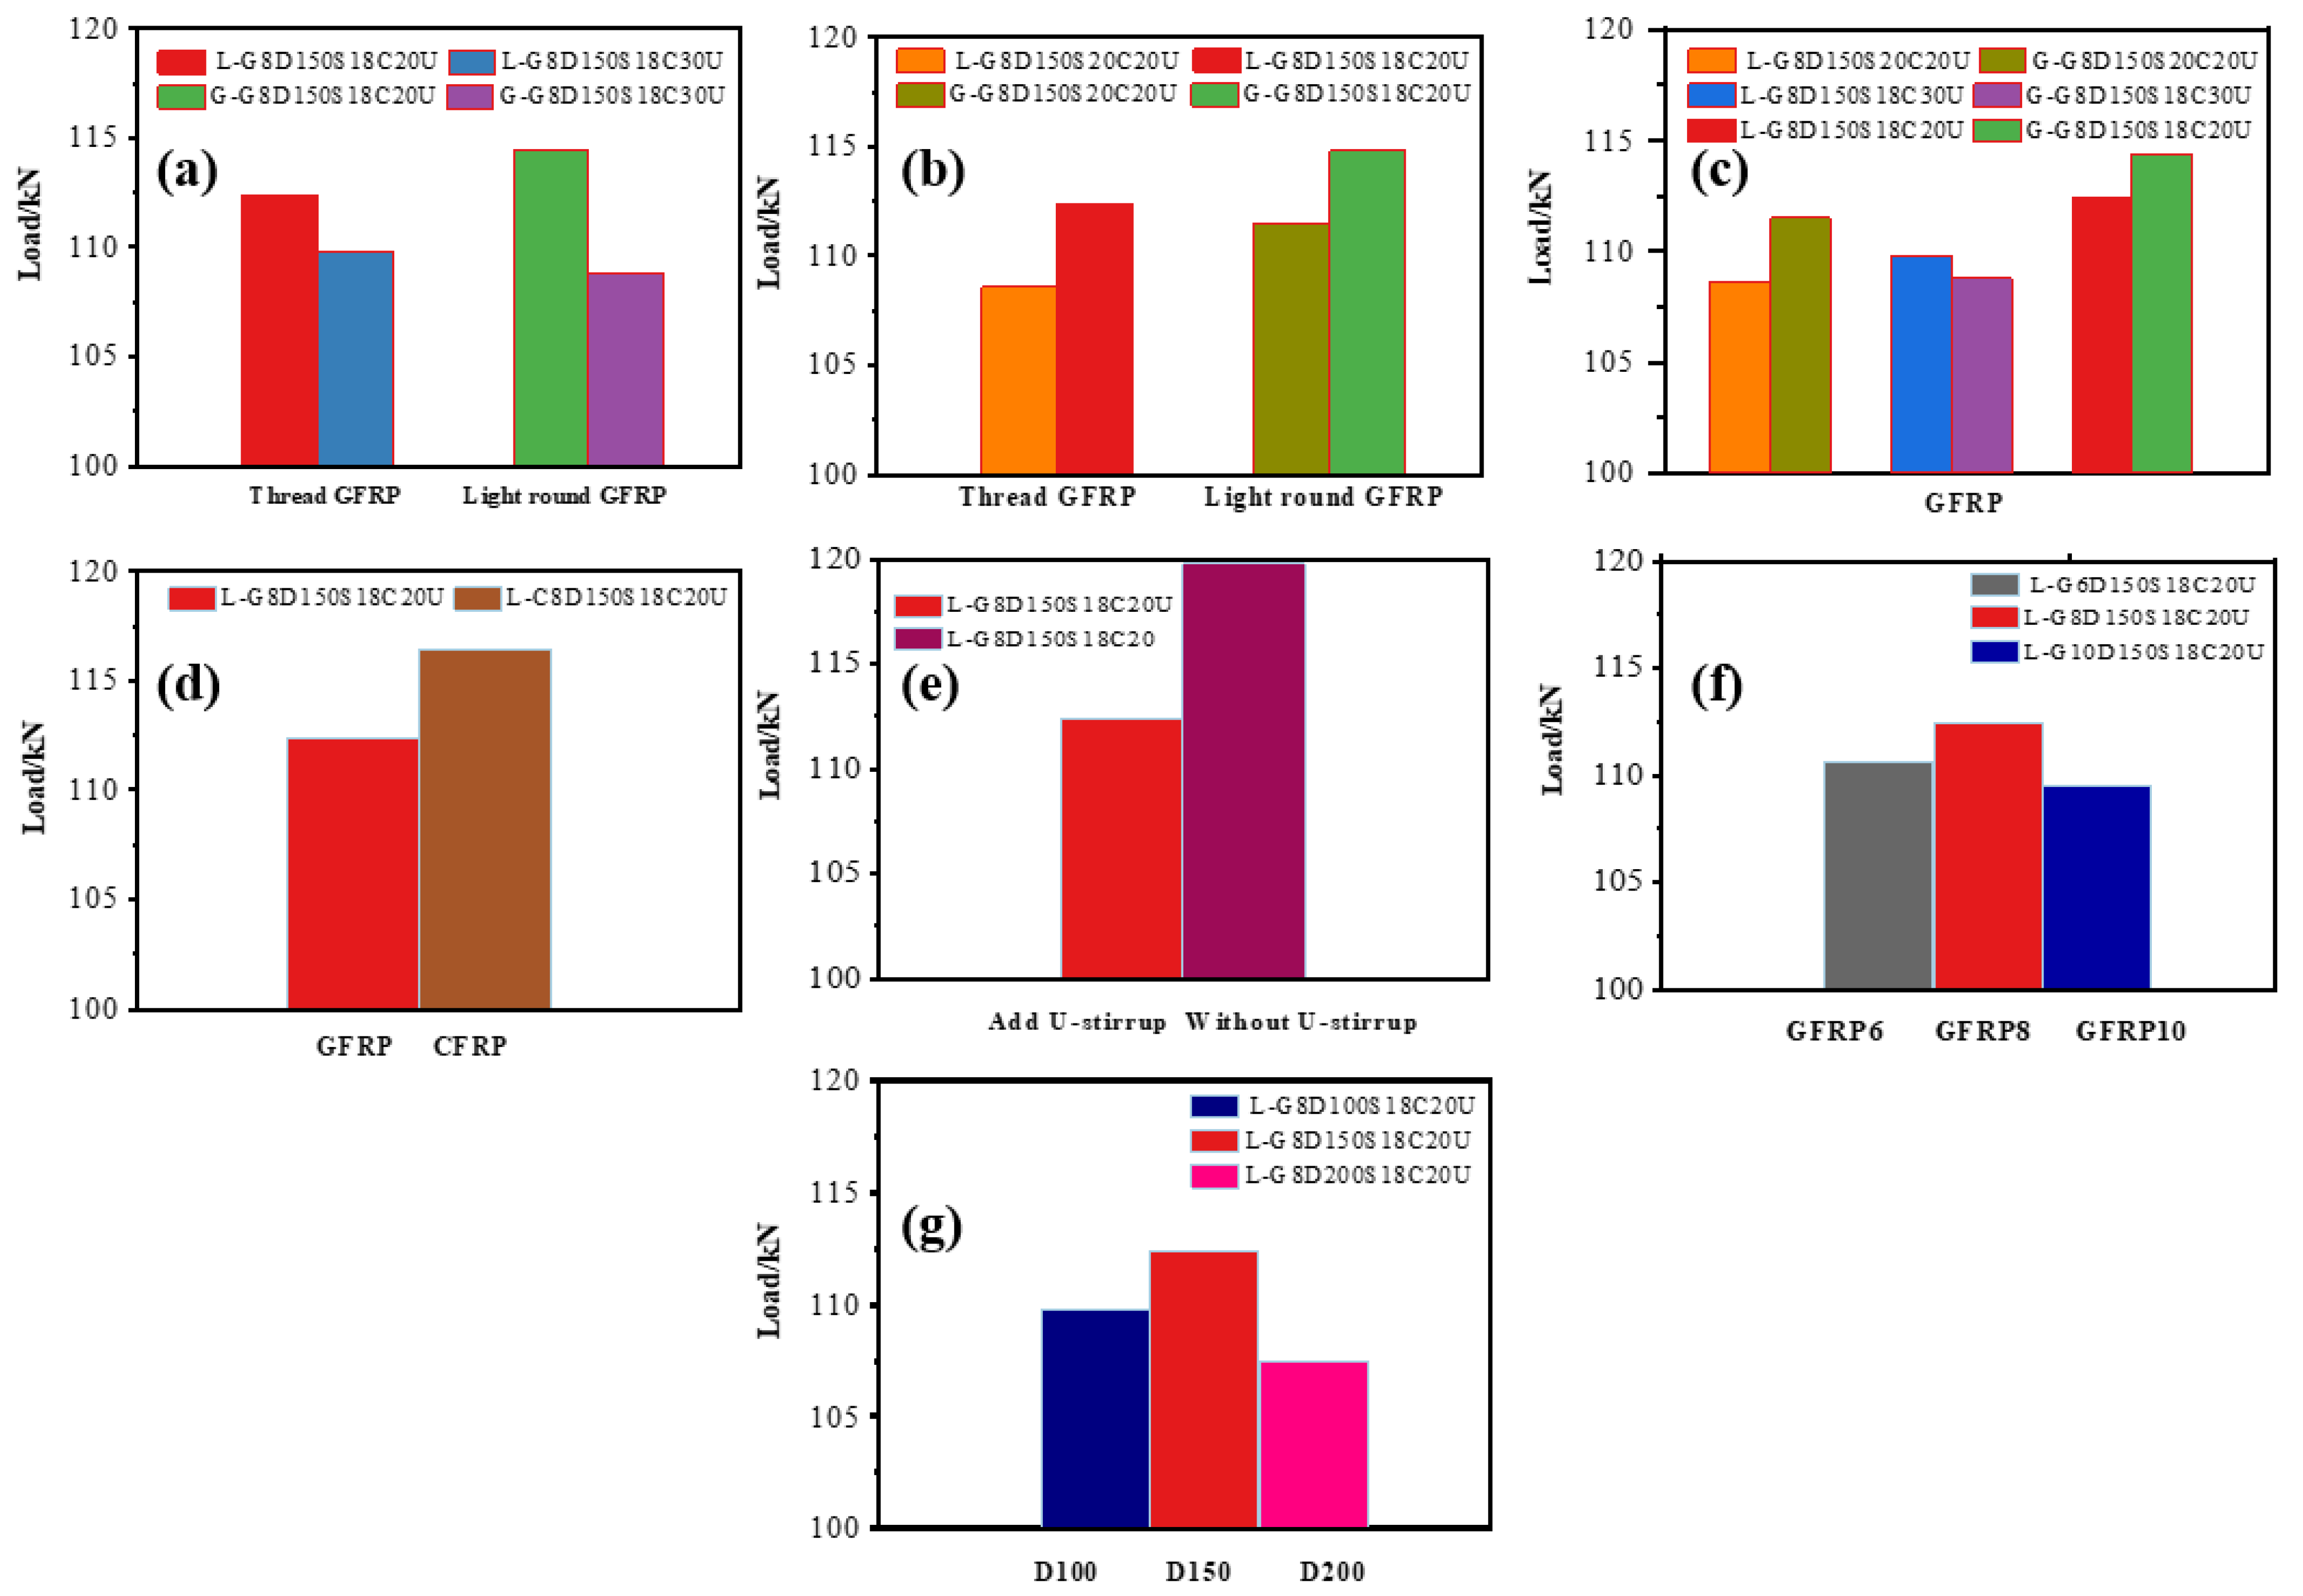
3.2. Bearing Capacity Analysis

The characteristic load of each test piece is shown in Table 7, where Pcr is the pure bending section cracking load, ΔPcr is the pure bending section breaking load increase rate; Pcr1 is the bending-shear section breaking load, and ΔPcr1 is the cracking load increasing the speed of the bending-shear section breaking load increasing rate; Pu is the ultimate load, and ΔPu is the maximum load increasing rate. The meaning of the growth rate is the test value after strengthening, divided by the test value of the corresponding standard specimen.
Reinforced specimen-bending shear-cracking showed no improvement over the base case, but did experience varying levels of degradation. This is because the curved shear section of the specimen is reinforced, and this part of the concrete stress state is altered compared to the stand-alone, reinforced specimen load, which is less prone to the bending-shear section and therefore is replaced by a pure bending section with reduced fracture load. Compared to the standard specimen, the stiffened model shows a significant increase in fracture load in the bending-shear section, from 56 to 319 percent. This is because the FRP strip splits the concrete into several tiny pieces. The overall stiffness of each microstructure is more significant than the standard specimen’s full flexural shear profile and is, therefore, less susceptible to cracking. As can be seen, FRPs improve fracture loads for flexural shear profiles by improving fracture load. The final burden of the reinforced specimen increased by 0.84–15.1% compared to the standard model, suggesting that FRPs play an essential role in improving the fracture load of the flexural shear section of the reinforced model.

3.3. Discussion of Test Parameters

3.3.1. Effect of Compressive Strength

Figure 6 shows the ultimate bearing capacity of the strengthened specimens under different parameters. Figure 6a is the ultimate bearing capacity of specimens with different concrete strength grades. The ultimate load of specimens strengthened with surface-embedded threaded GFRPs and plain GFRPs decreases with the increase in concrete strength grade, and the influence of plain GFRP on the strength grade of concrete is greater than that of threaded GFRP. The same situation occurred in the standard specimen (as shown in Table 7). The analysis of the stiffness information given in Table 7 shows that the higher the concrete strength grade, the more brittle it is. The embedded GFRP can improve the stiffness of the specimen, so the higher the concrete strength grade, the more obvious the reinforcement effect.

3.3.2. Effect of Longitudinal Reinforcement Ratio

The effect of the longitudinal reinforcement ratio on the bearing capacity of the specimen is shown in Figure 6b. The ultimate bearing capacity of the specimens, strengthened with embedded GFRP on the surface, is affected by the longitudinal reinforcement ratio and increases with the decrease in the longitudinal reinforcement ratio. This is because the web size of the specimen is small, and the distance between the longitudinal bars is also small. The larger the reinforcement ratio is, the smaller the utilization rate of the steel bar is. Therefore, the increase in the reinforcement ratio cannot improve the ultimate bearing capacity of the specimen but will reduce it.

3.3.3. Effect of GFRP Surface Characteristics

Figure 6c shows the influence of CFRP surface characteristics on the bearing capacity of the specimen. The ultimate load of the specimens strengthened with embedded smooth round GFRP is basically greater than that of the specimens strengthened with embedded threaded GFRP, so the surface characteristics of GFRP have a significant effect on the ultimate load of the strengthened specimens. It is worth noting that G-G8D150S20C20U and G-G8D150S18C30U show brittle failure. This should be avoided in engineering applications.

3.3.4. Effect of FRP Types

Figure 6d shows the influence of FRP type on the bearing capacity of the specimen. The ultimate load of CFRP-reinforced specimens is greater than that of GFRP-reinforced specimens, indicating that the type of FRP affects the ultimate load of reinforced specimens. Because the ultimate tensile strength of CFRP is much larger than that of GFRP, although the shear test is carried out, the results show that the tensile strength still has a certain influence on the bearing capacity.

3.3.5. Effect of Reinforcement Method

The influence of the reinforcement method on the bearing capacity of the specimen is shown in Figure 6e. The bearing capacity of specimens without U-hoop is higher. Unfortunately, like G-G8D150S20C20U and G-G8D150S18C30U, the specimens without U-bolts also show brittle failure. Therefore, although the U-shaped hoop sacrifices bearing capacity to a lesser extent, it makes the structure safer and more reliable. However, because there is only one specimen without a U-shaped hoop, the discreteness of the conclusion is large, something which needs further study.

3.3.6. Effect of GFRP Diameter

The influence of the GFRP diameter on the bearing capacity of the specimen is shown in Figure 6f. The ultimate bearing capacity of the specimen L-G8D150S18C20U is the largest, followed by the specimen L-G6D150S18C20U, and finally the specimen L-G10D150S18C20U. This may be due to the fact that the diameter of the GFRP is too small to cause too much colloid in the groove, and the overall brittleness of the specimen increases, which thus cannot bear the shear force well. When the diameter of GFRP is too large, the glue in the groove is too small, so that the reinforcement bars cannot bond well with the specimen to form a whole joint force.

3.3.7. Effect of GFRP Spacing

The effect of the GFRP spacing on the bearing capacity of the specimen is shown in Figure 6g. The L-G8D150S18C20U has the most significant increase in carrying capacity. Among the three groups of specimens, L-G8D150S18C20U has the largest stiffness. Too small or too large GFRP spacing will produce stiffness loss.

3.3.8. Effect of Shear Span Ratio

The larger the shear span ratio is, the smaller the ultimate bearing capacity is. Because the distance between the two concentrated forces is too small, the flexural failure occurs in the reinforced specimen with λ = 2.79, and the final bearing capacity is only 99.2 kN. Because the distance between the two concentrated forces is too small, the load mainly acts on the unreinforced part, while the reinforced bending-shear section does not bear too much load, and the selective effect is not large, so the bearing capacity is small.

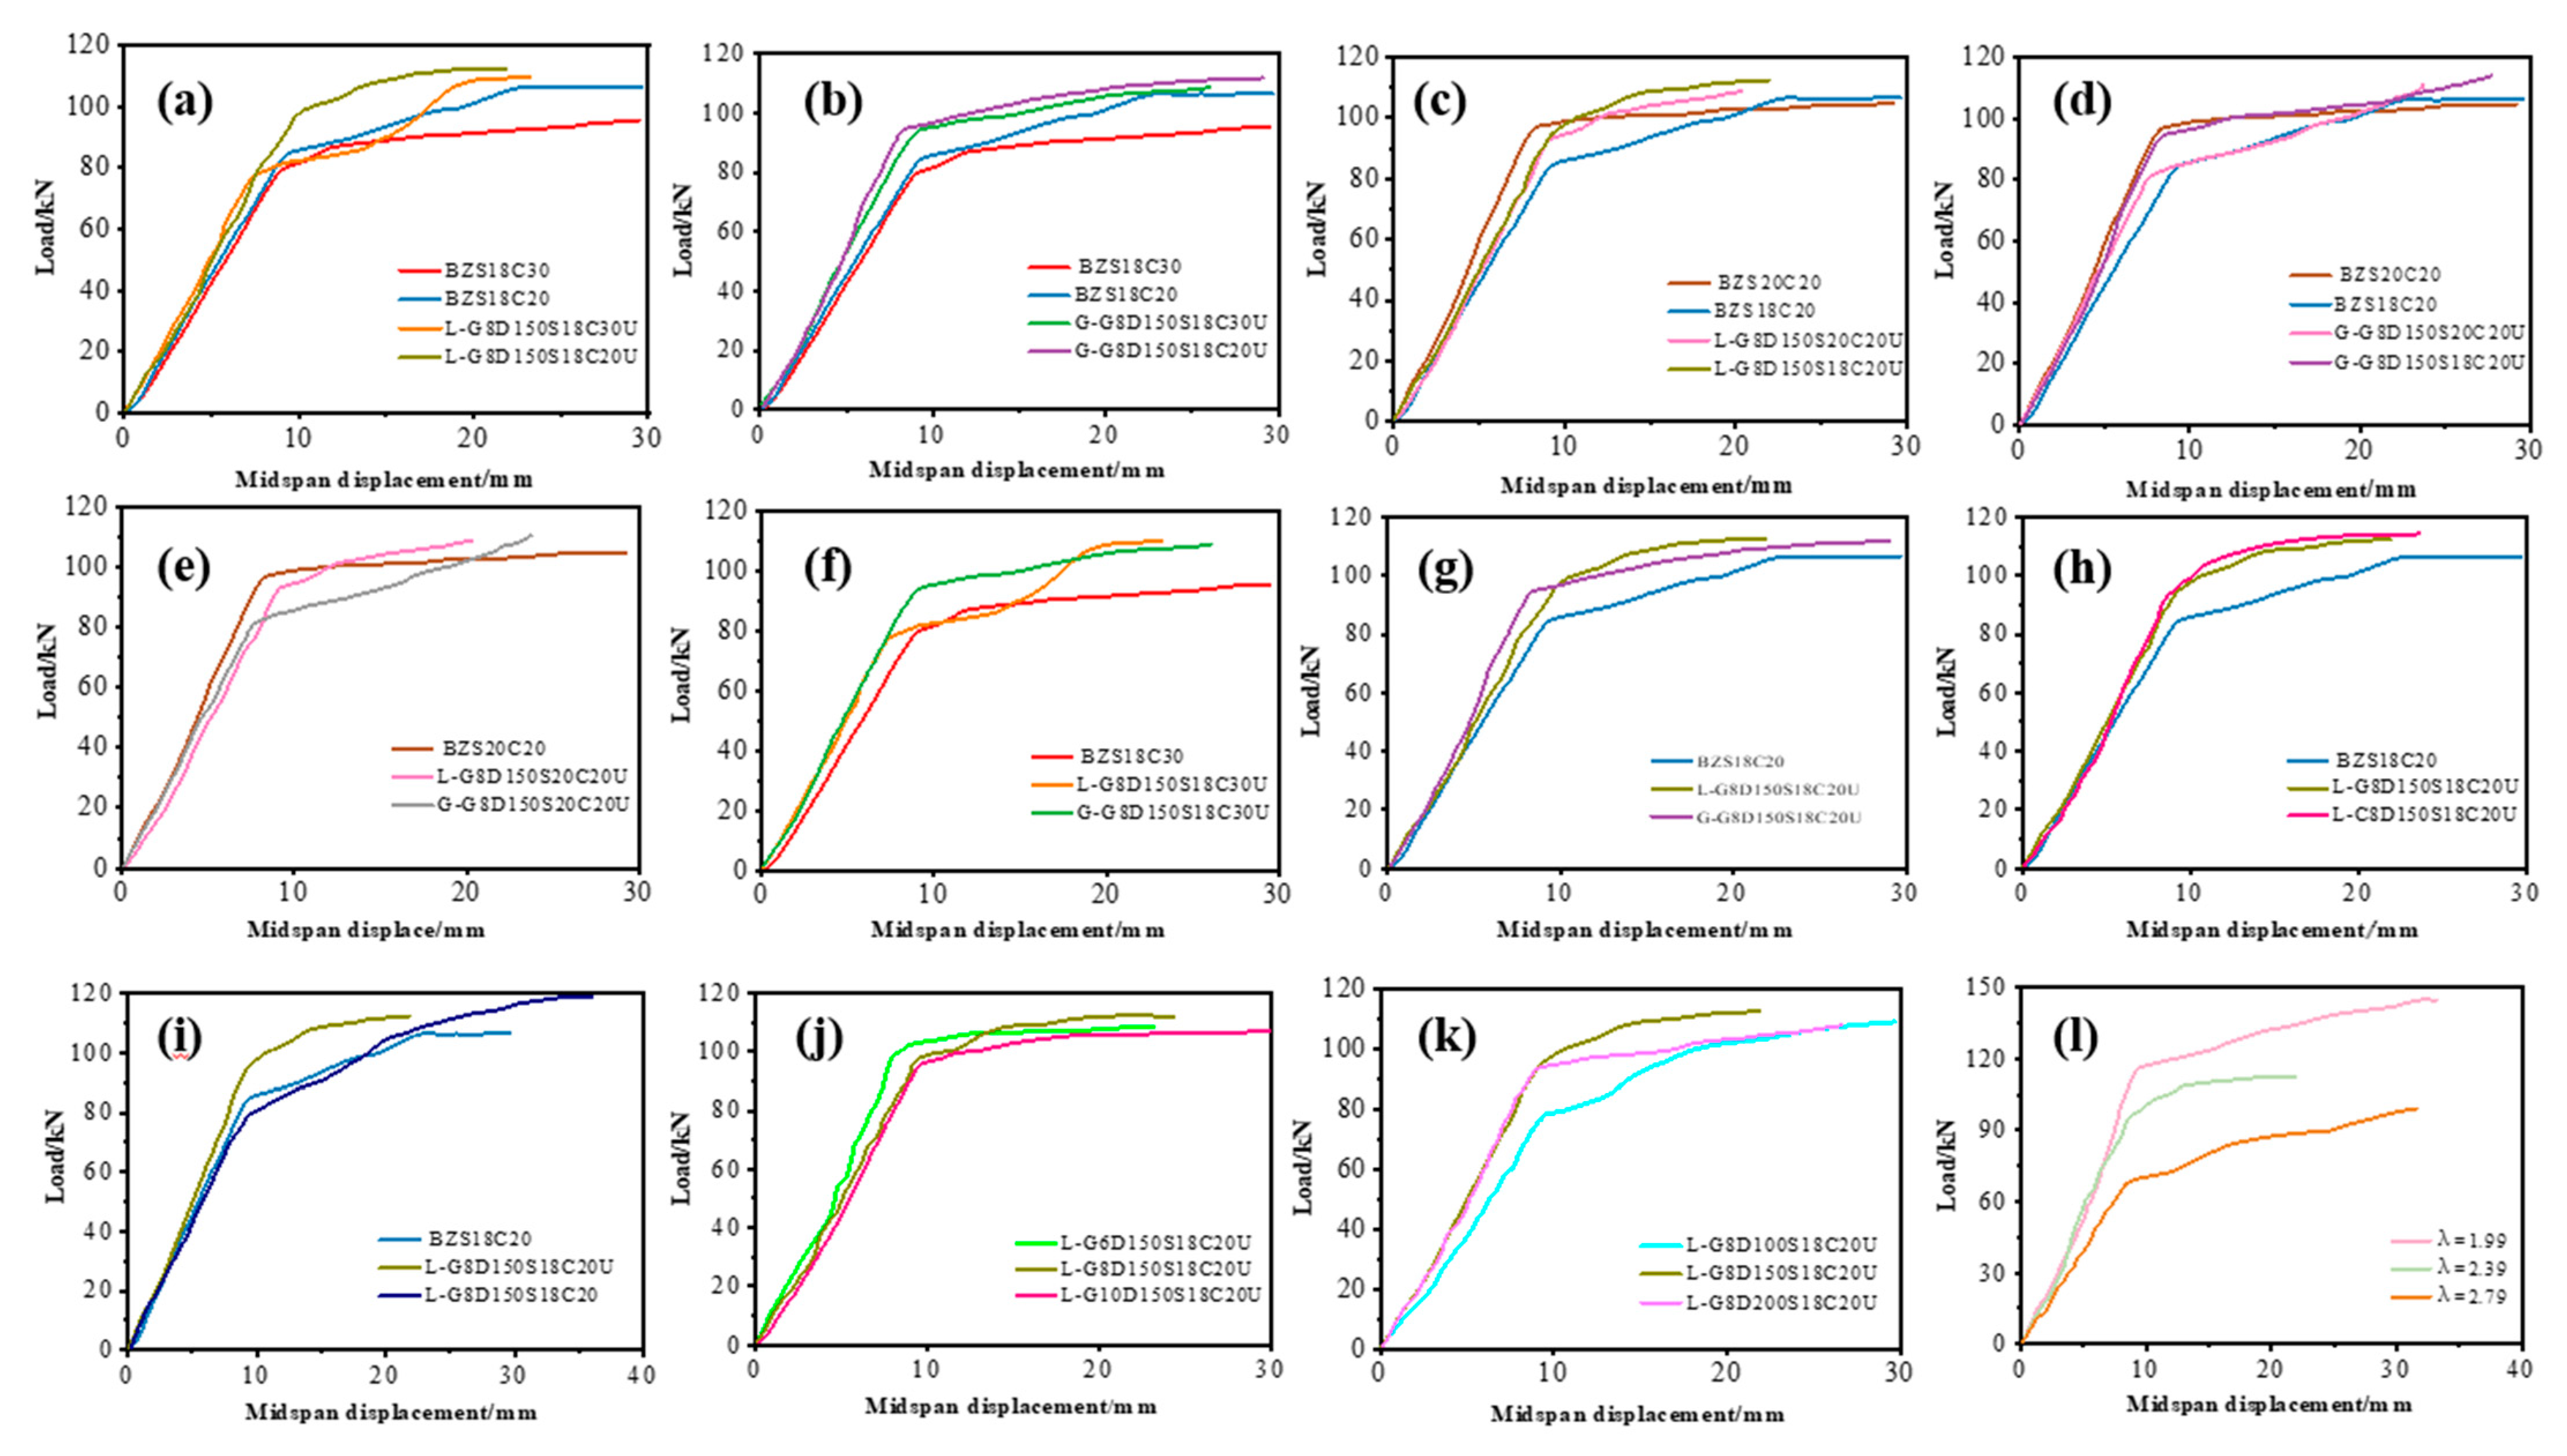
3.4. The Load-Deflection Relationships

The load variation curve of the specimen with displacement is shown in Figure 7. The test results are shown in Table 6 and Table 7. All specimens exhibit nearly the same elastic response, characterized by an increase in load accompanied by an increase in displacement up to the cracking limit. The cracking load is around 10~15 kN. In general, the cracking load of most specimens in the pure bending section is lower than that of unreinforced specimens. However, the cracking load of the reinforced specimen is significantly higher than that of the standard specimen. It is worth noting that the cracking load of L-G8D200S18C20U and L-G6D150S18C20U in the pure bending section is close to that of standard specimens, and the cracking load of flexural shear section is significantly higher than that of standard specimens.
After yielding, the mechanical behavior of the reinforced specimen is significantly different from that of the standard specimen. The ultimate bearing capacity of most of the reinforced specimens was significantly increased, as shown in Figure 7. However, this significant increase in ultimate bearing capacity comes at the expense of ductility, which is characterized by a reduction in the maximum displacement recorded in the span. This moderate ductility loss is an acceptable compromise between strength and ductility compared to the increase in bearing capacity, and thus provides a viable option for strengthening degraded beams with FRP.

3.5. Carrying Capacity Formula Correction

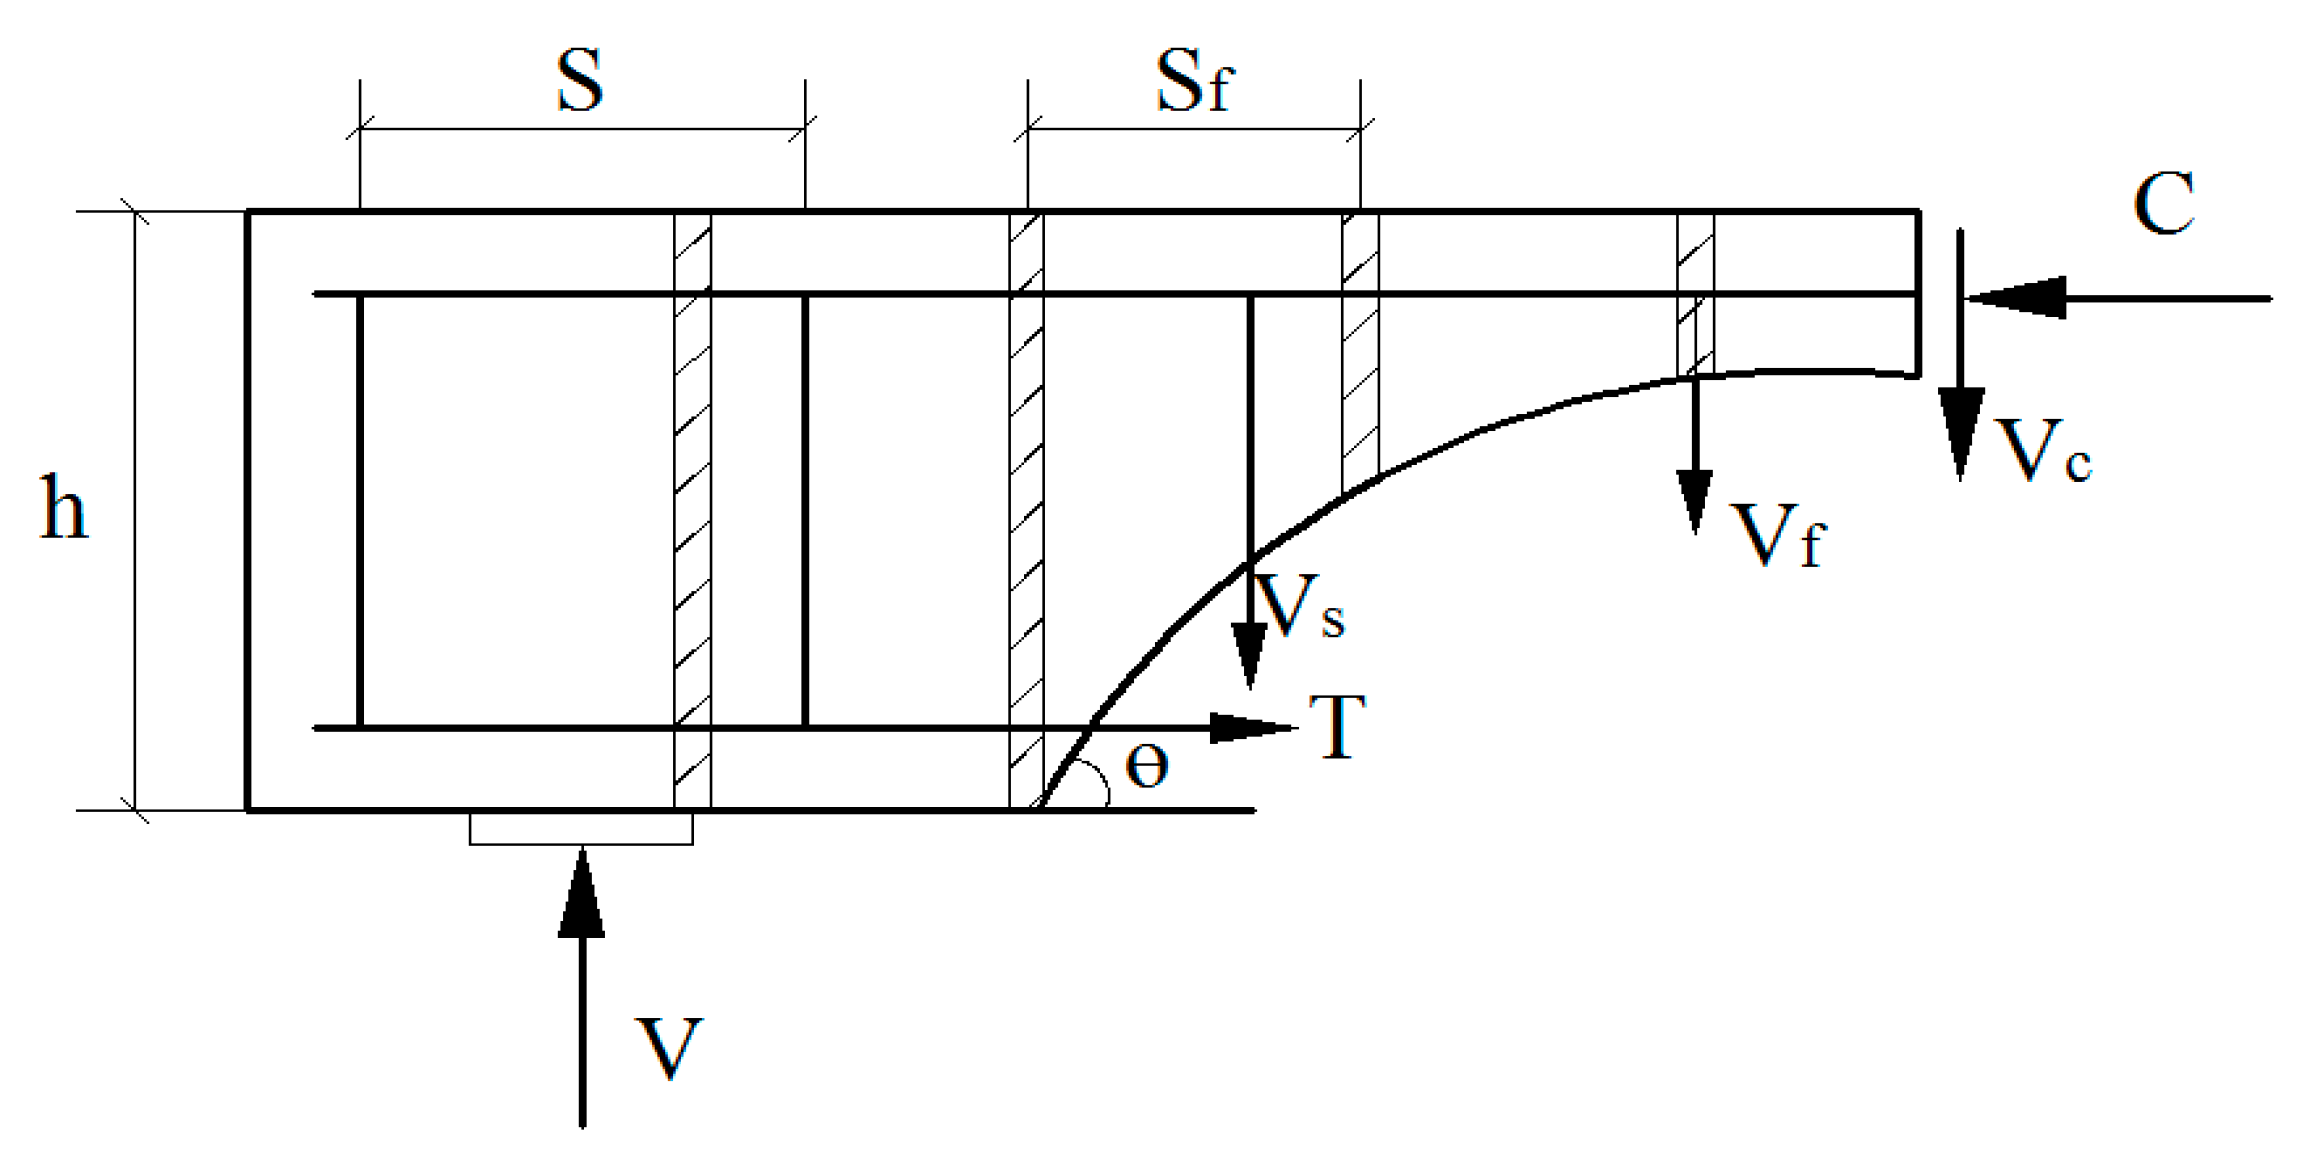
3.5.1. Calculation Formula of Shear Capacity

According to experiments in this study, the mechanism of the surface-embedded FRP tendons is like that of the stirrups. The shearing process of the strengthened specimens is the process of concrete, web and FRP reinforcement against the development of cracks. The construction shear model is shown according to the failure mechanism of the specimens reinforced with FRP on the surface in Figure 8.
According to the shear calculation model, combined with the concrete structure design specification and referring to the carbon fiber reinforcement procedure [20], the shear-bearing capacity of the oblique section can be estimated by the following formula:
V = V c + V s + V f
V c = α c v f t b h 0
V s = f y v A s v s h 0
V f = φ 2 A f S f ε f v E f h f cot θ
ε f v = 2 3 ψ f ( 0.2 + 0.12 λ ) ε f u
where V c is the shear capacity provided by the concrete; V s is the shear capacity supplied by the stirrups; V f is the shear-bearing capacity provided by FRP; αcv is the shear capacity of inclined concrete 0.7 for general flexural members and for concentrated loads (including multiple loads, where focused loads are applied to the bearing section or the edge of the joint). An independent beam with a value of more than 75% of the total shear force, taking αcv as 1.75 λ + 1 , λ is the shear span ratio of the calculated section, which can be λ = a/h0. When λ is less than 1.5, take 1.5. When λ is greater than 3, take 3, a to take the full load point to the support section or node. The distance of the edge:
Where, f t is the design value of concrete axial tensile strength; b is T-shaped web width; h 0 is the effective height of the section; f y v is the tensile strength design value of the stirrup; A s v is all the cross-sectional areas of the limbs of the stirrups arranged in the same team, i.e., n A s v . Here, n represents the number of limbs stems in the same section; A s v 1 represents the cross-sectional area of the single-legged stirrup; s is the spacing of the stirrups; φ is a carbon fiber sheet subjected to shear reinforcement form factor. For sealing and sticking, take 1.0; for u-shaped paste, take 0.85; for side paste, take 0.70; A f is the FRP area; S f is th FRP spacing; ε f v is the strain of the FRP when the limit state of the shear-bearing capacity is reached; ε f u is the ultimate tensile strain of the FRP; E f is the elastic modulus of the FRP; h f is the height of the FRP embedded in the beam; θ is the angle between the prominent crack on the shaft and the central axis of the beam shaft; λ is the shear span ratio of the beam is calculated by shearing, and a / h 0 is taken for the concentrated load action. When λ is more significant than 3.0, take 3.0; when it is less than 1.5, take 1.5, a as the distance from the point of concentrated load to the edge of the support; for the uniform load, take 3.0; ψ f is considered the actual tensile strain up to the FRP utilization factor introduced by the ultimate strain design value.

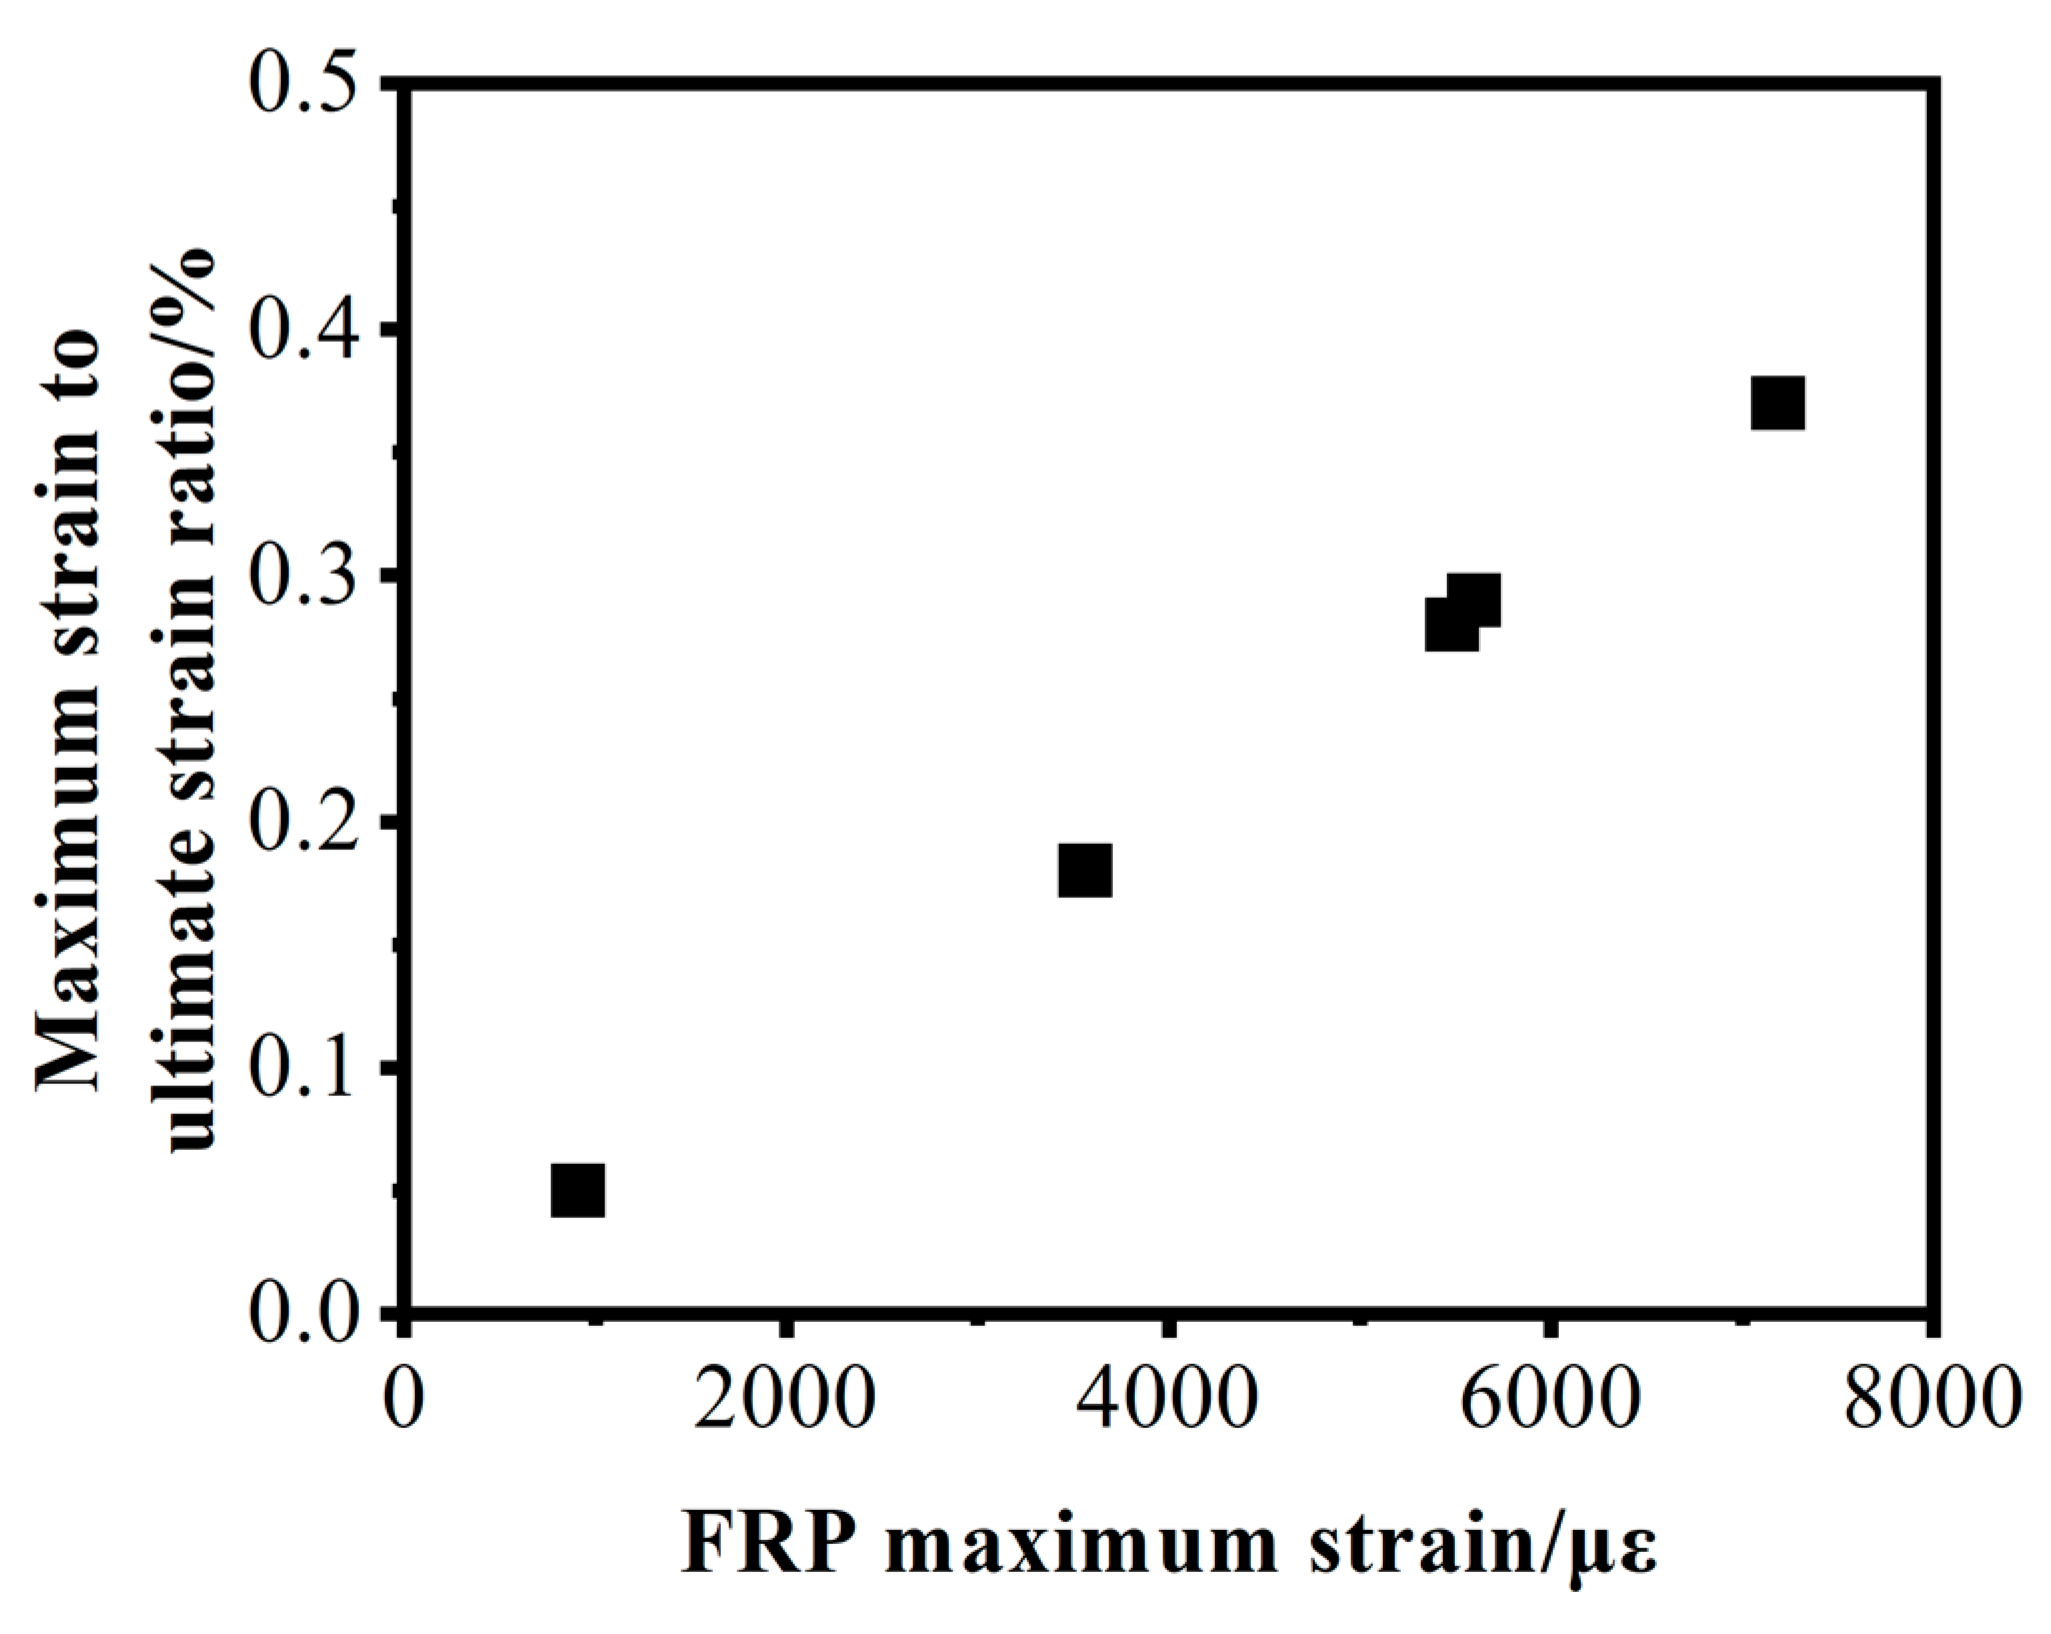
3.5.2. Determination of the Utilization Factor of FRP

Table 8 is a summary table of the maximum strain of each GFRP of the specimens with shear failure in the test. Figure 9 is the scatter of the maximum strain pressure produced by the GFRP of the regime specimens with shear failure and the ratio of the ultimate stress. It can be seen from the figure that the ratio balance of the maximum strain pressure to the top strain of the GFRP at the time of failure of the test piece is generally less than 0.3. From the safety point of view, the utilization factor of the FRP is 0.2.
The determined FRP utilization coefficient = 0.2, and it is brought into Formulas (4) and (5). The calculated values ψ f of the shear capacity provided by the FRP are shown in Table 9.
A regression fit is performed according to the stable’s experimental and theoretical values, as shown in Figure 10. The correlation coefficient R2 = 0.96, and the fitting is good. The utilization factor of the FRP is 0.2.

3.5.3. Comparison of Experimental Values and Theoretical Values

Table 10 shows the comparison between the theoretical value and the experimental value of the five reinforced specimens with shear failure. It can be seen from the data in the table that the ratio of the experimental practical value to the theoretical value of the two specimens is less than 1, but the difference is within 5%. The specimens with bending failure and the ultimate bearing capacity are more significant than or like the shear failure test specimens, so it is still safe to calculate the shear-bearing capacity of the oblique section according to the above formula.
In summary, the calculation formula of the shear capacity of the reinforced concrete T-beam, reinforced with FRP embedded in the surface, can be written as follows:
V = V c + V s + V f = 1.75 λ + 1 f t b h 0 + f y v A s v s h 0 + φ 2 A f S f ε f v E f h f cot θ
ε f v = 2 15 ( 0.2 + 0.12 λ ) ε f u

4. Conclusions

The experimental study and theoretical analysis were carried out by studying the shear properties of 17 reinforced concrete beams strengthened with FRP. After verification and further correction, a new bearing capacity formula has been developed. Based on the above work, the following conclusions are drawn:
(1)
The failure modes of the reinforced specimens are complex, including flexural failure and shear failure. Independent of failure mode, the stiffness degradation of the reinforced specimens is delayed and the displacement is reduced. The cracking load of the reinforced specimens in the pure flexural section did not increase, but the cracking load in the flexural section increased significantly, and the number and width of oblique cracks decreased significantly. Indeed, some cracks even stop developing when they encounter the FRP. The shear failure of the specimen strengthened by embedded optical circular GFRP bars is more likely than that by embedded thread GFRP bars. The bearing capacity of the reinforced specimen without the U-hoop is higher than that of the reinforced specimen with the U-hoop. However, since only one such specimen is designed, the dispersion of the results is large, and further verification is needed.
(2)
The concrete strength grade, longitudinal reinforcement ratio, surface characteristics, and the type and diameter of FRP bars have no effect on the mid-span displacement of the reinforced specimens. Conversely, the reinforcement method, FRP bar spacing, and shear span ratio of the specimens have a significant effect on the mid-span displacement of the reinforced specimens. The ultimate bearing capacity, stirrup strain and FRP bar strain of the strengthened specimens decrease with the increase in concrete strength grade and longitudinal reinforcement ratio. The increase rate of ultimate bearing capacity increases with the increase in concrete strength grade and decreases with the increase in longitudinal reinforcement ratio. The surface characteristics of FRP bars have a significant effect on the ultimate bearing capacity, ultimate bearing capacity increase rate, stirrup strain and FRP bar strain.
(3)
The shear failure mechanism of reinforced concrete beams strengthened with FRP embedded on the surface is similar to that of ordinary reinforced concrete beams, and the mechanism of FRP is similar to that of stirrups. Therefore, truss theory can be used for overall analysis. The test data show that using the method similar to that used for stirrups to calculate the shear capacity of FRP is also in line with the actual outcomes. According to the statistical results of the strain of FRP in the test and the results of data fitting, the utilization coefficient of FRP is determined to be 0.2.

Author Contributions

Y.Z.: Conceptualization, Data curation, Formal analysis, Methodology, Resources, Validation, Writing—original draft. N.L.: Conceptualization, Formal analysis, Investigation, Methodology, Resources, Writing—review and editing. Q.W.: Methodology, Writing—review and editing. Z.L.: Data curation, Writing—review and editing. X.Q.: Writing—review and editing, Investigation. All authors have read and agreed to the published version of the manuscript.

Funding

This research received no external funding.

Data Availability Statement

Not applicable.

Conflicts of Interest

The authors declare no conflict of interest.

References

  1. Pohoryles, D.A.; Melo, J.; Rossetto, T. Combined Flexural and Shear Strengthening of RC T-Beams with FRP and TRM: Experimental Study and Parametric Finite Element Analyses. Buildings 2021, 11, 520. [Google Scholar] [CrossRef]
  2. Colajanni, P.; Pagnotta, S.; Recupero, A.; Spinella, N. Shear resistance analytical evaluation for RC beams with transverse reinforcement with two different inclinations. Mater. Struct. 2020, 53, 18. [Google Scholar] [CrossRef]
  3. Colajanni, P.; Recupero, A.; Spinella, N. Shear strength degradation due to flexural ductility demand in circular RC columns. Bull. Earthq. Eng. 2015, 13, 1795–1807. [Google Scholar] [CrossRef]
  4. Lu, X.Z.; Chen, J.F.; Ye, L.P.; Teng, J.G.; Rotter, J.M. RC beams shear-strengthened with FRP: Stress distributions in the FRP reinforcement. Constr. Build. Mater. 2009, 23, 1544–1554. [Google Scholar] [CrossRef]
  5. Chen, J.-F.; Teng, J.G. Shear capacity of FRP-strengthened RC beams: FRP debonding. Constr. Build. Mater. 2003, 17, 27–41. [Google Scholar] [CrossRef]
  6. Koutas, L.N.; Tetta, Z.; Bournas, D.A.; Triantafillou, T.C. Strengthening of concrete structures with textile reinforced mortars: State-of-the-art review. J. Compos. Constr. 2019, 23, 03118001. [Google Scholar] [CrossRef]
  7. Deniaud, C.; Cheng, J.J.R. Reinforced concrete T-beams strengthened in shear with fiber reinforced polymer sheets. J. Compos. Constr. 2003, 7, 302–310. [Google Scholar] [CrossRef]
  8. Hawileh, R.A.; Nawaz, W.; Abdalla, J.A.; Saqan, E.I. Effect of flexural CFRP sheets on shear resistance of reinforced concrete beams. Compos. Struct. 2015, 122, 468–476. [Google Scholar] [CrossRef]
  9. Wegian, F.M.; Abdalla, H.A. Shear capacity of concrete beams reinforced with fiber reinforced polymers. Compos. Struct. 2005, 71, 130–138. [Google Scholar] [CrossRef]
  10. Hu, Z.; Zhou, X.; Guo, M.; Huang, X.; Hu, B. Enhancing the performance of CFRP shear-strengthened RC beams using “ductile” anchoring devices. Front. Mater. 2020, 7, 292. [Google Scholar] [CrossRef]
  11. Kotynia, R.; Oller, E.; Marí, A.; Kaszubska, M. Efficiency of shear strengthening of RC beams with externally bonded FRP materials–State-of-the-art in the experimental tests. Compos. Struct. 2021, 267, 113891. [Google Scholar] [CrossRef]
  12. Chen, G.M.; Li, S.W.; Fernando, D.; Liu, P.C.; Chen, J.F. Full-range FRP failure behaviour in RC beams shear-strengthened with FRP wraps. Int. J. Solids Struct. 2017, 125, 1–21. [Google Scholar] [CrossRef]
  13. Shahbazpanahi, S.; Ali, A.A.A.; Aznieta, F.N.; Kamgar, A.; Farzadnia, N. A Theoretical Method for Fracture Resistance of Shear-Strengthened RC Beams with FRP. Arab. J. Sci. Eng. 2014, 39, 3591–3597. [Google Scholar] [CrossRef]
  14. Belarbi, A.; Bae, S.-W.; Brancaccio, A. Behavior of full-scale RC T-beams strengthened in shear with externally bonded FRP sheets. Constr. Build. Mater. 2012, 32, 27–40. [Google Scholar] [CrossRef]
  15. Monti, G.; Liotta, M.A. Tests and design equations for FRP-strengthening in shear. Constr. Build. Mater. 2007, 21, 799–809. [Google Scholar] [CrossRef]
  16. Alam, M.S.; Hussein, A. Size effect on shear strength of FRP reinforced concrete beams without stirrups. J. Compos. Constr. 2013, 17, 507–516. [Google Scholar] [CrossRef]
  17. Ahmed, M.; Colajanni, P.; Pagnotta, S. Influence of Cross-Section Shape and FRP Reinforcement Layout on Shear Capacity of Strengthened RC Beams. Materials 2022, 15, 4545. [Google Scholar] [CrossRef] [PubMed]
  18. Pellegrino, C.; Modena, C. Fiber reinforced polymer shear strengthening of reinforced concrete beams with transverse steel reinforcement. J. Compos. Constr. 2002, 6, 104–111. [Google Scholar] [CrossRef]
  19. Bousselham, A.; Chaallal, O. Mechanisms of shear resistance of concrete beams strengthened in shear with externally bonded FRP. J. Compos. Constr. 2008, 12, 499–512. [Google Scholar] [CrossRef]
  20. CECS 146:2003; Technical Specification for Concrete Structures Strengthened with Carbon Fiber Sheets. China Plan Press: Beijing, China, 2003.
Figure 1. Rebar and concrete strain gauge layout. (a) Rebar strain guage layout. (b) Concrete strain gauge layout.
Buildings 12 02062 g001
Figure 2. Strain gauge arrangement of FRPs. (a) FRP spacing 100 mm; (b) FRP spacing 150 mm; (c) FRP spacing 200 mm.
Buildings 12 02062 g002aBuildings 12 02062 g002b
Figure 3. Dimension and reinforcement of T test beam.
Buildings 12 02062 g003
Figure 4. Reinforced specimen cross-section dimensions and reinforcement.
Buildings 12 02062 g004
Figure 5. Typical failure mode.
Buildings 12 02062 g005aBuildings 12 02062 g005b
Figure 6. Influence of different parameters on bearing capacity of specimens. (a) concrete strength grade, (b) the longitudinal reinforcement ratio, (c) CFRP surface characteristics, (d) FRP type, (e) the reinforcement method, (f) the GFRP diameter and (g) the GFRP spacing.
Buildings 12 02062 g006
Figure 7. Load versus displacement curves. (a) Different concrete strength grade thread GFRP reinforcement test pieces; (b) different concrete strength grade light round GFRP reinforcement test pieces; (c) different longitudinal reinforcement ratio GFRP reinforcement test pieces; (d) different longitudinal reinforcement ratio light round CFRP reinforcement test pieces; (e) different surface features GFRP S20C20; (f) different surface features GFRP S18C30; (g) different surface features GFRP S18C20; (h) different types of FRP reinforcement test pieces; (i) different reinforcement methods GFRP reinforcement test pieces; (j) GFRP reinforcement test pieces with different diameter threads; (k) GFRP reinforcement test pieces with different spacing; (l) different shear span ratio GFRP reinforcement test pieces.
Buildings 12 02062 g007
Figure 8. Shear calculation model.
Buildings 12 02062 g008
Figure 9. Utilization of GFRP.
Buildings 12 02062 g009
Figure 10. Vf Fitting curve between experimental value and theoretical value Vf.
Buildings 12 02062 g010
Table 1. Mechanical properties of steel bars indices.
Diameter
d/mm
Power LevelYield Strength
fyk/MPa
Ultimate Tensile Strength fstk/MPaElongation δ/%
8HPB235307.5537.530.5
12HRB33536555028.5
18HRB33537562529
20HRB33535552028.5
Table 2. Mechanical properties of concrete indices of concrete.
Concrete Strength GradeCube Compressive Strength/MPaAxial Compressive Strength/MPaModulus of Elasticity/GPa
C2021.414.326
C3031.521.131
Table 3. Mechanical properties of cement indices of adhesive.
AdhesiveSplitting Tensile Strength/MPaBending Strength/MPaCompressive Strength/MPa
JGN-type planting glue12.565.590.5
Table 4. FRP muscle mechanical performance indices of FRPs.
FRPUltimate Tensile Strengthaverage/MPaModulus of Elasticity/GPaUltimate Tensile Strain/10-6
GFRP10055219,327
CFRP206014514,200
Table 5. Specimens grouping.
Test Piece NumberConcrete
Grade
Reinforcement RatioFRP TypeFRP Surface CharacteristicsFRP
Diameter
FRP
Spacing
Shear
Span Ratio
Reinforcement Method
BZS20C20C200.0212.39
BZS18C30C300.0172.39
BZS18C20C200.0172.39
L-G8D150S20C20UC200.021GFRPThread81502.39Add U-hoop
L-G8D150S18C30UC300.017GFRPThread81502.39Add U-hoop
L-G8D150S18C20UC200.017GFRPThread81502.39Add U-hoop
G-G8D150S20C20UC200.021GFRPLight circle81502.39Add U-hoop
G-G8D150S18C30UC300.017GFRPLight circle81502.39Add U-hoop
G-G8D150S18C20UC200.017GFRPLight circle81502.39Add U-hoop
L-C8D150S18C20UC200.017CFRPThread81502.39Add U-hoop
L-G8D150S18C20C200.017GFRPThread81502.39No U-hoop
L-G6D150S18C20UC200.017GFRPThread61502.39Add U-hoop
L-G10D150S18C20UC200.017GFRPThread101502.39Add U-hoop
L-G8D100S18C20UC200.017GFRPThread81002.39Add U-hoop
L-G8D200S18C20UC200.017GFRPThread82002.39Add U-hoop
L-G8D150S18C20UC200.017GFRPThread81502.79Add U-hoop
L-G8D150S18C20UC200.017GFRPThread81501.99Add U-hoop
Table 6. Failure modes of specimens.
Sample
Number
Specimen NumberFailure ModeMaximum Mid-Span
Displacement (mm)
Diagonal Crack
Width (mm)
1BZS20C20Flexural failure29.874.40
2BZS18C30Flexural failure29.901.20
3BZS18C20Flexural failure28.371.48
4L-G8D150S20C20UFlexural failure20.350.60
5L-G8D150S18C30UFlexural failure23.230.48
6L-G8D150S18C20UFlexural failure21.900.50
7G-G8D150S20C20UShear failure26.05
8G-G8D150S18C30UShear failure29.07
9G-G8D150S18C20UFlexural failure23.710.90
10L-C8D150S18C20UFlexural failure23.611.90
11L-G8D150S18C20Shear failure36.041.00
12L-G6D150S18C20UFlexural failure22.380.40
13L-G10D150S18C20UFlexural failure30.340.30
14L-G8D100S18C20UFlexural failure29.669.40
15L-G8D200S18C20UShear failure26.640.35
16L-G8D150S18C20U (λ = 2.79)Flexural failure26.600.50
17L-G8D150S18C20U (λ = 1.99)Flexural failure32.290.90
Table 7. Characteristic load of beam specimens.
Test Piece NumberPcr/kNΔPcrPcr1/kNΔPcr1Pu/kNΔPuStiffness/kN·mm−1
BZS20C201717.7104.83.51
BZS18C3012.413.695.43.19
BZS18C2016.716.7106.63.76
L-G8D150S20C20U9.3−0.4532.90.86108.60.0225.34
L-G8D150S18C30U12.3−0.008381.79109.80.1514.73
L-G8D150S18C20U10.2−0.38361.16112.40.0545.13
G-G8D150S20C20U13.2−0.22542.05111.50.0644.28
G-G8D150S18C30U13.80.11502.67108.80.1413.74
G-G8D150S18C20U8.7−0.47501.99114.40.0734.82
L-C8D150S18C20U12−0.28703.19114.50.094.85
L-G8D150S18C209.3−0.44612.65119.80.123.32
L-G6D150S18C20U15.6−0.06361.16110.60.0374.94
L-G10D150S18C20U13.5−0.1927.20.63109.50.0273.61
L-G8D100S18C20U7.8−0.53260.56109.80.033.7
L-G8D200S18C20U16.1−0.03320.92107.50.00844.04
L-G8D150S18C20U (λ = 1.99)12.949.5144.73.73
L-G8D150S18C20U (λ = 2.79)134099.24.48
Table 8. Maximum strain summary of GFRP.
Test Piece NumberFRP Maximum Strain/μεMaximum Strain to Ultimate Strain Ratio
L-G8D150S18C30U71880.37
G-G8D150S20C20U9090.05
G-G8D150S18C30U55970.29
L-G8D150S18C2054830.28
L-G8D100S18C20U35620.18
Table 9. Comparison of experimental values with theoretical values of Vf.
Test Piece NumberMain Crack Angle V f _ t e s t / kN V f _ e x p e c t / kN
L-G8D150S18C30U47°7.27.15
G-G8D150S20C20U55°3.95.27
G-G8D150S18C30U49°6.76.66
L-G8D150S18C2050°6.66.43
L-G8D100S18C20U63°4.15.5
Table 10. Comparison of the shear-bearing capacity test value and the theoretical value.
Test Piece Number V f _ t e s t / kN V f _ e x p e c t / kN V f _ t e s t / V f _ e x p e c t
L-G8D150S18C30U109.8111.90.98
G-G8D150S20C20U112.697.941.15
G-G8D150S18C30U108.8110.920.98
L-G8D150S18C20119.8100.261.19
L-G8D100S18C20U113.898.41.16
Publisher’s Note: MDPI stays neutral with regard to jurisdictional claims in published maps and institutional affiliations.

