Article

Recycling of Waste Stone Powder in High Fluidity Grouting Materials for Geotechnical Engineering Reinforcement

1
No. 5 Mine, Pingdingshan Tian’an Coal Company, Pingdingshan 467000, China
2
School of Civil Engineering, Henan Polytechnic University, Jiaozuo 454000, China
*
Author to whom correspondence should be addressed.
Buildings 2022, 12(11), 1887; https://doi.org/10.3390/buildings12111887
Submission received: 29 September 2022 / Revised: 18 October 2022 / Accepted: 21 October 2022 / Published: 4 November 2022
(This article belongs to the Special Issue Materials in Sustainable Buildings)

Abstract

:
Clay cement grout is frequently employed in geotechnical reinforcement projects. However, laboratory test revealed that clay cement slurry does not consolidate in a closed environment for an extended period of time, with cracks forming during the consolidation process under natural conditions, indicating that the geotechnical reinforcement poses dangers. Stone powder is a powdery solid waste similar to clay materials. Stone powder particle surfaces provide an attachment point for cement reaction, which can speed up cement hydration, with the ability to substitute clay cement slurry. According to our findings, the bleeding rate of clay cement slurry is 14.80% at 290 mm fluidity, and that of the same mass ratio (1:3) as stone powder cement slurry is 11.09%. The bleeding rate is minimal, which promotes the creation of an integral structure after setting between the slurry and lose rock and soil. Mechanical test results show that the strength of the stone powder cement slurry hardened body is 1458 kPa, whereas the strength of the clay cement slurry hardened body is 436 kPa. Microstructural analysis shows that the stone powder cement hardened body has more hydration products and is porous than the clay cement hardened body. The hardened body of stone powder cement slurry has high strength and resistance to external loads, which can increase the bearing capacity and improve the geotechnical reinforcement effect.

1. Introduction

Clay cement grout is frequently employed in geotechnical engineering reinforcing projects. Indoor testing of samples revealed that clay cement slurry does not solidify in a confined environment for a long period, accompanied by severe bleeding. We also found that slurry does not solidify after drilling and sampling of the grouting geotechnical engineering, in line with the test phenomenon. Cracks form during the grout consolidation process in its natural state, and there are risks associated with geotechnical engineering consolidation. Whether in a closed or natural environment, grout is subject to limitations, such as low bleeding rate, long-term non-condensation, poor mechanical performance, etc. [1,2,3,4], making it difficult to consolidate into a hardened body that is resistant to external loads. Furthermore, it is unable to properly strengthen geotechnical engineering. To address these issues associated with clay slurry, a geotechnical engineering grouting material with high fluidity, low bleeding rate, and outstanding mechanical qualities must be developed. Stone powder is a type of powdery solid waste similar to a clay material. The surface of stone powder particles serves as an attachment point for cement reaction, which can speed up cement hydration and perhaps replace clay cement slurry. Mechanized aggregate processing, crushing, grinding, transportation, and other procedures generate a considerable volume of solid stone powder waste. The reuse of stone powder can not only protect the environment but also provide economic benefits, which is in line with green development objectives [5,6,7,8,9,10]. Stone powder is a powdery solid waste that resembles clay, and cement particles are smaller than stone powder particles. The stone powder particles are encased in an aqueous solution, which serves as an attachment point for the cement hydration reaction and accelerates cement hydration. As a result, clay has the potential to be substituted for slurry. Slurry diffuses into the soft geotechnical reinforcement crack depth, covering a wide range in the geotechnical reinforcement complex and crisscrossing pore channels, requiring a high fluidity of the slurry. The slurry hardened body must exhibit high strength to support the foundation and improve the bearing capacity of the base.
Vardhan et al. [11,12,13] investigated stone powder as an additive in cement, mortar, concrete, and other slurries. When 10% cement was substituted with stone powder, the compressive strength of the hardened body increased to its maximum. When the content exceeds 10%, the hardened body gradually decreases. Chen X et al. [14,15] investigated the addition of stone powder to cement slurry as a type of composite additive. They discovered that when 5–10% stone powder was substituted in cement, the fluidity and compressive properties of the material improved. However, when more than 10% of cement is replaced by stone powder, the material’s fluidity and compressive qualities steadily deteriorate.
With respect to the influence of the content of stone powder on the strength, impermeability, and durability of concrete, when the content of stone powder is less than 7%, the strength and durability of concrete increase, and when the content is more than 7%, the mechanical properties and durability of concrete decrease. Bayesteh et al. [16,17] discovered that the cement ratio also has a significant influence on strength, reporting a rapid reduction in compressive strength of cement slurry hardened body with increased cement ratio. Furthermore, the surface of stone powder particles has low activity, which can be hydrated with cement to form single-carbon calcium aluminate and semi-carbon calcium aluminate [18,19,20,21], as well as crystal nuclei, expediting the early cement reaction and improving early strength properties [22,23].
In this study, the performance of stone powder cement grout and clay cement grout will be compared in a bleeding rate test, uniaxial compression test, and microstructure test. According to the tests results, stone powder cement grout is a geotechnical reinforcement material with a low bleeding rate, high compressive strength, and thick microstructure that has the potential to replace clay cement grout. In terms of environmental protection, the appropriate use of stone powder cement slurry is critical for conserving land resources, improving the ecological environment, and rationally utilizing solid waste. From an engineering standpoint, the stone powder cement slurry hardened body has high strength and strong resistance to the external load, which can increase the bearing capacity of the geotechnical reinforcement and provide an excellent geotechnical reinforcement effect.

2. Materials and Methods

2.1. Materials

Cement: ordinary Portland cement, the central composition and clinker of which are shown in Table 1 and Table 2, respectively.
The stone powder studied in this paper is limestone powder, which is a kind of powdery solid waste produced in the process of machine-made aggregate processing. It is gray–white, and the main component is calcium oxide. The detailed composition and physical parameters of stone powder are shown in Table 3 and Table 4, respectively.
The clay used in this study is a yellow, powdery granule mainly composed of silicon oxide. The detailed composition and physical properties of the clay are shown in Table 5 and Table 6, respectively.
The particle size distribution of the three materials is normal; the clay particle size is mainly distributed in the range of 5–50 μm, and the cement particle size is mainly distributed in the range of 30–100 μm and configured into a clay cement slurry, as shown in Figure 1. The clay particles enclose the cement particles, hindering the hydration reaction of cement to a certain extent. The particle size of stone powder is mainly distributed in the range of 100–150 μm and configured into stone powder cement slurry. The cement particles are attached to the surface of stone powder particles, and the cement reaction contact surface is increased, which can accelerate the cement hydration reaction and has the potential to replace clay for slurry.
The ratio of clay cement grouting material is cement: clay = 1:3, and the fluidity is 289 mm. A stone powder cement slurry was prepared with a similar fluidity. The proportion of materials in the slurry is cement: stone powder = 1:3, and the fluidity is 296 mm. Clay cement grouting material and stone powder cement grouting material were prepared according to this proportion listed in Table 7.

2.2. Methods

2.2.1. Fluidity Test Method

We applied the fluidity test method described in [24]. A glass plate was placed in a horizontal position. The glass plate and a cement flowing mold of cement net slurry were wiped with a wet cloth, and the flowing mold of cement net slurry was placed in the center of the glass plate. The upper diameter of the cement slurry flow mold was 36 mm, the lower diameter was 60 mm, and the height was 60 mm, with a smooth inner wall. The mixed slurry was poured into the cement slurry flow mold so that the slurry was level with the surface of the mold. Then, the cone mold was lifted, and the maximum diameter of the slurry flowing freely on the glass plate plane was determined. The above test steps were repeated, and the fluidity values were averaged.

2.2.2. Bleeding Rate Test Method

We applied the bleeding rate test method described in [25]. A volume of 100 mL clay cement slurry or stone powder cement slurry was added to a measuring cylinder with the lid sealed tightly to prevent water evaporation. The bleeding of the slurry in the measuring cylinder was continuously observed. The final bleeding volume of the slurry was recorded after the level of the slurry had not changed for 5 h. The final bleeding rate of the slurry was calculated according to the average value of bleeding volume.

2.2.3. Uniaxial Compression Test Method

We applied the test method described in [26] according to the “Standard for Testing Methods for Basic Properties of building mortar”. Standard 70.7 mm × 70.7 mm × 70.7 mm cubic test blocks were prepared and cured under standard conditions for 7 days, 14 days, 28 days, 56 days, and 112 days, with 3 samples for each duration; the test blocks were labeled accordingly. After curing for the specified durations, a universal press was used for the uniaxial compression test. The pressure speed was set to 0.2 kN/min an adjusted according to the coefficient to calculate the final corresponding compressive strength value, as shown in Figure 2.

2.2.4. Scanning Electron Microscopy (SEM) Test Method

We applied the method described in [24]. After testing the mechanical properties, sample pieces were selected and processed into 3 mm × 3 mm × 3 mm cubes. Before the microscopic test, the samples were sprayed with gold, and the cement hydration products and the microscopic pores of the hardened body were observed by scanning electron microscopy. The hydration products of the slurry were observed under an electron microscope at different magnifications. A photo of the test setup is shown in Figure 3.

3. Results

3.1. Analysis of the Setting Process of Clay Cement Slurry

When clay cement slurry is injected into a ground rock mass, it forms a strong overall structure with the rock mass by solidification. Because clay particles are smaller than cement particles, the cement particles are wrapped in the slurry to prevent the cement hydration reaction, preventing the immediate solidification of the clay slurry. Because the bleeding rate is high and the water on the surface of the slurry is difficult to volatilize, the slurry does not immediately solidify in the ground. Therefore, the incorporation of cement does not play a hardening or induce a consolidation effect, as shown in Figure 4.
When curing clay cement slurry in a ventilated environment, initial cracks appear during the slurry consolidation process, resulting in a decrease in compressive strength of the hardened body. The consolidation process of slurry can be divided into three stages: normal shrinkage, residual shrinkage, and micro expansion, as shown in Figure 5. Analysis of the consolidation process of slurry showed that with the evaporation of free water of slurry, the slurry changed from a saturated state to an unsaturated state, and matric suction was be generated during the clay drying process [27], which increased with decreasing water content. When the adhesion and matric suction between clay particles are equal, the slurry is in equilibrium. When the adhesive force between clay particles is greater than matric suction, cracks do not occur, as shown in the model diagram in Figure 6c. When the adhesion force between clay particles is greater than matric suction, the distance between particles is reduced, resulting in surface shrinkage and gradual extension inward, accompanied by local cracks, as shown in Figure 6d.
The evaporation of water molecules causes the shrink film between clay particles to become thinner. The distance between the clay particles is narrowed, the position of the clay particles is rearranged, and dry shrinkage cracking occurs. Disappearance of water in the soil provides space for the occurrence of cracks in the soil. Analysis of the consolidation process of clay cement slurry, shows that fracturing is the main factor that causes the strength failure of the clay slurry hardened body.
Regardless of whether the clay cement slurry is in a closed environment or in a natural state, it is subject to the limitations of low stone rate, poor bond strength, long-term non-condensation, poor mechanical performance, etc. It is difficult to form a hardened body with the ability to resist external loads, so clay cement slurry cannot play a role in strengthening the geotechnical reinforcement.

3.2. Analysis of Slurry Bleeding Rate under High-Fluidity Conditions

In the process of geotechnical reinforcement grouting, in order to ensure that the grout can spread widely, as well as the deep diffusion in the fissures and pores of rock and soil mass, it is necessary to prepare stone powder cement grout with high mobility. A fluidity test of stone powder cement slurry was carried out based on clay cement slurry. The fluidity of stone powder slurry is 296 mm, and that of clay slurry is 289 mm. The fluidity of the two materials is similar, ensuring the width and depth of slurry diffusion. The test setup is shown in Figure 7.
Grouting materials with high flow conditions cause the bleeding of the grout, leading to a decrease in the grout stone rate and affecting the consolidation of the grout and the rock and soil around the cracks, making it difficult to form an overall structure. Therefore, we conducted a bleeding rate test. After the water bleeding test of clay cement slurry and stone powder cement slurry, the final water bleeding rate of clay cement slurry was 16.4 mL, and that of stone powder cement slurry was 12.6 mL. According to the calculation, the bleeding rate of clay cement slurry is 14.80%, and that of stone powder cement slurry is 11.09%, indicating that the stone powder cement slurry with a low bleeding rate has good fluidity, diffuses into the depth of fractures, and forms a relatively complete structure with the rock and soil mass of the foundation fracture.
Analysis of the bleeding test results shows that the slurry can be divided into two stages: gravity sedimentation and hydration reaction. The bleeding rate of clay cement within 4 h was 12.96%, and that of stone powder cement slurry was 9.83%, representing the first stage of the bleeding process of slurry, mainly due to the gravity effect of clay and stone powder particles. The bleeding rate of clay cement slurry was 1.84% after 4–5 h, and the bleeding rate of stone powder cement slurry was 1.26% after 4–5 h, representing the second stage of bleeding of slurry, mainly due to the cement hydration reaction. The curves and test photos of the two slurry bleeding processes are shown in Figure 8.
Clay particles and cement particles form a scaffolding structure in the slurry, polymerizing into a clay cement ball structure, narrowing the pores between clay particles, and causing clay particles to sink. However, the surface of the stone powder particles participate in the hydration reaction of cement. The hydration products condense the stone powder particles into larger blocks, causing the particles to sink, resulting in bleeding.
The bleeding rate of stone powder cement grout Is lower than that of clay cement grout, making it more conducive to ensuring the width and depth of grout diffusion so that the grout fills in the cracks of rock soil mass, forming a whole with the pores and cracks of bedrock soil mass after consolidation so as to ensure the integrity and stability of the geotechnical reinforcement structure.

3.3. Comparison and Analysis of Uniaxial Compression Test Results of Stone Powder and Clay Slurry Hardened Body

A comparison of the strength of stone powder cement slurry hardened body and clay cement slurry hardened body at different ages shows that the strength of stone powder cement slurry hardened body is higher than that of clay cement slurry hardened body at each stage, indicating that the stone powder cement slurry has high strength, strong resistance to the external load, and a better grouting reinforcement effect than the clay cement slurry hardened body. The strength and strength ratio of stone powder cement slurry hardened body and clay cement slurry hardened body are shown in Table 8; the data in the table represent the average compressive strength.
The strength of stone powder cement stone is greater than that of clay cement stone across all curing durations, as shown in Figure 9 and Figure 10. The strength of stone powder cement slurry hardened body gradually increases with age, with the rate of increase gradually slowing down with age. However, the strength of the clay cement slurry hardened body first increases first and then decreases with time. After 28 days of curing, the maximum strength of clay cement slurry stone is 436 kPa, whereas that of stone powder cement slurry stone is 1352 kPa. The strength of stone powder cement slurry stone is 3.1 times that of clay cement slurry stone. After 112 days of curing, the maximum strength of stone powder cement slurry hardened body is 1458 kPa, whereas the strength of clay cement slurry hardened body is 46 kPa. The strength of stone powder cement slurry hardened body is 31.6 times that of clay cement slurry hardened body. The longer the curing duration, the higher the strength of stone powder cement slurry relative to that of clay cement slurry, owing to the cracks generated during the solidification of clay cement grout. The compressive strength value shows that the geotechnical reinforcement strengthening capacity of stone powder cement grout hardened body is greater than that of clay cement hardened body.
The strength of stone powder cement grout gradually increases with the curing duration, and no cracks are found on the surface, as shown in Figure 11a, whereas the surface of clay cement slurry exhibits crisscrossing cracks, leading to strength failure and hardened body instability, as shown in Figure 11b. When the clay slurry is transported to the rock of the geotechnical reinforcement, cracks occur after slurry consolidation, reducing the strength of the hardened body and the bearing capacity of the geotechnical reinforcement. When the stone powder slurry is transported to the depth of the geotechnical reinforcement cracks, a strong hardened body is formed. Therefore, stone powder cement slurry material is preferred for geotechnical reinforcement slurry material.
During the curing process, the strength of the stone powder cement slurry gradually increases over time. After 112 days, the maximum strength of the stone powder cement slurry stone is 1458 kPa—31.6 times that of the clay cement slurry stone. The hardened body reinforced with stone powder slurry is more powerful than that with clay cement and is more resistant to external load.

3.4. Analysis of Microscopic Reaction Mechanism and Pore Structure of the Hardened Body

In addition to the mechanical macroanalysis, a microanalysis should also be carried out. The hydration products, reaction mechanism, and micropores of clay cement and stone powder cement stone bodies were analyzed from the microscopic perspective. The microparameters of stone powder cement grouting hardened body are better. The combination of macro- and microanalysis further demonstrates that the stone powder cement slurry is more resistant to external loads, making the geotechnical reinforcement more stable and improving the bearing capacity.

3.4.1. Analysis of Hydration Reaction Products

The microstructure of cement hydration products was compared between clay cement slurry hardened body and stone powder cement slurry hardened body at different magnifications. Under 1500 × magnification, the surface of the clay particles was coated with sheet tetracalcium ferroaluminate crystals. However, the crystals on the surface of stone powder particles covered the surface in bundles, in contrast to those on the surface of clay particles; there were more crystals on the surface of stone powder particles than on the clay particles, as shown in Figure 12.
Under 3500 × magnification, the Ca(OH)2 hardened body [28,29,30,31] generated by C-S-H gel of several superimposed sheets is distributed among a few clay particles, whereas there are significantly more hydration products of C-S-H gel of stone powder cement hardened body are significantly more than those of clay cement hardened body. The sheets are closely stacked, with decreased porosity and increased strength, as shown in Figure 12.
Under 5000 × magnification, SEM images show nucleation of hydrated calcium oxide gel on the surface of the clay particles, with a small amount of ettringite growing on the surface. However, traces of erosion are visible on the surface of stone powder particles because the surface of the stone powder particles is active as a result of the reaction with cement, with a large amount of ettringite growing on the surface, as shown in Figure 12.

3.4.2. Reaction Mechanism Analysis

The role of clay in cement hydration reaction: Under the heat released from the cement hydration reaction, a small amount of ferric oxide and magnesium oxide in clay components is converted into ferric hydroxide and magnesium hydroxide colloid with positive charge. Serum anion binding clouds cluster in the body, and clay adsorption by the electrostatic force between particles results in a low strength of the hardened body. A small amount of calcium oxide in the clay composition reacts with water to produce calcium hydroxide colloid with a positive charge and cement particles with a very weak charge exchange, providing crystal nucleus attachment points for cement particles, accelerating the hydration reaction of cement, clay, and cement hydration products by chemical bond force condensation, resulting in a hardened body with high strength. However, due to the low proportion of cement in the slurry and the reduction in cementing material after hydration, the overall strength of the hardened body is low.
The role of stone powder in the cement hydration reaction: The addition of stone powder inhibits the formation of monosulfur calcium sulphoaluminate hydrate (AFm), and the ettringite formed by the hydration reaction of cement clinker in the early stage of cement is more stable. Because the molar volume of ettringite is higher than that of AFm, the porosity of the hardened body is reduced, the pore structure of the hardened body is improved, and the strength is increased.

3.4.3. Analysis of Porosity Results

(1) Image-Pro Plus (IPP) porosity calculation method
To analyze the microscopic pores of the hardened body, SEM images were analyzed by IPP software with the help of binarization-related software and the Menger sponge model. The image obtained by scanning electron microscope was imported into IPP software, and the relationship between porosity and porosity obtained by mercury pressure test was calculated according to the gray threshold. When the gray threshold was set to 81, binarization was performed to reduce the test error. In the SEM scanning volume images, pixels are taken as units; 1 represents particles, and 0 represents pores. The porosity of the consolidated body can be calculated by counting the proportion of 0 and 1 images, as shown in Figure 13.
In 3D space, based on the Menger sponge model, the expression of the micropore distribution density function can be derived as follows.
F ( r ) = 3 D K v L D r 1 D
In the aperture area, [ r 1 r 2 ] can be used to obtain the area between the microscopic pore volume for:
V ( r 1 ~ r 2 ) = r 1 r 2 F ( r ) K V r 3 d r = r 1 r 2 3 D L D r 2 D d r
And because:
V a = L 3
The microscopic porosity in the modified interval can be obtained as follows:
n ( r 1 ~ r 2 ) = r 2 L 3 D r 1 L 3 D
In summary, the microscopic pore volume of the hardened body can be expressed as:
V ( r )   V a 1 ( r L ) 3 D
After the change:
1 V ( r ) V a = r L 3 D
Finally, taking the logarithm of both sides yields:
L n 1 V ( r ) V a = ( 3 D ) L n ( r L )
where KV denotes the shape factor of microscopic pore volume, V (≥r) denotes the pore volume with a pore size is greater than or equal to the pore volume, Va denotes the total pore volume of soil within the observation range, L denotes the scale of observation range, and D denotes the fractal dimension of the pore volume of the Menger sponge.
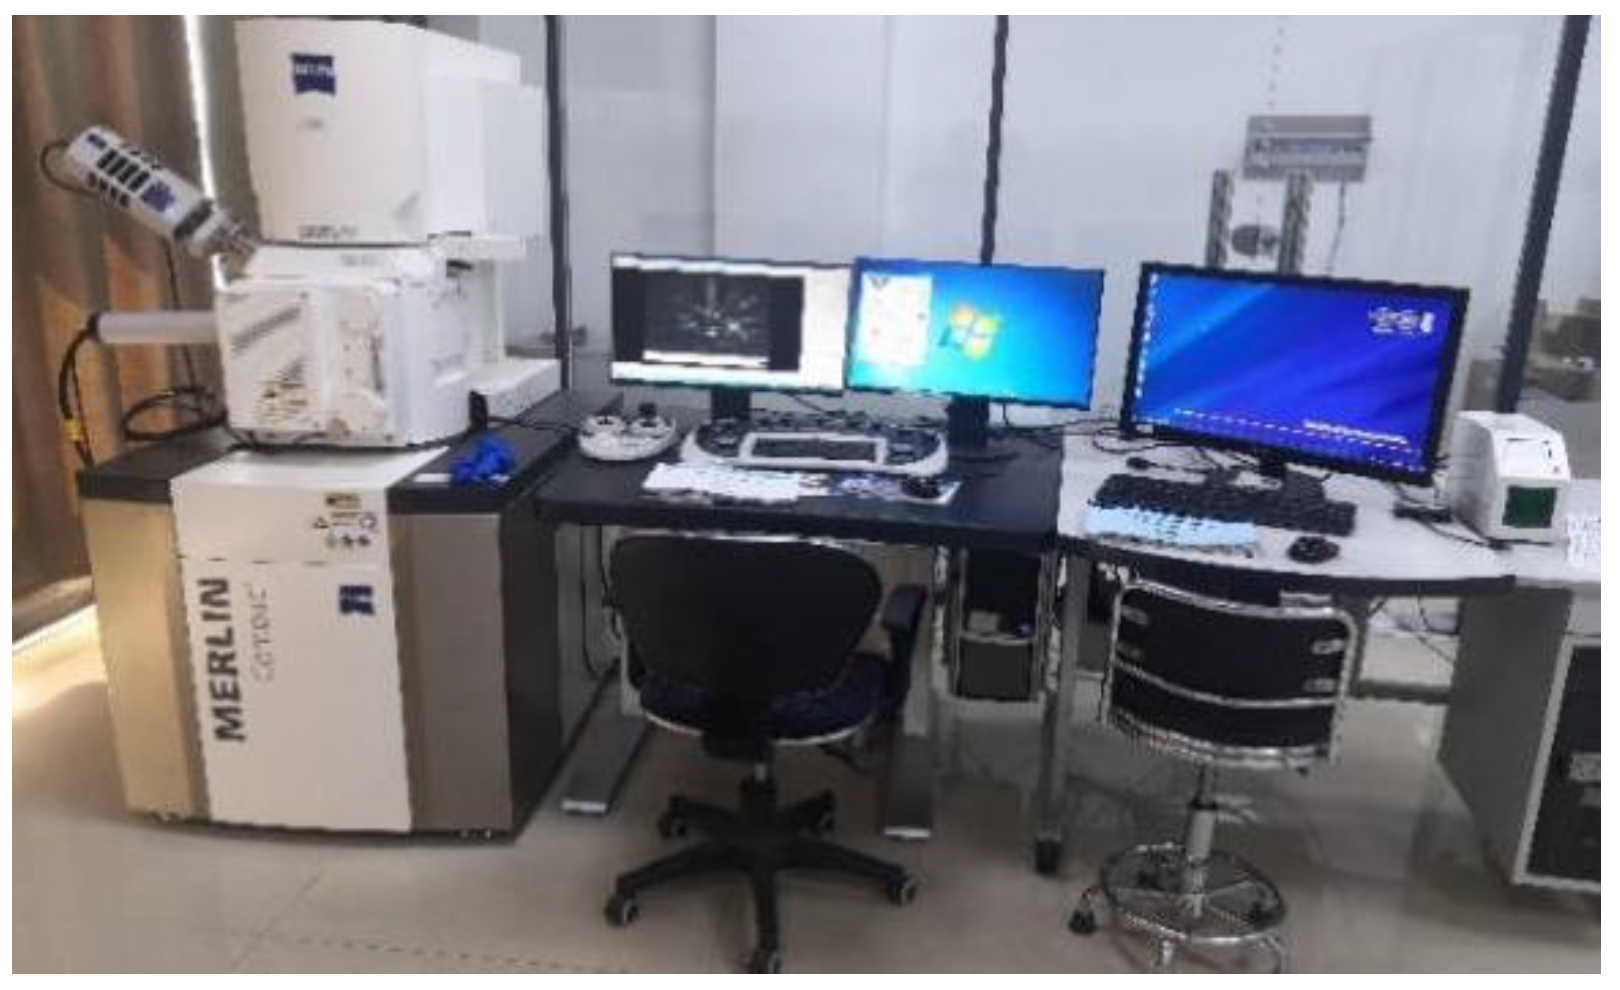
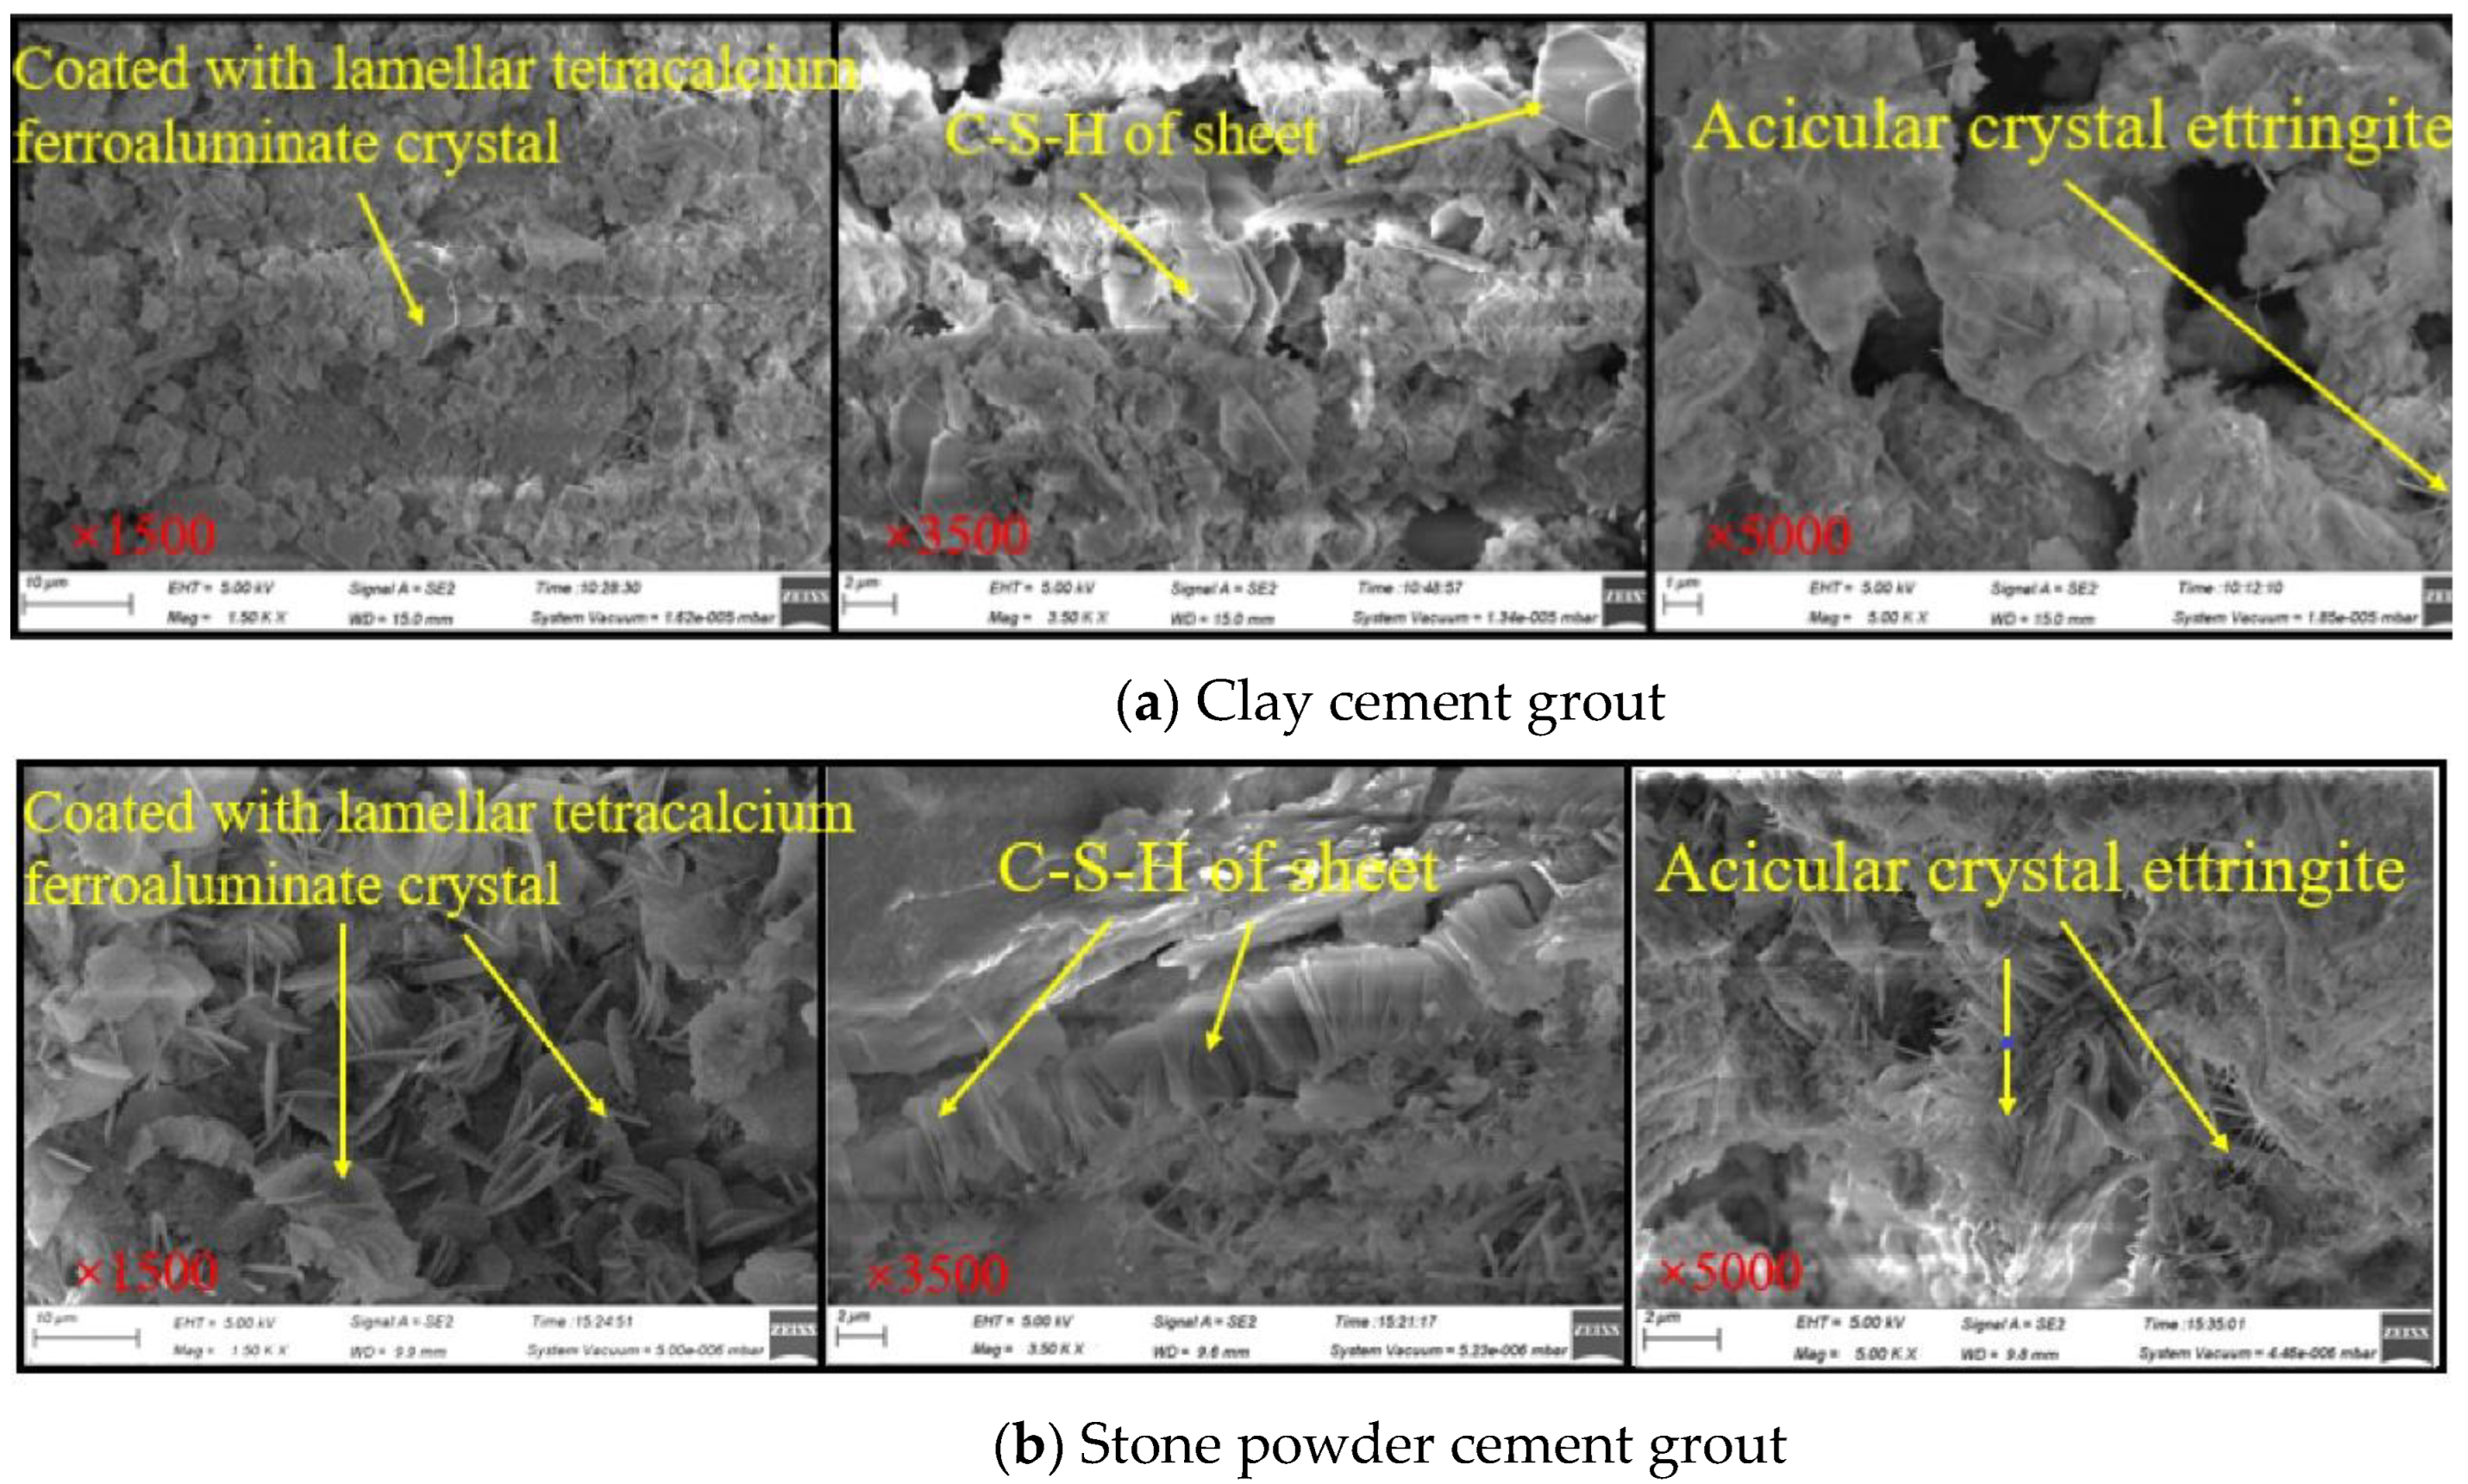
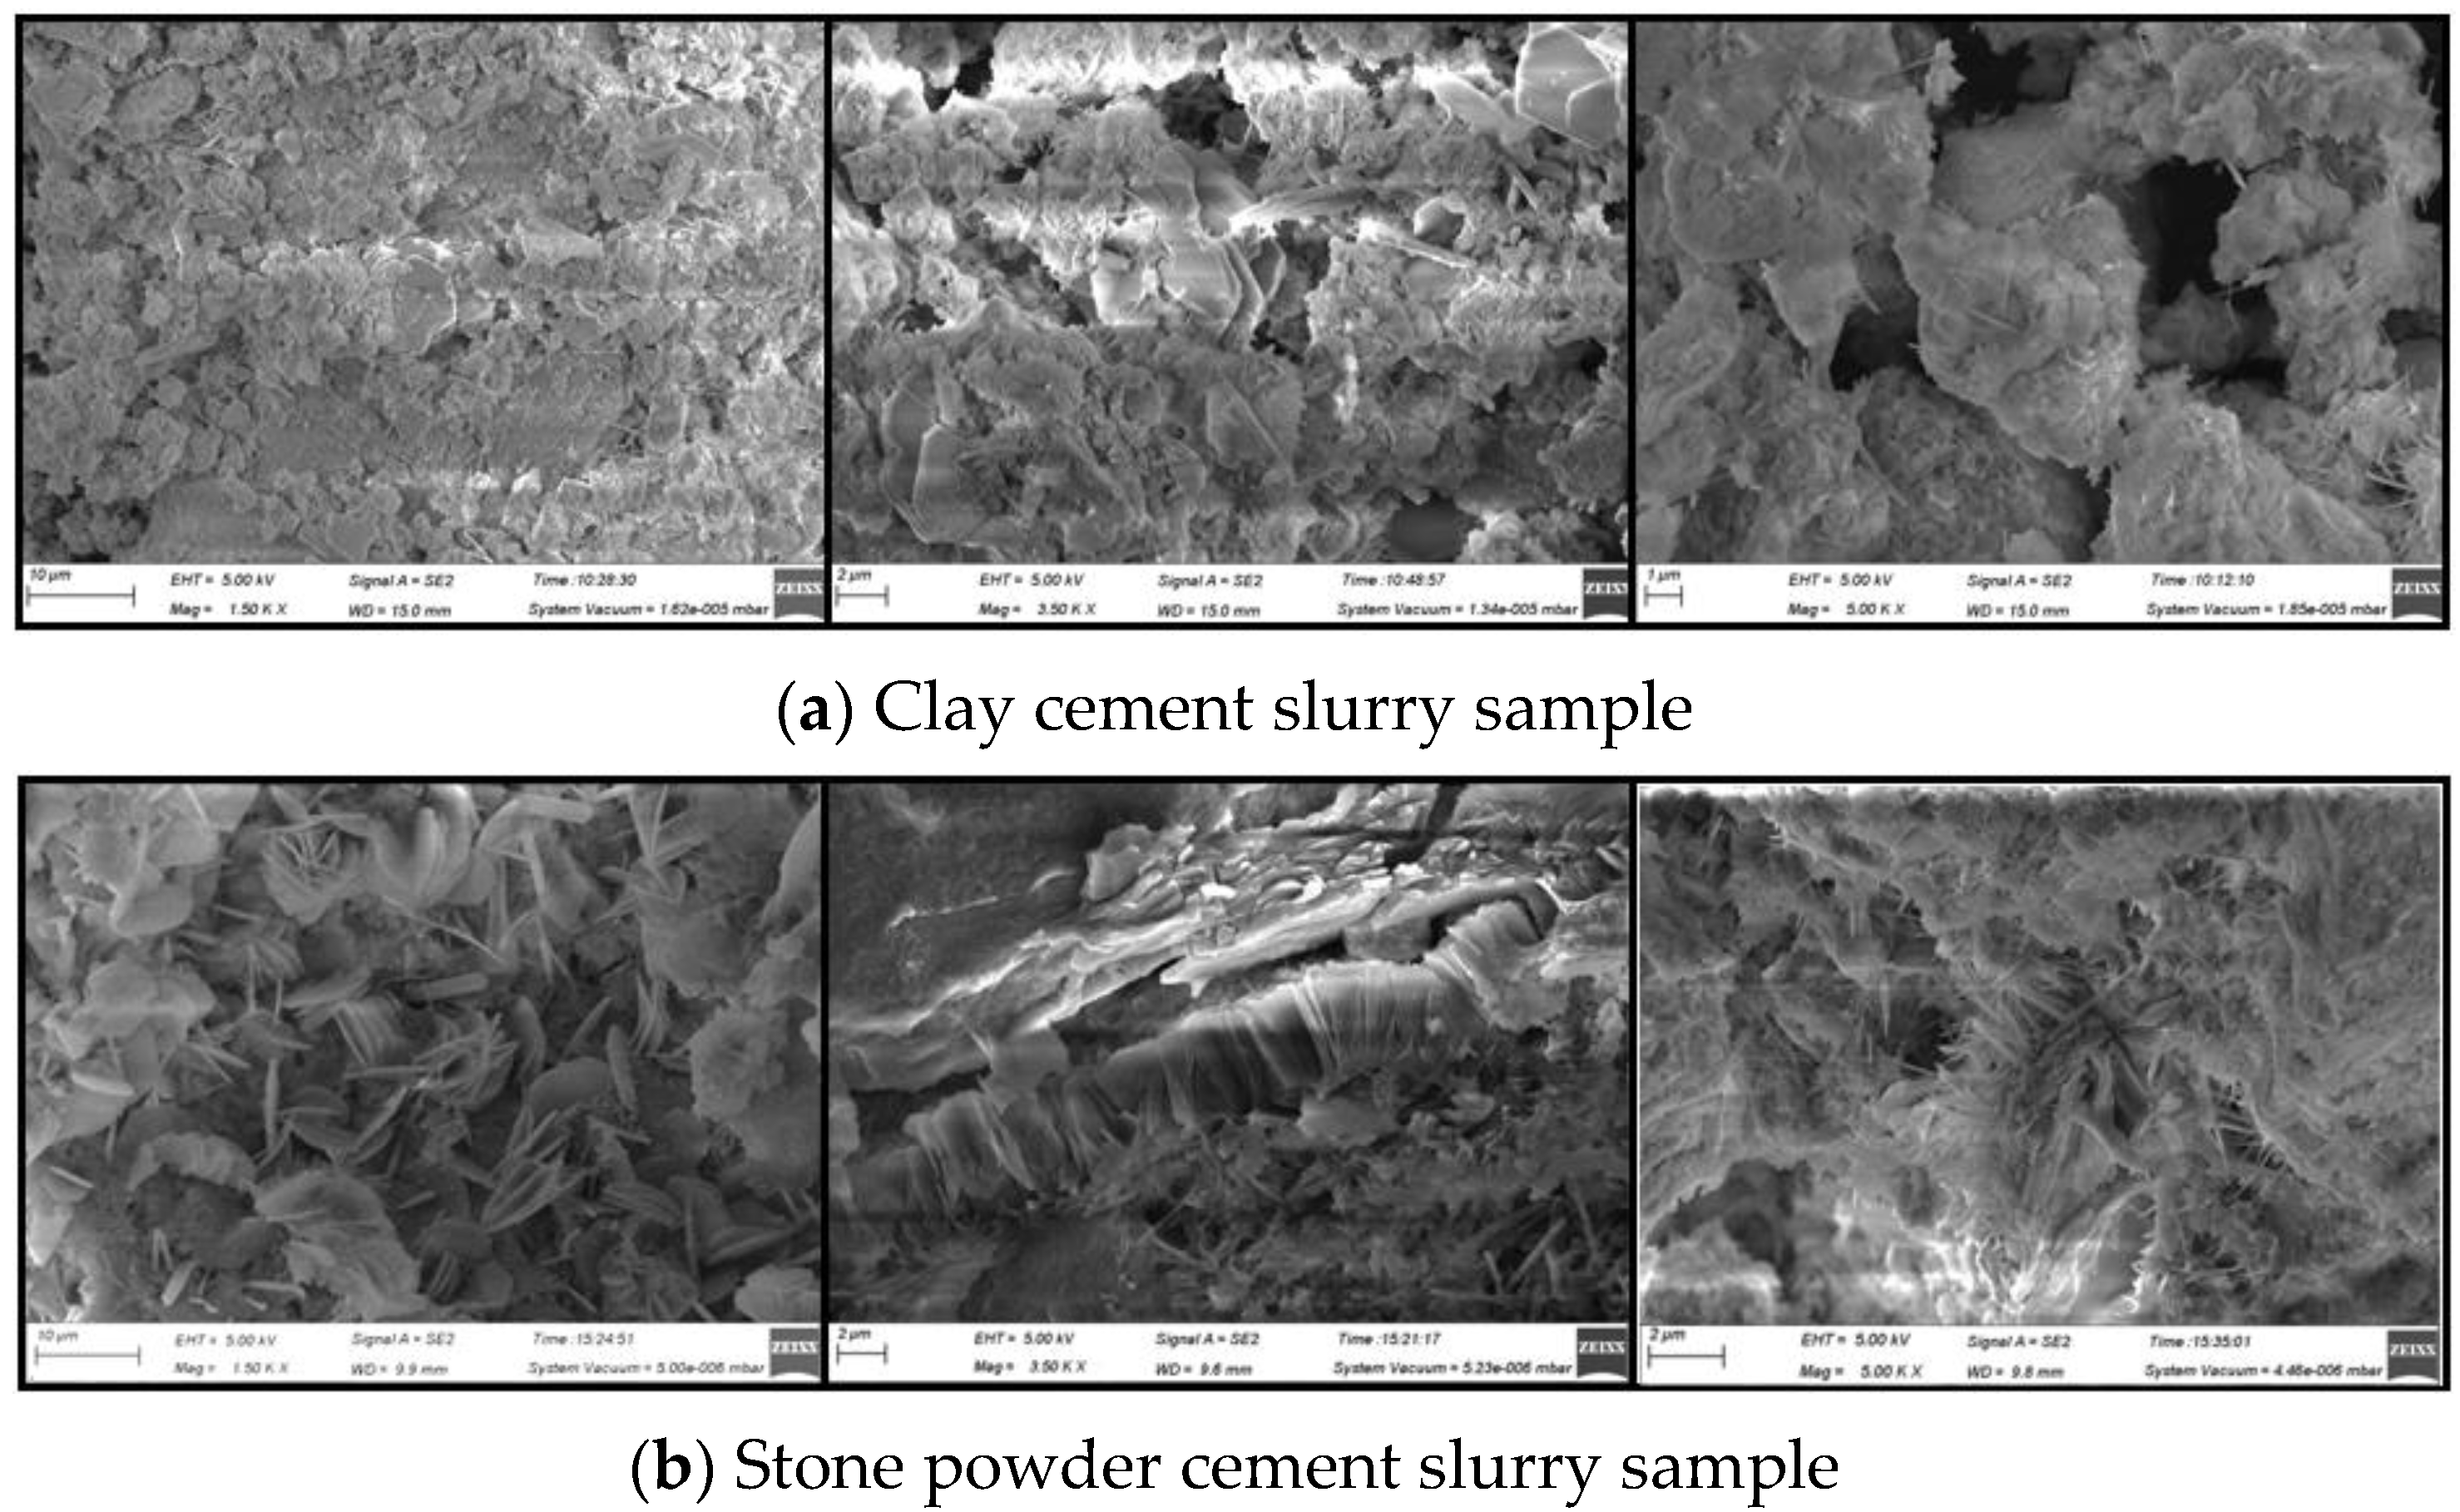
An electron microscope can magnify stone powder cement and clay cement hardened bodied by tens of thousands of times. The smaller the multiple, the larger the range of analysis and statistics and the more blurred the boundary between particles and pores, which affects the statistical error. The larger the multiple, the smaller the area of analysis and statistics, and the obtained data are one-sided and cannot be regarded as representative values. Therefore, it is necessary to select appropriate multiple images to study the porosity of the hardened bodies. Three electron microscopic scanning images of the mucinous hardened bodies with different magnifications (1500, 3500, and 5000) and different regions were selected, as shown in Figure 14. According to calculations, the porosity of the three clay hardened body images was 26.2%, 37.3%, and 36.8%, respectively, with an average value of 33.43%. The porosity of the three images was 16.7%, 17.5%, and 20.3%, respectively, with an average of 18.16%.
Microstructural analysis of the clay cement slurry hardened body and the stone powder cement slurry hardened body revealed many hydration products in the stone powder cement slurry hardened body. The strength of the hardened body was improved as the cement particles encapsulated the stone powder particles to provide an attachment point for the cement reaction, accelerating the cement hydration reaction and producing a large number of hydration products that effectively filled the pores of the hardened body. However, due to the small size of the clay particles, the clay particles wrapped the cement particles and prevented the cement hydration reaction. As a result, the clay cement slurry hardened body had fewer hydration products, a simpler structure, and larger pores. Comprehensive comparative analysis shows that the microstructure of stone powder cement slurry is dense.
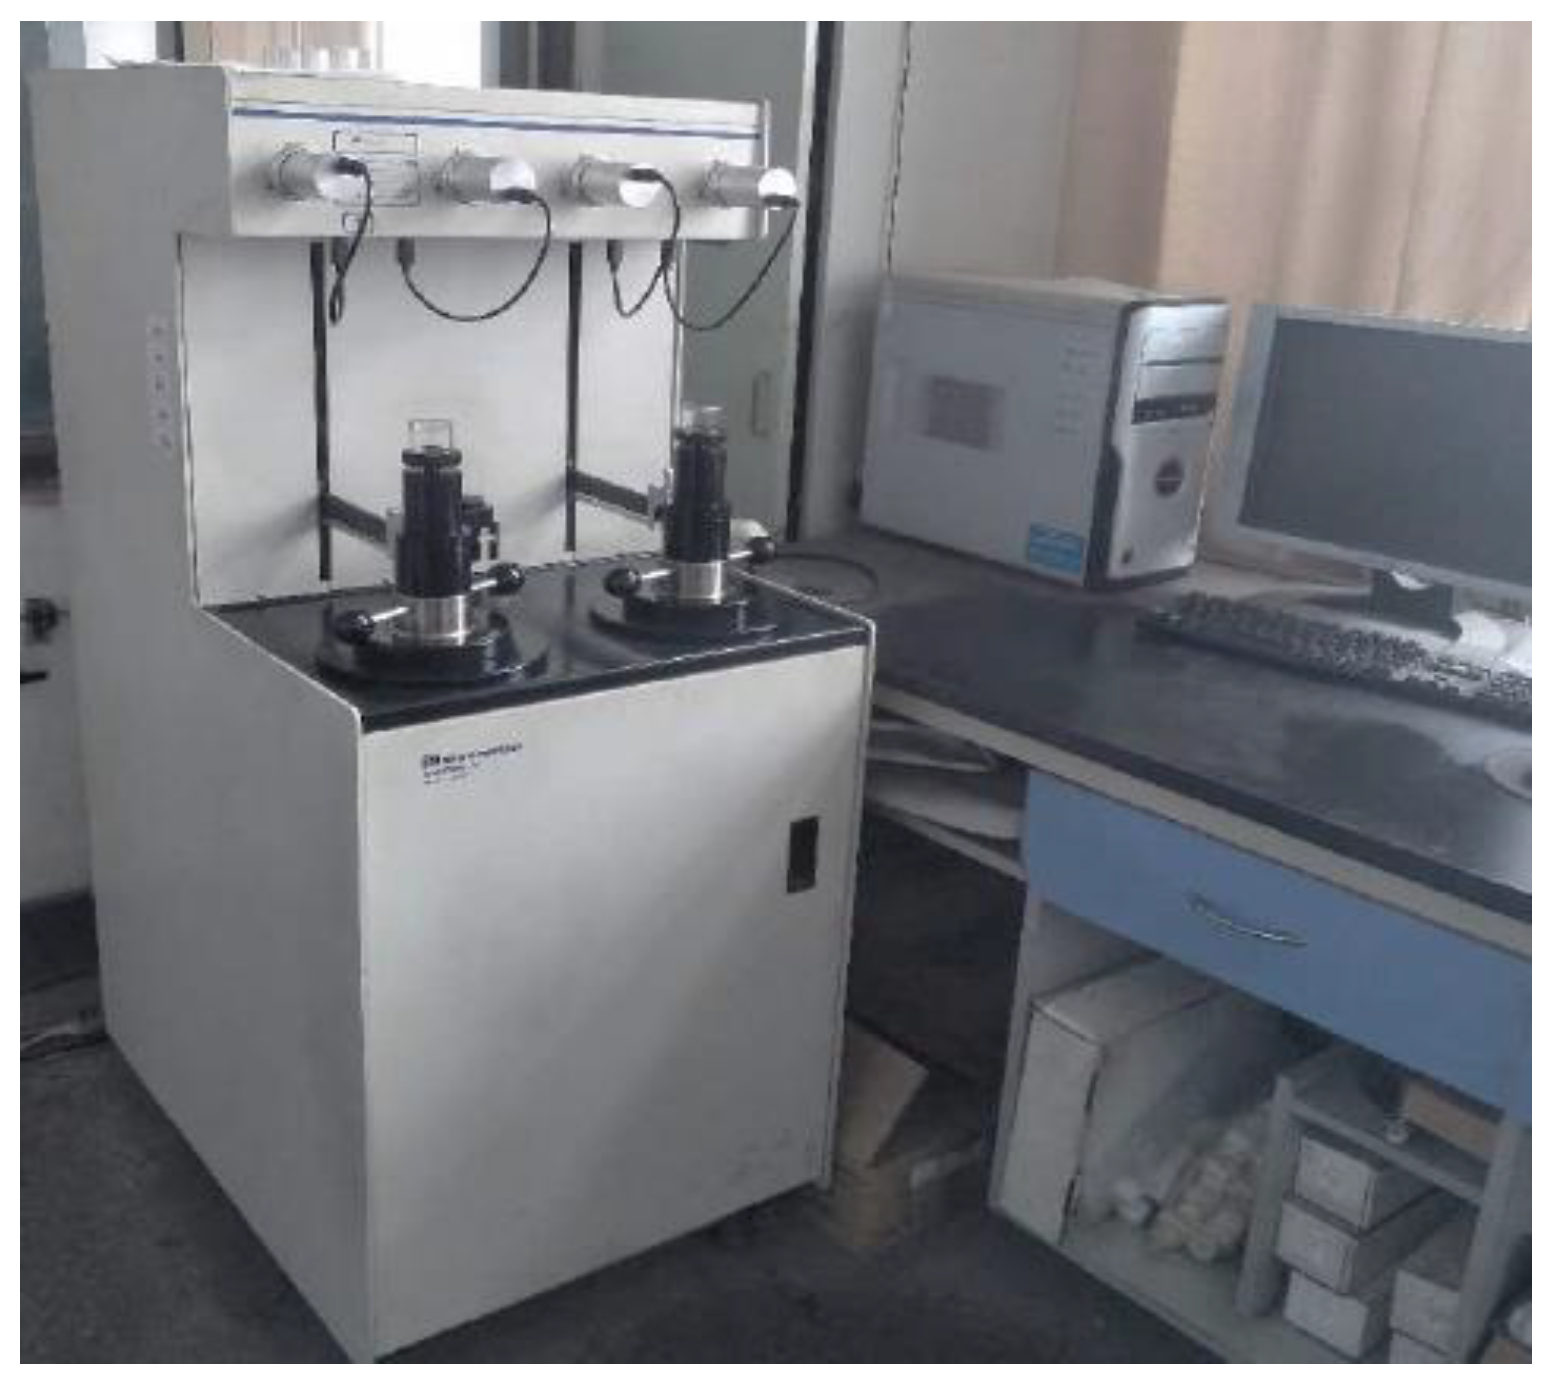
(2) Mercury Intrusion Porosimeter (MIP) porosity calculation method
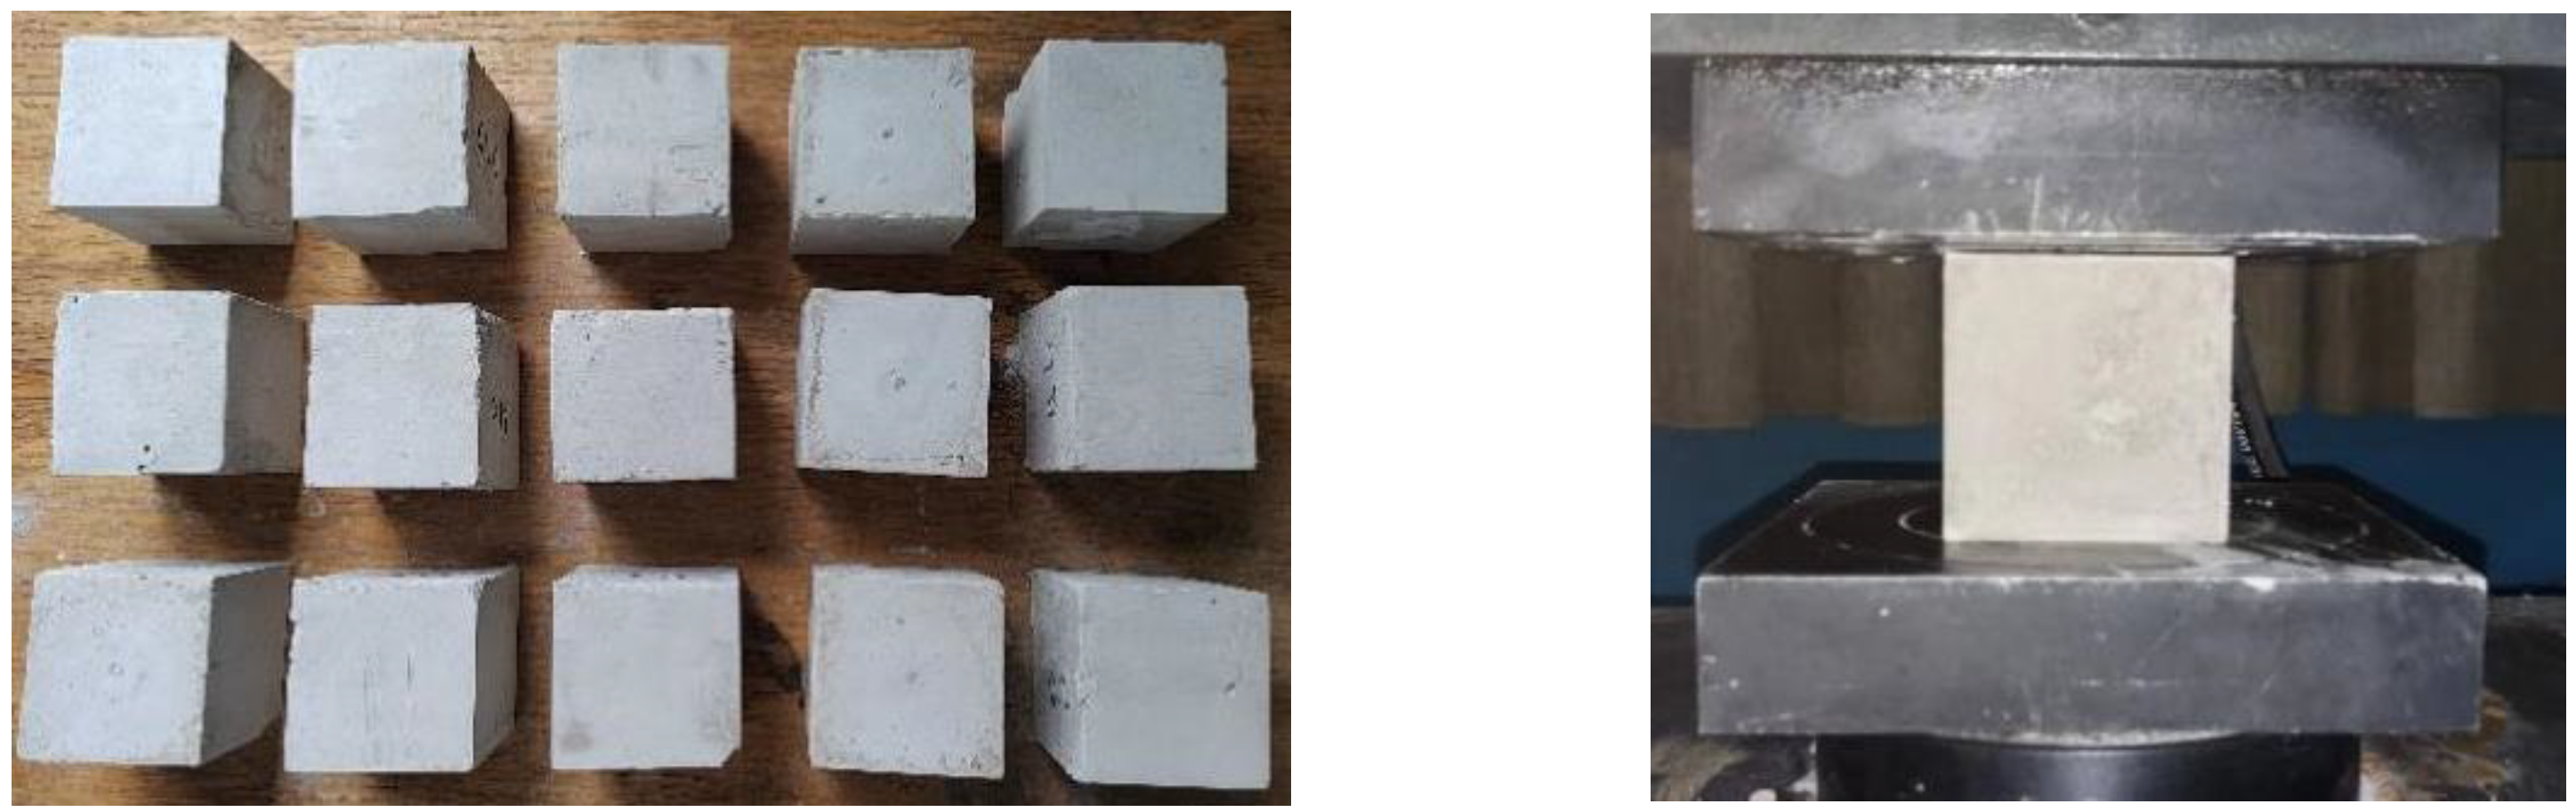
The prepared stone powder cement slurry hardened body and clay cement slurry hardened body samples were dried (three for each group), processed into 10 mm × 10 mm × 10 mm squares with fine steel wire, and placed in a dilatometer under a pump vacuum to ensure that the pore pressure in the samples was close to zero. Then, mercury was injected for mercury injection analysis. The pore parameters of the samples were collected. The MIP test operation is shown in Figure 15.
Analysis of the data obtained from the mercury intrusion test, allowed for calculation of the porosity of the samples, the maximum volume of mercury injection, and other parameters. As shown in Table 9, the mercury inflow volume of stone powder cement slurry hardened body is 0.12–0.18 mL, and that of clay cement slurry hardened body is 0.23–0.31 mL. Other parameters measured in the mercury injection test are listed in Table 9.
After data processing and analysis, the distribution curves of pore diameter and accumulated mercury volume of the samples were obtained according to the accumulated mercury volume and pore diameter data obtained in the mercury intrusion test, as shown in Figure 16. The curve value of sample 2-3 is the highest among all samples, indicating that it has the highest mercury intake and porosity. The curve value of sample 1-1 is the lowest, indicating that it has the lowest mercury intake and porosity. The mercury content of stone powder cement slurry (sample 1) at mutation point 1 increased, indicating that the pore diameter of stone powder cement slurry hardened body is concentrated in the range of 10–50 nm. When the pore diameter is greater than 50 nm, the cumulative mercury content of the pore volume changes minimally, indicating that there are few pores larger than 50 nm in the sample. The mercury content of clay cement slurry (sample 2) at mutation point 2 increased, indicating that the pore diameter of the clay cement slurry hardened body is concentrated in the range of 100–150 nm. When the pore diameter is greater than 150 nm, the cumulative mercury volume change of the pore is minimal, indicating that there are few pores larger than 150 nm in the sample.
Mutation point 1 is on the right side of mutation point 2, indicating that the average pore diameter of the stone powder cement slurry hardened body is smaller than that of the clay cement slurry hardened body, whereas the curve height of sample 1 is lower than that of sample 2, indicating that the porosity of the stone powder cement slurry hardened body is smaller than that of the clay cement slurry hardened body because when the stone powder cement slurry hydration reaction occurs, because the stone powder particle size is larger than the cement particle size, the stone powder particles are surrounded by cement, providing an attachment point for the cement reaction and accelerating the cement hydration reaction, generating a large number of hydration products, effectively filling the voids of the hardened body and resulting in a small pore size in the stone powder cement slurry hardened body. However, when the hydration reaction occurs in the clay cement slurry, owing to the small size of the clay particles, the clay particles surround the cement particles, hindering the hydration reaction of cement and resulting in few hydration products, so the gaps of the hardened body cannot be effectively filled, resulting in high porosity and a large pore diameter of the clay cement slurry hardened body.
The average porosity of stone powder cement slurry produced using the MIP method is 19.53%, and the error of IPP calculation is 7%. The average porosity of the clay cement slurry hardened body is 33.77%, and the error of IPP calculation is 1%. The calculation results are similar between the two methods, indicating that the combination of SEM and IPP is an effective porosity calculation method.
Analysis of the hydration reaction products, hydration mechanism, and pore structure of the slurry hardened body show that the stone powder slurry hardened body has many hydration products, a sufficient hydration reaction, and low porosity. These microstructures are conducive to improving the strength of the stone powder slurry hardened body and strengthening the bearing capacity of the geotechnical reinforcement, indicating that the microstructure of the stone powder cement slurry is superior to that of the clay cement slurry.

4. Discussion

Stone powder is a type of powdery solid waste. The surface of stone powder particles provides an attachment point for cement reactions, which can accelerate the cement hydration reaction, with the potential to replace clay cement slurry. We conduct a bleeding rate test, mechanical property test, and microstructure test for stone powder cement slurry and compare the performance of stone powder cement slurry with that of clay cement slurry.

5. Conclusions

(1) Under the condition of high fluidity (296 mm), stone powder cement grout has a lower bleeding rate than clay cement grout. The high fluidity ensures that the grout can spread more widely and deeper in geotechnical reinforcement grouting and fully fill the bedrock and soil fractures. The low bleeding ensures that the grout will completely fill the pores and fissures of the bedrock soil mass after consolidation, improving the integrity of the geotechnical reinforcement structure.
(2) According to the results of the mechanical test, the strength of stone powder cement grout is higher than that of clay cement grout. After the stone powder cement grout is injected into the geotechnical reinforcement, the rock and soil mass can form an integral structure and improve the bearing capacity of the geotechnical reinforcement.
(3) Analysis of the microstructure of the stone powder cement slurry hardened body shows that the stone powder cement slurry hardened body has many hydration products, a sufficient hydration reaction, and low porosity, which further explains the its superior mechanical properties. Macro- and microanalyses show that the stone powder cement slurry hardened body is highly resistant to external loads, improving the bearing capacity the geotechnical reinforcement effect.
Stone powder cement slurry has a low bleeding rate, high compressive strength, and low porosity, which are conducive to improving geotechnical engineering, with an excellent grouting effect.

Author Contributions

Conceptualization, X.C. (Xinming Chen) and X.L.; methodology, Y.R. and Y.R.; formal analysis, X.C. (Xi Chen) and Y.R.; investigation, Y.R. and X.C. (Xi Chen); writing—original draft preparation, Y.R.; writing—review and editing, X.C. (Xinming Chen) and W.Z. All authors have read and agreed to the published version of the manuscript.

Funding

This research was funded by the National Natural Science Foundation of China (grant number 51834001, 52104129), and the General Funded Project of the China Postdoctoral Science Foundation (grant numbers 2022T150159 and 2020M672226).

Institutional Review Board Statement

Not applicable.

Informed Consent Statement

Not applicable.

Data Availability Statement

Not applicable.

Acknowledgments

Thank you very much for the guidance of the reviewers on my thesis.

Conflicts of Interest

The authors declare no conflict of interest.

References

  1. Du, J.; Liu, J.; Lyu, X.; Zhai, P.; Wang, W. Analytical Solution of the Grouting Reinforcement Response of a Circular Cavern in Deeply Buried Fractured Surrounding Rock under a Nonuniform Stress Field. ACS Omega 2022, 7, 28016–28029. [Google Scholar] [CrossRef] [PubMed]
  2. Zhai, M.; Bai, H.; Wu, L.; Wu, G.; Yan, X.; Ma, D. A reinforcement method of floor grouting in high-water pressure working face of coal mines: A case study in Luxi coal mine, North China. Environ. Earth Sci. 2022, 81, 1–17. [Google Scholar] [CrossRef]
  3. Sun, Y.; Zhang, P.; Yan, W.; Wu, J.; Yan, F. Grouting Material Development and Dynamic Grouting Test of Broken Rock Mass. J. Mater. Civ. Eng. 2022, 34, 04022072. [Google Scholar] [CrossRef]
  4. Jiao, H.Z.; Wu, Y.C.; Wang, H.; Zhang, B.; Liu, J. Micro-scale mechanism of sealed water seepage and thickening from tailings bed in rake shearing thickener. Miner. Eng. 2021, 173, 107043. [Google Scholar] [CrossRef]
  5. Li, G.; Ma, F.S.; Guo, J.; Zhao, H.; Liu, G. Study on deformation failure mechanism and support technology of deep soft rock roadway. Eng. Geol. 2019, 264, 105262. [Google Scholar] [CrossRef]
  6. Chen, F.B.; Xu, B.; Jiao, H.Z.; Chen, X.; Shi, Y.; Wang, J.; Li, Z. Triaxial mechanical properties and microstructure visualization of BFRC. Constr. Build. Mater. 2021, 278, 122275. [Google Scholar] [CrossRef]
  7. Chen, X.M.; Shi, Y.L.; Jiao, H.Z.; Chen, X.; Shi, Y.; Wang, J.; Li, Z. Fiber distribution characteristics based on the search cone algorithm and the enhancement mechanism for BFRC. Mater. J. 2021, 35, 4061–4066. [Google Scholar]
  8. Di, H.; Liu, S.; Han, K.; Luo, S.; Zhang, H.; Wang, Y.; Guan, X. Reinforcement of Broken Coal Rock Using Ultrafine Sulfoaluminate Cement–Based Grouting Materials. J. Mater. Civ. Eng. 2022, 34, 04022082. [Google Scholar] [CrossRef]
  9. Jiao, H.Z.; Chen, W.L.; Wu, A.X. Flocculated unclassified tailings settling efficiency improvement by particle collision optimization in the feedwell. Int. J. Miner. Metall. Mater. 2021. accepted. [Google Scholar]
  10. Pathan, V.G.; Pathan, M.G. Feasibility and need of use of waste marble powder in concrete production. J. Mech. Civ. Eng. 2014, 6, 23–26. [Google Scholar]
  11. Aliabdo, A.A.; Elmoaty, A.; Auda, E.M. Re-use of waste marble dust in the production of cement and concrete. Constr. Build. Mater. 2014, 50, 28–41. [Google Scholar] [CrossRef]
  12. Medina, G.; del Bosque, I.F.S.; Frias, M.; de Rojas, M.S.; Medina, C. Durability of new recycled granite quarry dust-bearing cements. Constr. Build. Mater. 2018, 187, 414–425. [Google Scholar] [CrossRef]
  13. Lemaire, K.; Deneele, D.; Bonne, S.; Legret, M. Effects of lime and cement treatment on the physicochemical, microstructural and mechanical characteristics of a plastic silt. Eng. Geol. 2013, 166, 255–261. [Google Scholar] [CrossRef]
  14. Chen, X.; Chen, H.; Chen, Q.; Lawi, A.; Chen, J. Effect of partial substitution of cement with Dolomite powder on Glass-Fiber-Reinforced mortar. Constr. Build. Mater. 2022, 344, 128201. [Google Scholar] [CrossRef]
  15. Erguen, A. Effects of the usage of diatomite and waste marble powder as partial replacement of cement on the mechanical properties of concrete. Constr. Build. Mater. 2011, 25, 806–812. [Google Scholar] [CrossRef]
  16. Bayesteh, H.; Sharifi, M. Effect of stone powder on the rheological and mechanical performance of cement-stabilized marine clay/sand. Constr. Build. Mater. 2020, 262, 120792. [Google Scholar] [CrossRef]
  17. Gunjal, S.M.; Kondraivendhan, B. Usage of Waste Marble Powder for the Manufacture of Limestone Calcinated Clay Cement (LCCC). In Sustainable Building Materials and Construction; Springer: Singapore, 2022; pp. 357–363. [Google Scholar]
  18. Svermova, L.; Sonebi, M.; Bartos, P. Influence of mix proportions on rheology of cement slurrys containing limestone powder. Cem. Concr. Compos. 2003, 25, 737–749. [Google Scholar] [CrossRef]
  19. Zajac, M.; Rossberg, A.; Le Saout, G.; Lothenbach, B. Influence of limestone and anhydrite on the hydration of Portland cements. Cem. Concr. Compos. 2014, 46, 99–108. [Google Scholar] [CrossRef]
  20. Liu, Y.; Hao, W.; He, W.; Meng, X.; Shen, Y.; Du, T.; Wang, H. Influence of Dolomite Rock Powder and Iron Tailings Powder on the Electrical Resistivity, Strength and Microstructure of Cement Pastes and Concrete. Coatings 2022, 12, 95. [Google Scholar] [CrossRef]
  21. Xiao, J.; Gou, C.F.; Jin, Y.G.; Wang, Y.-H. Effect of CaCO3 on hydration characteristics of C3A. J. Cent. South Univ. 2010, 17, 918–923. [Google Scholar] [CrossRef]
  22. Liu, D.; Zhang, W.; Tang, Y.; Jian, Y.; Lai, Y. Orthogonal Experimental Study on Concrete Properties of Machine-Made Tuff Sand. Materials 2022, 15, 3516. [Google Scholar] [CrossRef] [PubMed]
  23. Yang, H.F.; Liang, D.Y.; Deng, Z.H.; Qin, Y. Effect of limestone powder in manufactured sand on the hydration products and microstructure of recycled aggregate concrete. Constr. Build. Mater. 2018, 188, 1045–1049. [Google Scholar] [CrossRef]
  24. Thong, J.; Lee, K.W.; Wong, W.K. Reduction of charging effects using vector scanning in the scanning electron microscope. Scanning 2010, 23, 395–402. [Google Scholar] [CrossRef] [PubMed] [Green Version]
  25. Huang, T.; Huang, F.; Zhou, H. Experimental Study on Fluid Properties of Cement-Fly Ash Slurry Subjected to Multifactors. Geofluids 2021, 2021, 9924895. [Google Scholar] [CrossRef]
  26. Qiu, H.; Zhang, F.; Sun, W.; Liu, L.; Zhao, Y.; Huan, C. Experimental Study on Strength and Permeability Characteristics of Cemented Rock-Tailings Backfill. Front. Earth Sci. 2022, 10, 49. [Google Scholar] [CrossRef]
  27. Rao, S.M.; Revanasiddappa, K. Role of microfabric in matrix suction of residual soils. Eng. Geol. 2005, 80, 60–70. [Google Scholar] [CrossRef]
  28. Zhao, D.D.; Khoshnazar, R. Hydration and microstructural development of calcined clay cement paste in the presence of calcium-silicate-hydrate (C–S–H) seed. Cem. Concr. Compos. 2021, 122, 104162. [Google Scholar] [CrossRef]
  29. Zhao, D.D.; Khoshnazar, R. Microstructure of cement paste incorporating high volume of low-grade metakaolin. Cem. Concr. Compos. 2020, 106, 103453. [Google Scholar] [CrossRef]
  30. Love, C.A.; Richardson, I.G.; Brough, A.R. Composition and structure of C–S–H in white Portland cement–20% metakaolin pastes hydrated at 25 °C. Cem. Concr. Res. 2007, 37, 109–117. [Google Scholar] [CrossRef]
  31. Kanchanason, V.; Plank, J. Effect of calcium silicate hydrate-polycarboxylate ether (C-S-H–PCE) nanocomposite as accelerating admixture on early strength enhancement of slag and calcined clay blended cements. Cem. Concr. Res. 2019, 119, 44–50. [Google Scholar] [CrossRef]
Figure 1. Distribution curves of stone powder, cement, and clay particles.
Buildings 12 01887 g001
Figure 2. Standard stone powder hardened body specimens and compressive strength test.
Buildings 12 01887 g002
Figure 3. SEM device.
Buildings 12 01887 g003
Figure 4. Clay cement slurry does not solidify after standing for half a year.
Buildings 12 01887 g004
Figure 5. Clay cement slurry consolidation process.
Buildings 12 01887 g005
Figure 6. Mechanism of fracture formation during clay slurry drying.
Buildings 12 01887 g006
Figure 7. Slurry fluidity test.
Buildings 12 01887 g007
Figure 8. Bleeding rate test of clay cement and stone powder cement slurry.
Buildings 12 01887 g008
Figure 9. The slurry hardened body is damaged under pressure.
Buildings 12 01887 g009
Figure 10. Comparison of slurry strength between stone powder cement and clay cement.
Buildings 12 01887 g010
Figure 11. Destruction images of hardened bodies in natural state.
Buildings 12 01887 g011
Figure 12. SEM images of hardened bodies.
Buildings 12 01887 g012
Figure 13. Process of porosity calculation.
Buildings 12 01887 g013
Figure 14. Sample diagram for porosity calculation.
Buildings 12 01887 g014
Figure 15. MIP test operation.
Buildings 12 01887 g015
Figure 16. Volume distribution of different sample pore diameters and cumulative mercury intake.
Buildings 12 01887 g016
Table 1. Main chemical components of cement (%).
ComponentSiO2Al2O3CaOFe2O3MgOOther
Percentage (%)20.613.9865.702.621.565.53
Table 2. Main components of cement clinker (%).
ComponentC3SC2SC3AC4AF
Percentage (%)54.620.57.817.1
Table 3. Main chemical components of stone powder (%).
ComponentCaOSiO2Al2O3MgOOther
Percentage (%)43.0015.723.141.1836.96
Table 4. Physical parameters of stone powder.
Physical ParameterWater Content/%MB ValueApparent Density/kg·m−3Loose Bulk Density/kg·m−3Compacted Bulk Density/kg·m−3Water Demand Ratio/%
Numerical value0.240.52623924.31280.694.64
Table 5. Chemical composition of clay (%).
ComponentSiO2Al2O3MgOCaOOther
Percentage (%)72.7515.260.980.3510.31
Table 6. Physical parameters of stone powder.
Physical ParameterWater Content/%Natural Density/g·cm−3Relative Density of Particle/g·cm−3Plastic Limit/%Liquid Limit/%Force of Cohesion/kPa
Numerical value18.31.642.3464.821.4127
Table 7. Slurry material mix ratio.
Slurry MaterialStone Powder/gClay/gCement/gWater/gBulk Density/g·cm−3
Clay cement slurry7202407361.275
Stone powder cement slurry7202408421.468
Table 8. Strength values and strength ratios of stone powder cement and clay cement hardened bodies.
StrengthAge
7/d14/d28/d56/d112/d
Strength of stone powder cement
/kPa
357845135214231458
Strength of clay cement/kPa12438543627346
Strength of stone powder/Clay 2.82.13.15.231.6
Table 9. Mercury intrusion test parameters.
MaterialNumberSample Quality/gMaximum Volume of Mercury Inlet/mLPorosity/%
Stone powder cement slurrySample 1-13.40.1416.4
Sample 1-23.40.1218.7
Sample 1-33.40.1823.5
Clay cement slurrySample 2-12.70.2331.8
Sample 2-22.70.2833.4
Sample 2-32.70.3136.1
Publisher’s Note: MDPI stays neutral with regard to jurisdictional claims in published maps and institutional affiliations.

