
Effect of Spacing and Slenderness Ratio of Piles on the Seismic Behavior of Building Frames


Abstract
:1. Introduction
2. Description of Prototype Structural Models
2.1. Superstructure
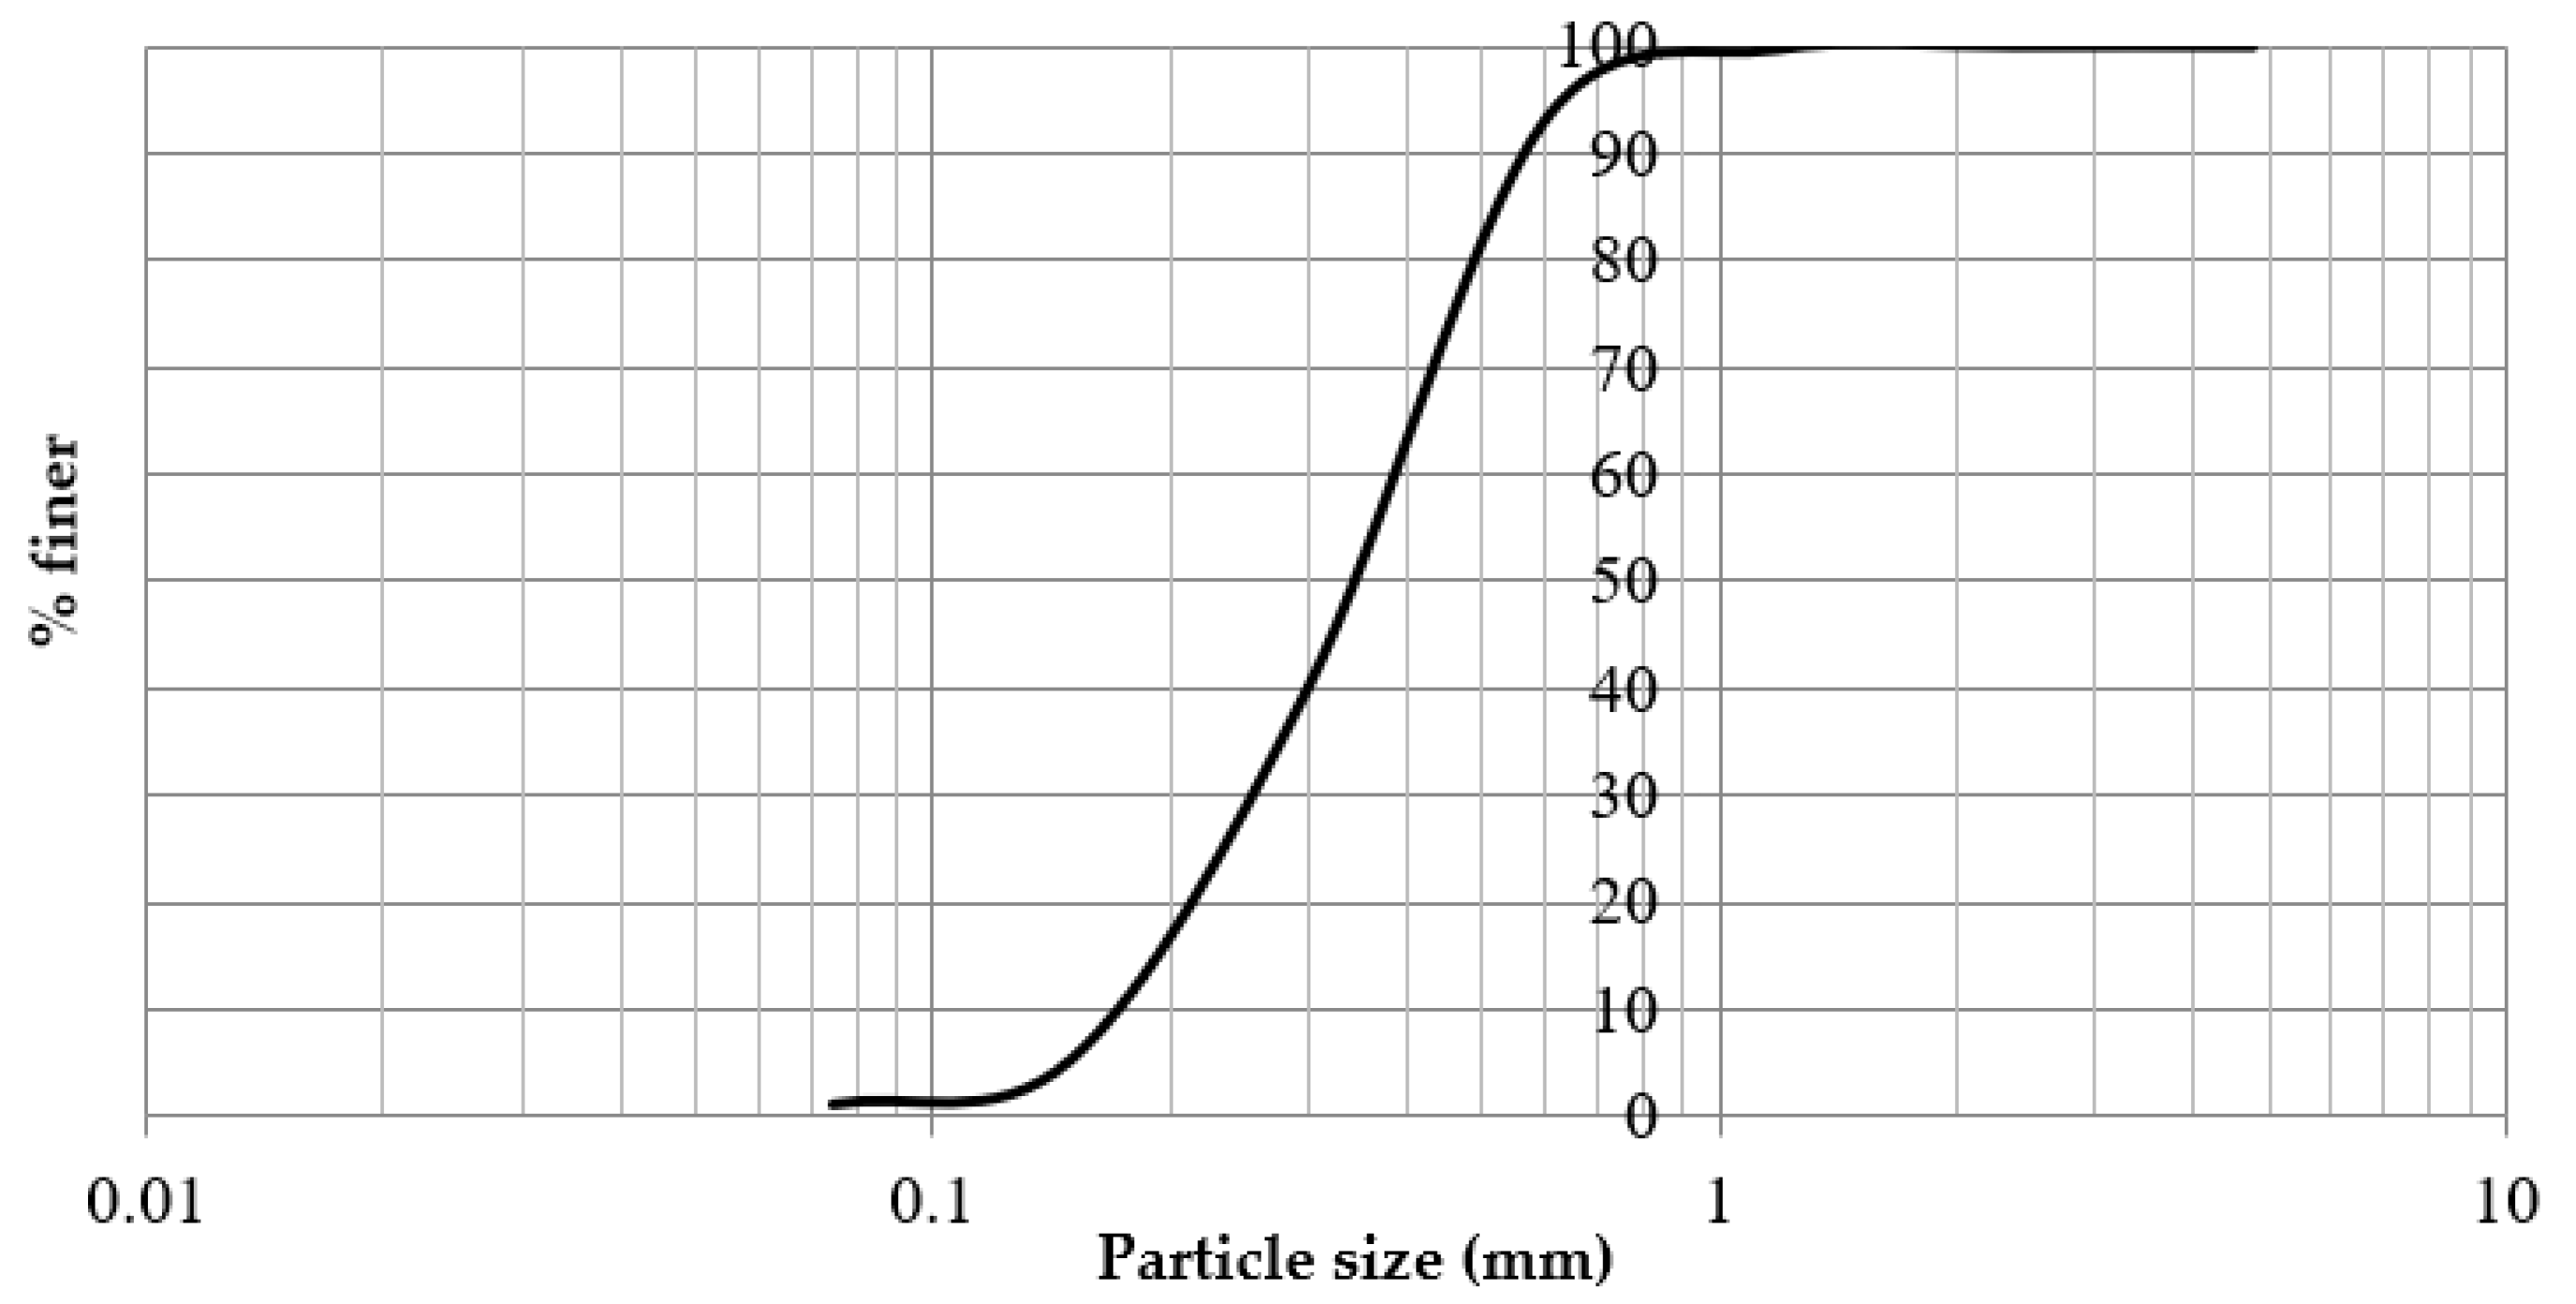
2.2. Soil
3. Testing Facilities Used
3.1. Shake Table
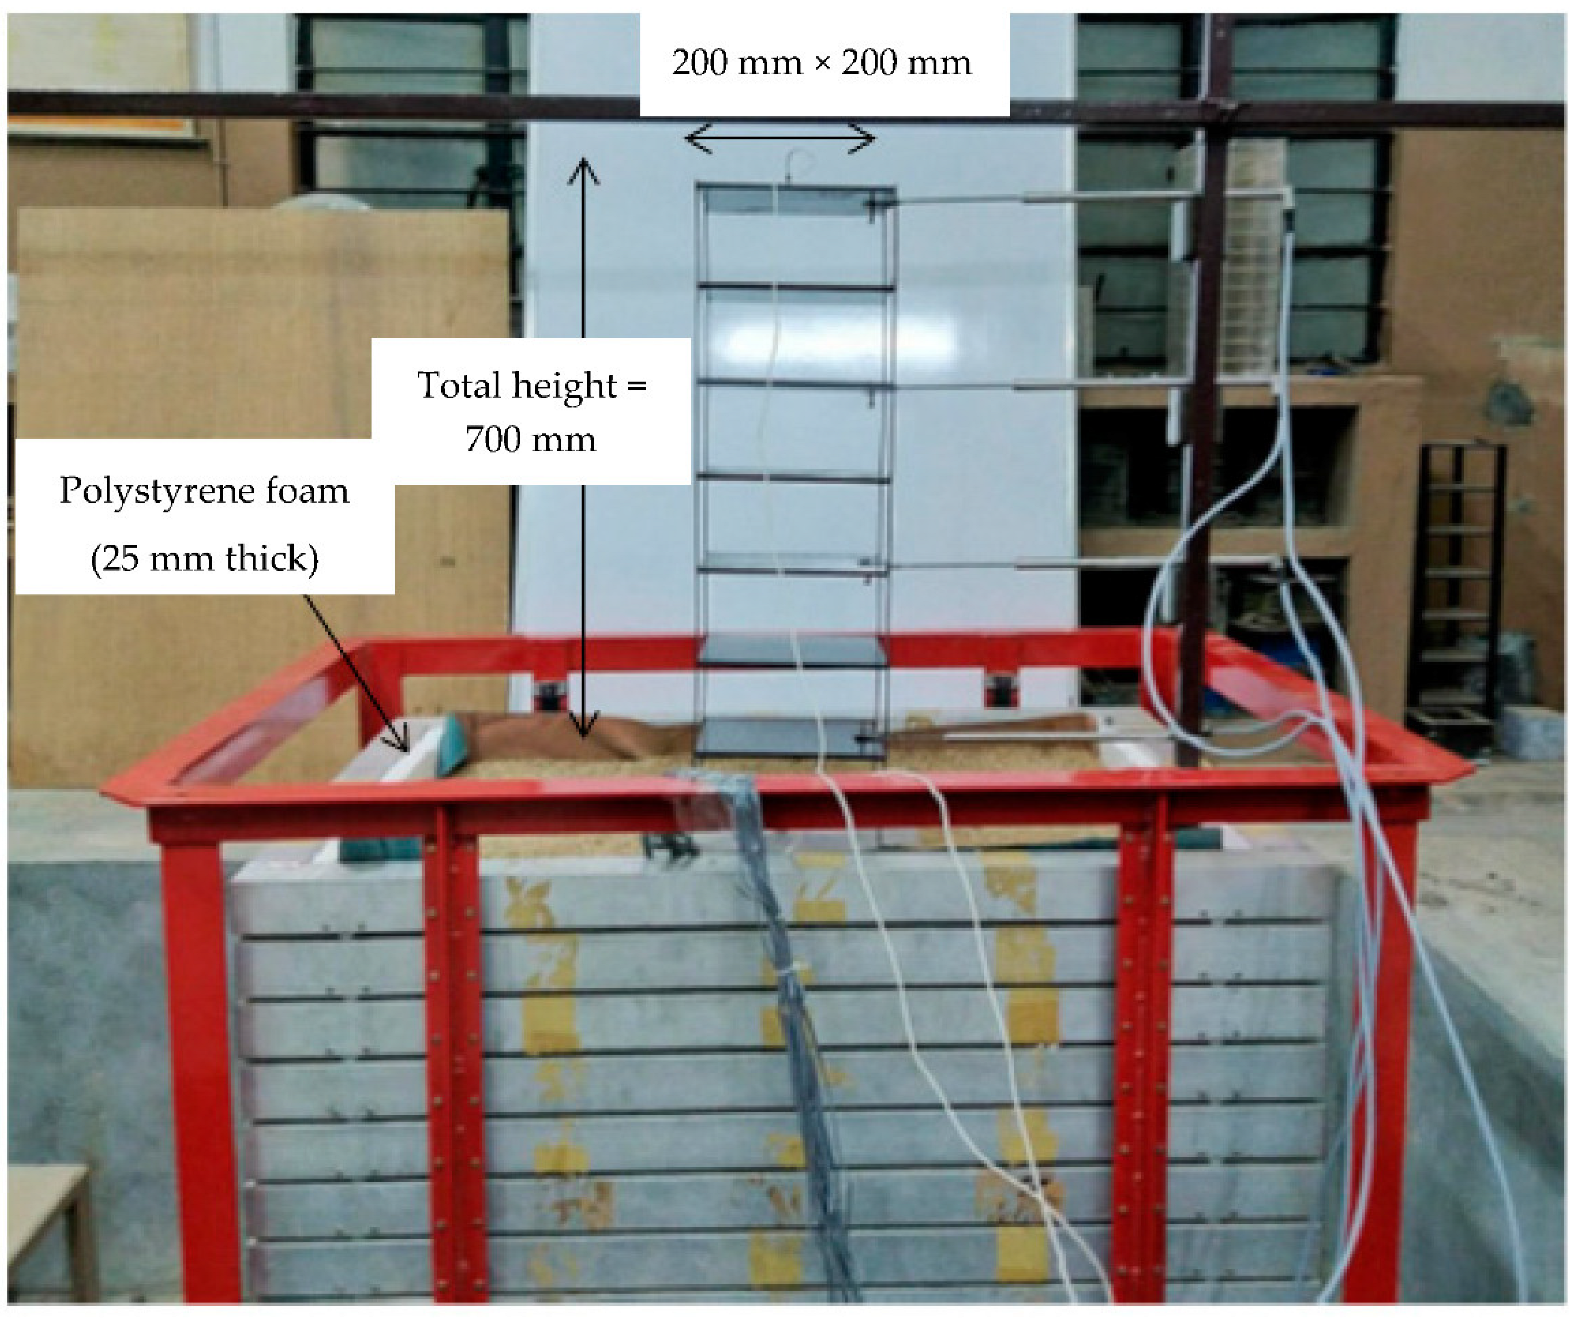
3.2. Laminar Shear Box Container
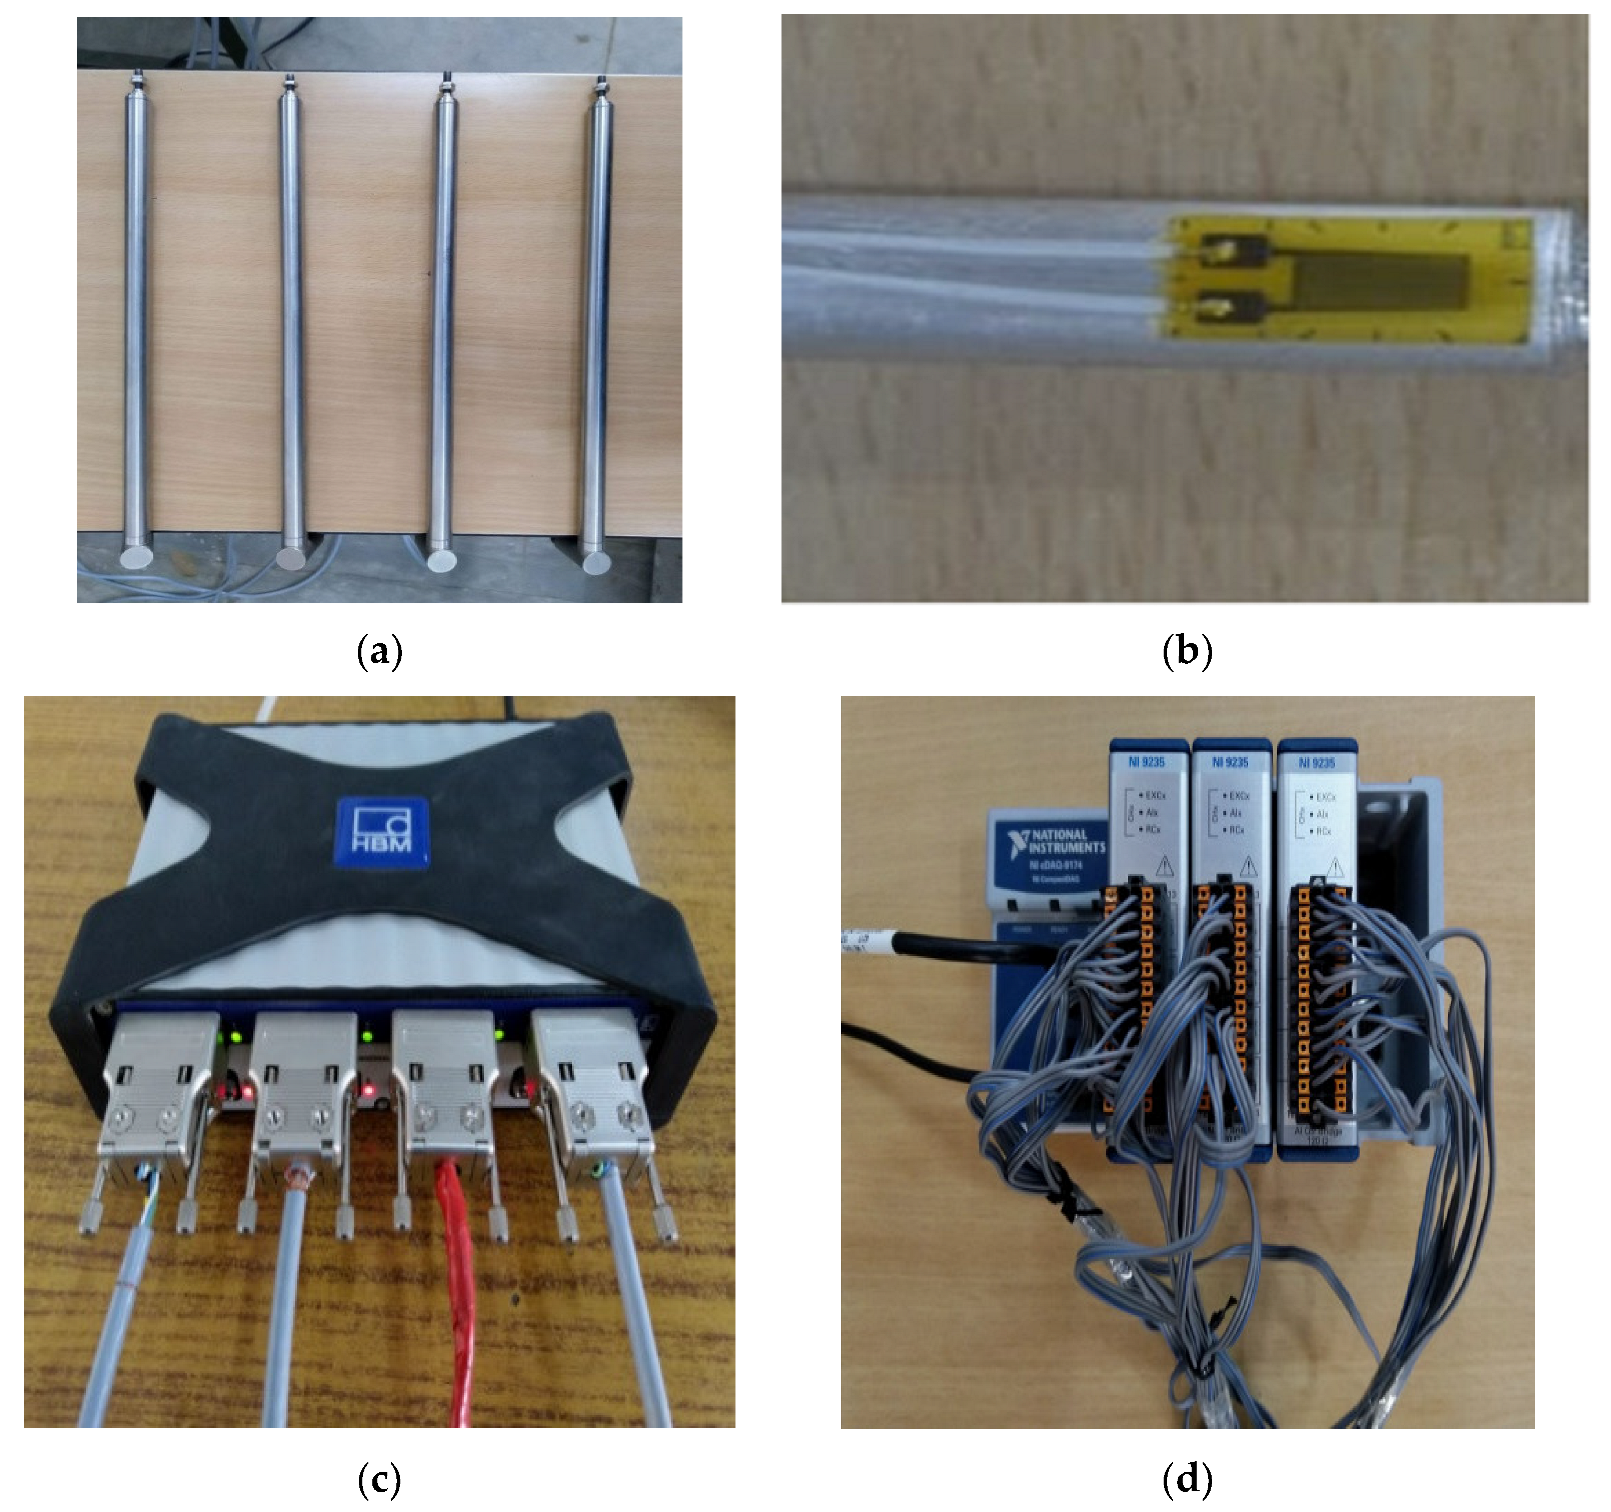
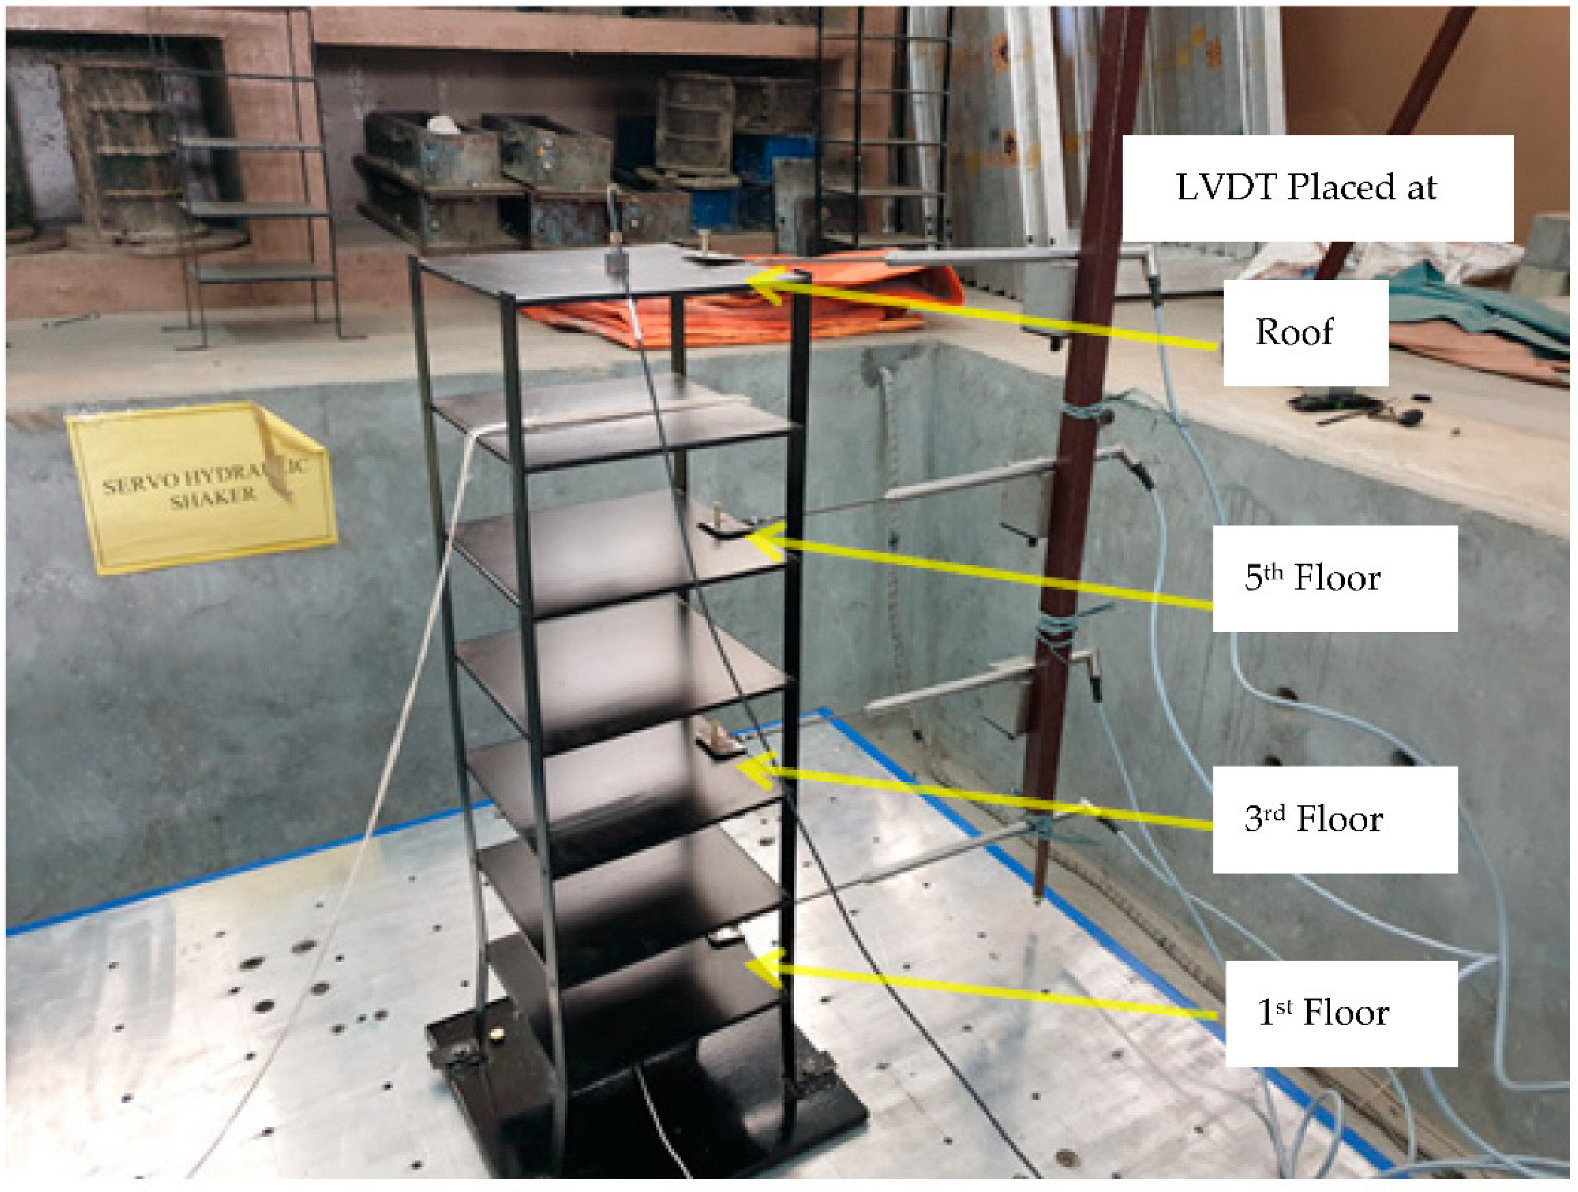
3.3. Instrumentation and Data Acquisition System
4. Description of Scaled Models
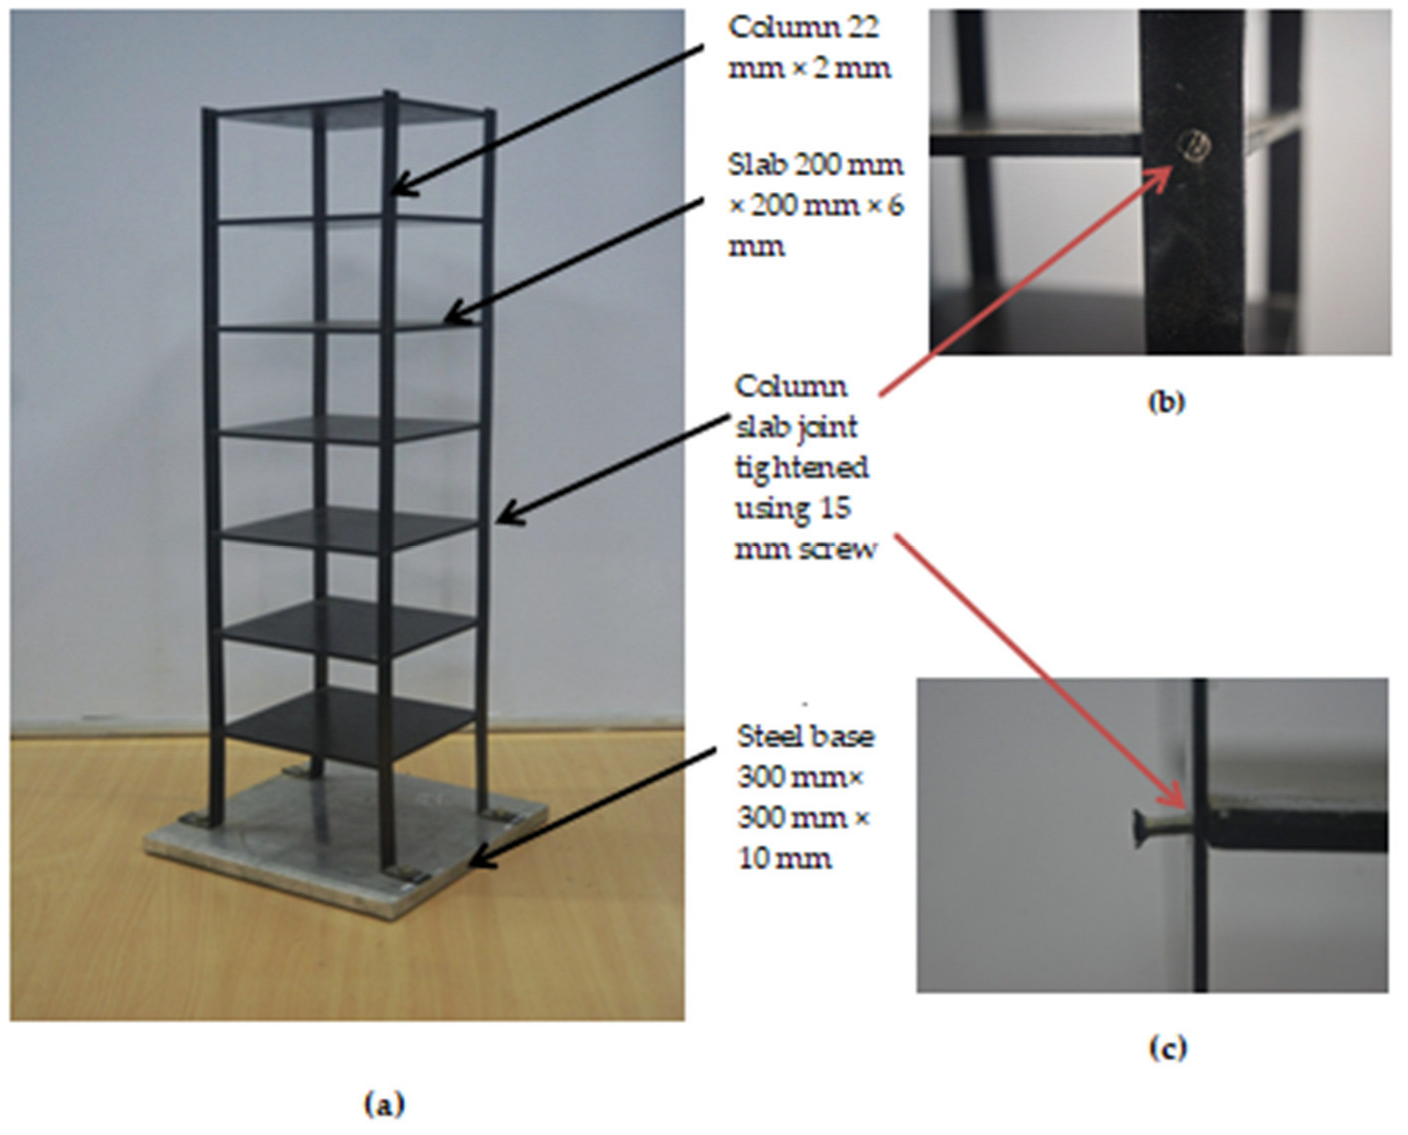
4.1. Building Model
4.2. Soil
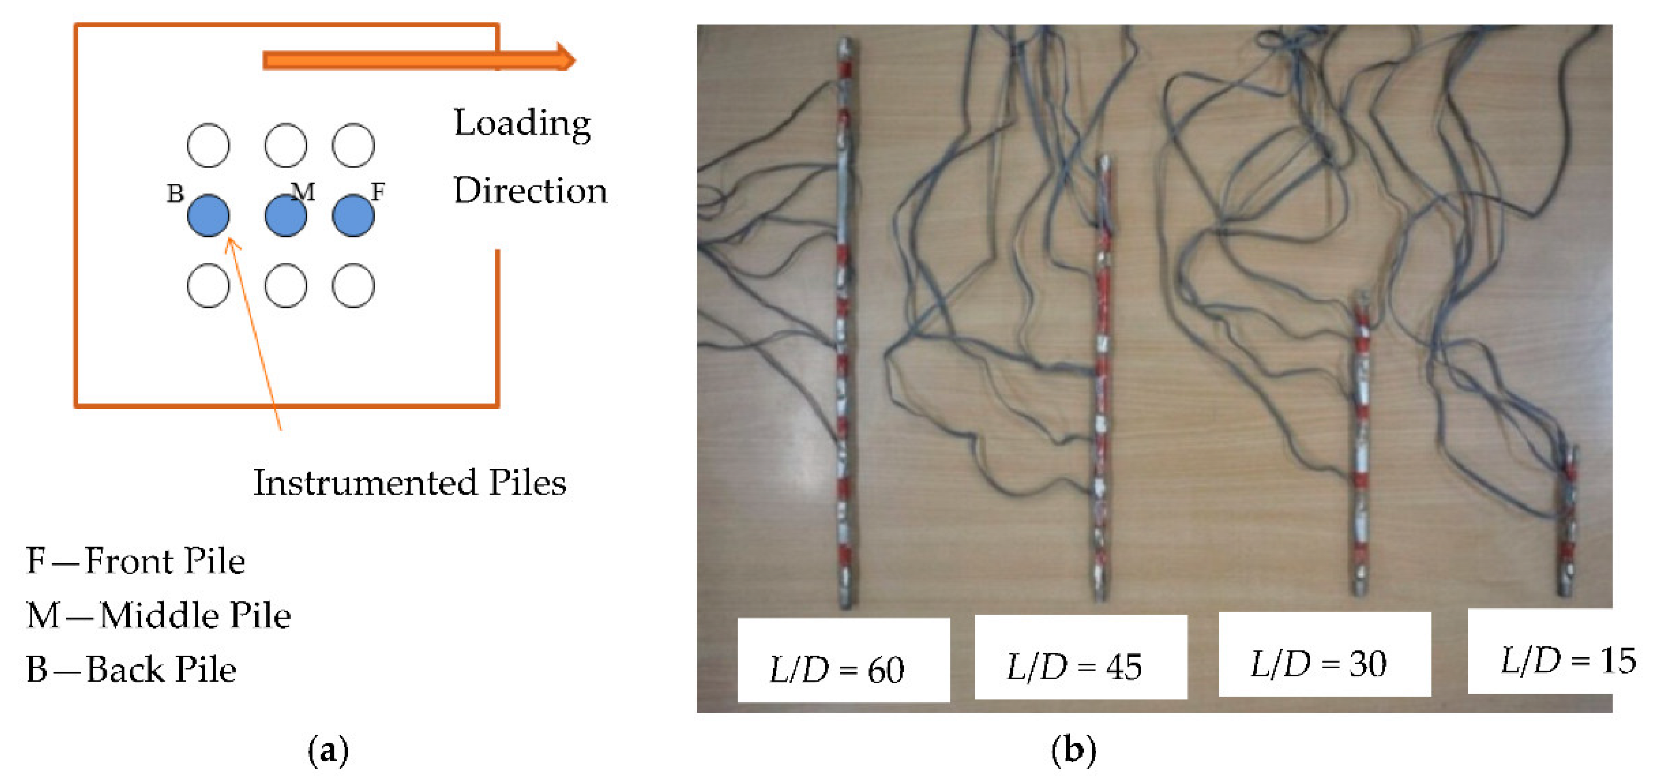
4.3. Model Foundations
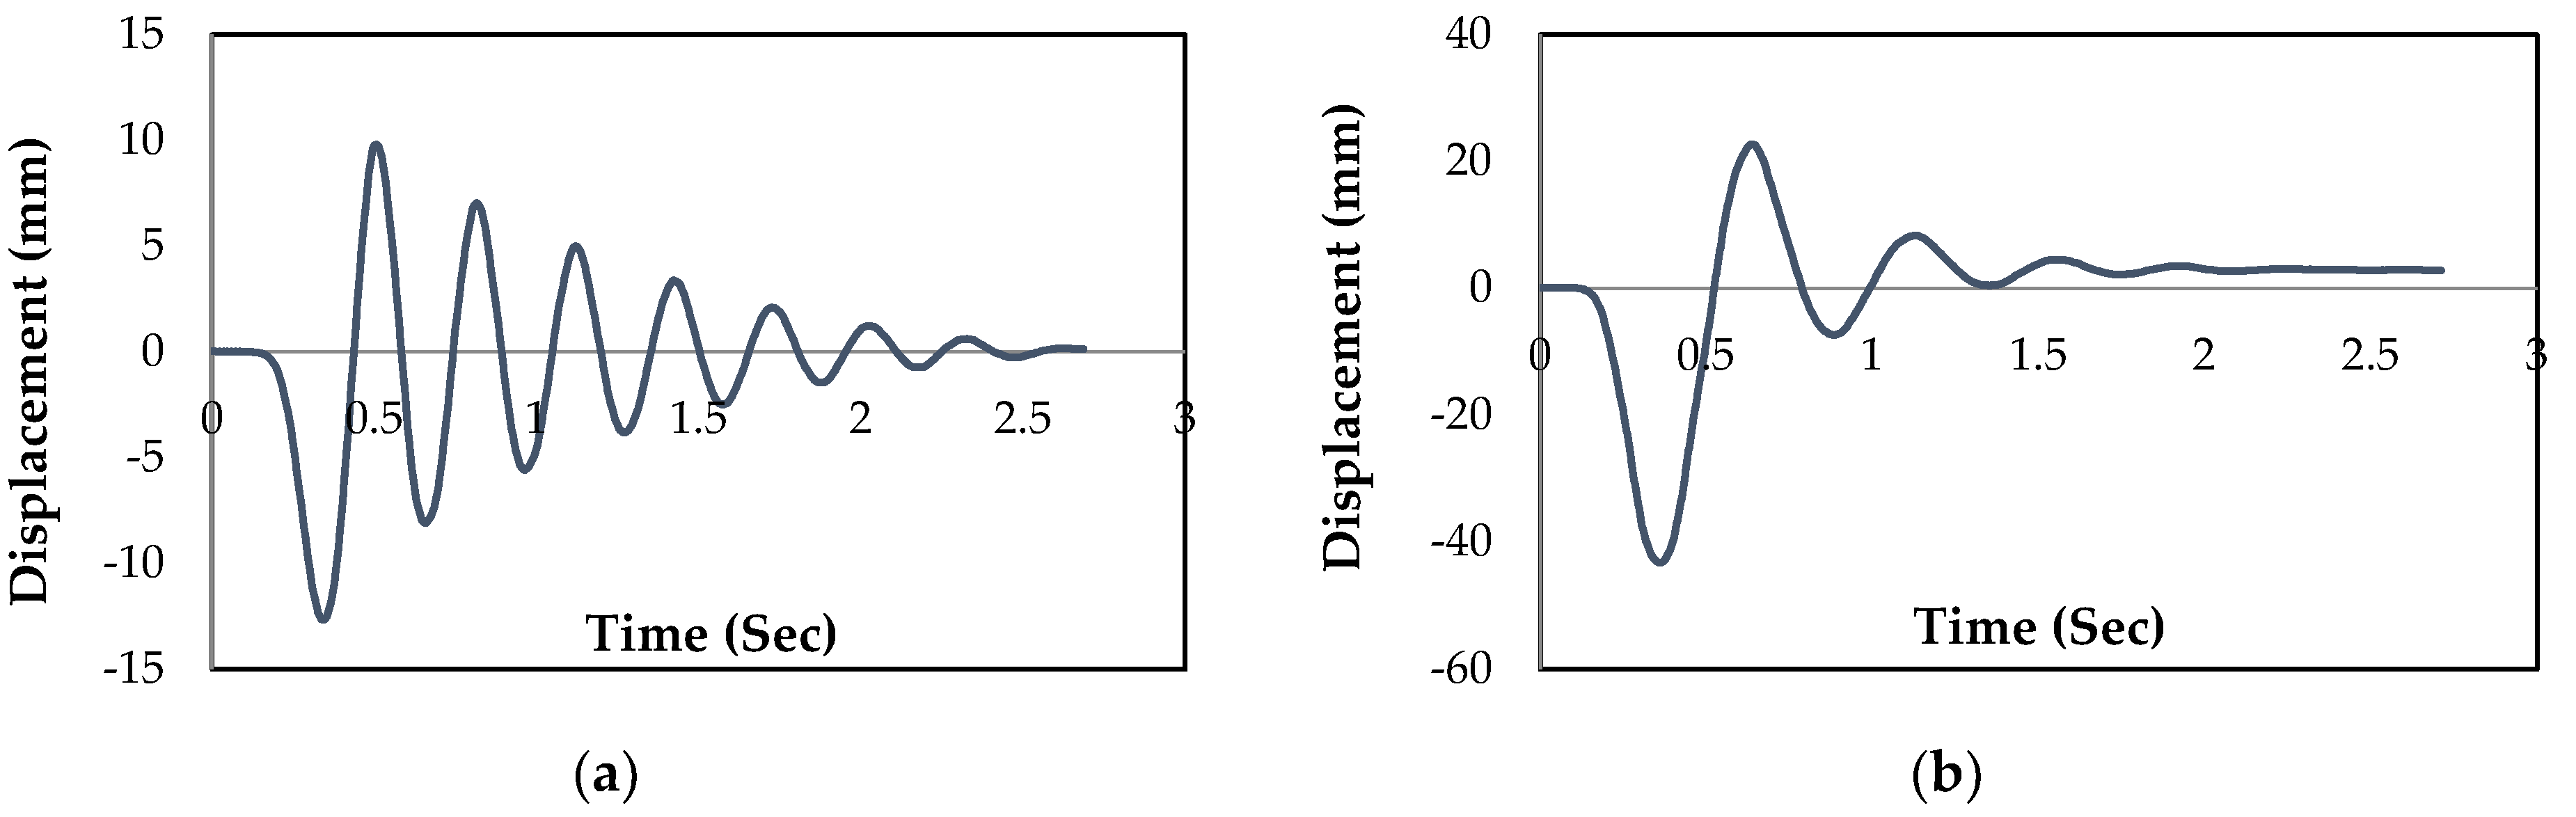
5. Free Vibration Analyses of the Structures
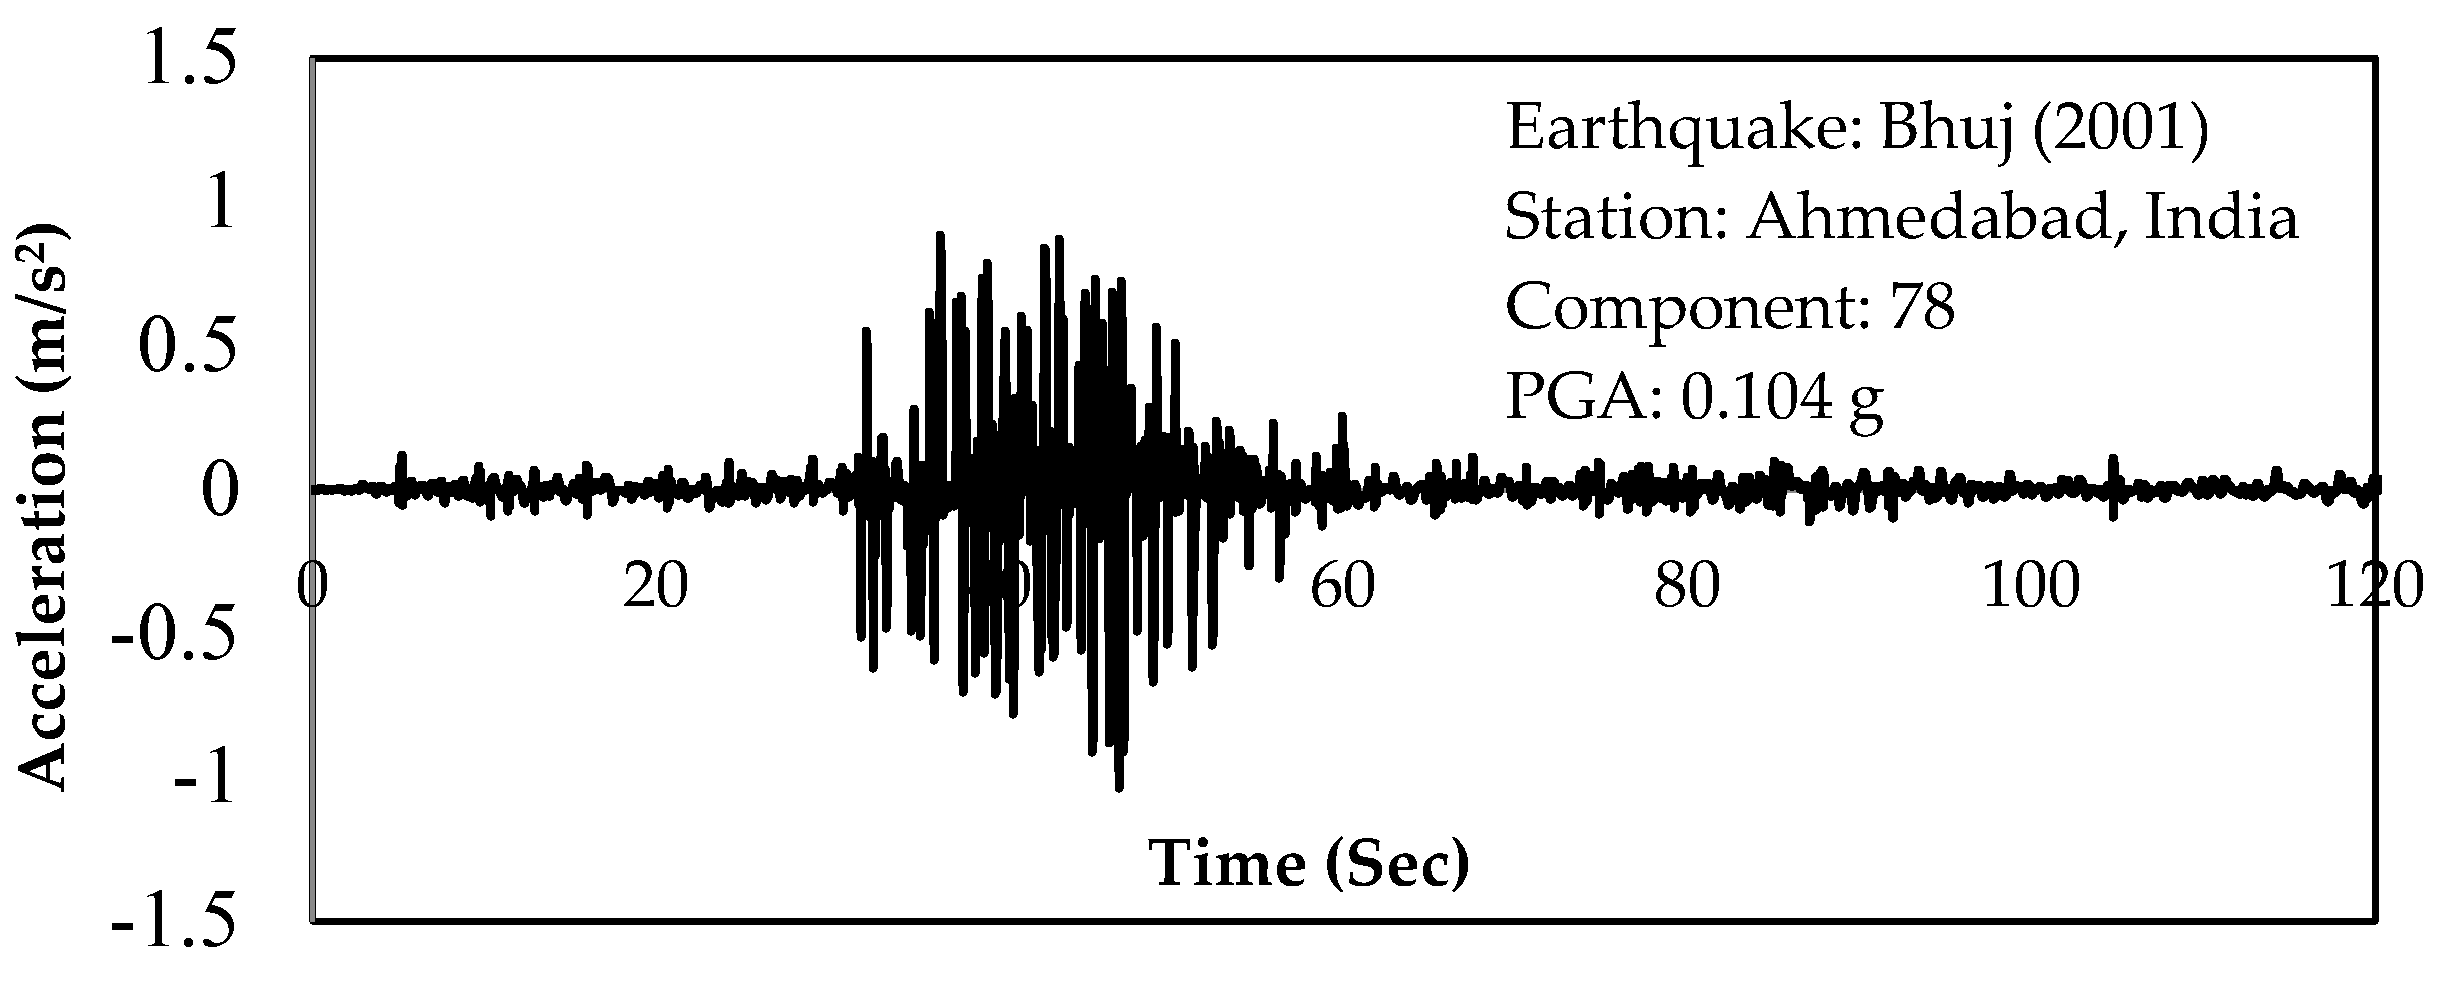
6. Forced Vibration of Structures
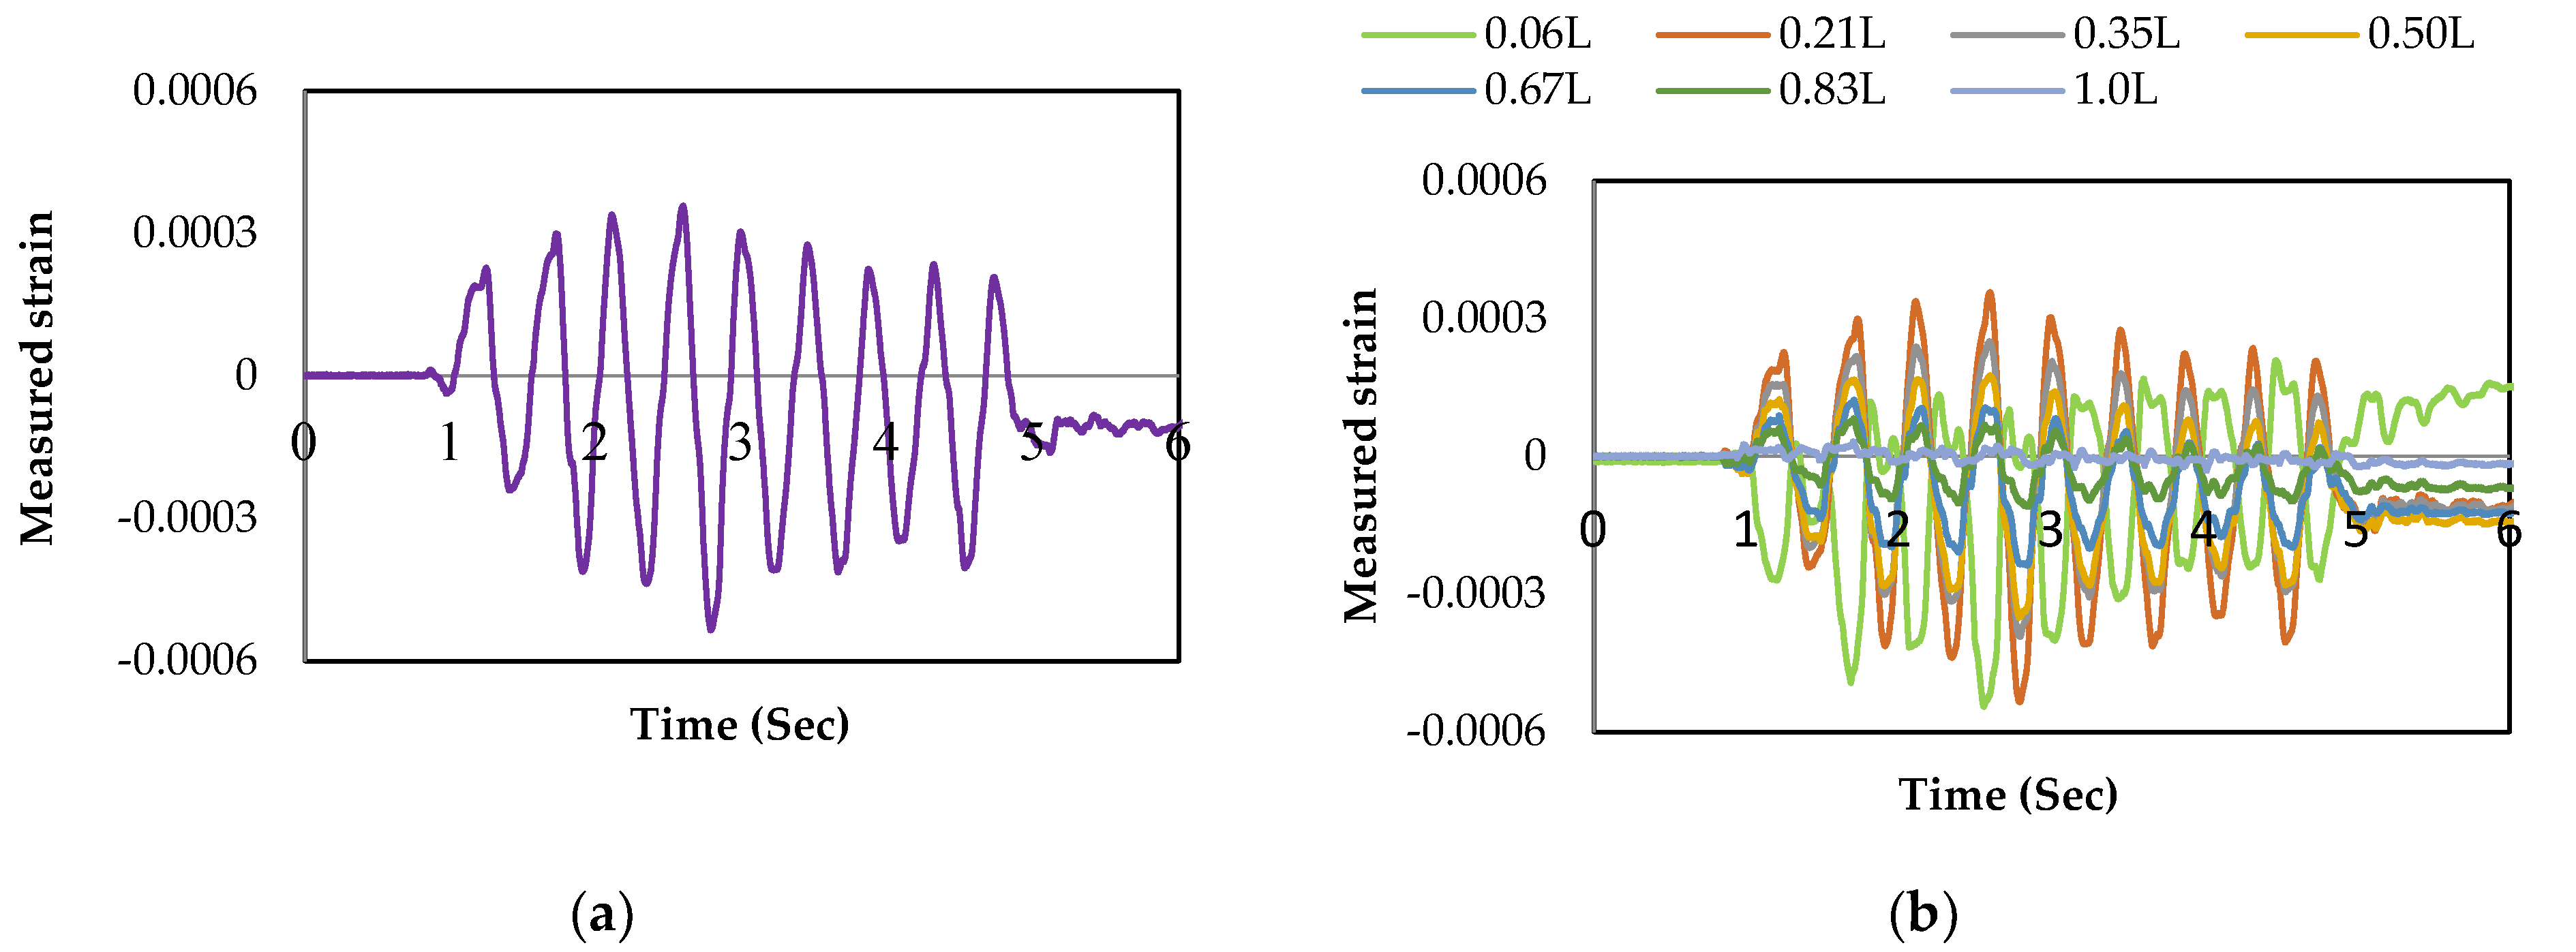
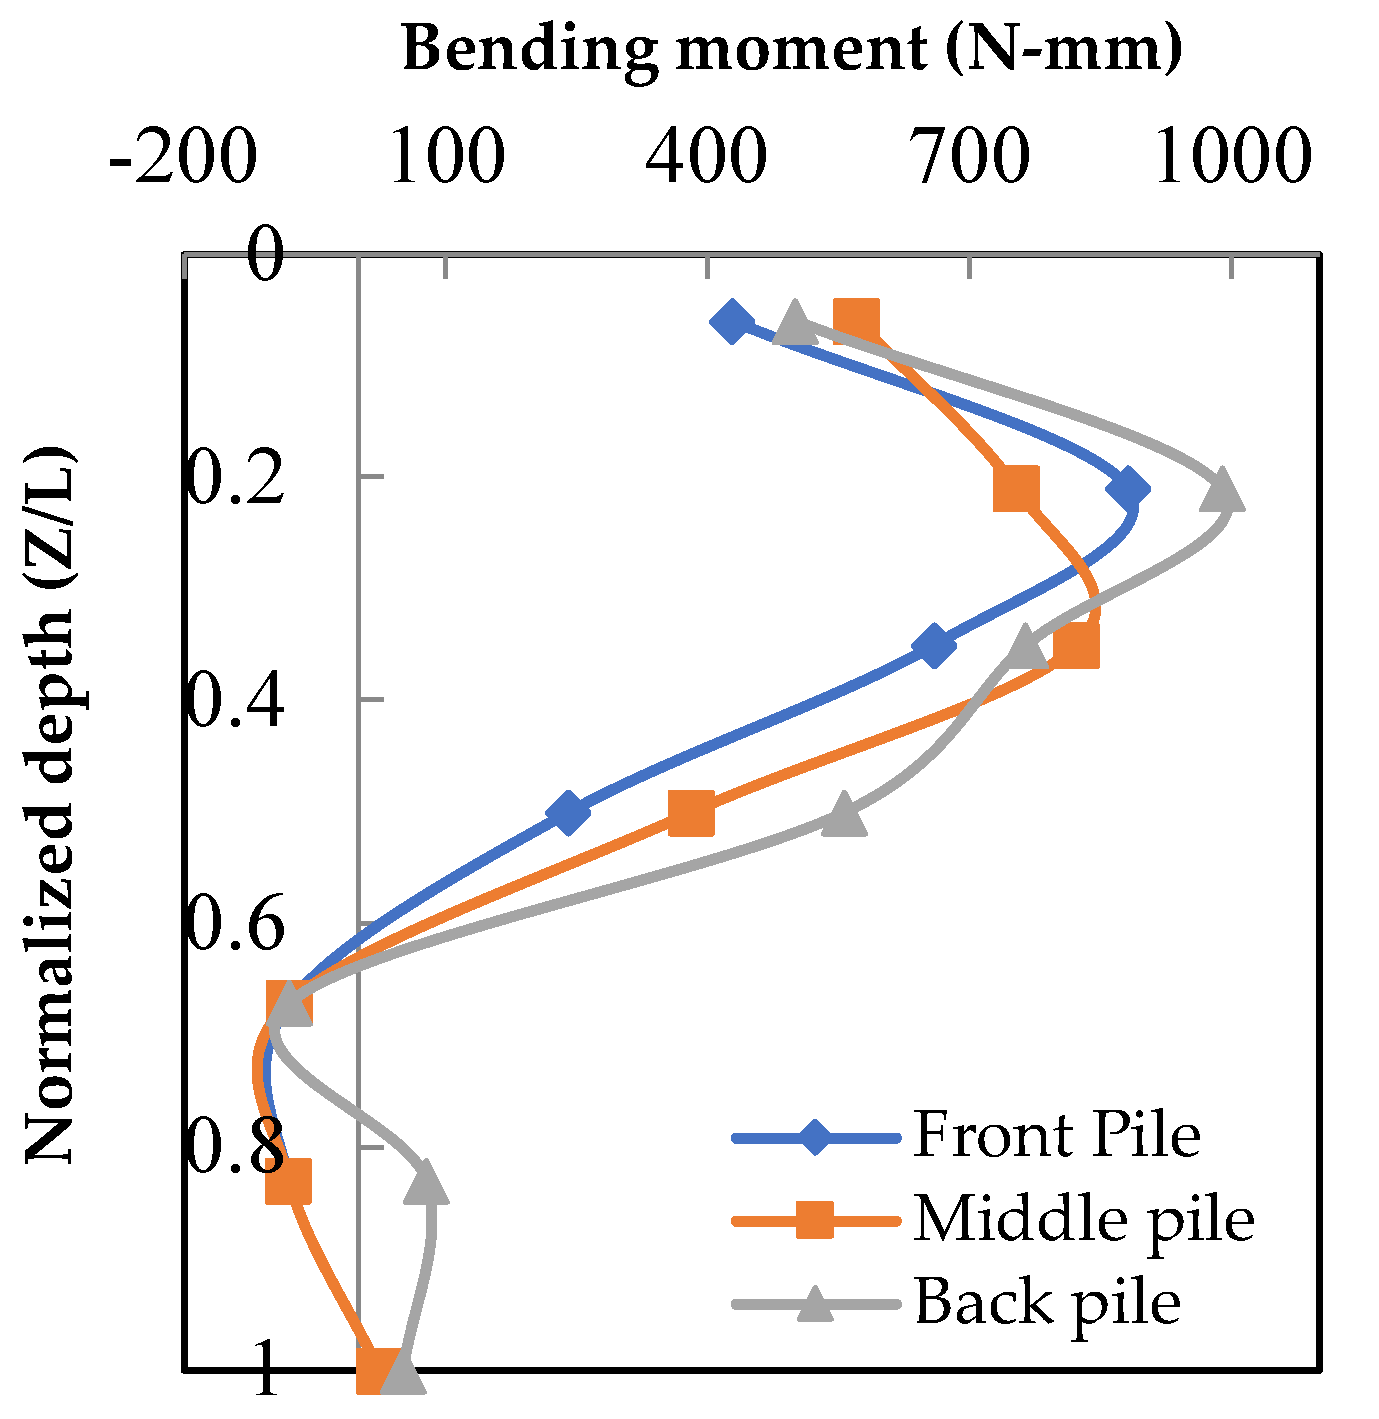
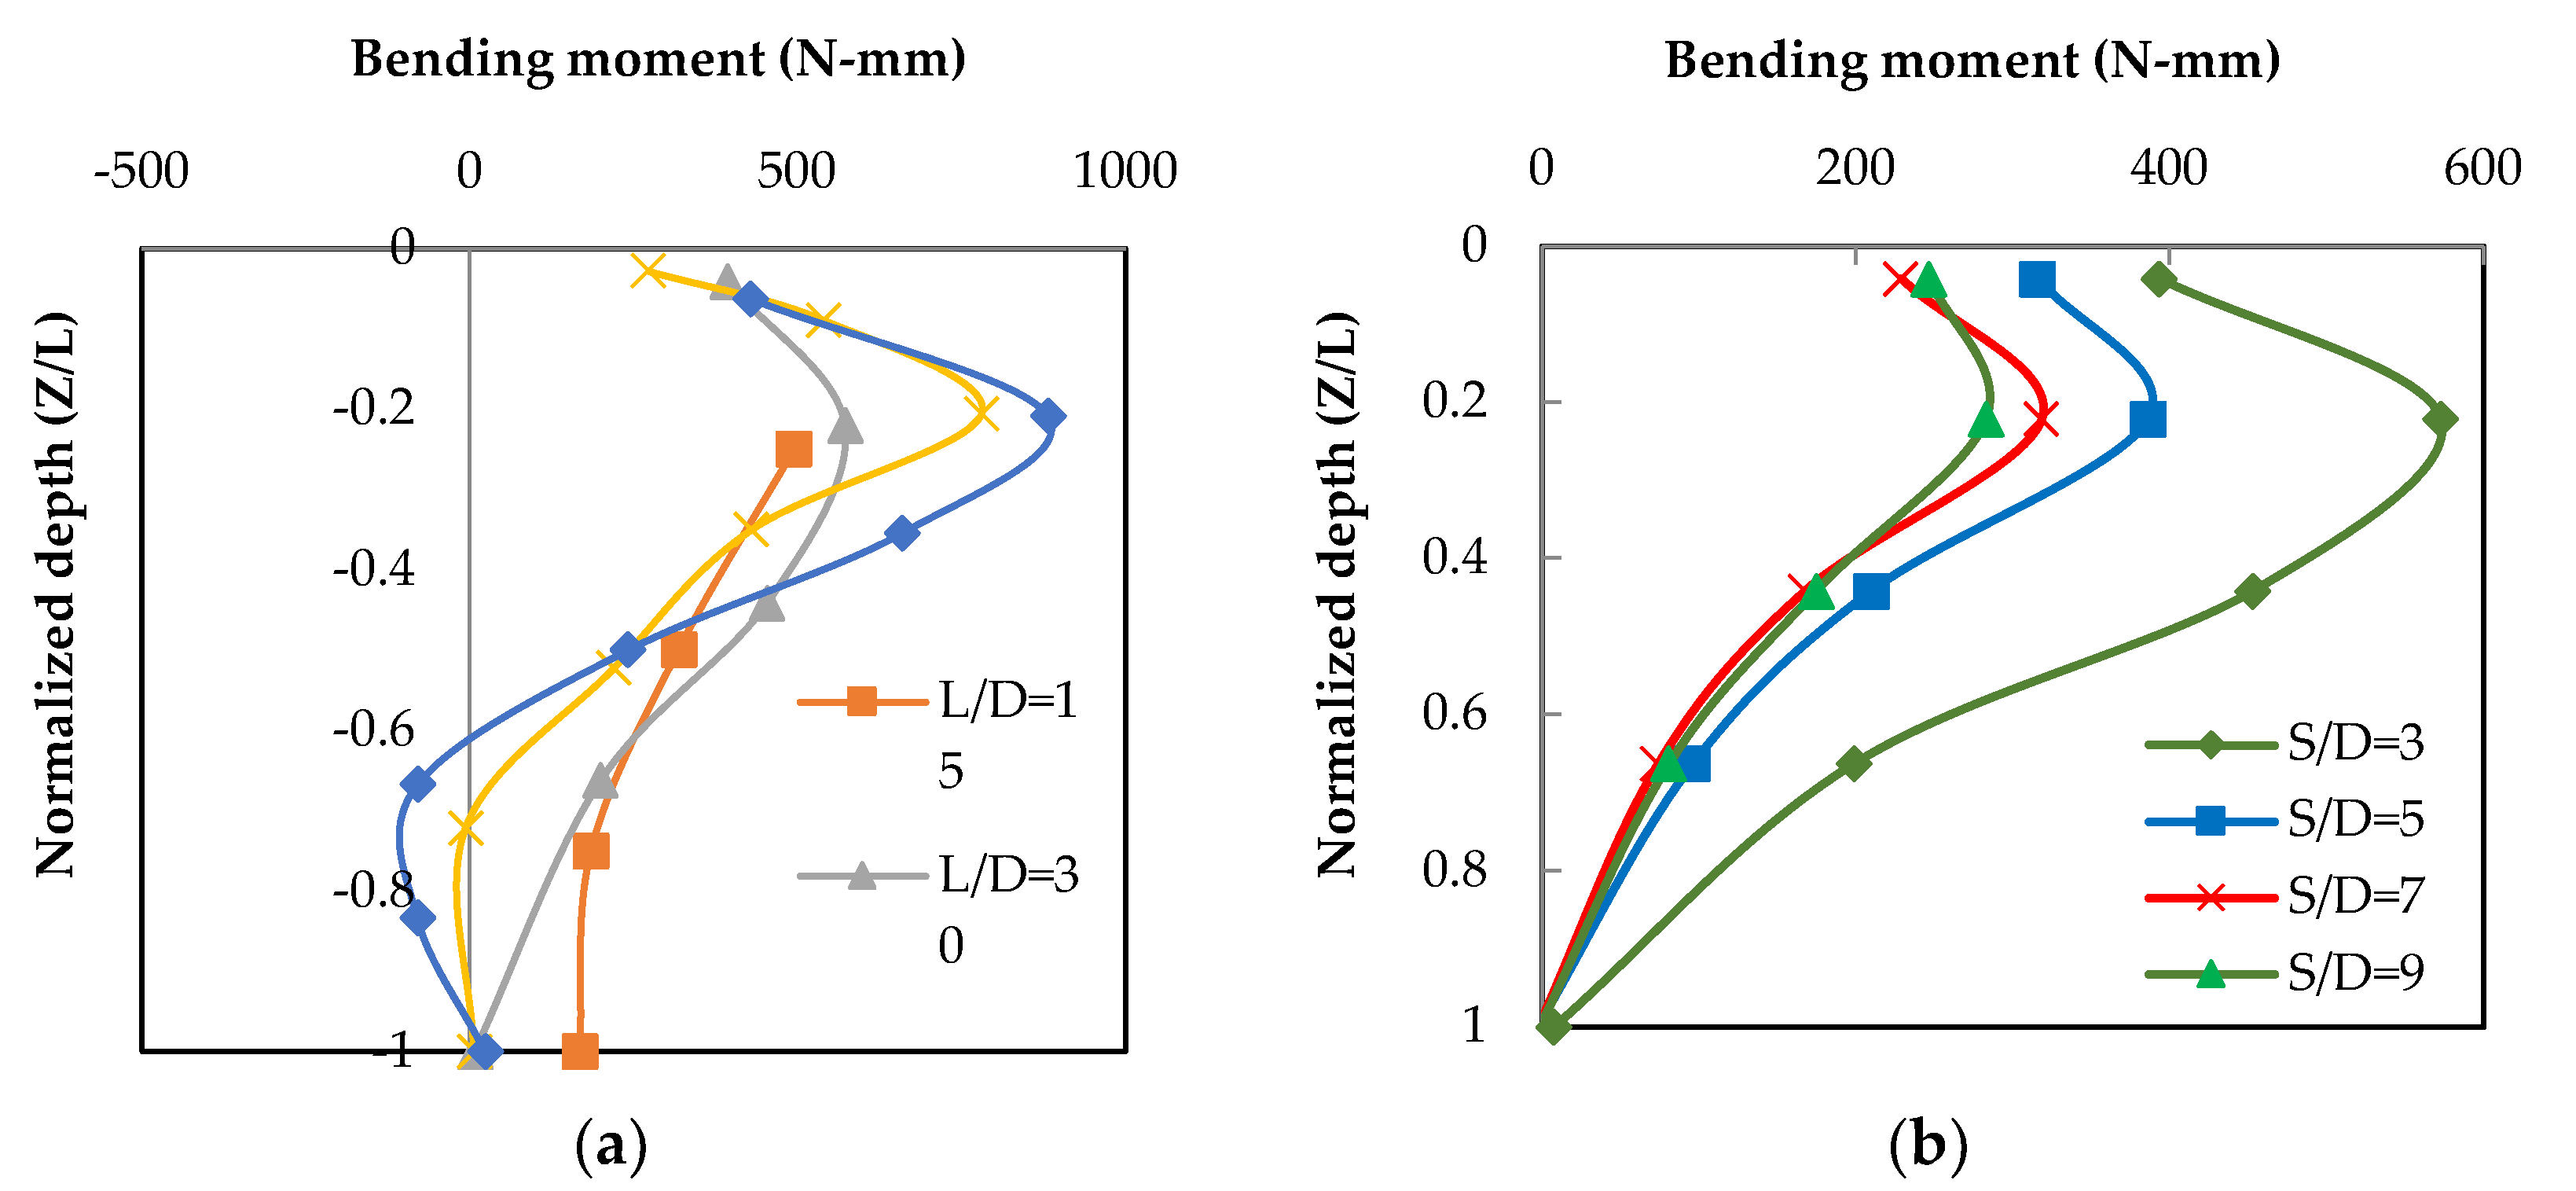
6.1. Pile Bending Moment
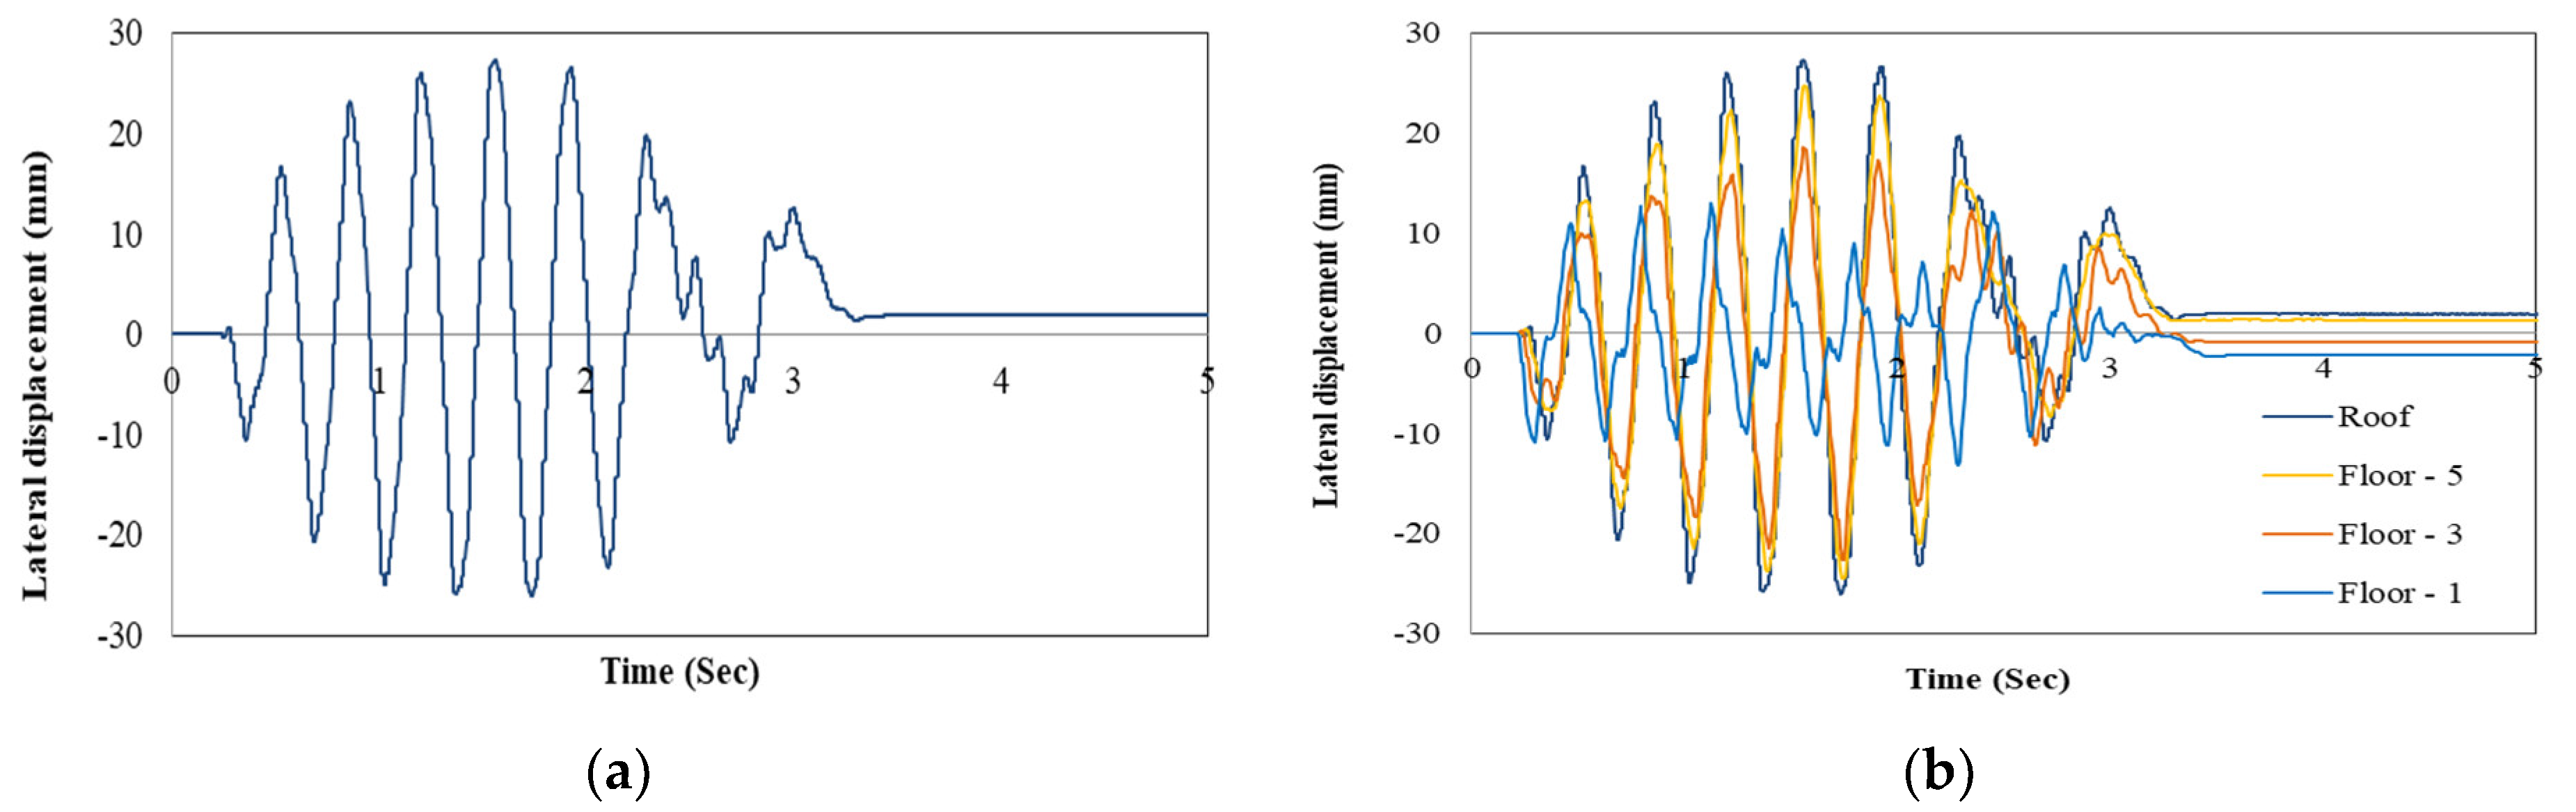
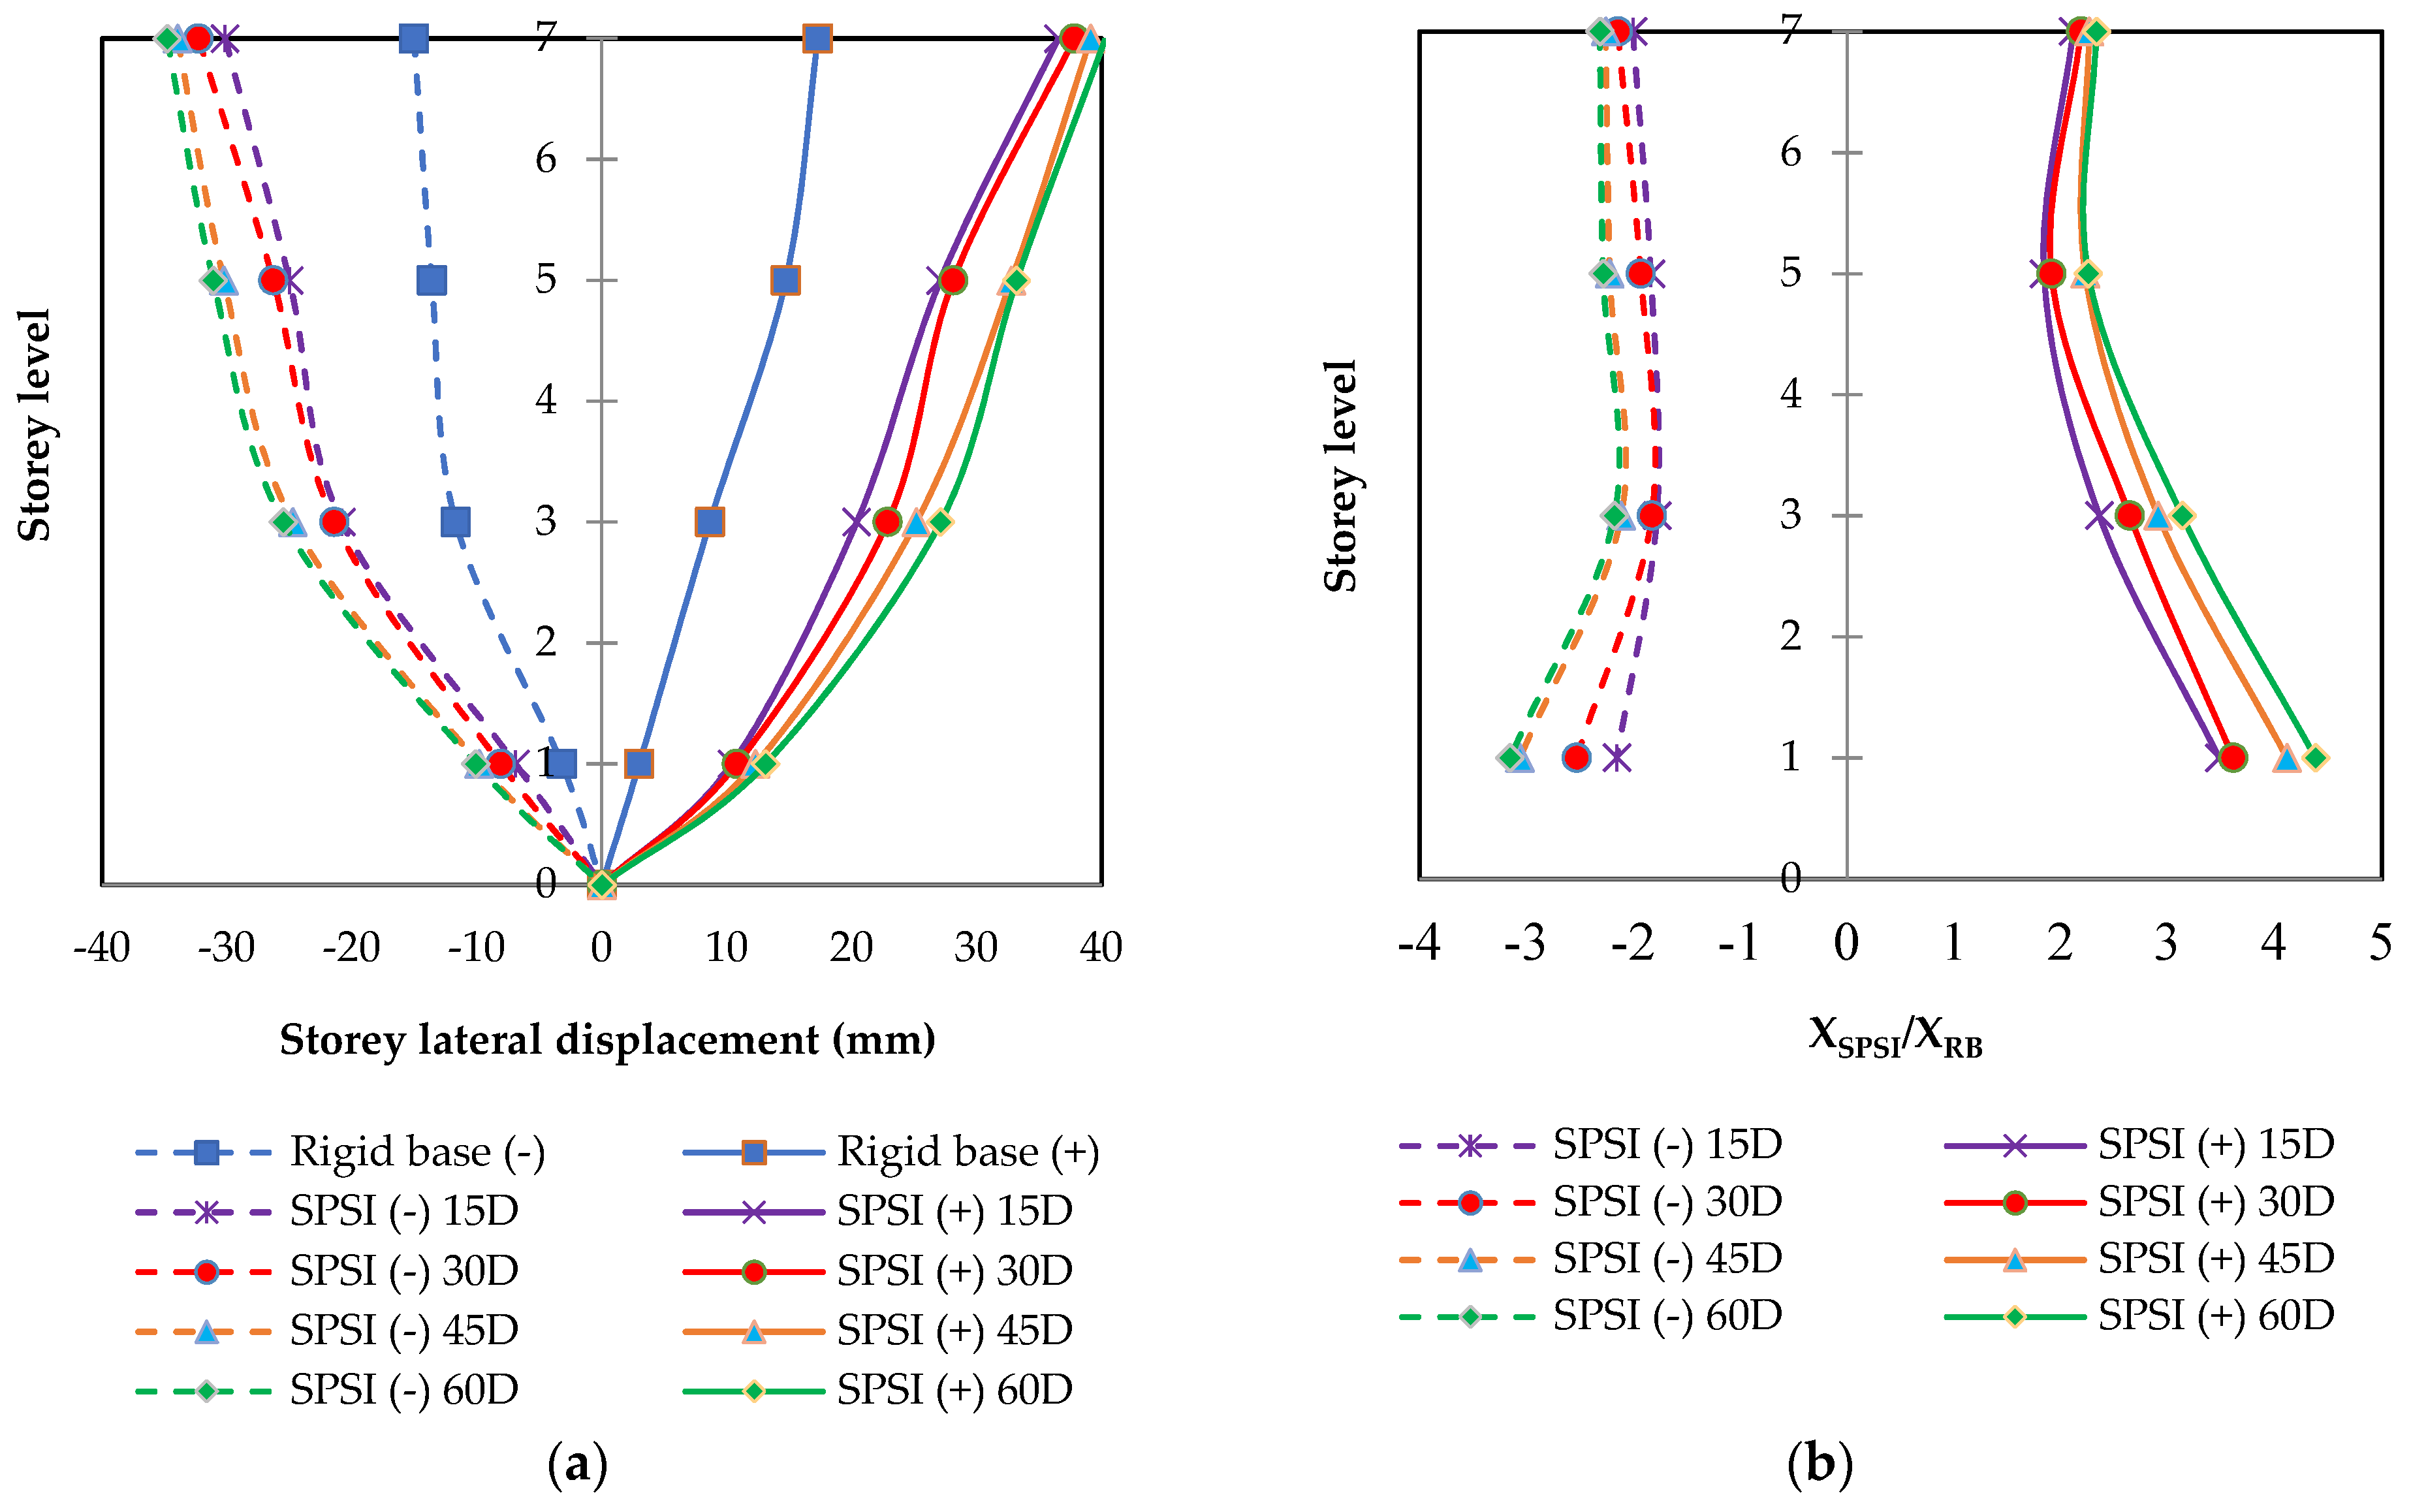
6.2. Story Lateral Displacement
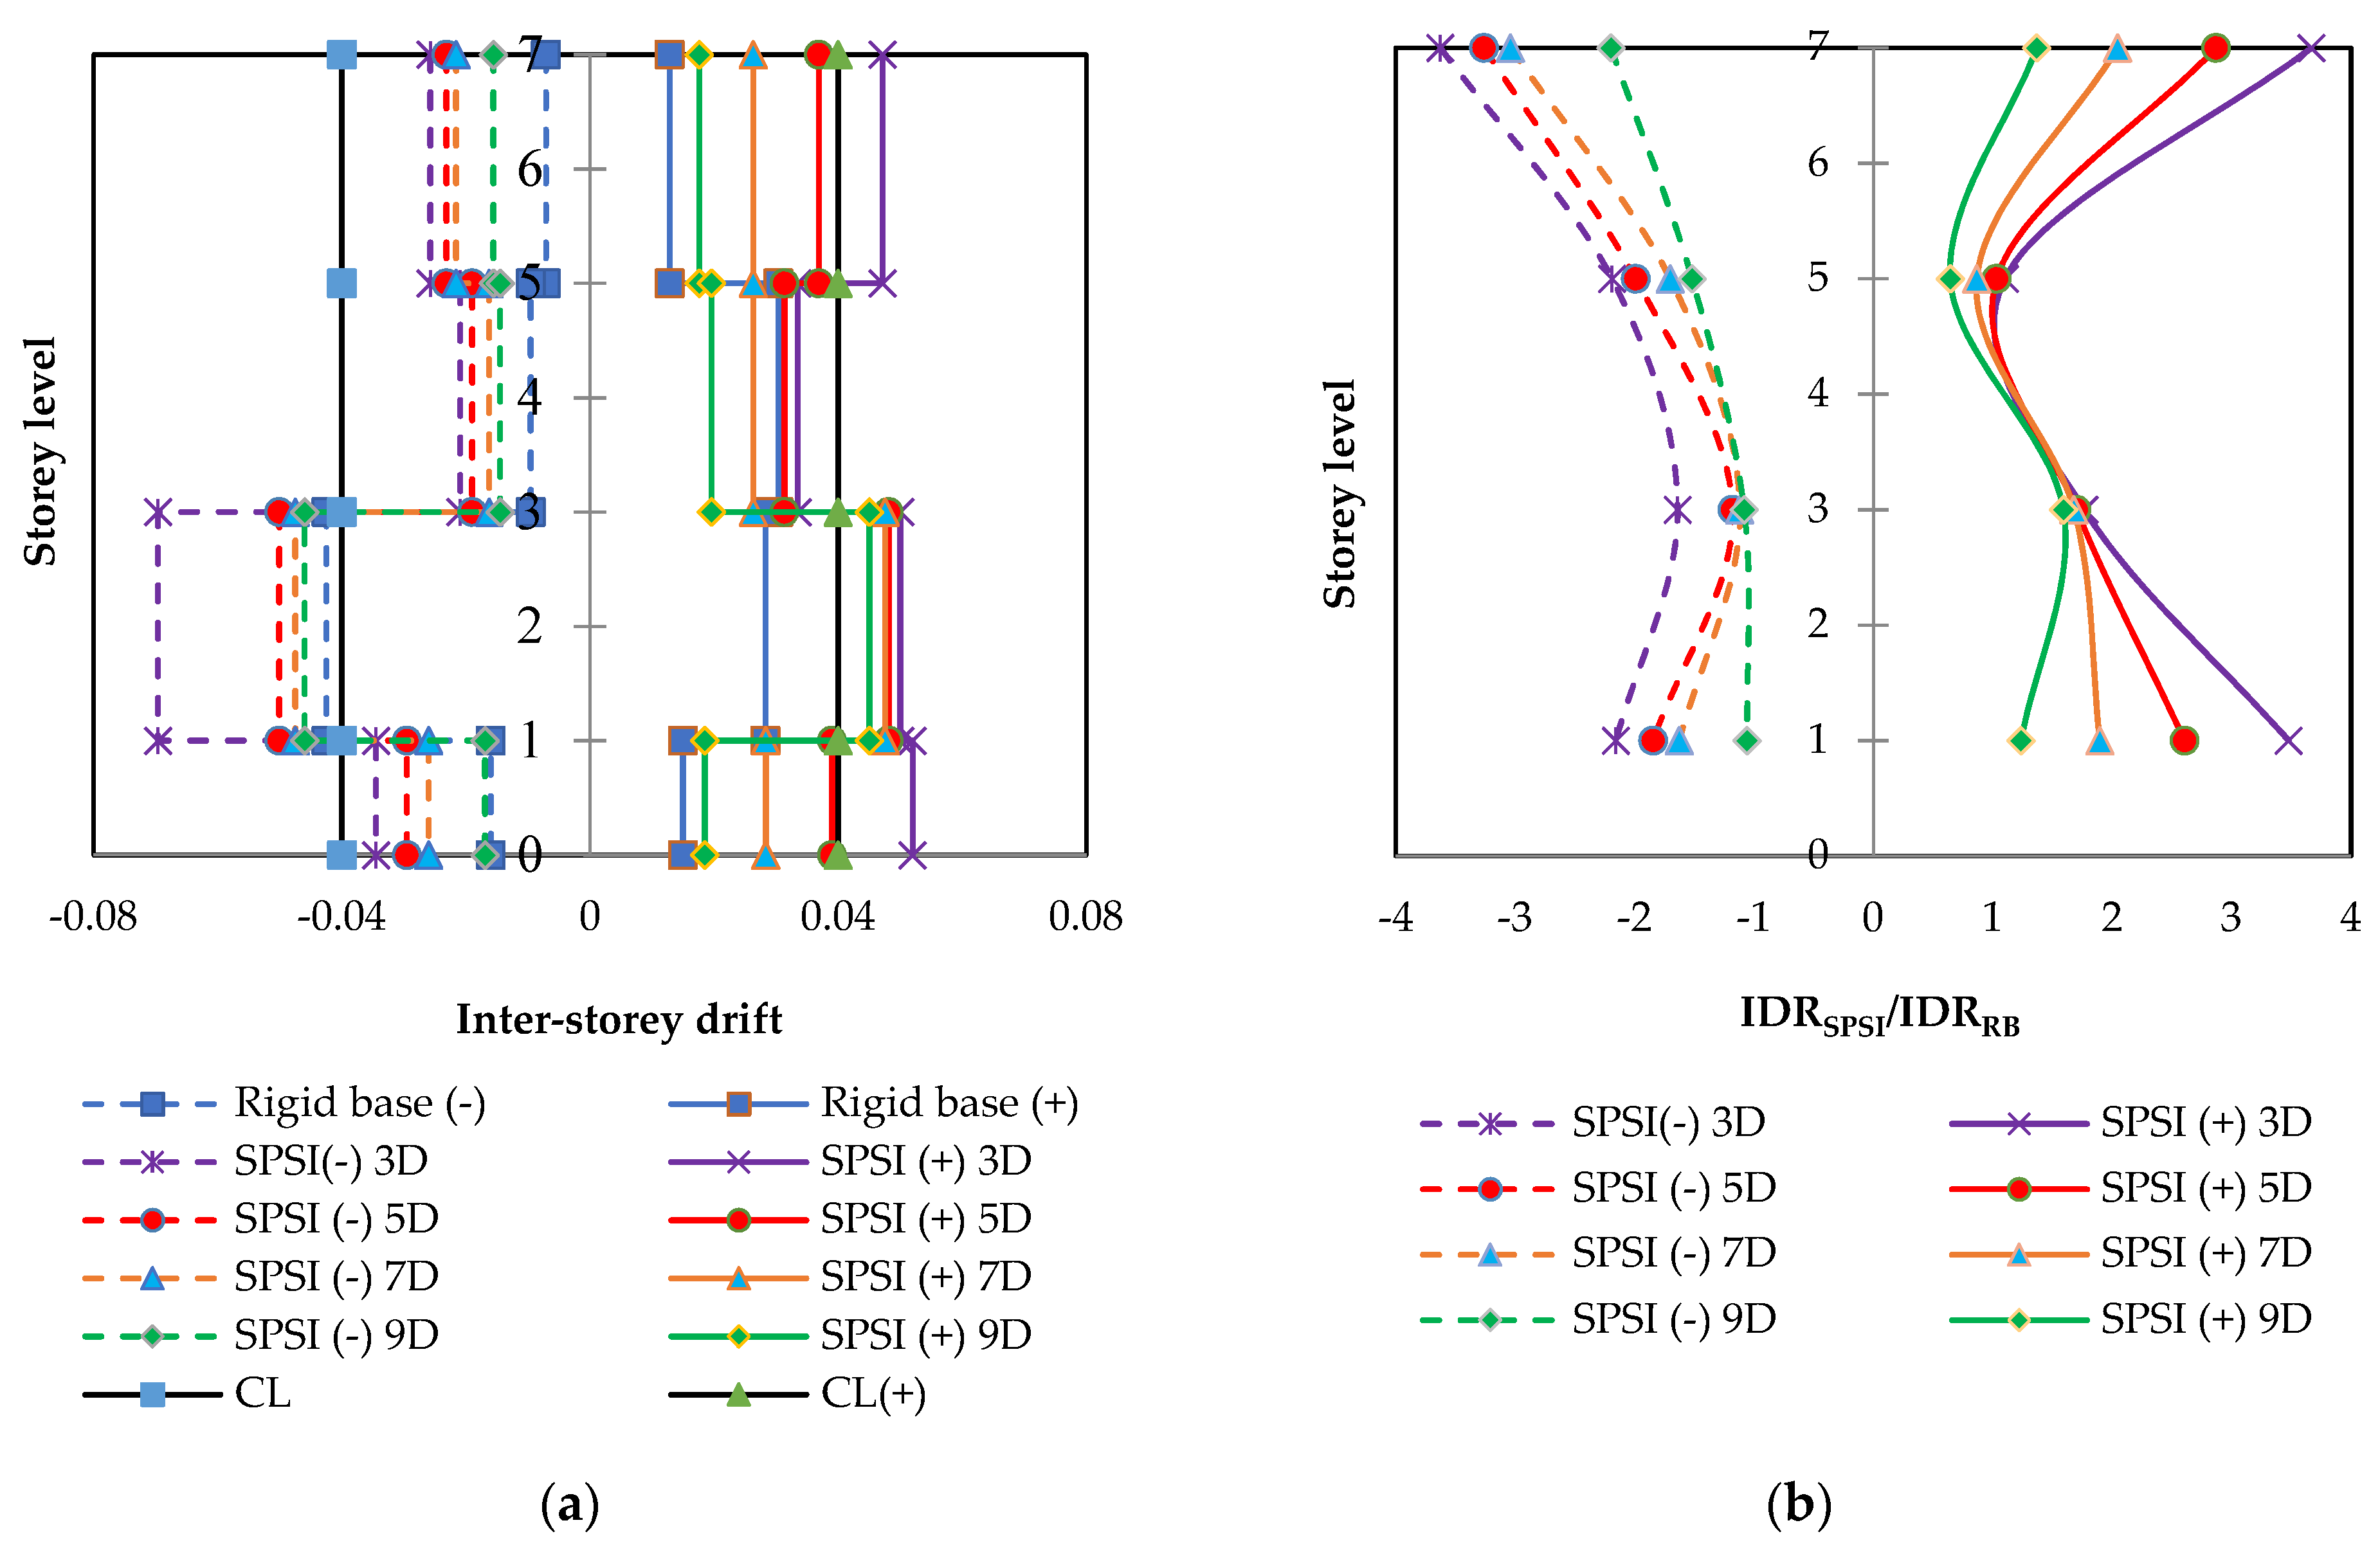
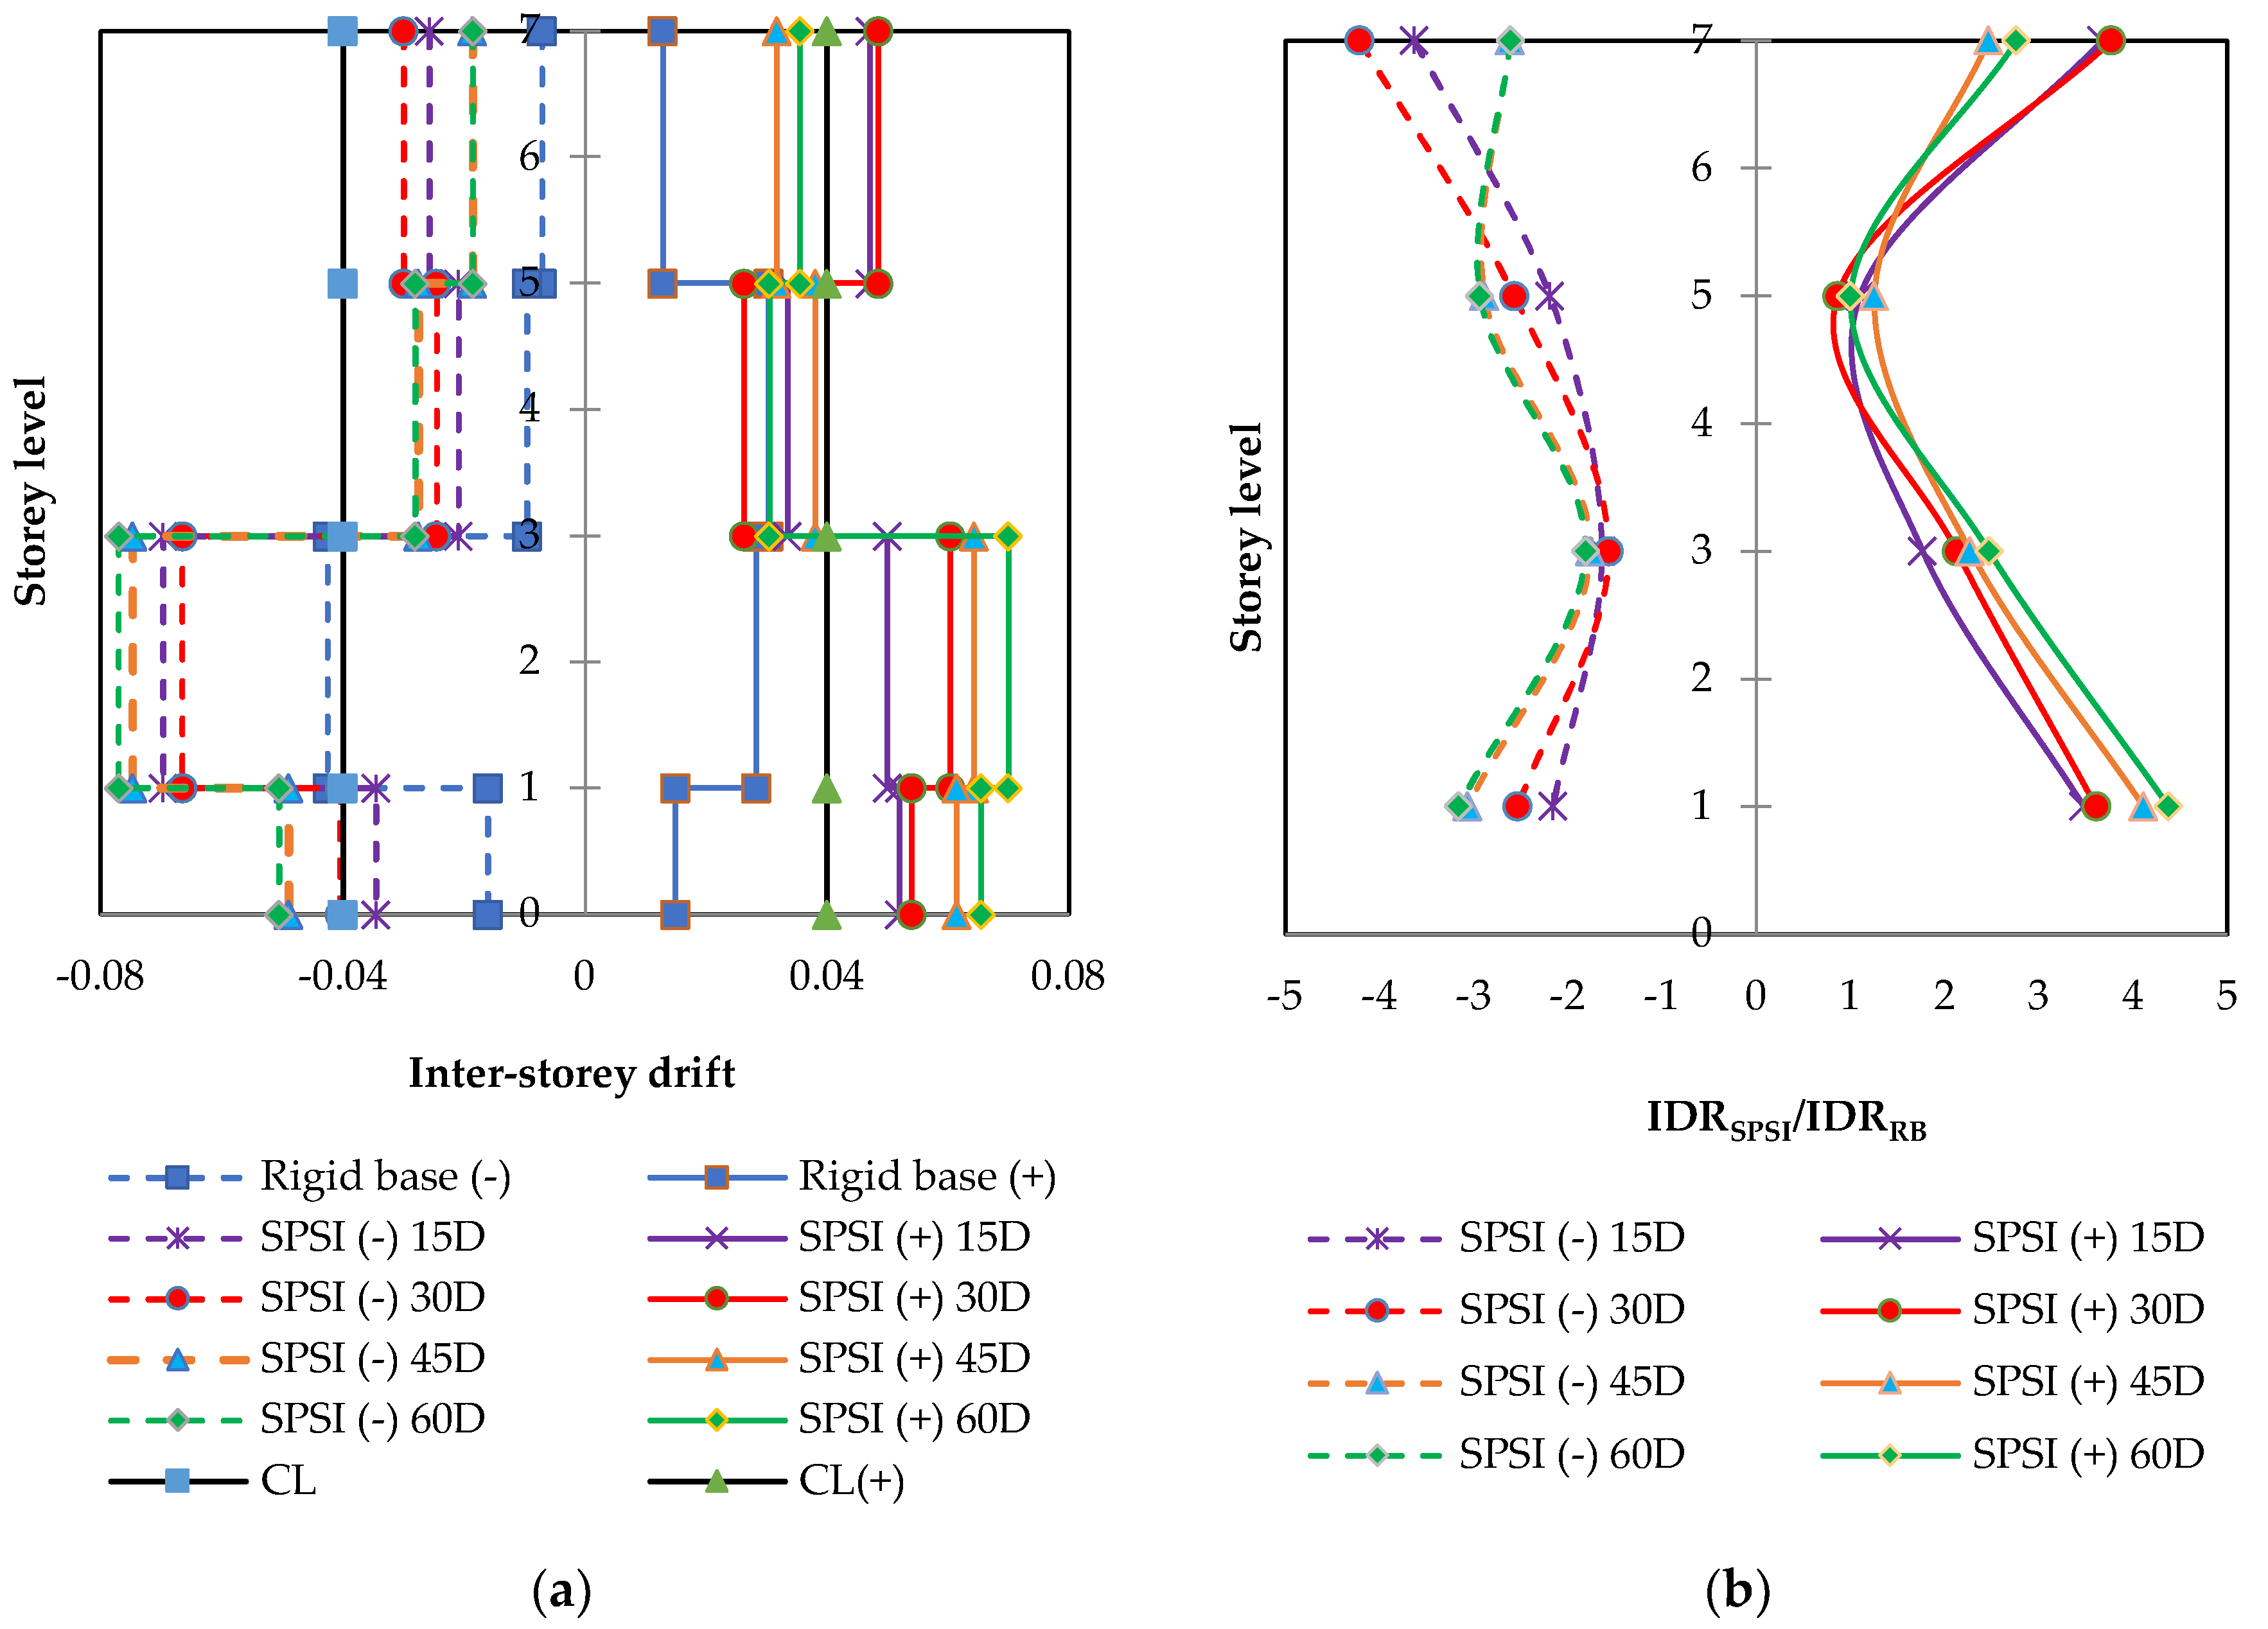
6.3. Inter-Story Drift
7. Discussion
8. Conclusions
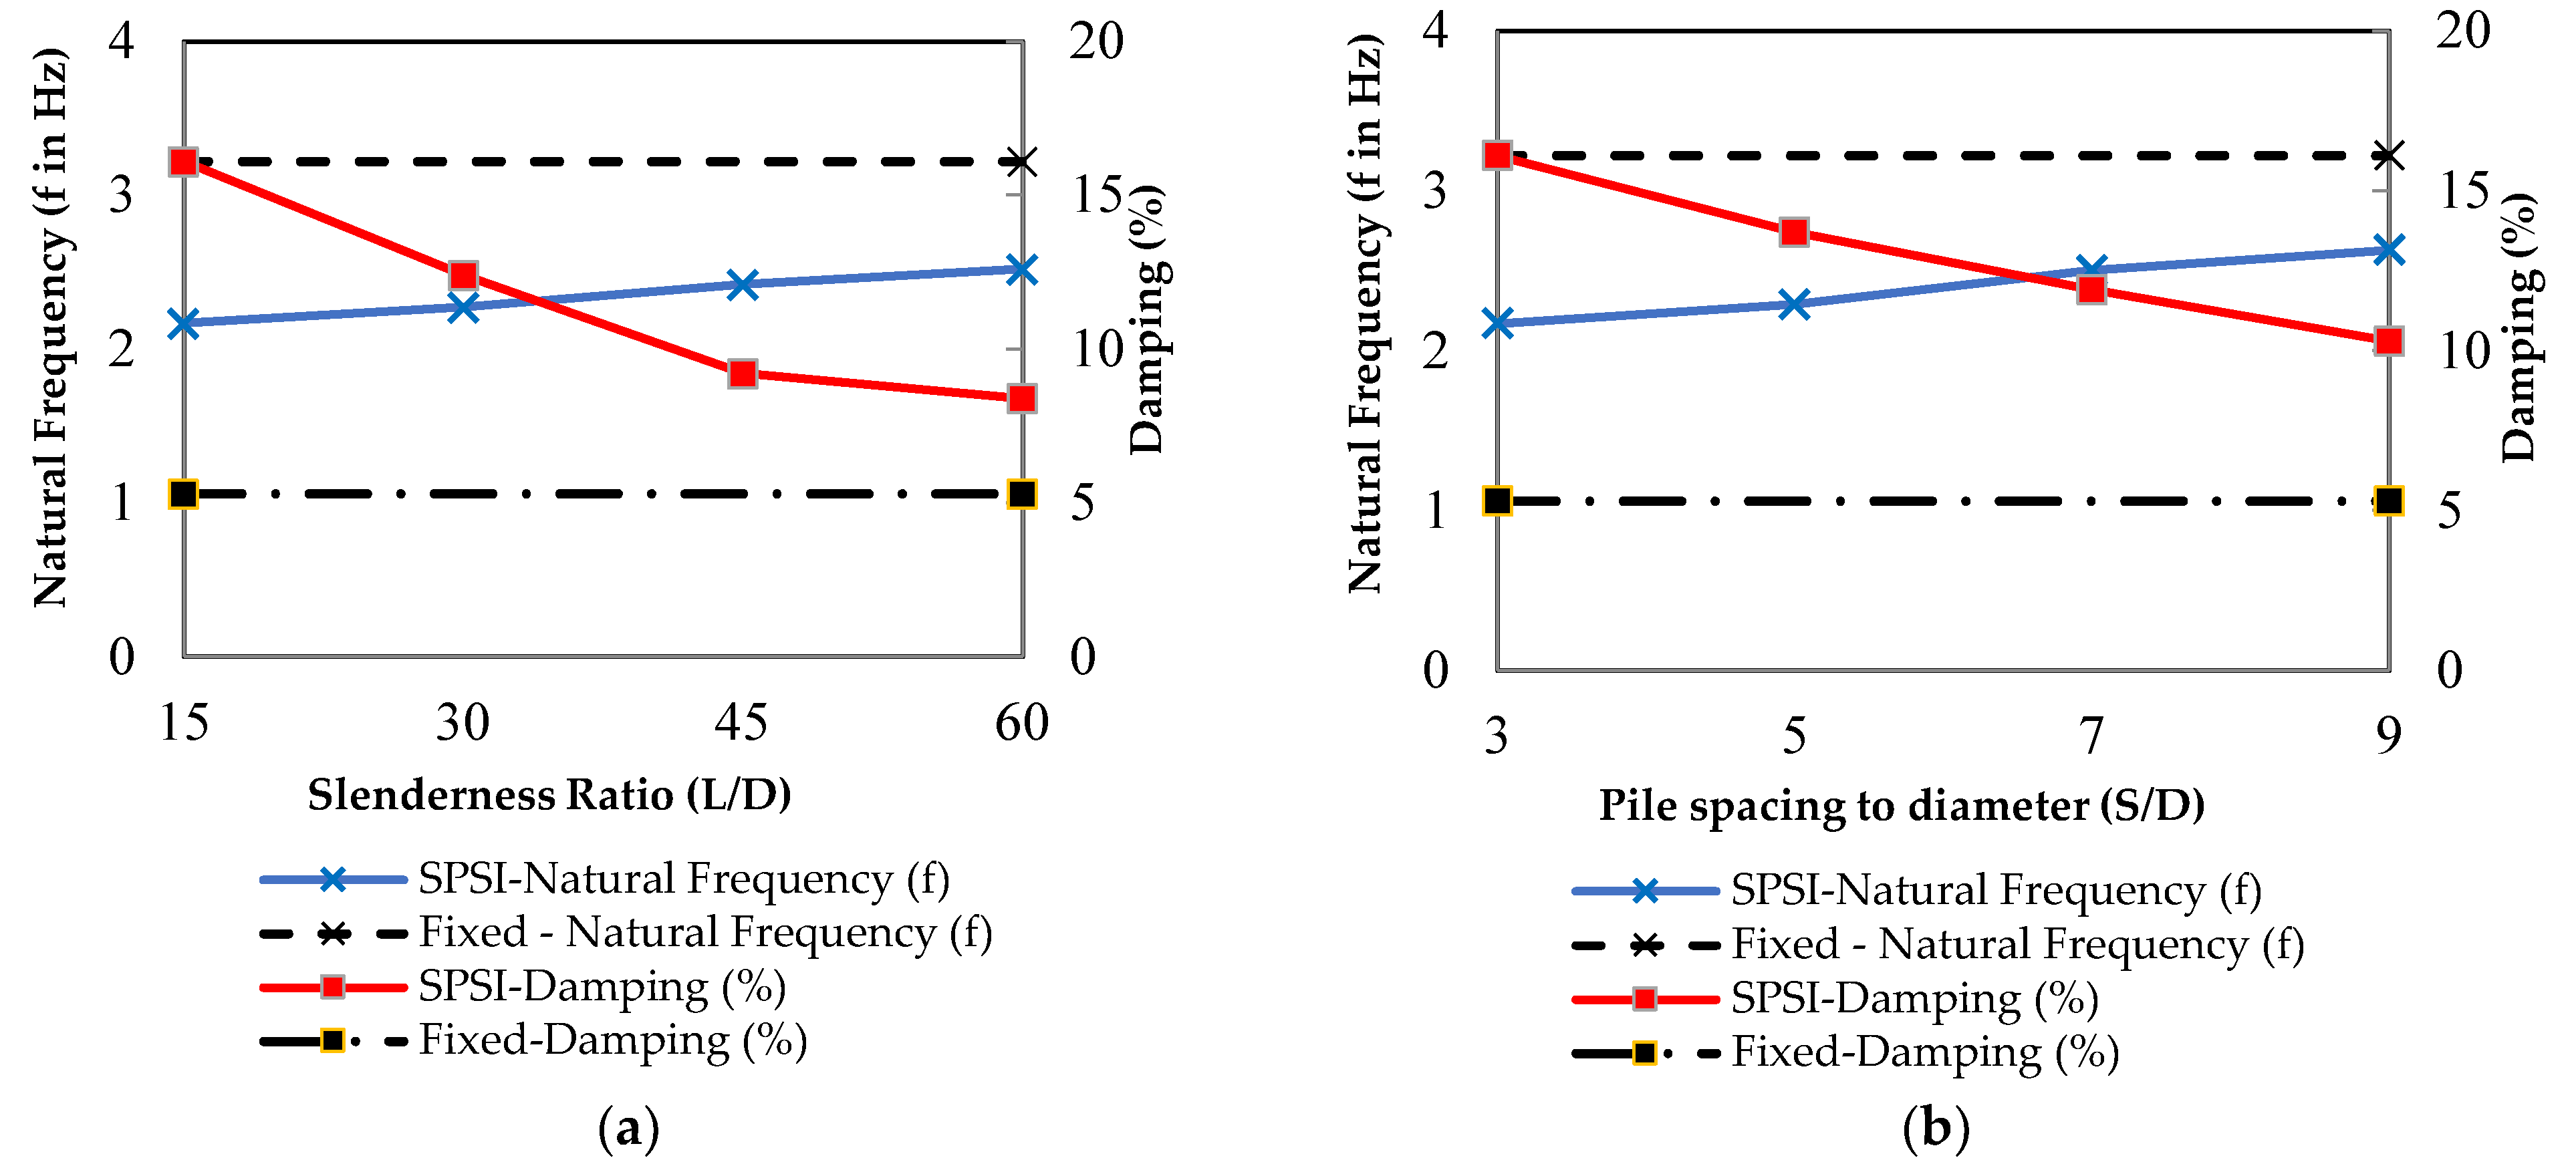
- The natural frequency values of the flexible-base models increased compared to the rigid-base models. The pile slenderness ratio and spacing have great effects on the natural frequency of the soil-pile-supported models. The natural frequency of SPSI models with a pile length of 15D was reduced by 16%, compared to those of the model with a pile length of 60D. Similarly, the increase in pile spacing from 3D to 9D increased the natural frequency by 21%.
- Similarly, the damping values of the SPSI models decreased compared to those of the fixed-base models. The damping of the flexible-base models with a pile length of 15D increased by 92%, in comparison to that of the model with a pile length of 60D. The rigidity at the base of the model also increased when the spacing between the piles was large (S = 9D). This decreased the value of damping by 56% compared to that of the model with closely spaced piles (S = 3D). This increase in damping in shorter pile models may alter the inelastic deformation of the superstructure.
- The pile bending moment due to the dynamic lateral loading increased by 78% for the model with L/D = 60, in comparison to that of the model with L/D = 15. This is due to the fact that the piles started behaving as flexible components when the slenderness ratio increased. Similarly, the group action of the piles reduced the lateral resistance due to the degradation of soil stiffness for closely spaced pile models. Therefore, we saw a rise in pile bending moment by 102% for the structure resting on closely spaced piles (3D), compared to that of the model with large spacing (9D).
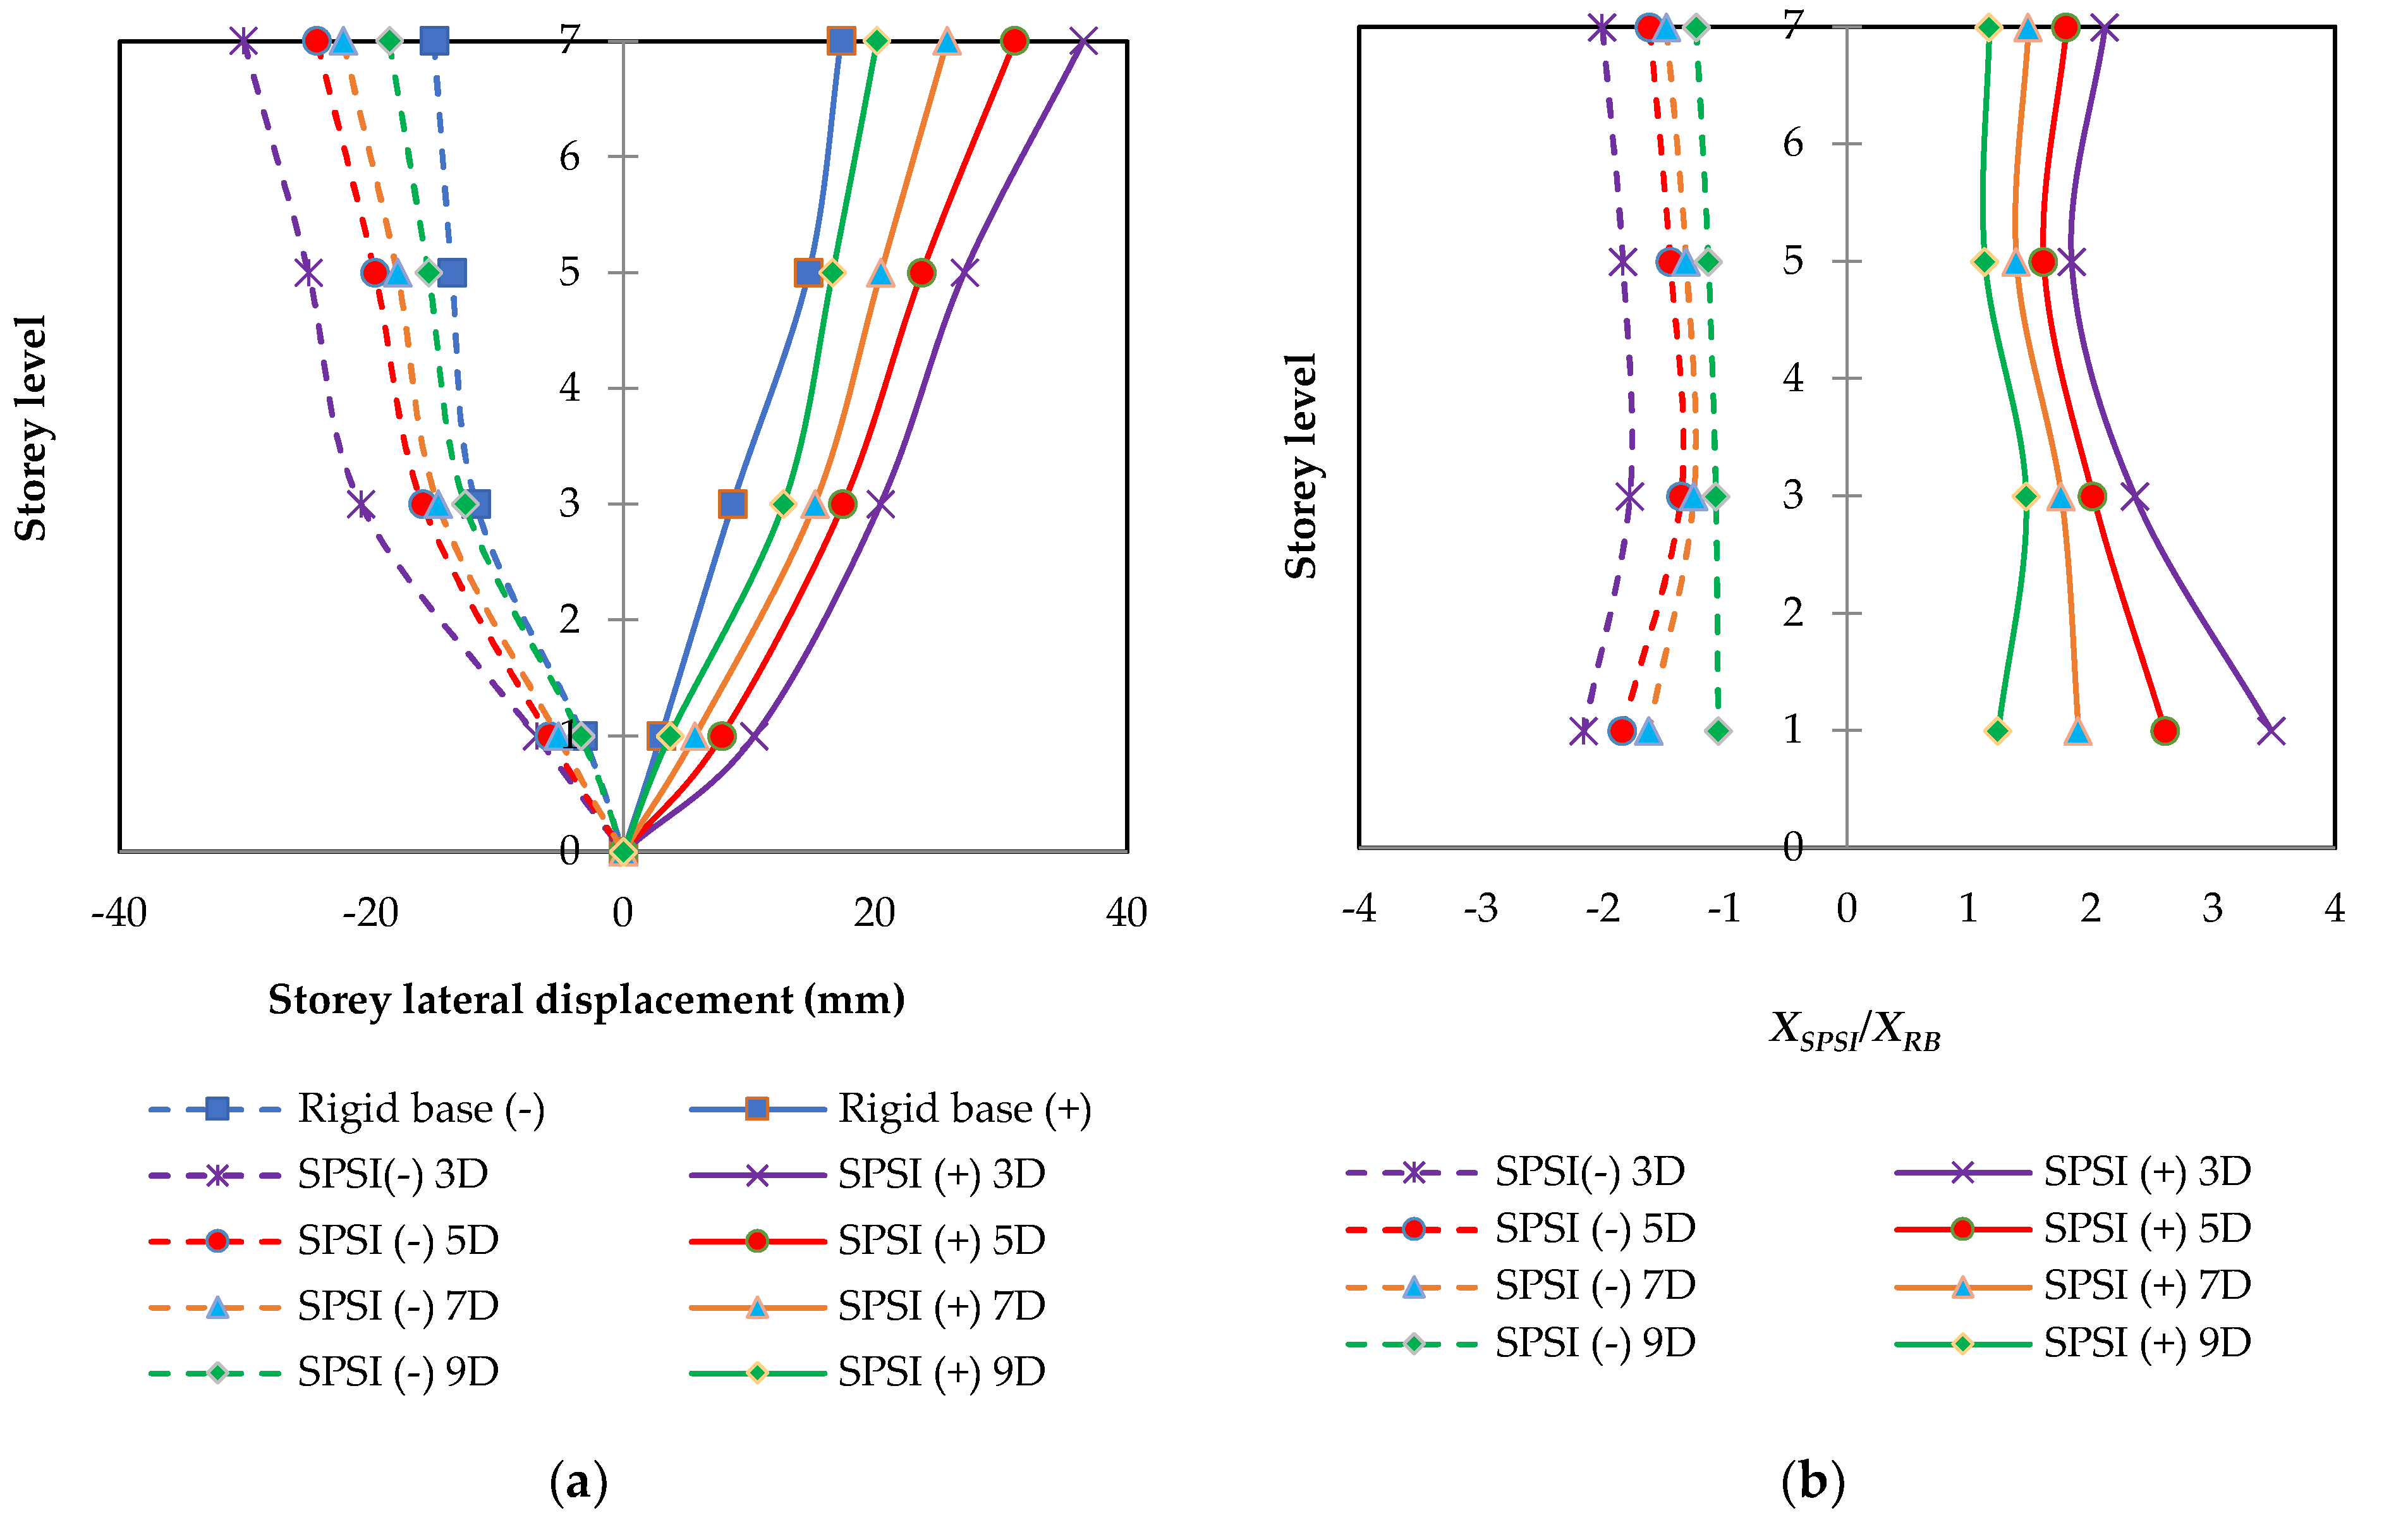
- The seismic response of the superstructure was significantly influenced by the behavior of the soil-foundation system. The higher value of story lateral displacement was attained with the model resting on closely spaced (S = 3D) slender piles (L = 60D). The corresponding ratio of story displacement of the SPSI model compared to the rigid-base model (XSPSI/XRB) was estimated to be 4.38. This demonstrates the significance of considering the soil-pile-structure interaction during the analysis and design stages.
- Moreover, the increase in the slenderness ratio and decrease in pile spacing increased the story lateral displacement considerably. The value of the superstructure story lateral displacement increased by 26% for the model supported by piles of L/D = 60, compared to that of the model with piles of L/D = 15. Similarly, reducing the spacing of the piles to 3D increased the lateral story displacement by 180%. This is due to the increase in pile bending moment, the decrease in natural frequency, and the increase in the damping of the system.
- Inter-story drift (IDR) is one of the most important design parameters for the limit state design of serviceability. The ratio of IDR values for the flexible base (model with S/D = 3 and L/D = 60) compared to the rigid base was computed to be 4.21. Furthermore, the model with the closely spaced piles (S/D = 3) experienced an IDR value of 167% more than that of the model with an S/D = 9. The increase in slenderness ratio to L/D = 60 also increased the IDR value by 46%, compared to that of the model with L/D = 15.
- As an increase or decrease in natural frequency may alter the spectral acceleration and resulting base shear, it is important to consider the SPSI effects in the design parameters. Moreover, the spacing and slenderness ratio of piles play a vital role in the seismic behavior of building frames. The closely spaced slender pile group model becomes more flexible due to soil degradation and the flexural behavior of piles. Therefore, proper consideration must be given to the design parameters, such as the time period, damping, soil properties, and foundation details during the design process of superstructures. However, soil-pile-structure interaction effects should be incorporated in building design to eliminate the under/overestimation of the forces at work in the design.
Author Contributions
Funding
Data Availability Statement
Acknowledgments
Conflicts of Interest
Appendix A
| Scaling Calculations: | |
| Length: | |
| Scaled model length = (1/n) × Prototype length | |
| Where, n = 40 | |
| Width of prototype building—8m | |
| Width of scaled model—8 m × (1/n) = 8000 × 1/40 = 200 mm | |
| Length of prototype building—8 m | |
| Length of scaled model—8 m × (1/n) = 8000 × 1/40 = 200 mm | |
| Height of prototype building—28 m | |
| Height of scaled model—28 m × (1/n) = 28,000 × 1/40 = 700 mm | |
| Storey Height of prototype building—4 m | |
| Storey Height of scaled model—4 m × (1/n) = 4000 × 1/40 = 100 mm | |
| Volume: | |
| Volume of scaled model = Volume of prototype × (1/n3) | |
| Volume of prototype = 8 m × 8 m × 28 m = 1792 m3. | |
| Therefore, volume of scaled model = 1792/403 = 0.028 m3 (0.2 × 0.2 × 0.7) | |
| Stiffness: | |
| Stiffness of the column of scaled model = Stiffness of the column of prototype × (1/n2) | |
| Stiffness of the prototype column = 12EI/L3 | |
| Where, E = Elastic modulus of concrete = 25,000 MPa | |
| I = Moment of Inertia = BD3/12 = 500 × 5003/12 = 5.21 × 109 mm4 | |
| L = 4000 mm | |
| Stiffness of the one prototype column = 24,422 N-mm | |
| Total stiffness of the storey = 9 × 24,422 = 219,797 N-mm | |
| Therefore, stiffness of one scaled model = 219,797/4 = 54,949 N–mm = 54,949 × (1/402) = 34.33 N-mm | |
| Thus, dimension of scaled model column = 12EI/L3 = 34.33 | |
| E = Elastic modulus of steel = 2 × 10⁵ N/mm2. | |
| L = 100 mm | |
| I = bt3/12 | |
| Thickness of column = 2 mm | |
| Therefore, required width of column, 12EI/L3 = 12 × 2 × 105 × b × (23/12)/1003 = 34.33 | |
| So, b = 21.46 = 22 mm. | |
| Adopt, 22 mm × 2 mm size column for scaled model. | |
| Density: | |
| Scaled model = 1 × Prototype | |
| Density of prototype = Weight of the building/volume = 9048 kN/(8 m × 8 m × 28 m) = 5.05 kN/m3 = 515 kg/m3. | |
| Therefore, required weight of scaled model = Density × volume = 515 × (0.2 × 0.2 × 0.7) = 14.4 kg. | |
| Moreover, adopt 6 mm thickness slab for all storeys. | |
| Total weight of the fabricated scaled model = Column weight + slab weight | |
| Where, column weight | = No. of column × L × B × t × density |
| = 4 × 0.7 (m) × 0.022 (m) × 0.002 (m) × 7850 kg/m3 = 0.97 kg | |
| Slab weight | = No. of slabs × B × L × t × 7850 = 7 × 0.2 × 0.2 × 0.006 × 7850 |
| = 13.2 kg | |
| Total weight of the scaled model = 0.97 + 13.2 = 14.17 kg, which is nearer to the required weight (14.4 kg). | |
| Frequency: | |
| Frequency of prototype = 0.49 Hz | |
| Frequency of fixed base scaled model = 0.49 Hz × Scale factor (n1/2) = 0.49 × 400.5 = 3.10 Hz | |
References
- Boominathan, A.; Ayothiraman, R. Dynamic behaviour of laterally loaded model piles in clay. Proc. Inst. Civ. Eng. Geotech. Eng. 2005, 158, 207–215. [Google Scholar] [CrossRef]
- Boominathan, A.; Ayothiraman, R. An experimental study on static and dynamic bending behaviour of piles in soft clay. Geotech. Geol. Eng. 2007, 25, 177–189. [Google Scholar] [CrossRef]
- Poulos, H.G.; Davis, E.H. Pile Foundation Analysis and Design; John Wiley and Sons: Chichester, UK, 1980. [Google Scholar]
- Reese, L.C.; Isenhower, W.M.; Wang, S.T. Analysis and Design of Shallow and Deep Foundations, 1st ed.; Wiley: New York, NY, USA, 2005. [Google Scholar] [CrossRef]
- Chandrasekaran, S.S.; Boominathan, A.; Dodagoudar, G.R. Group Interaction Effects on Laterally Loaded Piles in Clay. J. Geotech. Geoenviron. Eng. 2010, 136, 573–582. [Google Scholar] [CrossRef]
- Brown, D.A.; Lymon, C.R.; O’Neill, M.W. Cyclic Lateral Loading of a Large-Scale Pile Group. J. Geotech. Eng. 1987, 113, 1326–1343. [Google Scholar] [CrossRef]
- Rollins, K.M.; Peterson, K.T.; Weaver, T.J. Lateral Load Behavior of Full-Scale Pile Group in Clay. J. Geotech. Geoenviron. Eng. 1998, 124, 468–478. [Google Scholar] [CrossRef]
- Fayez, A.F.; El Naggar, M.H.; Cerato, A.B.; Elgamal, A. Correction to: Assessment of SSI Effects on Stiffness of Single and Grouped Helical Piles in Dry Sand from Large Shake Table Tests. Bull. Earthq. Eng. 2022, 20, 3619. [Google Scholar] [CrossRef]
- Wolf, J.P. Dynamic Soil-Structure Interaction; Prentice-Hall Inc.: Englewood Cliffs, NJ, USA, 1985. [Google Scholar]
- Mylonakis, G.; Gazetas, G. Seismic soil-structure interaction: Beneficial or detrimental? J. Earthq. Eng. 2000, 4, 277–301. [Google Scholar] [CrossRef]
- Somerville, P.G. The amplitude and duration effects of rupture directivity in near fault ground motions. In Geotechnical Earthquake Engineering and Soil Dynamics III; Dakoulas, P., Yegian, M.K., Holtz, R.D., Eds.; ASCE: Reston, VA, USA, 1998. [Google Scholar]
- Gazetas, G.; Mylonakis, G. ‘Seismic Soil-Structure Interaction: New evidence and emerging issues’. In Geotechnical Earthquake Engineering and Soil Dynamics III; Dakoulas, P., Yegian, M.K., Holtz, R.D., Eds.; ASCE: Reston, VA, USA, 1998; Volume 2, pp. 1119–1174. [Google Scholar]
- Veletsos, A.S.; Meek, J.W. Dynamic behaviour of building-foundation systems. Earthq. Eng. Struct. Dyn. 1974, 3, 121–138. [Google Scholar] [CrossRef]
- Tabatabaiefar, H.R.; Massumi, A. A simplified method to determine seismic responses of reinforced concrete moment resisting building frames under influence of soil–structure interaction. Soil Dyn. Earthq. Eng. 2010, 30, 1259–1267. [Google Scholar] [CrossRef]
- Horii, K. General Report on the Niigata Earthquake; Part 3: Highway Bridges; Tokyo Electrical Engineering College Press: Tokyo, Japan, 1968; pp. 431–450. [Google Scholar]
- Towhata, I. Photographs and Motion Picture of the Niigata City Immediately after the 1964 earthquake (CD). Jpn. Geotech. Soc. 1999, 17. [Google Scholar]
- Kerciku, A.A.; Bhattacharya, S.; Lubkowski, Z.A.; Burd, H.J. Failure of Showa Bridge during the 1964 Niigatta Earthquake. In Proceedings of the 14th World Conference on Earthquake Engineering, Beijing, China, 12–17 October 2008. [Google Scholar]
- Dash, S.R.; Bhattacharya, S. Mechanism of failure of three pile-supported structures during three different earthquakes. In Proceedings of the 15th World Conference on Earthquake Engineering, Lisboa, Portugal, 24–28 September 2012. [Google Scholar]
- Meymand, P.J. Shaking Table Scale Model Tests of Nonlinear Soil-Pile-Superstructure Interaction in Soft Clay. Ph.D. Thesis, University of California Berkeley, Berkeley, CA, USA, 1998. [Google Scholar]
- Mylonakis, G.; Gazetas, G.; Nikolaou, S.; Michaelides, O. The role of soil on the collapse of 18 piers of the Hanshin Expressway in the Kobe earthquake. In Proceedings of the 12th World Conference on Earthquake Engineering, Auckland, New Zealand, 30 January–4 February 2000. [Google Scholar]
- Dash, S.R.; Govindaraju, L.; Bhattacharya, S. A case study of damages of the Kandla Port and Customs Office tower supported on a mat–pile foundation in liquefied soils under the 2001 Bhuj earthquake. Soil Dyn. Earthq. Eng. 2009, 29, 333–346. [Google Scholar] [CrossRef]
- Smyrou, E.; Tasiopoulou, P.; Bal, I.E.; Gazetas, G. Ground Motions versus Geotechnical and Structural Damage in the February 2011 Christchurch Earthquake. Seism. Res. Lett. 2011, 82, 882–892. [Google Scholar] [CrossRef]
- Hokmabadi, A.S.; Fatahi, B.; Samali, B. Assessment of soil–pile–structure interaction influencing seismic response of mid-rise buildings sitting on floating pile foundations. Comput. Geotech. 2014, 55, 172–186. [Google Scholar] [CrossRef]
- Hokmabadi, A.S.; Fatahi, B. Influence of Foundation Type on Seismic Performance of Buildings Considering Soil–Structure Interaction. Int. J. Struct. Stab. Dyn. 2016, 16, 1550043. [Google Scholar] [CrossRef]
- Van Nguyen, Q.; Fatahi, B.; Hokmabadi, A.S. Influence of Size and Load-Bearing Mechanism of Piles on Seismic Performance of Buildings Considering Soil–Pile–Structure Interaction. Int. J. Géoméch. 2017, 17, 04017007. [Google Scholar] [CrossRef]
- Askouni, P.K.; Karabalis, D.L. The Modification of the Estimated Seismic Behaviour of R/C Low-Rise Buildings Due to SSI. Buildings 2022, 12, 975. [Google Scholar] [CrossRef]
- Mori, F.; Mendicelli, A.; Moscatelli, M.; Romagnoli, G.; Peronace, E.; Naso, G. A new Vs30 map for Italy based on the seismic microzonation dataset. Eng. Geol. 2020, 275, 105745. [Google Scholar] [CrossRef]
- Ruggieri, S.; Calò, M.; Cardellicchio, A.; Uva, G. Analytical-mechanical based framework for seismic overall fragility analysis of existing RC buildings in town compartments. Bull. Earthq. Eng. 2022, 1–38. [Google Scholar] [CrossRef]
- Alizadeh, M.; Davisson, M.T. Lateral Load Tests on Piles-Arkansas River Project. J. Soil Mech. Found. Div. 1970, 96, 1583–1604. [Google Scholar] [CrossRef]
- Matlock, H. Correlations for design of laterally loaded piles in soft clay. In Proceedings of the 2nd Annual Offshore Technology Conference 1, Houston, TX, USA, 21 April 1970; Volume 1204, pp. 577–594. [Google Scholar]
- Reese, L.C.; Cox, W.R.; Coop, F.D. Field testing and Analysis of laterally loaded piles in stiff clay. In Proceedings of the VII Annual Offshore Technology Conference, Houston, TX, USA, 4 May 1975; Volume 2, pp. 672–690. [Google Scholar]
- Reese, L.C.; Welch, R.C. Lateral Loading of Deep Foundations in Stiff Clay. J. Geotech. Eng. Div. 1975, 101, 633–649. [Google Scholar] [CrossRef]
- Kim, J.B.; Brungraber, R.J. Full-Scale Lateral Load Tests of Pile Groups. J. Geotech. Eng. Div. 1976, 102, 87–105. [Google Scholar] [CrossRef]
- Ruesta, P.F.; Townsend, F.C. Evaluation of Laterally Loaded Pile Group at Roosevelt Bridge. J. Geotech. Geoenviron. Eng. 1997, 123, 1153–1161. [Google Scholar] [CrossRef]
- Rollins, K.M.; Sparks, A. Lateral Resistance of Full-Scale Pile Cap with Gravel Backfill. J. Geotech. Geoenviron. Eng. 2002, 128, 711–723. [Google Scholar] [CrossRef]
- Richards, P.W.; Rollins, K.M.; Stenlund, T.E. Experimental Testing of Pile-to-Cap Connections for Embedded Pipe Piles. J. Bridg. Eng. 2011, 16, 286–294. [Google Scholar] [CrossRef]
- Franke, E. Principles for test loading of large bored piles by horizontal loads. In Proceedings of the 8th International Conference on Soil Mechanics and Foundation Engineering, Moscow, Russia, 6–11 August 1973; Volume 2, pp. 97–104. [Google Scholar]
- Meimon, Y.; Baguelin, F.; Jezequel, J.F. Pile group behavior under long time lateral monotonic and cyclic loading. In Proceedings of the Third International conference on Numerical methods in Offshore Piling, Nantes, France, 21–22 May 1986; pp. 285–302. [Google Scholar]
- Brown, D.A.; Clark, M.; Reese, L.C. Lateral Load Behavior of Pile Group in Sand. J. Geotech. Eng. 1988, 114, 1261–1276. [Google Scholar] [CrossRef]
- Dunnavant, T.W.; Michael, W.O. Experimental P-y Model for Submerged, Stiff Clay. J. Geotech. Eng. 1989, 115, 95–114. [Google Scholar] [CrossRef]
- Chai, Y.H.; Hutchinson, T.C. Flexural Strength and Ductility of Extended Pile-Shafts. II: Experimental Study. J. Struct. Eng. 2002, 128, 595–602. [Google Scholar] [CrossRef]
- Rollins, K.M.; Olsen, K.G.; Jensen, D.H.; Garrett, B.H.; Olsen, R.J.; Egbert, J.J. Pile Spacing Effects on Lateral Pile Group Behavior: Analysis. J. Geotech. Geoenviron. Eng. 2006, 132, 1272–1283. [Google Scholar] [CrossRef]
- Rollins, K.M.; Olsen, R.J.; Elbert, J.J.; Jensen, D.H.; Olsen, K.G.; Garrett, B.H. Pile Spacing Effects on Lateral Pile Group Behavior: Load Tests. J. Geotech. Geoenviron. Eng. 2006, 132, 1262–1271. [Google Scholar] [CrossRef]
- Tuladhar, R.; Maki, T.; Mutsuyosi, H. Cyclic behavior of laterally loaded concrete piles embedded into cohesive soil. Earthq. Eng. Struct. Dyn. 2007, 37, 43–59. [Google Scholar] [CrossRef]
- Ting, J.M. Full-Scale Cyclic Dynamic Lateral Pile Responses. J. Geotech. Eng. 1987, 113, 30–45. [Google Scholar] [CrossRef]
- Blaney, G.W.; O’Neill, M.W. Procedures for Prediction of Dynamic Lateral Pile Group Response in Clay from Single Pile Tests. Geotech. Test. J. 1991, 14, 3. [Google Scholar] [CrossRef]
- Blaney, G.W.; O’Neill, M.W. Dynamic Lateral Response of a Pile Group in Clay. Geotech. Test. J. 1989, 12, 22. [Google Scholar] [CrossRef]
- Han, Y.; Vaziri, H. Dynamic response of pile groups under lateral loading. Soil Dyn. Earthq. Eng. 1992, 11, 87–99. [Google Scholar] [CrossRef]
- Novak, M.F.; Grigg, R. Dynamic experiments with small pile foundations. Can. Geotech. J. 1976, 13, 372–385. [Google Scholar] [CrossRef]
- El Shamouby, B.; Novak, M. Dynamic Experiments with Group of Piles. J. Geotech. Eng. 1984, 110, 719–737. [Google Scholar] [CrossRef]
- Hassini, S.; Woods, R.D. Dynamic experiments with model pile foundations. In Proceedings of the 12th International Conference on Soil Mechanics and Geotechnical Engineering, Rio de Janeiro, Brazil, 2–15 September 1989; pp. 1135–1138. [Google Scholar]
- El-Marsafawi, H.; Han, Y.C.; Novak, M. Dynamic Experiments on Two Pile Groups. J. Geotech. Eng. 1992, 118, 576–592. [Google Scholar] [CrossRef]
- Burr, J.P.; Pender, M.J.; Lankin, T.J. Dynamic Response of Laterally Excited Pile Groups. J. Geotech. Geoenviron. Eng. 1997, 123, 1–8. [Google Scholar] [CrossRef]
- Chau, K.T.; Shen, C.Y.; Guo, X. Nonlinear seismic soil–pile–structure interactions: Shaking table tests and FEM analyses. Soil Dyn. Earthq. Eng. 2009, 29, 300–310. [Google Scholar] [CrossRef]
- Ishimura, K.; Ohtsuki, A.; Yokoyama, K.; Koyangi, Y. Sway rocking model for simulating nonlinear response of sandy deposit with structure. In Proceedings of the 10th World Conference on Earthquake Engineering, Madrid, Spain, 19–24 July 1992; pp. 1897–1903. [Google Scholar]
- Pitilakis, D.; Dietz, M.; Wood, D.M.; Clouteau, D.; Modaressi, A. Numerical simulation of dynamic soil–structure interaction in shaking table testing. Soil Dyn. Earthq. Eng. 2008, 28, 453–467. [Google Scholar] [CrossRef]
- Pan, T.-C.; Goh, K.; Megawati, K. Empirical relationships between natural vibration period and height of buildings in Singapore. Earthq. Eng. Struct. Dyn. 2013, 43, 449–465. [Google Scholar] [CrossRef]
- Ruggieri, S.; Andrea, F.; Uva, G. A New Approach to Predict the Fundamental Period of Vibration for Newly-designed Reinforced Concrete Buildings. J. Earthq. Eng. 2021, 26, 6943–6968. [Google Scholar] [CrossRef]
- Hatzigeorgiou, G.D.; Kanapitsas, G. Evaluation of fundamental period of low-rise and mid-rise reinforced concrete buildings. Earthq. Eng. Struct. Dyn. 2013, 42, 1599–1616. [Google Scholar] [CrossRef]
- Hokmabadi, A.S.; Fatahi, B.; Samali, B. Physical Modeling of Seismic Soil-Pile-Structure Interaction for Buildings on Soft Soils. Int. J. Géoméch. 2015, 15, 04014046. [Google Scholar] [CrossRef]
- Tabatabaiefar, H.R.; Fatahi, B.; Ghabraie, K.; Zhou, W. Evaluation of numerical procedures to determine seismic response of structures under influence of soil-structure interaction. Struct. Eng. Mech. 2015, 56, 27–47. [Google Scholar] [CrossRef]
- El Hoseny, M.; Ma, J.; Dawoud, W.; Forcellini, D. The role of soil structure interaction (SSI) on seismic response of tall buildings with variable embedded depths by experimental and numerical approaches. Soil Dyn. Earthq. Eng. 2023, 164, 107583. [Google Scholar] [CrossRef]
- Patil, G.; Choudhury, D.; Mondal, A. Three-Dimensional Soil–Foundation–Superstructure Interaction Analysis of Nuclear Building Supported by Combined Piled–Raft System. Int. J. Géoméch. 2021, 21, 04021029. [Google Scholar] [CrossRef]
- IS 875-Part 1; Code of Practice for Design Loads (Other Than Earthquake) for Buildings and Structures—Dead Loads—Unit Weights of Building Materials and Stored Materials. Reaffirmed (2018); Bureau of Indian Standards: New Delhi, India, 1987.
- IS 875-Part 2; Code of Practice for Design Loads (Other Than Earthquake) for Buildings and Structures—Imposed Loads. Reaffirmed (2018); Bureau of Indian Standards: New Delhi, India, 1987.
- IS 1893-Part 1; Criteria for Earthquake Resistant Design of Structures—General Provisions and Buildings. Bureau of Indian Standards: New Delhi, India, 2016.
- IS 456; Plain and Reinforced Concrete—Code of Practice. Reaffirmed (2005); Bureau of Indian Standards: New Delhi, India, 2000.
- SAP2000, Computer Software; Computers and Structures: California, CA, USA, 2019.
- IS 2720-Part 3; Methods of Tests for Soils—Determination of Specific Gravity—Fine Grained Soils. Sec 1—Reaffirmed (2016); Bureau of Indian Standards: New Delhi, India, 1980.
- IS 2720-Part 14; Determination of Density Index (Relative Density) of Cohesionless Soils. Reaffirmed (2020); Bureau of Indian Standards: New Delhi, India, 1983.
- IS 2720-Part 13; Direct Shear Test. Reaffirmed (2016); Bureau of Indian Standards: New Delhi, India, 1986.
- IS 2720-Part 4; Methods of Tests for Soils—Grain Size Analysis. Reaffirmed (2020); Bureau of Indian Standards: New Delhi, India, 1985.
- D2487-17; Standard Practice for Classification of Soils for Engineering Purposes (Unified Soil Classification System). ASTM: West Conshohocken, PA, USA, 2020.
- IS 2911-Part 1/Sec 2; Design and Construction of Pile Foundations—Code of Practice. Bureau of Indian Standards: New Delhi, India, 2010.
- Wood, D.M.; Crewe, A.; Taylor, C. Shaking table testing of geotechnical models. Int. J. Phys. Model. Geotech. 2002, 2, 1–13. [Google Scholar] [CrossRef]
- Gazetas, G. Vibrational characteristics of soil deposits with variable wave velocity. Int. J. Numer. Anal. Methods Géoméch. 1982, 6, 1–20. [Google Scholar] [CrossRef]
- Taylor, C.A.; Dar, A.R.; Crewe, A.J. Shaking Table modelling of seismic geotechnical problems. In Proceedings of the 10th European Conference on Earthquake Engineers, Vienna, Austria, 28 August–2 September 1995; pp. 441–446. [Google Scholar]
- Tao, X.; Kagawa, T.; Minowa, C.; Abe, A. Verification of dynamic soil-pile interaction. In Geotechnical Earthquake Engineering and Soil Dynamics III; Dakoulas, P., Yegian, M.K., Holtz, R.D., Eds.; ASCE: Reston, VA, USA, 1998; pp. 1199–1210. [Google Scholar]
- Jakrapiyanun, W. Physical Modelling of Dynamics Soil-Foundation-Structure Interaction using a Laminar Container. Ph.D. Thesis, University of California, San Diego, CA, USA, 2002. [Google Scholar]
- Prasad, S.; Towhata, I.; Chandradhara, G.; Nanjundaswamy, P. Shaking table tests in earthquake geotechnical engineering. Curr. Sci. 2004, 87, 1398–1404. [Google Scholar]
- Tang, L.; Ling, X.; Xu, P.; Gao, X.; Wang, D. Shake table test of soil-pile groups-bridge structure interaction in liquefiable ground. Earthq. Eng. Eng. Vib. 2010, 9, 39–50. [Google Scholar] [CrossRef]
- Chen, J.; Shi, X.; Li, J. Shaking table test of utility tunnel under non-uniform earthquake wave excitation. Soil Dyn. Earthq. Eng. 2010, 30, 1400–1416. [Google Scholar] [CrossRef]
- Lee, C.-J.; Wei, Y.C.; Kuo, Y.C. Boundary effects of a laminar container in centrifuge shaking table tests. Soil Dyn. Earthq. Eng. 2012, 34, 37–51. [Google Scholar] [CrossRef]
- Massimino, M.R.; Maugeri, M. Physical modelling of shaking table tests on dynamic soil–foundation interaction and numerical and analytical simulation. Soil Dyn. Earthq. Eng. 2013, 49, 1–18. [Google Scholar] [CrossRef]
- Kumar, M.; Mishra, S.S. Study of seismic response characteristics of building frame models using shake table test and considering soil–structure interaction. Asian J. Civ. Eng. 2019, 20, 409–419. [Google Scholar] [CrossRef]
- Kramer, S.L. Geotechnical Earthquake Engineering; Prentice Hall: Upper Saddle River, NJ, USA, 1996. [Google Scholar]
- Kumar, A.; Choudhary, D.; Katzenbach, R. Effect of Earthquake on Combined Pile–Raft Foundation. Int. J. Géoméch. 2016, 16, 04016013. [Google Scholar] [CrossRef]
- Gohl, W.B.; Finn, W.D.L. Seismic response of single piles in shaking table studies. In Proceedings of the 5th Canadian Conference on Earthquake Engineering, Ottawa, ON, Canada, 6–8 July 1987; pp. 435–444. [Google Scholar]
- Valsangkar, A.; Dawe, J.; Mita, K. Shake Table Studies of Seismic Response of Single Partially Supported Piles; University of Toronto: Toronto, ON, Canada, 1991; pp. 327–334. [Google Scholar] [CrossRef]
- Chandrasekaran, S.S.; Boominathan, A.; Dodagoudar, G.R. Dynamic Response of Laterally Loaded Pile Groups in Clay. J. Earthq. Eng. 2012, 17, 33–53. [Google Scholar] [CrossRef]
- Sulaeman, N. The Use of Lightweight Concrete Piles for Deep Foundation on Soft Soils. Ph.D. Thesis, University in Tun Hussein Onn, Johor, Malaysia, 2010. [Google Scholar]
- IS 2062; Hot Rolled Medium and High Tensile Structural Steel—Specification. Bureau of Indian Standards: New Delhi, India, 2011.
- Salgado, R. The mechanics of cone penetration: Contributions from experimental and theoretical studies. In Geotechnical and Geophysical Site Characterization 4 (ISC-4); CRC Press: London, UK, 2012; pp. 131–135. [Google Scholar] [CrossRef]
- Memar, M.; Zomorodian, S.M.A.; Vakili, A.M. Effect of pile cross-section shape on pile group behaviour under lateral loading in sand. Int. J. Phys. Model. Geotech. 2020, 20, 308–319. [Google Scholar] [CrossRef]
- Bao, Y.; Ye, G.; Ye, B.; Zhang, F. Seismic evaluation of soil–foundation–superstructure system considering geometry and material nonlinearities of both soils and structures. Soils Found. 2012, 52, 257–278. [Google Scholar] [CrossRef]
- Kanaujia, V.K.; Ayothiraman, R.; Matsagar, V.A. Influence of superstructure flexibility on seismic response of pile foundation in sand. In Proceedings of the 15th World Conference on Earthquake Engineering, Lisboa, Portugal, 24–28 September 2012. [Google Scholar]
- Paz, M. Structural Dynamics—Theory and Computation; CBS Publishers and Distributers Pvt. Ltd.: New Delhi, India, 2004. [Google Scholar]
- Holzner, S. Physics for Dummies; Wiley Publishing, Inc.: Indianapolis, IN, USA, 2006. [Google Scholar]
- Boominathan, A.; Ayothiraman, R. Measurement and Analysis of Horizontal Vibration Response of Pile Foundations. Shock Vib. 2007, 14, 89–106. [Google Scholar] [CrossRef] [Green Version]
- Durante, M.G.; Di Sarno, L.; Mylonakis, G.; Taylor, C.A.; Simonelli, A.L. Soil-pile-structure interaction: Experimental outcomes from shaking table tests. Earthq. Eng. Struct. Dyn. 2015, 45, 1041–1061. [Google Scholar] [CrossRef] [Green Version]
- Visuvasam, J.; Chandrasekaran, S.S. Effect of soil–pile–structure interaction on seismic behaviour of RC building frames. Innov. Infrastruct. Solut. 2019, 4, 45. [Google Scholar] [CrossRef]
- American Society of Civil Engineers. Minimum Design Loads and Associated Criteria for Buildings and Other Structures; American Society of Civil Engineers: Reston, VA, USA, 2017. [Google Scholar]
- Council, Building Seismic Safety. NEHRP Guidelines for the Seismic Rehabilitation of Buildings: Prepared for the Building Seismic Safety Council; FEMA: Washington, DC, USA, 1997.


| Length (mm) | Density (kg/m3) | Volume (m3) | Stiffness (N/m) | Frequency (Hz) |
|---|---|---|---|---|
| 1/n | 1 | 1/n3 | 1/n2 | n1/2 |
Publisher’s Note: MDPI stays neutral with regard to jurisdictional claims in published maps and institutional affiliations. |
© 2022 by the authors. Licensee MDPI, Basel, Switzerland. This article is an open access article distributed under the terms and conditions of the Creative Commons Attribution (CC BY) license (https://creativecommons.org/licenses/by/4.0/).
Share and Cite
Visuvasam, J.A.; Chandrasekaran, S.S. Effect of Spacing and Slenderness Ratio of Piles on the Seismic Behavior of Building Frames. Buildings 2022, 12, 2050. https://doi.org/10.3390/buildings12122050
Visuvasam JA, Chandrasekaran SS. Effect of Spacing and Slenderness Ratio of Piles on the Seismic Behavior of Building Frames. Buildings. 2022; 12(12):2050. https://doi.org/10.3390/buildings12122050
Chicago/Turabian StyleVisuvasam, Joseph Antony, and Sembulichampalayam Sennimalai Chandrasekaran. 2022. "Effect of Spacing and Slenderness Ratio of Piles on the Seismic Behavior of Building Frames" Buildings 12, no. 12: 2050. https://doi.org/10.3390/buildings12122050
APA StyleVisuvasam, J. A., & Chandrasekaran, S. S. (2022). Effect of Spacing and Slenderness Ratio of Piles on the Seismic Behavior of Building Frames. Buildings, 12(12), 2050. https://doi.org/10.3390/buildings12122050