5.1. Simulation Approach
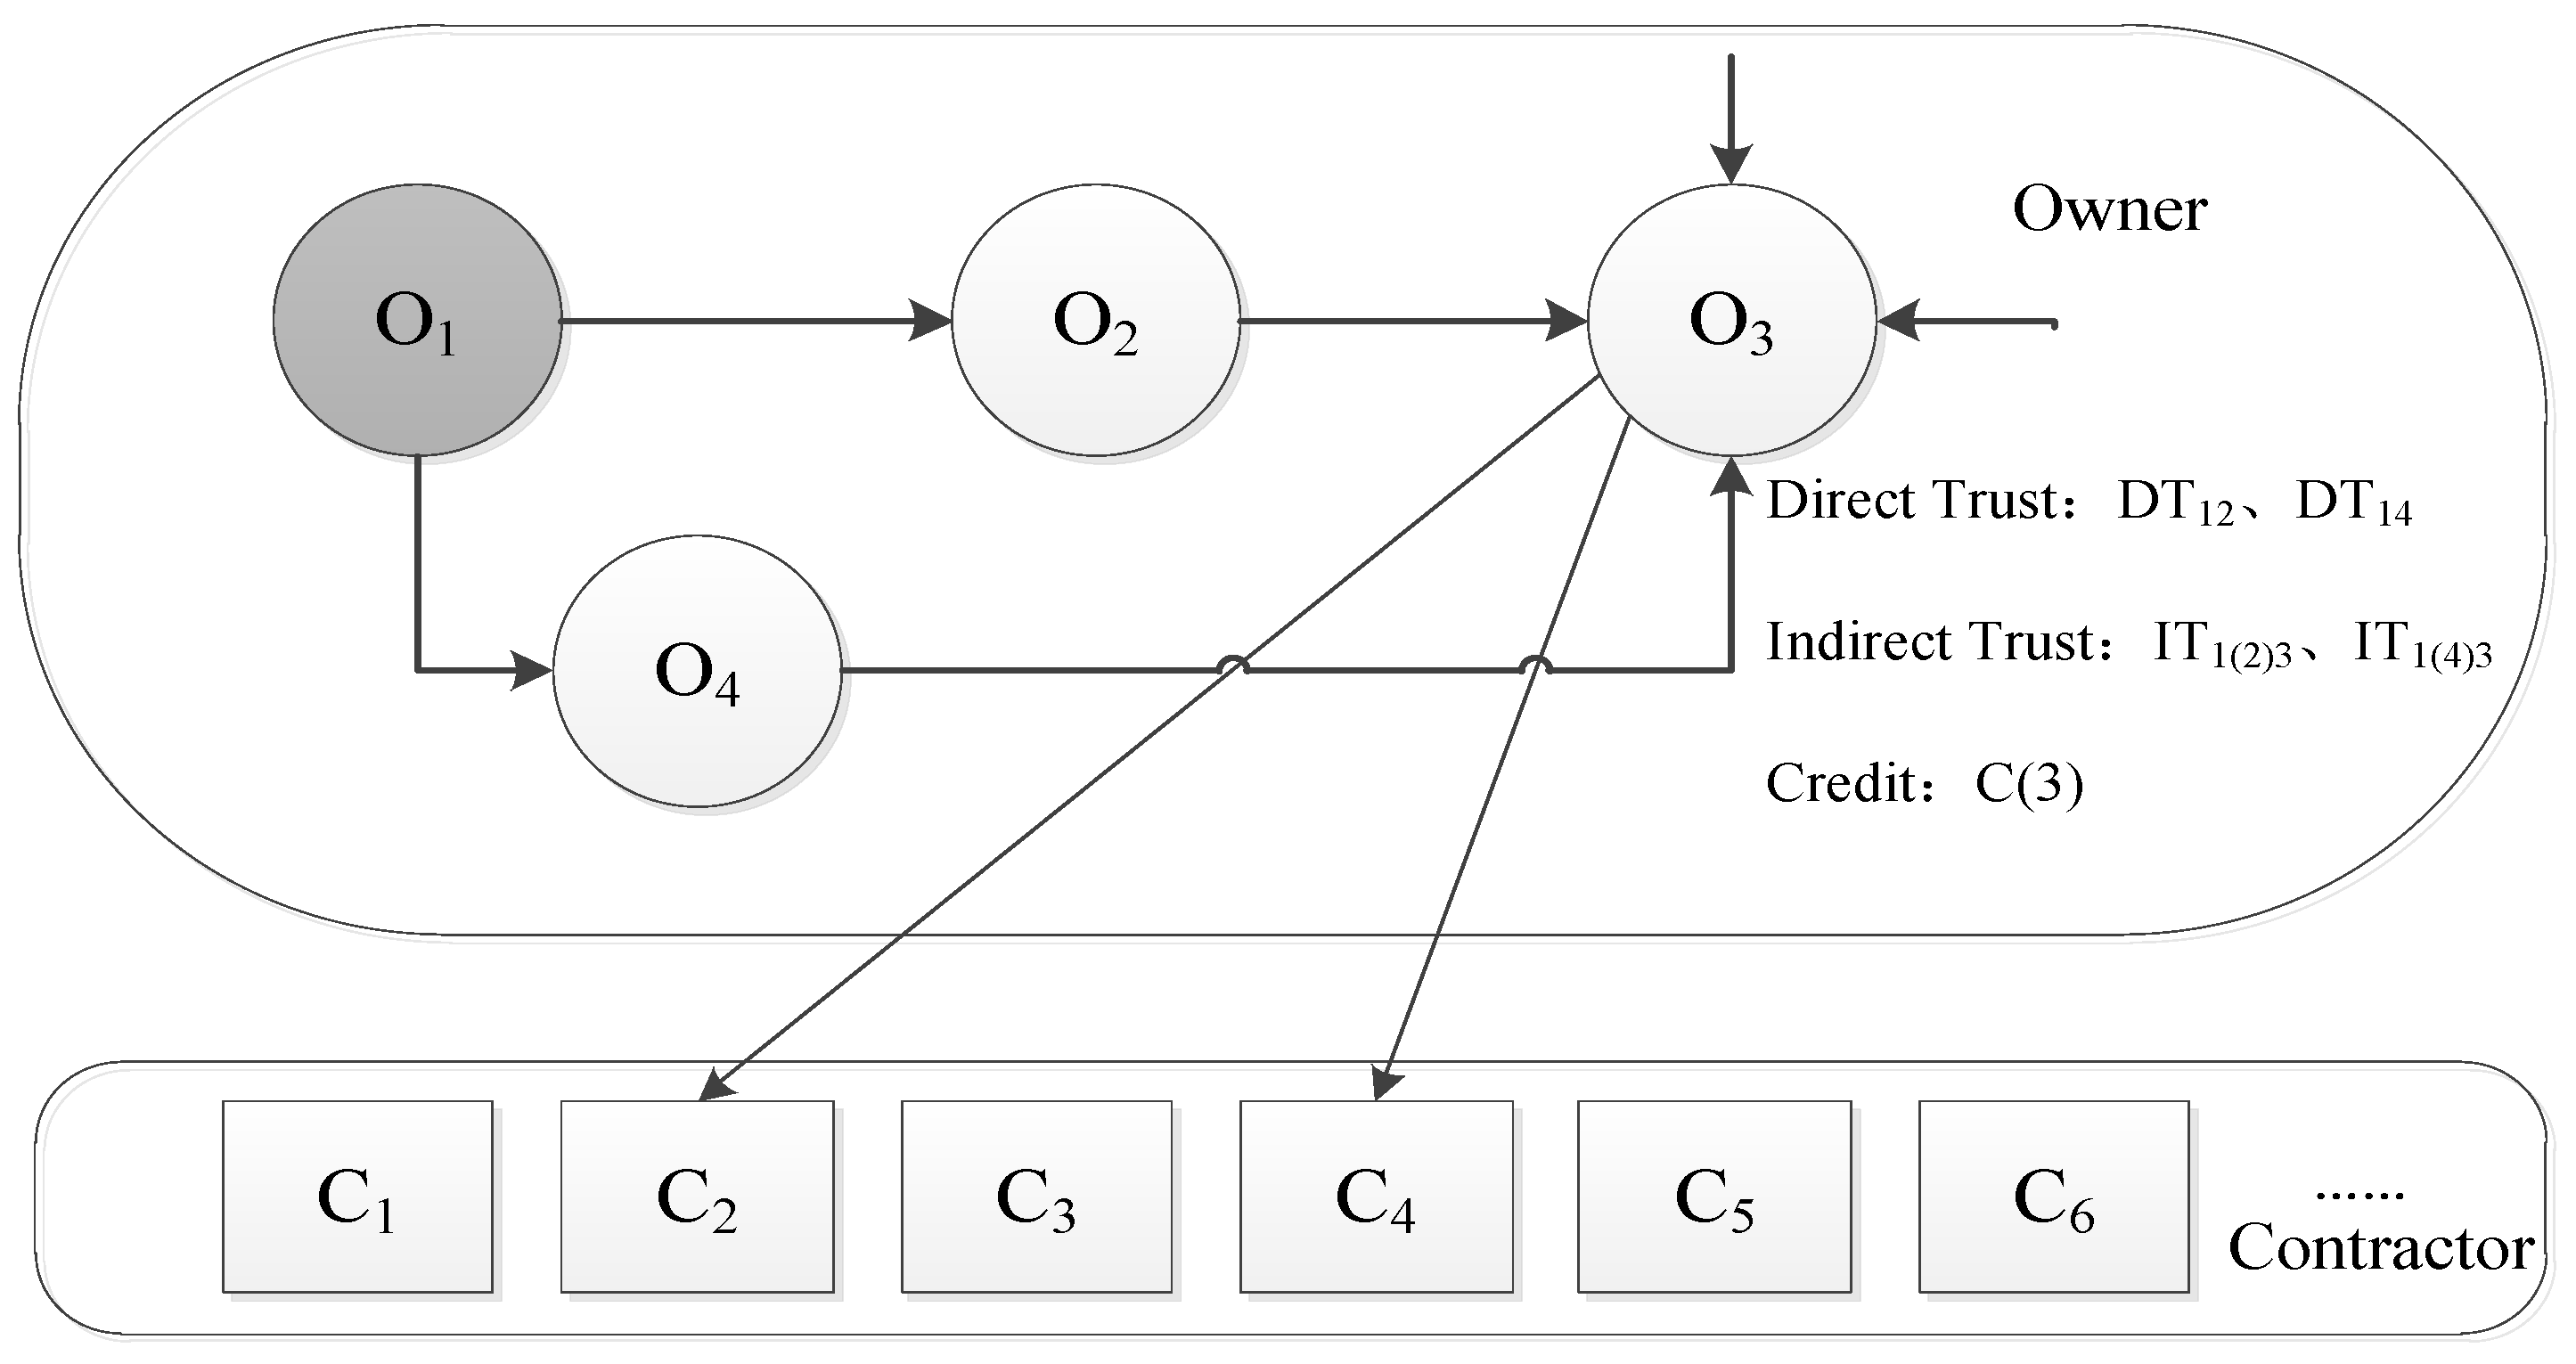
In this work, the nodes in the simulation system were grouped into two categories, classes O and C, representing the virtual owners and virtual contractors, respectively. Here, the owners included the decision owners and target owners, whereas class O nodes were divided into request and response nodes. After interacting with each other in a class O hierarchy, a neighbor set was formed, which could query related nodes in the class C hierarchy and feed them back to the class O hierarchy. The C level could answer the O level query request.
Table 2 lists the interpretations of all the nodes used in the simulation system. The neighbor set of the class O request nodes depended on the feedback results from the class O response nodes, and the query of the class O request nodes to the class C nodes was related to the class O response nodes. Depending on the scenario, the class O nodes might be of different node types.
For a project to be performed at any given location, owner O1 intends to choose the most suitable Cx as the object of cooperation from many contractors, that is, C1, C2, C3, C4, …, Cn. According to the modeling idea proposed herein, first, node O1 sends a response to the query request of O2, O3, O4, …, Om, and all the class O nodes that have interacted with O1 respond; these are denoted as Ot1. The number of third-party owners is less than or equal to three, and the longest path to reach the target owner is four. Here, Ot1 issues a query request to the class O nodes, and the class O nodes that have interacted with Ot1, excluding O1, generate a response, which is denoted as Ot2, and so on. It is likely that Ot1, Ot2, Ot3, and Ot4 are neighbors of owner O1. According to the comprehensive trust calculation rule, a trust score for the class O response node can be obtained. Class O response nodes with high comprehensive trust are selected as the neighbor set of the class O request node O1, which are assumed to be O2, O3, and O4. Here, O2, O3, and O4 send requests to the class C nodes, and all the class C nodes that have interacted with O2, O3, and O4 respond and feed back to the class O requesting node O1. According to the calculation rules for the credit score, class C nodes with high credit scores, such as C1 and C2, are obtained to form the contractor recommendation list. The selection range of contractors is narrowed, and thus owner O1 can compare C1 and C2 to make the final decision. At this point, the credit network recommendation model, constructed using the collaborative filtering algorithm of the owner, completes one iteration. Here, the effectiveness of the built model was proved by simulating the process of the owner choosing the contractor.
5.2. Simulation Hypothesis
We considered a certain city with a moderately difficult and medium-sized project issued by the owner and that the best partner must be chosen from 10 selected contractors. Further, we assumed that the owner had no past cooperation with these 10 contractors and knew nearly nothing about their performance and abilities. Thereafter, the credit evaluation of the contractors by owners who had cooperated with them was used to eliminate contractor candidates with poor credit. The number of other owners who had direct or indirect contact with the owner was 99.
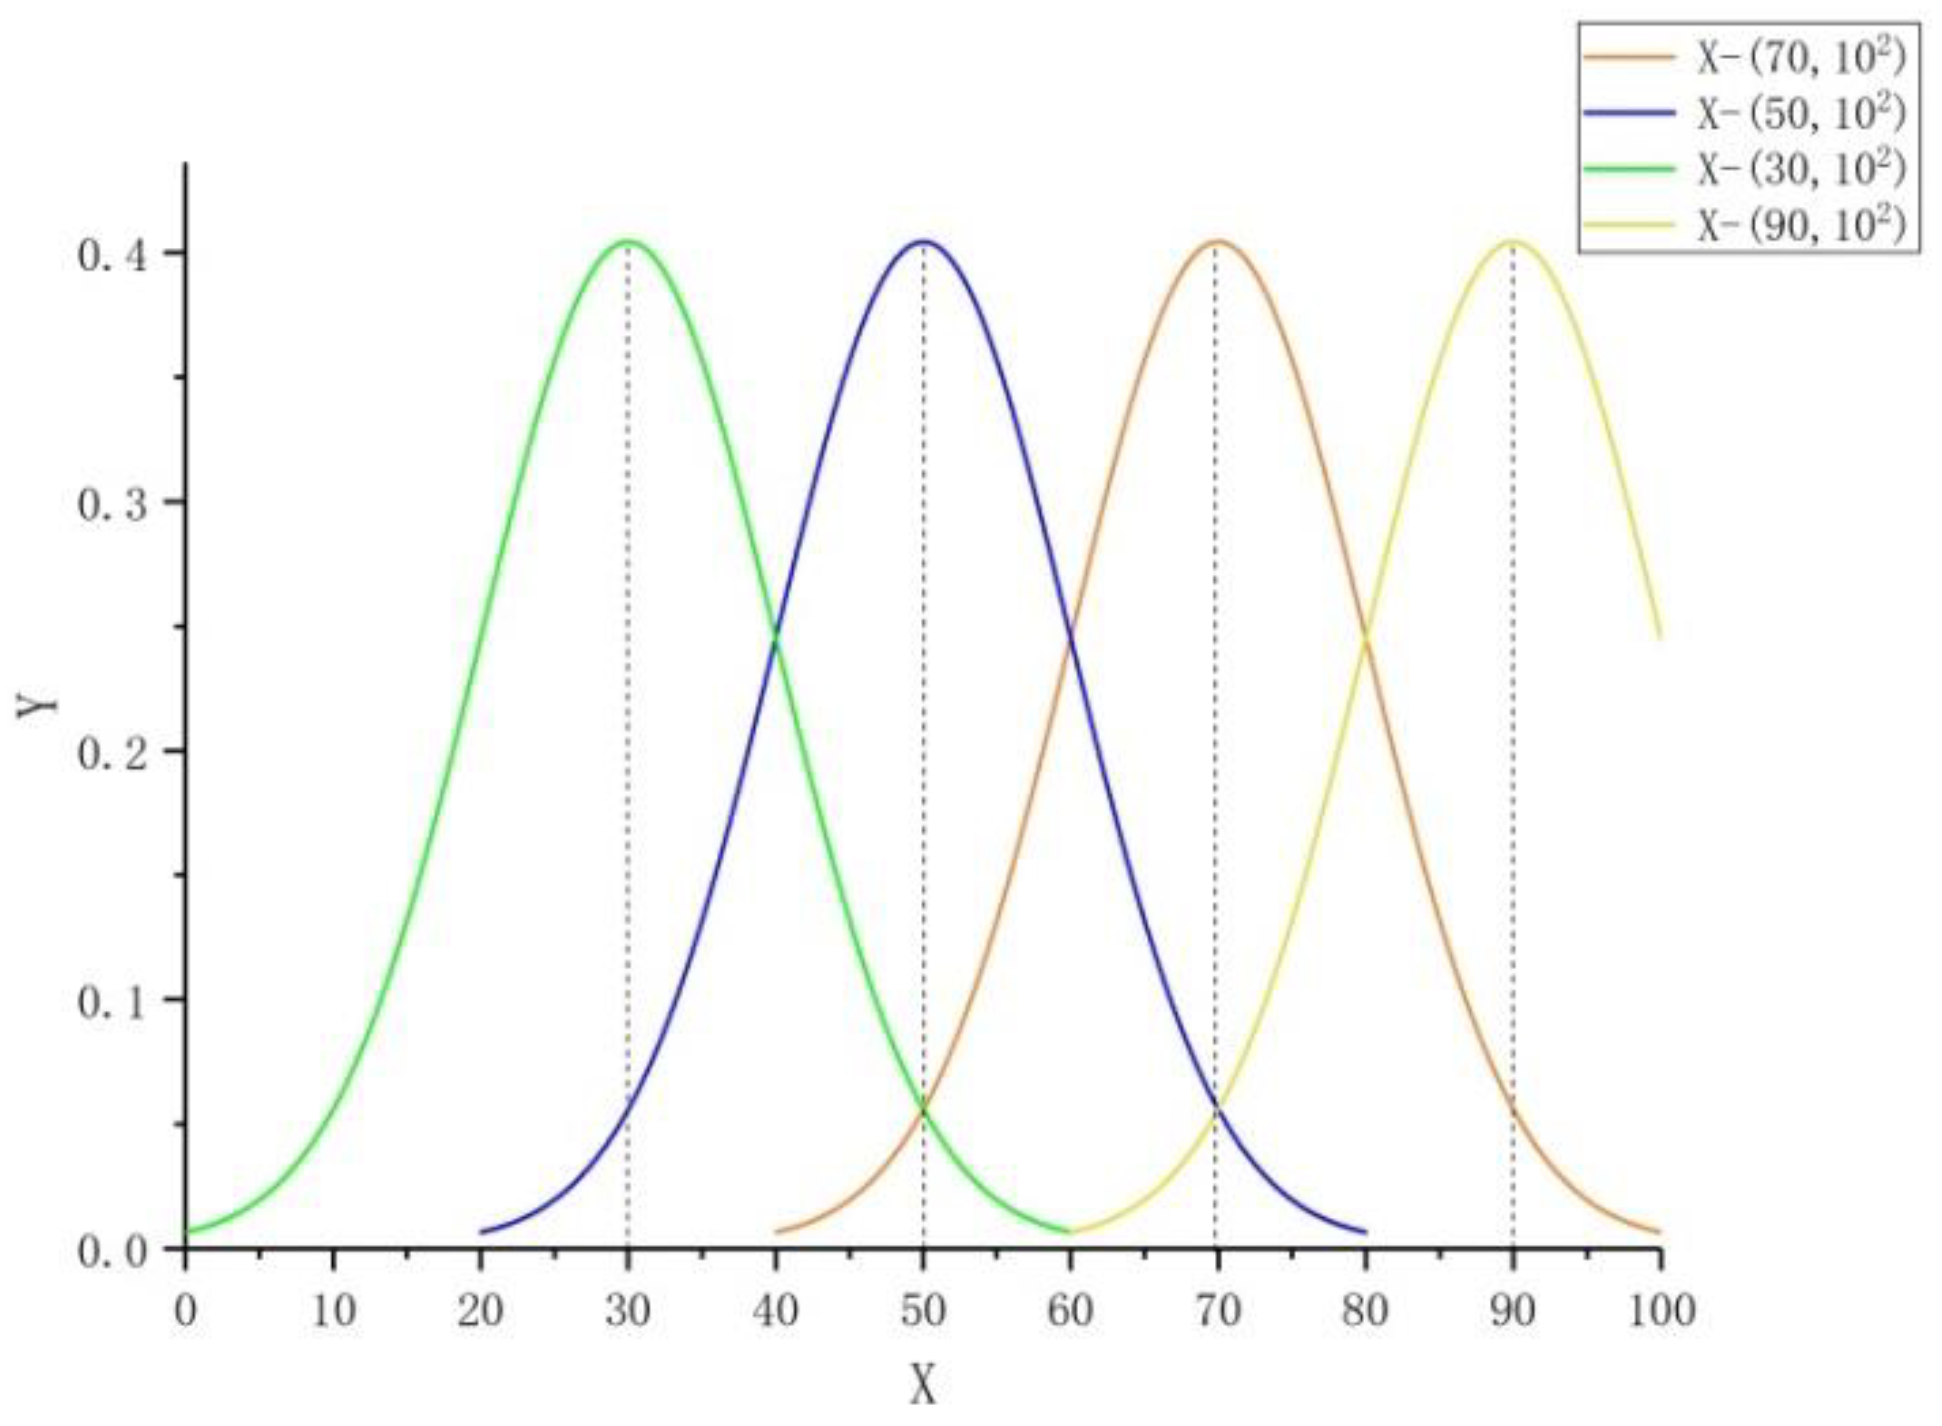
The abilities and behaviors of the contractors are the primary reasons for their inherent attributes that do not change with the trust evaluation. The value range of the inherent attributes of trust of the contractors was set as [0, 100], where 100 represented excellent performance and a very high level. Meanwhile, zero implied that the contractor was extremely poor and had no advantage in almost any aspect. According to the normal distribution with a mean value of 70, the inherent attributes of trust were randomly assigned to class C nodes, representing the capability value of each contractor; these inherent attribute values of trust obeyed X − N (70, 102).
5.3. Simulation Process
According to the abovementioned simulation conditions, the simulation process was defined using the design links, as illustrated in
Figure 9.
5.3.1. Trust Evaluation between Owners
After determining the inherent attribute of the trust evaluation factor of the class O node, the respective credit value could be calculated. The intrinsic attributes of the trust evaluation factor of class O nodes followed X − N (0.7, 0.1
2), as shown in
Figure 10. The specific steps were as follows. Firstly, a random O class node was simulated, based on the inherent nature of the trust evaluation factor value, which determined the performance of cooperation. If TE ≥ 0.6, then O had a better ability, indicating the trust evaluation assignment s = 1, which suggested that the other O nodes provided positive opinions. If TE < 0.6, then s = −1, which suggested that the other O nodes provided negative opinions. According to the logic of the PageRank algorithm, the PR value of O was calculated and sorted, that is, the value and order of the credit.
5.3.2. Owner’s Assessment of Trust in Contractor
The simulation system randomly selected a class C node and assigned it the trust inherent attribute value, according to the law of normal distribution. Based on the trust inherent attribute value, a normal distribution with a standard deviation of 10 was used to form the trust evaluation distribution of this node; some distributions were selected for the trust evaluation for the class C node from the class O nodes, as shown in
Figure 11.
The credit scores obtained using the contractor-type nodes after the simulation were sorted to represent the calculation results of the model. The similarity h between the actual scenario and simulations was compared based on the set measurement. The number of intersection elements in the sets corresponding to the two sequences at different depths may differ. The similarity of the sorted list could then be obtained using the average intersection ratios at different depths. If the similarity was high, then the simulation results were consistent with the results of the actual situation.
5.3.3. Owner’s Neighbor Set
The owner set formed by Ot1, Ot2, Ot3, and Ot4 reduced the number of owners according to the trust value, and as a result, the owners who were less connected with the decision owner were excluded; the number of owners was reduced by a factor of one-third and sorted according to the CTV. By comparing the similarity of the contractor trust assessments between request node O1 and response nodes Ot1, Ot2, Ot3, and Ot4, the number of owners in the owner set was further reduced by one-half to form the owner neighbor set with one-third of the original Ot1, Ot2, Ot3, and Ot4 owners, according to the ranking of the comprehensive trust degree.
5.3.4. Owner Chooses a Contractor
Here, Ot1, Ot2, Ot3, and Ot4 in the neighbor set provided recommendations to the class C nodes with which requesting node O1 intended to cooperate, assuming that C1 was one of them. The selected O-type nodes that had interacted with C1 in the neighbor set formed set NC1. Each O-type node in NC1 had a trust evaluation for C1. The trust score followed a normal distribution with the trust inherent attribute of C1, with a mean and standard deviation of 10. Owing to the high reliability of the O-type nodes in NC1, the random value range of the trust score was (μ − 10, μ + 10). The average value of the trust scores of the class O nodes in NC1 with regard to the class C nodes that had interacted was calculated according to the number of class C nodes that had interacted with this recommendation. Here, O1 took the trust inherent attribute as the trust evaluation value for the C-type nodes that had responded. The comprehensive trust degree of O1 to O-type nodes in NC1 was combined to form the credit score of O1 to C1.
5.4. Simulation Results
We assumed that the decision-making owner was aggressive. In the construction market, there was approximately one direct communication among every five owners, and the probability of direct interactions between the owner-type nodes was 20%. Furthermore, there were up to four iterations when calculating IT. The number of properties of the owner-type node was 10, and the O-type nodes in the neighbor set had a complete evaluation of the 10 C-type nodes. The simulation of the program yielded the following results.
The decision-making owner evaluated the CTV and similarity of other connected owners to form a comprehensive trust degree, and they collected the top 34 owners with high comprehensive trust degrees as members of the neighbor set.
Table 3 lists the CTVs of the decision-making owners with respect to the other owners,
Table 4 presents the evaluation of the similarity of the decision-making owners to some owners, and
Table 5 shows the comprehensive trust of the decision-making owners in their neighboring owners, in a descending order.
Table 6 shows the inherent attributes of trust assigned to a contractor by random values, according to the normal distribution curve of X − N (70, 10
2). This was processed in descending order according to the inherent property of contractor trust, and two decimal digits were reserved as the evaluation standards for the contractor ability, quality, and morality levels in actual situations. Here, C
8, C
6, and C
2 had high trust inherent property values and were ideal partners for cooperation; by contrast, C
3, C
4, C
9, and C
10 had low trust inherent property values, and the decision-making owner did not expect to cooperate with them.
Table 7 presents the trust evaluation of an owner with ID 33 for 10 different contractors.
Table 8 compares the rankings between the inherent attributes of trust and the contractor’s credit scores assigned by the decision-making owner.
Table 9 shows the similarity h obtained via the method of set measurements.
From
Table 9, it is evident that h = 0.969 > 0.75, which indicates that the similarity between the two sequences is high, and the simulation results reflect the credit level of a contractor.
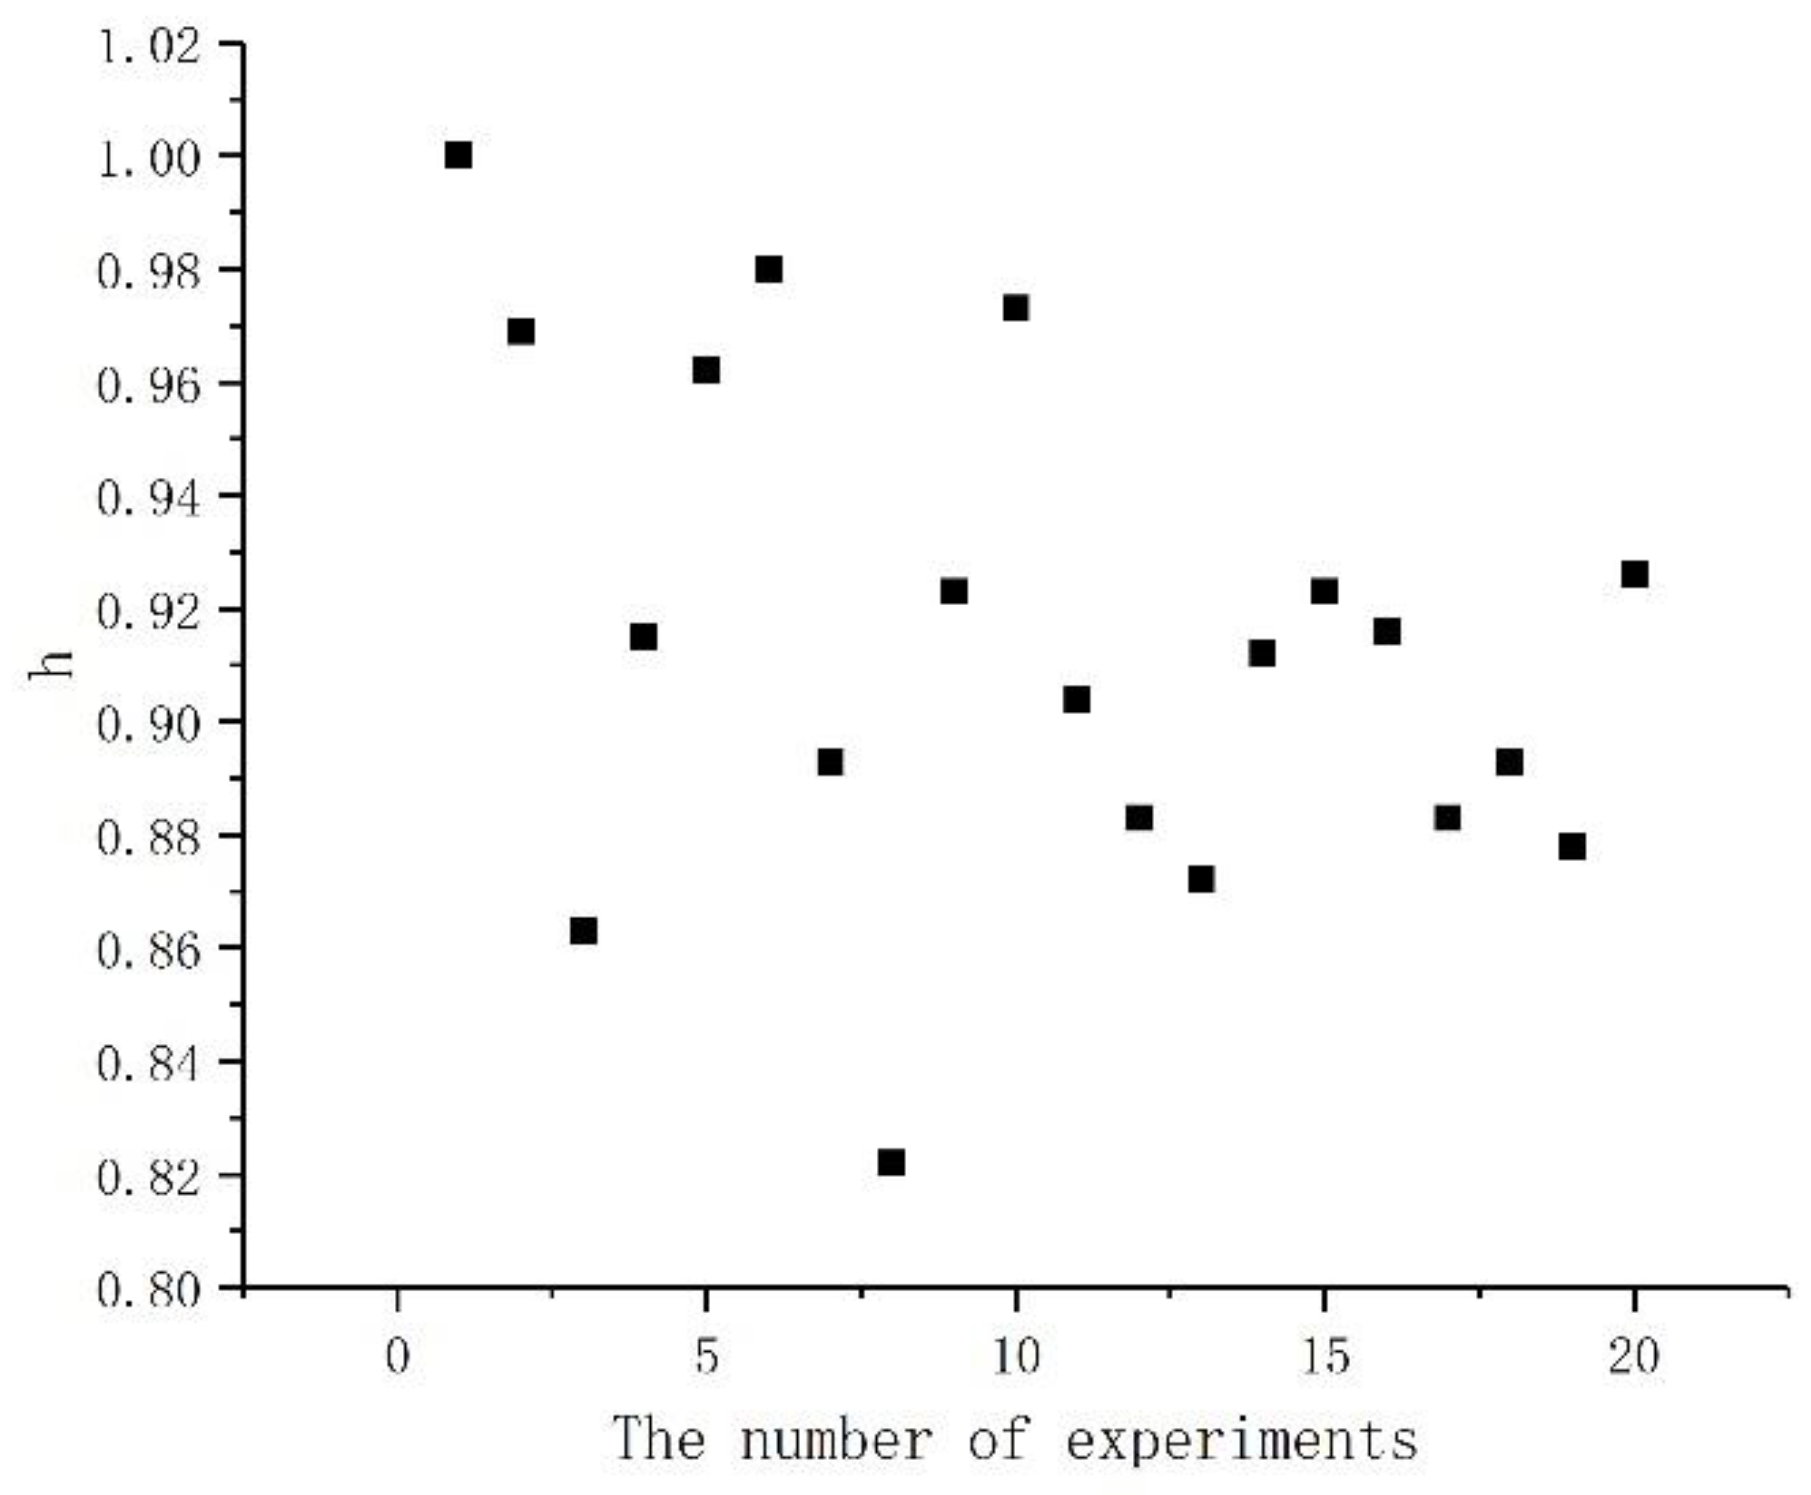
Figure 12 shows a scatter plot of the similarity h obtained after performing multiple simulations. According to the distribution, the similarity is concentrated around 0.9, which verifies the effectiveness of the model.
According to the credit scores listed, contractors C8, C6, and C2 had better evaluations and were the top three candidates in the recommendation list. Their ranking was the same as that of the intrinsic contractor’s trust properties. The ranking results were similar to those in the actual scenario, indicating that the model and simulation experiments could narrow the scope of contractor selection and reflect the capability and quality of the contractors in terms of serving the decision-making owner. The credit scores for C3, C4, C9, and C10 were lower, and they failed to meet the requirements of the decision-making owner. Hence, they were replaced with better contractors, which was also in agreement with the actual scenario. Based on the simulation results, ranking errors, such as those for C5 and C7, were because the inherent trust values of these contractors were relatively similar; in such cases, the sensitivity of the model was weakened. Thus, it was difficult to identify their true ranking. For contractors with a large difference in their inherent trust values, the model could provide ranking results that were consistent with the actual scenario. Thus, the basic ranking of the credit of a contractor could be calculated using this credit network recommendation model.
