1. Introduction
The mechanism and design theory considering the utilization of soil below the raft to bear a part of the total applied load in piled raft foundation has been a research hotspot for more than half a century [
1,
2]. A large number of theoretical studies, experimental studies, and numerical studies have carried out in-depth explorations of the bearing characteristics of a piled raft foundation [
3,
4,
5], and different optimized design methods for a composite pile foundation on soft clay subjected to vertical loads have been reported in the literature [
6,
7,
8,
9]. All of the above-mentioned works require that the pile foundation be close to its ultimate bearing capacity, thereby enforcing the pile tip piercing downward to achieve the compatible deformation between piles and soil [
10].
In some cases, a cushion with a finite thickness may be laid on the top of the pile to make the pile top penetrate into the cushion so that the soil between the piles can work better [
11,
12,
13]. However, it is still difficult to use for end bearing piles due to the limited role of the cushion. As the stiffness of pile and soil varies significantly, the differential deformation between pile and soil is large and cannot be easily coordinated, which is one of the major concerns in the end bearing pile foundation [
14]. To solve this issue and to realize the pile-soil interaction, Zhou et al. [
15] developed an optimization device called a deformation adjustor, which is placed between the top of the piles and the raft. This technique is able to accomplish the optimization of load distribution between soils and piles in complicated soil conditions. In recent years, this technique has been applied in more than twenty high-rise building projects in China [
16,
17,
18].
Accordingly, this paper presents a case study on applying deformation adjustors to improve the performance of piled raft foundations in complicated soil conditions. In the original design of piled raft foundations, the majority of the total applied loads were carried by piles, while piles were prevented from being installed to the required depth due to the number of large boulders. Consequently, this technique (using deformation adjustors) was used for such a challenging project. The design scheme of a piled raft foundation with deformation adjustors in this case was presented briefly. Then, the numerical results were compared with the monitoring results for raft settlements, earth pressures, deformation amount of deformation adjustors, pile top reactions, and load-sharing ratios between soils and piles during and after construction, which proved that a piled raft foundation with deformation adjustors was an effective and economical design scheme in complicated soil conditions. Through this study, we expect to provide a reference for improving the performance of piled raft foundations.
2. Project Information and Site Conditions
The project is located in Xiamen, China, and was for the construction of two high-rise residential buildings (building A and building B) with a total construction area of 38,000 m
2. The case described herein focuses on the piled raft system of building A with a height of 120 m, as shown in
Figure 1.
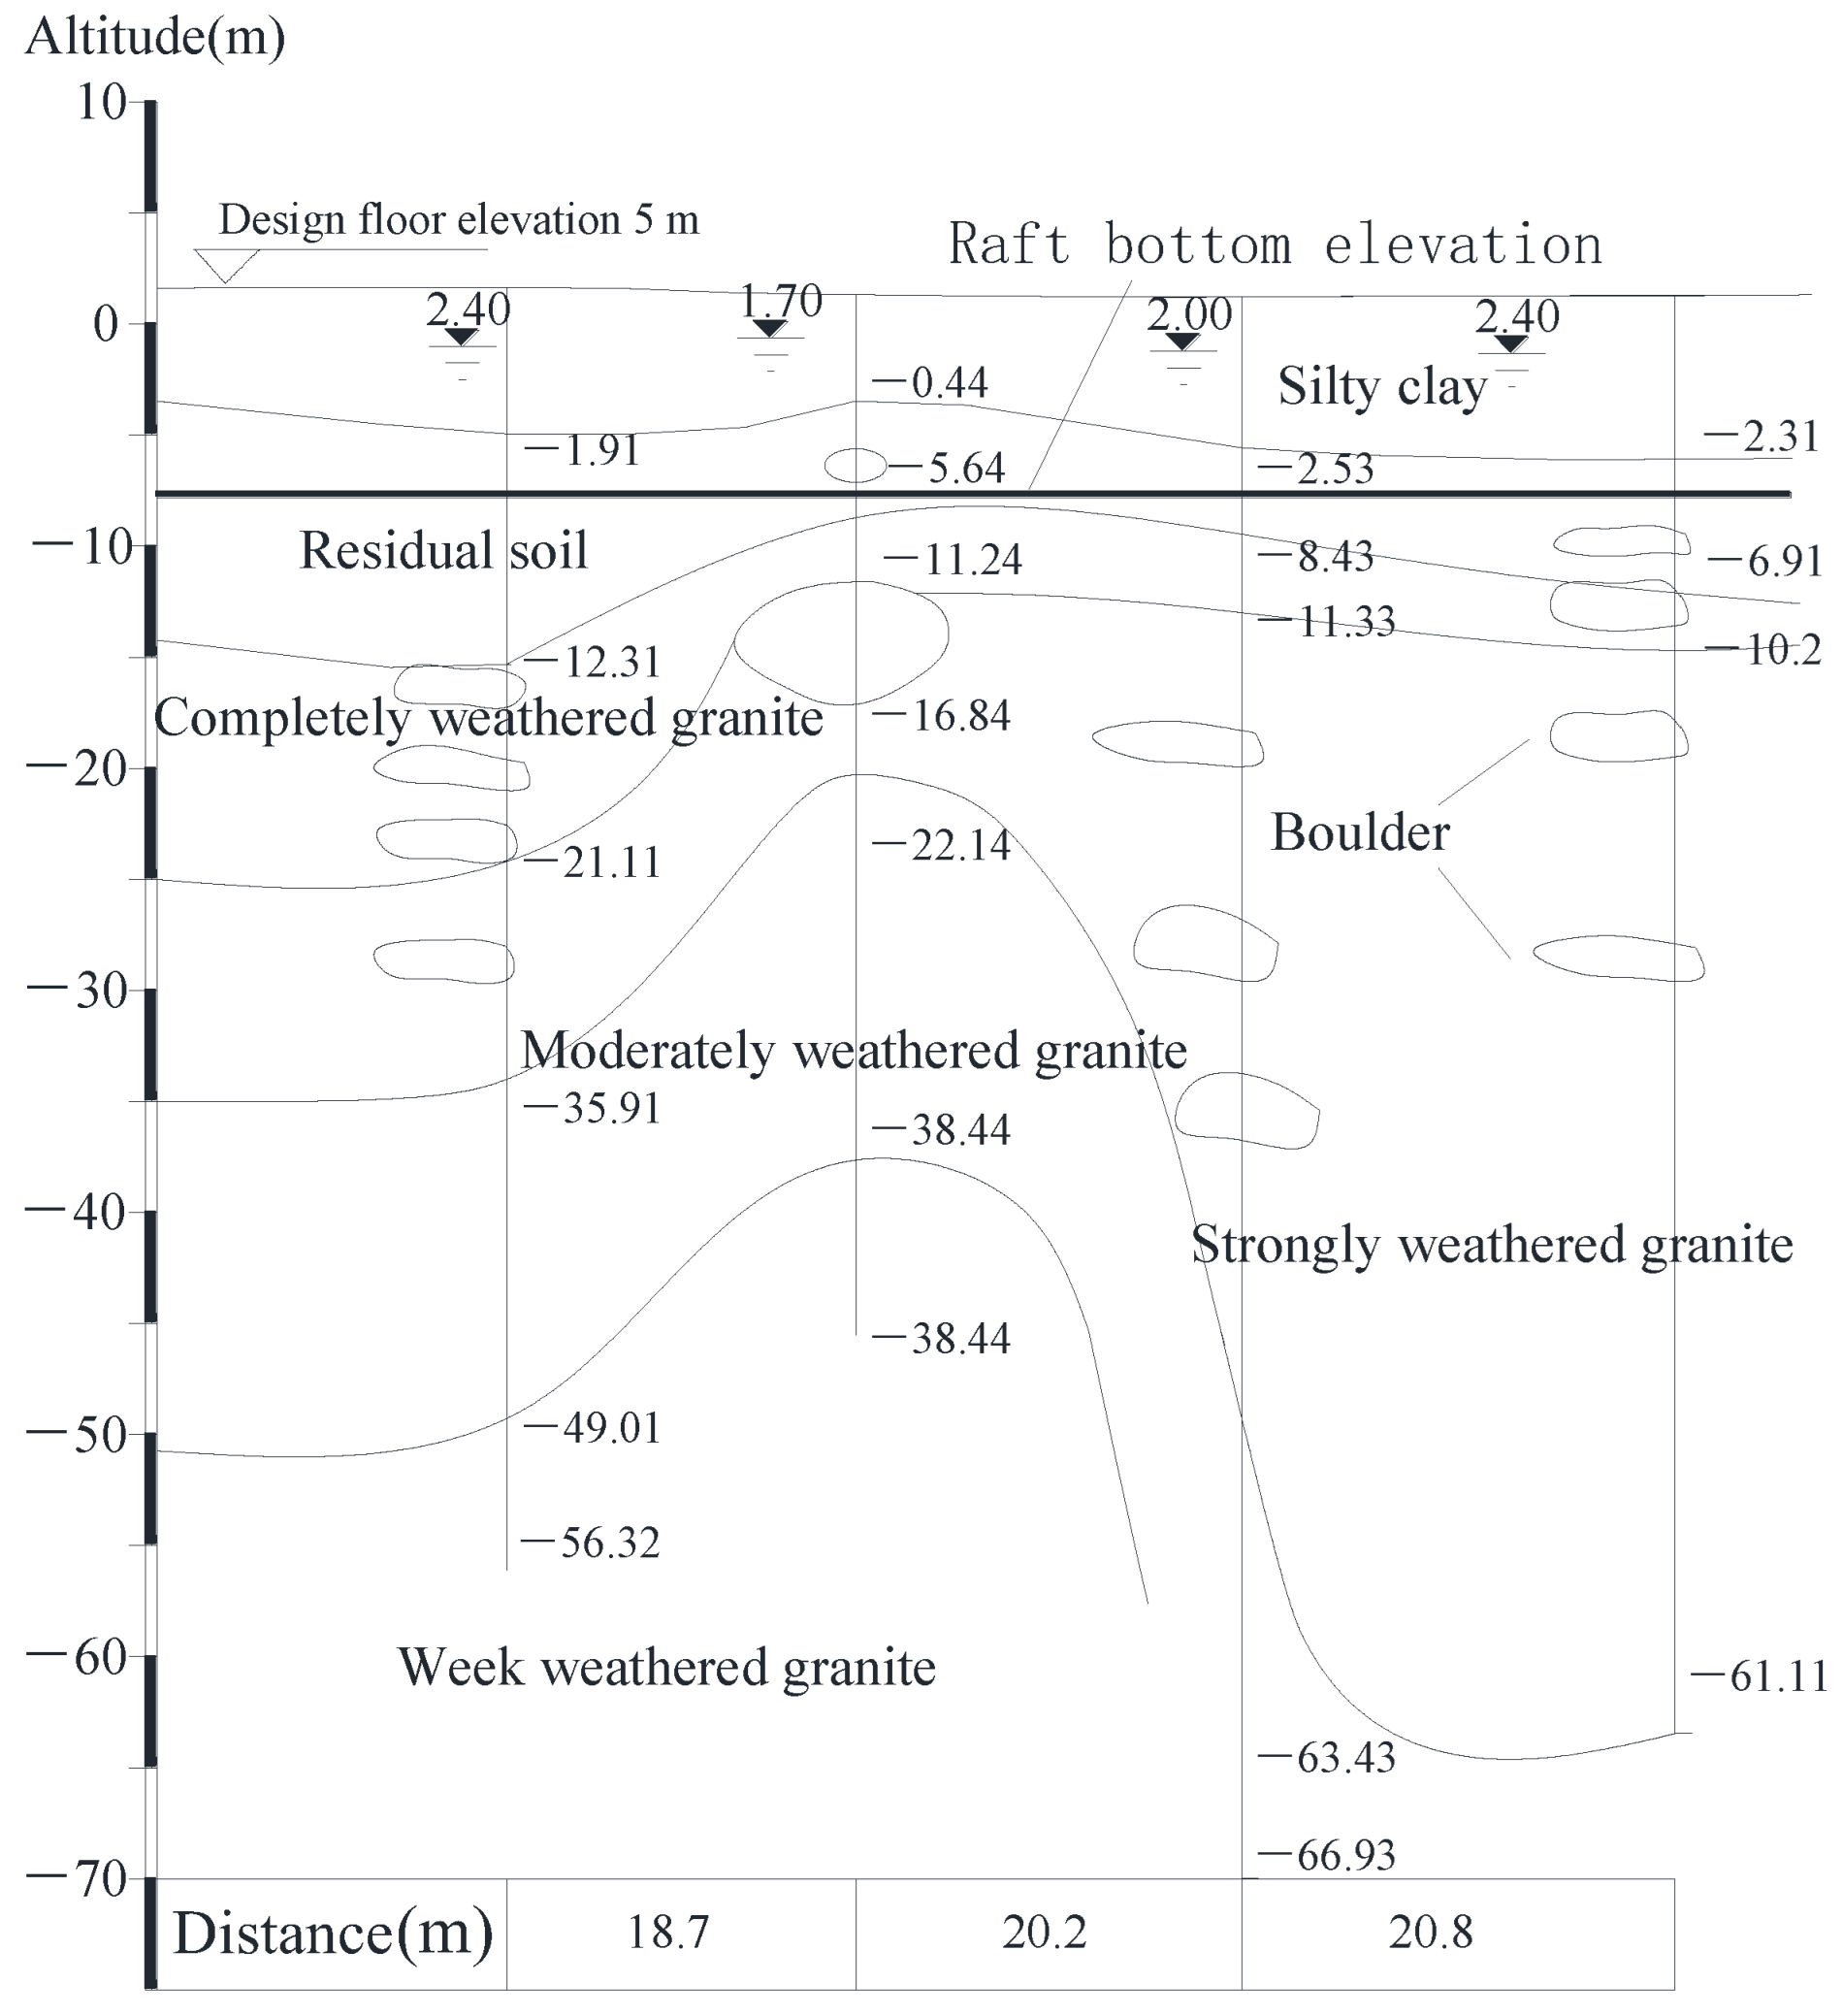
The site exploration was conducted in 2006. It was found that the soil conditions were complicated, mainly consisting of residual soil and weathered granite. Specifically, the unit weight, cohesion, internal friction angle, and deformation modulus of residual soil were 18.6 kN/m
3, 18 kPa, 28°, and 35 MPa, while those of weathered granite were 19.5~23.5 kN/m
3, 40~45 kPa, 27~30°, and 60~120 MPa, respectively. Similarly, characteristic values of the subgrade bearing capacity, skin resistance, and tip resistance for residual soil and weathered granite were 280, 100, and 1200 kPa and 400~3000, 150~800, and 1500~10,000 kPa, respectively. Soils of the site experienced highly uneven weathering and spheroidal weathering, leading to the formation of various sizes of boulders, which mainly appeared in completely and strongly weathered granite layers, as indicated in
Figure 2. Additionally, the distribution of the soil layer is highly uneven with regards to depth, resulting in the different soil characteristics in the same depth. Accordingly, the complicated soil conditions bring about severe challenge to the design and construction of piled raft foundations.
3. Preliminary Design Scheme
3.1. Design Concept
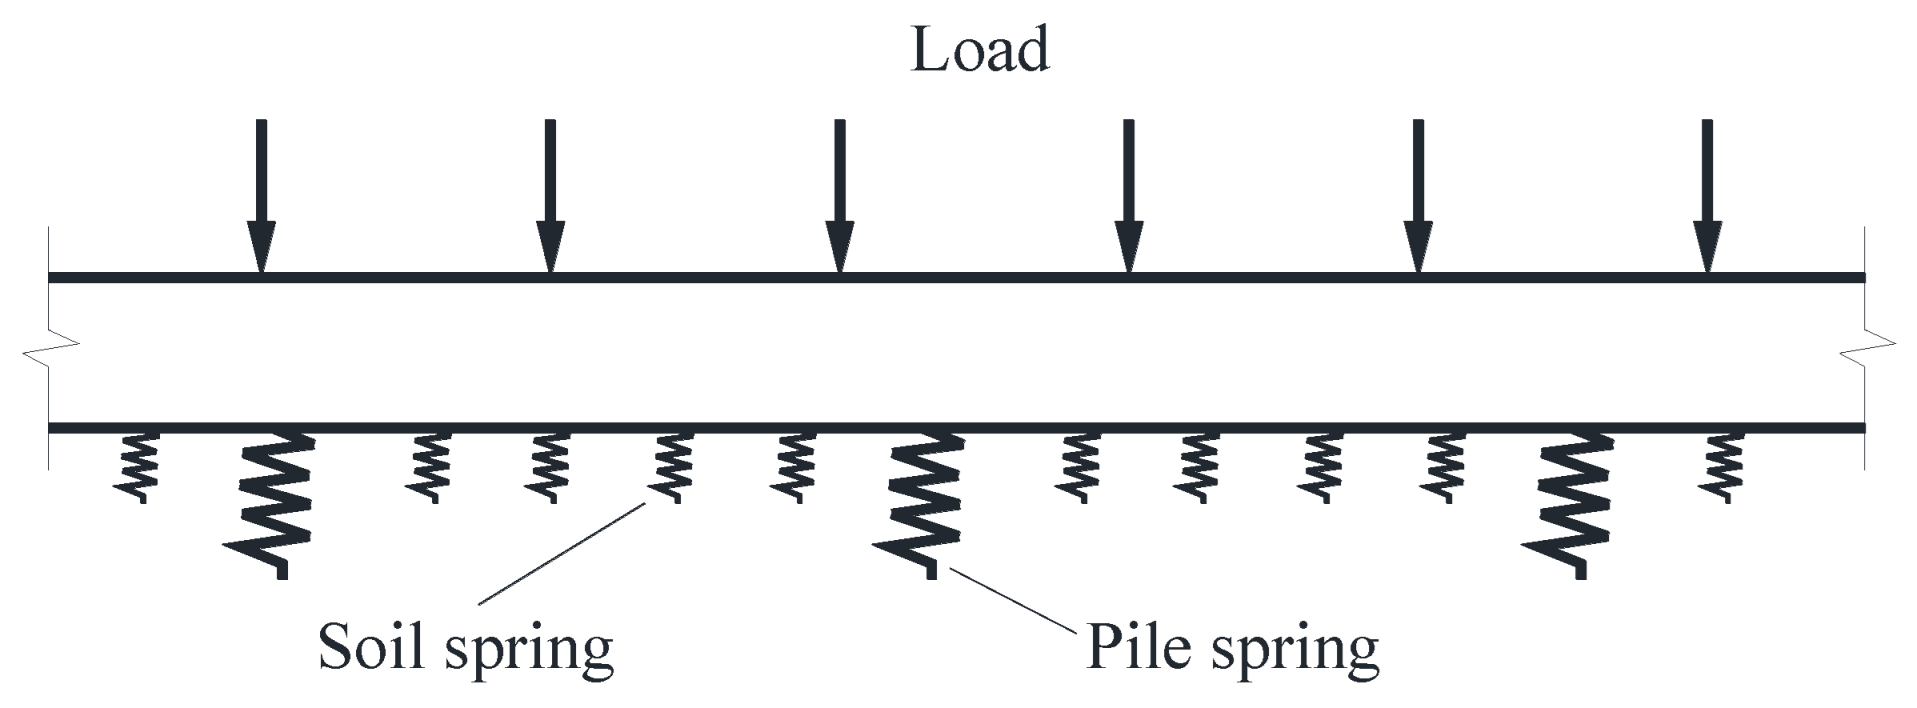
A deformation adjustor is a device used to adjust the bearing stiffness between two contacting objects. The overall stiffness of piled raft foundations is adjusted through the large deformation of deformation adjustors placed between the top of the piles and rafts. The schematic diagram of its mechanical model is shown in
Figure 3. It can be seen that the placement of deformation adjustors is equivalent to installing springs with a specific stiffness on the top of the piles. The stiffness of the deformation adjustor is generally much lower than the stiffness of the pile. Accordingly, the applied load is partly transferred to the soils below the raft with the deformation of deformation adjustors, which significantly reduces the requirement for the bearing capacity of piles. It would save a lot of money and time for the project.
3.2. Parameters of the Building
The raft of building A has a width of 20.8 m, a length of 44.5 m, and an L-shaped plane close to the rectangle. The diameter (R0) of the equivalent circular raft is 35 m. The superstructure load was approximately 524,700 kN. The area of building A was 960 m2, and the corresponding earth pressure was 546 kPa.
3.3. Soil Bearing Capacity
The soil ultimate bearing capacity provided by the geotechnical report was 280 kPa, which was derived from laboratory tests. However, the residual soil and weathered granite are easily disturbed. The soil ultimate bearing capacity will be reduced after the disturbance. Thus, the value provided by the geotechnical report is underestimated. According to local engineering specifications, the bearing capacity was approximately 480 kPa. To confirm this value, a static plate load test, a standard penetration test, a pressure meter test, and a deep screw plate test were conducted. The test results indicated that the allowable bearing capacity was above 480 kPa, with a safety factor of 2.
3.4. Preliminary Design Scheme
The design scheme adopted a 2.5 m thick raft supported on hand-dug piles. The piles were 1 m in diameter, 12 m long, and the average center-to-center spacing of piles was four times the pile diameter. The pile tip was located at −18 m YSL, indicating that most of the piles were borne on the highly weathered granite layer. As such, the foundation should be designed as a piled raft with end-bearing piles. The design procedures are described in detail in [
18] for piled raft foundations with deformation adjustors. The main parameters for this project were calculated as per [
19,
20], as listed in
Table 1.
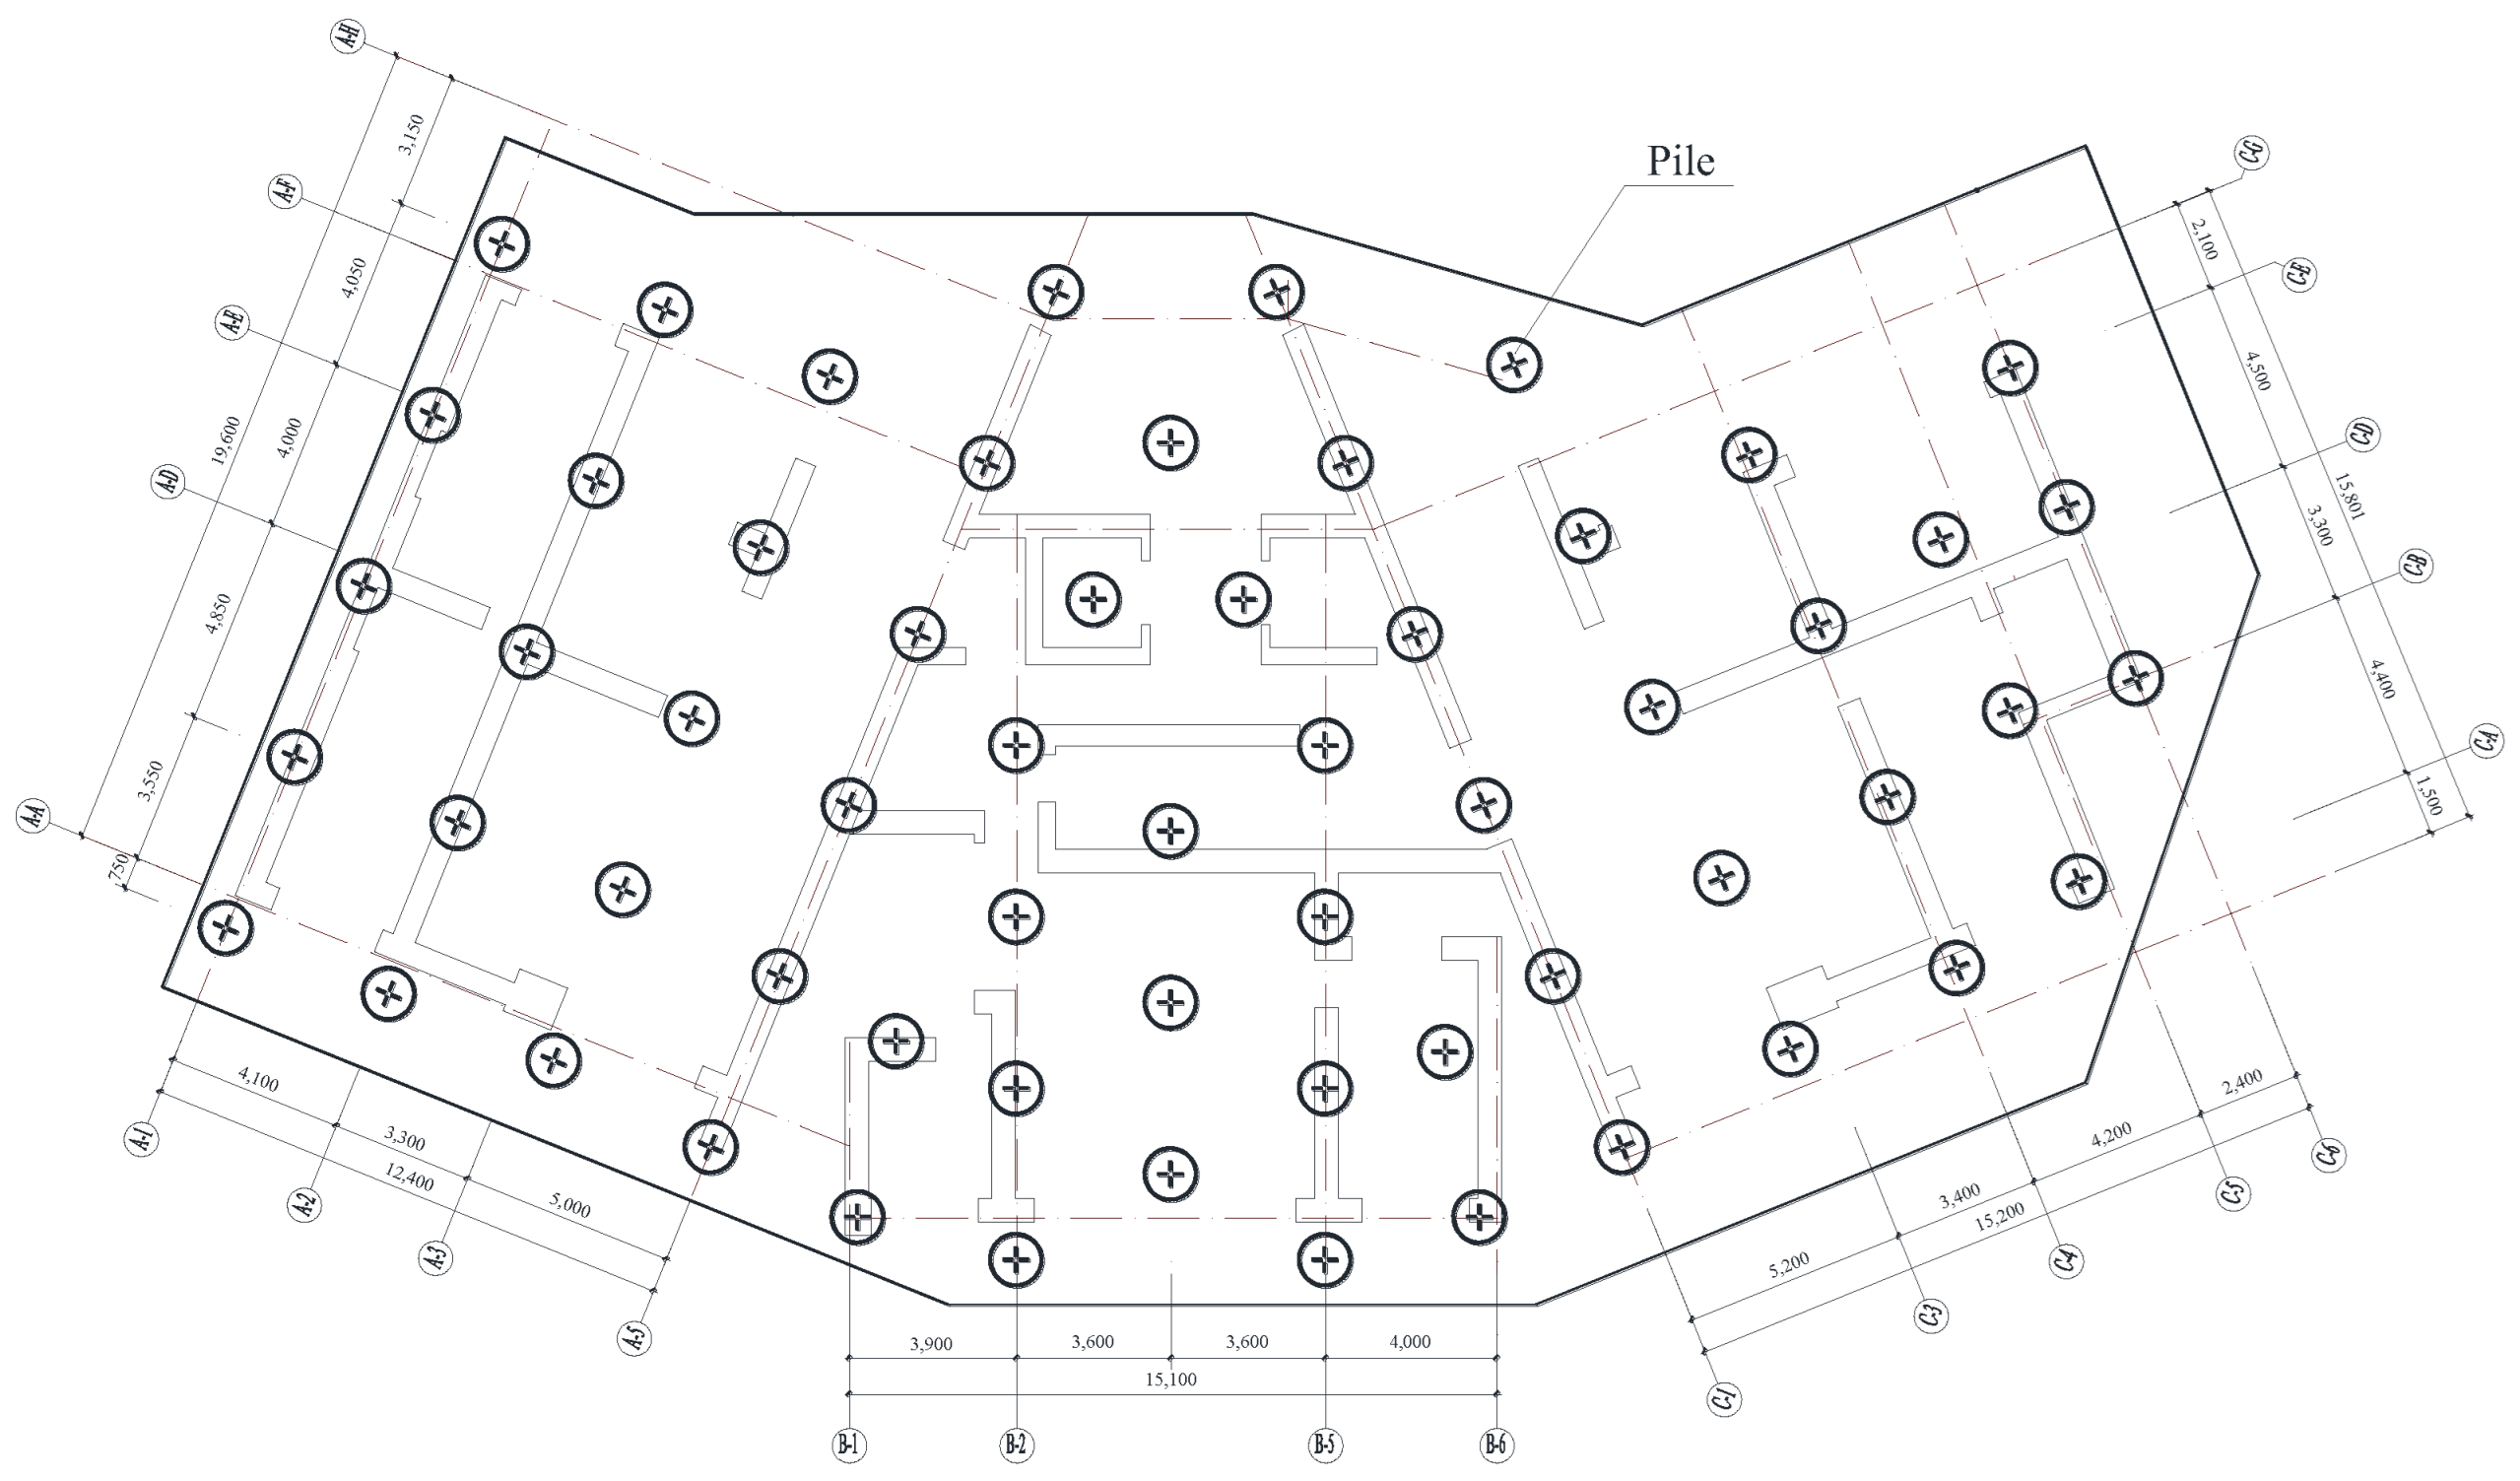
Besides, the calculation value of the pile number is equal to 53. Considering some special needs of the superstructure configuration, the pile number,
n = 60, was used for the design scheme. The pile arrangement is presented in
Figure 4.
4. Description of the Numerical Study
4.1. Geometric Configuration of the Model
In this paper, the numerical analysis was carried out using the
ABAQUS [
21]. To be in correspondence with the construction, the three-dimensional numerical model of the piled raft foundation was simulated as it had been in the construction in both its configuration and dimensions.
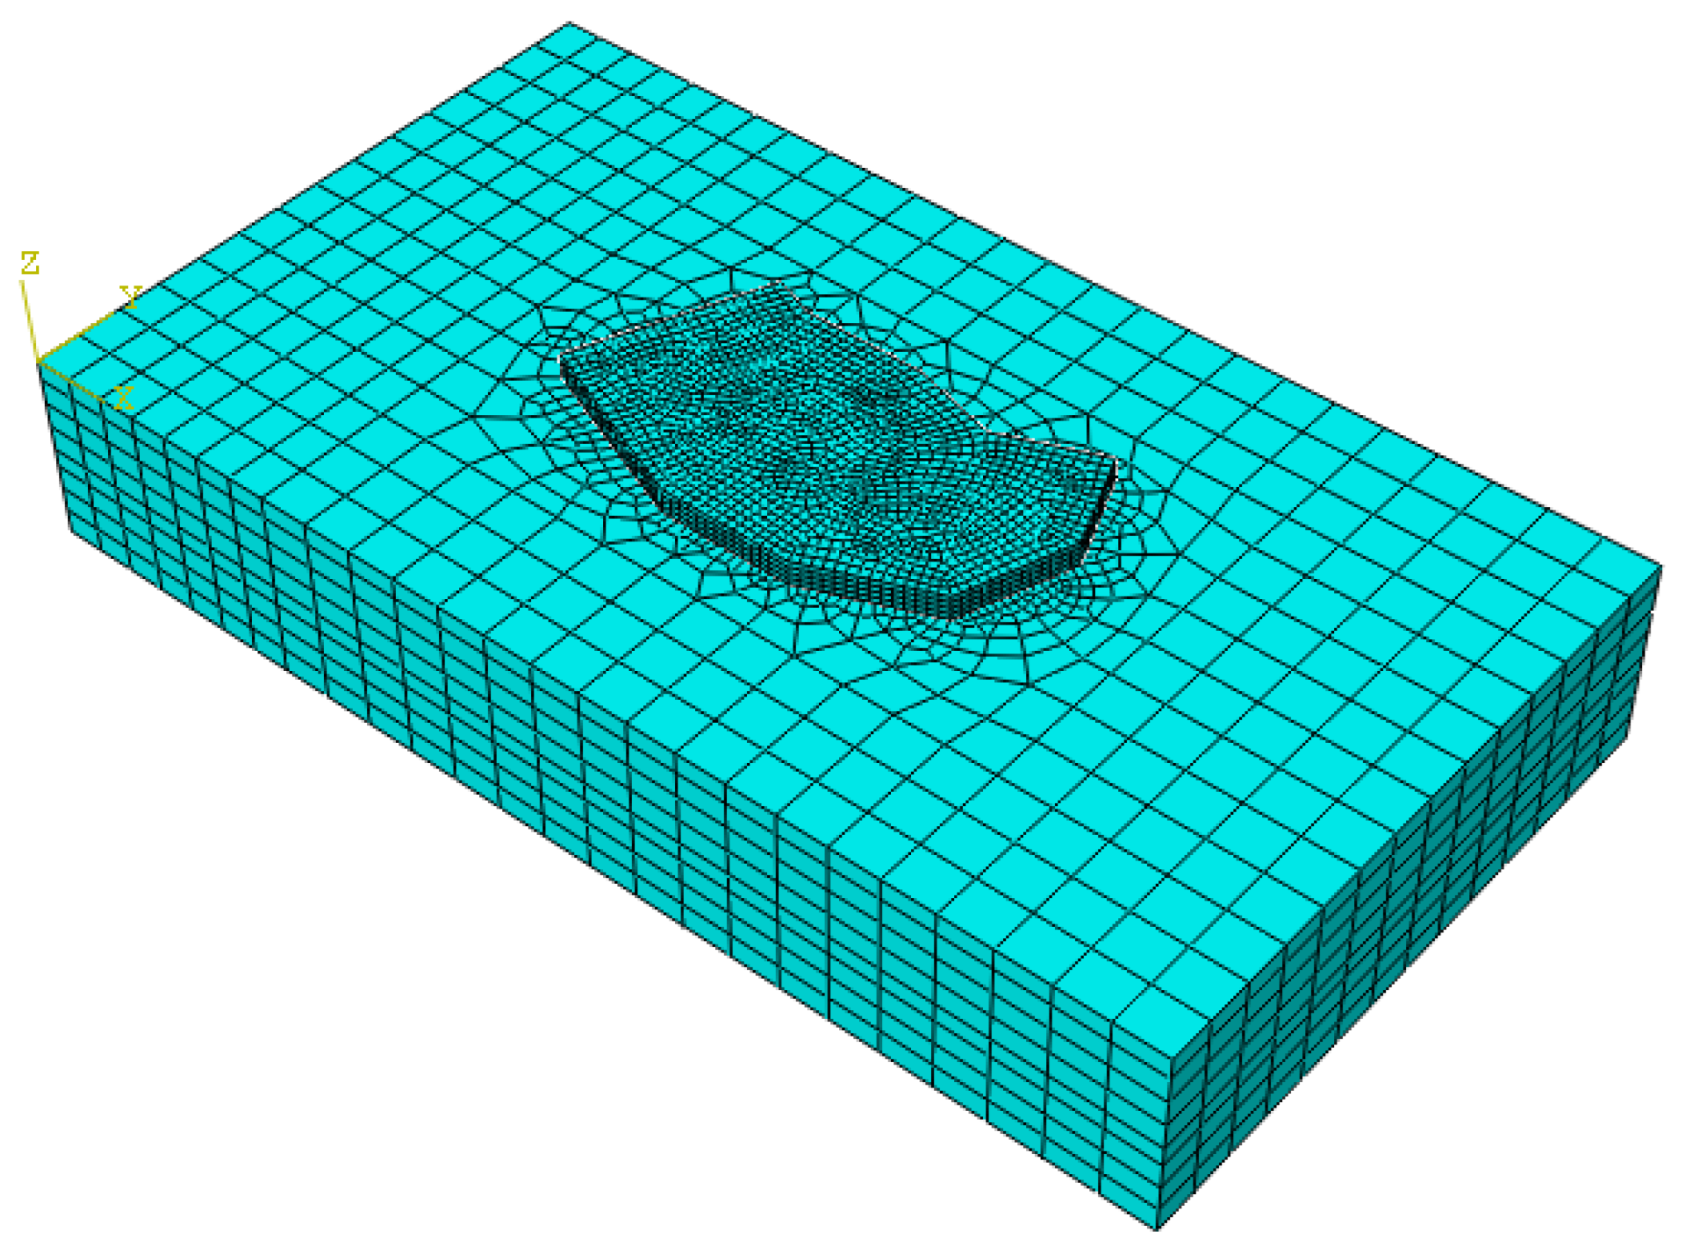
Figure 5 presents the basic configuration of the model. The size of model is 120 m in the x direction, 60 m in the y direction, and 40 m in the z direction. The piles are 1 m in radius and 12 m in depth. Respectively, a raft which had a thickness of 2.5 m was arranged on the pile-soil system to enable the system to support the applied load. To simulate the deformation adjusters on the pile heads in the construction, an analysis was performed on them with a simulation where two rigid plates are the top and bottom of the deformation adjustor and a spring with a length of 30 mm was between the two plates. For simplicity, the rigid plate had zero thickness. The cross-sectional geometry of the numerical deformation adjustor was identical to that of the pile (2R = 1 m). The boundary was given according to different conditions: x = 0, y = 0, and z = 0 on the upper and lower surfaces of the model, while x = 0 and y = 0 on the surface around the model. The whole model has 54,820 units and 111,728 nodes. In this paper, the model was simulated without taking advantage of the symmetry due to the irregular geometry of the piled raft foundation in the project. Additionally, the soil and the piled raft foundation are modeled with finite elements. The pile mass, raft mass and soil mass were discretized using continuum solid elements, mainly 8-noded hexahedral elements with reduced integration.
4.2. Material Property
Actually, the soil is a multiphase medium. For simplicity, it was simulated as a one-phase media in this paper. The Mohr–Coulomb plasticity model was used to model the soil plasticity [
22]. The pile and raft were simulated as elastic materials, and the properties of them were in accordance with the parameters in the construction. All of the model parameters are shown in
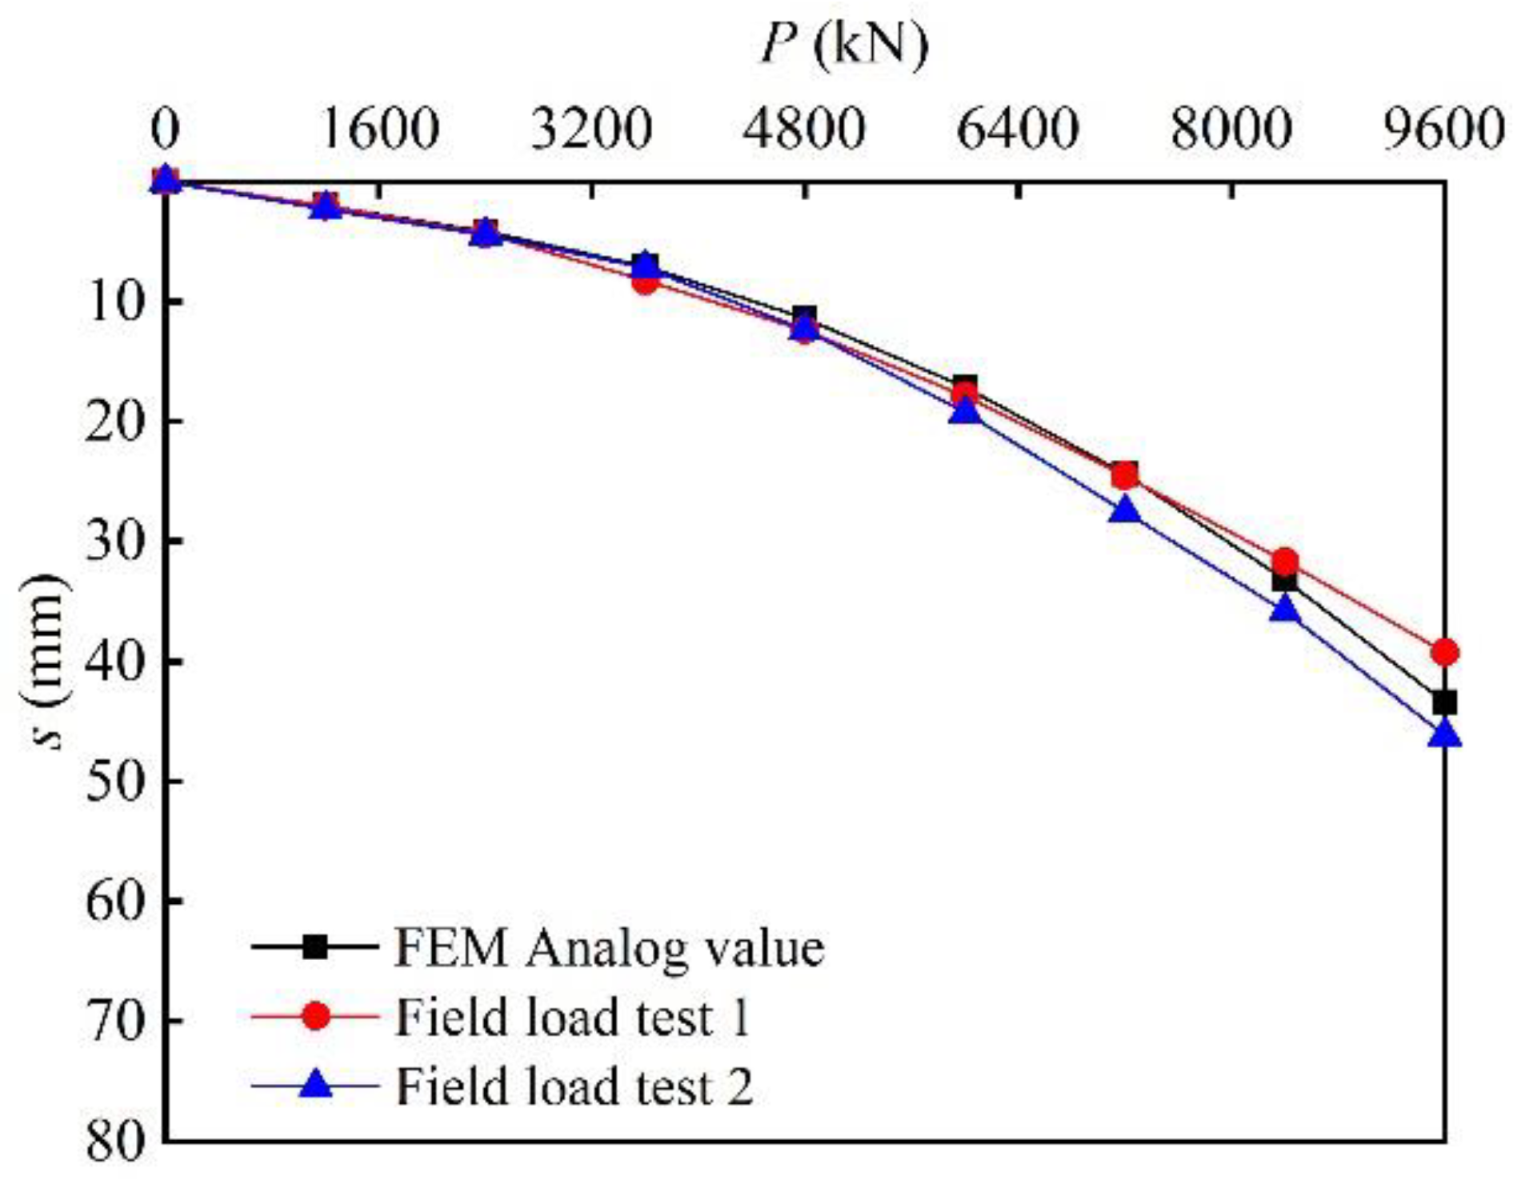
Table 2. The validity of the model parameters in the program based on the analysis of the two static load tests, and the comparison of
P-S curve between numerical results and static load test results was shown in
Figure 6. As we can see, all of the three curves matched well. Hence, the conclusion was reached that the model parameters in the program are reasonable.
In addition, the contact between the structure and the soil was simulated as perfectly rough and no relative motion would appear between the finite elements nodes. Duplicated nodes were used to form a zero-thickness interface between the pile and the soil, the pile and the plate, the soil and the raft, and the plate and the raft.
4.3. Numerical Analysis Scheme
In order to further analyze the influence of the stiffness of the deformation adjustors on the load-sharing ratio, and whether the stiffness of 12,000 kN/m in the preliminary design scheme is reasonable, numerical analysis was conducted for studying the bearing characteristics of the piled raft foundations with different stiffnesses of the deformation adjustors, which is equal to spring stiffness, as shown in
Table 3.
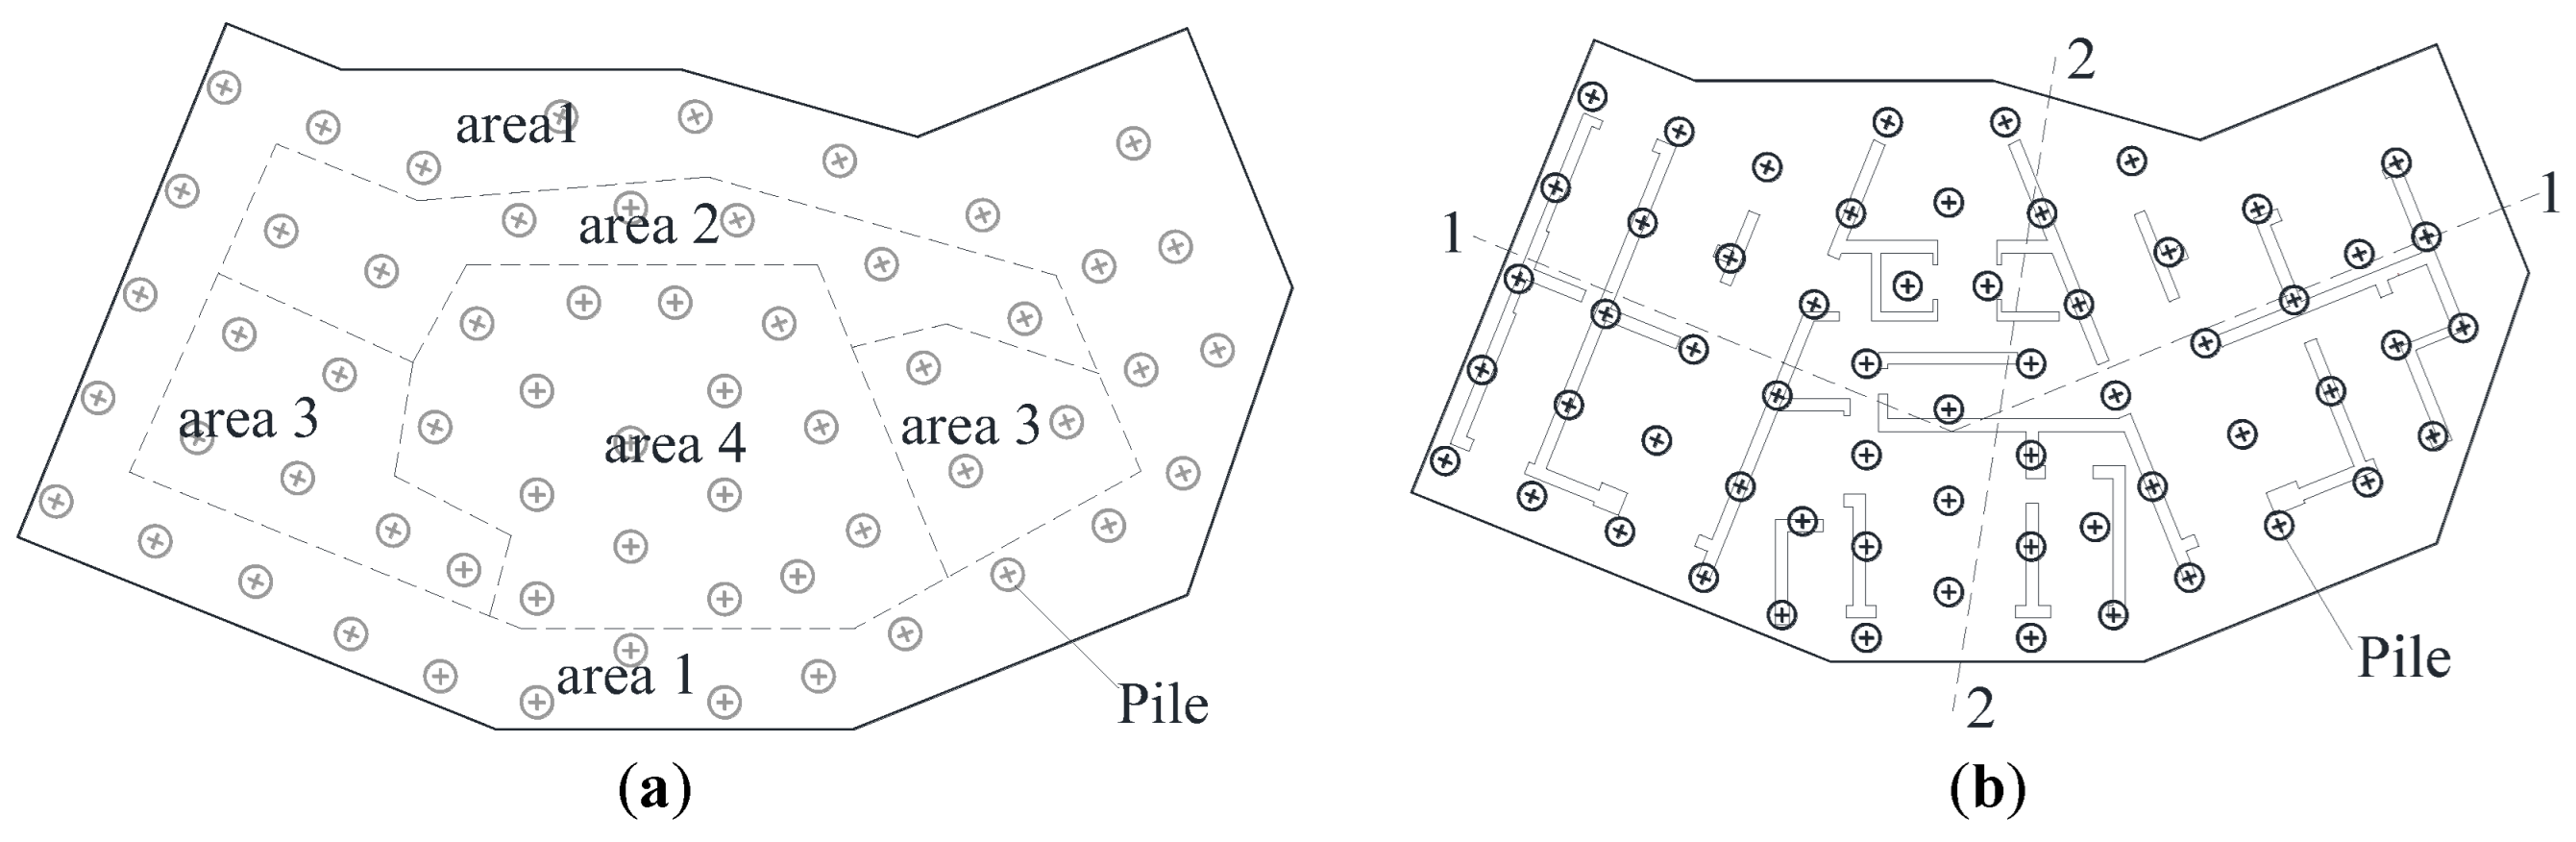
The above schemes were only for the case where the deformation adjustors were a single stiffness. Actually, deformation adjustors with different stiffness could be placed on different areas to make full use of the soil bearing capacity, as shown in
Figure 7a and
Table 4. To limit the length of the article, the author selected path 1-1′ and path 2-2′ for the analysis, as shown in
Figure 7b.
5. Numerical Results
5.1. Analysis of Settlement
The raft settlement distribution variation along path 1 and path 2 is shown in
Figure 8 and
Figure 9, respectively. The stiffness of the deformation adjustors had a great influence on the raft settlement. The overall settlement and differential settlement significantly increased as the stiffness of the deformation adjustors was reduced. When the stiffness of the deformation adjustors was 120,000 kN/m, the maximum settlement and differential settlement were 41 mm and 17 mm, respectively, which was consistent with the range proposed by [
23]. It indicated that 120,000 kN/m was the reasonable stiffness of the deformation adjustors. Besides, the differential settlement could be controlled nearly to zero as the deformation adjustors of different stiffness were placed in different areas.
5.2. Analysis of Earth Pressure
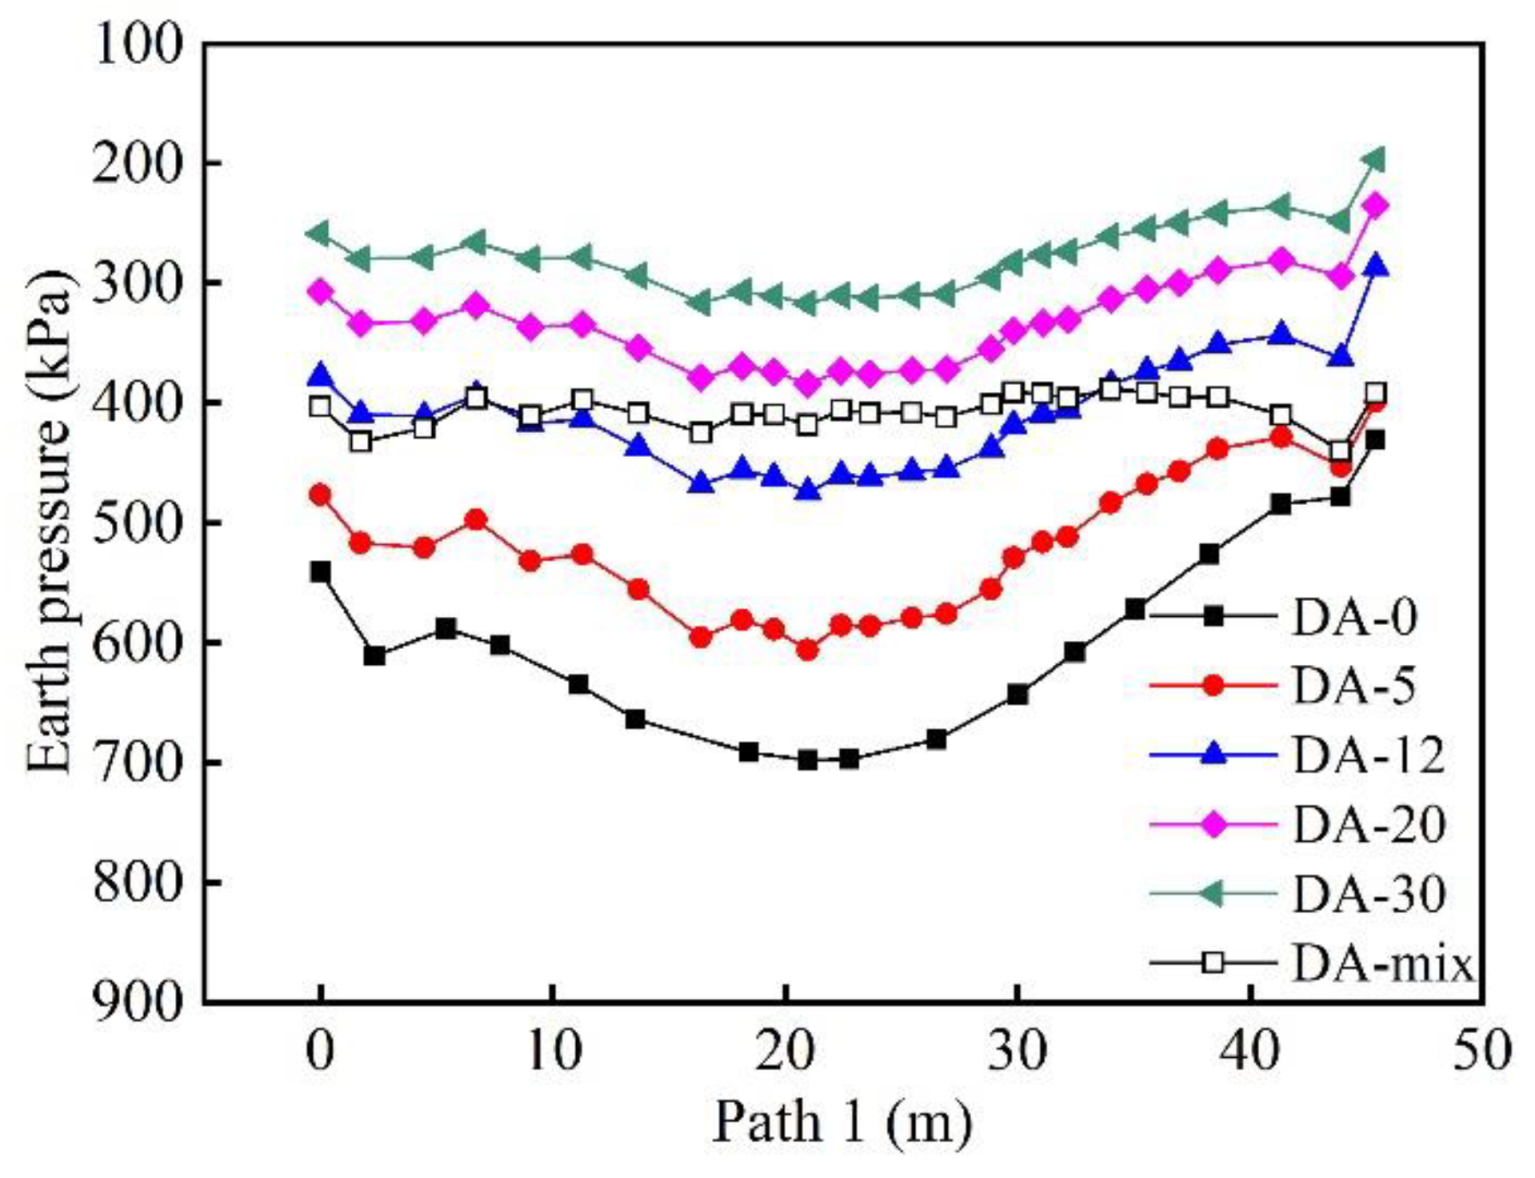
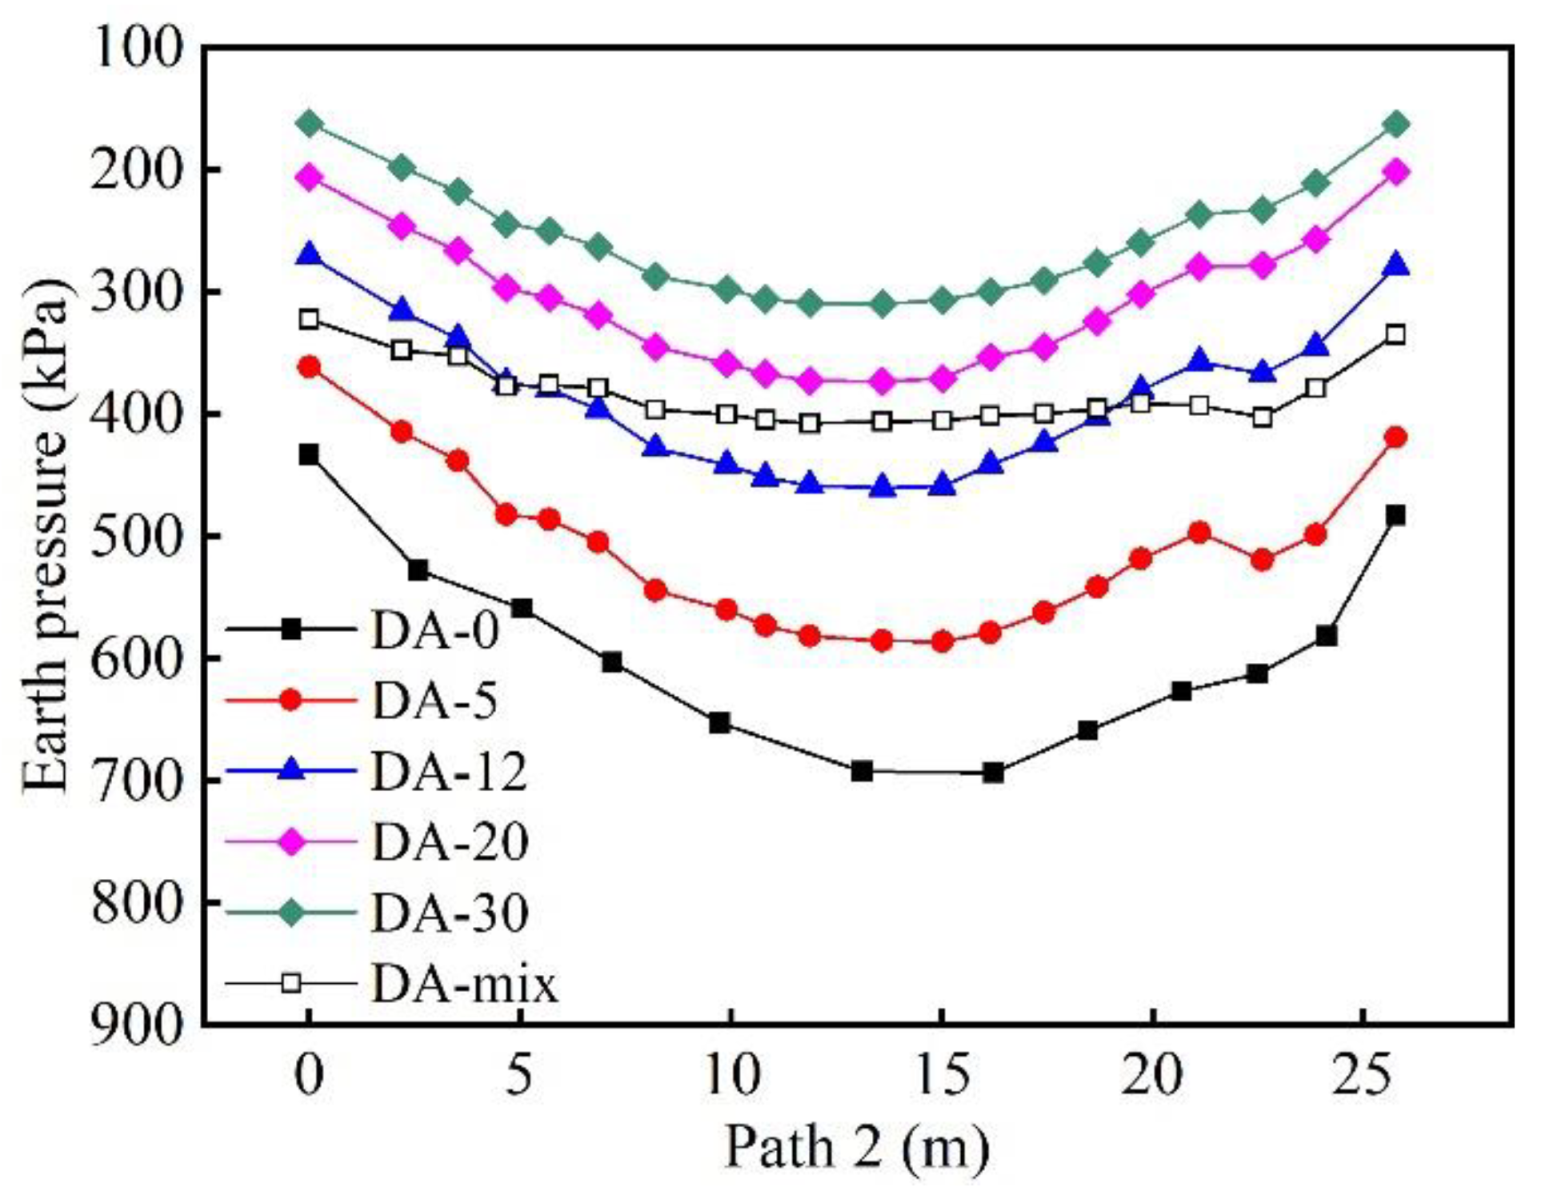
The earth pressure distribution below the raft along path 1 and path 2 are presented in
Figure 10 and
Figure 11, respectively. The distributed load on soil gradually increased as the stiffness of the deformation adjustors reduced. When the stiffness of the deformation adjustors was zero, the average earth pressure below the raft was 602 kPa, which was greater than the actual soil bearing capacity. If 12,000 kN/m was chosen as the stiffness of the deformation adjustors, the average earth pressure below the raft was only 377 kPa, indicating that the deformation adjustors have a significant effect on promoting the pile-soil interaction. Additionally, the earth pressure distribution below the raft was more uniform in the scheme of deformation adjustors with different stiffness placed in different areas than that with a single stiffness, which is the main reason that the differential settlement was close to zero. Comparing the earth pressure distribution in
Figure 10 and
Figure 11, it is found that when the earth pressure is small, the earth pressure below the raft showed characteristics of partial stiffness along the direction of the short side and somewhat showed flexibility along the direction of the long side due to the uneven distribution of the upper load. This distinction should be taken into account in the design of the raft.
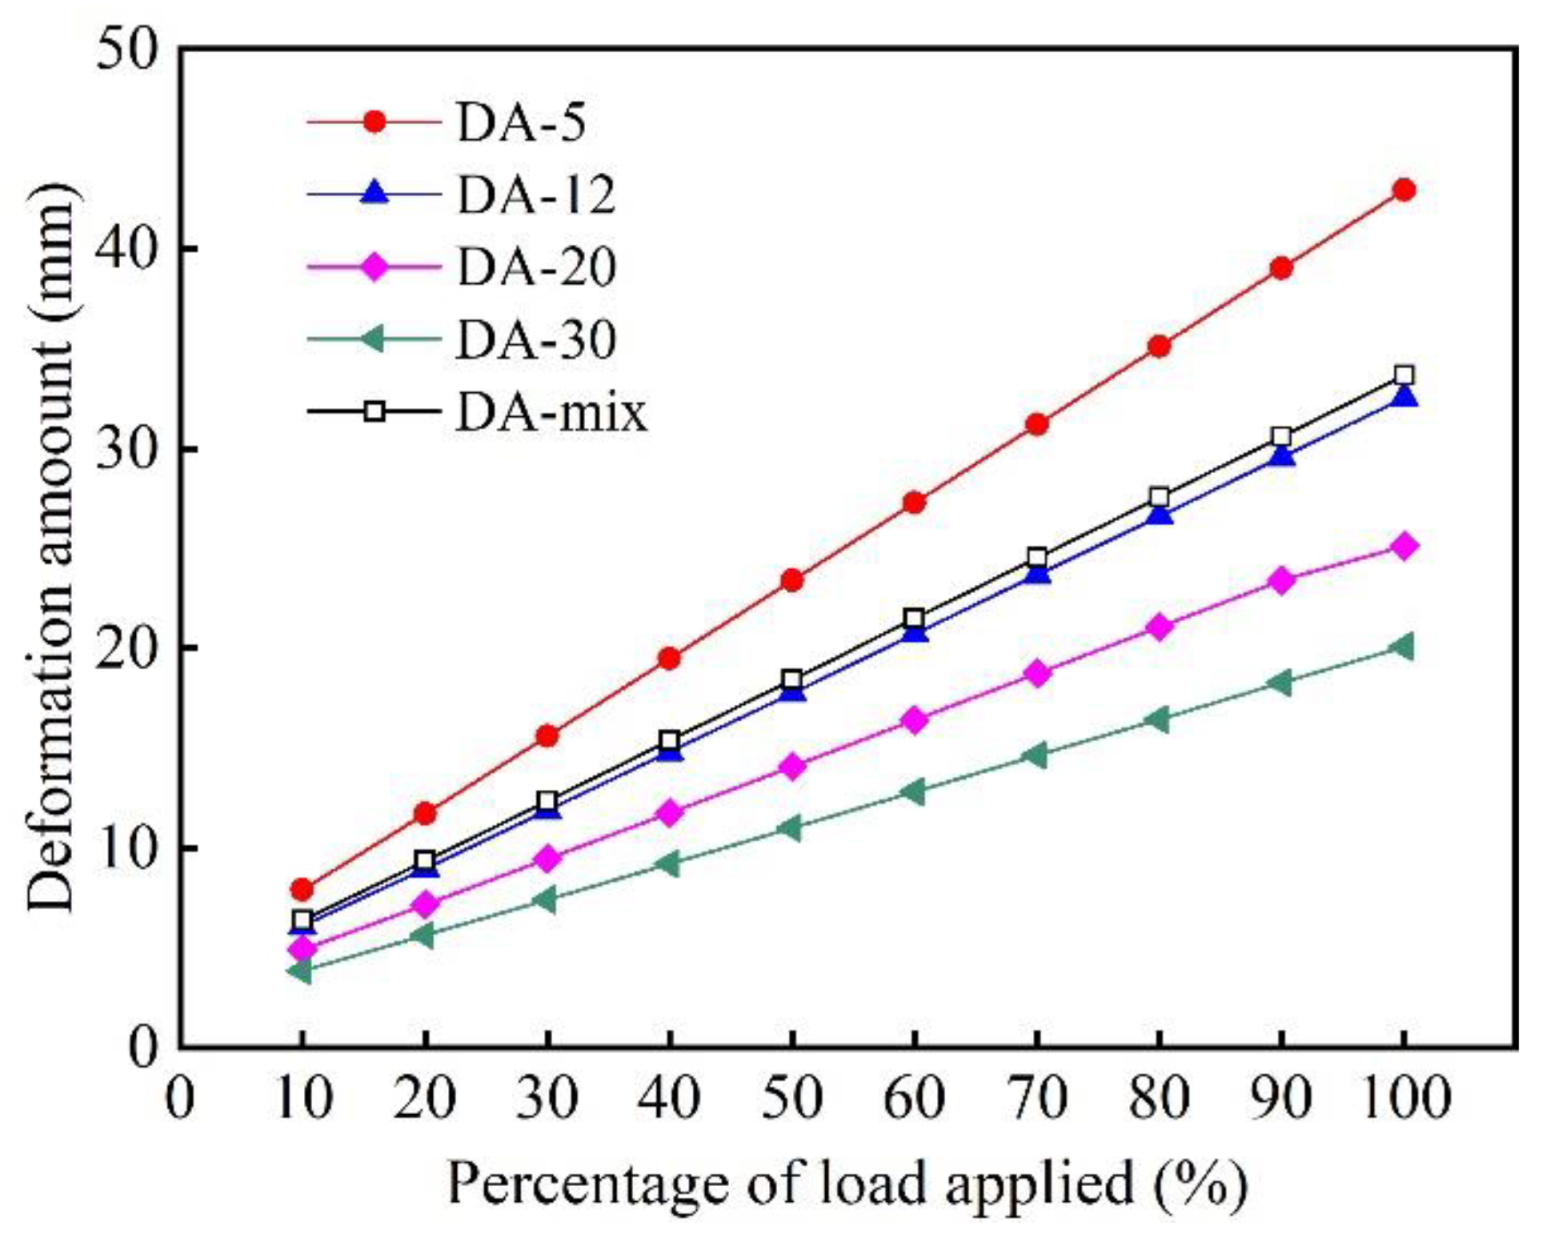
5.3. Analysis of Deformation Amount of Deformation Adjustors
Figure 12 shows the curve of deformation amount of deformation adjustors variation with the percentage of load applied. As shown in
Figure 12, the deformation amount of deformation adjustors was smaller as the stiffness of deformation adjustors was larger. When the stiffness of deformation adjustors was 12,000 kN/m, the deformation amount of the deformation adjustors was 32.52 mm after the load was applied, whereas it was 33.66 mm in the scheme of deformation adjustors with different stiffness placed in different areas.
5.4. Analysis of Pile Top Reaction
Figure 13 presented the curve of the pile top reaction variation with the percentage of the load applied. As shown in
Figure 13, the pile top reactions increased significantly as the stiffness of deformation adjustors became larger. The average pile top reaction was 4057 kN, as the stiffness of the deformation adjustors was 120,000 kN/m, which was slightly smaller than the pile allowance bearing capacity. Additionally, in the scheme of deformation adjustors with different stiffness placed in different areas, the pile top reaction could be calculated by the deformation amount of deformation adjustors and the stiffness of deformation adjustors. Accordingly, the maximum and minimum pile top reactions were 10,098 kN and 1683 kN, respectively, which were higher than the pile allowance bearing capacity. When the deformation adjustors were adopted, the pile top reactions would be significantly different. The stiffness 120,000 kN/m was the relatively reasonable value on the basis of satisfying the design condition.
5.5. Analysis of Load-Sharing Ratio between Soil and Pile
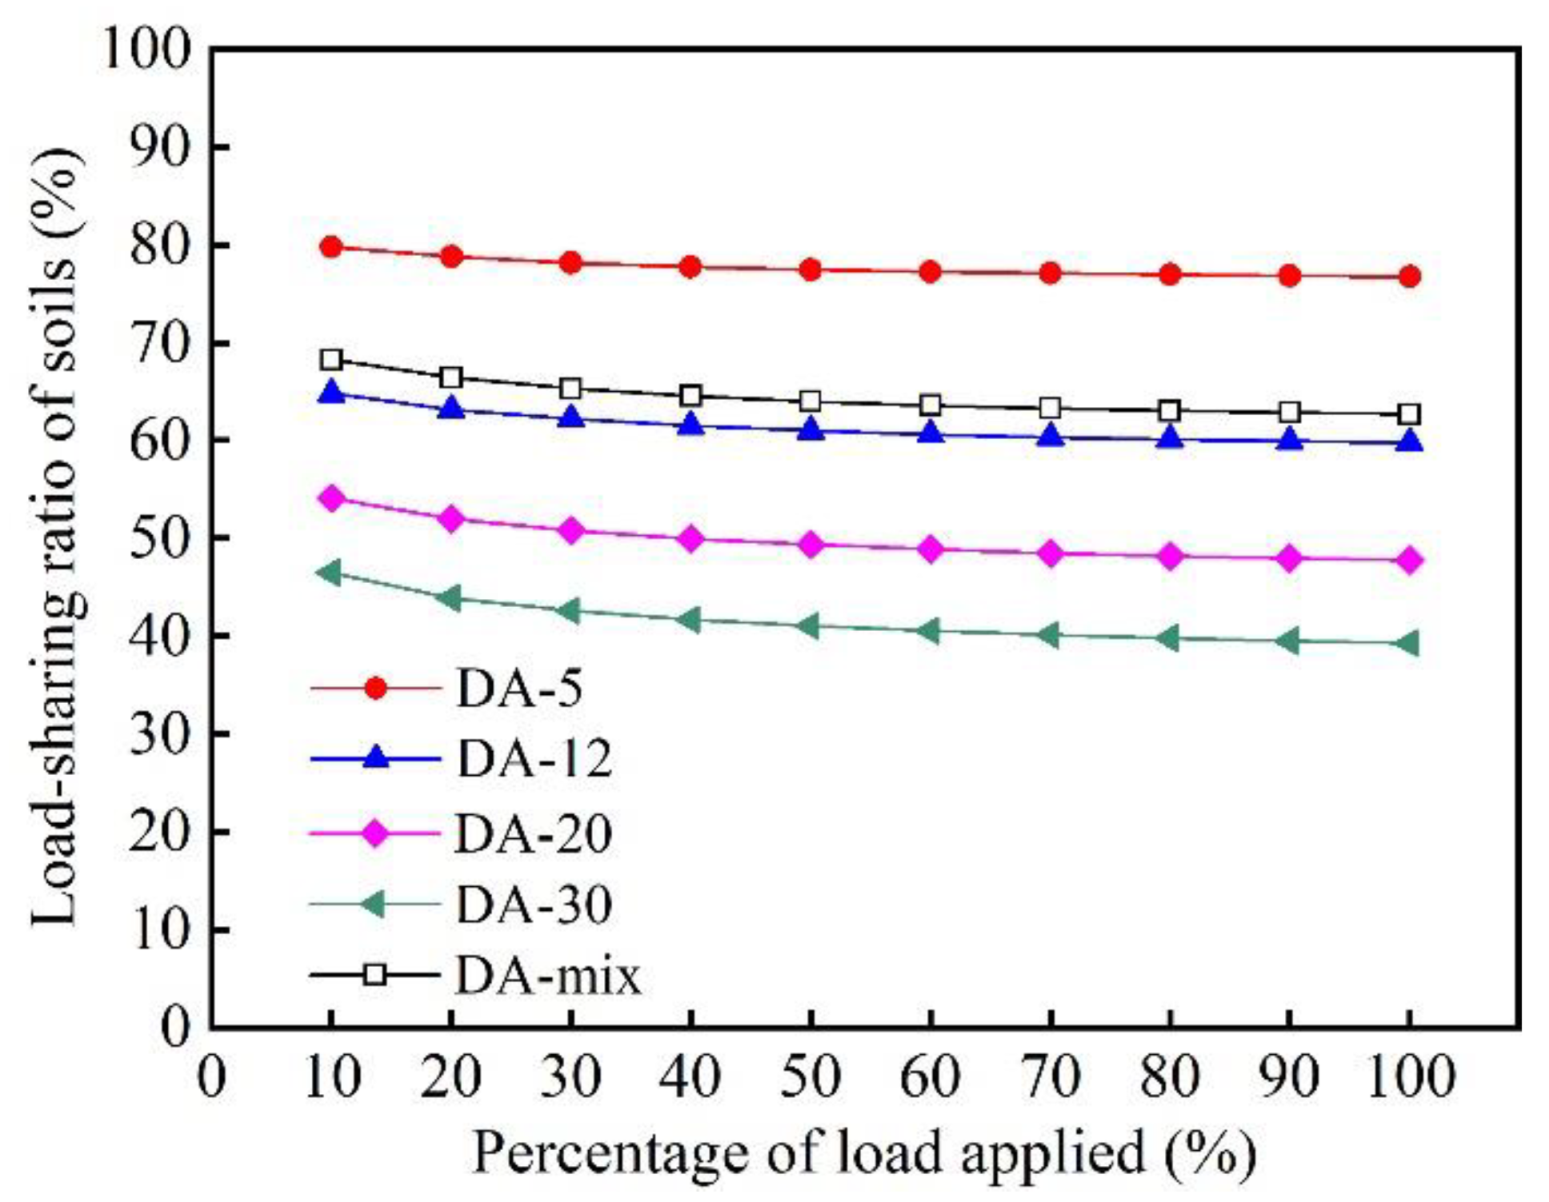
Figure 14 is the curve of the load-sharing ratio of soil variation with the percentage of load applied. As shown in
Figure 14, the load-sharing ratio of soil decreased and tended to be stable as the percentage of the load applied increased. This is because the raft, soil, and deformation adjustors were deformed and coordinated in the process of the load applied. When the stiffness of the deformation adjustors was 120,000 kN/m, the load-sharing ratio of soil was up to 59.76%. The conclusion that was reached was that the deformation adjustors could effectively change the load-sharing ratio between soil and piles, and that they made full use of the soil bearing capacity.
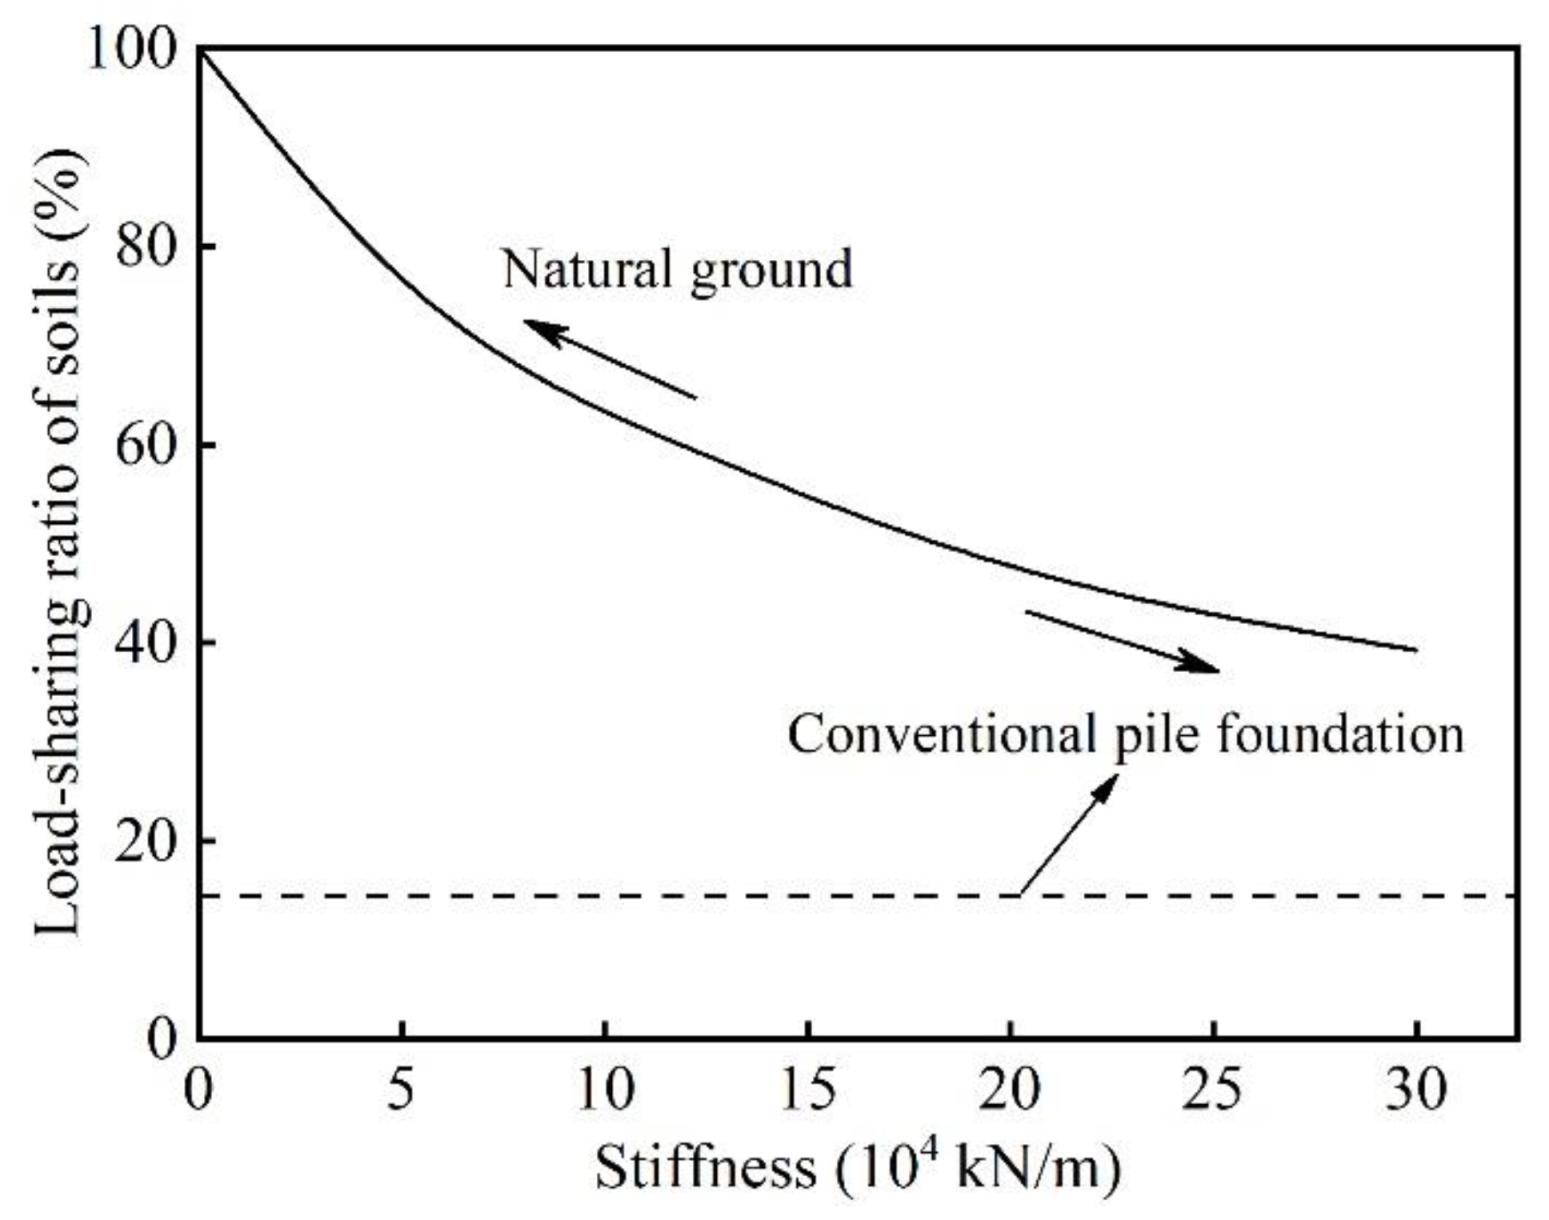
Figure 15 presented the curve of the load-sharing ratio of soil variation with stiffness of deformation adjustors. When the stiffness of the deformation adjustors is zero, the foundation is equivalent to the natural ground, and the superstructure load was all carried by soil. With the stiffness of the deformation adjustor increasing, the decreasing trend of the load-sharing ratio of soil gradually slows down and tends to be stable. The foundation will show the characteristics of a conventional pile foundation, as the stiffness of the deformation adjustors was close to the stiffness of the piles.
The essence of the deformation adjustor placed on the top of piles was an optimization of practical engineering. The deformation adjustors with different stiffness determine the difference in the load-sharing ratio of soil, resulting in different total settlements and differential settlements.
5.6. Determination of Design Scheme
Based on the above analysis, the average settlements and differential settlements of the building were all in the reasonable range when the piled raft foundation with deformation adjustors (120,000 kN/m) was adopted. The average earth pressure is 377.2 kPa and the average pile top reaction is 4057 kN. This scheme not only took full advantage of the soil bearing capacity, but also greatly reduced the project cost. The numerical analysis was also proven to be an effective method for assisting in the design of the piled raft foundation with deformation adjustors.
Additionally, deformation adjustors with different stiffness in four areas had a better effect on achieving pile-soil interaction in the numerical analysis. The differential settlement would be smaller and the distribution of the earth pressure under the raft would be more uniform. However, this scheme was more complex in the process of design and construction and had not ever been used in practical engineering. Thus, it is not adopted for the time being.
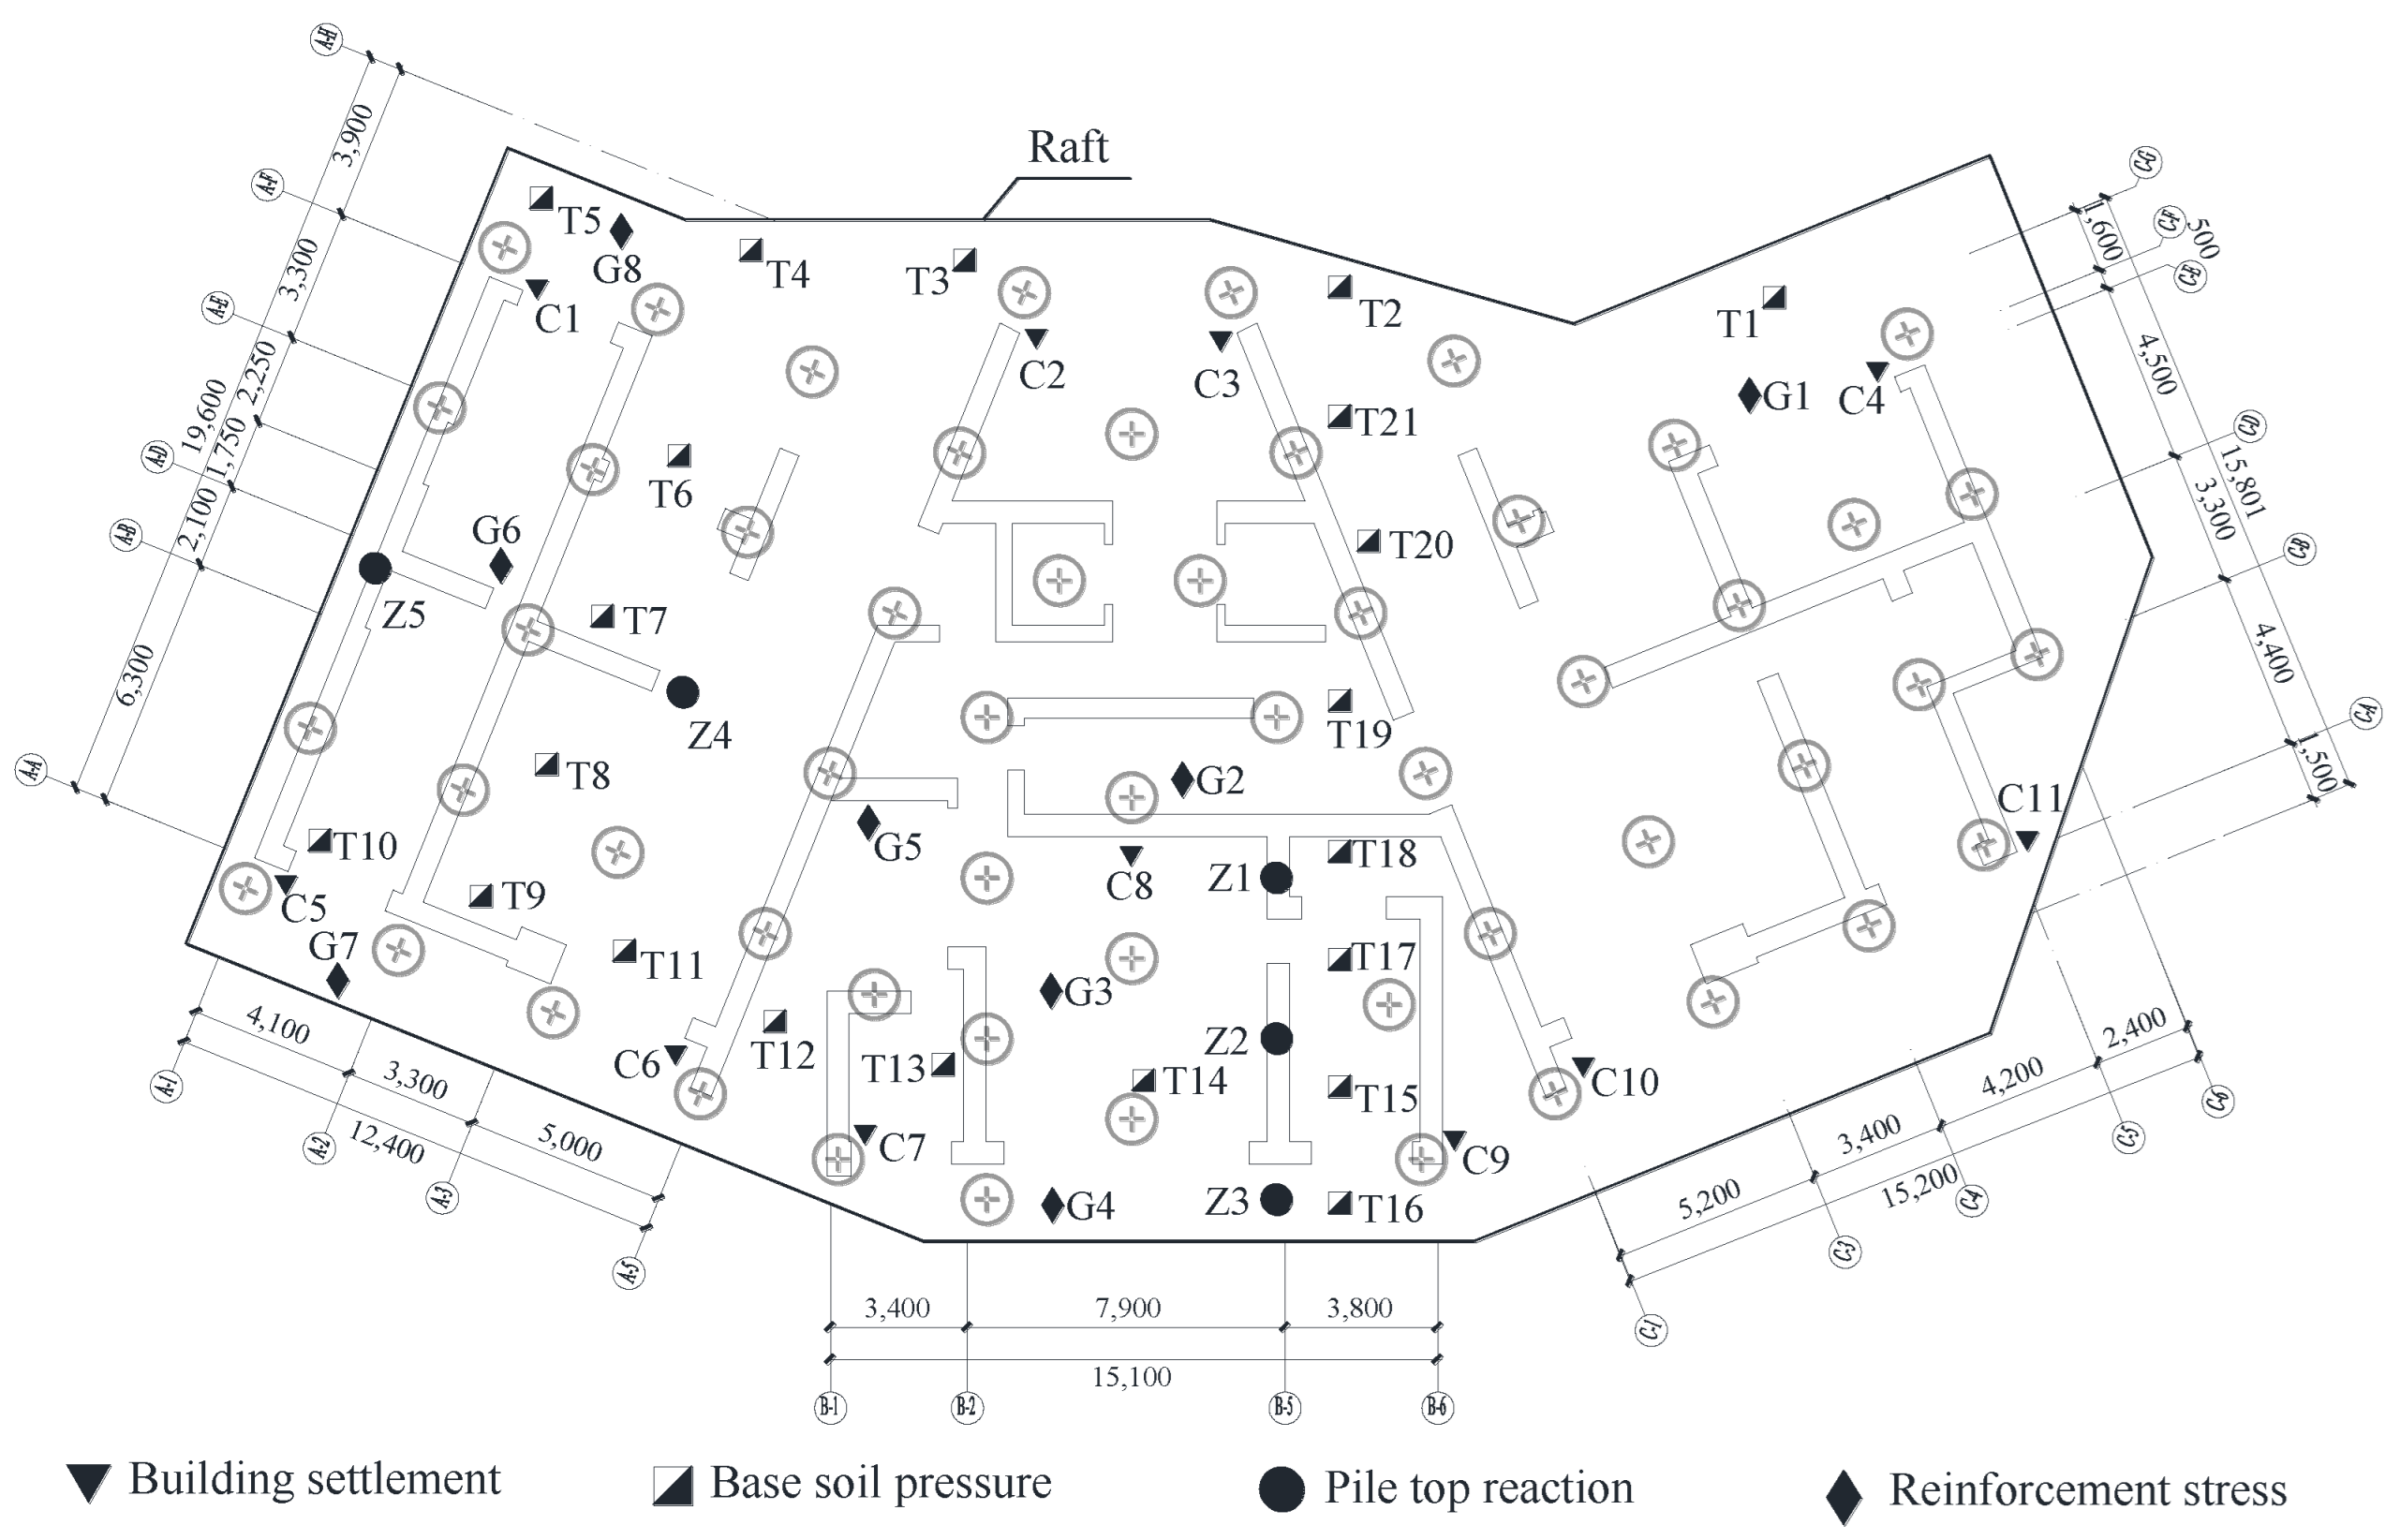
6. Monitoring Measurement
The project completed the construction of the two-story cushion and the main structure at the end of December 2010 and December 2011, respectively. During and after construction, a comprehensive monitoring of settlements, earth pressures, deformation amount of deformation adjustors, pile top reactions, steel bar stress, and load-sharing ratios between soils and piles was carried out. The monitoring measurement lasted for seventeen months from January 2011 to May 2012 and the monitoring points were arranged, as shown in
Figure 16.
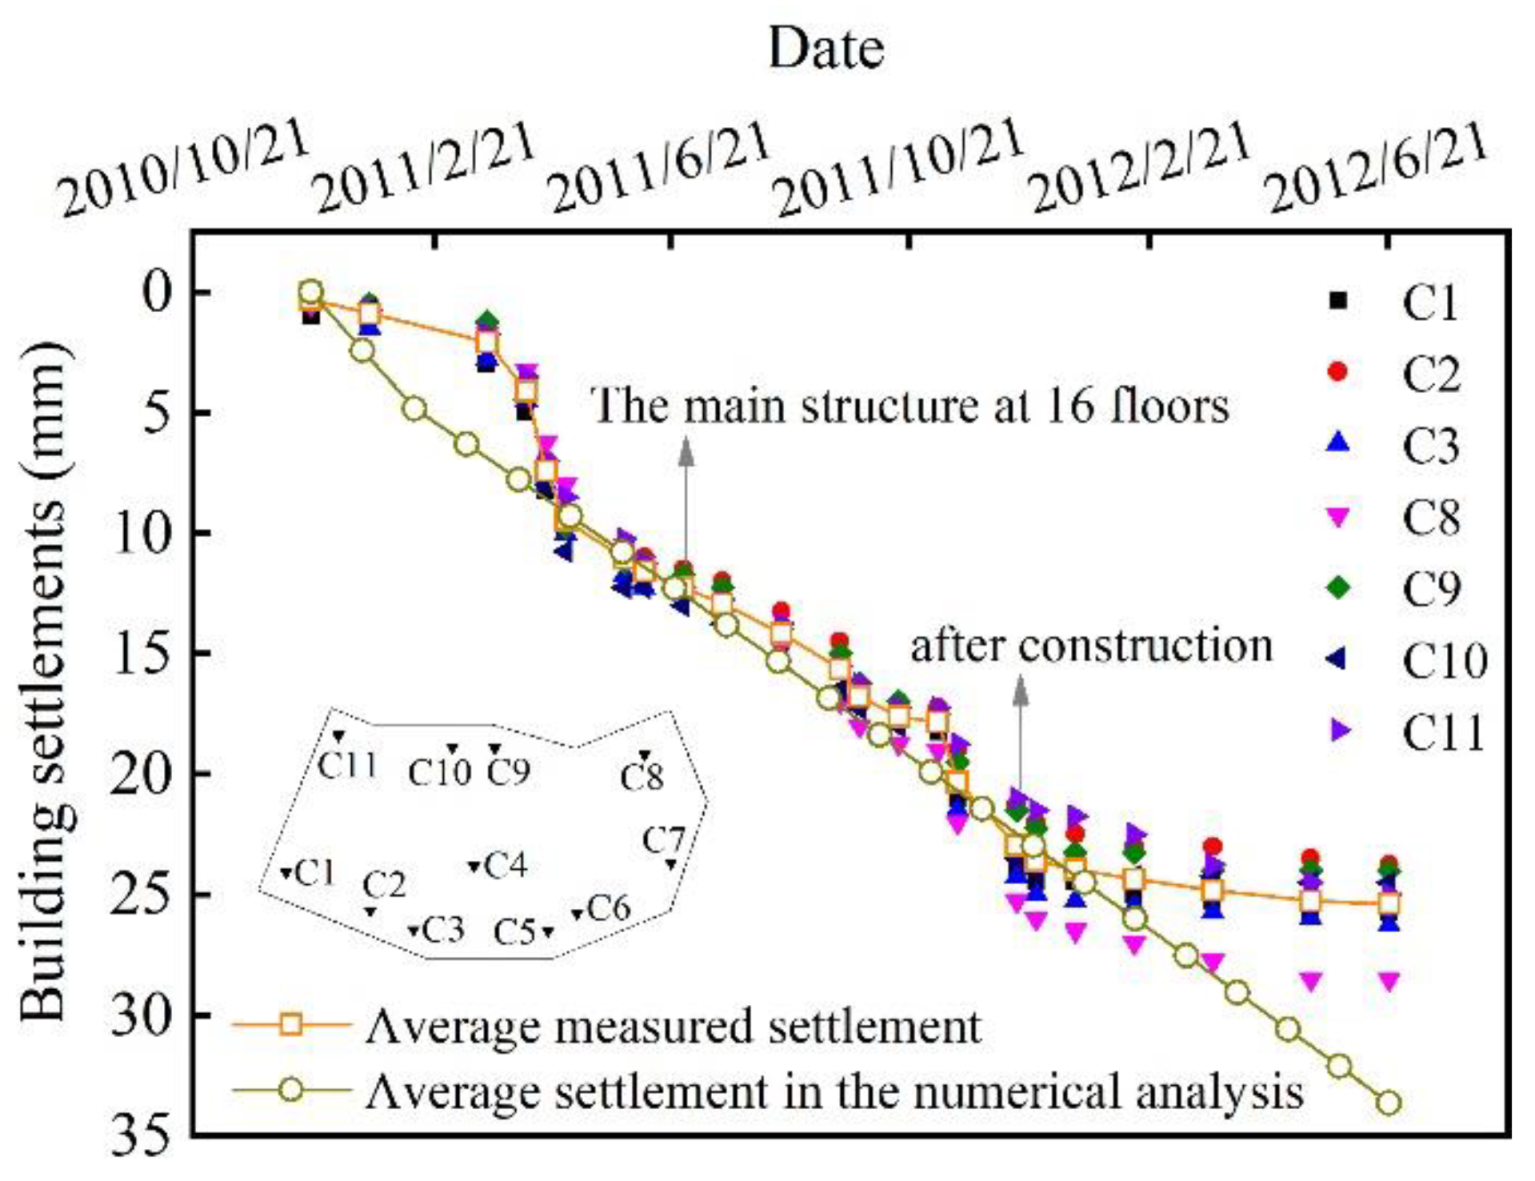
6.1. Analysis of Settlements
Eleven monitoring points were arranged on the raft during construction and seven monitoring points were still active after construction.
Figure 17 presents the curve of the building settlements variation with time. The maximum settlements were measured at C8 and C3, while the minimum settlement was at C11. Such a difference of settlement distribution may be attributed to the fact that the raft was irregular and that some monitoring points might be located at the elevator shaft or the raft corner. The average settlement and differential settlement were 24.5 mm and 4.2 mm after construction, and then, half a year later, the average settlement and differential settlement were 25.4 mm and 5.1 mm, respectively. The measured values were significantly lower than the calculated values listed in
Table 2 and the numbers in [
20], which were less than 200 mm for the total settlement and less than 0·001
R0 for the differential settlement.
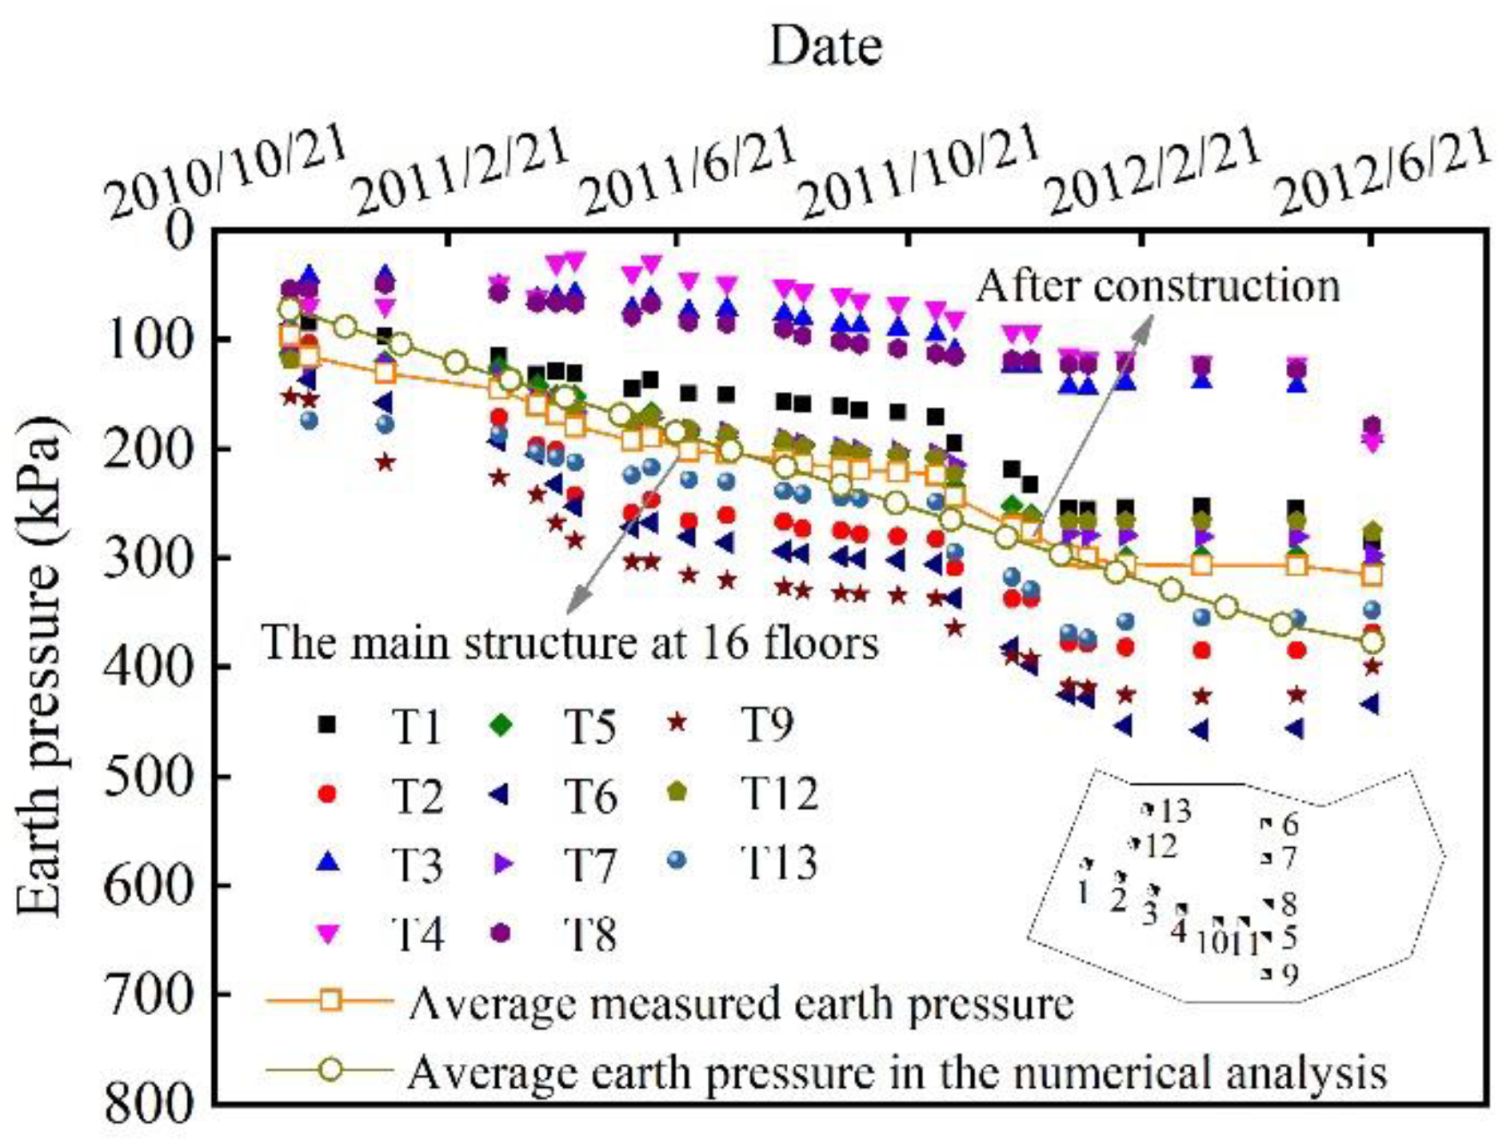
6.2. Analysis of Earth Pressure
During construction, 21 earth pressure cells were installed between the raft and the soil, 11 of which remained at work after construction.
Figure 18 shows the curve of earth pressure variation with time. It was seen that the earth pressure increased significantly over time during construction. The maximum and minimum earth pressure were up to 433 kPa and 152 kPa, respectively. After construction, the average earth pressure tended to be stable and had a value of about 315 kPa, which was less than the value in the numerical analysis. Considering that the load applied was about 80% of the design value, the above results are relatively reasonable.
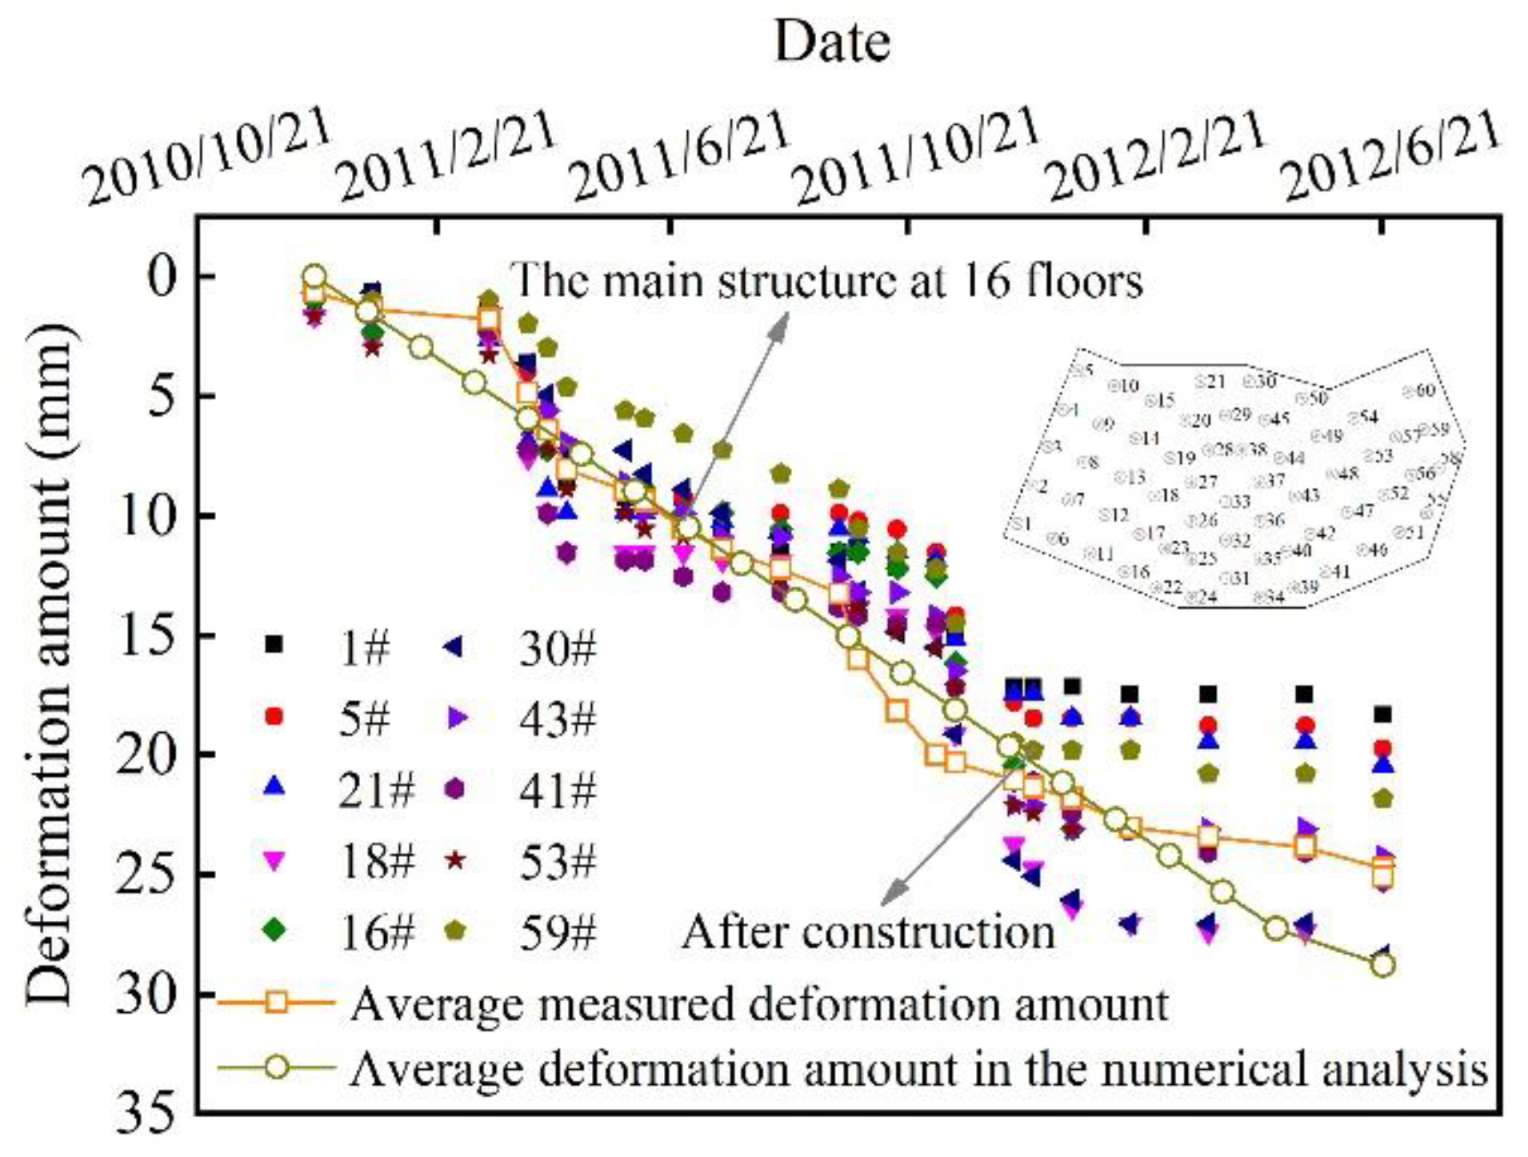
6.3. Analysis of Deformation Amount of Deformation Adjustors
In this project, 60 deformation adjustors with monitoring sensors (1#–60#) were placed on the top of the piles, and 54 monitoring sensors were still active after construction. The deformation amount of the deformation adjustors was obtained by subtracting the pile top settlement measured from the building or raft settlement.
Figure 19 shows the curve of deformation amount of deformation adjustor variation with time. As shown in
Figure 19, the deformation amount increased relatively linearly with the load applied during construction, which was consistent with numerical results. After construction, the deformation amount gradually became stable. The maximum deformation amount was up to 26.1 mm and the average deformation amount was approximately 25.8 mm.
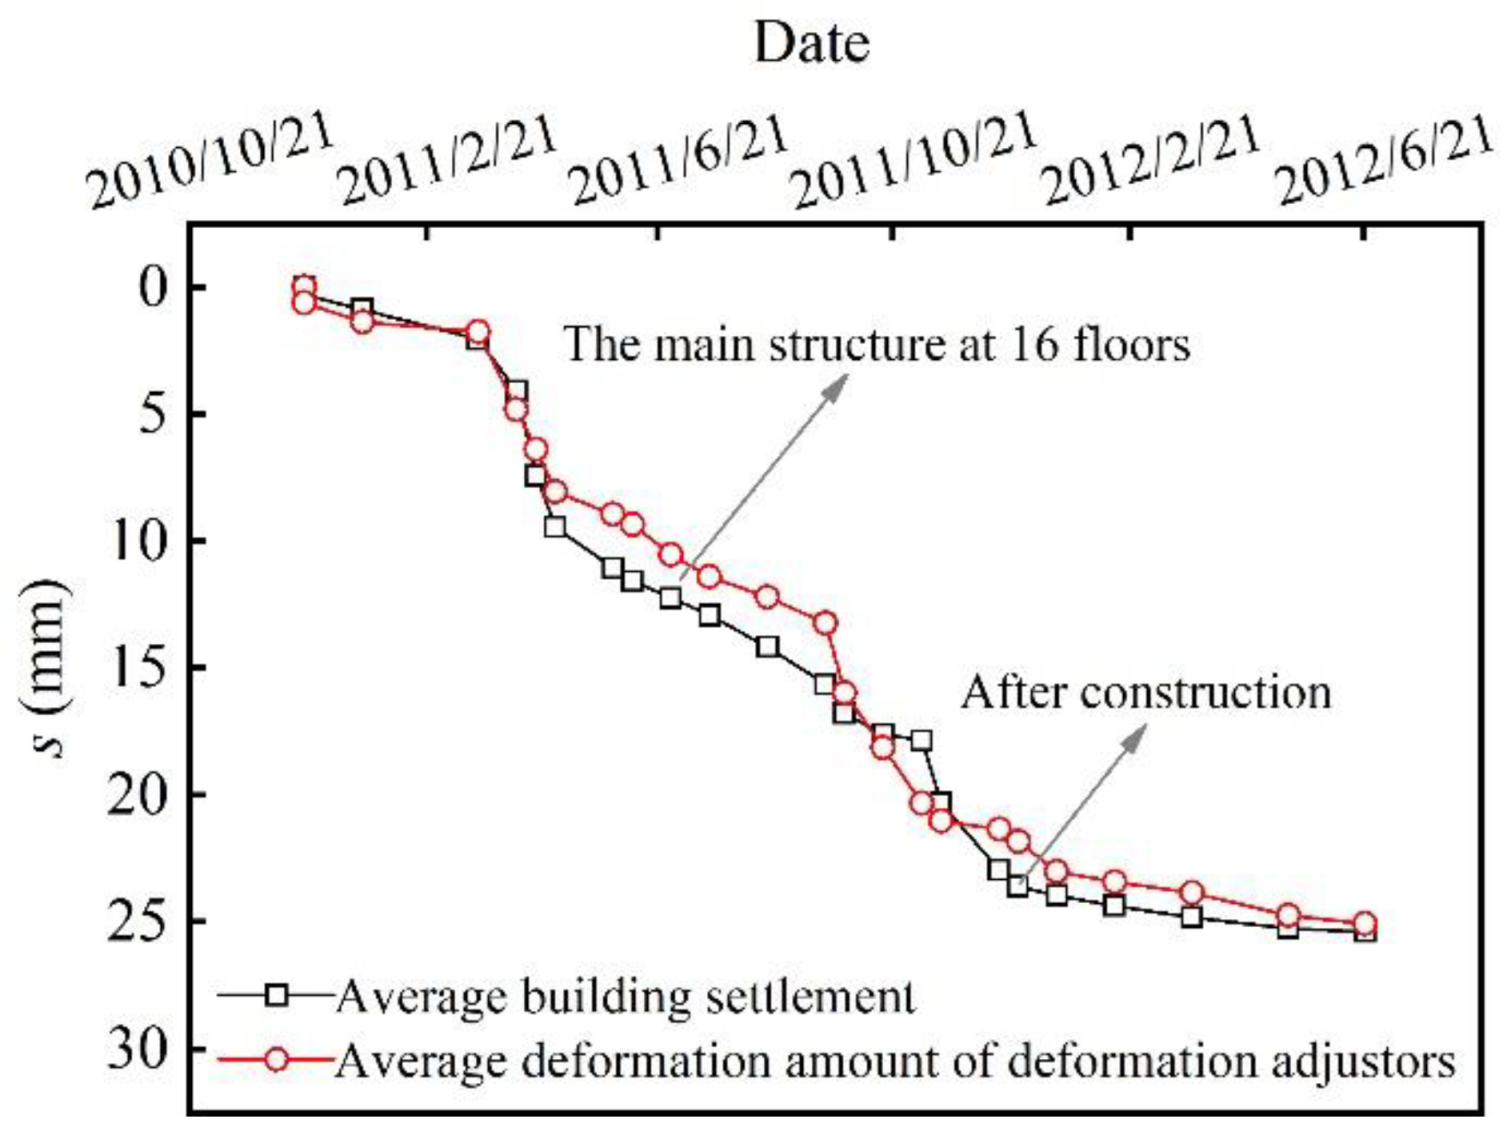
Figure 20 is the comparison curve between the average deformation amount and average building settlement. As shown in
Figure 20, the average deformation amount of the deformation adjustors was slightly smaller than the average building settlement, which is in agreement with numerical results. It indicated that the end bearing soil and pile body still have a small amount of deformation.
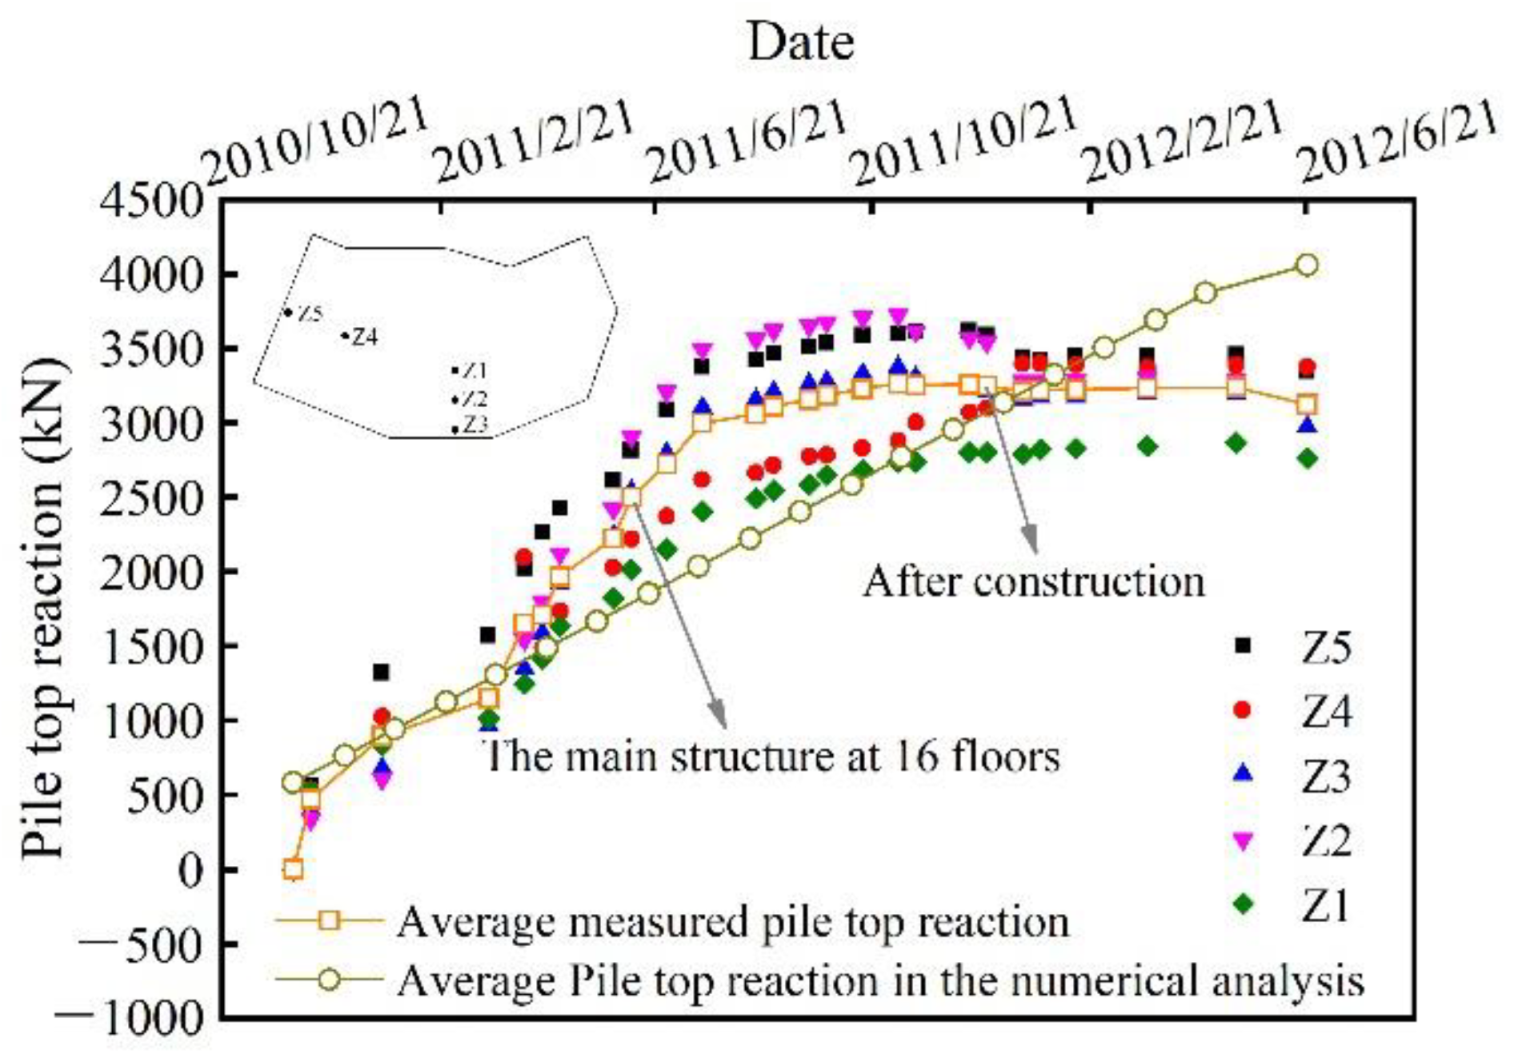
6.4. Analysis of Pile Top Reaction
The sensors were installed on the top of the piles to measure the pile top reaction during and after construction.
Figure 21 presented the curve of pile top reaction variation with time. As shown in
Figure 21, the average pile top reaction increased significantly during construction and was up to 3246 kN after construction, which was consistent with the numerical results. However, the pile top reactions were unequal in different monitoring points. The possible reason for such a phenomenon was that each monitoring point had a different soil sharing area, leading to various measured pile top reactions. Additionally, the pile top reaction became stable and decreased slightly at 3120 kN until the termination of the monitoring in June 2012, while the pile top reaction still increased in linear in the numerical analysis. This is because the decoration load and live load had not been applied, leading to the applied load being smaller than the design value. In the numerical analysis, the load, which was consistent with the design value, was applied linearly. Consequently, the measurements were reasonable, which also indicated that the load distribution between soils and piles was further adjusted over time.
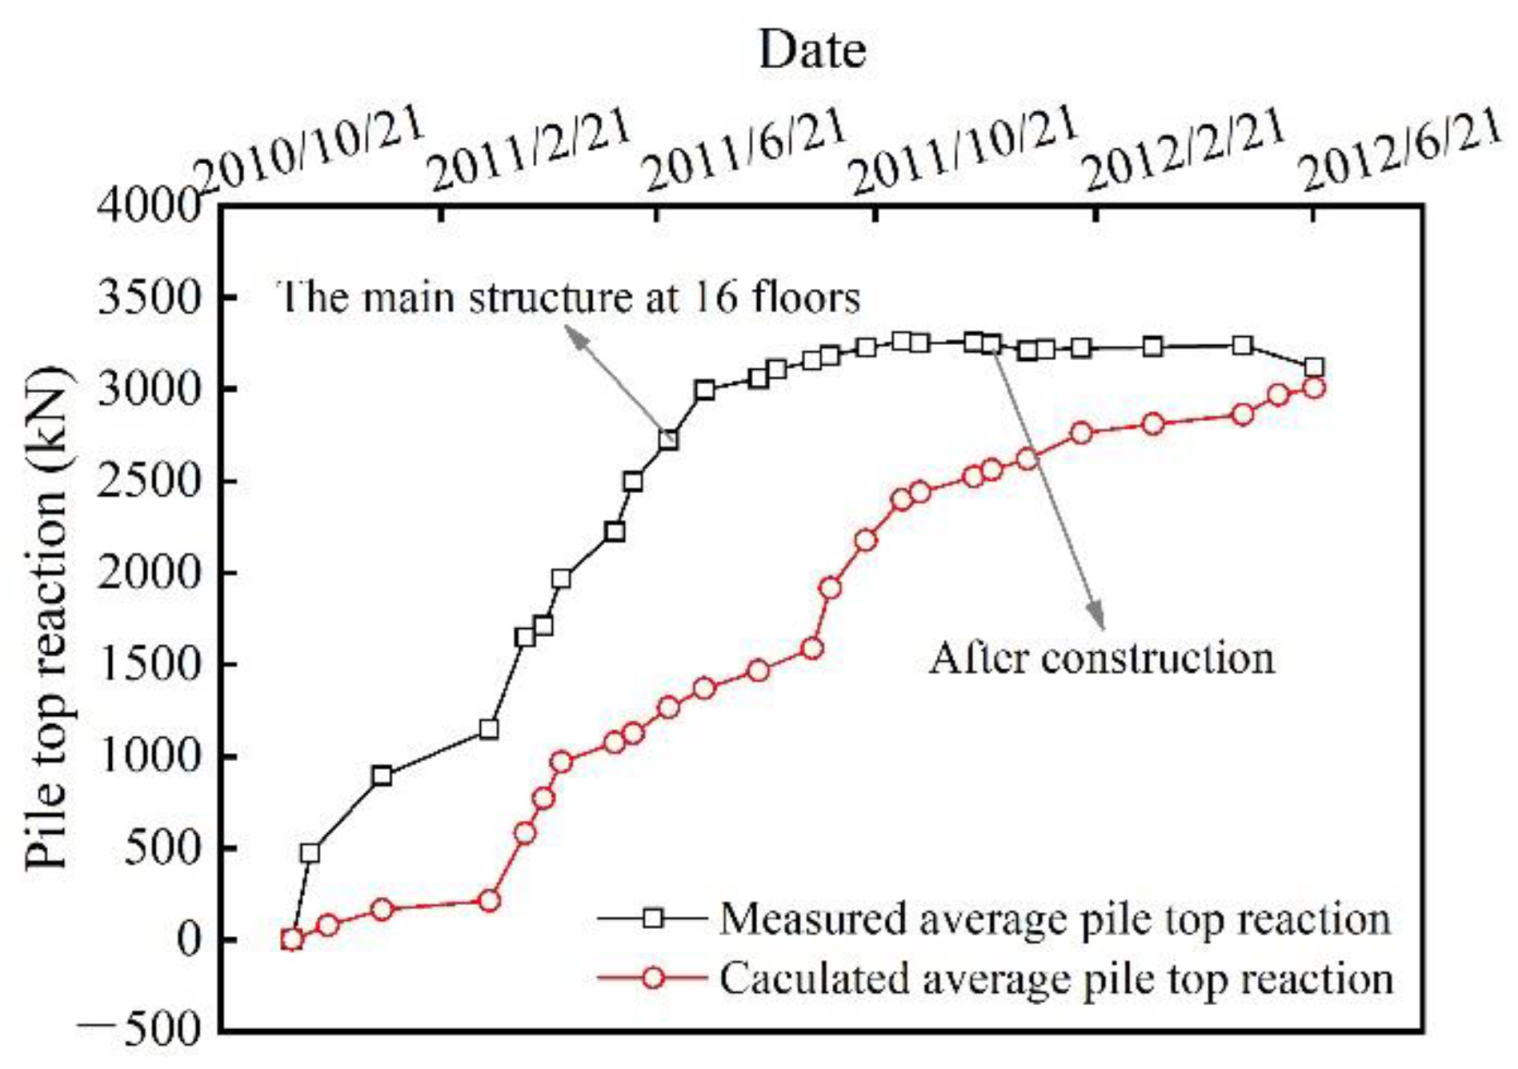
The average pile top reaction can be approximately calculated according to its stiffness and deformation amount.
Figure 22 presented the curve of measured and calculated average pile top reaction variation with time. Since the average deformation amount of the deformation adjustor was obtained from 54 piles and the measured average pile top reaction was only obtained by five piles, the calculated average pile top reaction is significantly smaller than the measured value. However, it still indicated that the trends of measured average pile top reaction variation with time were basically in line with the calculated average pile top reaction.
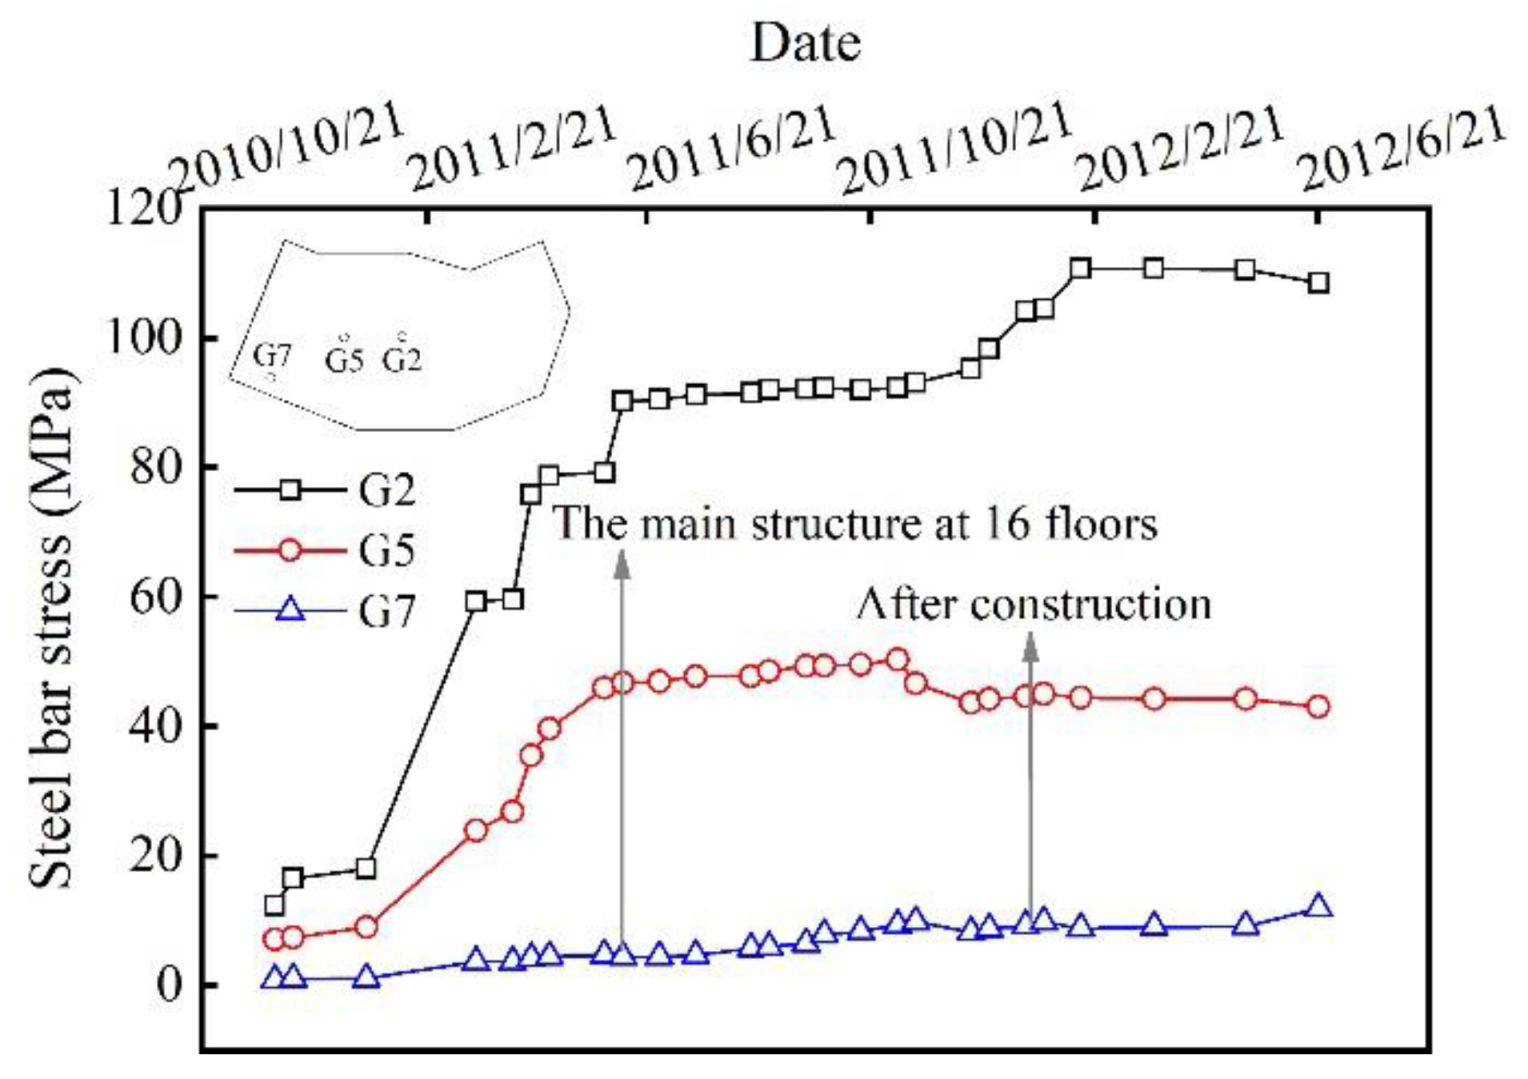
6.5. Analysis of Steel Bar Stress
In this project, eight bar stress meters were installed within the raft in order to measure the stress distribution in the raft.
Figure 23 presented the curve of steel bar stress variation with time. As shown in
Figure 23, the steel bar stress significantly improved with the increase of load applied prior to the 16th floor of the main structure. Since then, the steel bar stress tended to be stable until the completion of the construction. The maximum steel bar stress was at G2, followed by G5, and then G7. This is because G2 was located in the core tube, where the structure was more rigid, and the load was concentrated. G5 and G7 were located on the edge of a shear wall and in the edge area of the raft with a small load, respectively. After construction, the maximum steel bar stress was 108.5 MPa, which did not reach the 1/3 of the design value. It was consistent with the facts written in the literature stating that the measured stress of most steel bars within the raft was low. After the field observation, there was no cracking or water seepage on the raft surface, indicating that the design concept of piled raft foundations with deformation adjustors was successful.
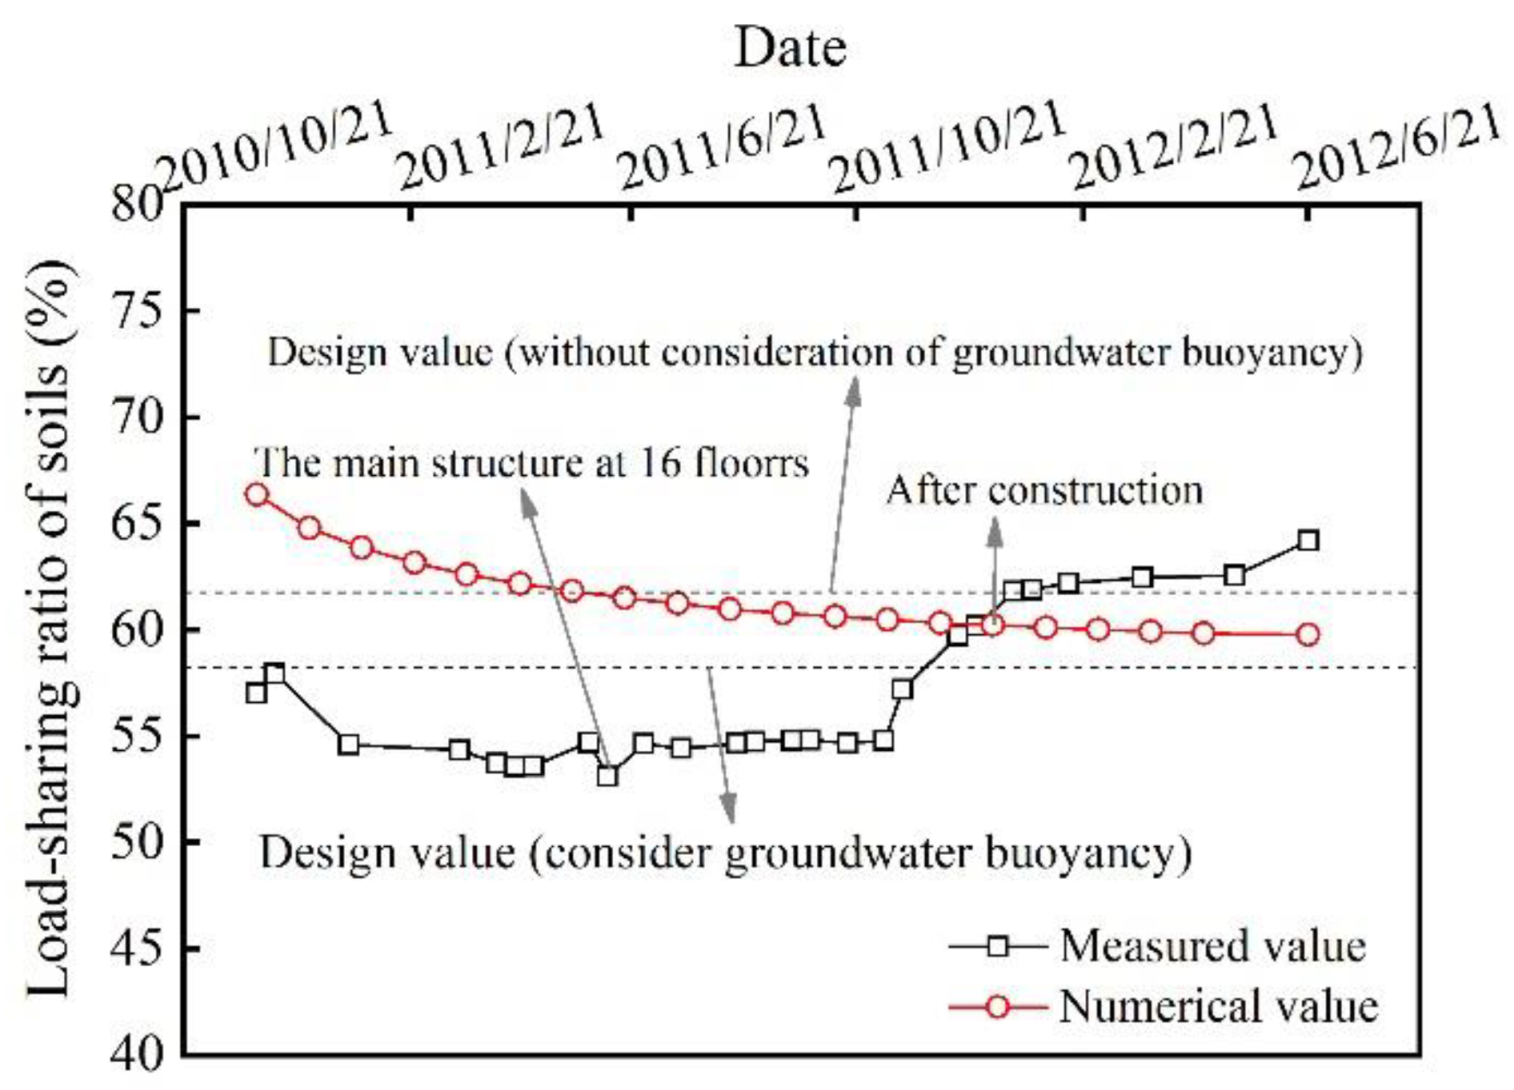
6.6. Analysis of Load-Sharing Ratio between Soils and Piles
In this project, the soil bearing capacity has significant utilization potential. Thus, the soil was designed to have an allowable bearing capacity of 353 kPa for supporting 62% of the superstructure load, whereas the piles were designed to bear 38% of the applied loads. The load-sharing ratio between soils and piles can be derived from the measured average earth pressure and the measured average pile top reaction directly.
Figure 24 presented the curve of the load-sharing ratio of soil variation with time. As shown in
Figure 24, the load-sharing ratio of soils varied with time but fluctuated around the design value. After construction, the load-sharing ratio gradually became stable. The measured value indicated that the load-sharing ratio of soils was 63%, which is slightly higher than the design value and numerical results. The application of deformation adjustors put the end-bearing piles and soils into play synchronously, which was essentially different from friction piles.
In addition, the numerical results showed that the load-sharing ratio of soils was high in the beginning of construction, and then gradually reduced to the design value with load applied, which was not exactly the same with measured results. This is because the raft and soil were in contact first, and soils deformed earlier than the deformation adjustors, leading to soil carrying more load in the beginning. As the deformation adjustors worked, the load-sharing ratio between soil and piles gradually stabilized.
7. Conclusions
(a) The pile-raft foundation with deformation adjustors was used successfully in complicated soil conditions. The deformation adjustors solved the challenges caused by abundant boulders and made the piled raft foundation into a coordinated deformation.
(b) As an application of deformation adjustors with different stiffness, the differential settlement of the building could be well controlled. The earth pressure distribution is also more uniform. However, the difference of pile top reactions was large, and the design scheme was more complex. It still needs to be tested and studied later.
(c) Deformation adjustors helped to adjust the stiffness difference so that soils and piles would jointly bear superstructure loads. In this case study, the soil was capable of supporting 63% of superstructure loads, whereas piles carried 37% of the loads.
(d) The piled raft foundations with deformation adjustors have been successfully applied to more than 20 projects, showing a better performance than conventional piled raft foundations in challenging conditions. However, the stiffness of current deformation adjustors cannot be changed after installation. Further studies are encouraged to carry out investigations on the active control technology of stiffness during the working period of deformation adjustors.
Author Contributions
Conceptualization, R.Z. and F.Z.; methodology, R.Z.; validation, Z.W., S.D. and X.D.; formal analysis, R.Z.; investigation, F.Z.; data curation, W.X.; writing—original draft preparation, R.Z. and Z.Z.; project administration, R.Z. and F.Z.; funding acquisition, R.Z., F.Z., S.D. and Z.W. All authors have read and agreed to the published version of the manuscript.
Funding
This research was funded by the financial support from Natural Science Foundation of Jiangsu Province (Nos. BK20220356, BK20200400 and BK20200707) and National Natural Science Foundation of China (Nos. 51778287, 52008100 and 52008208).
Institutional Review Board Statement
Not applicable.
Informed Consent Statement
Not applicable.
Data Availability Statement
The data used to support the findings of this study are available from the authors upon request.
Conflicts of Interest
The authors declare that they have no conflict of interest to report regarding the present study.
References
- Wu, J.T.; El Naggar, M.H.; Zhao, S.; Wen, M.J.; Wang, K.H. Beam-unequal length piles-soil coupled vibrating system considering pile-soil-pile interaction. J. Bridge Eng. 2021, 26, 04021086. [Google Scholar] [CrossRef]
- Zhang, Y.P.; Wu, W.B.; Zhang, H.K.; El Naggar, M.H.; Wang, K.H.; Jiang, G.H.; Mei, G.X. A novel soil-pile interaction model for vertical pile settlement prediction. Appl. Math. Model. 2021, 99, 478–496. [Google Scholar] [CrossRef]
- Ko, J.Y.; Cho, J.Y.; Jeong, S.S. Closure: Analysis of load sharing characteristics for a piled raft foundation. Geotech. and Eng. 2018, 16, 99–102. [Google Scholar]
- Mayne, P.W.; Poulos, H.G. Approximate displacement influence factors for elastic shallow foundations. J. Geotech. Geoenvironmental Eng. 1999, 125, 453–460. [Google Scholar] [CrossRef]
- Randolph, M.F. Design methods for pile groups and piled rafts. In Proceedings of the 13th International Conference of Soil Mechanics and Foundation Engineering, New Delhi, India, 1 January 1994; Taylor & Francis: Leiden, The Netherlands, 1994; Volume 5, pp. 61–82. [Google Scholar]
- Randolph, M.F.; Wroth, C.P. Analysis of deformation of vertically loaded piles. J. Geotech. Eng. 1978, 104, 1465–1488. [Google Scholar] [CrossRef]
- Reul, O.; Randolph, M.F. Design strategies for piled raft subjected to nonuniform vertical loading. J. Geotech. Geoenvironmental Eng. 2004, 130, 1–13. [Google Scholar] [CrossRef]
- Mandolini, A.; Russo, G.; Viggiani, C. Pile foundations: Experimental investigations, analysis and design. In Proceedings of the 16th International Conference on Soil Mechanics and Geotechnical Engineering, Osaka, Japan, 12–16 September 2005; Balkema: New York, NY, USA, 2005; Volume 1, pp. 177–213. [Google Scholar]
- Lee, S.H.; Chung, C.K. An experimental study of the interaction of vertically loaded pile groups in sand. Can. Geotech. J. 2005, 42, 1485–1493. [Google Scholar] [CrossRef]
- Fleming, K.; Weltman, A.; Randolph, M.; Elson, K. Piling Engineering; Taylor & Francis: New York, NY, USA, 2009. [Google Scholar]
- Liang, F.Y.; Chen, L.Z.; Shi, X.G. Numerical analysis of composite piled raft with cushion subjected to vertical load. Comput. Geotech. 2003, 30, 443–453. [Google Scholar] [CrossRef]
- Sharma, V.J.; Vasanvala, S.A.; Solanki, C.H. Behaviour of cushioned composite piled raft foundation under lateral forces. Indian Geotech. J. 2015, 45, 89–97. [Google Scholar] [CrossRef]
- Liu, H.K.; Xia, T.D. Pile-soil stress analysis of geogrid-reinforced pile-supported embankments with piles arranged in triangle. J. Cent. South Univ. 2014, 45, 3957–3963. [Google Scholar]
- Poulos, H.; Mattes, N. Settlement and load distribution analysis of pile groups. Aust. Geomech. J. 1971, 1, 18–28. [Google Scholar]
- Zhou, F.; Lin, C.; Wang, X.D.; Cheng, J.Y. Application of deformation adjustors in piled raft foundations. Proc. Inst. Civ. Eng. Geotech. Eng. 2016, 169, 527–540. [Google Scholar] [CrossRef]
- Zai, J.M. Theory and Practice of Composite Pile Foundation; Intellectual Property Publishing House: Beijing, China, 2004. [Google Scholar]
- Zhou, F.; Qu, W.; Guo, T.X.; Lin, S.Z. Engineering practice of composite end-bearing pile foundation based on settlement control. Chin. J. Rock Mech. Eng. 2015, 5, 1071–1079. [Google Scholar]
- Zhou, F.; Lin, C.; Zhang, F.; Lin, S.Z.; Wang, X.D. Design and field monitoring of pile-raft foundations with deformation adjustors. J. Perform. Constr. Facil. 2016, 30, 04016057. [Google Scholar] [CrossRef]
- CDC. Technical Code for Design of Building Foundation (GB 50007); China Building Industry Press: Beijing, China, 2002.
- CDC. Technical Code for Building Pile Foundations (JGJ 94); China Building Industry Press: Beijing, China, 2008.
- Hibbitt, H.; Karlsson, B.; Sorensen, P. ABAQUS. Theory Manual, Verion. 6.12; SIMULIA: Providence, RI, USA, 2012. [Google Scholar]
- Tradigo, F.; Pisanò, F.; Prisco, C.D. On the use of embedded pile elements for the numerical analysis of disconnected piled rafts. Comput. Geotech. 2016, 72, 89–99. [Google Scholar] [CrossRef]
- Bjerrum, L. Allowable settlement of structures. In Proceedings of the 3rd European Conference on Soil Mechanics and Foundation Engineering, Weisbaden, Germany, 1963; Volume 2, pp. 135–137. [Google Scholar]
Figure 1.
Project Information.
Figure 1.
Project Information.
Figure 2.
Typical geological section.
Figure 2.
Typical geological section.
Figure 3.
Mechanical model of piled raft foundations with deformation adjustors.
Figure 3.
Mechanical model of piled raft foundations with deformation adjustors.
Figure 4.
Plan of pile arrangement.
Figure 4.
Plan of pile arrangement.
Figure 5.
Typical finite element mesh.
Figure 5.
Typical finite element mesh.
Figure 7.
Numerical analysis scheme: deformation adjustors in different regions (a), direction of the path (b).
Figure 7.
Numerical analysis scheme: deformation adjustors in different regions (a), direction of the path (b).
Figure 8.
Curve of raft settlement along path 1.
Figure 8.
Curve of raft settlement along path 1.
Figure 9.
Curve of raft settlement along path 2.
Figure 9.
Curve of raft settlement along path 2.
Figure 10.
Curve of earth pressure along path 1.
Figure 10.
Curve of earth pressure along path 1.
Figure 11.
Curve of earth pressure along path 2.
Figure 11.
Curve of earth pressure along path 2.
Figure 12.
Curve of deformation amount of deformation adjustors variation with percentage of load applied.
Figure 12.
Curve of deformation amount of deformation adjustors variation with percentage of load applied.
Figure 13.
Curve of pile top reaction variation with percentage of load applied.
Figure 13.
Curve of pile top reaction variation with percentage of load applied.
Figure 14.
Curve of load-sharing ratio of soils variation with percentage of load applied.
Figure 14.
Curve of load-sharing ratio of soils variation with percentage of load applied.
Figure 15.
Curve of load-sharing ratio of soils variation with stiffness of deformation adjustors.
Figure 15.
Curve of load-sharing ratio of soils variation with stiffness of deformation adjustors.
Figure 16.
Arrangement of monitoring points.
Figure 16.
Arrangement of monitoring points.
Figure 17.
Curve of building settlements variation with time.
Figure 17.
Curve of building settlements variation with time.
Figure 18.
Curve of earth pressure variation with time.
Figure 18.
Curve of earth pressure variation with time.
Figure 19.
Curve of deformation amount of deformation adjustor variation with time.
Figure 19.
Curve of deformation amount of deformation adjustor variation with time.
Figure 20.
Comparison curve between average deformation amount and average building settlement.
Figure 20.
Comparison curve between average deformation amount and average building settlement.
Figure 21.
Curve of pile top reaction variation with time.
Figure 21.
Curve of pile top reaction variation with time.
Figure 22.
Curve of measured and calculated average pile top reaction variation with time.
Figure 22.
Curve of measured and calculated average pile top reaction variation with time.
Figure 23.
Curve of steel bar stress variation with time.
Figure 23.
Curve of steel bar stress variation with time.
Figure 24.
Curve of load-sharing ratio of soil variation with time.
Figure 24.
Curve of load-sharing ratio of soil variation with time.
Table 1.
Design parameters.
Table 1.
Design parameters.
| Quantity | Meaning | Value |
|---|
| Ppr (kN) | Loads applied to the piled raft | 660,000 |
| qt (kN) | Allowable axial bearing capacity of a single pile | 4200 |
| Rr (kPa) | Allowable raft bearing capacity | 450 |
| A (m2) | Gross raft area | 960 |
| η | Group stiffness efficiency factor | 1.0 |
| kr (kN/mm) | Stiffness of the raft alone | 8912 |
| ξ | Load-sharing ratio of soils | 0.62 |
| na | Number of deformation adjustors per pile | 1 |
| kPa (kN/mm) | Overall stiffness of a single pile with deformation adjustors | 7268 |
| ka (kN/mm) | Stiffness of a deformation adjustor | 120 |
| n | Pile number | 60 |
| St (mm) | Calculated total settlement of the building | 64 |
| Sd (mm) | Calculated differential settlement of the building | 16 |
Table 2.
Model parameters.
Table 2.
Model parameters.
| Material | Model | Elastic Modulus (MPa) | Cohesion (kPa) | Internal Friction Angle | Poisson’s Ratio | Unit Weight (kN/m3) |
|---|
| Pile | Linear elasticity | 30,000 | - | - | 0.2 | 25 |
| Raft | Linear elasticity | 30,000 | - | - | 0.2 | 25 |
| ⑥Residual soil | Mohr–Coulomb plasticity | 35 | 18 | 28 | 0.3 | 18.6 |
| ⑦Completely weathered granite | 60 | 40 | 27 | 0.3 | 19.5 |
| ⑧Strongly weathered granite | 500 | 45 | 30 | 0.25 | 20.5 |
Table 3.
Different stiffness of deformation adjustors.
Table 3.
Different stiffness of deformation adjustors.
| Adjuster Number | DA-0 | DA-5 | DA-12 | DA-20 | DA-30 | DA-mix |
|---|
| Stiffness(kN/m) | 0 | 50,000 | 120,000 | 200,000 | 300,000 | Table 4 |
Table 4.
The mixed stiffness of deformation adjustor.
Table 4.
The mixed stiffness of deformation adjustor.
| Aera | 1 | 2 | 3 | 4 |
|---|
| Stiffness (kN/m) | 50,000 | 100,000 | 200,000 | 300,000 |
| Publisher’s Note: MDPI stays neutral with regard to jurisdictional claims in published maps and institutional affiliations. |
© 2022 by the authors. Licensee MDPI, Basel, Switzerland. This article is an open access article distributed under the terms and conditions of the Creative Commons Attribution (CC BY) license (https://creativecommons.org/licenses/by/4.0/).


 ,
, 


