Article

Study on Shear-Lag Effect of Steel–UHPC Ribbed Slab Composite Structures Using Bar Simulation Method

1
Key Laboratory for Wind and Bridge Engineering of Hunan Province, College of Civil Engineering, Hunan University, Changsha 410082, China
2
Anhui Transport Consulting & Design Institute Co., Ltd., Hefei 230088, China
*
Author to whom correspondence should be addressed.
Buildings 2022, 12(11), 1884; https://doi.org/10.3390/buildings12111884
Submission received: 23 September 2022 / Revised: 19 October 2022 / Accepted: 2 November 2022 / Published: 4 November 2022
(This article belongs to the Special Issue Reinforced Concrete Buildings)

Abstract

:
Recently, Ultra-High Performance Concrete (UHPC) has attracted increasing attention in civil engineering. Numerous steel–UHPC composite structures have been constructed around the world. The proper consideration of the shear-lag effect has a significant influence on the safety of structures. In view of the shear-lag effect of steel–UHPC ribbed slab composite structure (SU-RSCS) in the elastic stage, a theoretical calculation model based on the bar simulation method is first developed. Then, the feasibility and accuracy of that are verified using both experimental data and numerical simulation. Moreover, many factors (including width-to-span ratio, the ratio of rib height to UHPC layer thickness, the ratio of rib width to rib spacing, and the number of transverse ribs) are parametrically investigated to further investigate the structural shear-lag effect using the proposed method. In addition, the orthogonal analysis is applied to determine the sensitivity of each parameter to the shear-lag effect. The parametric interactions are also considered. At last, the comparison between calculation results of the proposed method and specifications are discussed. The results show that the proposed approach can accurately predict the shear-lag effect on SU-RSCSs in the elastic stage. It is also found that the width-to-span ratio has a great influence on the structural shear-lag effect, while the number of transverse ribs has no significant influence on that.

Graphical Abstract

1. Introduction

For long-span concrete bridges, e.g., cable-stayed bridges and suspension bridges, the anchor points of the cable are prone to cause local cracks on concrete slabs on account of stress concentration [1]. In addition, due to material limitations, traditional steel–Normal Concrete Composite Structures (SNC-CSs) suffer from high self-weight, poor durability, high risk of concrete cracking, and steel beam buckling in applications [2,3]. Thus, there is a need for higher quality and stronger engineering materials to solve these issues.
Ultra-High Performance Concrete (UHPC) is regarded as one of the most innovative cement-based engineering materials over the past few decades, which has excellent tensile properties, compressive properties, ductility, durability, and fatigue resistance [4,5]. In view of the excellent mechanical properties of UHPC, it is natural to use it instead of normal concrete in the traditional composite structure to form the steel–UHPC Composite Structure (SU-CS) [6]. Studies have shown that, compared with the traditional SNC-CS, the thickness of the SU-CS bridge deck can be reduced by 50–60%, and its own weight can be reduced by 40% [7]. Therefore, SU-CS [8,9] can be used to extend the economic span of steel–concrete composite girder cable-stayed bridges from 400–600 m to 1000 m, which is of great significance for the development of long-span structures. In addition, due to the strong crack resistance, in comparison to SNC-CS, the cracking load and ultimate flexural capacity of the SU-CS could be increased by about 340% and 26%, respectively, under the negative bending moment [10]. It is also found that the cracks in SU-CSs are tighter than those in SNC-CSs, which indicates that UHPC can effectively redistribute the stress and limit the development of the main cracks [11]. Similarly, the UHPC layer of the bridge deck system can also improve the fatigue resistance and overload resistance of the structure. The results showed that UHPC could effectively reduce the maximum stress range and effective stress range at the fatigue details of the bridge deck, thus improving the fatigue life of the structure [12]. Moreover, the SU-CS can reduce the fatigue stress of traditional orthotropic steel decks by 80%, and prolong the fatigue life by two times that of the design requirement [13]. In regard to the dynamic characteristics, although the damping effect of the UHPC layer of SU-CS is not as good as that of the conventional NC layer, the rigidity of the steel bridge deck is still ensured in the low-frequency range [14]. Furthermore, SU-CSs can also be used for the renovation of existing steel bridge decks to reduce or avoid damage to flexible pavement [15]. To sum up, SU-CSs show considerable potential in field applications.
It is well understood that the thickness of the bridge deck can be greatly reduced when UHPC material is used. To maintain its high flexural stiffness, the solution of adding longitudinal and transverse stiffening ribs below the thin UHPC plate is proposed, thus constituting a steel–UHPC Ribbed Slab Composite Structure (SU-RSCS). Wang Y et al. [16] proposed a steel–UHPC longitudinal ribbed slab composite structure (SU-LRSCS) that contains steel plates. The bending and shearing properties were experimentally investigated. The results ensure that this structure is applied to a field suspension bridge (Qinglong Island Bridge) in China. Zhu J et al. [17,18] applied the SU-CS to the waffle deck system to form steel–UHPC Waffle Slab Composite Structure (SU-WSCS). The bending and shearing characteristics were experimentally and numerically studied. In addition, the ratio of rib height to upper panel thickness, the ratio of longitudinal rib width to longitudinal rib spacing, and the ratio of transverse rib spacing to longitudinal rib spacing, are parametrically analyzed. Compared with the SU-CS, SU-RSCS has advantages in terms of light self-weight and high cross-section stiffness, and has great application prospects.
Shear-lag effect is an important concept in structure mechanical analysis. It is defined as the longitudinal normal strain (referred to as strain in short) in the flange plate that is unevenly distributed along the lateral direction due to the accumulation of shear deformation. If the shear-lag effect is incorrectly calculated or ignored, the structures may have safety problems over their service life. For SU-RSCSs, the shear stiffness of the UHPC plate decreases with its thickness, and the shear-lag effect may be more pronounced. Therefore, it is of necessity to study the shear-lag effect of SU-RSCS. At present, there are many approaches to study the structural shear-lag effect, including model tests, finite element simulations and theoretical calculations. The theoretical calculation methods usually include the energy variation method, bar simulation method, and finite-segment method.
Zhou C et al. [19] proposed a calculation method to calculate the shear-lag effect of non-prismatic composite box girders with corrugated steel webs using the bar simulation method. The effects of width-span ratio, beam-height ratio, beam-height curve, and loading form on the shear lag effect are then studied by this method. For composite twin-girder decks, Zhu L et al. [20] proposed a new one-dimensional analytical model to study the effects of section variation characteristics and load type on the positive and negative shear-lag effects. Li S et al. [21] put forward an improved bar simulation method for thin-walled steel box girder, and verified its correctness and applicability through finite element models (FEM). In addition, the sensitivity analysis of the shear-lag effect was carried out including the thickness of the top and bottom plates, the thickness of the longitudinal ribs and the height of the beam. Li X et al. [22] proposed a new beam finite element (B3S) formulation to calculate the shear-lag effect of thin-walled single-and multi-cell box girders, which was verified by both finite element analysis and experimental data. Chen Y et al. [23] theoretically deduced the shear-lag coefficients of the corrugated steel web and truss composite box girder bridge using the energy variation principle, and conducted in-depth parameter sensitivity analysis through model tests and finite element analysis. As mentioned above, the bar simulation method is one of the most commonly used theoretical calculation methods for considering structural shear-lag effects, with the advantages of high accuracy, clear calculation process, easy programming, etc. [19]. The core of the bar simulation method is to simplify the structure with an equivalent model consisting of thin plates and ideal stiffeners, in which the ideal stiffeners are connected by the equivalent thin plates. The equivalent thin plate only transmits shear force, while the longitudinal ideal stiffener only transmits axial force.
In this work, the bar simulation method is used to analyze the shear-lag effect on SU-RSCS. First, the corresponding equivalent structure is developed based on some assumptions. Then, theoretical equations are derived and the calculation model is established. This model is suitable for both SU-WSCS and SU-LRSCS. The developed model is numerically and experimentally verified. Moreover, using the proposed method, some structural parameters that may affect the shear-lag effect on SU-RSCS are investigated, including the width-to-span ratio, the longitudinal rib height ratio, the longitudinal rib width ratio, and the number of transverse ribs. In addition, the sensitivity of those parameters and their interactions are studied using the orthogonal analysis. At last, the comparison between the calculation results of the proposed method and the corresponding specifications are discussed. The results show that the proposed approach can accurately predict the shear-lag effect on SU-RSCS in the elastic stage. It is also found that the width-to-span ratio has a great influence on the structural shear-lag effect, while the number of transverse ribs has no significant influence on that.

2. Theoretical Derivations

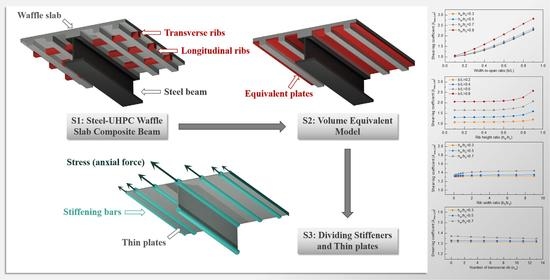
2.1. Description of the SU-RSCS

SU-RSCS is defined as steel–UHPC composite structures with ribbed slabs, including the common structural forms of the steel–UHPC waffle slab composite structure (SU-WSCS) and the steel–UHPC longitudinal ribbed slab composite structure (SU-LRSCS), as shown in Figure 1.
SU-WSCS is taken as an example to establish the theoretical calculation model for considering the shear-lag effect. As shown in Figure 2, the height of the steel beam is hs, of which the width and thickness of the upper flange are bst and hst, respectively, and those of the lower flange are bsb and hsb, respectively. The steel web height is hw and the thickness is bw. The width of the UHPC slab is b with the thickness of hc, where the thin plate has a thickness of hcp-w and the ribs have a height of hcr-w. b1~b4 denotes the width of the longitudinal ribs and their clear spacings, as shown in Figure 2b. The width of the transverse ribs is bw, and the total number of that is nw.
First, the transverse ribs in SU-WSCS are converted to the longitudinally ribbed slab according to the principle of constant volume, as shown in Figure 3. In this way, the equivalent thin plate thickness hcp and the longitudinal rib height hcr of the UHPC slab can be calculated using Equations (1) and (2), respectively, where L represents the span length. It is noted that there is no change in their width. The distance between the neutral axis of the UHPC slab and the neutral axis of the steel bottom flange plate is defined as h. Assume that there are a number of n longitudinal ribs, so the total width of that, br can be calculated according to Equation (3).
h c p = h c p w + h c r w b w n w L
h c r = h c h c p
  b r = 2 b 1 + n 1 b 3
The bar simulation method considers the objective structure as an ideal combination of stiffeners and equivalent thin plates, where the equivalent thin plates only transmit shear force, and the longitudinal stiffeners only transmit axial force [24]. SU-WSCS can be divided into stiffeners and thin plates based on the ribs as shown in Figure 4. One stiffener is used to simulate the steel lower flange plate without considering its shear-lag effect. For the UHPC slab, the stiffeners are labeled as B1~Bn+1, respectively, and the thin plates are labeled as P1~Pn, respectively. It should be noted that setting additional stiffeners probably improves the accuracy of the theoretical model [19].
The shear-lag effect is a phenomenon of uneven distribution of longitudinal stresses in the flange plate along the transverse direction, and its severity can be reflected by the shear-lag coefficient or the effective flange width [25]. Therefore, to study the shear-lag effect in SU-WSCS, it is necessary to determine the stress value of each stiffener in Figure 4, which is equal to the ratio of axial force of the stiffener to its area.

2.2. Calculation of Equivalent Area of Stiffeners

An external moment M(x) is given to the structure, and then the longitudinal normal stress (stress in short) σt at the neutral axis of the UHPC slab can be calculated according to Equation (4).
σ t = M x Z t I t c
where, Zt denotes the distance from the neutral axis of UHPC slab to the neutral axis of whole composite section, and Itc denotes the bending moment of inertia when the composite section is converted into UHPC section, given in Equation (5).
I t c = b h c p 3 12 + b h c p Z c p 2 b r h c r 3 12 + b r h c r Z c r 2 + α E b s t h s t Z s t 2 + b s b h s b 3 12 + b s b h s b Z s b 2 + t w h w 3 12 + t w h w Z w 2
of which αE is the elastic modulus ratio of steel to UHPC; Zcp is the distance from the neutral axis of the thin plate in the UHPC slab to that of whole composite section; Zcr is the distance from the neutral axis of the longitudinal ribs in UHPC slab to that of the whole composite section; Zst is the distance from the neutral axis of the steel top flange to that of the whole composite section; Zsb is the distance from the neutral axis of the steel bottom flange to that of the whole composite section; Zw is the distance from the neutral axis of the steel web to that of the whole composite section.
On the other hand, the resistance of the simplified structure is also equal to M(x), and σt can be calculated with Equation (6), where Aef is the total area of the stiffener at the UHPC slab.
σ t = M x h A e f
With Equations (4) and (6), one can calculate Aef using Equation (7).
A e f = I t c h Z t
Substituting Equation (5) into Equation (7), Aef can be expressed as
A e f = α t w h w + β p b h c p + β r b r h c r
where
α = α E h Z t h w 2 12 + Z w 2 + b s t h s t t w h w Z s t 2
β p = 1 h Z t h c p 2 12 + Z c p 2 + α E b s b h s b b h c p h s b 2 12 + Z s b 2 I c p + A c p Z c p 2 I c
β r = 1 h Z t h c r 2 12 + Z c r 2 + α E b s b h s b b r h c r h s b 2 12 + Z s b 2 I c r + A c r Z c r 2 I c
of which Ic is the moment of inertia of the UHPC slab to the neutral axis of the whole composite beam, namely I c = I c p + A c p Z c p   2 + I c r + A c r Z c r 2 ; Icp and Acp are the own moment of inertia and the cross-sectional area of the thin plate in UHPC slab, respectively, namely I c p = b h c p 3 / 12 , and A c p = b h c p , respectively; Icr and Acr are the own moment of inertia and the cross-sectional area of the longitudinal ribs in UHPC slab, respectively, namely I c r = b r h c r 3 / 12 , and A c r = b r h c r , respectively.
Based on Equation (8), the effective thickness of thin plate and longitudinal ribs in UHPC slab are defined as in Equations (12) and (13), respectively. Therefore, the equivalent area of each stiffener (as shown in Figure 4) can be calculated according to Equations (14)–(17).
h e c p = β p h c p
h e c r = β r h c r
B 1 :   A 1 = h e c p + h e c r b 4
B i ( B 2 ~ B n ) :   A i = h e c p + h e c r b 3 ,   i   is   an   even   number
A i = h e c p b 2 ,   i   is   an   odd   number
B n + 1 :   A 0 = 1 2 h e c p + h e c r 2 b 1 + α t w h w  

2.3. Calculation of Axial Force of Stiffeners

This section is to calculate the stiffener axial force. Take 1/4 of the simplified model as an example, as shown in Figure 5a. The micro-element of thin plates and stiffeners with length Δx are selected at x from the end of the beam. The forces on the stiffener elements are shown in Figure 5b, where qi(x) is the unknown shear flow function corresponding to the thin plate element of Pi, and Ni is the axial force of the stiffener Bi at x from the end of the beam. It is assumed that the shear force Q(x) of any section is uniformly carried by the full section of the steel web. Then, the shear flow qE(x) in the web stiffeners can be calculated according to Equation (18).
q E x = Q x h  
As shown in Figure 5b, Ni is related to qi(x). In order to solve qi(x), a differential equation needs to be established in the following.

2.3.1. Establishment of Differential Equation

According to Figure 5b, the force equilibrium equation of the stiffener element can be established as in Equation (19).
B 1 :   d N 1 d x = q 1 x B 2 :   d N 2 d x = q 1 x q 2 x ⋯⋯ B n :   d N n d x = q n 1 x q n x B n + 1 :   d N n + 1 d x = q n x + q E x 2  
A thin plate element, Pi in Figure 5a, is taken out separately, as shown in Figure 6, of which ui and ui+1 are the longitudinal elongations of Bi and Bi+1 at x from the beam end, respectively. γ is the shear angle and ci is the width of Pi. The shear angle change rate of the thin plate element can be calculated as
d γ d x = 1 c i u i + 1 x u i x = 1 c i ε i + 1 ε i = 1 c i E c σ i + 1 σ i = 1 c i E c N i + 1 A i + 1 N i A i  
where εi and σi are the strain and stress of Bi, respectively; Ec is the flexural elastic modulus of UHPC.
It is also well known that q = γtG, where t is the plate thickness in UHPC slab, and G is the shear elastic modulus of UHPC. Considering the shear-lag effect conservatively, t is taken as the equivalent thickness tecp of the thin plate in UHPC slab, which is calculated by Equation (12) [21]. Substituting q = γtG into Equation (20), the following equation can be obtained:
d q i x d x = G t e c p d γ d x = G t e c p c i E c N i + 1 A i + 1 N i A i  
Combining Equations (19) and (21), the differential equation of qi(x) can be expressed as
P 1 :   d 2 q 1 x d x 2 K 1 u 11 q 1 x + K 1 u 12 q 2 x = 0 ⋯⋯ P i :   d 2 q i x d x 2 + K i u i i 1 q i 1 x K i u i i q i x + K i u i i + 1 q i + 1 x = 0 ⋯⋯ P n :   d 2 q n x d x 2 + K n u n n 1 q n 1 x K n u n n q n x = K n q E x 2 A n + 1  
where K i = G t e c p c i E c , u i i = 1 A i + 1 A i + 1 , u i k = 1 A k i   <   k , u i j = 1 A i i   >   j .

2.3.2. Solution of Differential Equation

There are many methods for solving the first-order linear differential equation, including the elimination method, the spline function approximation method, and the constant variation method. Because Equation (22) contains a large number of equations with high order, the spline function approximation method is adopted in this paper to ensure the accuracy and convenience of the calculation. The core idea of this method is to divide the beam into several sections along the longitudinal direction, and define the shear flow function of each section with a polynomial. Then, the shear flow function can be solved using the boundary conditions of the structure.
In this work, MATLAB Version 8.1 (R2013a) is used to program the above conditional equations, and the calculation process is shown in Figure 7. First, the spline function approximation method is used to solve the function expression of qi(x). Then, according to the equilibrium relationship, qi(x) is integrated along the longitudinal direction of the beam to obtain the axial force Ni of each stiffener using Equation (19). Dividing Ni by the area Ai of the corresponding stiffener to obtain the stress σi of each stiffener. At last, the shear-lag coefficient λ and effective width We of the UHPC slab in SU-RSCS are calculated.

2.4. Validation with Experimental Data

2.4.1. Validation on SU-LRSCS

First, an experimental specimen of SU-LRSCS in reference [26] is adopted here to validate the proposed approach. The detail of the test specimen is shown in Figure 8. To obtain more useful data, a half-span finite element model (FEM) is established based on the ABAQUS [27,28], as shown in Figure 9. Special attention should be paid in the modeling to impose appropriate interactions and boundary conditions [29]. The FEM is mainly composed of UHPC slab, steel beam and studs. The UHPC slab, steel beam, and studs are modeled using the element of C3D8R, which is the hexahedral linear reduced integral solid element with eight nodes. The degree of freedom (DOF) of C3D8R is 3, including translations in the X, Y and Z directions. A fixed constraint (Tie) is applied between the steel beam and studs. The contact between UHPC and steel beam is “Hard” in the normal direction and friction with a coefficient of 0.4 in the tangential direction. A boundary condition of “Symmetry” is set in the middle span section of the main beam, and the displacements in Y and Z direction are limited in the supporting point. One concentrated load distributed on the UHPC slab at the diaphragm position. Since only the elastic stage of experiment is considered, all materials are assumed to be elastic materials. The Young’s modulus, Poisson’s ratio and density of UHPC are 46,900 MPa, 0.2 and 2600 kg/m3, respectively, and that of steel are 200,000 MPa, 0.3 and 7850 kg/m3, respectively. The default convergence criterion of ABAQUS is used in this FEM.
The FEM is verified by the load-deflection relationships between the experimental test and the numerical results as shown in Figure 10.
For the FEM, three sections are considered, i.e., I-I (x = 2.25 m), II-II (x = 1.950 m) and III-III (x = 1.125 m). In addition, two types of loading are simulated, namely, a two-point concentrated load with P = 200 kN (LC1) and a uniform load with q = 44.44 kN/m (LC2), as shown in Figure 11. Figure 12 plots the FEM and proposed method results under two loading tests. As can be seen, the maximum error under LC1 occurs at the stiffener B3 of section II-II, with −5.0%, and that for LC2 is −4.8% at the stiffener B4 of section III-III. It is concluded that the proposed approach can accurately predict the strain in SU-LRSCS, so as to effectively assess the shear-lag effect. In addition, Table 1 lists the comparison of the maximum shear-lag coefficient (λmax) between the FEM results and the proposed method for both load conditions. The error is within 4.6%, which pays in favor the accuracy and validity of the proposed method again.

2.4.2. Validation on SU-WSCS

An experimental specimen of SU-WSCS in reference [18] is also used to verify the effectiveness of the proposed method for calculating the shear-lag effect. The dimensions of this specimen and the corresponding simplified structure are shown in Figure 13. In that test, 11 strain gauges are mounted on the upper surface of the waffle slab at the mid-span section. During the loading test (P = 0~400 kN), the specimen is still within the elastic stage. Figure 14 shows the experimental strains and the predictions with the proposed method. As shown, the proposed method results agree well with the test results at each measurement point. The maximum error is within 5.5%. It is also demonstrated that the structural simplification method of transforming the waffle plate into a longitudinal rib is feasible. Table 2 lists the comparisons of the maximum shear-lag coefficient (λmax) between the proposed method and the experimental result. The maximum error is only 3.0%.

3. Orthogonal Analysis (OA)

For SU-RSCS, the shear-lag effect is probably affected by many factors, such as the width-to-span of the beam, the longitudinal ribs height, the longitudinal ribs width, the number of transverse ribs, and the loading condition. The structural parameters of width-to-span ratio b/L, rib height ratio hcr/hc, and rib width ratio b3/b2 are selected for analysis in this study. Since all parameters are related to the structure dimension, they may influence each other. In order to evaluate the sensitivity of each parameter and their interaction to the shear-lag effect, the method of OA is utilized [30]. The proposed method is adopted to compute the shear-lag effect in this section. The structure in Figure 8 under the LC2 loading condition is taken as an example for analysis.

3.1. Introduction of OA

OA is a scientific experimental design method that uses a set of standard tables (orthogonal tables) to arrange experiments and analyze the experimental results. This method can not only be used for multi-factor optimization, but also for simultaneously analyzing the influence degree of each factor as well as their interactions, so that researchers can efficiently grasp the main factors and discard some secondary factors [31,32]. In this study, this method can provide the sensitivity order of the analysis parameters mentioned above and their interaction, to the shear-lag effect of SU-RSCS.

3.2. Test Design and Calculation

The maximum shear-lag coefficient at the top surface of the UHPC slab at the L/4 section (labeled as λmax,L/4) is referred to as the indicator to evaluate the shear-lag effect degree of SU-RSCS with different structural parameters. The parameters b/L, hcr/hc, and b3/b2 are represented as A, B and C, respectively, as shown in Table 3, and each parameter has 3 levels. For convenience, the higher-order interactions between factors are ignored; that is to say, only the first-order interactions between any two factors are considered (denoted as A × B for instance), which are arranged as independent factors in the orthogonal table. In addition, since each factor has three levels, the same interaction needs to occupy two columns in the orthogonal table, shown as (A × B)1 and (A × B)2, for instance. Therefore, L27(313) standard orthogonal table is used to arrange the experiment, as shown in Table 4, which is the miniature table that contains all parameters and their interactions [32,33]. For each case, the result of λmax,L/4 is calculated and also listed in Table 4.

3.3. Analysis of Variance (ANOVA)

ANOVA is commonly used to assess the sensitivity of the parameters and their interactions, in which index, Fi can directly represent the degree of sensitivity of the parameters or interactions i [34]. The larger the Fi, the higher the sensitivity of i. Mathematically, Fi is defined as:
F i = S i / f i S e / f e  
where Si and Se denote the sum of squared deviations of i and empty columns in orthogonal array, respectively, and fi and fe denote the freedom degree of i and empty columns in orthogonal array, respectively. In this case, fi of each factor is 2 and that of each interaction is 4. fe equals to 8. The result of Fi is calculated and listed in Table 5.
As shown in Table 5, the order of sensitivity of parameters and their interactions is: A > B > A × B > C > B × C > A × C. Obviously, the Fi values of A and B are much higher than others, indicating that their influences are extremely significant and deserve more attention in structural design. In addition, the influence of A × B is more significant than that of C, indicating that besides parameters themselves, the influence of their interaction on the shear-lag effect should also be considered. In the following section, those three parameters, as well as the parameter of the number of transverse ribs, are separately studied for sensitivity analysis of the shear-lag effect

4. Parametric Study

4.1. Effect of the Width-to-Span Ratio (b/L)

To investigate the effect of the width-to-span ratio (b/L), it varies from 0.1 to 0.9 with a step of 0.1. The other two parameters are considered as follows: (1) the value of b3/b2 is kept as 0.5, and the value of hcr/hc varies from 0.3 to 0.9 with a step of 0.2; (2) the value of hcr/hc is kept as 0.5, and the value of b3/b2 is 0.5, 1, and 2, respectively. Using the proposed approach, the values of λmax,L/4 for two cases are calculated and shown in Figure 15a,b, respectively. With the increase in b/L, the value of λmax,L/4 apparently increases as well, indicating that the increase in b/L will lead to rapid increase in the shear-lag effect. This may be because an increase in b/L leads to a longer shear transfer path from the steel web to the flange plate end, thereby enhancing the shear-lag effect.
As shown in Figure 15a, in the curve’s comparison of hcr/hc = 0.3 and 0.9, the slope of the curve increases by 110.2%. In other words, with the increase in hcr/hc, the curve of b/L-λmax,L/4 has a higher growth rate, indicating that there is a strong mutual promotion between b/L and hcr/hc. In Figure 15b, when b3/b2 increases, the growth rate of the curve hardly changes, indicating that the interaction between b/L and b3/b2 is negligible. The results are consistent with the findings in the OA analysis.

4.2. Effect of Rib–Height Ratio (hcr/hc)

Similarly, to study the effect of the rib height ratio (hcr/hc), two cases are considered. Case 1: the value of b3/b2 is kept as 0.5, and the value of b/L varies from 0.2 to 0.8 with a step of 0.2; Case 2: the value of b/L is kept as 0.4, and the value of b3/b2 is 0.5, 1, and 2, respectively. For both cases, the value of hcr/hc varies from 0.1 to 0.9 with a step of 0.1. Figure 16 depicts the calculation results of λmax,L/4 using the proposed approach. As shown, when hcr/hc is less than 0.5, the curve is almost horizontal, while when hcr/hc is greater than 0.5, the curve gradually increases with an increase in hcr/hc. The reason for this phenomenon may be that the increase in hcr/hc (to a certain value) weakens the transverse stiffness of the UHPC slab, resulting in a reduction in shear flow that it can transmit. As a result, the phenomenon of shear-lag becomes more pronounced. It is also confirmed that there is a strong mutual promotion relationship between b/L and hcr/hc, while that between hcr/hc and b3/b2 is not obvious.

4.3. Effect of Rib Width Ratio (b3/b2)

Figure 17 plots the curve of λmax,L/4 versus b3/b2 considering different values of b/L and hcr/hc. In this analysis, the value of hcr/hc = 0.5 and the value of b/L is 0.2, 0.4, and 0.6, respectively. The corresponding results are plotted in Figure 17a. Figure 17b plots the results when the value of hcr/hc is 0.3, 0.5, and 0.7, respectively, and b/L = 0.4. As shown, when the b3/b2 is less than 2, both curves slightly increase with an increase in b3/b2, but when the b3/b2 is greater than 2, the curves show no change. The reason for this phenomenon may be that the transverse stiffness of the UHPC slab is mainly controlled by the minimum thickness, but the increase in the b3/b2 has little effect on it. Therefore, the shear-lag effect has no obvious change.
As shown in Figure 17a, the three curves are almost parallel, indicating that the interaction between the b/L and the b3/b2 can be neglectable. In Figure 17b, when the hcr/hc changes from 0.3 to 0.7, the growth rate of the curve increases more significantly in the range of b3/b2 = 0~2, indicating that hcr/hc and b3/b2 have a certain mutual promotion effect. The results are consistent with the findings in the OA analysis. To sum up, the interaction between factors b/L and hcr/hc is stronger than that between factors hcr/hc and b3/b2, and the latter is stronger than that between b/L and b3/b2.

4.4. Effect of Number of Transverse Ribs

For the above analysis, the structure of SU-LRSCS is considered, namely there are no transverse ribs. To investigate the effect of the number of transverse ribs, herein the structure of SU-WSCS is used for analysis. The dimension of SU-WSCS is the same as SU-LRSCS as aforementioned where the b/L is 0.4, and the b3/b2 is 0.5. Three values of the hcr/hc are considered, i.e., 0.3,0.5, and 0.7, respectively. The number of transverse ribs varies from 0 to 13 with a step of 1, which are evenly distributed in the structure. The thickness of the waffle slab transverse ribs is 40 mm. Using the proposed approach, the corresponding shear-lag coefficient λmax,L/4 are calculated and the results are illustrated in Figure 18. As shown, increasing the number of transverse ribs can weaken the shear-lag effect of the structure but is very slight. It is also found that increasing the height of the ribs can enhance this weakening effect to some extent.

5. Comparison with Specifications

5.1. Eurocode 4: Design of Composite Steel and Concrete Structures

In Eurocode 4 5.4.1.2, the effective width beff at mid-span or internal support of concrete bridge deck in steel–concrete composite structures can be calculated by Equation (24), and beff at end support can be calculated by Equations (25) and (26) [35]:
b e f f = b 0 + b c i  
b e f f = b 0 + β i b c i  
β i = 0.55 + 0.025 L c / b c i 1.0
in which, b0 is the distance between the centers of the outermost shear connectors; bci is the effective width of the concrete flange on each side of the web, which can be taken as Lc/8 but not more than the geometric width. Lc is the distance between points of zero bending moment.
The effective width varies linearly between the support and the 1/4 span close to the support and remains constant between the 1/4 span and 3/4 span [35].

5.2. CSA S6:19: Canadian Highway Bridge Design Code

In CSA S6:19, the effective width of concrete slab in steel–concrete composite bridges can be calculated as follows [36]:
b s = b 1 1 L e 15 b 3  
in which, bs is the effective flange width on both sides of the girder, which should be smaller than or equal to the original flange width; Le is the span length for simply supported girders.

5.3. Discussion

The shear-lag coefficient can be calculated as the original width of the concrete flange divided by the effective flange width. As can be seen, both Eurocode 4 and CSA S6:19 consider the effect of span or b/L on the shear-lag effect, which matches the results of the previous orthogonal analysis, that is, b/L is an important factor influencing the shear-lag effect. However, the code equations ignore the effect of other parameters of the ribbed plate, e.g., the rib height, rib width, and the number of transverse ribs.
Considering the effect of b/L, Figure 19 illustrates the results of shear-lag coefficients based on the codes and the proposed method. As shown, the curves of the codes and the proposed method exhibit the same trend, i.e., the shear-lag coefficient grows rapidly with the increase in b/L. It is worth noting that when b/L = 0.1, both codes ignore the shear-lag effect, so the coefficient is 1.0. When 0.1 < b/L ≤ 0.4, some of the results using the code equations are still smaller than the calculated ones using the proposed approach, which indicates that it is not conservative to directly calculate the shear-lag coefficient of SU-RSCS with the code equations when b/L ≤ 0.4. With a further increment of b/L, the results of the code equations are gradually larger than most of the calculated ones. Relatively speaking, CSA S6:19 provides a closer result of the shear-lag coefficient of SU-RSCS than Eurocode 4. In most cases, both codes give conservative shear-lag coefficients for SU-RSCS.

6. Conclusions

With the rapid development of UHPC material, SU-RSCS structures have gained great interest in infrastructure construction. As is well known, the shear-lag effect is an essential consideration in many structural designs. However, at present, there are rarely related studies for SU-RSCS structures. Thus, this paper proposes to use the bar simulation method for developing a theoretical calculation model of the shear-lag effect on SU-RSCS. The feasibility and accuracy of the proposed approach are numerically and experimentally verified. Many factors that may affect the shear-lag effect on SU-RSCS are also investigated. In addition, the method of orthogonal analysis is used to determine the sensitivity of the parameters of SU-RSCS to shear-lag effects. The main conclusions of this work are as follows:
  • The proposed theoretical calculation method for the shear-lag effect of SU-RSCS is in good agreement well with the experimental and FEM results under multiple working conditions, which verifies the accuracy and effectiveness of this method.
  • According to the principle of a constant volume of transverse rib, a simplified method of converting waffle plate into longitudinal ribbed plate is proposed. The proposed theoretical method has a high accuracy for calculating the shear-lag effect of the simplified structure.
  • In ANOVA, F indicates the sensitivity degree of the parameters or interactions. For the shear-lag effect in SU-RSCS, the F values of the width-to-span ratio (A) and the rib height ratio (B) are significantly higher than others, indicating that their influences are extremely significant and deserve more attention in structural design. In addition, the influence of A×B is more significant than that of the rib width ratio (C), indicating that besides the parameters themselves, the influence of their interaction on the shear-lag effect should also be considered. The sensitivity order of the shear-lag effect of the SU-RSCS parameters can be expressed as: A > B > interaction A × B > C > interaction B × C > interaction A × C.
  • Increasing the number of transverse ribs can weaken the shear-lag effect of the structure, but is very slight. It is also found that increasing the height of the ribs can enhance this weakening effect to some extent.
  • Relatively speaking, CSA S6:19 provides a closer result of the shear-lag coefficient of SU-RSCS than Eurocode 4. In most cases, both codes give conservative shear-lag coefficients for SU-RSCS.

Author Contributions

Conceptualization, Y.Z. and T.D.; methodology, Y.Z.; software, Y.Z.; validation, C.T. and H.Z.; formal analysis C.T. and Y.Z.; investigation, C.T.; resources, H.Z. and T.D.; data curation, C.T., Y.Z. and B.Z.; writing—original draft preparation, C.T.; writing—review and editing, H.Z., C.T., Y.Z. and B.Z.; visualization, C.T. and Y.Z.; supervision, H.Z. and C.T.; project administration, H.Z.; funding acquisition, H.Z. All authors have read and agreed to the published version of the manuscript.

Funding

This research was funded by the National Natural Science Foundation of China, grant number 52278179 and 51978256. Any opinions, findings, conclusions, or recommendations expressed in this publication are those of the authors and do not necessarily reflect the view of the sponsors.

Data Availability Statement

Not applicable.

Conflicts of Interest

The authors declare no conflict of interest.

References

  1. Nie, J.G.; Wang, J.J.; Gou, S.K.; Zhu, Y.Y.; Fan, J.S. Technological development and engineering applications of novel steel-concrete composite structures. Front. Struct. Civ. Eng. 2019, 13, 1–14. [Google Scholar] [CrossRef]
  2. Zhang, Q.; Liu, Y.; Bao, Y.; Jia, D.; Bu, Y.; Li, Q. Fatigue performance of orthotropic steel-concrete composite deck with large-size longitudinal U-shaped ribs. Eng. Struct. 2017, 150, 864–874. [Google Scholar] [CrossRef]
  3. Walter, R.; Olesen, J.F.; Stang, H.; Vejrum, T. Analysis of an orthotropic deck stiffened with a cement-based overlay. J. Bridge Eng. 2007, 12, 350–363. [Google Scholar] [CrossRef] [Green Version]
  4. Shi, C.; Wu, Z.; Xiao, J.; Wang, D.; Huang, Z.; Fang, Z. A review on ultra high performance concrete: Part I. Raw materials and mixture design. Constr. Build. Mater. 2015, 101, 741–751. [Google Scholar] [CrossRef]
  5. Wang, D.; Shi, C.; Wu, Z.; Xiao, J.; Huang, Z.; Fang, Z. A review on ultra high performance concrete: Part II. Hydration, microstructure and properties. Constr. Build. Mater. 2015, 96, 368–377. [Google Scholar] [CrossRef]
  6. Jong, F.B.P. Renovatie Technieken voor Vermoeiingsscheuren op Orthotrope Stalen Brugdekken. Ph.D. Thesis, TU Delft, Delft, The Netherlands, January 2007. [Google Scholar]
  7. Shao, X. The Steel-UHPC Lightweight Composite Bridge Structure, 3rd ed.; China Communications Press Co, Ltd.: Beijing, China, 2015. [Google Scholar]
  8. Svensson, H.S.; Lovett, T.G. The twin cable-stayed Baytown bridge. In Proceedings of the International Conference IABSE-FIP: Ponts suspendus et à haubans = Cable-stayed and suspension bridges, Deauville, France, 12–15 October 1994. [Google Scholar]
  9. Shao, X.D.; Deng, L.; Cao, J.H. Innovative steel-UHPC composite bridge girders for long-span bridges. Front. Struct. Civ. Eng. 2016, 13, 981–989. [Google Scholar] [CrossRef]
  10. Zhang, Y.; Cai, S.; Zhu, Y.; Fan, L.; Shao, X. Flexural responses of steel-UHPC composite beams under hogging moment. Eng. Struct. 2020, 206, 110134. [Google Scholar] [CrossRef]
  11. Xiao, J.L.; Zhou, M.; Nie, J.G.; Yang, T.Y.; Fan, J.S. Flexural behavior of steel-UHPC composite slabs with perfobond rib. Eng. Struct. 2021, 245, 112912. [Google Scholar] [CrossRef]
  12. Qin, S.; Zhang, J.; Huang, C.; Gao, L.; Bao, Y. Fatigue performance evaluation of steel-UHPC composite orthotropic deck in a long-span cable-stayed bridge under in-service traffic. Eng. Struct. 2022, 254, 113875. [Google Scholar] [CrossRef]
  13. Liu, Y.; Zhang, X.; Liu, R.; Chen, G. Design and Mechanical Properties of Steel-UHPC Lightweight Composite Decks. Adv. Civ. Eng. 2021, 850, 87–95. [Google Scholar] [CrossRef]
  14. Zhang, X.; Li, X.; Liu, R.; Hao, C.; Cao, Z. Dynamic properties of a steel–UHPC composite deck with large U-ribs: Experimental measurement and numerical analysis. Eng. Struct. 2020, 213, 110569. [Google Scholar] [CrossRef]
  15. Cheng, B.; Tian, L.; Sun, B.; Xu, C. Experimental Study of Fatigue Behaviors of Orthotropic Steel Bridge Decks Enhanced by the Ultra-High Performance Concrete Layer. J. Tongji Univ. Nat. Sci. Ed. 2021, 49, 1097–1106. (In Chinese) [Google Scholar] [CrossRef]
  16. Wang, Y.; Shao, X.; Zhang, X.; Cao, J.; Zhao, X.; Deng, S. Structural Behaviors of a Low-Profile Steel Plate Reinforced UHPC Deck Panel with Longitudinal Ribs. J. Bridge Eng. 2021, 26, 4021043.1–4021043.13. [Google Scholar] [CrossRef]
  17. Zhu, J.; Guo, X.; Kang, J.; Duan, M.; Wang, Y. Experimental Investigation of Flexural Behavior of Steel–UHPC Composite Beam with Waffle-Slab System. J. Bridge Eng. 2021, 26, 04021011. [Google Scholar] [CrossRef]
  18. Zhu, J.; Wang, Y.; Yan, J.; Guo, X. Shear behaviour of steel-UHPC composite beams in waffle bridge deck. Compos. Struct. 2020, 234, 111678. [Google Scholar] [CrossRef]
  19. Zhou, C.; Li, L.; Wang, J. Modified bar simulation method for shear lag analysis of non-prismatic composite box girders with corrugated steel webs. Thin Wall Struct. 2020, 155, 106957. [Google Scholar] [CrossRef]
  20. Zhu, L.; Nie, J.G.; Ji, W.Y. Positive and negative shear lag behaviors of composite twin-girder decks with varying cross-section. Sci. China Technol. Sci. 2017, 60, 116–132. [Google Scholar] [CrossRef]
  21. Li, S.; Hong, Y.; Gou, H.; Pu, Q. An improved method for analyzing shear-lag in thin-walled girders with rectangular ribs. J. Constr. Steel Res. 2021, 177, 106427. [Google Scholar] [CrossRef]
  22. Li, X.; Wan, S.; Zhang, Y.; Zhou, M.; Mo, Y. Beam finite element for thin-walled box girders considering shear lag and shear deformation effects. Eng. Struct. 2021, 233, 111867. [Google Scholar] [CrossRef]
  23. Chen, Y.; Dong, J.; Xu, T.; Xiao, Y.; Jiang, R.; Nie, X. The shear-lag effect of composite box girder bridges with corrugated steel webs and trusses. Eng. Struct. 2019, 181, 617–628. [Google Scholar] [CrossRef]
  24. Cheng, X. Theory and Calculation of Beam Bridge, 3rd ed.; China Communications Press: Beijing, China, 1990. [Google Scholar]
  25. Luo, D.; Zhang, Z.; Li, B. Shear lag effect in steel-concrete composite beam in hogging moment. Steel Compos. Struct. 2019, 31, 27–41. [Google Scholar] [CrossRef]
  26. Du, T. Shear Lag Effect Study of Steel-UHPC Composite Beam. Master’s Thesis, Hunan University, Changsha, China, May 2019. [Google Scholar]
  27. Smith, M. ABAQUS/Standard User’s Manual, Version 6.9; Dassault Systèmes Simulia Corp.: Providence, RI, USA, 2009. [Google Scholar]
  28. Amani, M.; Rafeei, B.; Alinia, M.M. Shear buckling and ultimate capacity of steel plates coupled with cover panels. J. Constr. Steel Res. 2013, 80, 181–187. [Google Scholar] [CrossRef]
  29. Kodur, V.K.R.; Naser, M.; Pakala, P.; Varma, A. Modeling the response of composite beam-slab assemblies exposed to fire. J. Constr. Steel Res. 2013, 80, 163–173. [Google Scholar] [CrossRef]
  30. Liu, Y.H.; Xie, C.; Li, X.P.; Lu, G.L.; Tang, L.; Tan, X.H. Optimization analysis of structure parameters of downhole vortex tool based on CFD and orthogonal studies. J. Petrol Sci. Eng. 2020, 190, 107030. [Google Scholar] [CrossRef]
  31. Jiang, J.C.; Hu, G.B.; Li, X.; Xu, X.; Zheng, P.; Stringer, J. Analysis and prediction of printable bridge length in fused deposition modelling based on back propagation neural network. Virtual Phys. Prototyp. 2019, 14, 253–266. [Google Scholar] [CrossRef]
  32. Ren, L.Q. Optimum Design and Analysis of Experiments, 2nd ed.; Higher Education Press: Beijing, China, 2003. [Google Scholar]
  33. Plackett, R.L.; Burman, J.P. The Design of Optimum Multifactorial Experiments. Biometrika 1946, 33, 305–325. [Google Scholar] [CrossRef]
  34. Chen, Y.; Wang, X.; Zhao, Y.; Song, B.; Yu, T.B. Interactive optimization of process parameters and coating analysis of laser cladding JG-3 powder. Int. J. Adv. Manuf. Technol. 2020, 107, 2623–2633. [Google Scholar] [CrossRef]
  35. EN 1994-1-1 (2004); Eurocode 4: Design of Composite Steel and Concrete Structures—Part 1-1: General Rules and Rules for Buildings. European Committee for Standardization: Brussels, Belgium, 2004.
  36. CSA S6:19; Canadian Highway Bridge Design Code. Canadian Standards Association: Toronto, ON, Canada, 2019.
Figure 1. The SU-RSCS: (a) SU-WSCS; (b) SU-LRSCS.
Buildings 12 01884 g001
Figure 2. The SU-WSCS: (a) elevation; (b) cross section.
Buildings 12 01884 g002
Figure 3. Volume equivalent model.
Buildings 12 01884 g003
Figure 4. Dividing stiffeners and thin plates.
Buildings 12 01884 g004
Figure 5. Mechanical model: (a) 1/4 simplified structure; (b) stiffener micro-elements.
Buildings 12 01884 g005
Figure 6. Shear deformation diagram of the equivalent plate micro-element.
Buildings 12 01884 g006
Figure 7. Program calculation flow of the theoretical model.
Buildings 12 01884 g007
Figure 8. Dimension of SU-LRSCS specimen (unit: mm): (a) elevation; (b) cross section; (c) simplified structure.
Buildings 12 01884 g008
Figure 9. Finite element model.
Buildings 12 01884 g009
Figure 10. Load–deflection curve [26].
Buildings 12 01884 g010
Figure 11. Loading conditions (unit: mm): (a) LC1; (b) LC2.
Buildings 12 01884 g011
Figure 12. Strain comparison in SU-LRSCS: (a) I-I section (LC1); (b) II-II section (LC1); (c) III-III section (LC1); (d) I-I section (LC2); (e) II-II section (LC2); (f) III-III section (LC2).
Buildings 12 01884 g012
Figure 13. Dimension of specimen SU-WSCS (unit: mm): (a) side view; (b) typical cross-section; (c) simplified structure.
Buildings 12 01884 g013
Figure 14. Comparison of the strain in SU-WSCS: (a) P = 100 kN; (b) P = 200 kN; (c) P = 300 kN; (d) P = 400 kN.
Buildings 12 01884 g014
Figure 15. Relation curve of b/L and λmax,L/4: (a) different hcr/hc (b) different b3/b2.
Buildings 12 01884 g015
Figure 16. Relation curve of hcr/hc and λmax,L/4: (a) different b/L, (b) different b3/b2.
Buildings 12 01884 g016
Figure 17. Relation curve of b3/b2 and λmax,L/4: (a) different b/L (b) different hcr/hc.
Buildings 12 01884 g017
Figure 18. Relation curve of nw and λmax,L/4.
Buildings 12 01884 g018
Figure 19. Relation curve of b/L and λmax,L/4 in different calculation method: (a) different hcr/hc (b) different b3/b2.
Buildings 12 01884 g019
Table 1. λmax comparison in SU-LRSCS.
SectionLC1LC2
RFRpError (%)RFRpError (%)
I-I1.0721.1204.51.0731.1103.4
II-II1.1031.1544.61.0841.1122.6
III-III1.0661.0740.81.1111.1402.6
Note: the RF represents the FEM result; the Rp represents the proposed method result.
Table 2. λmax comparison in SU-WSCS.
Load/kNRERpError (%)
1001.1881.181−0.6
2001.1591.1811.9
3001.1521.1812.5
4001.1461.1813.0
Note: the RE represents the experimental result; the Rp represents the proposed method result.
Table 3. Structural parameters and their levels.
SymbolStructural
Parameters
Level 1Level 2Level 3
Ab/L0.20.40.6
Bhcr/hc0.30.50.7
Cb3/b20.512
Table 4. Calculation of orthogonal test.
Tes. No.AB(A × B)1(A × B)2C(A × C)1(A × C)2(B × C)1 (B × C)2 λmax,L/4
111111111111111.082
211112222222221.083
311113333333331.084
412221112223331.089
512222223331111.091
612223331112221.095
713331113332221.107
813332221113331.115
913333332221111.123
1021231231231231.316
1121232312312311.317
1221233123123121.318
1322311232313121.329
1422312313121231.335
1522313121232311.341
1623121233122311.373
1723122311233121.393
1823123122311231.413
1931321321321321.653
2031322132132131.653
2131323213213211.650
2232131322133211.668
2332132133211321.673
2432133211322131.676
2533211323212131.732
2633212131323211.760
2733213212131321.782
Table 5. ANOVA.
Table 5. ANOVA.
Variance SourceSifFSensitivity Ranking
A0.730720212,653.1601
B0.0252882437.8872
C0.000966216.7274
A × B0.004802441.5763
A × C0.00010940.9446
B × C0.00102948.9095
Empty columns0.0002318--
Publisher’s Note: MDPI stays neutral with regard to jurisdictional claims in published maps and institutional affiliations.

