Article

A Simplified Method for Evaluating the Diaphragm Flexibility for Frame-Shear Wall Structure under Earthquake Load

Hunan Provincial Key Laboratory on Damage Diagnosis for Engineering Structures, College of Civil Engineering, Hunan University, Changsha 410082, China
*
Author to whom correspondence should be addressed.
Buildings 2023, 13(2), 376; https://doi.org/10.3390/buildings13020376
Submission received: 23 September 2022 / Revised: 1 November 2022 / Accepted: 24 November 2022 / Published: 29 January 2023
(This article belongs to the Special Issue Reinforced Concrete Buildings)

Abstract

:
The rigid floor assumption is commonly used in structural design, but it is not applicable to buildings with a large plane aspect ratio. This study designed nine frame-shear wall structures with the story of 3, 6, and 12, with a plane aspect ratio of 2, 3.33, and 4. Based on the design results, the finite element models were set up by ETABS. Both the rigid diaphragm and the flexible diaphragm cases were considered in each model. The effect of elastic diaphragm deformation on structural seismic performance was investigated, including fundamental period, top displacement, inter-story drift, and base shear force. The results indicate that the diaphragm deformation on 3-story structures is more significant than that on 6-story and 12-story structures. The diaphragm in-plane deformation increases with the aspect ratio. On the basis of the analysis results, a simplified formula to calculate the internal force amplification factor and a quantitative assessment method for evaluating the diaphragm flexibility were proposed, which can provide a reference for engineering design.

Graphical Abstract

1. Introduction

The diaphragm is an important part of a building structure, and its in-plane stiffness directly influences the structure’s seismic performance. In the present structural design, the rigid floor assumption is commonly adopted. However, in the case of buildings with a large aspect ratio [1], openings in the diaphragm plane [2], or asymmetric plane [3,4], the elastic deformation of the flexible diaphragm significantly impacts the mechanical behavior of the overall structure. Under these circumstances, the rigid floor assumption is not applicable anymore.
Recently, there have been more and more studies about structures’ mechanical performance with a flexible diaphragm. Koliou et al. [5,6,7] analyzed the numerical models of buildings with rigid walls and flexible roof diaphragms (RWFD) and developed a semi-empirical fundamental period formula and a concept of distributed yielding in the flexible diaphragm to improve the seismic performance of RWFD buildings. Sadashiva et al. [8] proposed a conservative displacement prediction equation and a fundamental natural period estimate equation for flexible diaphragm structures through a series of elastic and inelastic time history analyses. Eivani et al. [3,9] studied the seismic behavior of asymmetric structures with flexible diaphragms and suggested a proper configuration of stiffness and strength centers to reduce the sensitivity of structural responses to diaphragm flexibility. In addition, it is worth mentioning that timber and steel diaphragms are commonly regarded as flexible [5,6]. Due to low pollution, low cost, and renewability [10,11], there are increasing research on timber diaphragms, including timber–concrete composite diaphragm [11], retrofitting of existing masonry buildings [12], connection characteristic to walls of unreinforced masonry buildings [13], a combination between cross-laminated timber with reinforced concrete (RC) or structural steel [14].
Simultaneously, many scholars investigated the stiffness and deformation problems of the diaphragm. Ju and Lin [15] proposed a deformation coefficient R to determine the diaphragm type. Subsequently, Tena-Colunga et al. [1] used R to determine the diaphragm type and then concluded that the diaphragm system behaved rigid in apartment buildings with a small floor span (6 m or less), but in office buildings with floor spans of 10 m or more, the diaphragm system probably behaved semi-rigid, semi-flexible, or even flexible. Ruggieri et al. [16,17,18] developed a practical numerical procedure to determine whether the diaphragm system is rigid or flexible. The analysis results of existing RC buildings showed that the diaphragms of an infill-frame and retrofitted frame were more inclined to the flexible diaphragms than that of bare-frame. The simulations conducted by Pecce et al. [19,20] presented that the in-plane diaphragm deformation of RC wall structures was not negligible, and the building shape, aspect ratio, and number of walls had effects on the in-plane diaphragm deformation. Fleischman et al. [21] proved that the rigid floor assumption no longer applies to the perimeter lateral-system structures and then proposed a deformation coefficient to evaluate the diaphragm deformation. Zhang et al. [22] analyzed the assembly truss beam composite floor, concluding that the rigid floor assumption no longer applies to this kind of structure. Wei et al. [23] discussed the analysis and design methods of the diaphragm’s in-plane stress and came up with a checking method for the diaphragm’s bearing capacity.
According to the American ASCE 7 standard [24], the performance index coefficient RASCE for evaluating the diaphragm flexibility can be calculated by Equation (1). When RASCE < 2, the diaphragm system can be regarded as rigid, and the rigid floor assumption is applicable. When RASCE > 2, the diaphragm system should be considered flexible, and the elastic floor assumption is appropriate to be adopted. It is worth noting that this evaluation method was concluded mainly based on the experimental and analytical study of wood structures’ roofs. Consequently, the applicability of the RC diaphragm needs to be further analyzed. Currently, there is no quantitative provision for judging rigid diaphragm or flexible diaphragm in Chinese code, which needs further improvement.
R ASCE = Δ C 0.5 Δ 1 + Δ 2
where Δc is the in-plane maximum relative deformation of the diaphragm; 0.5(Δ1 + Δ2) is the average lateral displacement value of the adjacent lateral force-resisting components at two ends of the diaphragm, as shown in Figure 1.
In this study, nine frame-shear wall buildings with a different number of stories and aspect ratios were designed firstly by current Chinese codes. Then, the corresponding structural models with rigid and flexible diaphragms were established using the finite element software ETABS. The influence of the diaphragm deformation on structural seismic performance was investigated through time history analysis. Finally, a regression analysis was performed on the results, leading to a simplified method for determining diaphragm type.

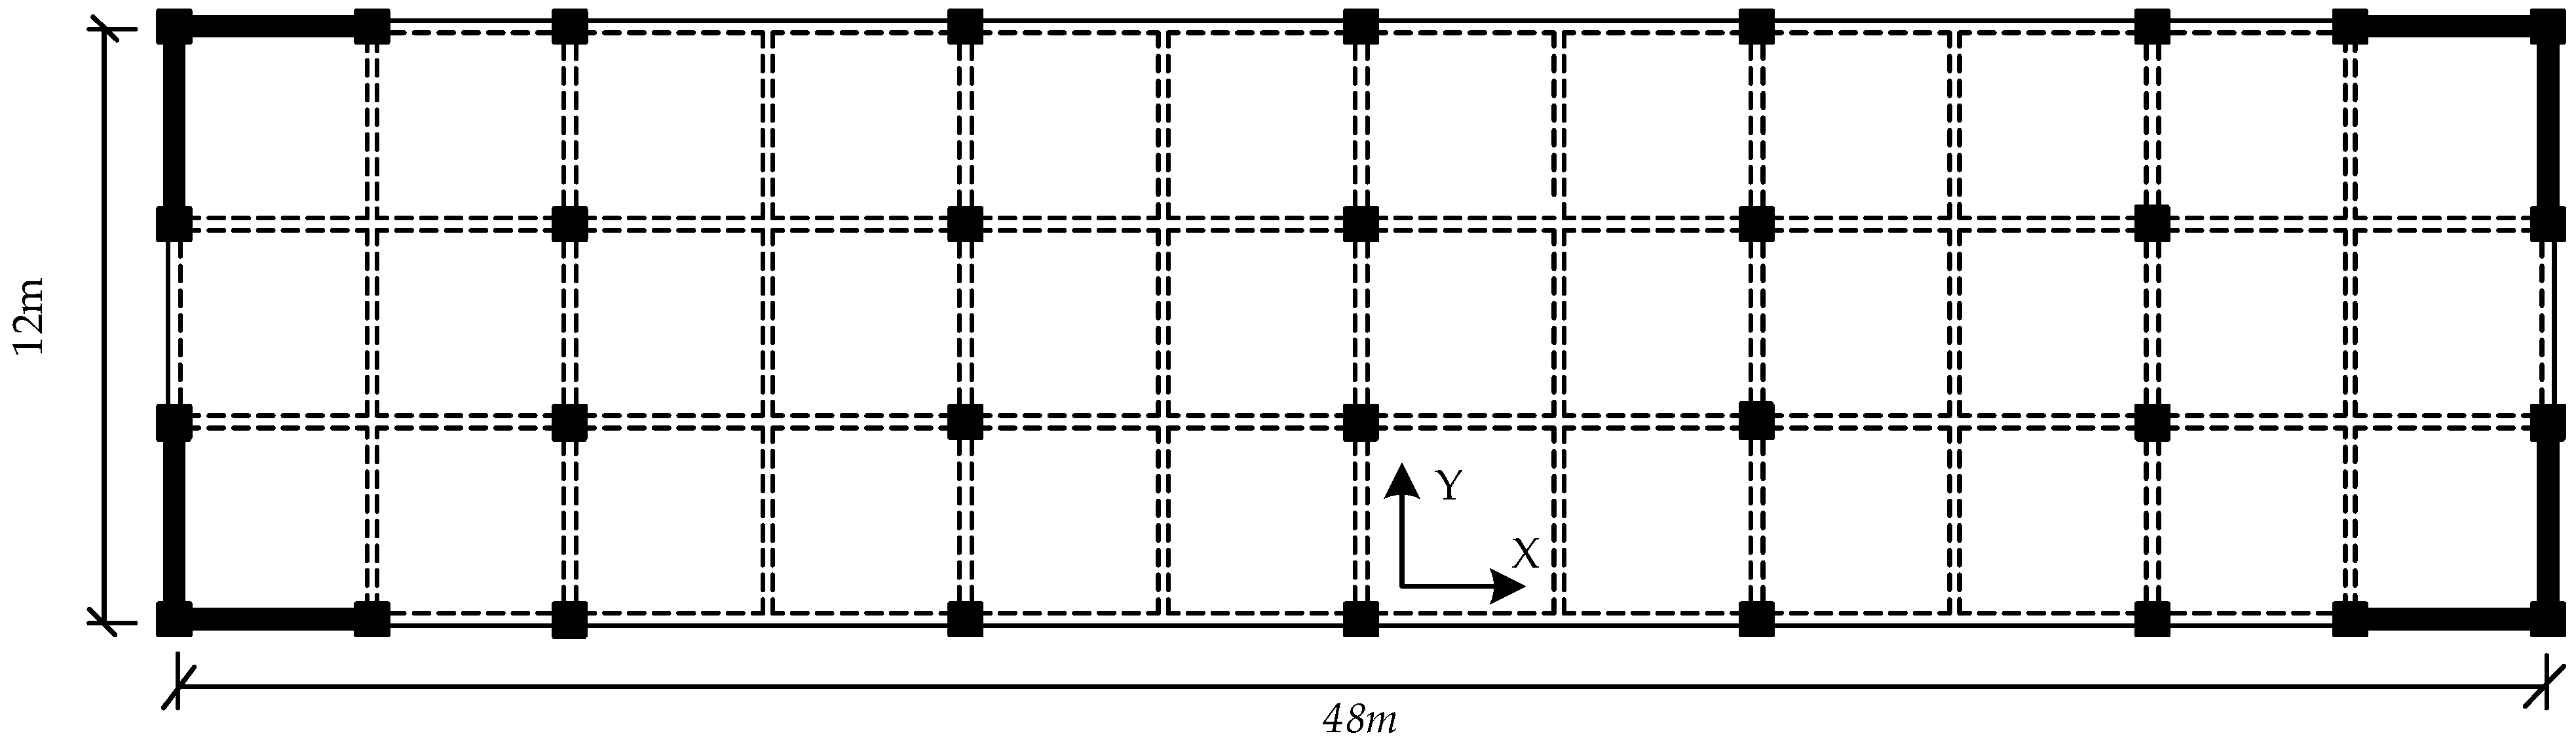
2. Investigated Frame Structures

Nine frame-building models with different stories and aspect ratios were designed. The specific parameters are listed in Table 1. The design plane width of all building models was 12 m, so the lengths of building models with aspect ratios of 2, 3.33, and 4 were 24 m, 40 m, and 48 m, respectively. The column spacing in the X and Y directions were 8 m and 4 m, respectively. Moreover, the plane arrangement of the structure with an aspect ratio of 4 is depicted in Figure 2. For all building models, the thickness of the diaphragm was 100 mm, and the bottom shear wall was 200 mm, which was the minimum value recommended by the Chinese code of Technical Specification for Concrete Structures of Tall Building (JGJ 3-2010) [25]. In addition, the site category was Class II, and the precautionary seismic intensity was 7 degrees. The exceedance probability in a 50-year return period is 63% and 2% for frequent and rare earthquakes [26], respectively. The primary wind pressure was 0.3 kN/m2, and the ground roughness category was Class B. Moreover, the height of the first and other floors were 4.5 m and 3.6 m, respectively. Additionally, the dead loads of floor, roof, exterior, and interior walls were 4.8 kN/m2, 3.6 kN/m2, 2.48 kN/m2, and 2.35 kN/m2, respectively. The live load of all members was 2 kN/m2, and the yield strength of steel reinforcements was 400 MPa. The parameters in the structure design software of PKPM V3.2 were set following Chinese specifications [27,28,29]. The dimensions of the primary components are listed in Table 1.

3. Finite Element (FE) Modeling and Verification
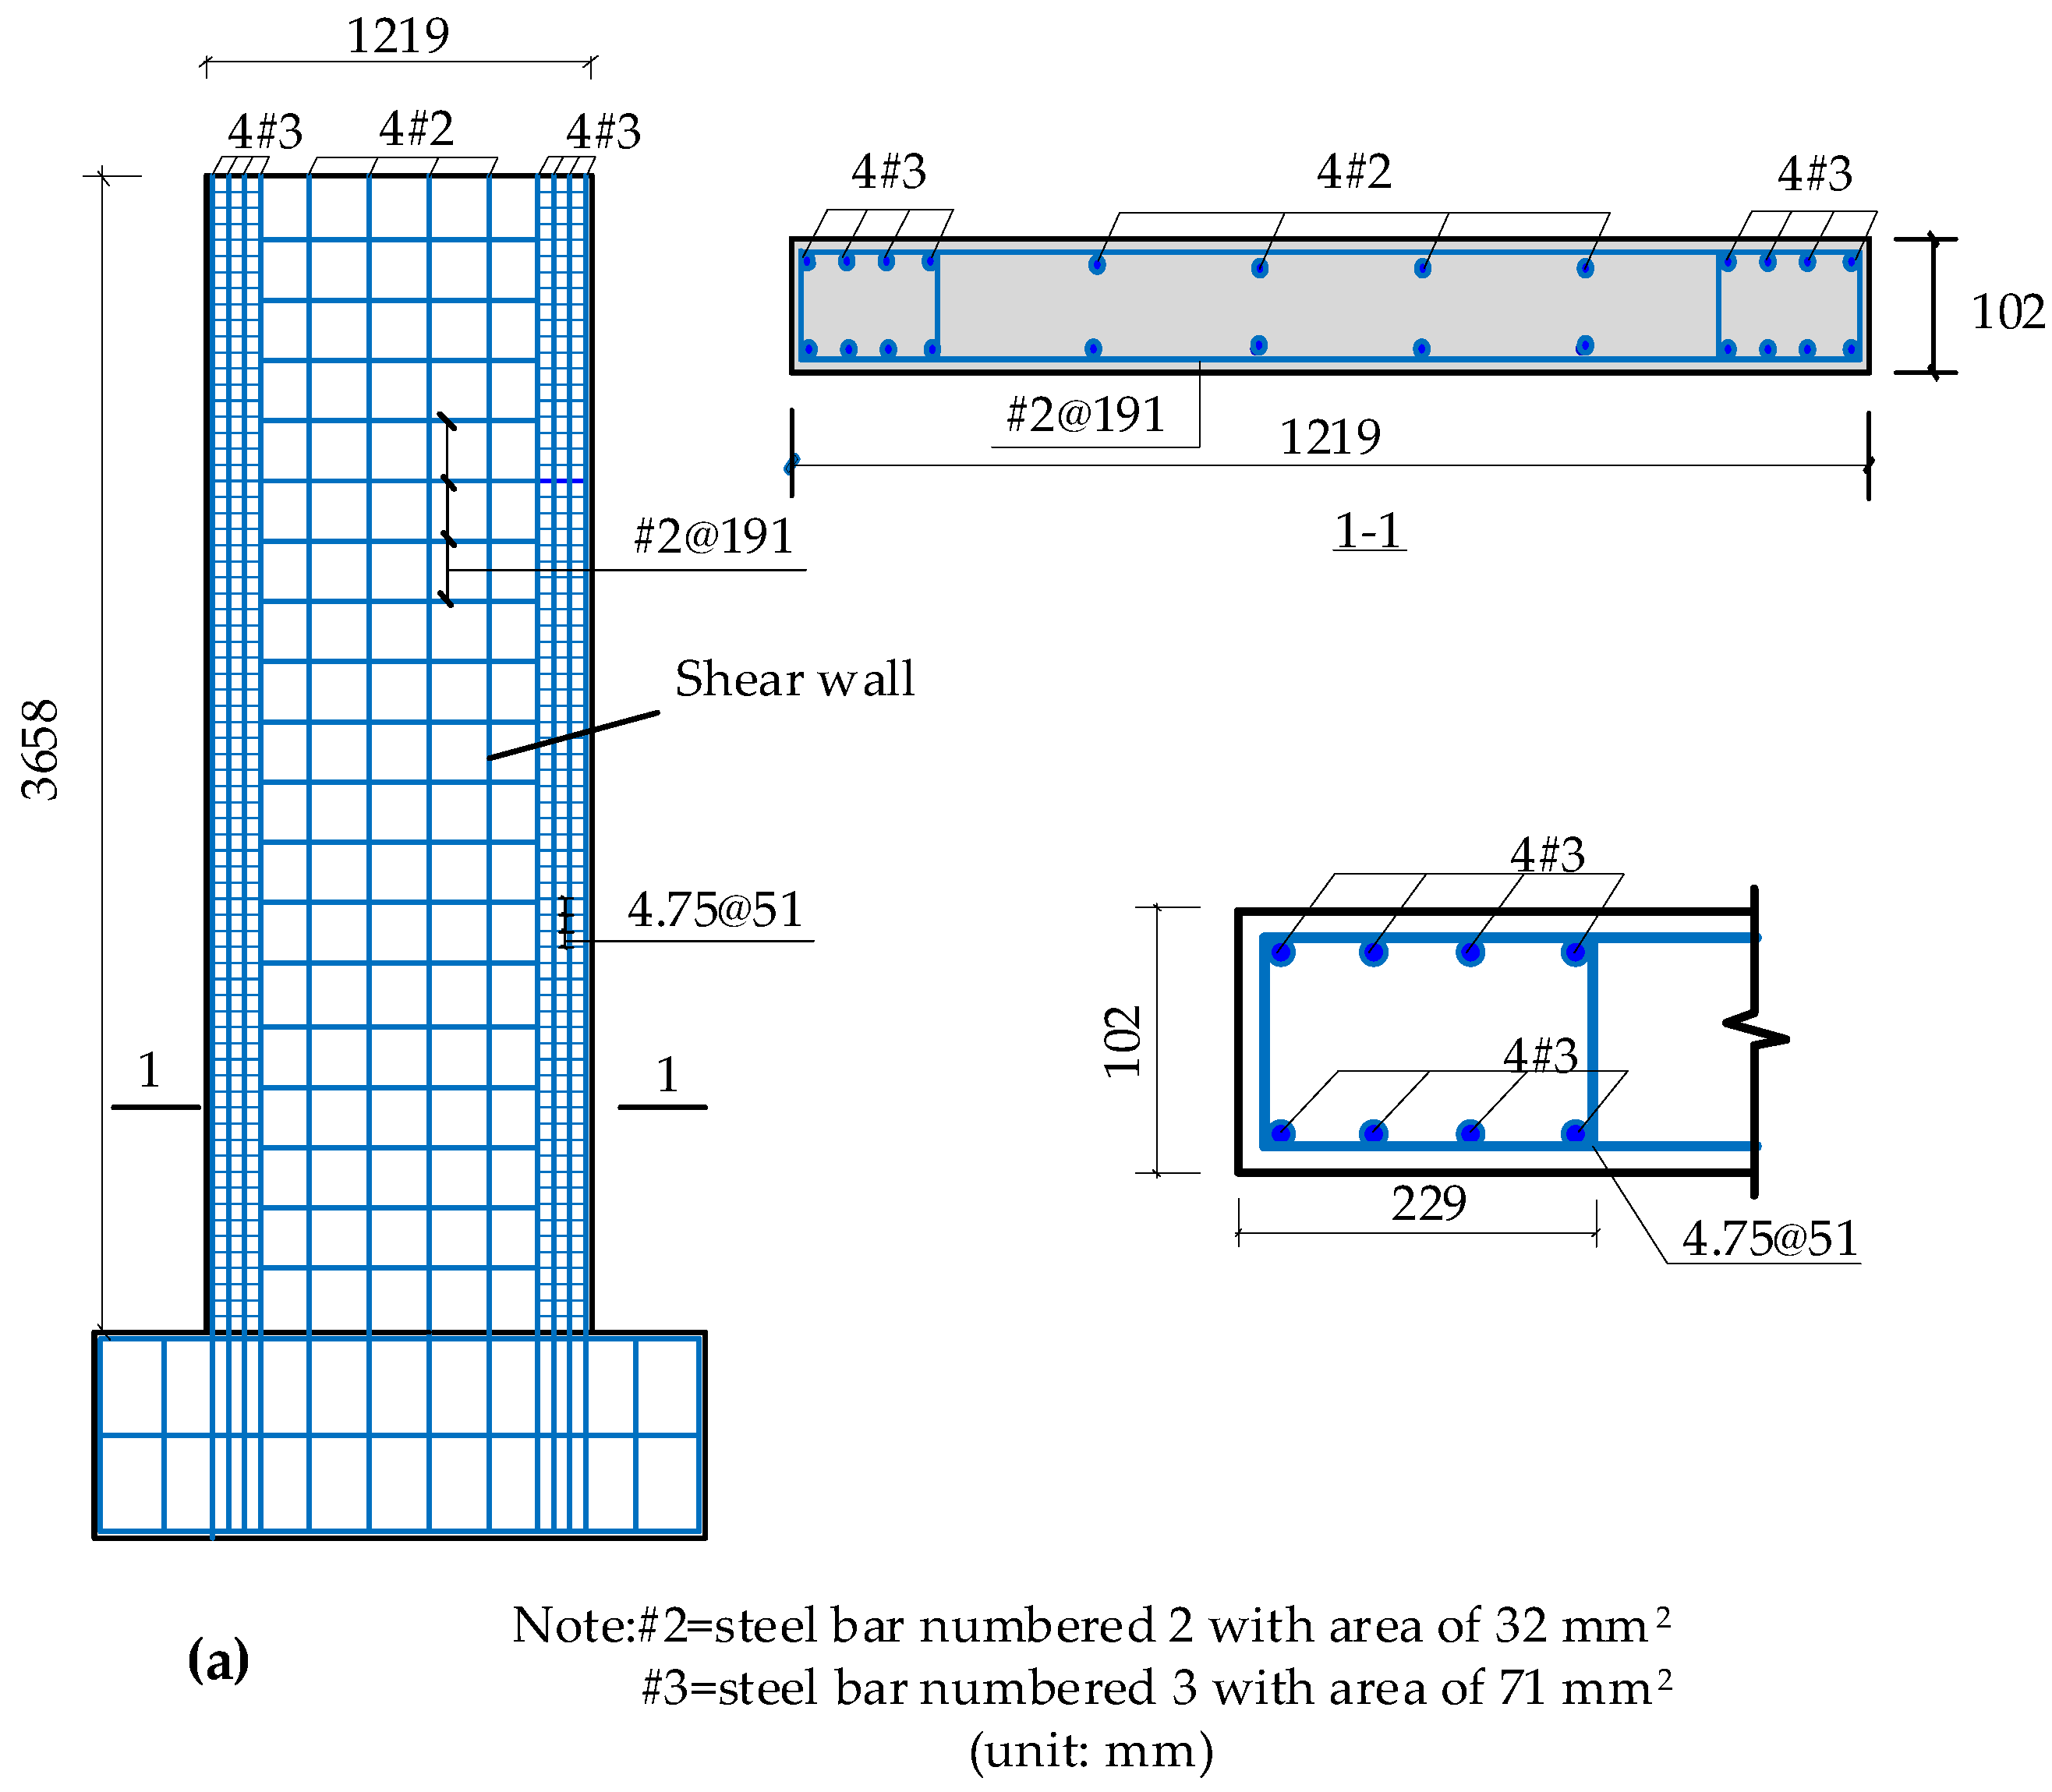
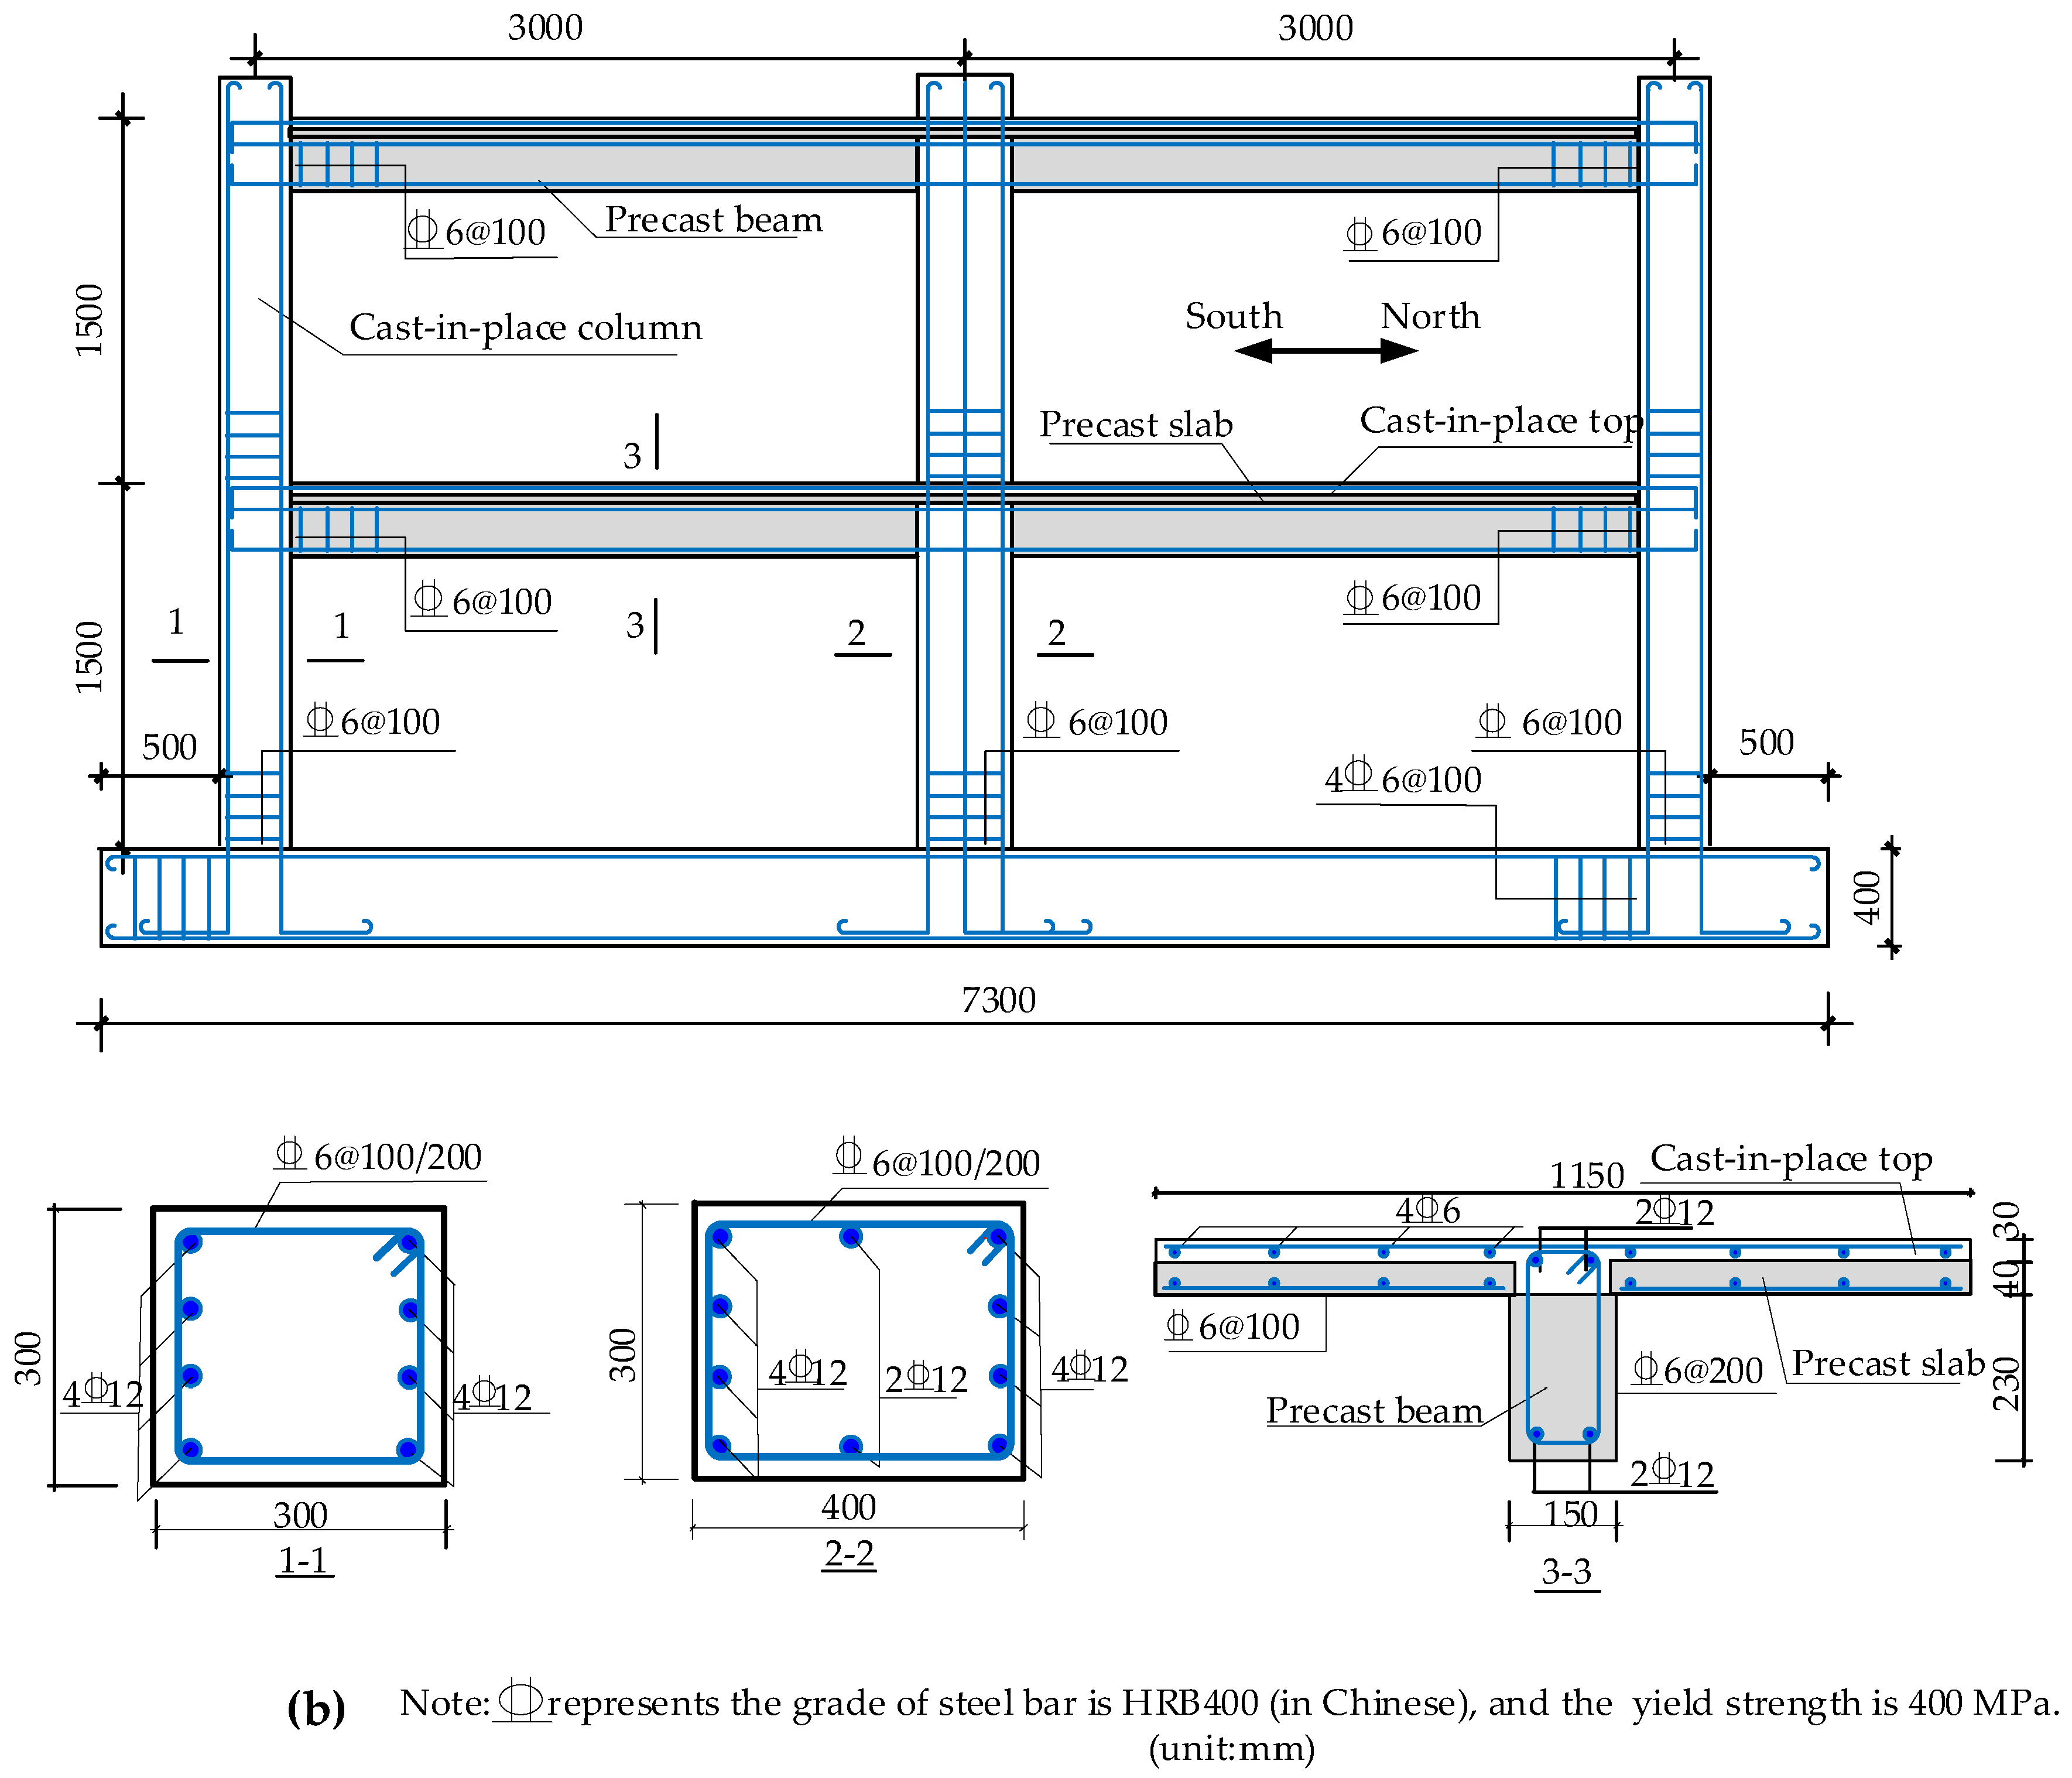
3.1. FE Modeling

3.1.1. Element Type and Meshing

Beams and columns were simulated by Beam/Column/Brace Objects elements. The nonlinear performance of the frame was realized by plastic hinges. M3 hinges were employed in beams that were mainly subjected to bending moment, and P-M2-M3 fiber hinges were used in columns that were mainly subjected to the combined action of compression and bending moment. Beam and column elements were meshed by the frame automatic mesh option. The diaphragms were simulated by layered shell elements, meshed by the default floor automatic mesh option. Additionally, the rigid diaphragms were specified by nodes. In terms of flexible diaphragms, the option of S11 (principal stress 1), S22 (principal stress 2), S12 (shear stress) for concrete layers, and S11 and S12 for reinforcements layers were set as elastic. The shear walls were also simulated by layered shell elements and meshed by the automatic rectangular mesh option. The concrete layers of diaphragms and shear walls were divided into two layers, respectively. One layer simulated in-plane (membrane) performance, and the other layer simulated out-of-plane (plate) performance.

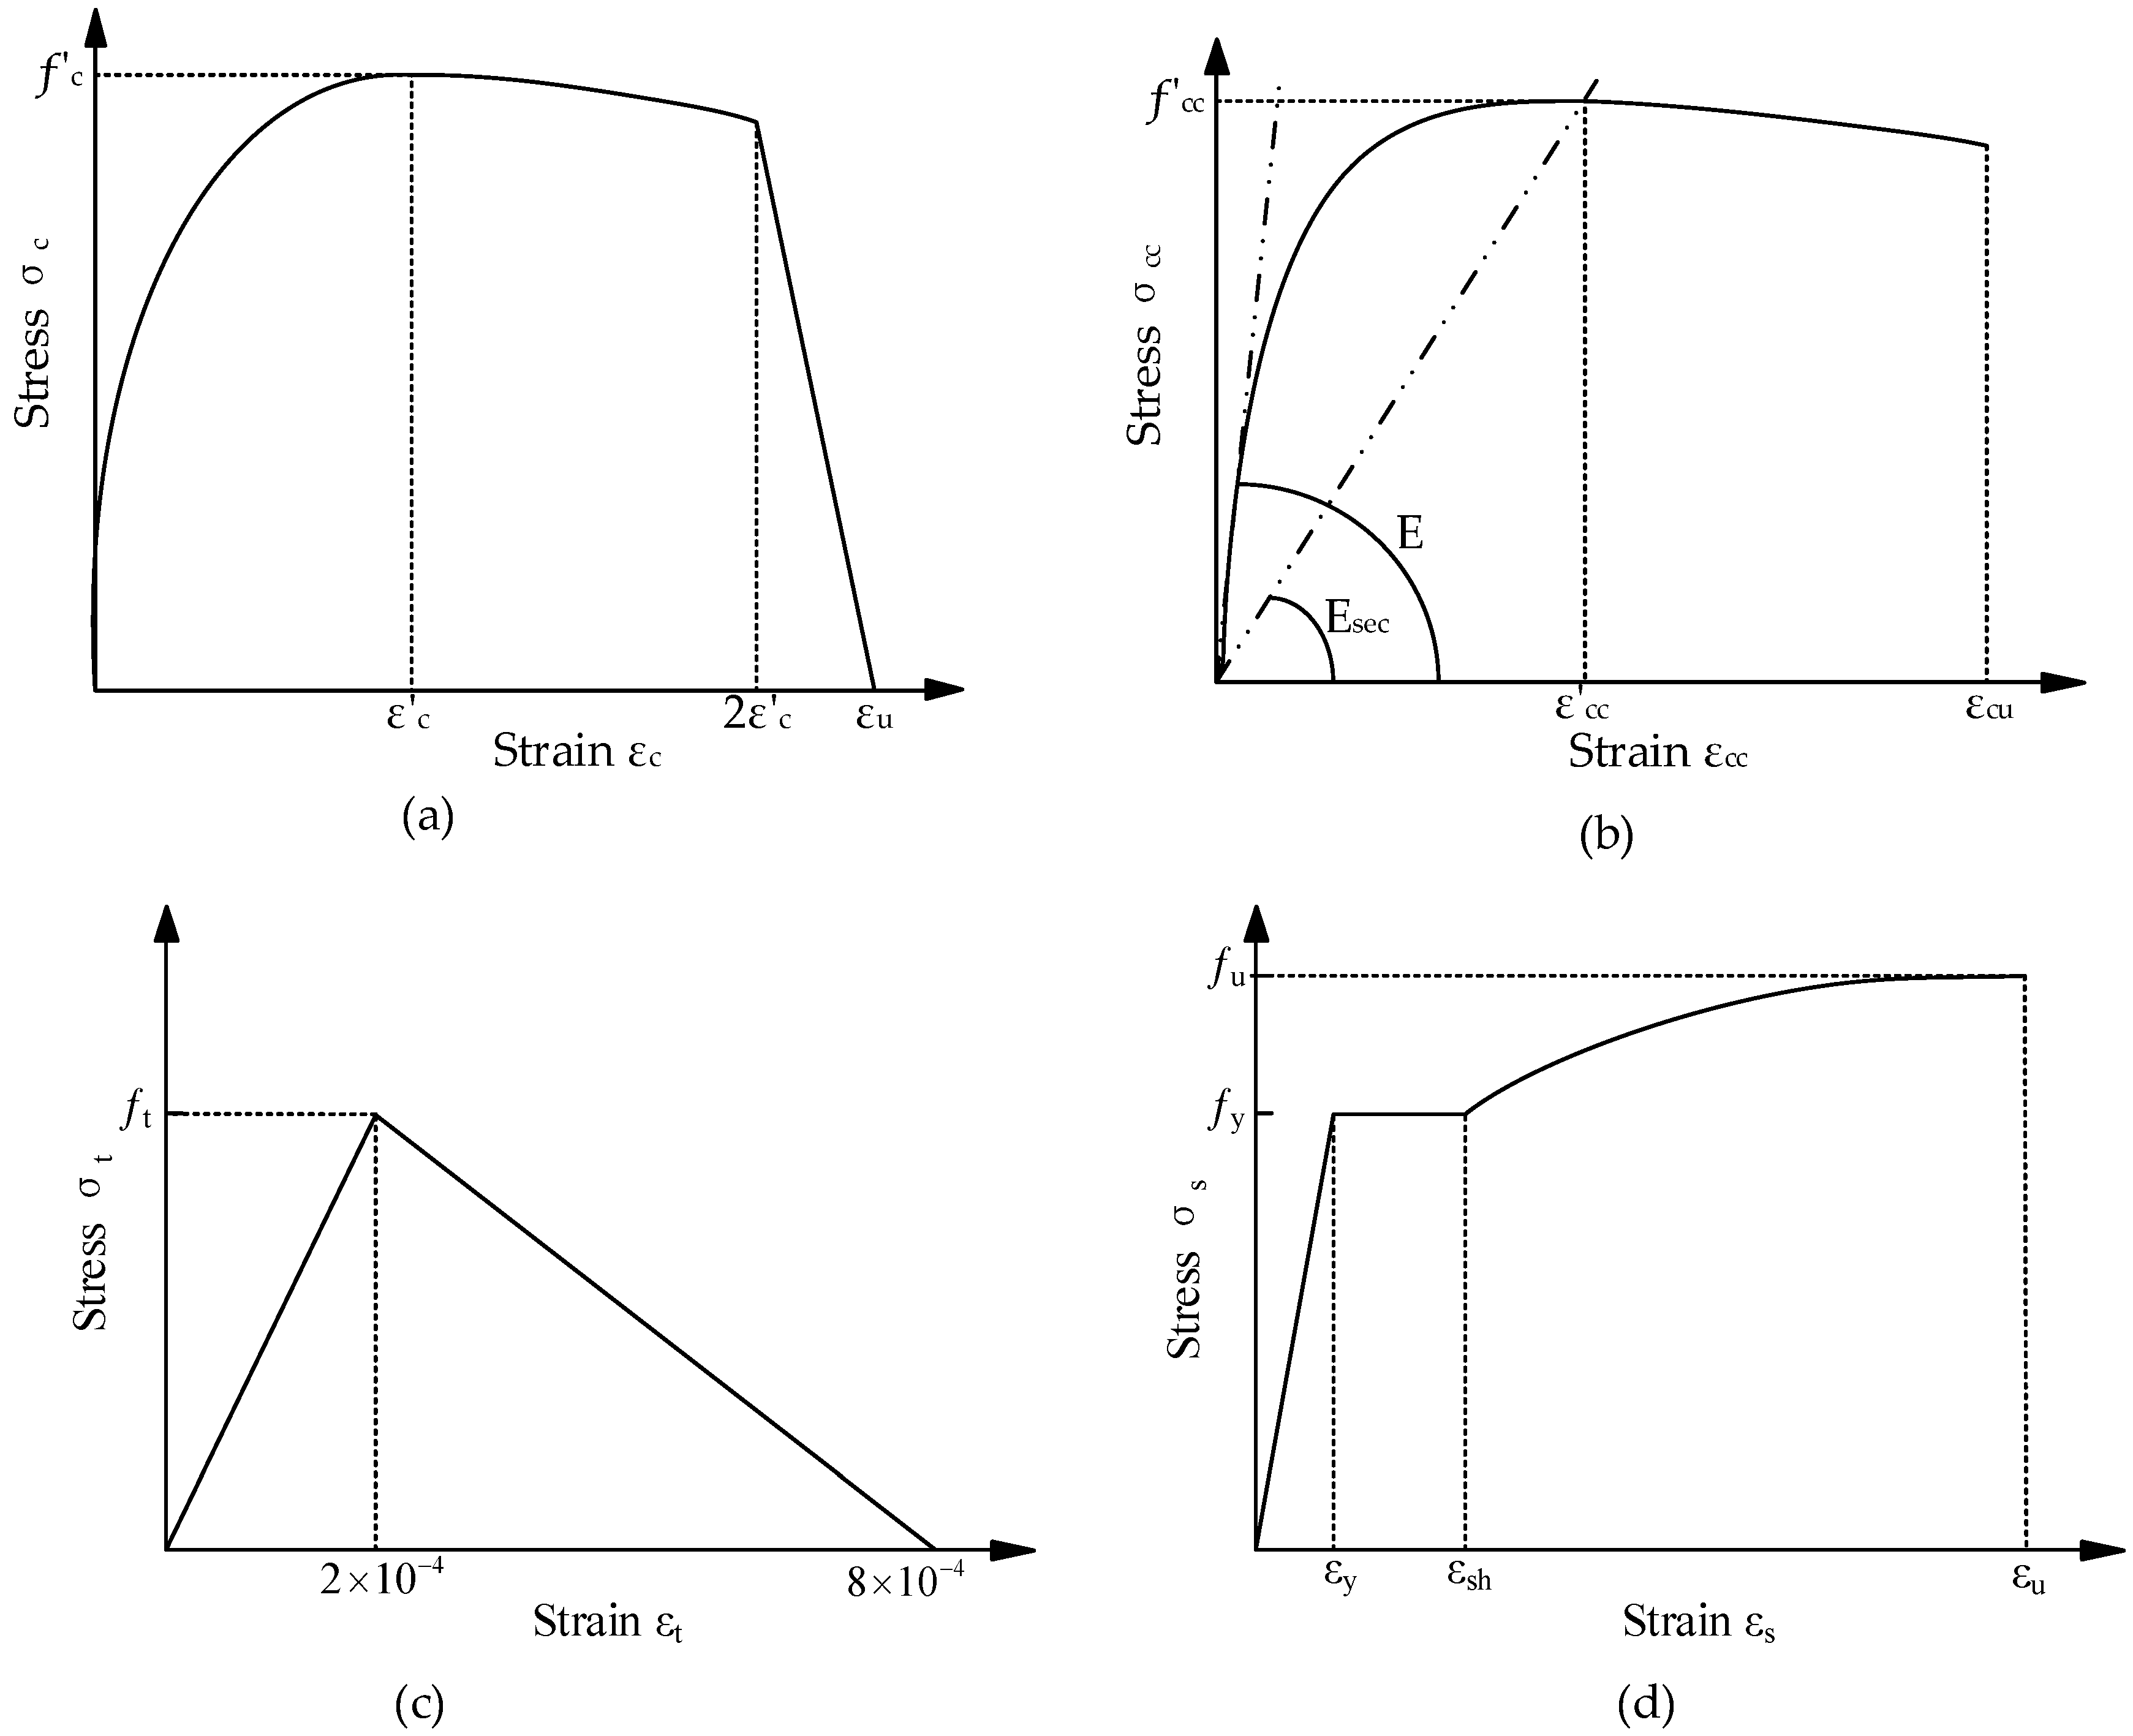
3.1.2. Material Modeling

The Mander model was applied for concrete material [30], and the Poisson’s ratio, peak strain ε c , ultimate strain ε u were taken as the default values in ETABS. In detail, the Mander-unconfined concrete constitutive model described beams’ concrete behavior and the non-boundary region of shear walls. Figure 3a presents the corresponding stress–strain relationship curve, which consists of a curved and straight part calculated by Equation (2). On the contrary, the Mander-confined concrete constitutive model described the confined compressive concrete behavior of columns and the boundary region of shear walls. Figure 3b and Equation (3) present the corresponding stress–strain relationship. Additionally, the Hillerborg two-line model was selected to perform the tensile concrete behavior of all components [31], as shown in Figure 3c and Equation (4).
σ c = f c x r r 1 + x r ε c 2 ε c 2 f c r r 1 + 2 r ε u ε c ε u 2 ε c 2 ε c < ε c ε u
where x = ε c / ε c ; r = E / E   f c / ε c ; E = 4730 f c [32,33]; σ c and ε c are the compressive stress and strain of unconfined concrete, respectively; f c and ε c are the compressive strength and corresponding strain of unconfined concrete, respectively; ε u is the ultimate strain of unconfined concrete; E is the elastic modulus of concrete.
σ c c = f c c x r r 1 + x r
where x = ε c c / ε c c ; r = E / ( E E sec ) ; ε c c = 5 f c c / f c 1 + 1 ε c ; E sec = f c c ε c c ; σ c c and ε c c are the compressive stress and strain of confined concrete, respectively; E sec is the elastic secant modulus of concrete; f c c and ε c c are the compressive strength and corresponding strain of confined concrete, respectively [30,34].
σ t = f t ε t 2 × 10 4 ε t 2 × 10 4 f t 8 × 10 4 ε t 6 × 10 4 2 × 10 4 < ε t 8 × 10 4
where σ t , ε t , f t are the tensile stress, corresponding strain and tensile strength of concrete.
Furthermore, all the steel reinforcements adopted the constitutive model defined by simplified parameters in ETABS [34]. The stress–strain relationship of steel reinforcements is depicted in Figure 3d and Equation (5), and the strain-hardening segment is simplified as a parabola.
σ s = E ε s ε s ε y f y ε y < ε s ε s h f y + f u f y ε s ε s h ε u ε s h ε s h < ε s ε u
where E = 21 , 000   MPa ; ε y = f y / E ; σ s , ε s , f y , f u , ε y , ε u , and E are the stress, strain, yield strength, ultimate strength, yield strain, ultimate strain and elastic modulus of steel reinforcements; ε s h is the strain at the initial strain strengthening of steel reinforcements [34].

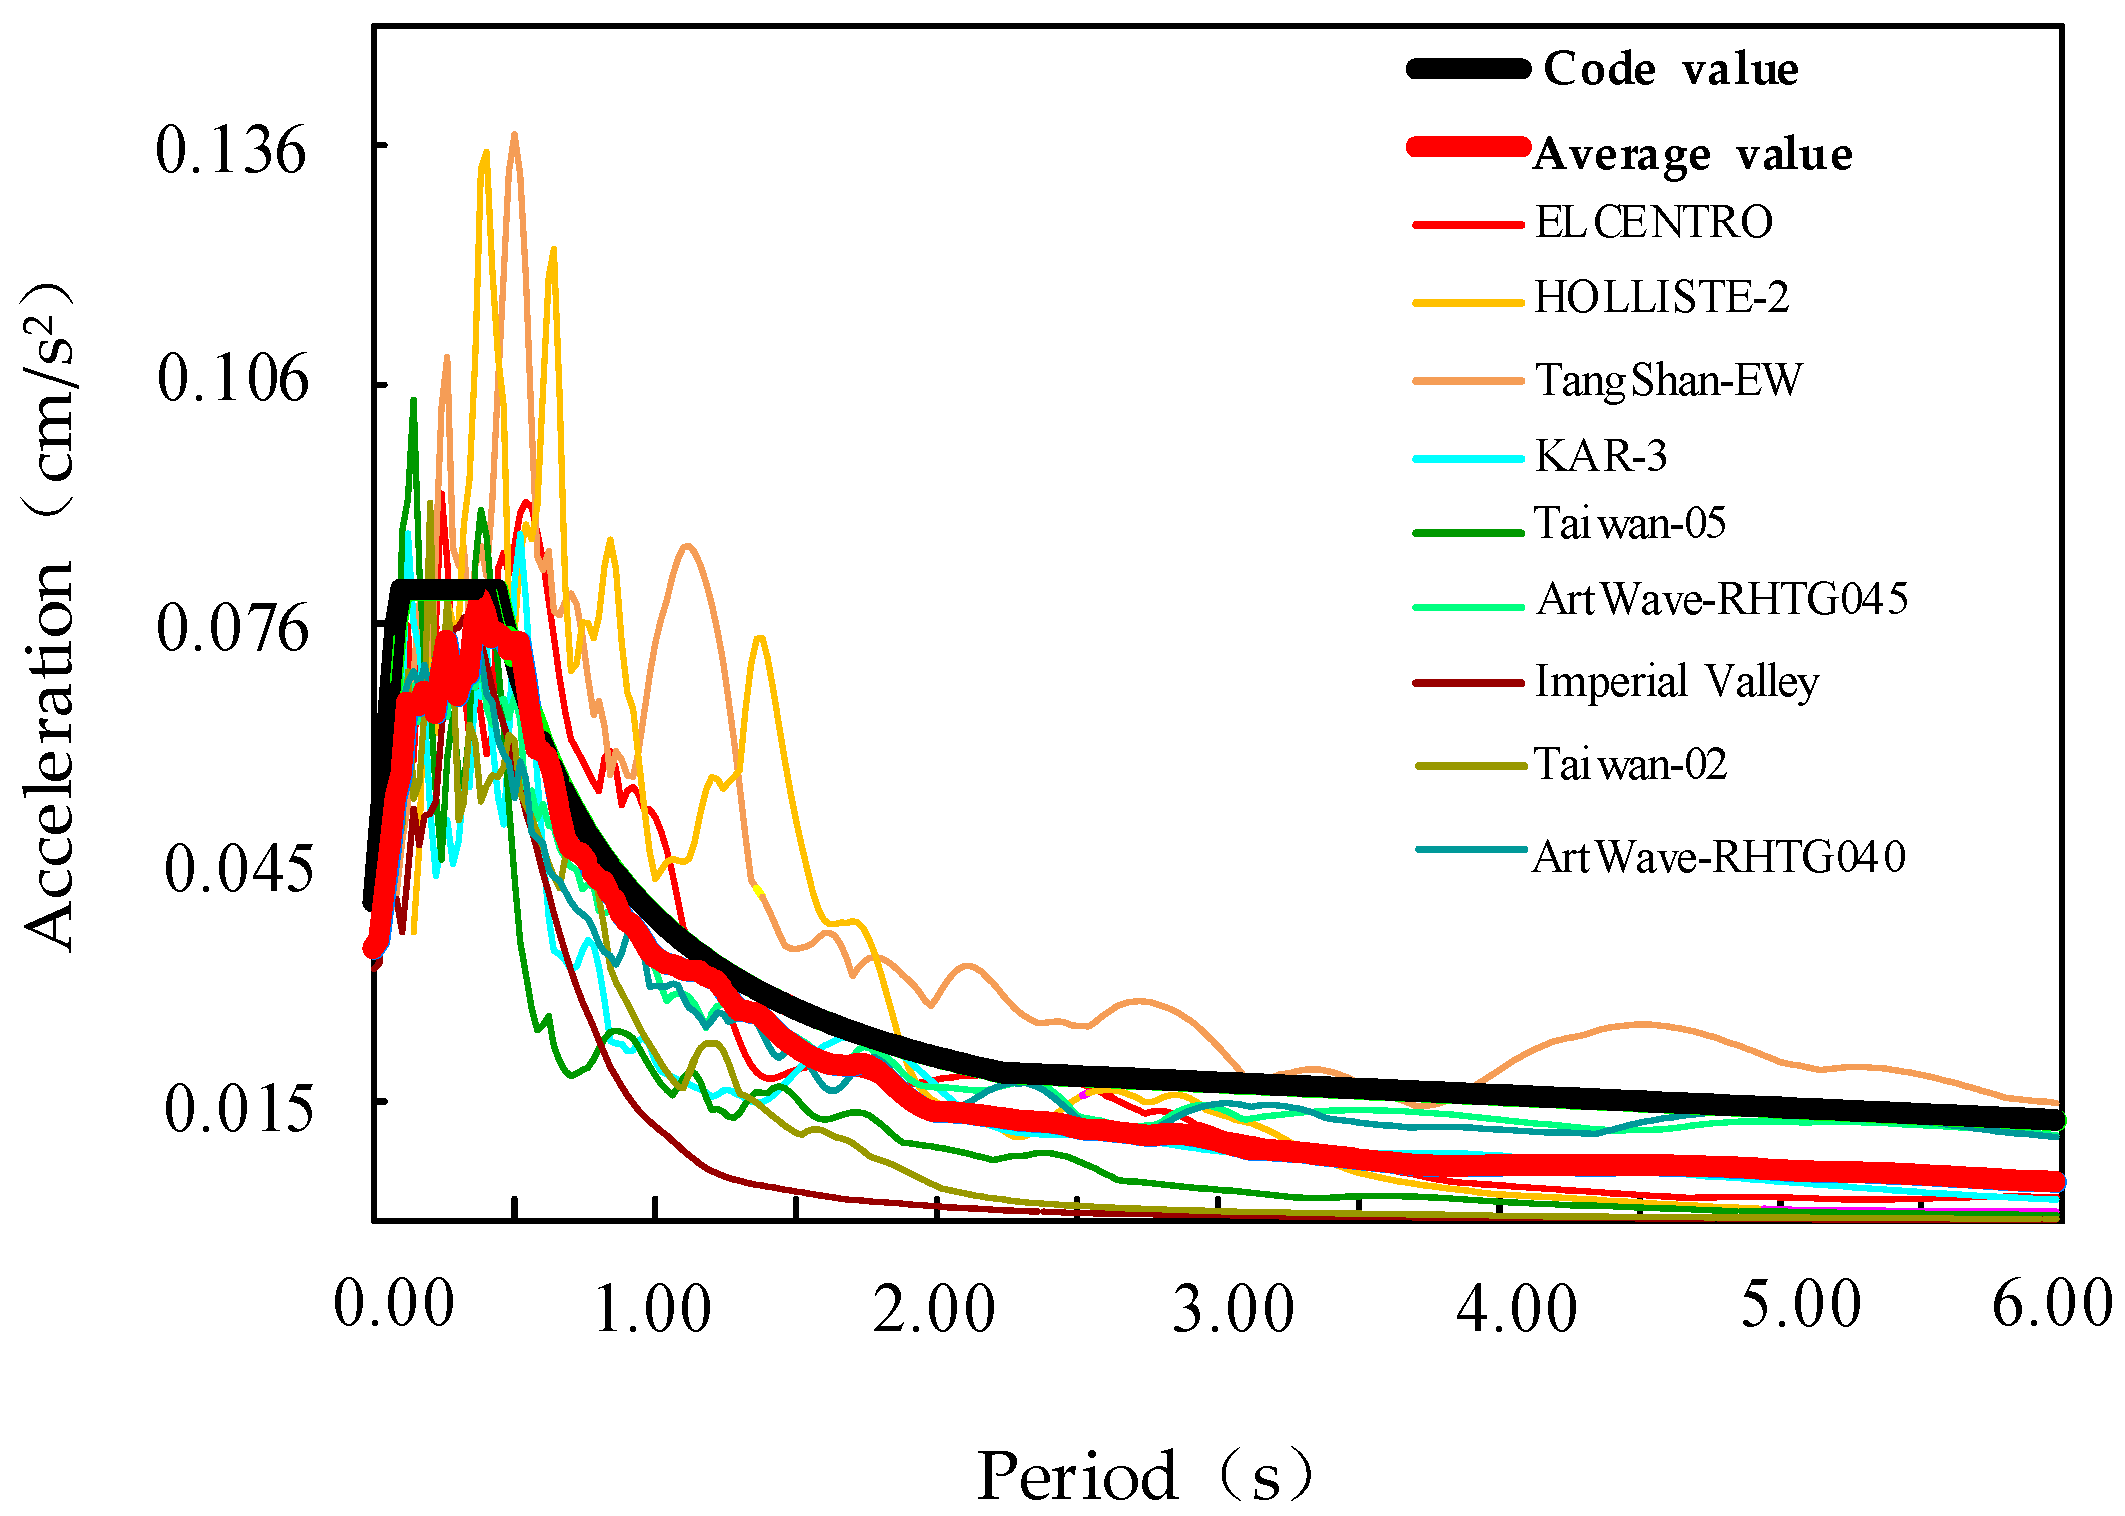
3.1.3. Ground Motion Selection

The selected method is based on the Chinese code GB50011-2010 [27]. The selected nine ground motions include seven natural waves and two artificial waves. The average spectral acceleration of the nine ground motions was close to the design response spectrum [35,36] for frequent earthquakes, as shown in Figure 4. The peak accelerations of the selected nine ground motions were scaled to represent rare earthquakes in the nonlinear dynamic time history analysis. In order to meet the requirement of effective peak acceleration, the “proportional coefficient” in the load case menu of ETABS was scaled [36], as listed in Table 2. Under the precautionary seismic intensity of seven degrees, the peak accelerations of each seismic record were scaled to 35 cm/s2 and 220 cm/s2 for frequent and rare earthquakes in the time history analysis [27]. There were eighteen FE models in this study, including nine rigid diaphragm models and nine flexible diaphragm models. Each model was run separately under nine ground motions. Since the response spectrum of each ground motion record was not the same as the design response spectrum, we took the average value of the nine-time history analysis results as the final result to represent the seismic behavior.

3.1.4. Load Case and Analysis Method
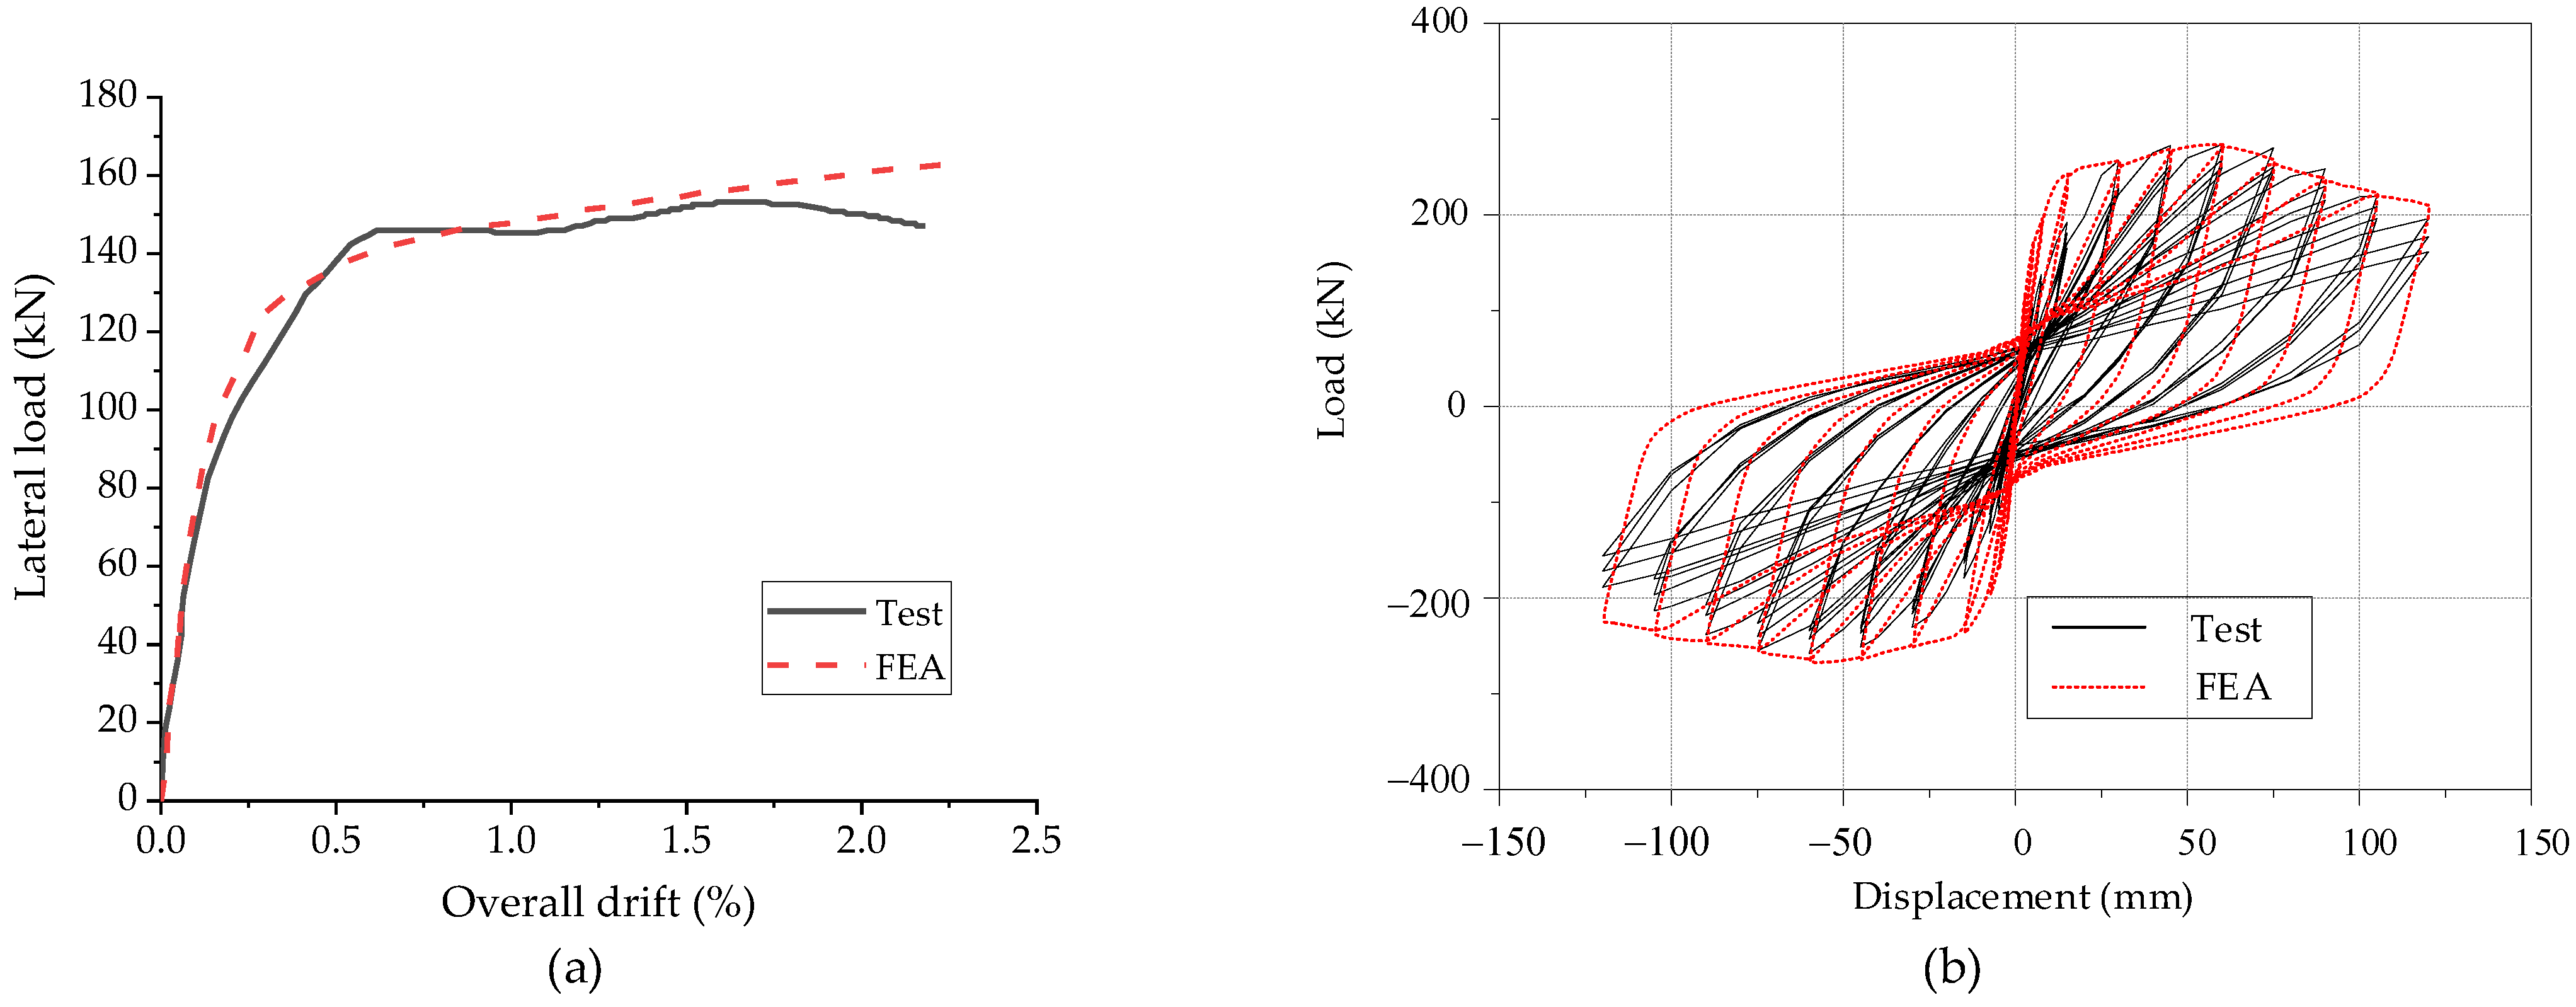
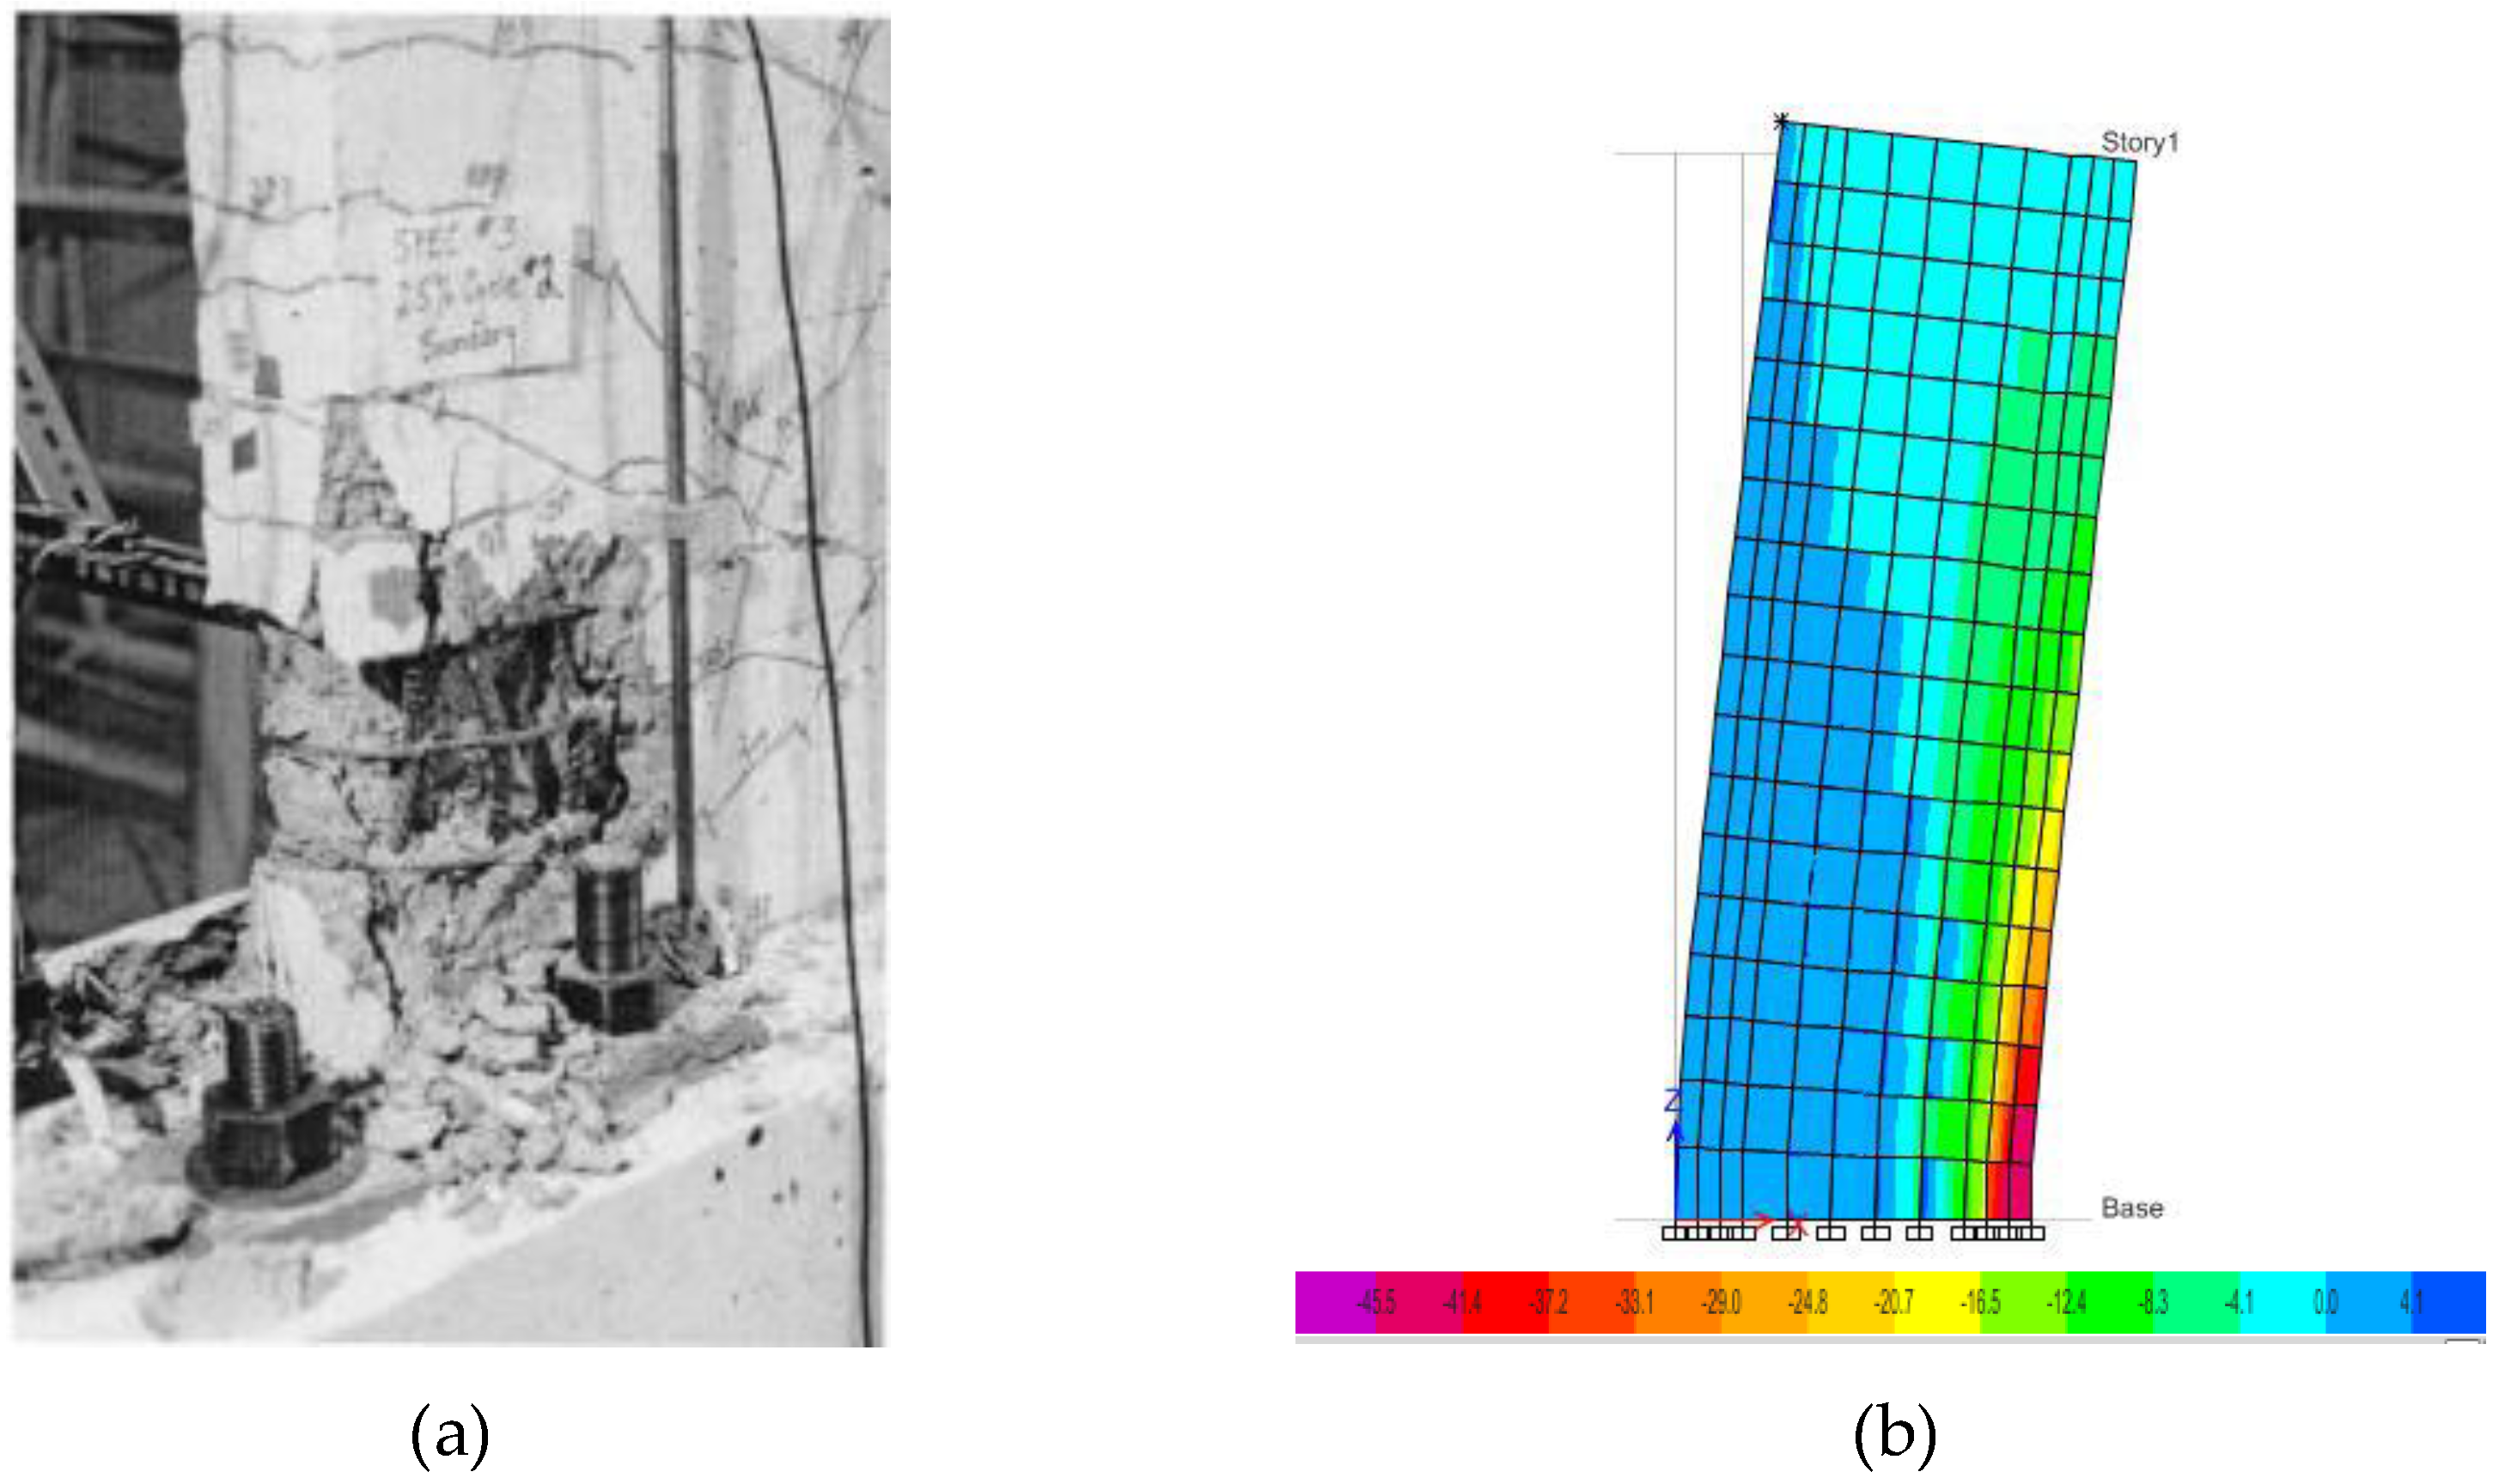
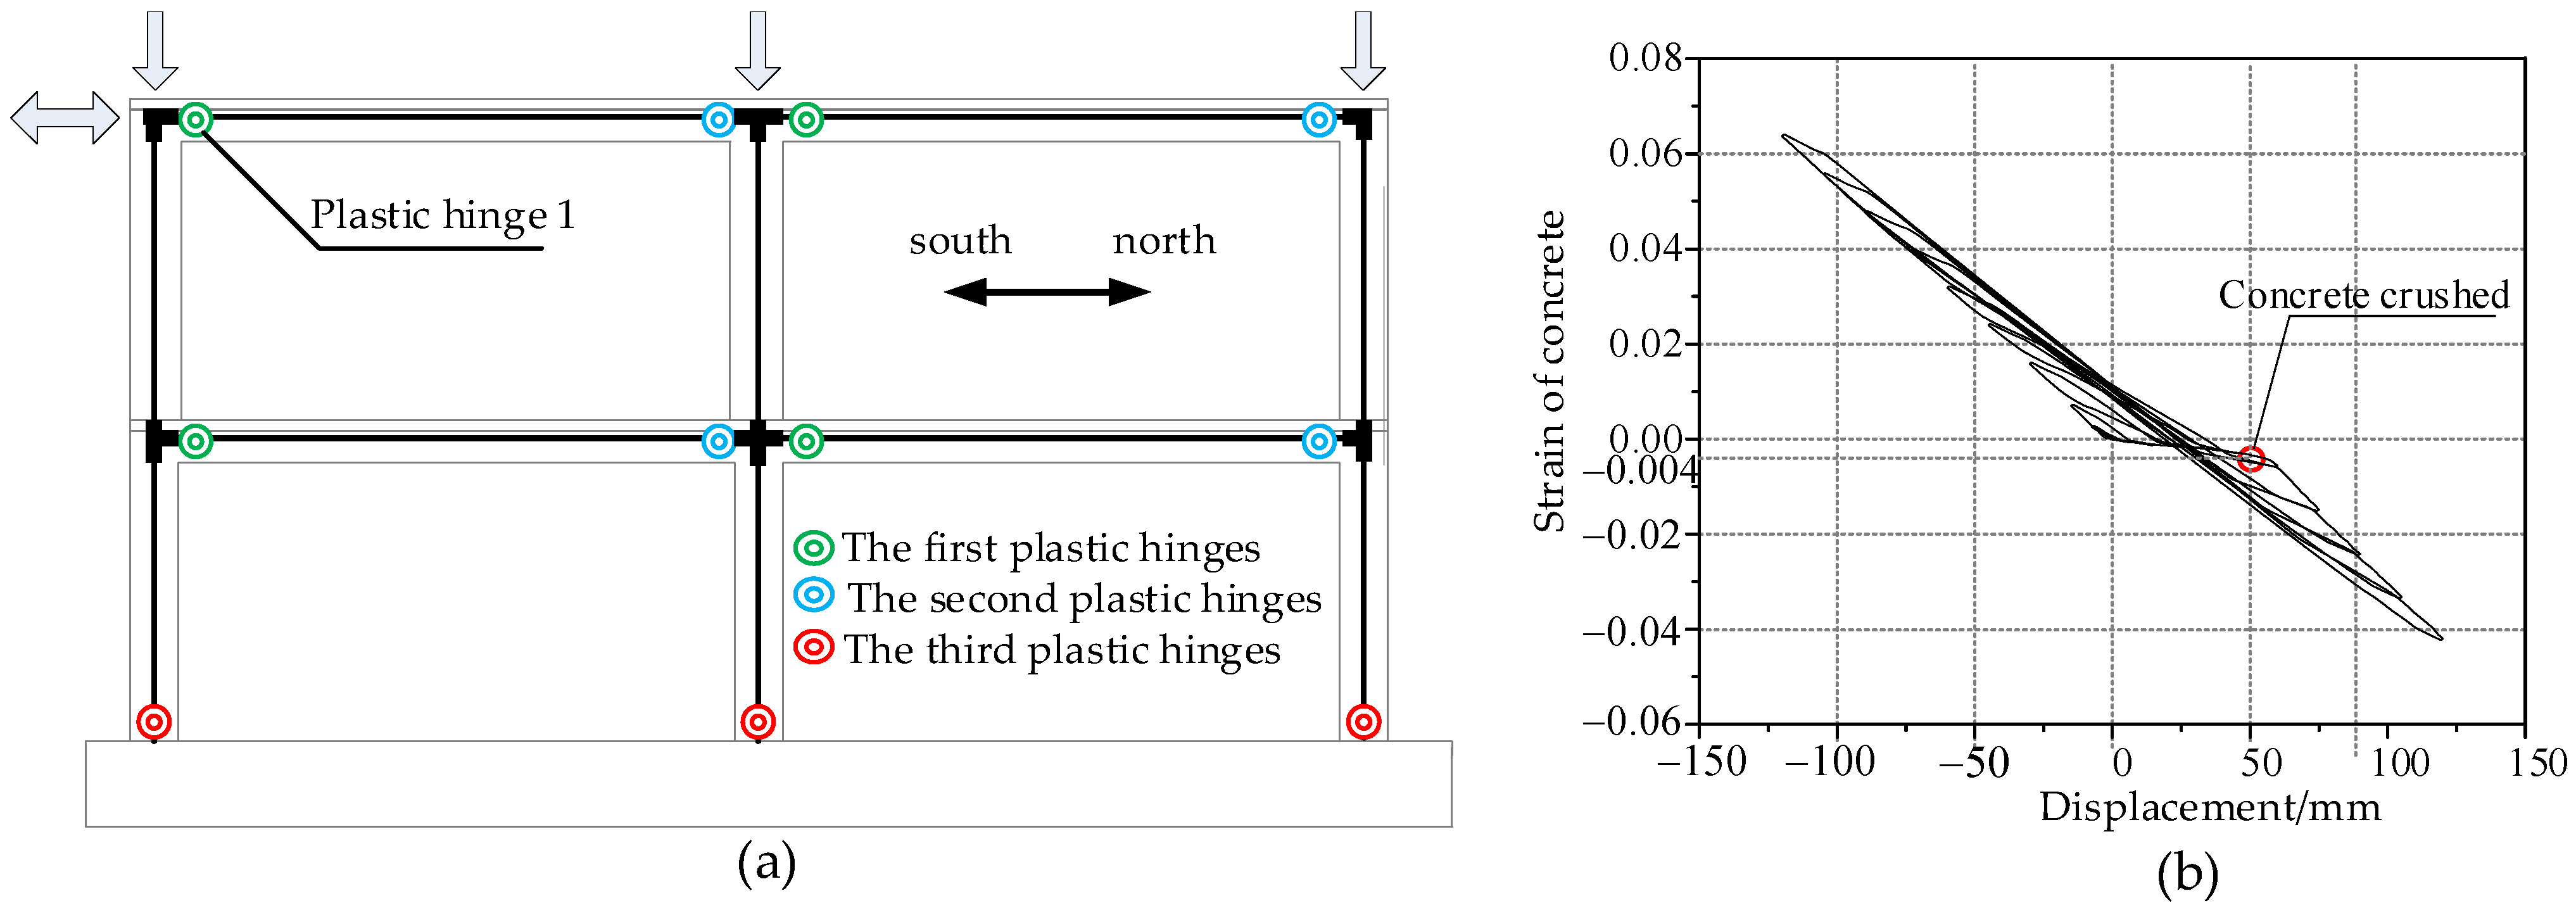
According to the Chinese code GB50011-2010 [27], the dead load factor and live load factor were separately taken as 1 and 0.5 when defining the mass sources. Set gravity load to Case 1, which was static nonlinear. The earthquake load was set to Case 2 as the time–history analysis case. Case 2 was initiated from the endpoint of Case 1. Because the diaphragm deformation was mainly concentrated in the Y direction, only the seismic action in the Y direction was considered. The solution method was the direct integration method.

3.2. Verification

3.2.1. Verification of Parameter Settings

The shear wall specimen RW2 [37] and the frame specimen PCF-1 [38] were selected to verify the rationality of the above FE parameters. The dimensions and steel reinforcements configurations are depicted in Figure 5.
For the shear wall specimen RW2, a constant and uniform vertical pressure was applied on the top area of the wall first, and then applied a horizontal monotonic load to the left endpoint on the top of the wall, using the displacement control method. The load-displacement curve of FEA and test are illustrated in Figure 6a, which matched well. At the same time, the failure modes of the test and FEA are presented in Figure 7. The bottom right concrete of the shear wall in FEA reached the ultimate strength of 41.87 MPa and crushed, which was consistent with the experimental failure phenomenon in Figure 7a, indicating that the finite element model can simulate the mechanical performance of the shear wall well.
For the frame specimen PCF-1, the vertical loads were first applied to the frame with an exterior column load of 250 kN and an interior column load of 350 kN, followed by a cyclic horizontal load on the top of the frame. The load-displacement hysteresis curves obtained by the test and FEA are shown in Figure 6b, which also match well. Simultaneously, the occurrence order of plastic hinges is depicted in Figure 8a, which is consistent with the description of the experimental phenomenon [38]. Moreover, when the structural displacement reached 45 mm, a large piece of concrete fell off at plastic hinge 1 in the test [38]. It can be seen from Figure 8b that the concrete reached the ultimate compressive strain of 0.004 when the structural displacement reached 50 mm in the FEA, which was consistent with the test phenomenon. Subsequently, the FE model can accurately simulate the mechanical behavior of the frame-shear wall structure.

3.2.2. Analysis Results: Comparison between ETABS and PKPM

In addition, it is necessary to verify the consistency between the analysis models in ETABS and the design models in PKPM. Based on the calculation results of rigid diaphragm models under frequent earthquakes in PKPM and ETABS, the total mass, fundamental period, elastic displacement at the top of the middle column in the X direction (as shown at point D in Figure 9), and base shear force of models were extracted. The comparison results are listed in Table 3. The total mass deviations and the fundamental period deviations were not more than 4%, and the top displacement deviations and the base shear force deviations were not more than 7%, representing that the structural analysis model in ETABS was consistent with the design model in PKPM.

4. The Effect of Flexible Diaphragm on Structural Seismic Performance

In this section, the fundamental period ratio, top displacement ratio at the top of the middle column in the X direction (as shown at point D in Figure 9), maximum inter-story drift ratio, and base shear force ratio were used to investigate the effect of the flexible diaphragm on structural seismic performance, described as follows:

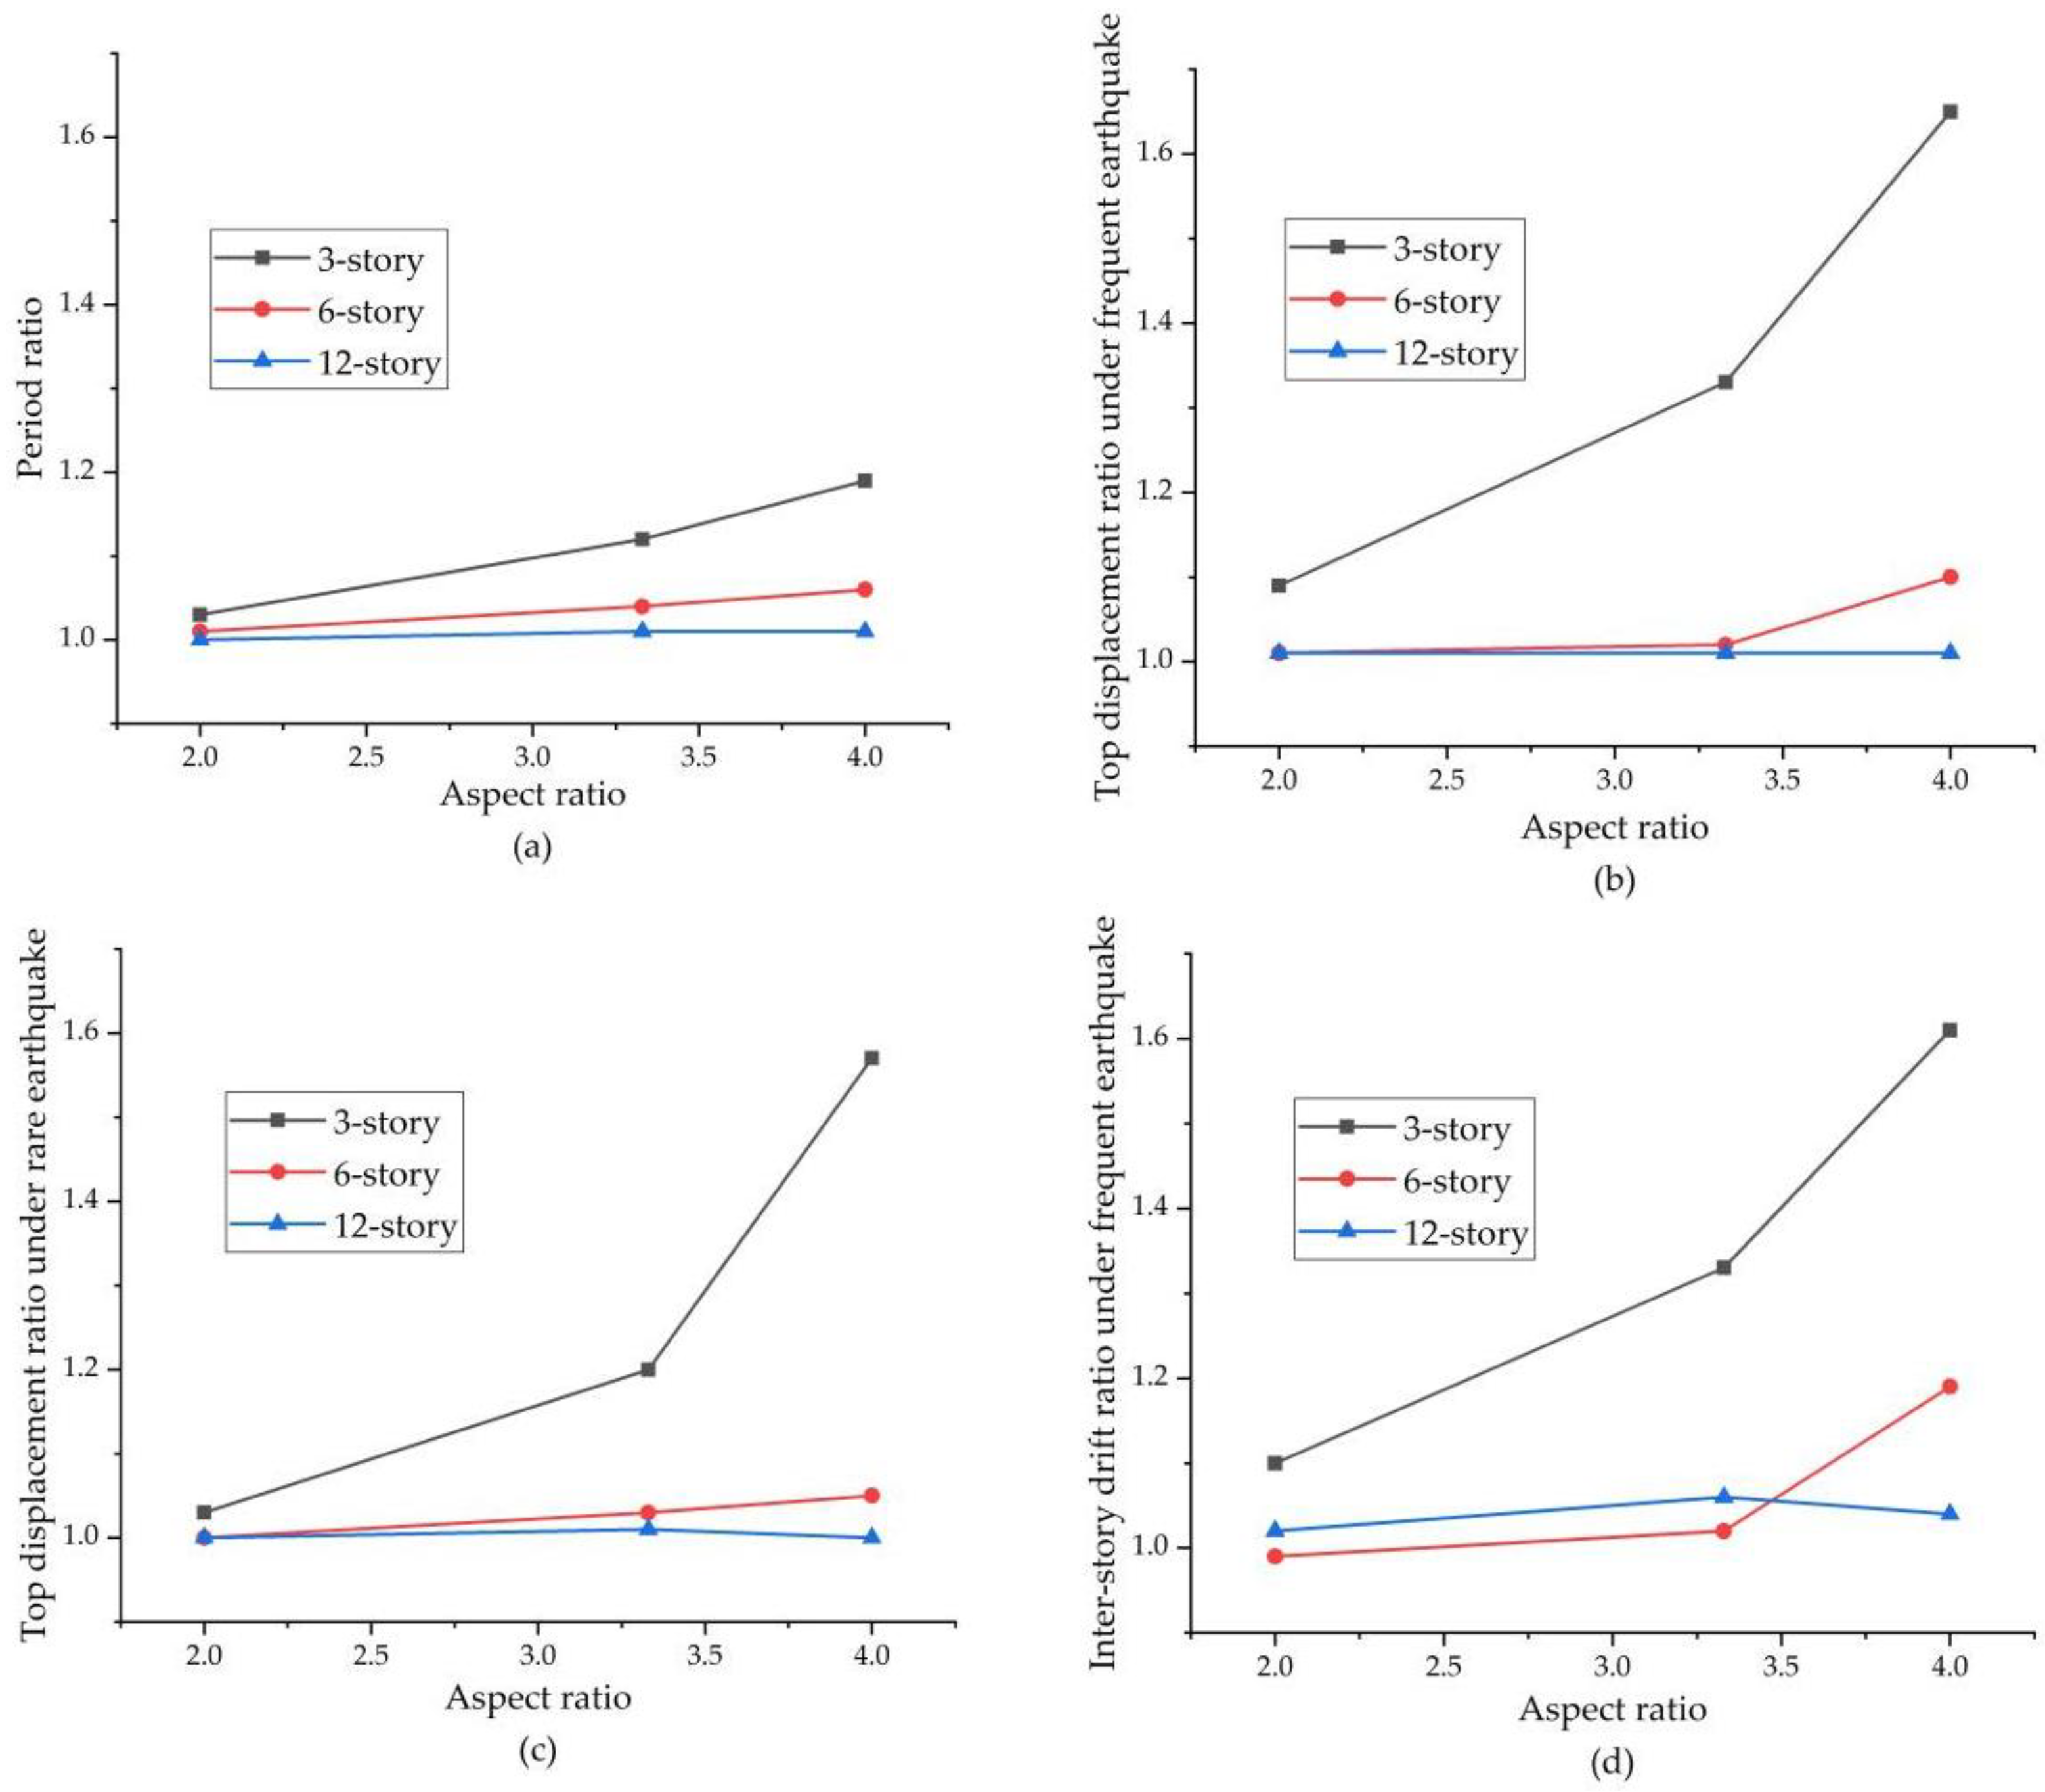
4.1. Fundamental Period Ratio

The relationship between the ratio of the fundamental period of flexible diaphragm models to that of rigid diaphragm models with a structural plane aspect ratio is shown in Figure 10a. The ratio of the period changed with the structural plane aspect ratio. Specifically, the period ratio decreased as the number of the story increased but increased as the aspect ratio increased. For the 3-story structures, the period of flexible diaphragm models with aspect ratios of 2, 3.33, and 4 increased by 3%, 12%, and 19%, respectively, compared with the corresponding rigid diaphragm models. For the 6-story and 12-story structures, the impact of elastic diaphragm deformation on the structural period was less than 7%, which could be ignored. Therefore, it turns out that the effect of the flexible diaphragm on the fundamental period is more significant in low-rise buildings.

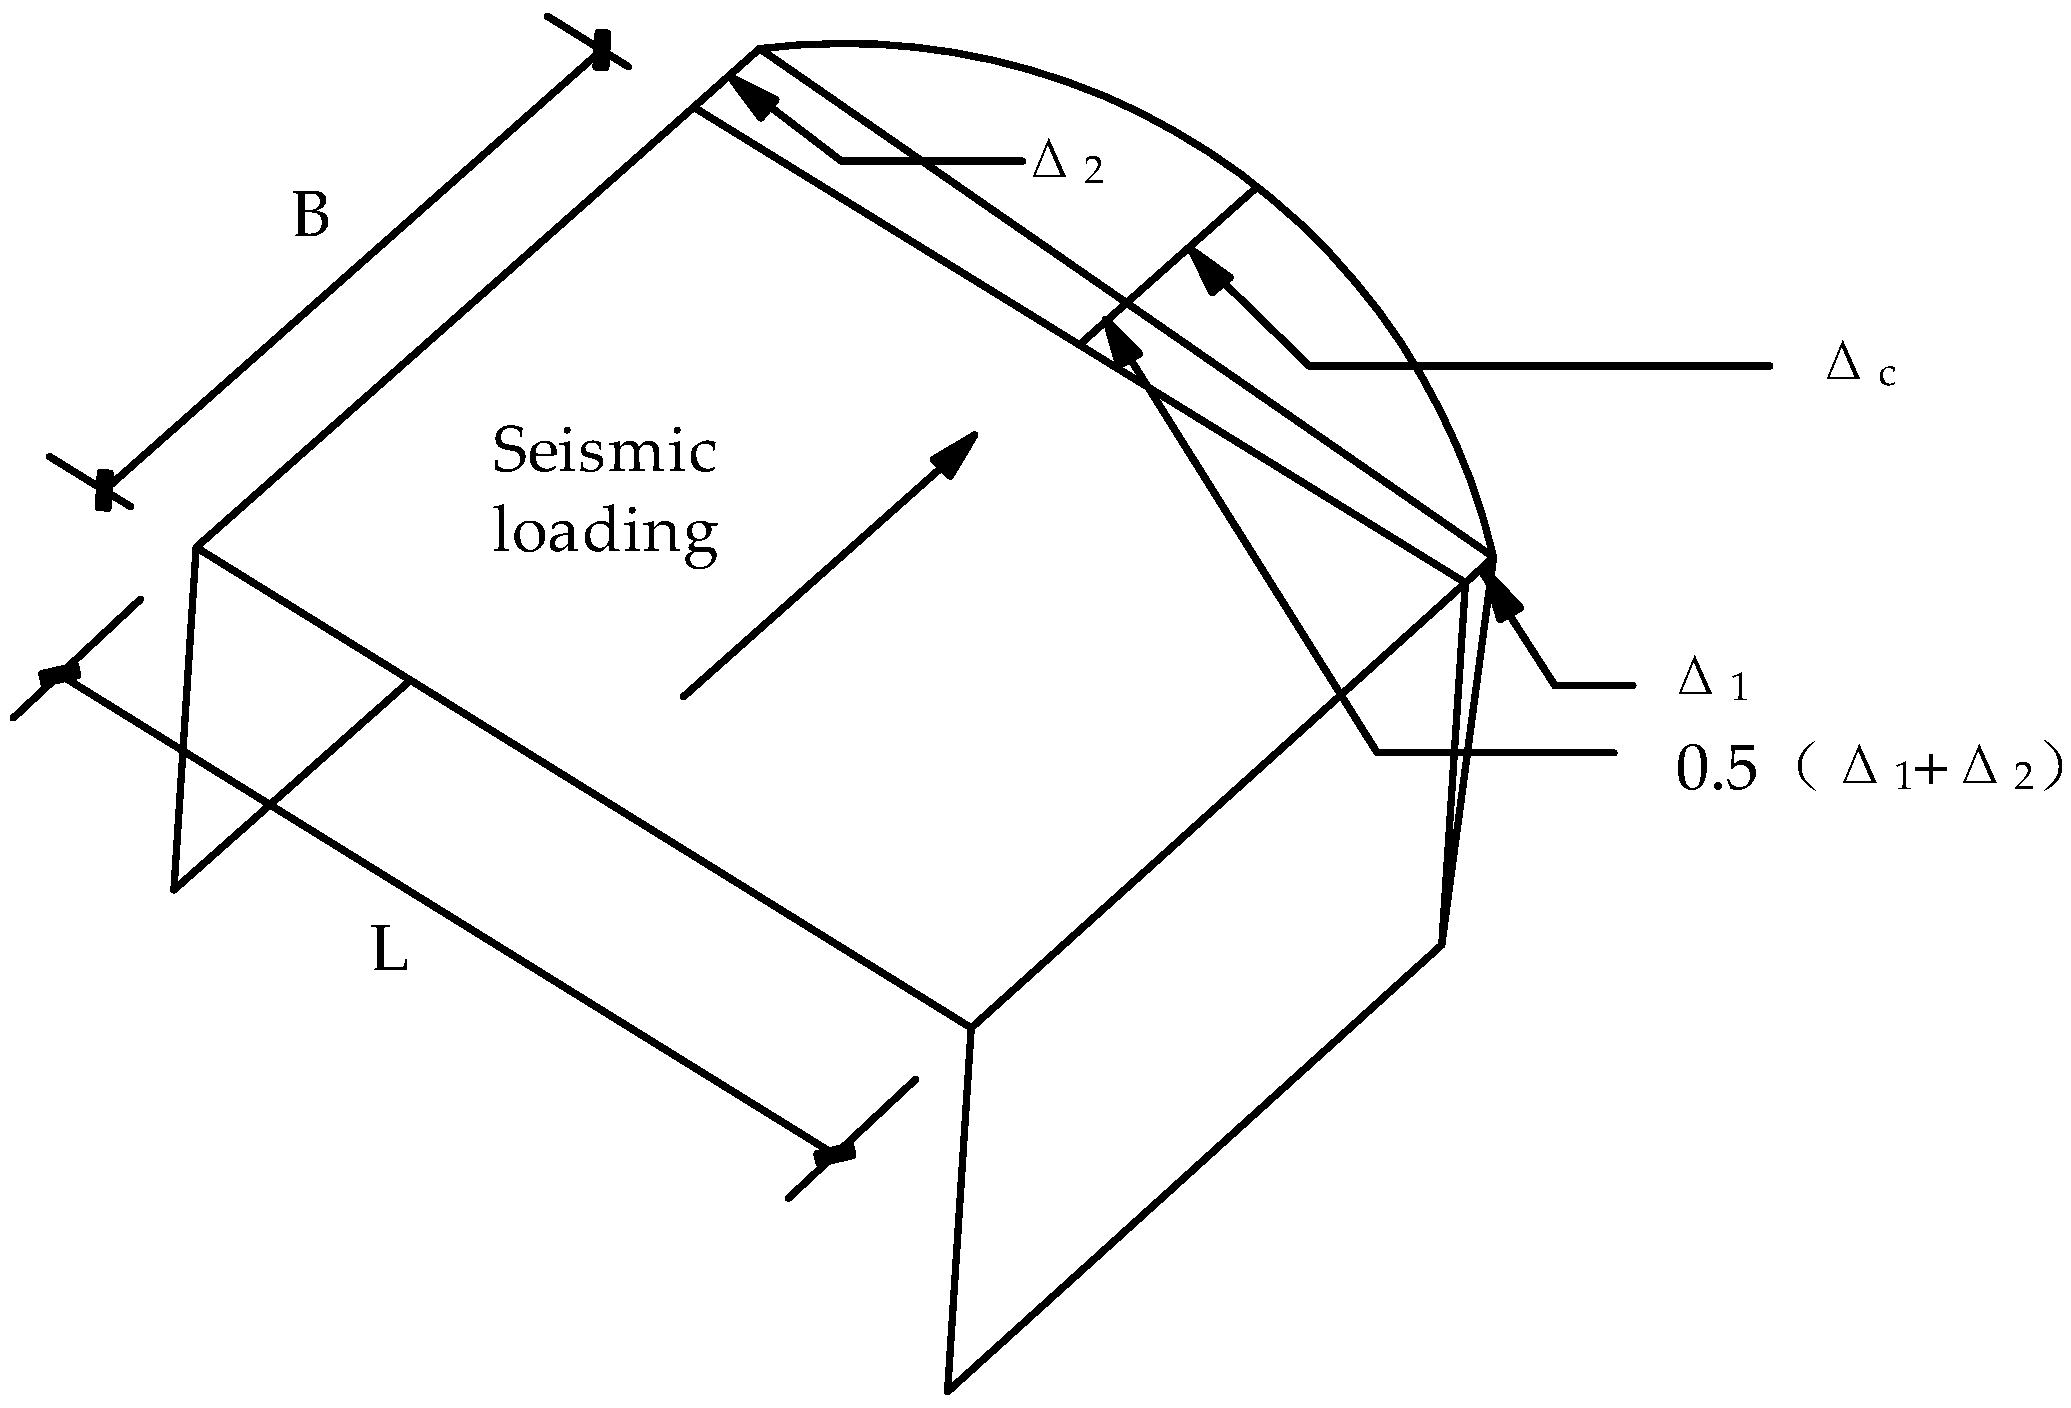
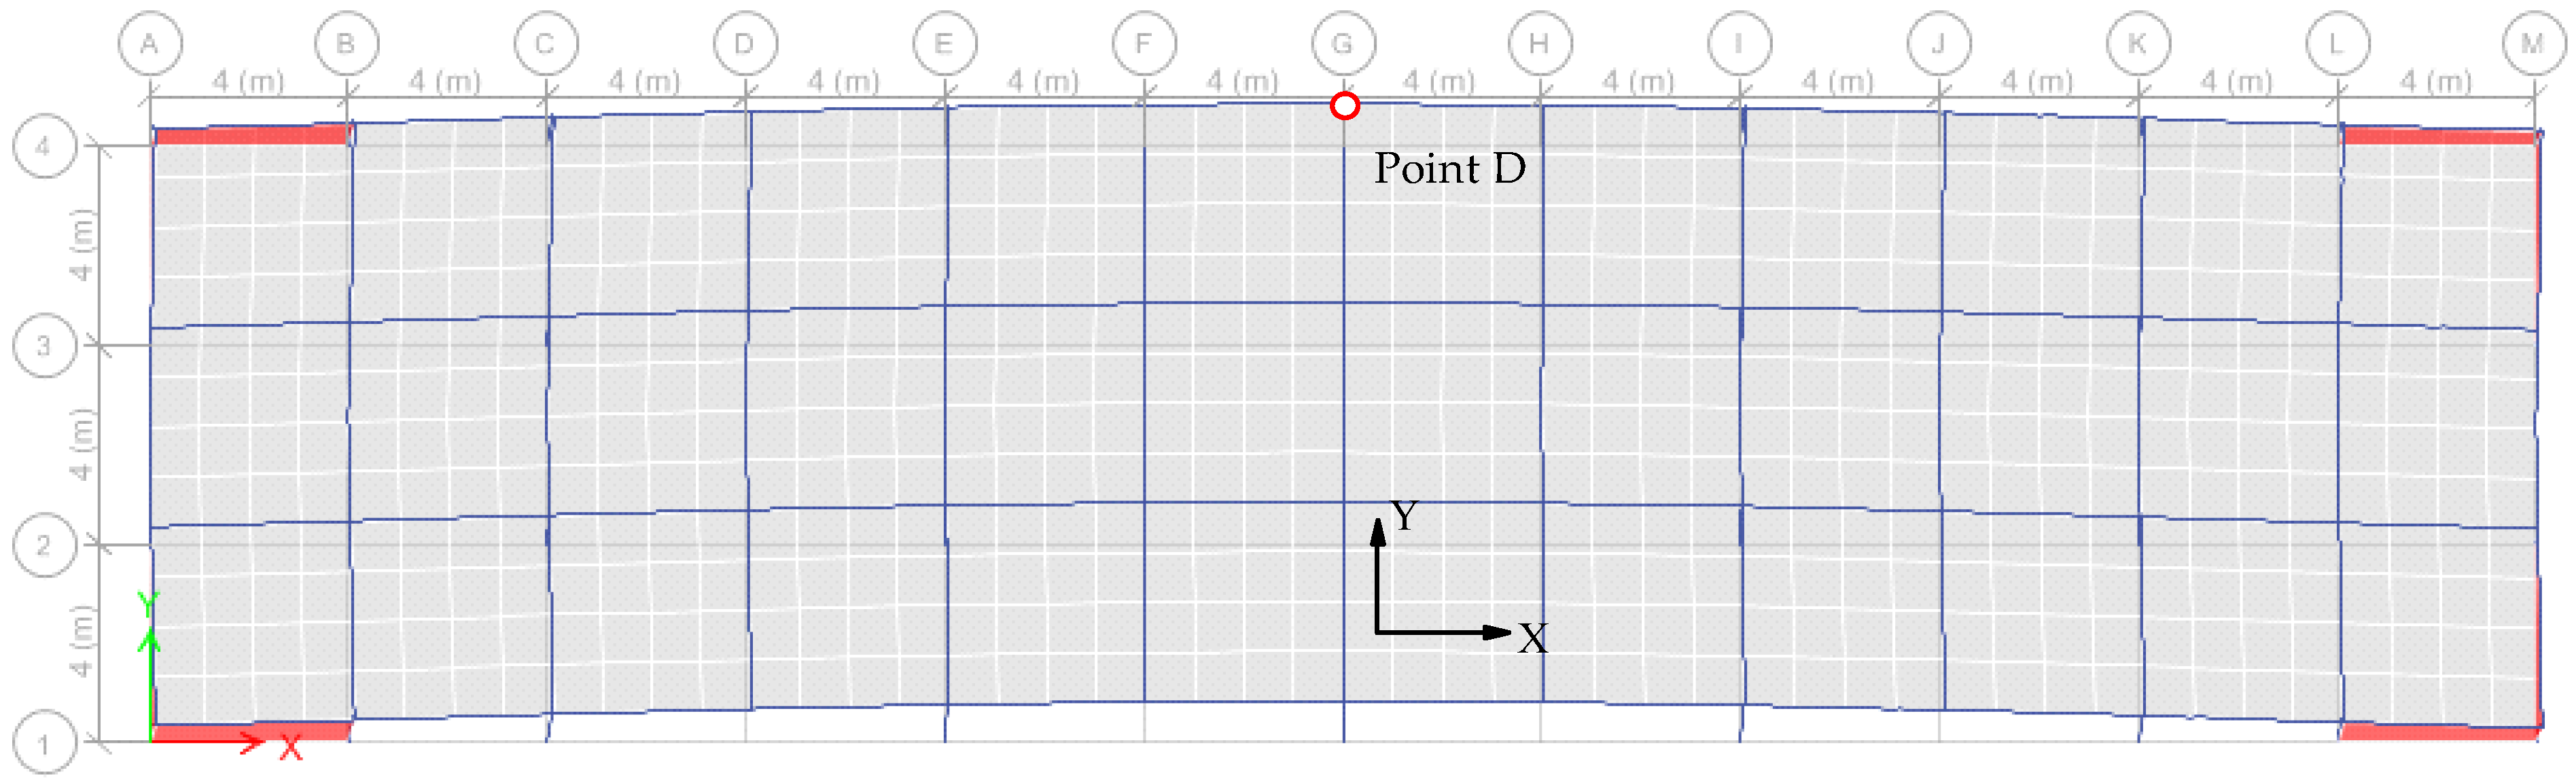
4.2. Top Displacement Ratio at Point D

Figure 10b presents the relationship between the elastic top displacement ratio of flexible diaphragm models to that of rigid diaphragm models with a structural plane aspect ratio under frequent earthquakes. The top displacement ratio decreased with the increase in the number of stories. For the 3-story structures, the top displacement of flexible diaphragm models with aspect ratios of 2, 3.33, and 4 increased by 9%, 33%, and 65% compared with the corresponding rigid diaphragm models, respectively. Meanwhile, for the 6-story structures, the top displacement of flexible diaphragm models with aspect ratios of 2, 3.33, and 4 increased by 1%, 2%, and 10% compared with the corresponding rigid diaphragm models, respectively. However, for the 12-story structures, the influence of the flexible diaphragm on the top displacement was less than 5%, which was inconsiderable. As a result, the impact of elastic diaphragm deformation on the top displacement of low-rise buildings is more significant.
Figure 10c depicts the relationship between the inelastic top displacement ratio of flexible diaphragm models to that of rigid diaphragm models with a structural plane aspect ratio under rare earthquakes. The top displacement ratio decreased with the increase in the number of stories. For the 3-story structures, the top displacement of flexible diaphragm models with aspect ratios of 2, 3.33, and 4 were 3%, 20%, and 57% larger than that of the corresponding rigid diaphragm models, respectively. Nevertheless, for the 6-story and 12-story structures, the influence of the flexible diaphragm on the top displacement was less than 5%, which was inconsequential. Thus, the impact of elastic diaphragm deformation on the top displacement of low-rise buildings is more significant.
In order to compare the influence of a flexible diaphragm on structural members, the deformation shapes of model F3-LB3.33 with rigid diaphragm and flexible diaphragm under rare earthquakes are illustrated in Figure 11. The number of plastic hinges in the rigid diaphragm model is significantly less than that of the flexible diaphragm model. Consequently, the influence of diaphragm deformation on the mechanical behavior of structural components should be considered.

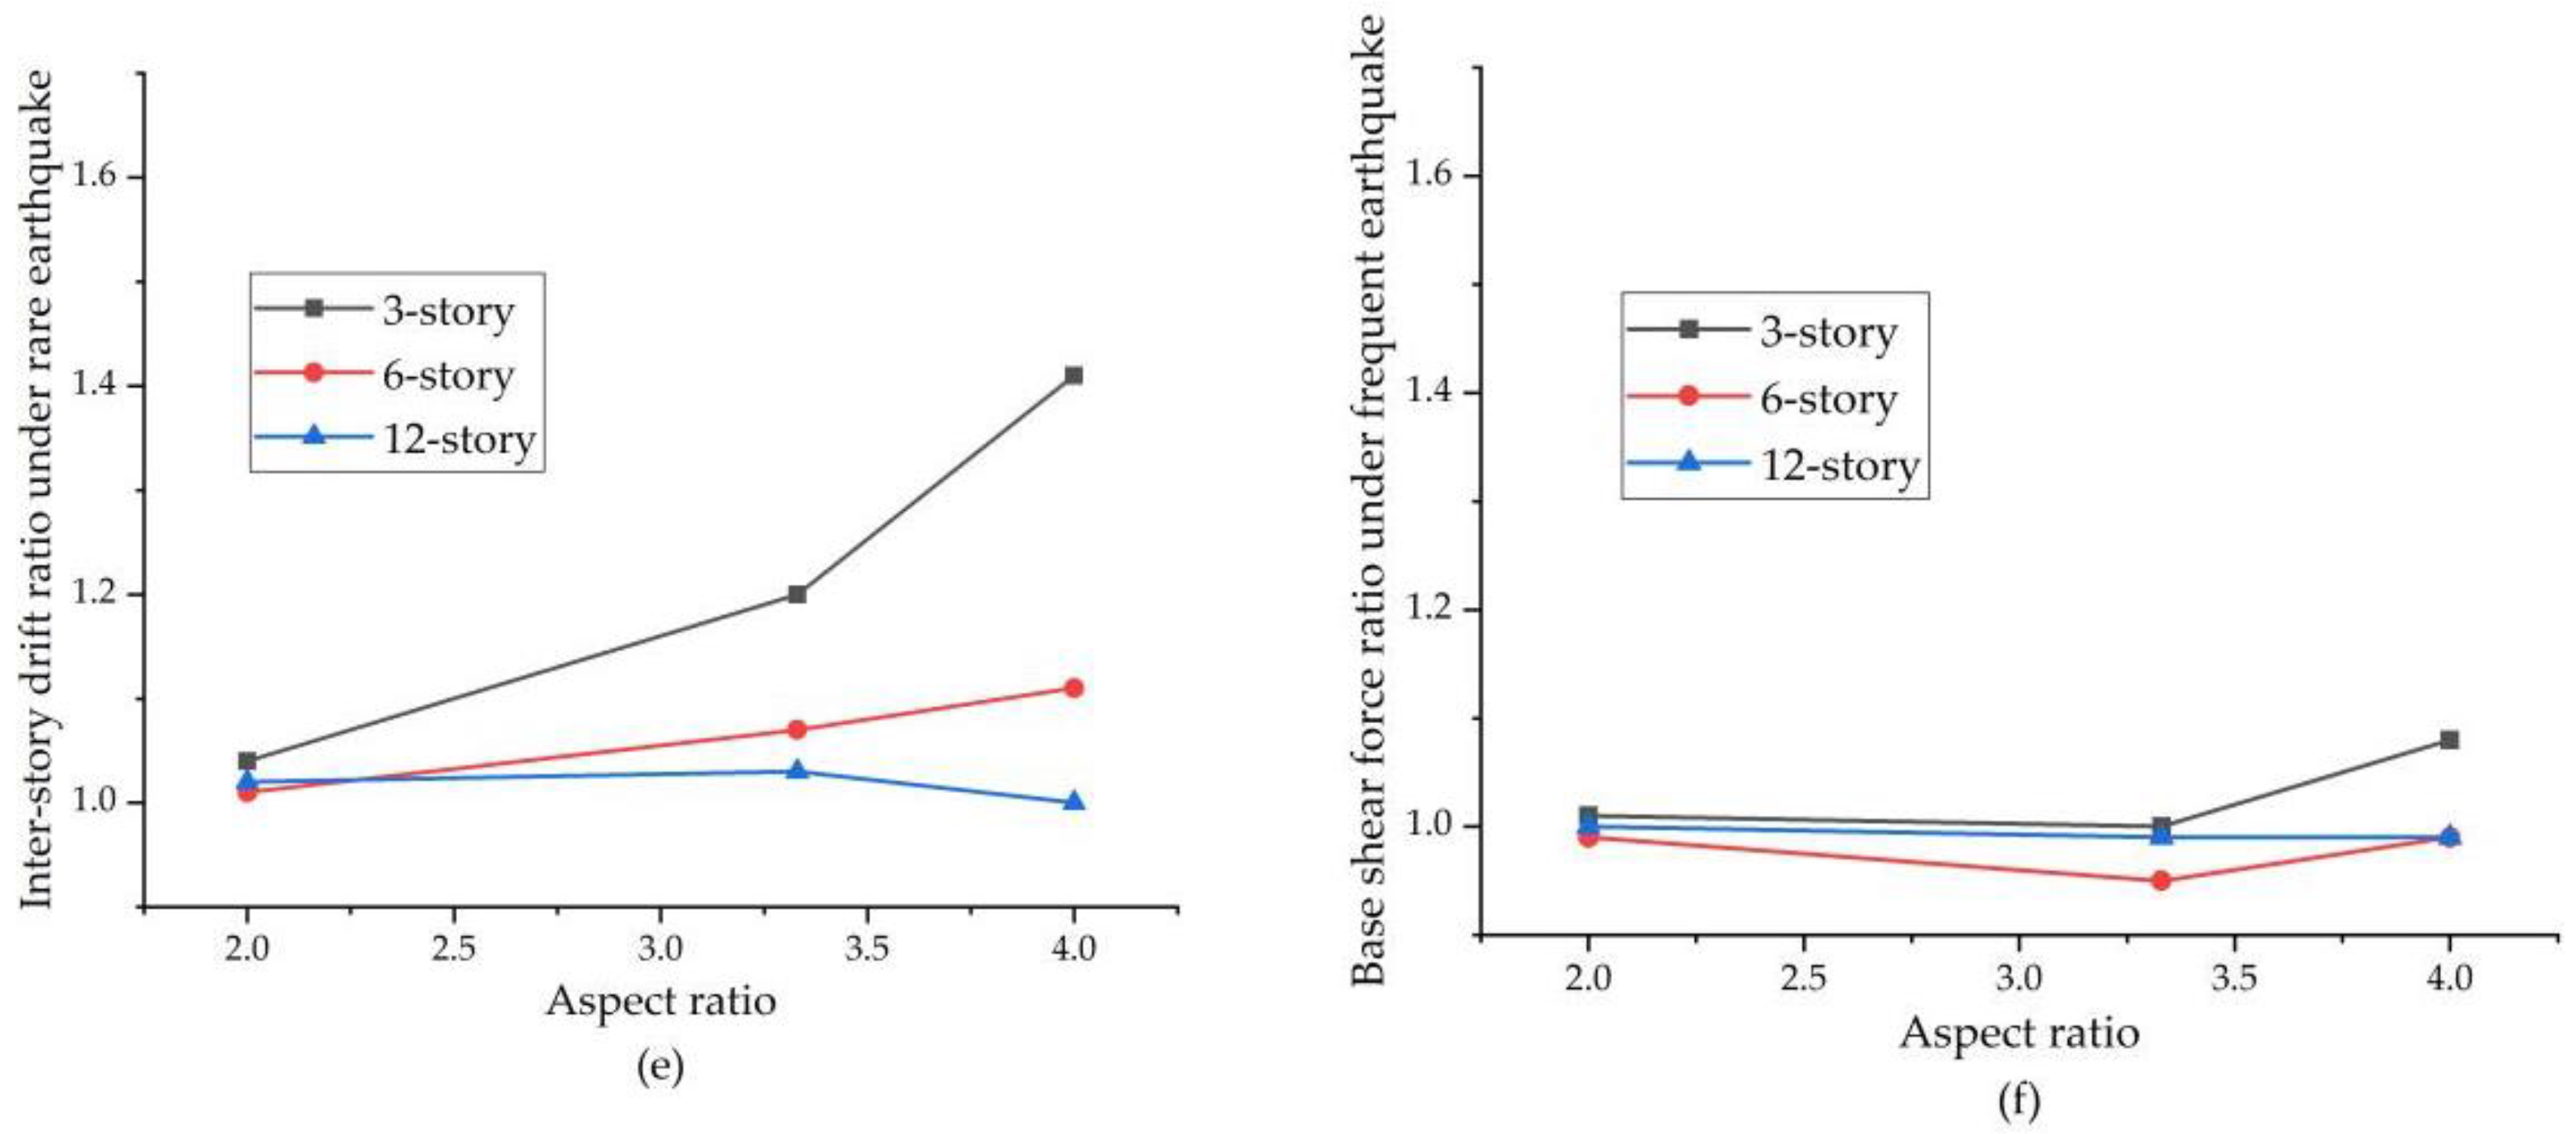
4.3. Inter-Story Drift Ratio

Figure 10d illustrates the relationship between the elastic maximum inter-story drift ratio of flexible diaphragm models to that of rigid diaphragm models with structural plane aspect ratio under frequent earthquakes. For the 3-story structures, the inter-story drift of flexible diaphragm models with aspect ratios of 2, 3.33, and 4 increased by 10%, 33%, and 61% compared to the corresponding rigid diaphragm models, respectively. However, for the 6-story structures, the changes in the inter-story drift of structures with aspect ratios of 2 and 3.33 were less than 5%; when the aspect ratio was 4, the inter-story drift of the flexible diaphragm model increased by 19% compared with the corresponding rigid diaphragm model. For the 12-story structures, the influence of the flexible diaphragm on structural inter-story drift was less than 5%, which was negligible. Hence, the impact of elastic diaphragm deformation on the inter-story drift of low-rise buildings is more significant.
Figure 10e shows the relationship between the inelastic maximum inter-story drift ratio of flexible diaphragm models to that of rigid diaphragm models with structural plane aspect ratio under rare earthquakes. For the 3-story structures, the inter-story drift of flexible diaphragm models with aspect ratios of 2, 3.33, and 4 increased by 4%, 20%, and 41% compared with the corresponding rigid diaphragm models, respectively. At the same time, for the 6-story structures, the inter-story drift of flexible diaphragm models with aspect ratios of 2, 3.33, and 4 increased by 1%, 7%, and 11% compared with the corresponding rigid diaphragm models, respectively. However, for the 12-story structures, the influence of the flexible diaphragm on structural inter-story drift was less than 5%, which was inconsequential. Consequently, the impact of elastic diaphragm deformation on the inter-story drift of low-rise buildings is more significant.

4.4. Base Shear Force Ratio

Figure 10f presents the relationship between the ratio of base shear force of flexible diaphragm models to that of rigid diaphragm models with structural plane aspect ratio under frequent earthquakes. The impacts of the flexible diaphragm on all models were less than 9%, which was negligible.

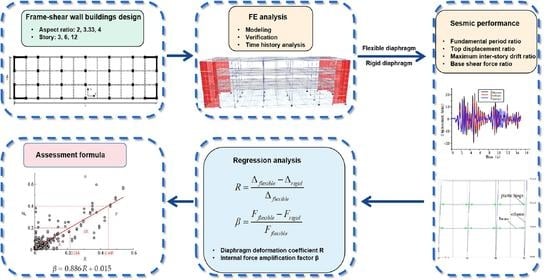
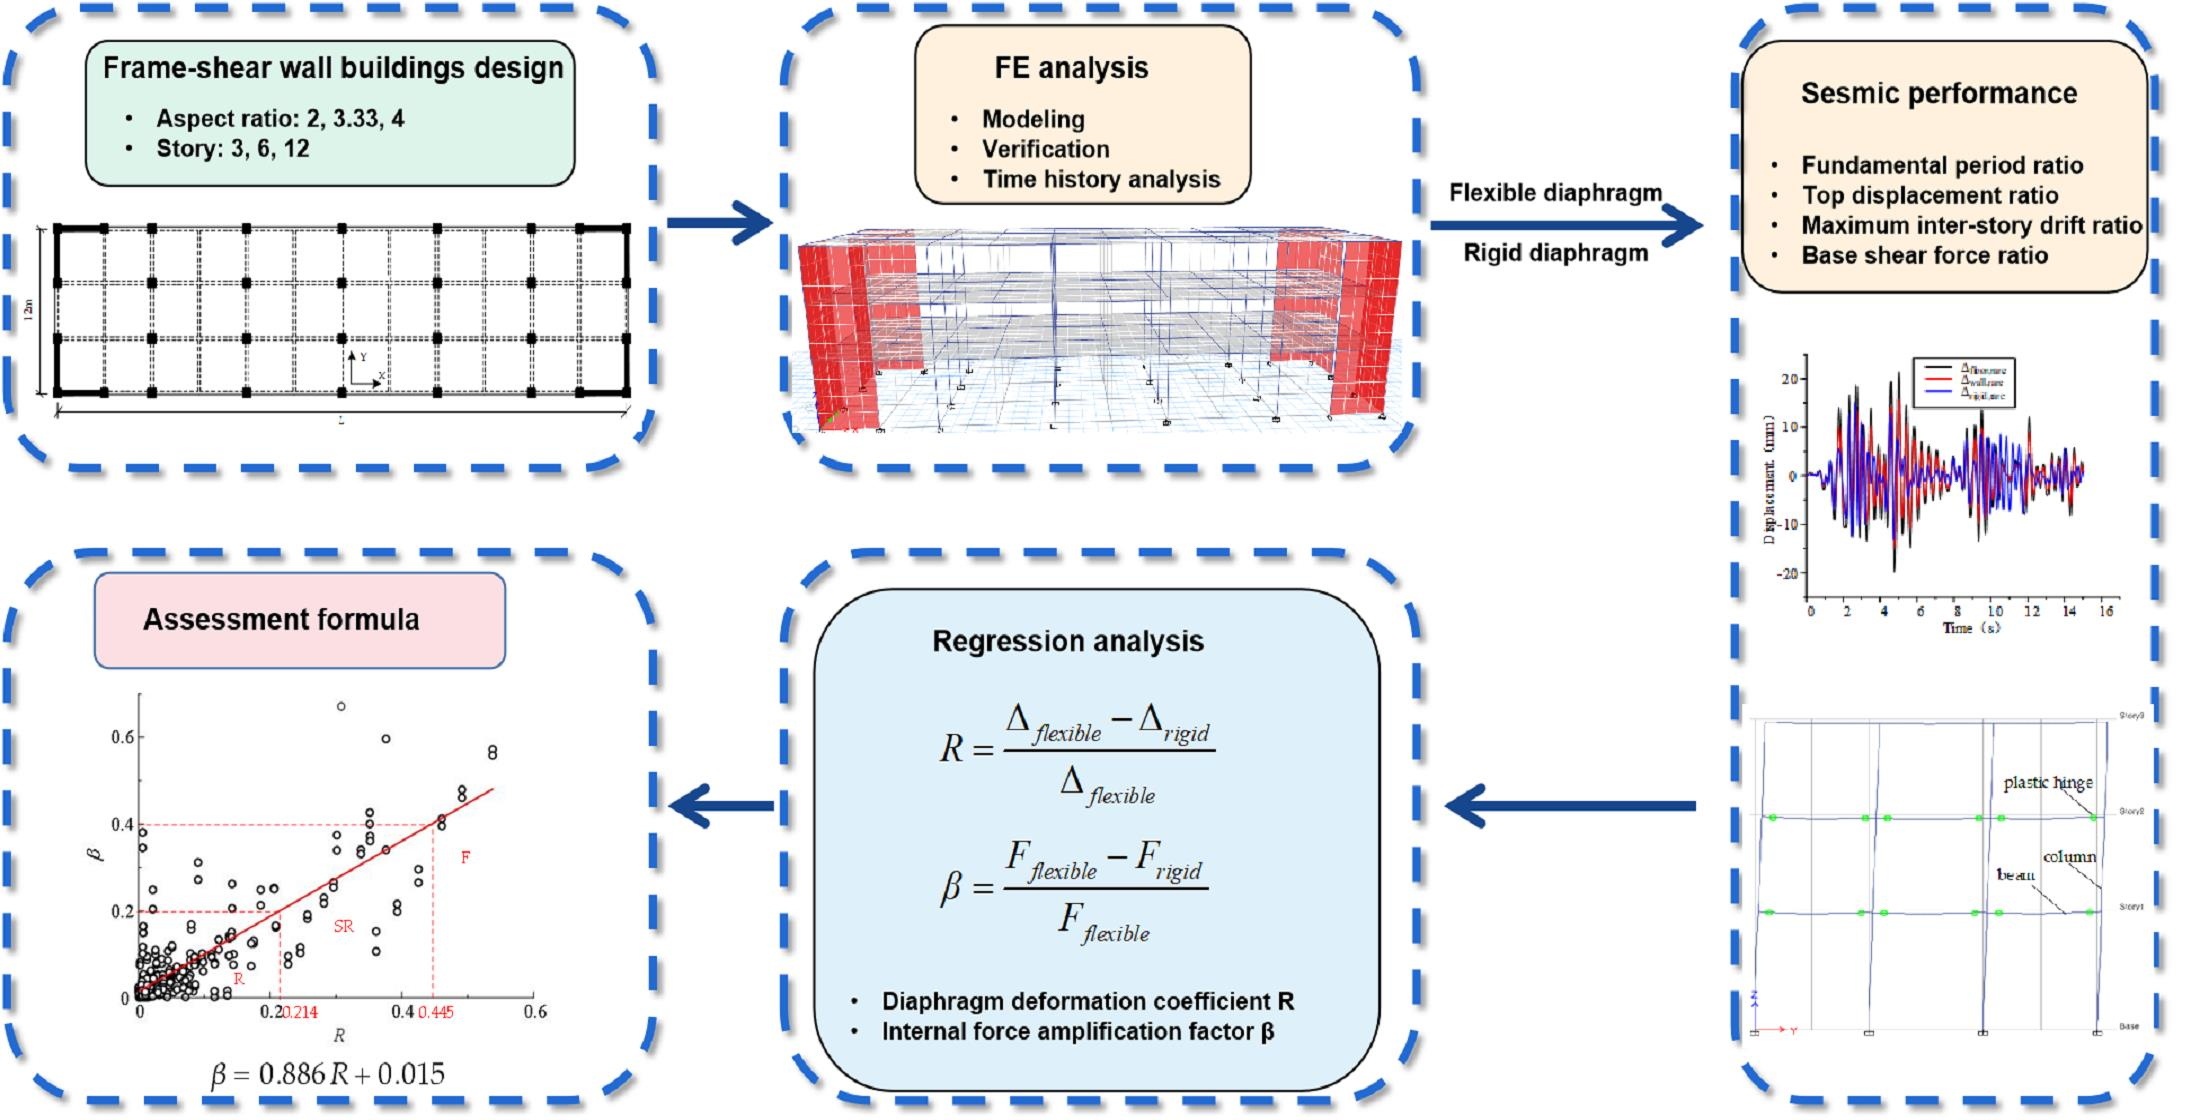
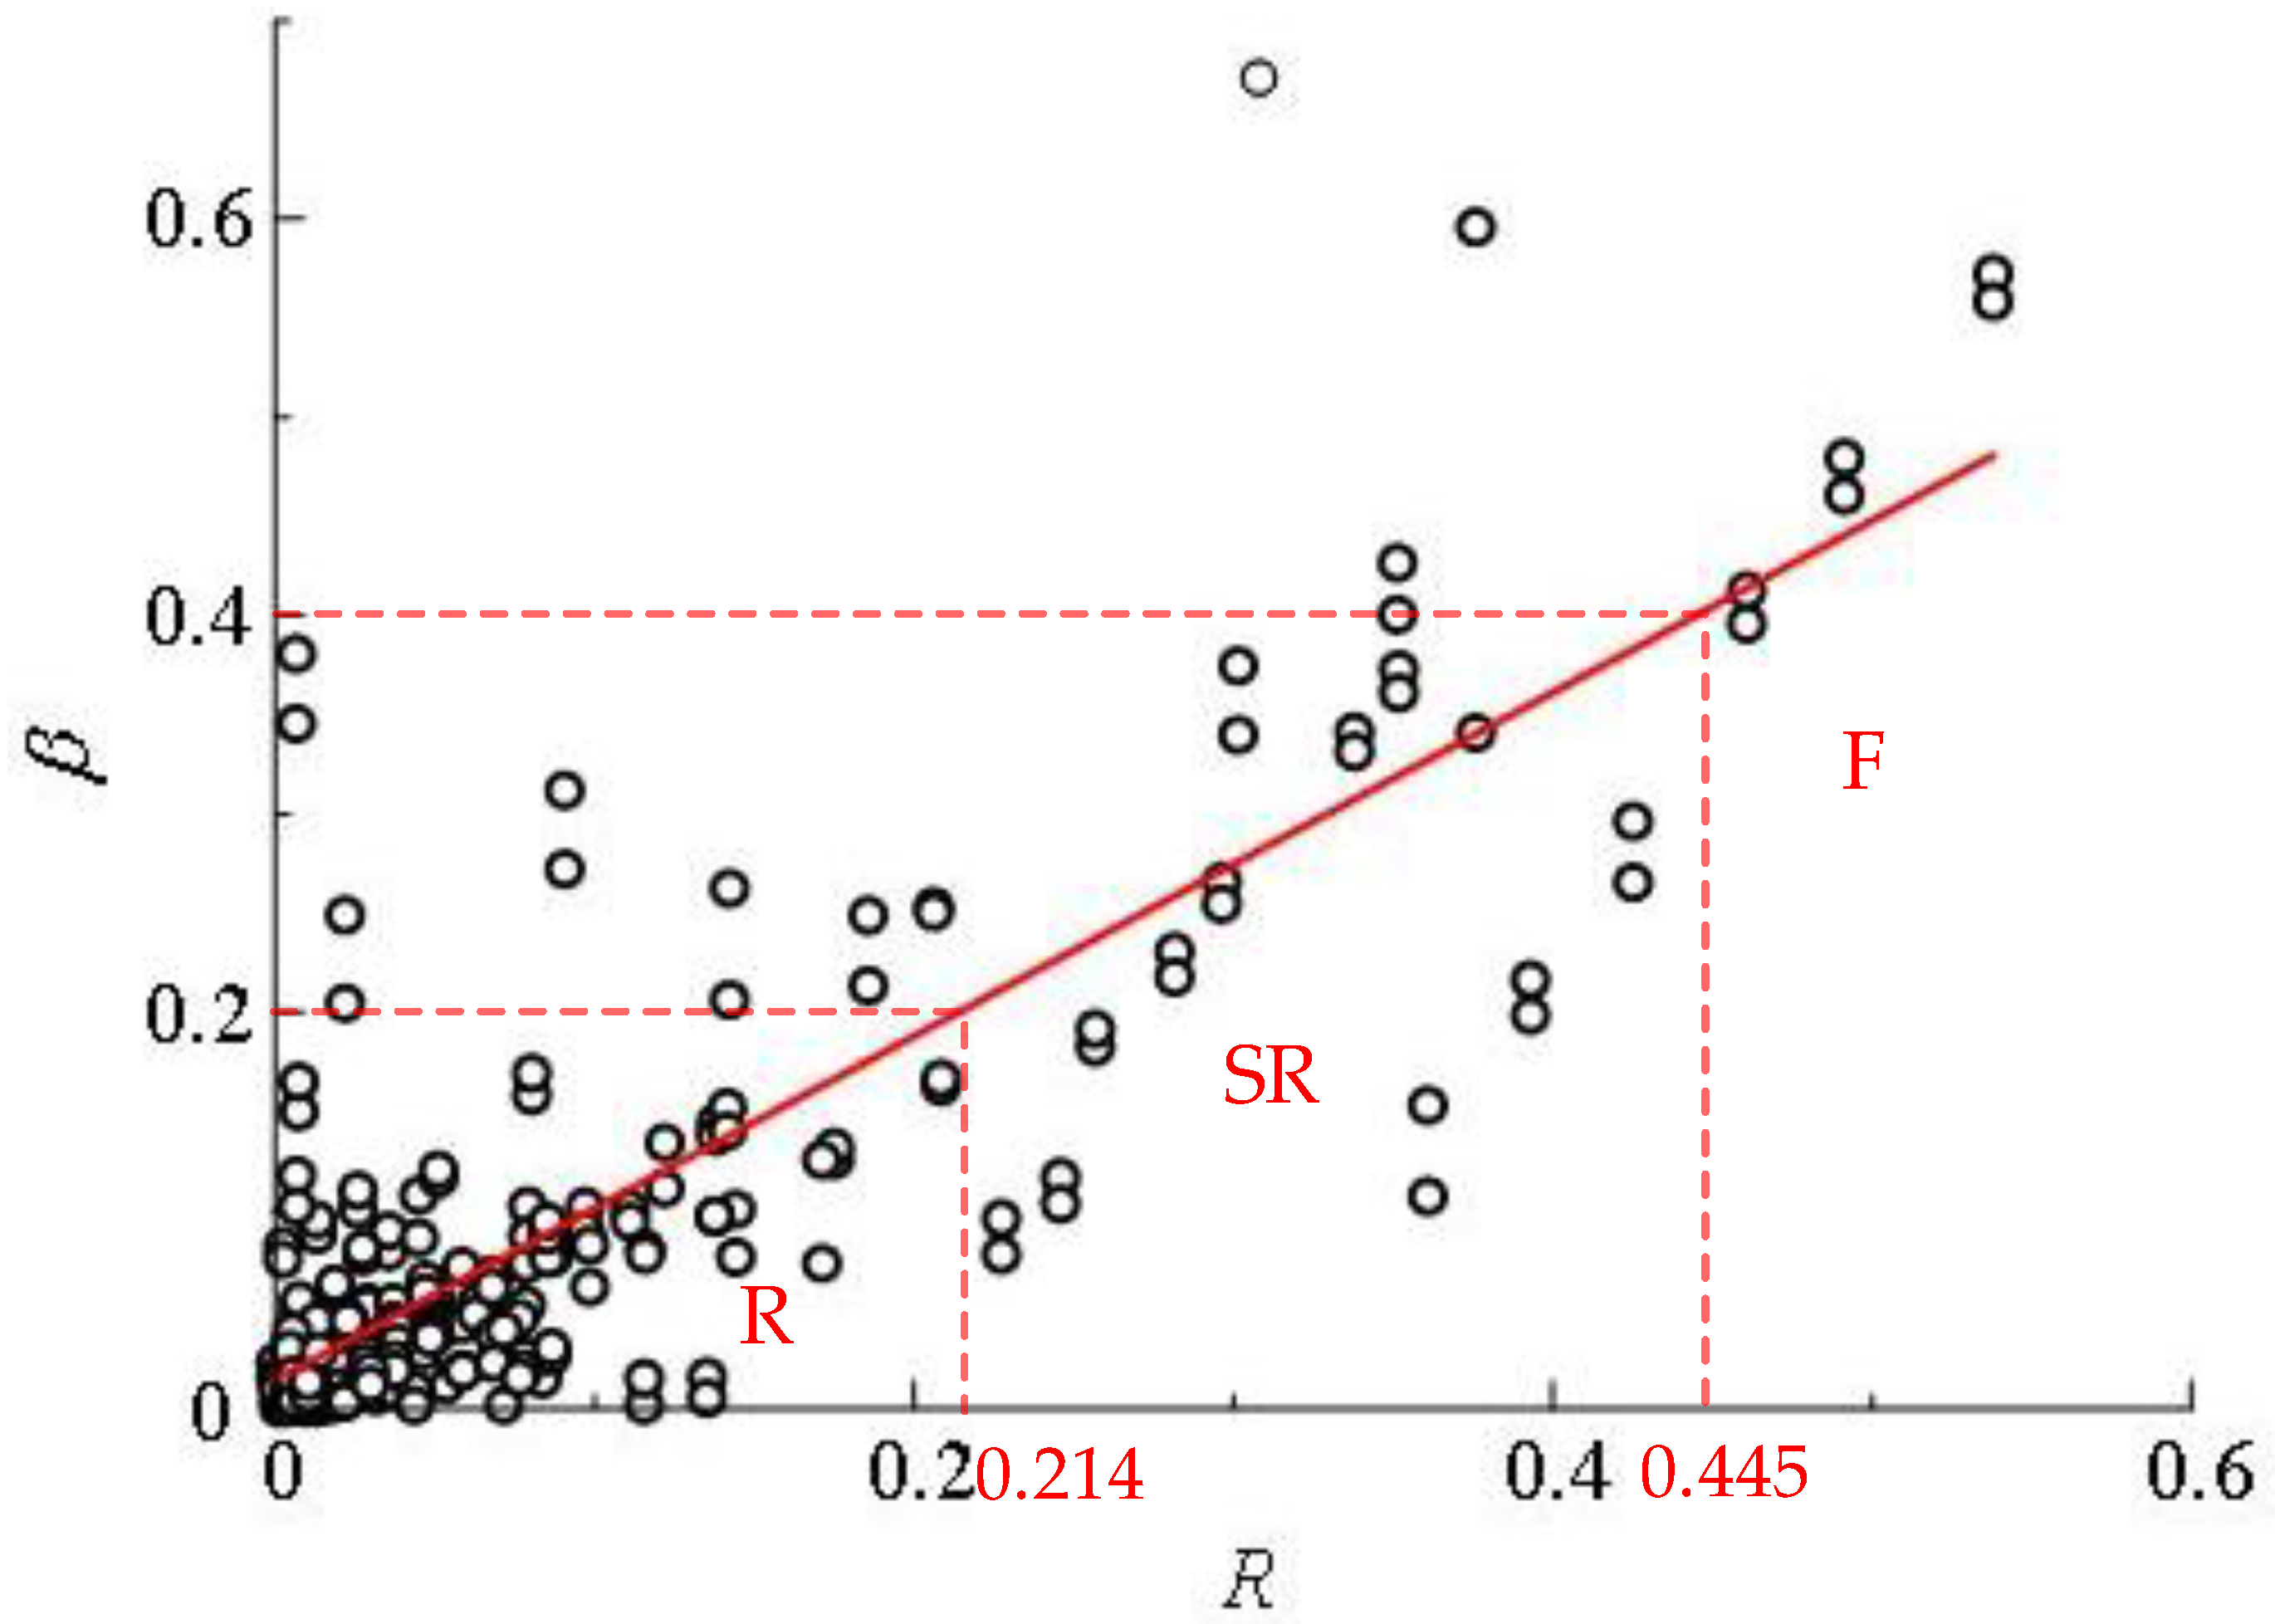
5. A Quantitative Assessment Formula of Diaphragm Type

Although the total base shear force of structures remained almost unchanged after considering the elasticity of the diaphragm, the proportion of shear force shared by the frame and shear wall changed a lot. In particular, the shear force borne by frame columns increased significantly, which affected the safety of the structural design. Therefore, this section analyzes the magnified effect of in-plane diaphragm deformation on the internal force of the frame. Then a quantitative evaluation formula of diaphragm elasticity will be proposed. The diaphragm deformation coefficient R and the amplification factor of frame columns’ internal force β are defined as Equations (6) and (7), respectively.
R = Δ flexible Δ rigid Δ flexible
β = F flexible F rigid F flexible
where Δ flexible is the maximum displacement of each story of the flexible diaphragm model; Δ rigid is the maximum displacement of the corresponding story of rigid diaphragm model. F flexible is the internal force of the middle frame column in the X direction of the flexible diaphragm model because this is the position of the largest in-plane deformation of the diaphragm and the internal force of the frame column here increases the most, as shown in Figure 9; F rigid is the internal force of the corresponding frame column of rigid diaphragm model.
Extracting R and β of each story of each model under four cases (such as shear force amplification and bending moment amplification factors under frequent and rare earthquakes) to perform regression analysis, the relationship between R with β can be obtained, as expressed in Equation (8). And the fitting curve is illustrated in Figure 12. When R < 0.214, the internal force amplification factor is less than 20%, and the rigid floor assumption can be used. When R > 0.445, the internal force amplification factor is greater than 40%, and the impact of diaphragm deformation should be considered. When 0.214 < R < 0.445, the impact of diaphragm deformation is appropriate to be considered [15].
β = 0.886 R + 0.015
Taking the maximum deformation coefficient R from each model, we obtain the diaphragm classification table of all structures, as listed in Table 4. The larger the aspect ratio, the larger the deformation coefficient R, and the greater the influence of diaphragm deformation on the structure.

6. Conclusions

As presented in this study, linear time history analysis under frequent earthquakes and nonlinear time history analysis under rare earthquakes were carried out to investigate the effect of diaphragm deformation on the seismic behavior of frame-shear wall structures. The fundamental period ratio, top displacement ratio, maximum inter-story drift ratio, and base shear force ratio between flexible diaphragm models and rigid diaphragm models were described with the changes in the number of stories and aspect ratios. Based on the regression analysis of the diaphragm deformation coefficients and the amplification factors of frame columns’ internal force, a simplified method to evaluate the diaphragm type was proposed. The main conclusions are as follows:
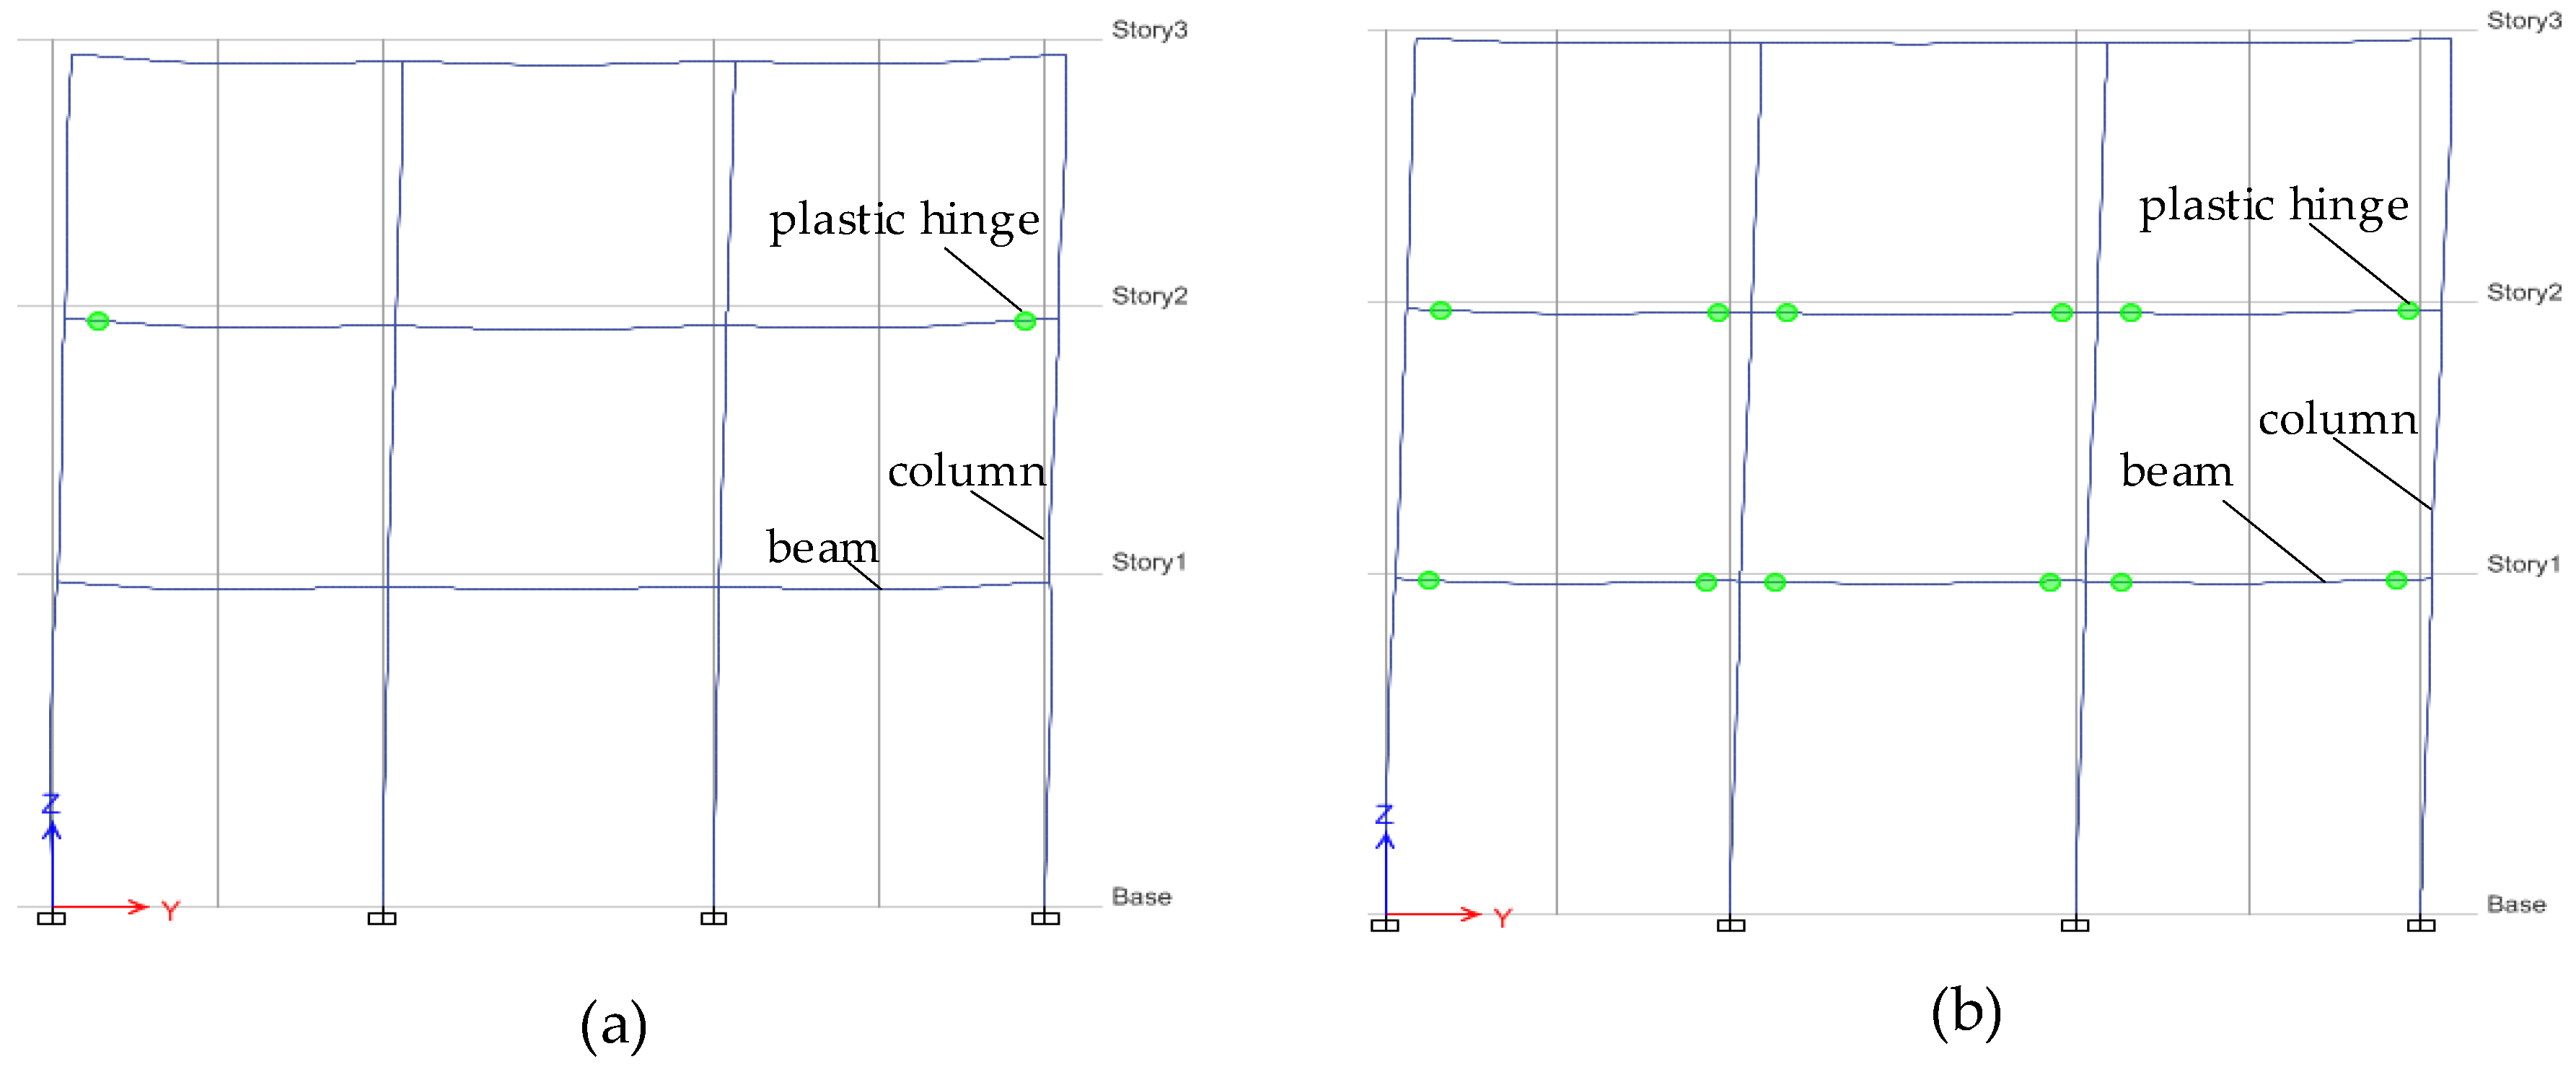
  • The element types, material constitutive models, and modeling methods used in this study can accurately simulate the mechanical performance of frame-shear wall structures, which is applicable for analyzing the seismic performance of frame-shear wall structures.
  • The fundamental structural period increases by considering the flexibility of the diaphragm. For the 3-story structures, the period of flexible diaphragm models with aspect ratios of 2, 3.33, and 4 increased by 3%, 12%, and 19%, respectively, compared with the corresponding rigid diaphragm models. For the 6-story and 12-story structures, the impact of elastic diaphragm deformation on the structural period was less than 7%.
  • After considering the diaphragm’s elasticity, the top displacement and inter-story drift magnify by decreasing the number of stories and increasing the plane aspect ratio. For the 3-story structures, under frequent earthquakes, the top displacement of flexible diaphragm models with aspect ratios of 2, 3.33, and 4 increased by 9%, 33%, and 65% compared with the corresponding rigid diaphragm models; under rare earthquakes, the top displacement increased by 3%, 20%, and 57%, respectively.
  • A simplified formula to calculate the internal force amplification factor of the frame column and a quantitative assessment method for evaluating the diaphragm type were proposed, which could provide a reference for practical engineering. To sum up, the fewer the number of stories, the larger the aspect ratio, and the greater the adverse effect of diaphragm deformation on structural seismic performance. When the deformation coefficient R > 0.445, the impact of diaphragm deformation should be considered, and the rigid floor assumption is not applicable anymore.
Eventually, it should be pointed out that the above analysis results are based on the rectangular plane layout of the building structural models with shear walls at the corners and moment frames in the interior, which is a relatively regular plane. The influence of parameters such as structural asymmetry and floor openings is not considered, resulting in limitations in the evaluation criteria for diaphragm type, but the evaluation method is universal. Further study is needed to consider the impact of more extensive parameters.

Author Contributions

Conceptualization, Y.H.; methodology, L.W.; software, L.W.; validation, X.Z.; data curation, X.H.; writing—original draft preparation, L.W. and X.Z.; writing—review and editing, X.Z.; visualization, X.H.; supervision, Y.H. All authors have read and agreed to the published version of the manuscript.

Funding

This research was funded by the Natural Science Foundation of Hunan Province with Grant No. 2020JJ2003 and No. 2020RC5005.

Institutional Review Board Statement

Not applicable.

Informed Consent Statement

Not applicable.

Data Availability Statement

The data presented in this study are available upon reasonable request from the corresponding author.

Conflicts of Interest

The authors declare no conflict of interest.

References

  1. Tena-Colunga, A.; Chinchilla-Portillo, K.L.; Juárez-Luna, G. Assessment of the diaphragm condition for floor systems used in urban buildings. Eng. Struct. 2015, 93, 70–84. [Google Scholar] [CrossRef]
  2. Khajehdehi, R.; Panahshahi, N. Effect of openings on in-plane structural behavior of reinforced concrete floor slabs. J. Build. Eng. 2016, 7, 1–11. [Google Scholar] [CrossRef]
  3. Eivani, H.; Moghadam, A.S.; Aziminejad, A.; Nekooei, M. Seismic response of plan-asymmetric structures with diaphragm flexibility. Shock Vib. 2018, 2018, 4149212. [Google Scholar] [CrossRef] [Green Version]
  4. Fang, C.H.; Leon, R.T. Seismic Behavior of Symmetric and asymmetric steel structures with rigid and semirigid diaphragms. J. Struct. Eng. ASCE 2018, 144, 04018186. [Google Scholar] [CrossRef]
  5. Koliou, M.; Filiatrault, A.; Kelly, D.; Lawson, J. Buildings with rigid walls and flexible roof diaphragms. I: Evaluation of current U.S. seismic provisions. J. Struct. Eng. ASCE 2016, 142, 04015166. [Google Scholar] [CrossRef]
  6. Koliou, M.; Filiatrault, A.; Kelly, D.; Lawson, J. Buildings with rigid walls and flexible roof diaphragms. II: Evaluation of a new seismic design approach based on distributed diaphragm yielding. J. Struct. Eng. ASCE 2016, 142, 04015167. [Google Scholar] [CrossRef]
  7. Koliou, M.; Filiatrault, A.; Kelly, D.; Lawson, J. Distributed yielding concept for improved seismic collapse performance of rigid wall-flexible diaphragm buildings. J. Struct. Eng. ASCE 2016, 142, 04015137. [Google Scholar] [CrossRef] [Green Version]
  8. Sadashiva, V.K.; Macrae, G.A.; Deam, B.L.; Spooner, M.S. Quantifying the seismic response of structures with flexible diaphragms. Earthq. Eng. Struct. Dyn. 2012, 41, 1365–1389. [Google Scholar] [CrossRef]
  9. Eivani, H.; Tena-Colunga, A.; Moghadam, A.S. Proper configuration of stiffness and strength centers in asymmetric single-story structures with semi-flexible diaphragms. Structures 2022, 40, 149–162. [Google Scholar] [CrossRef]
  10. Buka-Vaivade, K.; Serdjuks, D.; Pakrastins, L. Cost factor analysis for timber–concrete composite with a lightweight plywood rib floor panel. Buildings 2022, 12, 761. [Google Scholar] [CrossRef]
  11. Loss, C.; Pacchioli, S.; Polastri, A.; Casagrande, D.; Pozza, L.; Smith, I. Numerical study of alternative seismic-resisting systems for CLT buildings. Buildings 2018, 8, 162. [Google Scholar] [CrossRef] [Green Version]
  12. Mirra, M.; Ravenshorst, G. Optimizing seismic capacity of existing masonry buildings by retrofitting timber floors: Wood-based solutions as a dissipative alternative to rigid concrete diaphragms. Buildings 2021, 11, 604. [Google Scholar] [CrossRef]
  13. Tomic, I.; Vanin, F.; Božuli, I.; Beyer, K. Numerical simulation of unreinforced masonry buildings with timber diaphragms. Buildings 2021, 11, 205. [Google Scholar] [CrossRef]
  14. Roncari, A.; Gobbi, F.; Loss, C. Nonlinear static seismic response of a building equipped with hybrid cross-laminated timber floor diaphragms and concentric X-braced steel frames. Buildings 2021, 11, 9. [Google Scholar] [CrossRef]
  15. Ju, S.H.; Lin, M.C. Comparison of building analyses assuming rigid or flexible floors. J. Struct. Eng. ASCE 1999, 125, 25–31. [Google Scholar] [CrossRef]
  16. Ruggieri, S.; Porco, F.; Uva, G. A practical approach for estimating the floor deformability in existing RC buildings: Evaluation of the effects in the structural response and seismic fragility. Bull. Earthq. Eng. 2020, 18, 2083–2113. [Google Scholar] [CrossRef]
  17. Ruggieri, S.; Porco, F.; Uva, G. A numerical procedure for modeling the floor deformability in seismic analysis of existing RC buildings. J. Build. Eng. 2018, 19, 273–284. [Google Scholar] [CrossRef]
  18. Doudoumis, I.N.; Athanatopoulou, A.M. Code provisions and analytical modelling for the in-plane flexibility of floor diaphragms in building structures. J. Earthq. Eng. 2001, 5, 565–594. [Google Scholar] [CrossRef]
  19. Pecce, M.; Ceroni, F.; Maddaloni, G.; Iannuzzella, V. Assessment of the in-plane deformability of RC floors with traditional and innovative lightening elements in RC framed and wall structures. Bull. Earthq. Eng. 2017, 15, 3125–3149. [Google Scholar] [CrossRef]
  20. Pecce, M.R.; Ceroni, F.; Maddaloni, G. In-plane deformability of RC floors: Assessment of the main parameters and influence on dynamic behaviour. Bull. Earthq. Eng. 2019, 17, 297–311. [Google Scholar] [CrossRef]
  21. Fleischman, R.B.; Farrow, K.T.; Eastman, K. Seismic Performance of Perimeter Lateral-System Structures with Highly Flexible Diaphragms. Earthq. Spectra 2015, 18, 251–286. [Google Scholar] [CrossRef]
  22. Zhang, Z.H.; Shu, X.P.; He, R.; Xiao, S.J.; Liu, Z.L. Analysis and assessment on in-plane stiffness performance of assembly truss beam composite floor. J. Build. Struct. 2017, 38, 105–112. (In Chinese) [Google Scholar]
  23. Wei, L.; Wang, S.; Chen, Z.R.; Zeng, Q.L.; Yang, R.M. Slab stress analysis and design of high-rise building structure under horizontal load. Build. Struct. 2017, 47, 10–16. (In Chinese) [Google Scholar]
  24. ASCE Standard ASCE/SEI 7-10; Minimum Design Loads for Buildings and Other Structures. American Society of Civil Engineers (ASCE): Reston, VA, USA, 2010.
  25. JGJ3–2010; Technical Specification for Concrete Structures of Tall Building. Ministry of Housing and Urban-Rural Development of the People’s Republic of China: Beijing, China, 2010. (In Chinese)
  26. GB55002-2021; General Code for Seismic Precaution of Buildings and Municipal Engineering. Ministry of Housing and Urban-Rural Development of the People’s Republic of China: Beijing, China, 2021. (In Chinese)
  27. GB50011-2010; Code for Seismic Design of Buildings. Ministry of Housing and Urban-Rural Development of the People’s Republic of China: Beijing, China, 2010. (In Chinese)
  28. GB50009-2012; Load Code for the Design of Building Structures. Ministry of Housing and Urban-Rural Development of the People’s Republic of China: Beijing, China, 2012. (In Chinese)
  29. GB50010-2010; Code for Design of Concrete Structures. Ministry of Housing and Urban-Rural Development of the People’s Republic of China: Beijing, China, 2010. (In Chinese)
  30. Mander, J.B.; Priestley, M.J.N.; Park, R. Theoretical stress-strain model for confined concrete. J. Struct. Eng. ASCE 1988, 114, 1804–1826. [Google Scholar] [CrossRef] [Green Version]
  31. Hillerborg, A.; Moder, M.; Petersson, P. Analysis of crack formation and crack growth in concrete by means of fracture mechanics and finite elements. Cem. Concr. Res. 1976, 6, 773–782. [Google Scholar] [CrossRef]
  32. Tao, Y.X.; Huang, Y. Numerical investigation on progressive collapse resistance of post-tensioned precast concrete beam-column assemblies under a column-loss scenario. Eng. Struct. 2022, 251, 113528. [Google Scholar] [CrossRef]
  33. Huang, Y.; Tao, Y.X.; Yi, W.J.; Zhou, Y.; Deng, L. Numerical investigation on compressive arch action of prestressed concrete beam-column assemblies against progressive collapse. J. Build. Eng. 2021, 44, 102991. [Google Scholar] [CrossRef]
  34. Computers and Structures, Inc. SAP2000. In Material Stress-Strain Relationship Technical Notes; Computers and Structures, Inc.: Berkeley, CA, USA, 2006. [Google Scholar]
  35. Qu, Z.; Ye, L.P.; Pan, P. Comparative study on methods of selecting earthquake ground motions for nonlinear time history analyses of building structures. China Civ. Eng. J. 2011, 44, 10–21. (In Chinese) [Google Scholar]
  36. Lombardi, L.; Luca, F.D.; Macdonald, J. Design of buildings through Linear Time-History Analysis optimising ground motion selection: A case study for RC-MRFs. Eng. Struct. 2019, 192, 279–295. [Google Scholar] [CrossRef]
  37. Thomsen, J.H.; Wallace, J.W. Displacement-based design of slender reinforced concrete structural walls—Experimental verification. J. Struct. Eng. ASCE 2004, 130, 618–630. [Google Scholar] [CrossRef]
  38. Huang, Y.; Yi, W.J.; Naito, C.J.; Zhang, R. Seismic performance of precast concrete frames with debonded reinforcement. Mater. Struct. 2018, 51, 47. [Google Scholar]
Figure 1. Definition of flexible diaphragm in ASCE 7.
Buildings 13 00376 g001
Figure 2. Plane arrangement of structure with an aspect ratio of 4.
Buildings 13 00376 g002
Figure 3. Stress-strain relationship of materials: (a) Mander-unconfined concrete; (b) Mander-confined concrete; (c) tensile concrete; (d) steel reinforcements.
Buildings 13 00376 g003
Figure 4. Earthquake acceleration response spectrum for frequent earthquake.
Buildings 13 00376 g004
Figure 5. Dimensions and details of specimens: (a) shear wall specimen RW2; (b) frame specimen PCF-1.
Buildings 13 00376 g005aBuildings 13 00376 g005b
Figure 6. Load-displacement curve: (a) shear wall specimen RW2; (b) frame specimen PCF−1.
Buildings 13 00376 g006
Figure 7. Failure mode of specimen RW2: (a) test; (b) FEA.
Buildings 13 00376 g007
Figure 8. (a) The occurrence order of plastic hinges; (b) the relationship between structural displacement with strain of concrete at plastic hinge 1.
Buildings 13 00376 g008
Figure 9. In-plane deformation of diaphragm.
Buildings 13 00376 g009
Figure 10. The effect of flexible diaphragm on seismic performance: (a) fundamental period ratio; (b) elastic top displacement ratio under frequent earthquakes; (c) inelastic top displacement ratio under rare earthquakes; (d) elastic maximum inter-story drift ratio under frequent earthquake; (e) inelastic maximum inter-story drift ratio under rare earthquake; (f) base shear force ratio under frequent earthquake.
Buildings 13 00376 g010aBuildings 13 00376 g010b
Figure 11. Deformation shape of model F3-LB3.33: (a) rigid diaphragm model; (b) flexible diaphragm model.
Buildings 13 00376 g011
Figure 12. Regression analysis of internal force amplification factor.
Buildings 13 00376 g012
Table 1. Design parameters and dimensions of primary components.
ModelStoryAspect RatioSection Dimension of Bottom Column/(mm × mm)Section Dimension of Main Beam/(mm × mm)
F3-LB232400 × 400200 × 500
F3-LB3.3333.33400 × 400200 × 500
F3-LB434400 × 400200 × 500
F6-LB262400 × 400200 × 500
F6-LB3.3363.33400 × 400200 × 500
F6-LB464400 × 400200 × 500
F12-LB2122550 × 550200 × 500
F12-LB3.33123.33550 × 550200 × 500
F12-LB4124550 × 550200 × 500
Table 2. Amplitude scaling factor.
Ground MotionPeak Acceleration/(cm/s2)Under Frequent EarthquakeUnder Rare Earthquake
ELCentro341.700.1020.644
TangShanEW65.940.5313.336
HOLLISTER-2174.550.2011.260
KAR-3143.890.2431.529
Taiwan-0576.750.4562.866
ArtWave-RH1TG045100.000.3502.200
Imperal Valley80.010.4372.750
Taiwan-0231.211.1227.050
ArtWave-RH1TG040100.000.3502.200
Table 3. Calculation results comparisons of response spectrum case between ETABS and PKPM.
ModelMass RatioPeriod RatioElastic Displacement Ratio at Point DBase Shear Force Ratio
F3-LB21.000.981.061.05
F3-LB3.331.000.981.041.05
F3-LB41.000.981.041.05
F6-LB20.991.020.971.03
F6-LB3.331.021.031.001.02
F6-LB41.021.020.951.02
F12-LB21.011.031.021.06
F12-LB3.331.020.981.040.94
F12-LB41.011.040.931.05
Table 4. Assessment of diaphragm type.
ModelRDiaphragm Type
F3-LB20.138R
F3-LB3.330.352SR
F3-LB40.538F
F6-LB20.063R
F6-LB3.330.186R
F6-LB40.351SR
F12-LB20.040R
F12-LB3.330.206R
F12-LB40.376SR
Note: R refers to rigid diaphragm; F represents that the impact of diaphragm deformation should be considered; SR represents that the impact of diaphragm deformation is appropriate to be considered.
Disclaimer/Publisher’s Note: The statements, opinions and data contained in all publications are solely those of the individual author(s) and contributor(s) and not of MDPI and/or the editor(s). MDPI and/or the editor(s) disclaim responsibility for any injury to people or property resulting from any ideas, methods, instructions or products referred to in the content.

