Article

Traditional Passive Design Solutions as a Key Factor for Sustainable Modern Urban Designs in the Hot, Arid Climate of the United Arab Emirates

1
Department of Architecture, College of Architecture, Art and Design, Ajman University, Ajman 00971, United Arab Emirates
2
Department of Electromechanical Engineering, College of Engineering and IT, British University in Dubai, Dubai 999041, United Arab Emirates
*
Author to whom correspondence should be addressed.
Buildings 2022, 12(11), 1811; https://doi.org/10.3390/buildings12111811
Submission received: 9 September 2022 / Revised: 21 October 2022 / Accepted: 22 October 2022 / Published: 28 October 2022
(This article belongs to the Special Issue Research on Vernacular Architecture)

Abstract

:
Sustainable architecture is a key approach for creating sustainable cities and reducing the impact of climate change. In hot, arid regions, the passive design traditional architecture is known for its ability to provide comfortable indoor environments and outdoor shaded areas, in contrast to the use of energy-intensive air conditioners in a great deal of modern architecture. Thus, this research used a qualitative methodology based on ENVI-met software to study, investigate, and compare the thermal performance of two urban fabrics as case studies (traditional and modern districts) in the hot, arid climate of the United Arab Emirates. The thermal performance of the old urban districts was better than the new ones, with a lower maximum potential air temperature and an improvement in the level of thermal comfort, measured by a predicted mean vote. Moreover, it was found that enhancing the shade in the outdoor open areas in the modern district, mimicking the traditional passive design solutions, resulted in lower air temperature and PMVs. This research is expected to be one step among many towards creating sustainable, innovative modern architecture.

Graphical Abstract

1. Introduction and Literature Review

Climate change is accelerating due to greenhouse gases produced mainly by the high energy consumption of non-renewable resources, which damages the environment. Increased urban air temperatures constitute a significant problem made worse by climate change, where urban heat islands need extra cooling to maintain comfortable indoor temperatures, which are typically achieved by air conditioning [1]. Active cooling systems produce a significant quantity of greenhouse emissions [2] because of the continuing reliance on fossil fuels for energy systems and power generation, which exacerbates climate change [1]. Thus, the conflict between human and spatial environments and the imbalances of regional development have grown more pronounced. Various nations have already begun to discuss spatial planning, to develop and implement plans, and to collect experience to shape how spatial planning can contribute to achieving the sustainable development goals. These goals include overall social and economic development that can manage both climate change and energy deficiencies and promote citizens’ physical and mental health [3]. As 16–50% of energy is consumed by buildings for indoor environmental control [4], and since these indoor environmental conditions relate to the occupants’ mental well-being, the situation is influenced by social behavior in addition to climatic factors [5]. The Predicted Mean Vote (PMV) is used to quantify thermal comfort since it is connected to the heat-balance equilibrium of the human body [6]. Thus, sustainable architecture and urban planning can contribute to creating sustainable built environments that provide good thermal conditions with less energy consumption [7]. Tawayha et al. [8], Salameh et al. [9], Biqaraz et al. [10], and Drach and Karam-Filho [11] mentioned the capability of traditional passive design concepts to improve the thermal conditions in traditional buildings with less energy intake; they noted that contemporary buildings require a huge amount of electrical energy to facilitate and control the interior comfort conditions, resulting in high maintenance and operational costs, as well as the significant carbon emissions from generating electricity. Besides that, contemporary architectural trends have led to the destruction of traditional urban uniqueness and identity and have overlooked the conventional passive design solutions of historical buildings that were able to productively interface with the climate [8,10]. As current architecture is focused on fulfilling the needs of the users and reducing construction costs within city rules regarding land use and building setbacks, developers have largely ignored the traditional passive and sustainable concepts in architecture and urban design despite the fact that these concepts directly address the local insolation, climate zone, social requirements, cultural standards, and other needs of the location [9]. Moreover, these passive design solutions can offer a good orientation towards new ecofriendly approaches to architectural and urban strategies [8,10,12,13].
Traditional passive solutions increase shading ranges and cool the spaces in hot areas. Lin, Matzarakis, and Hwang [14] stated that the street direction, orientation, and the height–width ratio are the main factors for evaluating shading levels and intensities; moreover, the orientations of buildings and streets affect their access to direct sunlight according to the sun’s daily and annual cycles and determines whether a site is protected or not. Therefore, while creating shelters, the location, direction, time, and day should be considered. Many other studies investigating these passive concepts in the vernacular and traditional architecture highlight their capacity for improving thermal conditions. Some examples include courtyards, vegetation, shading devices, compressed urban design, orientation, and wind catchers, as in Table 1.

1.1. Traditional and Contemporary Urban and Architectural Design Concepts

The spatial planning framework offers more detailed instructions on how to react to land use change requests. In addition, it promotes “urban efficiency” and “sustainable urban environments” through sustainability concerns such as urban extension, sustainable environmental operations, and forming sustainable housing environments [20]. Thus, the spatial planning framework can direct architecture and urban planning toward urban sustainability. As the traditional form of spatial planning operated on both the architectural and urban levels, it helped to create sustainable communities through passive design solutions. To identify the significant effects of passive design concepts in traditional architecture and urban designs, various researchers have compared old and traditional structures with modern ones, often observing the superiority of the traditional and vernacular passive design concepts in improving thermal conditions both indoors and outdoors. Fernandes et al. [12] emphasized that passive design features can enhance the internal thermal conditions by improving temperatures without much maintenance, better respect social and cultural standards, can be implemented using locally accessible resources, and, finally, that these solutions can contribute to climate-responsive strategies for regulating indoor thermal conditions while reducing both energy consumption and greenhouse gas emissions. Despite all these benefits, as Nia and Rahbarianyazd [19] mention, modern architecture largely disregards old cultural values and their expression in traditional designs. Thus, Al Tawayha, Bragança, and Mateus [13] and Salameh et al. [9] added that the compact urban layout in the traditional areas—mostly comprising closely packed courtyard buildings with narrow, winding streets and a high land coverage ratio—improved thermal comfort outdoors by increasing shade around the buildings and in the streets, in contrast to the broad streets and detached buildings of today, with their correspondingly low land coverage ratios. Biqaraz et al. [10] agree that the traditional approaches offer excellent thermal efficiency as well as a number of qualities that have a high potential to improve thermal conditions in contemporary areas. Similarly, Bolouhari, Barbera, and Etessam [21] stated that traditional architecture is one of the most valuable sources of climate values in building design, as it offers lessons that can be applied to modern architecture with respect to, for example, orientation, dense textures, organic and covered pathways, windsurfing, qanats, building form, excavation into the earth, introversion, central courtyards, etc. In another study, Meutia, Sahputra, and Irwansyah [22] mentioned how the classic architectural concepts have evolved to fit the current environment. The purpose of their study was to provide a different approach to preserving Acehnese homes that can be used as a model for modern adaptable housing in terms of both structural and architectural features. Moreover, Du, Bokel, and van den Dobbelsteen [18] confirmed the capability of traditional houses to provide better thermal performance, observing how various passive cooling methodologies were incorporated into the vernacular buildings’ layouts to improve their indoor thermal conditions in the summertime. They mentioned that contemporary projects do not offer sufficient summer thermal conditions for the inhabitants, as they disregard the needs imposed by the local climate. Hailu, Gelan, and Girma [23] stated that the adaptive comfort standard’s 80 per cent acceptability band was met by traditional homes, which were regulated by the traditional building methods and materials that corresponded to their microclimates. For example, the passive design sky courtyards (see Gamero-Salinas et al. [24]) are two-story vertical breezeways, with a mix of water and vegetation characteristics, offering a more pleasant environment than balconies due to the dynamic air movement with the stack effect and increased sun shading, despite the decreased air velocity. According to Dou [25], the increased heat stress brought about by the rise in global temperatures can be reduced by expanding vegetation cover and enhancing shade through changes in urban planning. Moreover, Zou and Zhang [26] observe that the passive natural cooling effects contributing to outdoor thermal comfort depend on the tree coverage, the natural formation and density of grasses, the types of water elements, the textures and colors of materials, and the extent of shading systems. These traditional solutions are, according to Chi and Mak [27], a key factor for creating “livable cities”, fostering health and wellbeing, adapting to climate changes, and establishing a peaceful environment for human habitation.

1.2. The Thermal Performance of Contemporary Modern Architecture and Urban Designs in Hot, Arid Climates

Spatial planning systems can promote sustainable development as an objective and as an action plan [28]. This ability is of particular importance because it is a crucial instrument for achieving sustainable development and combating climate change, especially in the context of highlighting smart cities, healthy cities, green justice, urban revitalization, and emerging challenges [29]. Thus, it is important to consider architecture and urban design as a part of the spatial planning in any sustainability approach, as buildings and their urban forms are responsible for a major fraction of total energy consumption. Hausladen, Liedl, and De Saldanha [30] observe that optimal thermal performance in contemporary buildings and neighborhoods requires a great deal of electrical support, especially in hot, dry regions. For instance, buildings in the United Arab Emirates consume 70 percent of the country’s total energy supply [31]. According to Afshari, Nikolopoulou, and Martin [32], the UAE’s air-conditioning systems account for around 57.5 percent of the electricity used to cool buildings. According to Katanbafnasab [33], Al-Masri and Abu-Hijleh [34], and Beriatos [35], such high energy dependency is dangerous since it degrades the climate and the environment. According to Cantón et al. [36], sustainable architecture could be designed to respond to local climates, using techniques that suit the climate, urban layout, and location instead of focusing only on currently intriguing trends and styles [37].
As a result of modern air conditioning, the scale of urban heat islands (UHI), which are higher-temperature bubbles centered in urban environments, has expanded. The mixture of demographics and activities in metropolitan areas, in addition to the neighborhood layouts and designs of contemporary locations, all contribute to this impact [38]. According to Salvati, Roura, and Cecere [39], the UHI in modern districts increases buildings’ energy use and hastens climate change. In addition, according to Bueno, Roth, Norford, and Li [40], UHI reduce convective heat dissipation in metropolitan districts, especially in newer ones. Numerous solutions can be implemented in this scenario, and a variety of alternatives, including passive design solutions, may be included in planning contemporary urban neighborhoods. However, despite extensive research on conventional passive design approaches that might aid in developing sustainable modern architecture and urban areas, such as [13,15,16,17,18,19,20,22,23,41], no comprehensive study has yet concentrated on the hot, arid climate of the UAE or established a firm foundation in this area. Thus, this study aims to compare the old and new urban districts in the UAE (as an example of urban settings in a hot, arid climate) in order to assess traditional architecture’s potential to improve the thermal conditions in hot areas. The study also seeks to extract useful traditional urban design ideas for contemporary designs. Using the ENVI-met software, a qualitative methodology was applied in the study. In order to reduce climate change and the impact of UHI, it is crucial to comprehend past architectural experiences and incorporate helpful, climate-responsive strategies into current architecture and urban designs.

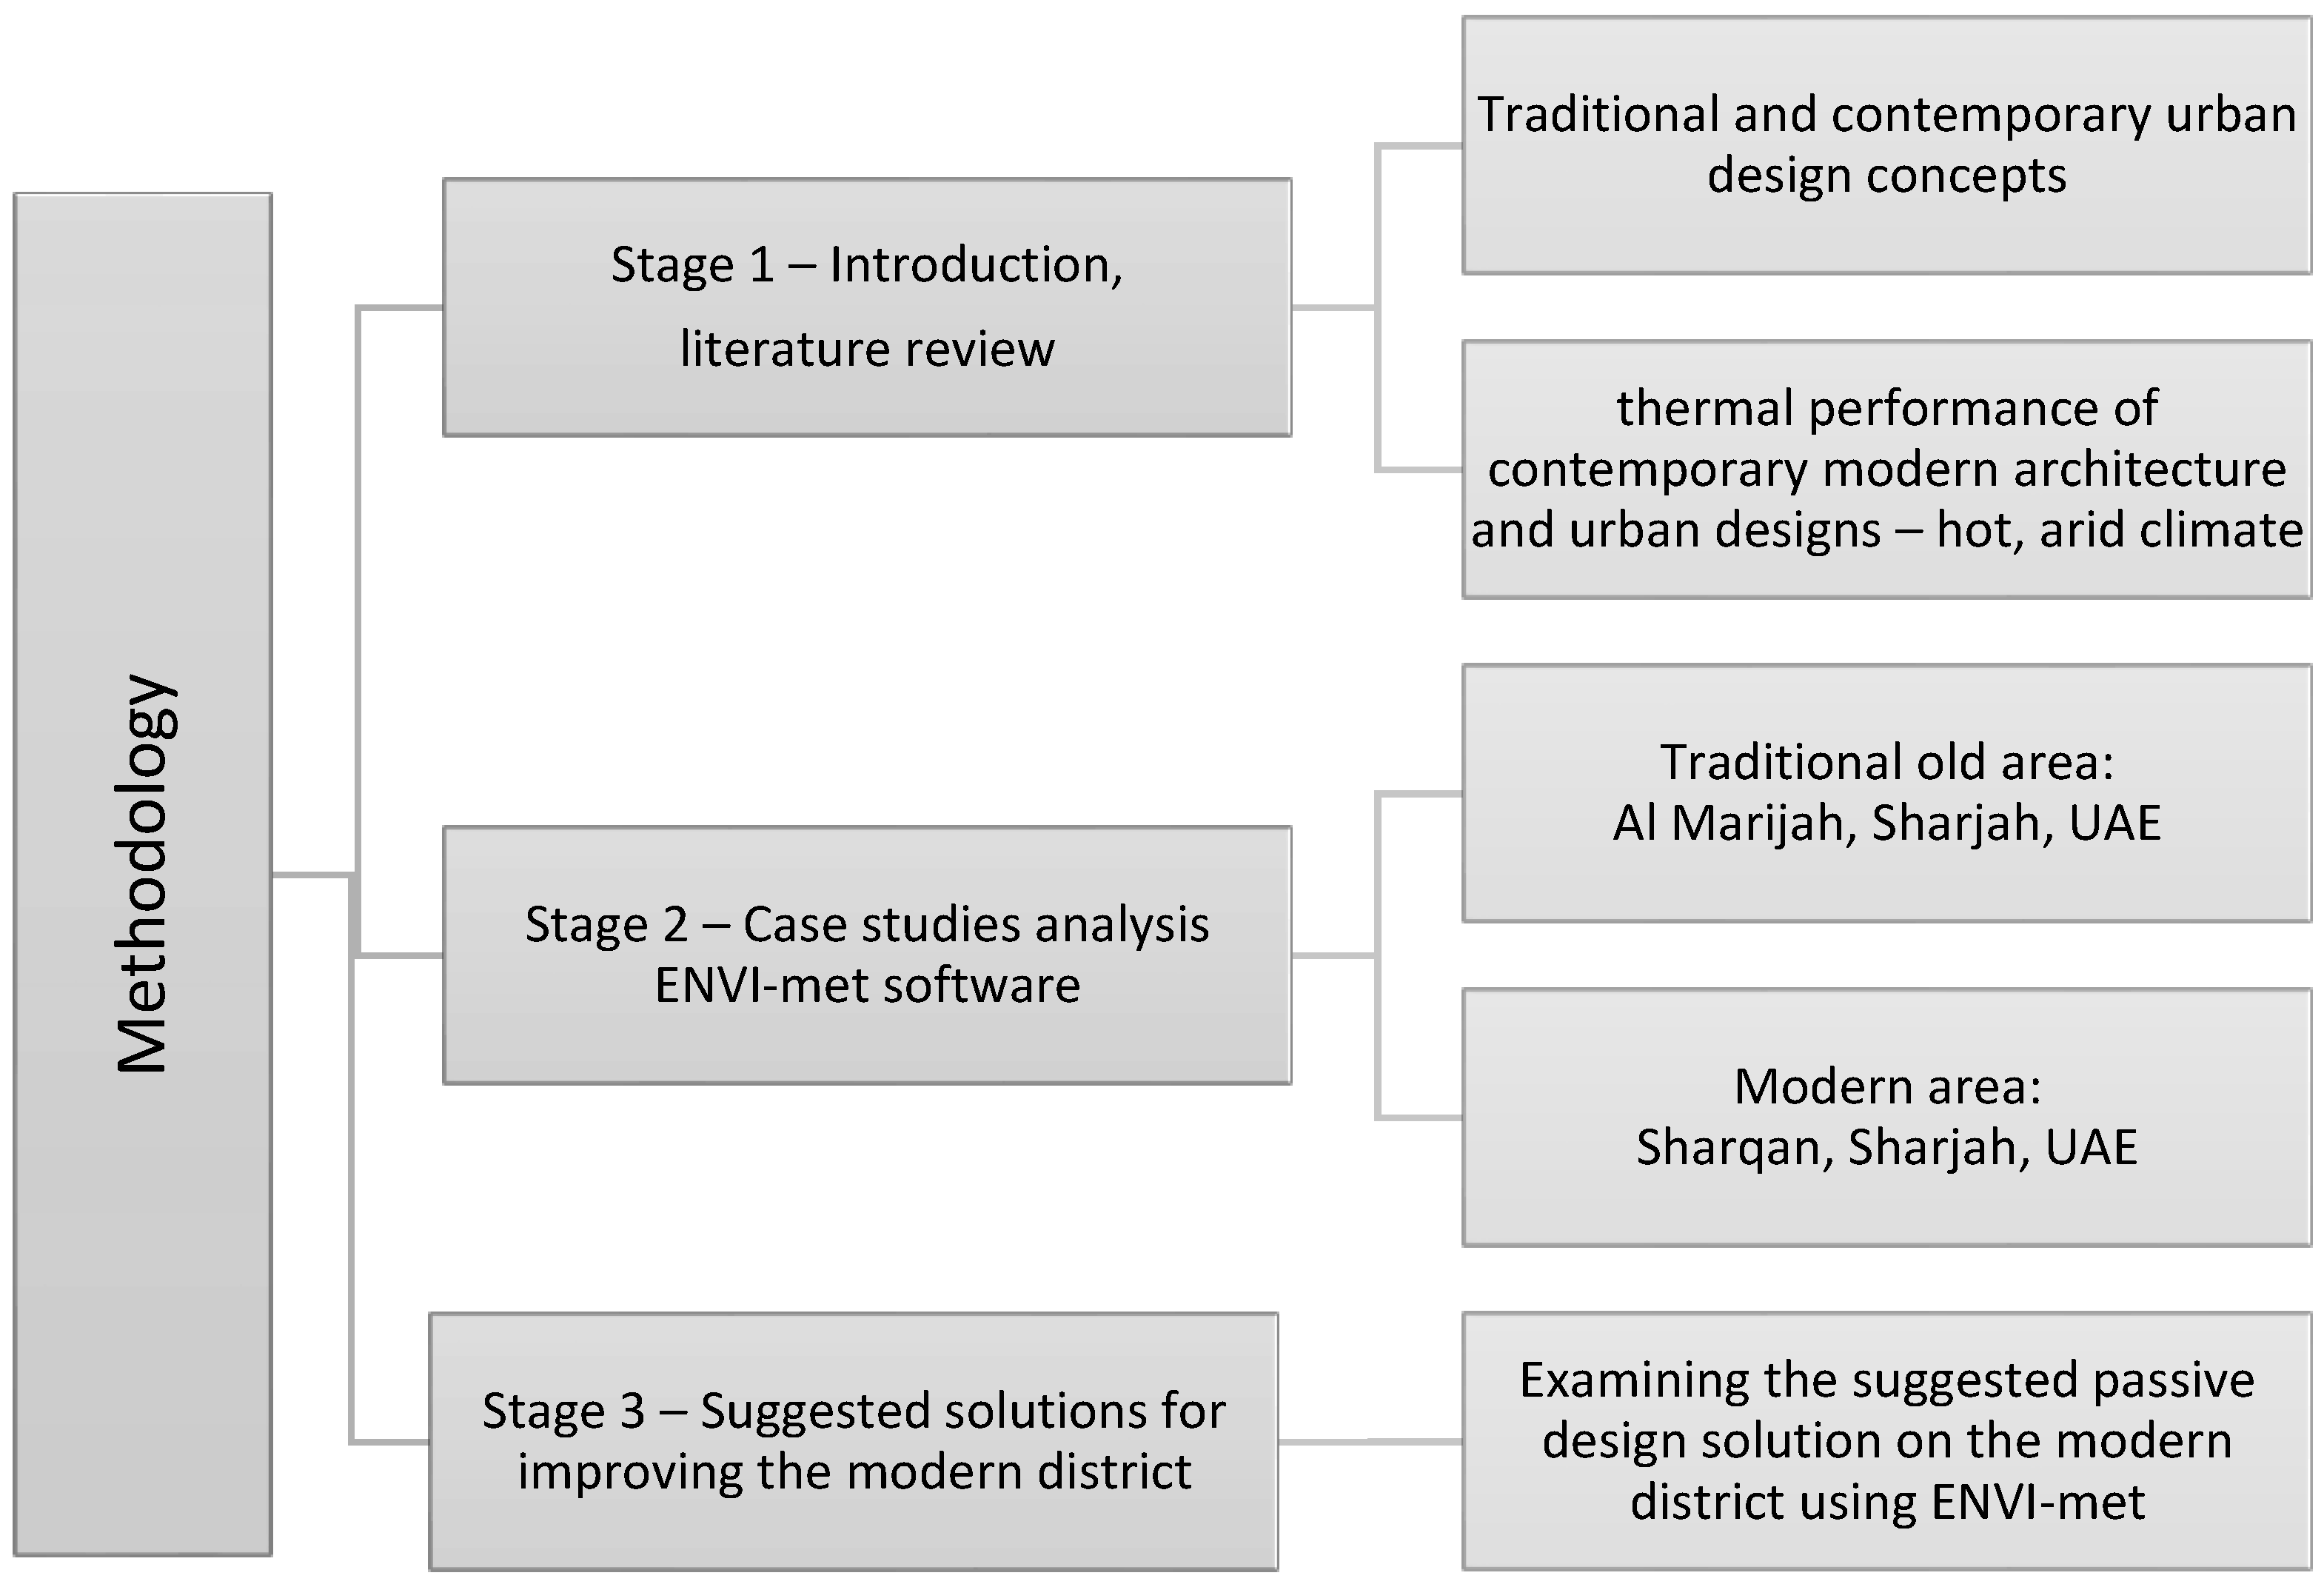
2. Research Methodology
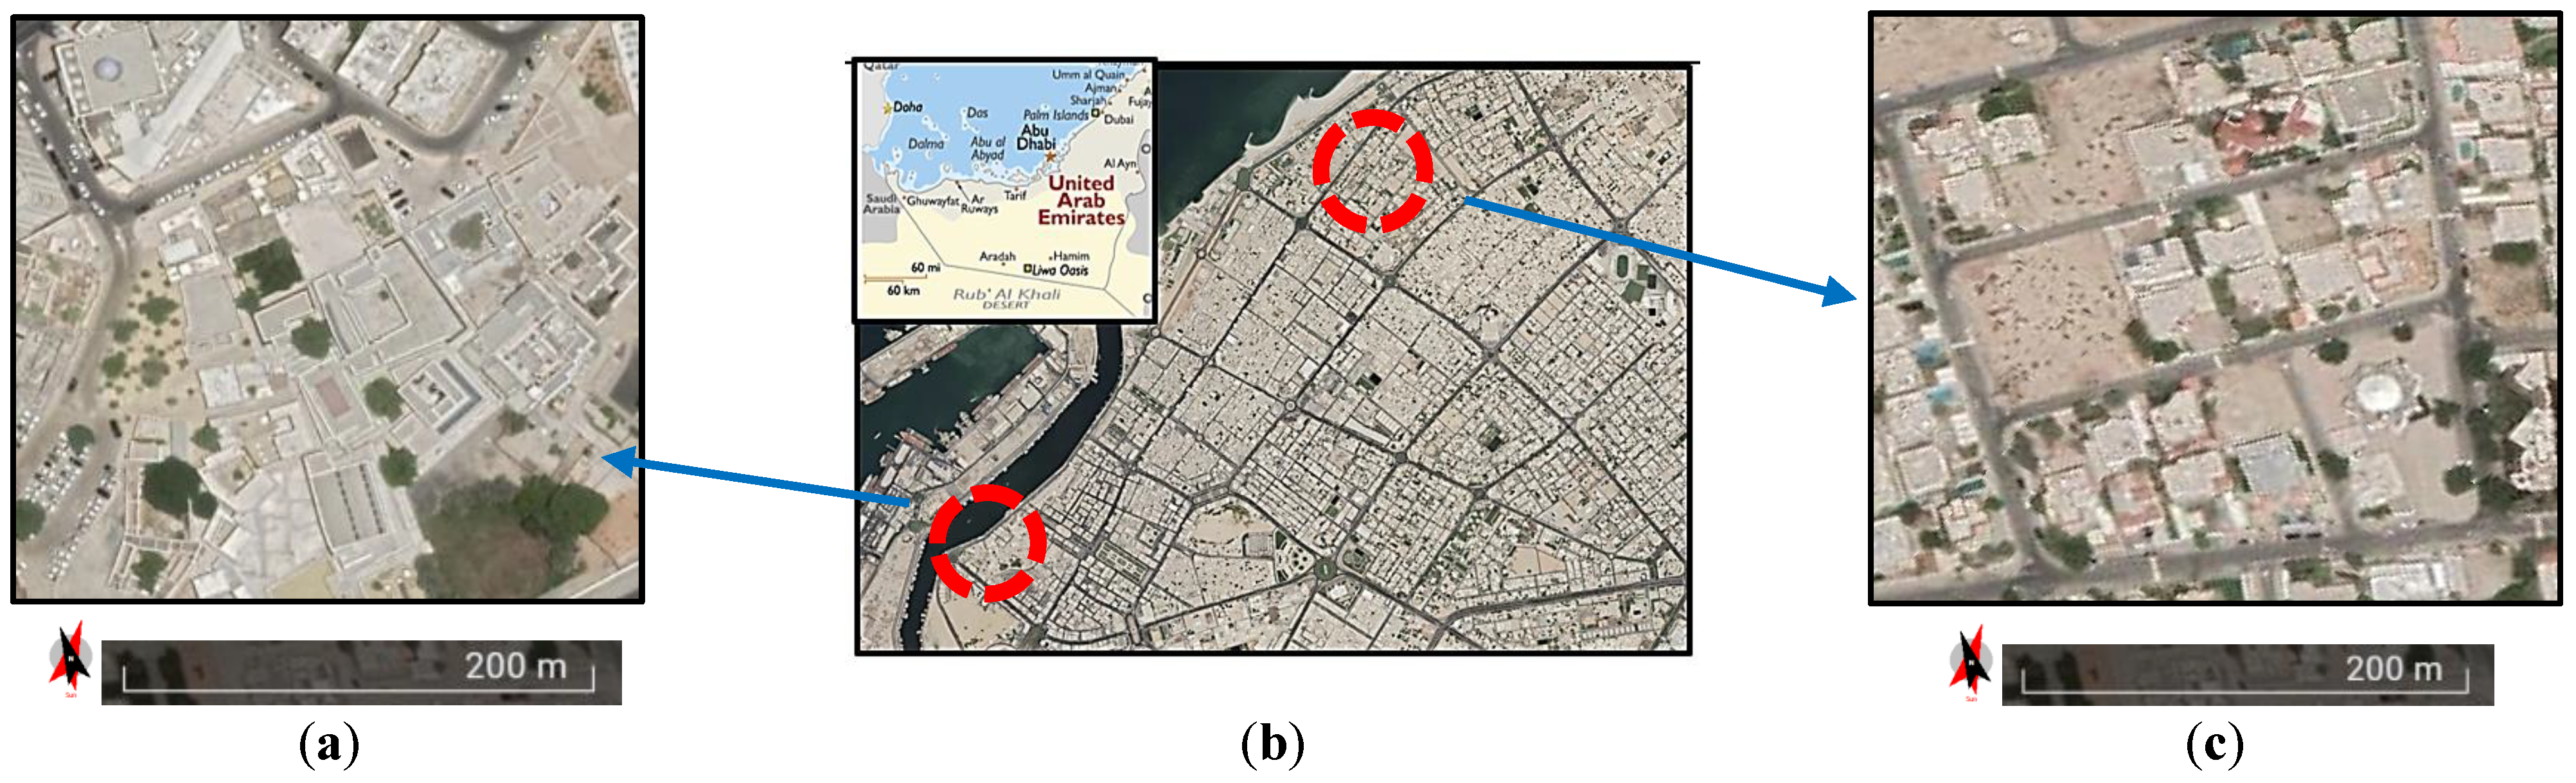
This study used a qualitative methodology and ENVI-met software to study, investigate, and compare the thermal performance between two urban fabrics (traditional vs. modern districts) as case studies in the hot, arid climate of the Emirate of Sharjah (Figure 1). The traditional case study was a district in Al Marijah in the heart of the Sharjah heritage area, and the modern district was in the Sharqan area. The study’s main intention is to reveal traditional passive strategies in the old district that can help towards improving thermal conditions in the modern districts.

2.1. Study Area

This study compares and investigates the thermal conditions through two case studies, namely, old and new urban districts in Sharjah, UAE (Figure 2a–c), as a model for a hot, arid climate area to determine some traditional passive design solutions that can be applied to improve the thermal conditions in modern areas and with lower energy consumption. The traditional case study is a district in Al Marijah, in the heart of the Sharjah heritage area; the modern case study is in the Sharqan area.
The UAE receives very little rain fall and has a hot, arid climate with an air temperature ranging between an average maximum of around 41 °C in August and an average minimum of 24 °C in January (Figure 3a). The wind is predominantly from the northwest (Figure 3b).

2.1.1. Sharqan District—Modern Case Study

Sharqan district was taken as a case of a modern neighborhood. It features straight, nearly perpendicular streets that form a modern grid pattern [46]. Municipal standards prescribe land use and cause considerable building setbacks regarding the construction and development of its streets (Figure 4).

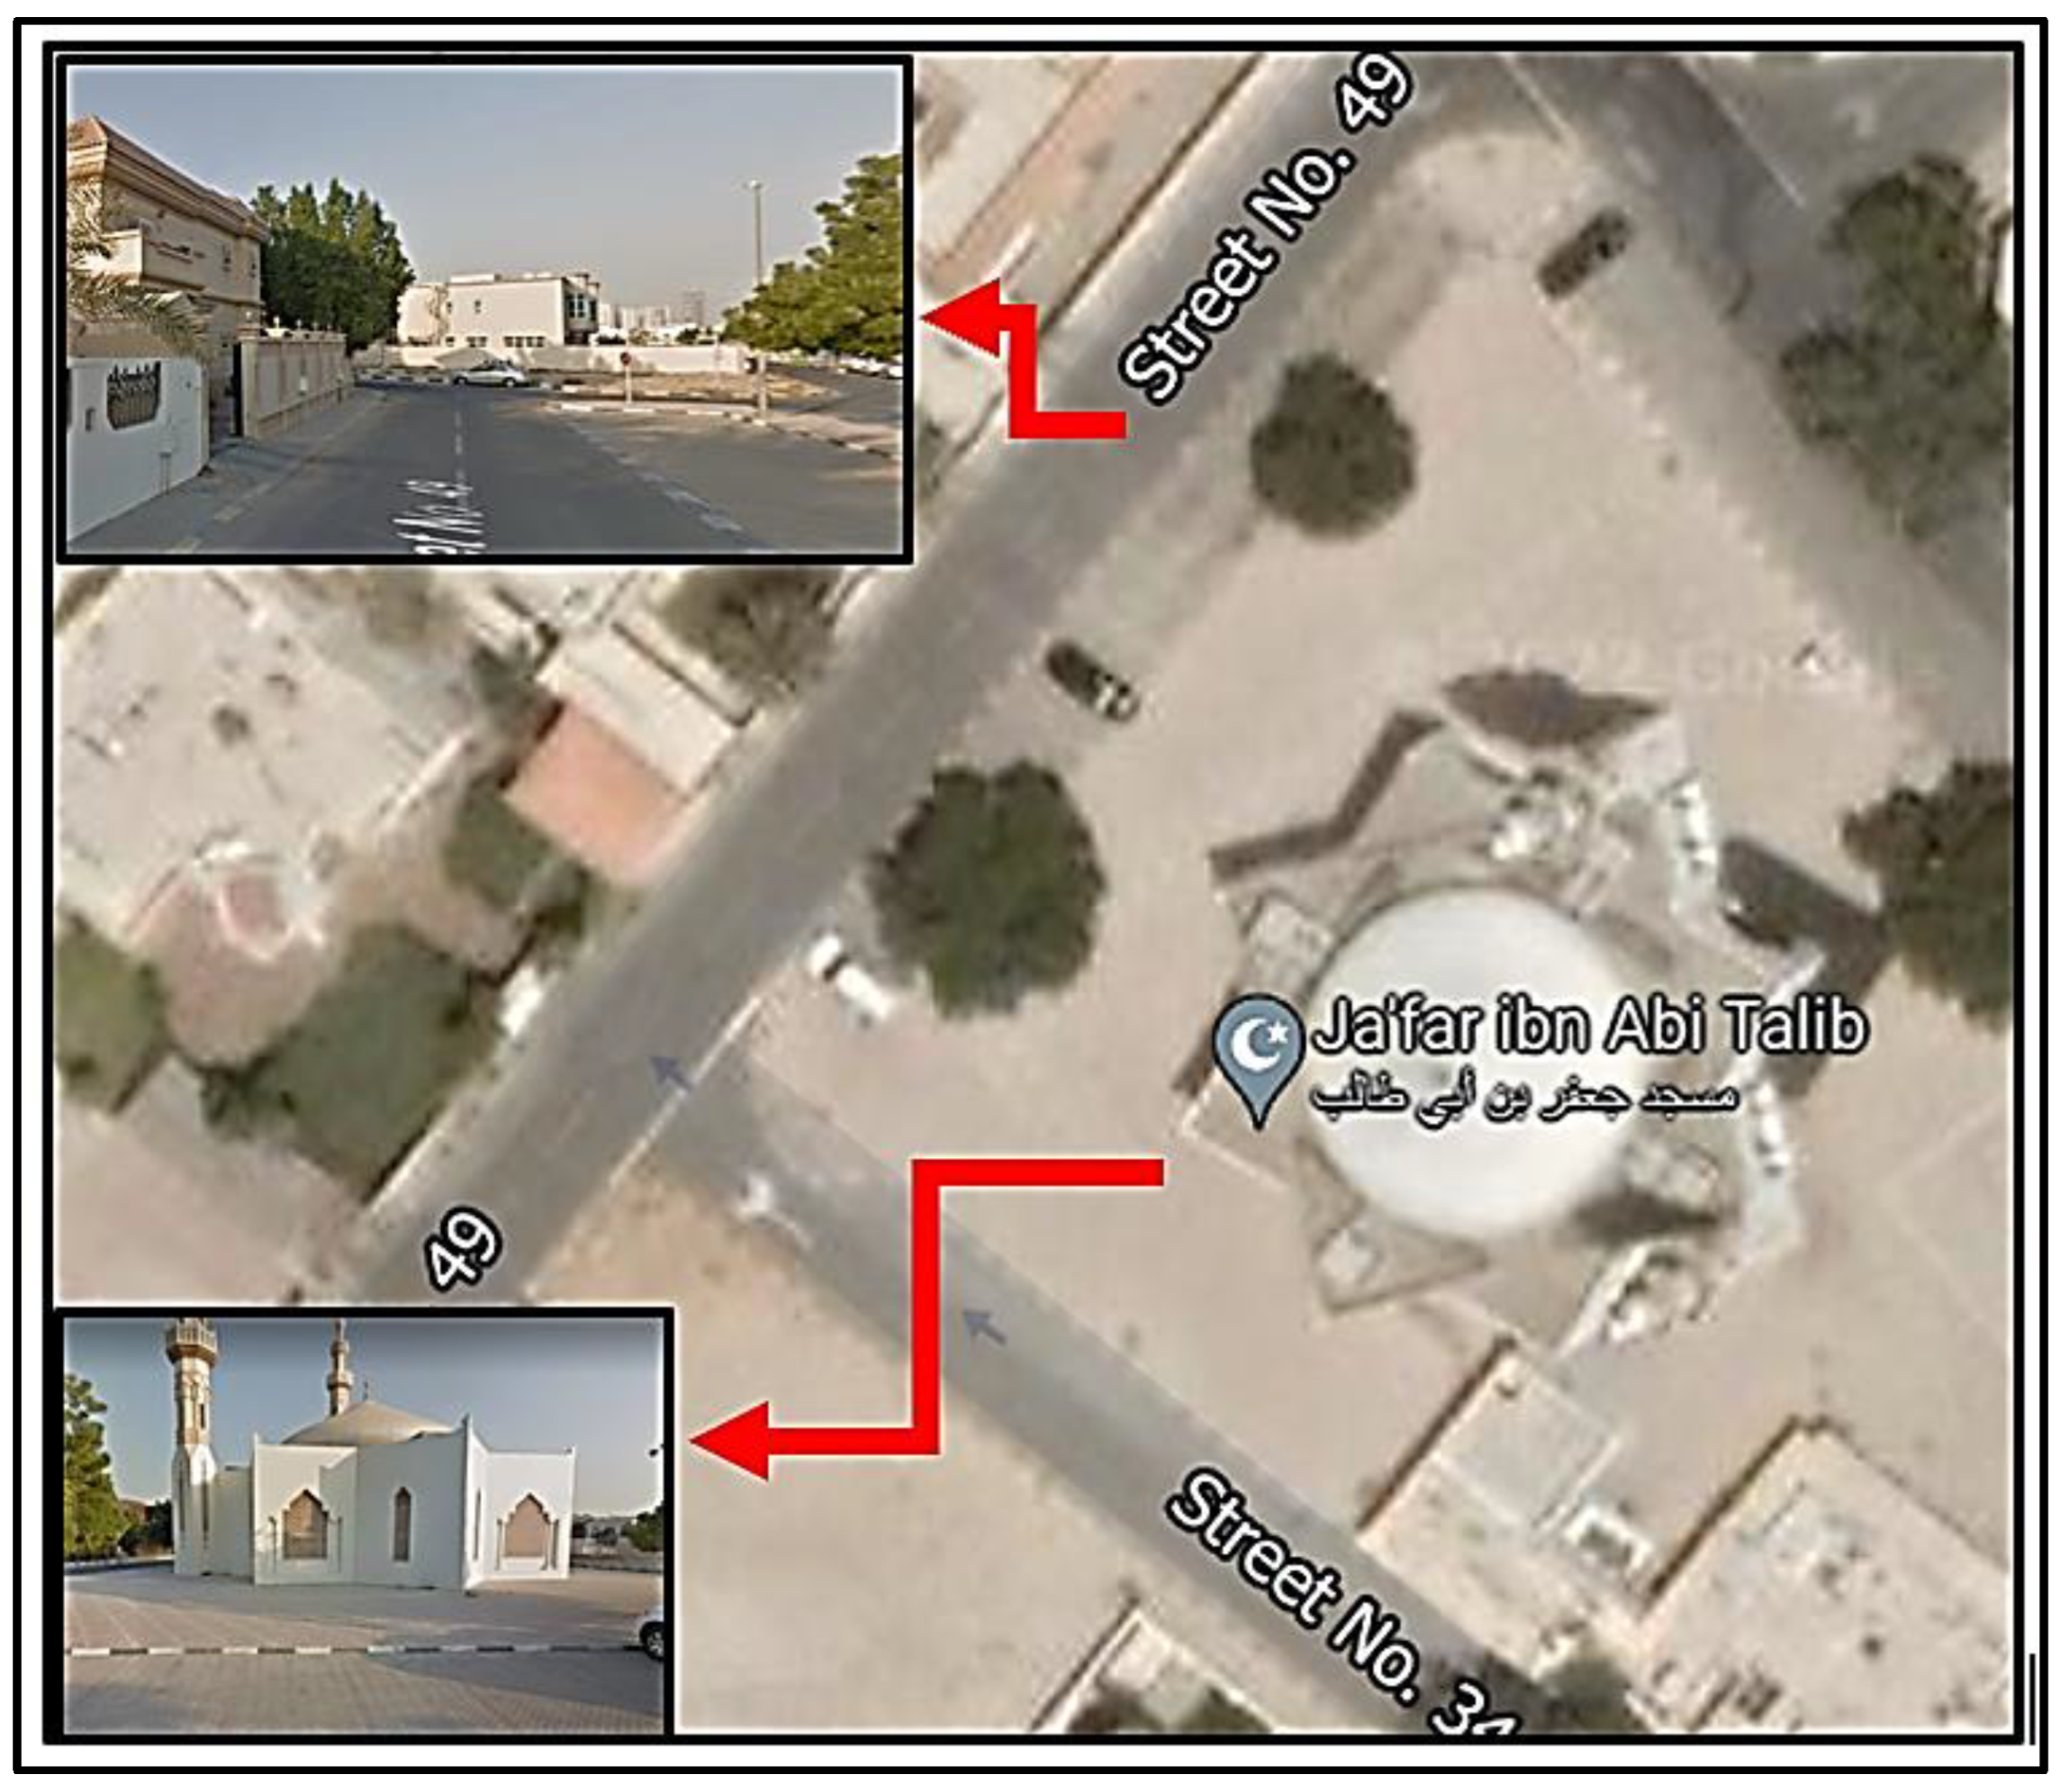
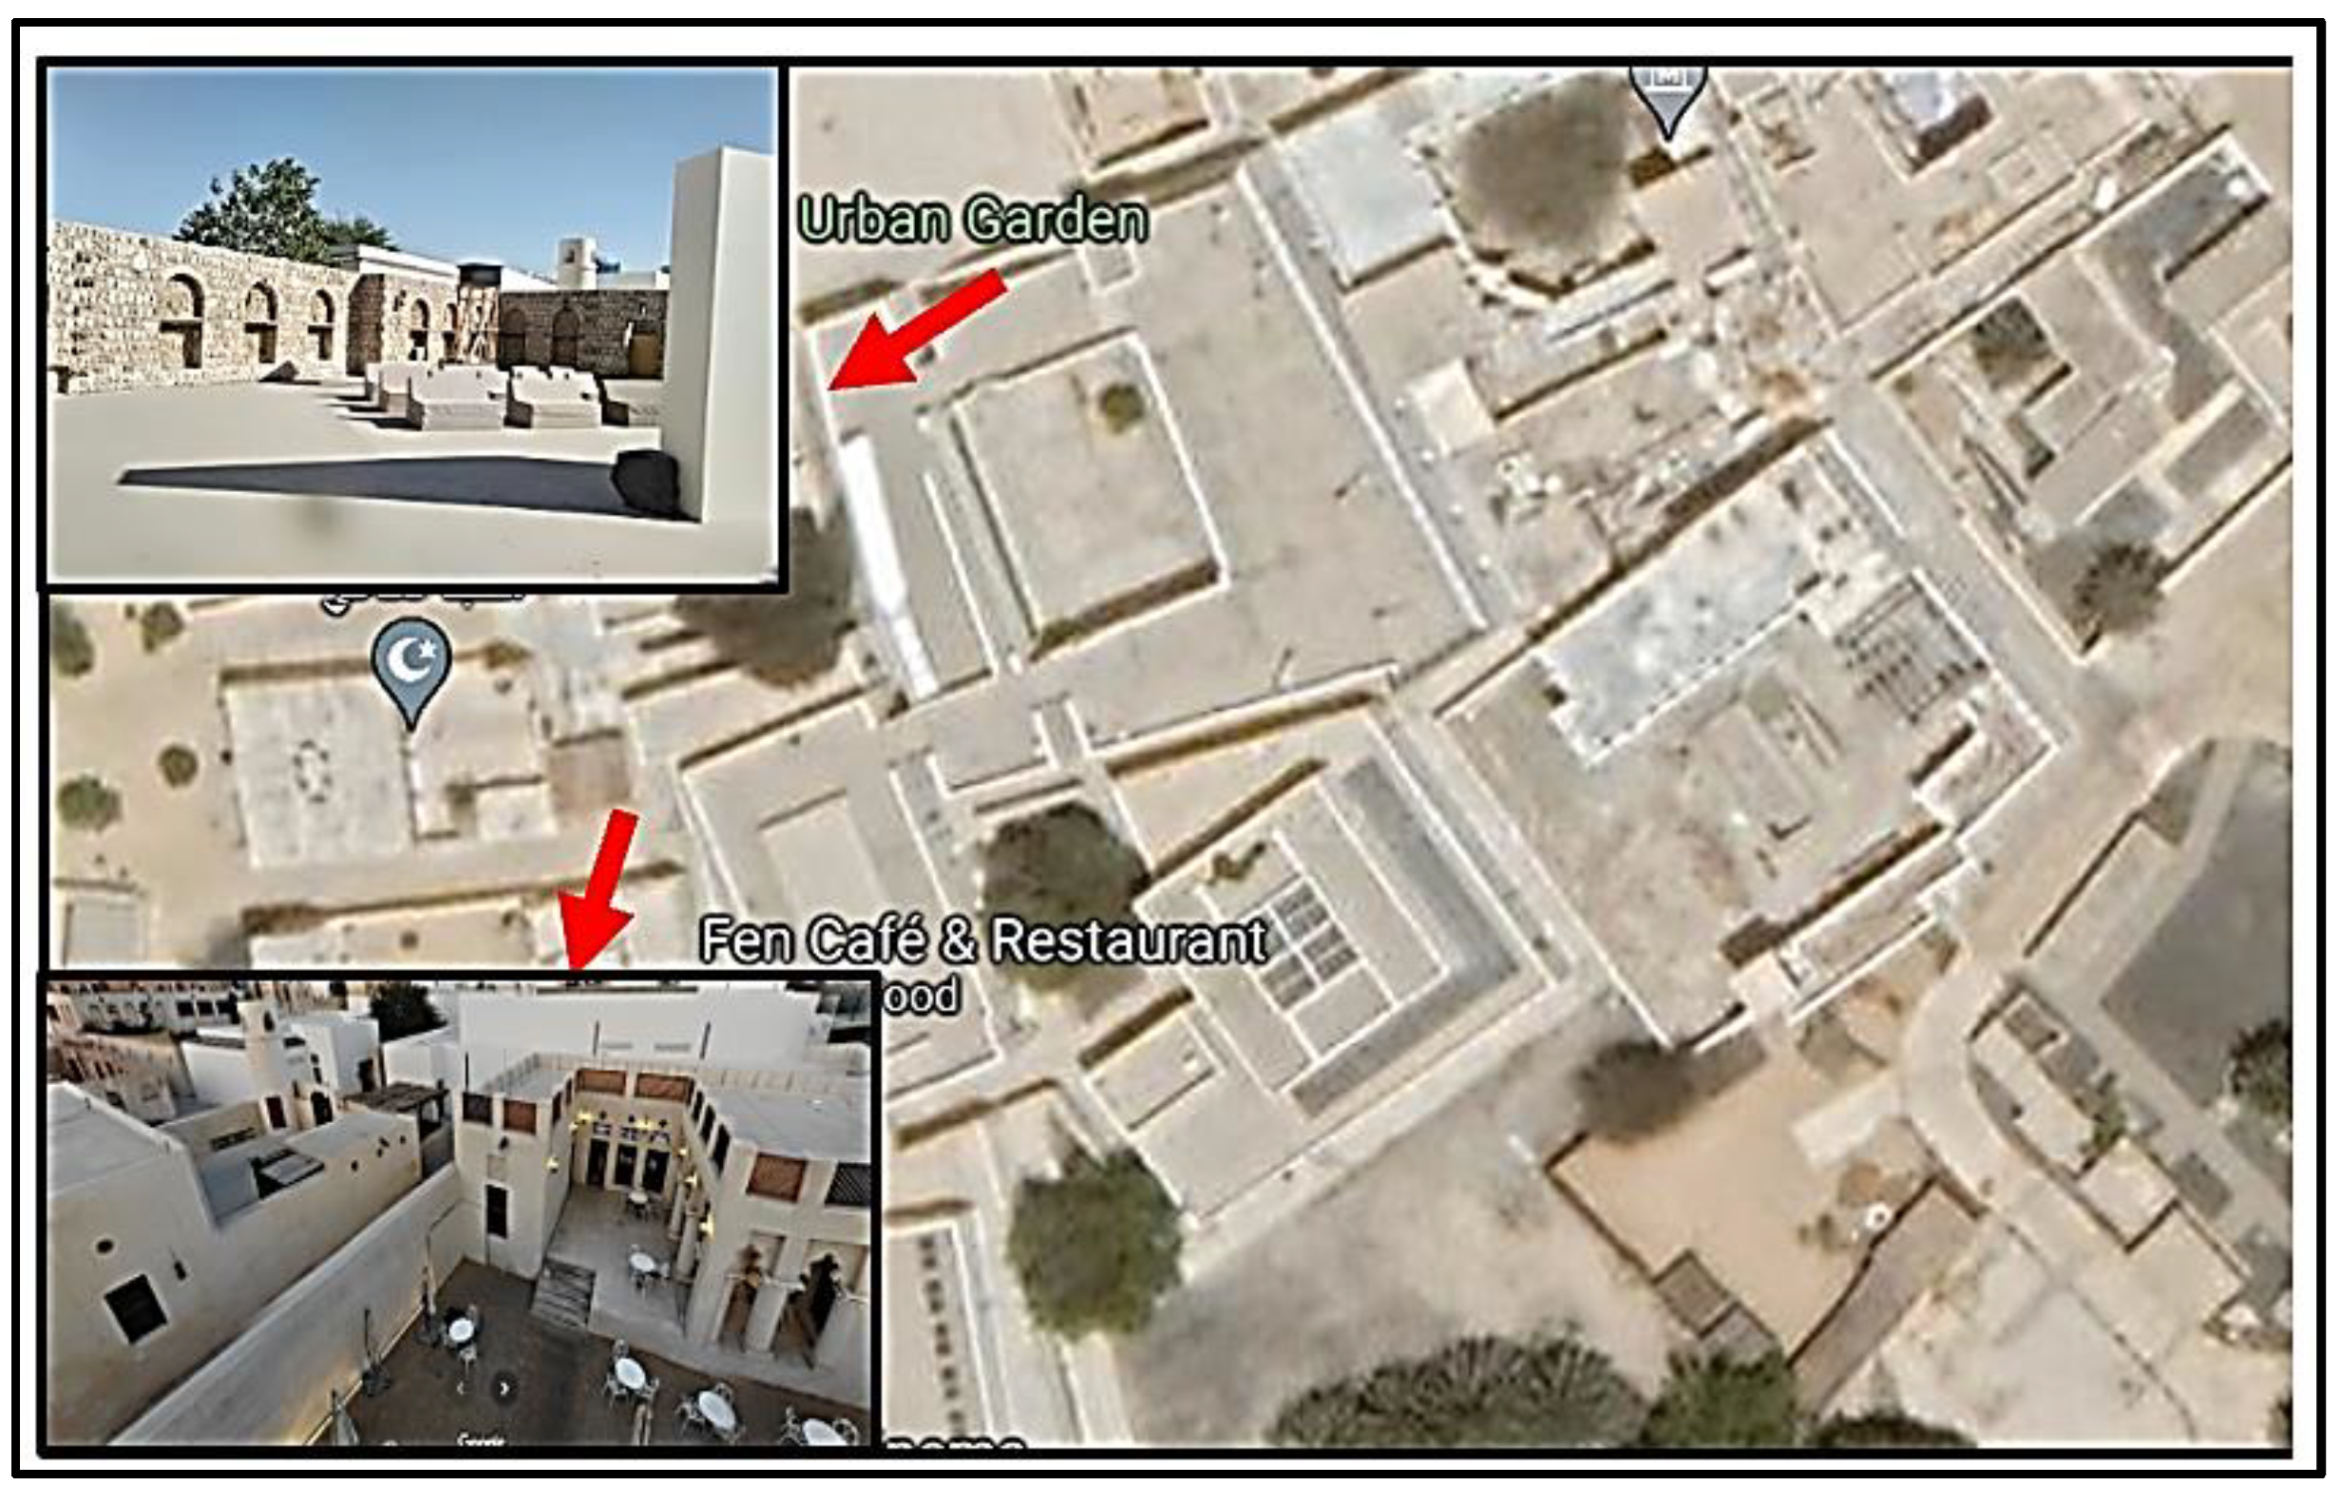
2.1.2. Al Marijah District—Traditional Case Study

Al Marijah’s old district provides a traditional case study (Figure 5). This area, built in the early 1800s, is the heart and the oldest part of Sharjah. It was constructed next to the corniche. It has an old fort, a traditional school, and many historic houses. This traditional area is seen as the main historic district of Sharjah and was built in a traditional layout with various passive design concepts such as winding streets and private and public courtyards, using local materials for construction.

2.2. Simulation of the Microclimate

ENVI-met software can simulate the microclimate conditions of urban districts with high accuracy in a three-dimensional micrometeorological space [49,50,51]. It can model outdoor microclimate parameters such as wind speed, air temperature, humidity, etc. [52].
This study used ENVI-met software to compare the thermal conditions between the new and the old areas in Sharjah including:
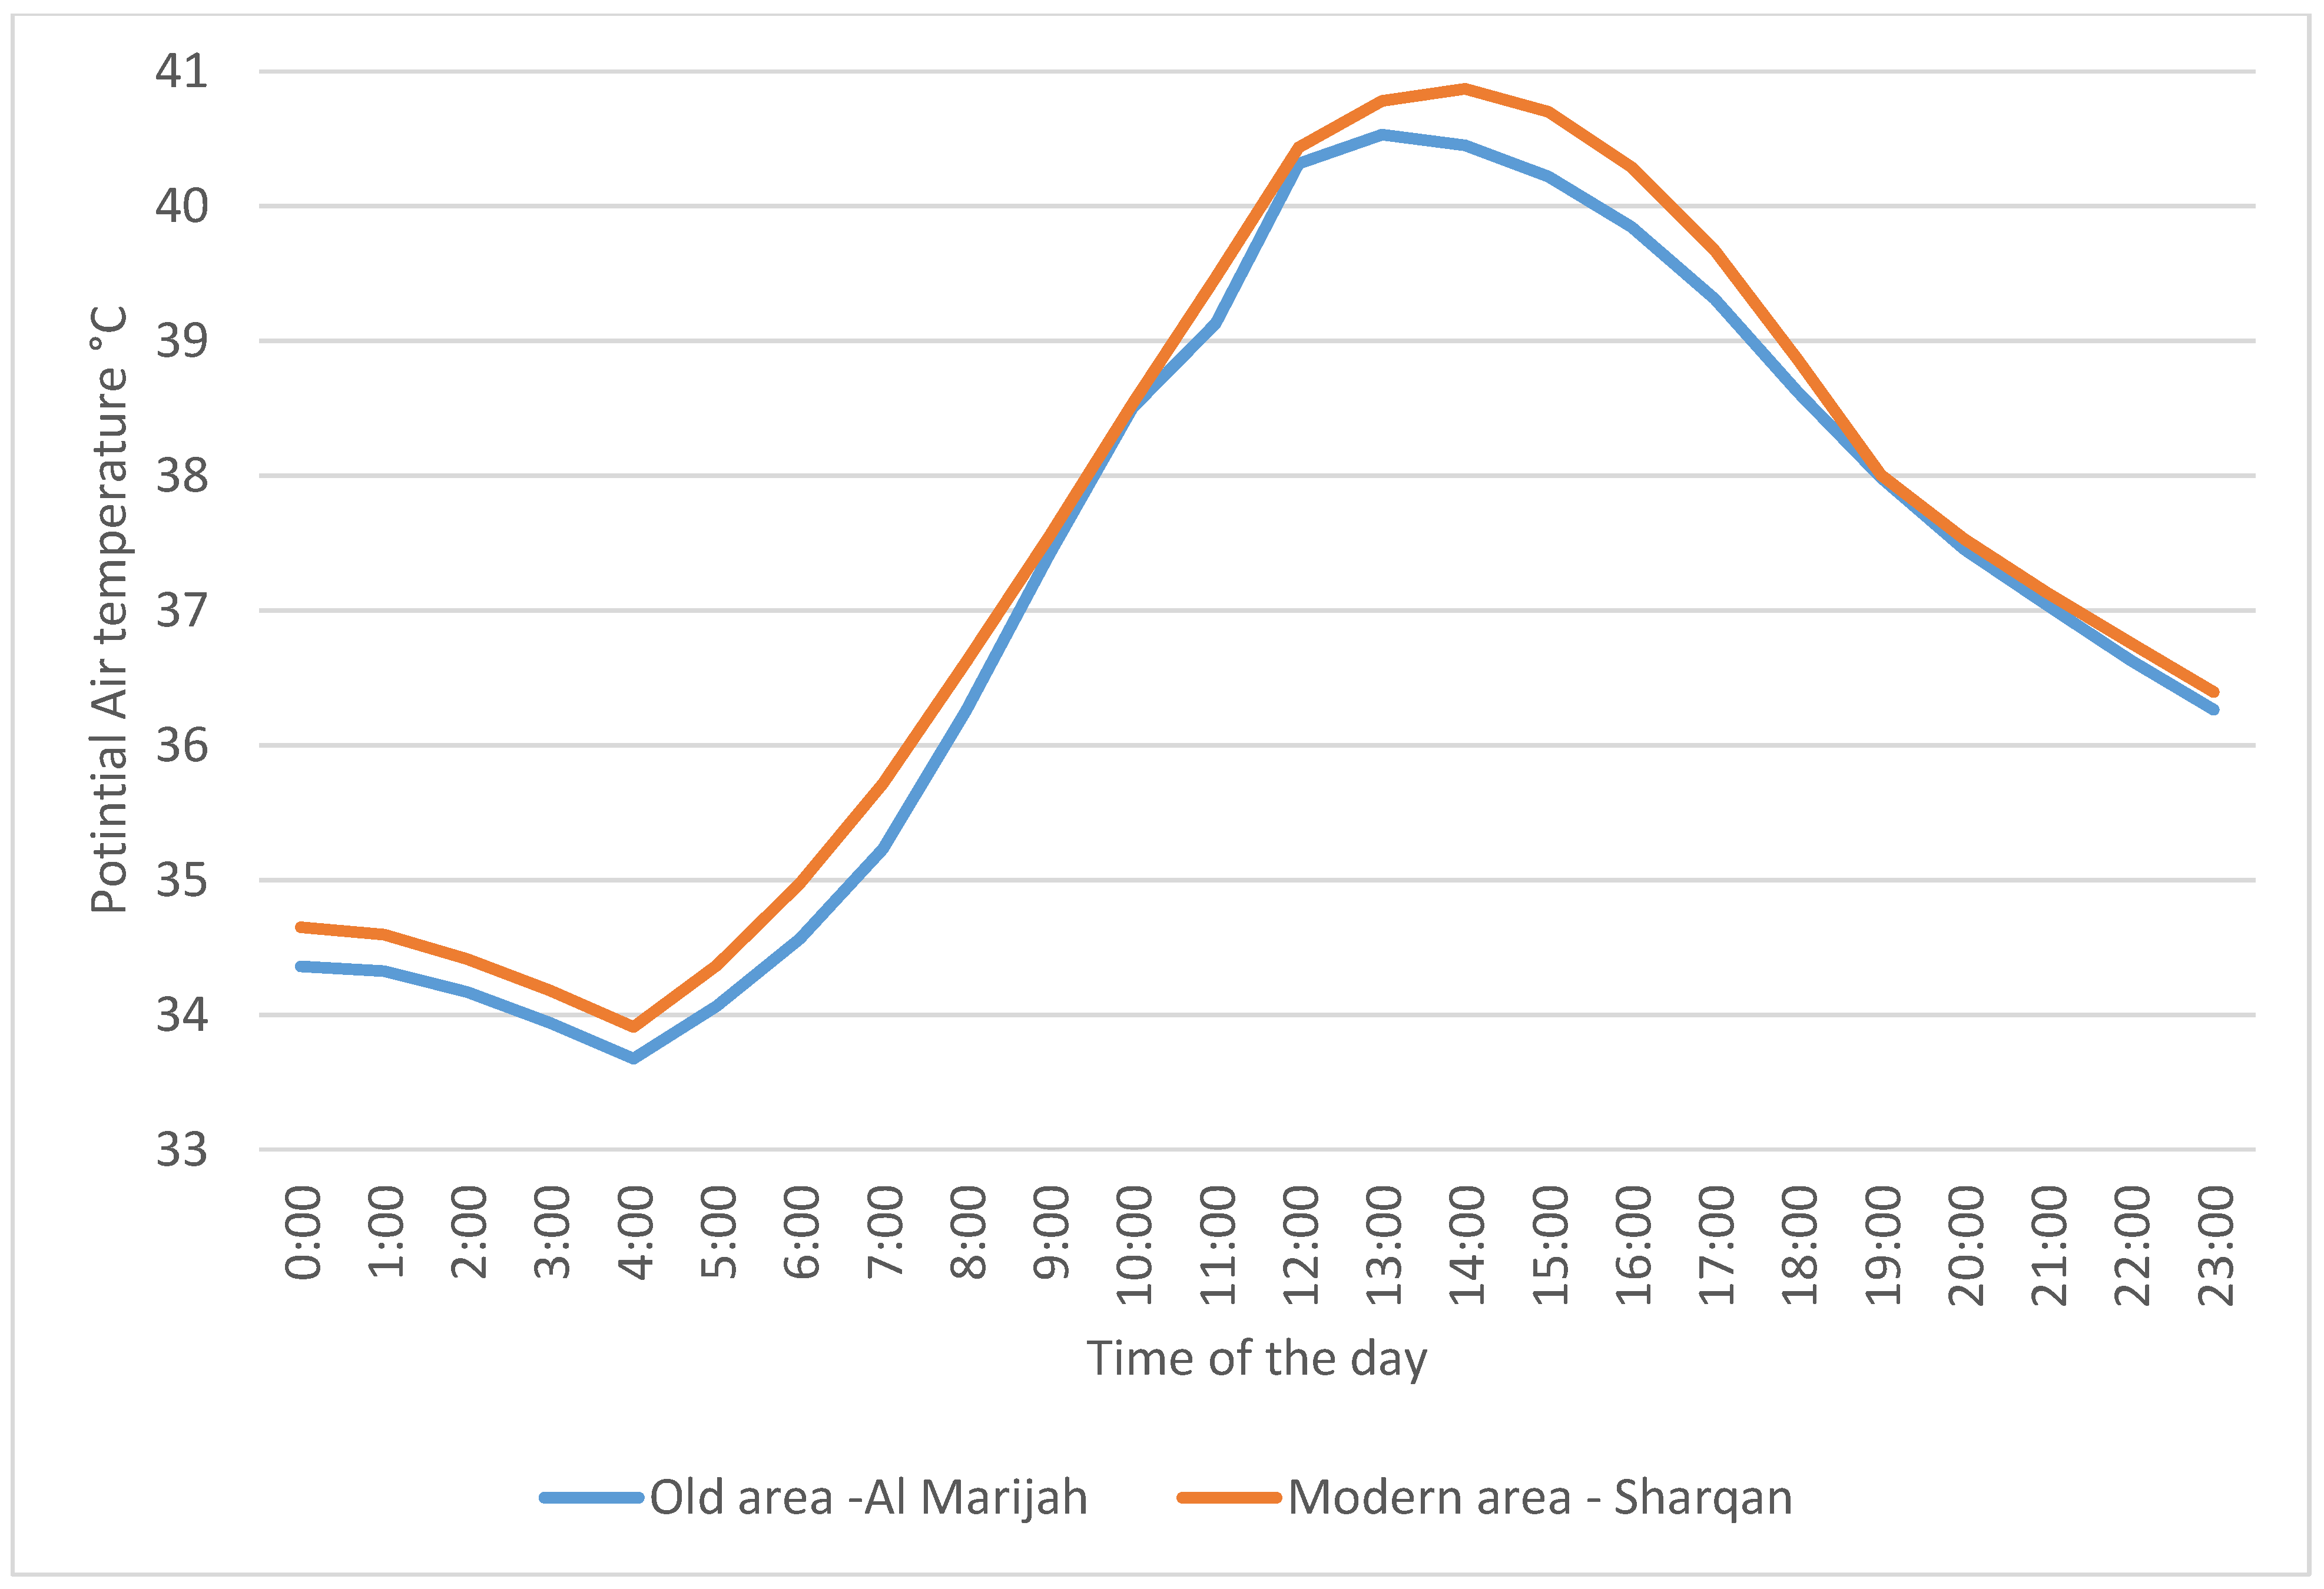
  • The outdoor potential air temperature in both urban layouts of the case studies.
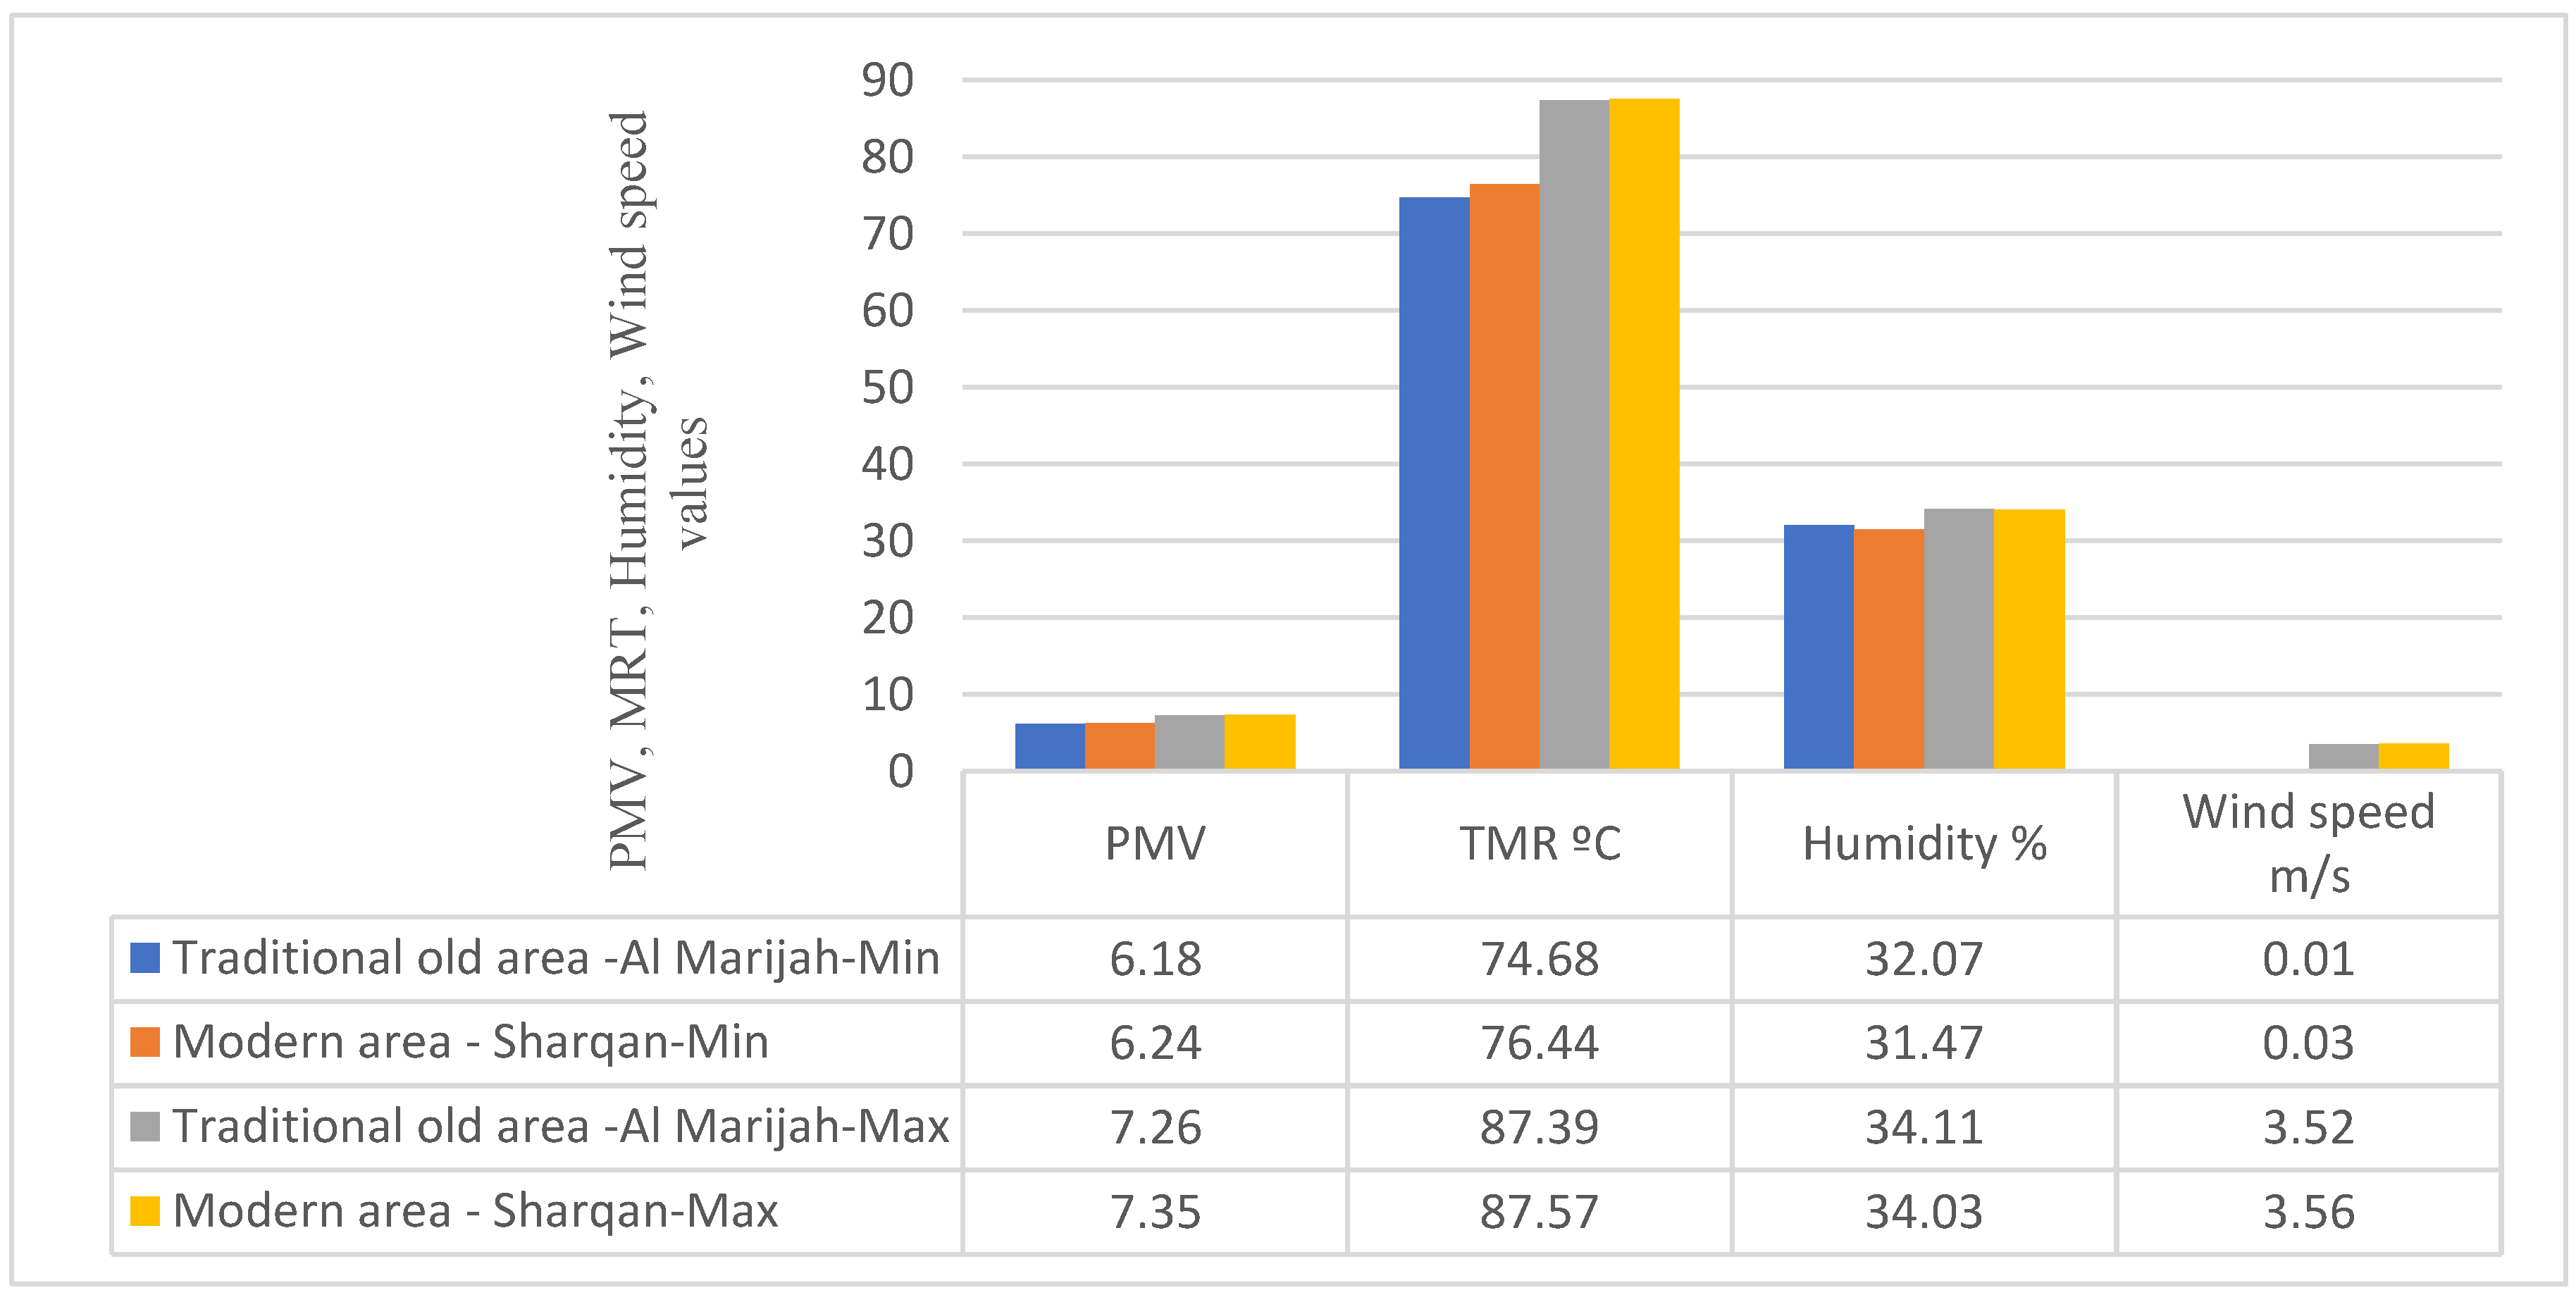
  • Predicted mean vote (PMV) readings for outside thermal comfort. PMV calculations are linked to the energy equilibrium of the users’ bodies within the produced microclimates. ENVI-met calculates PMV according to the ASHRAE scale that runs from +3 (hot) to 3 (cold) [49]. For open air spans, the scale is extended so that +4 is hot and 4 is cold [53].

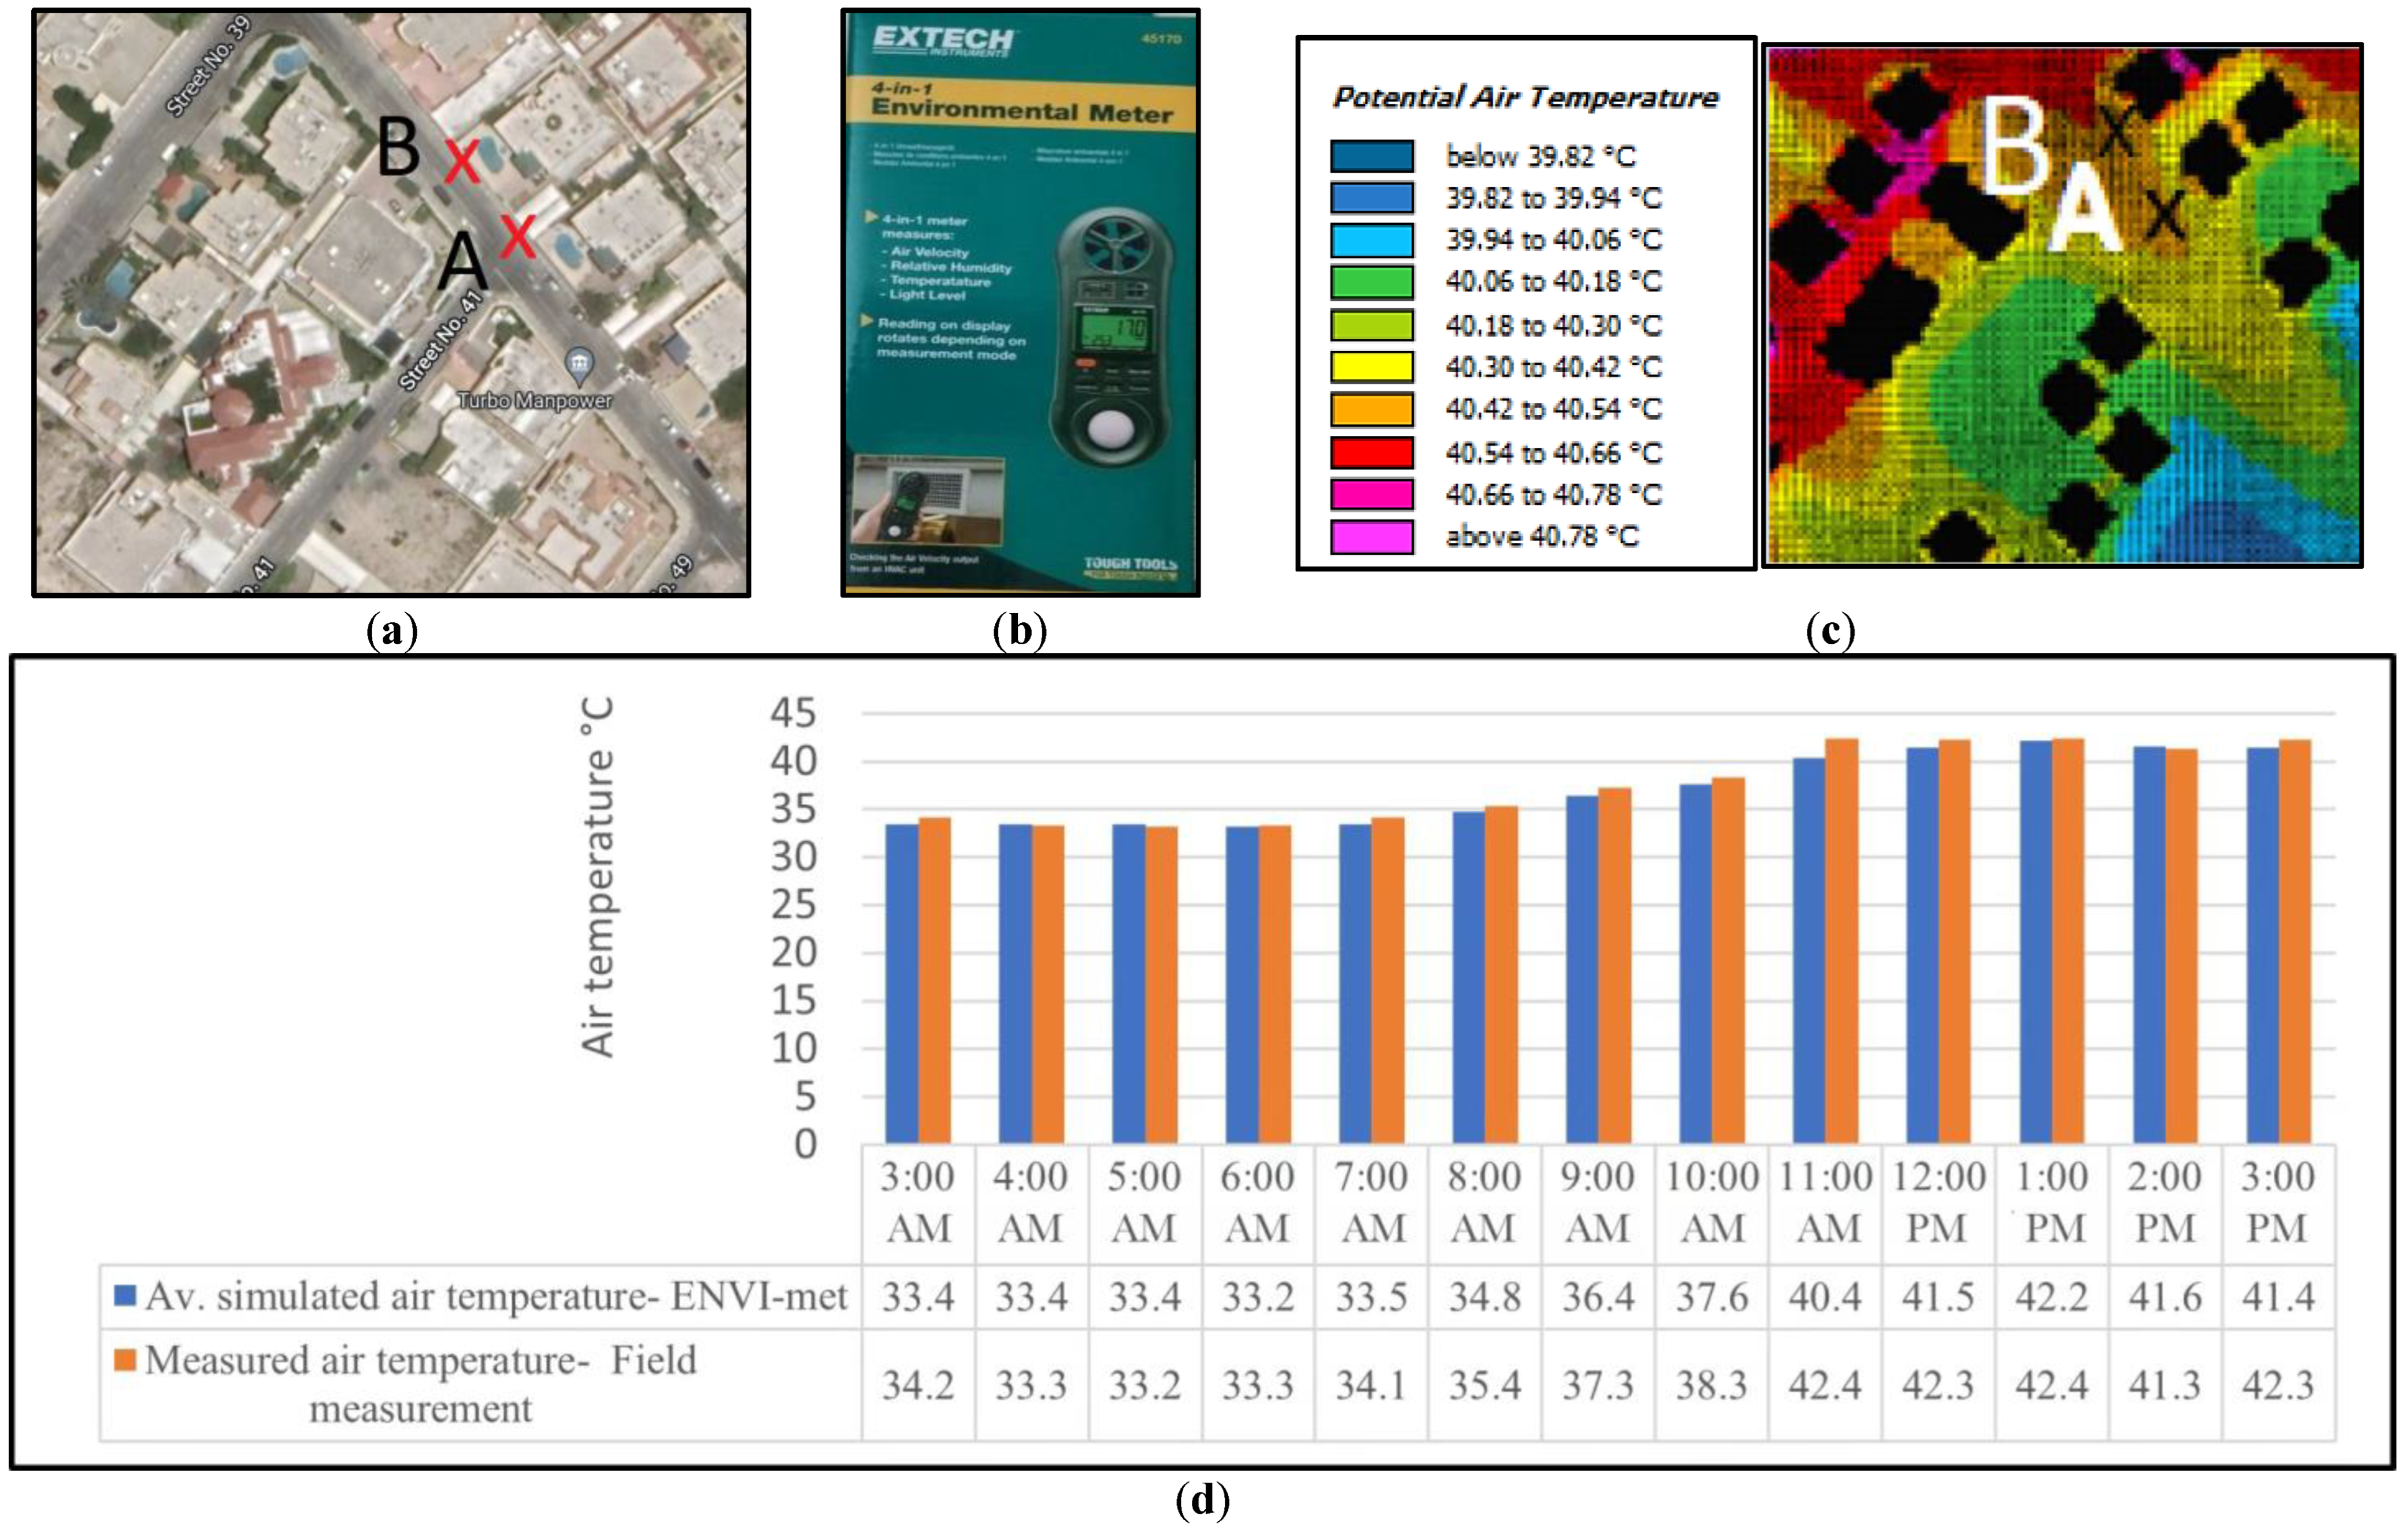
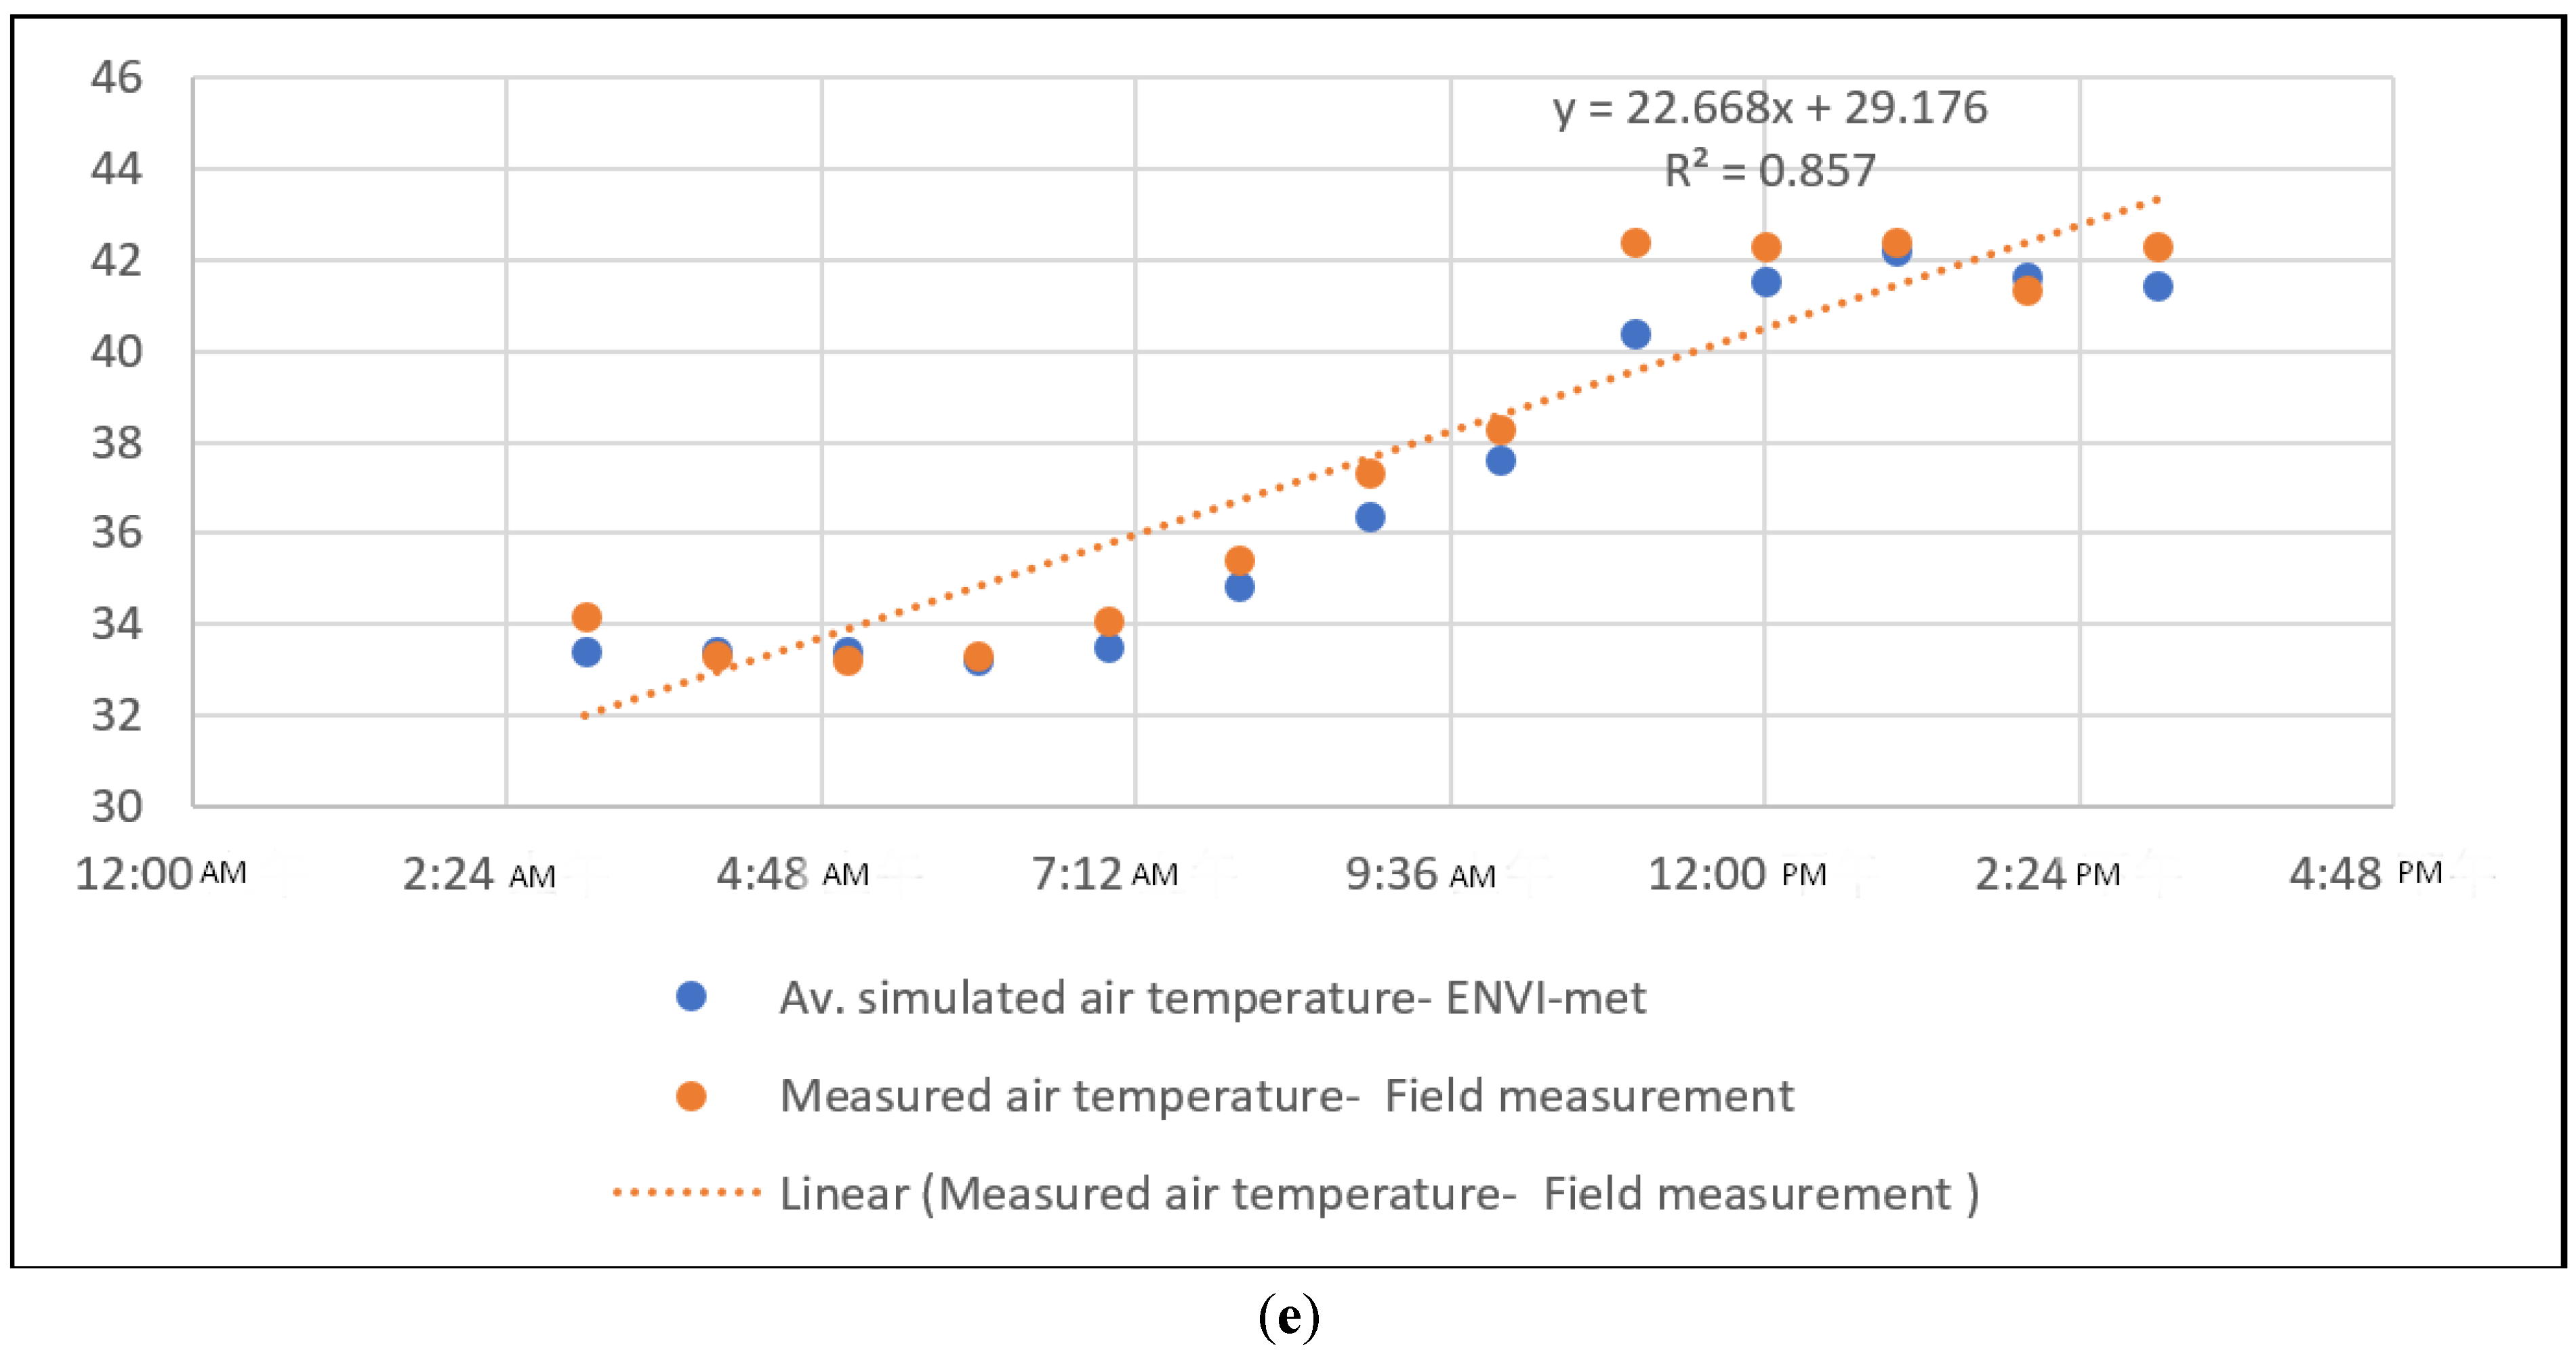
2.3. Validation for the Simulation Results

ENVI-met has been proven reliable through many studies at the urban level such as [9,22,50,54,55]. In addition, the authors conducted a validation process using two points—referred to as A and B —for field measurements in Sharqan (Figure 6a). The field measurements were registered using an Extech 45,170 m (Figure 6b) at height of 1.8 m, which measures the air temperature ±1.2 °C [56]. The average measured air temperatures were collected at both points and compared with the corresponding average air temperatures from the simulation for the same points; the collections were performed hourly on 21 August for 24 h (Figure 6c).
The average simulated and average measured air temperatures for points A and B (Figure 6d) exhibited a correlation of R2 = 0.857 (Figure 6e), which we consider a good correlation despite the discrepancies, which are mostly related to the accuracy of the used meter.

2.4. Simulation Date and Conditions

Date for simulation: The simulation for this study was conducted on 21st of August, the hottest month of the year in UAE, which was chosen because the maximum and minimum recorded air temperatures (41 °C and 34 °C) exceed the comfort boundaries on Schneider’s thermal comfort diagram [57]; thus, this setting illustrates the conditions that make reducing air-conditioning power consumption so challenging [58].
Conditions and spaces for the simulation: In both case studies (old and new), a plot with area about 180 m × 180 m was represented in ENVI-met (Table 2). The model’s geometry was as follows:
Basic cell size   2 m × 2 m × 2 m (dx, dy, dz);
Grid count   90 × 90 × 25 (x, y, z);
Computation domain   180 m × 180 m × 50 m.
The duration of each simulation was 24 h.
The simulations for the old and new cases featured some common parameters:
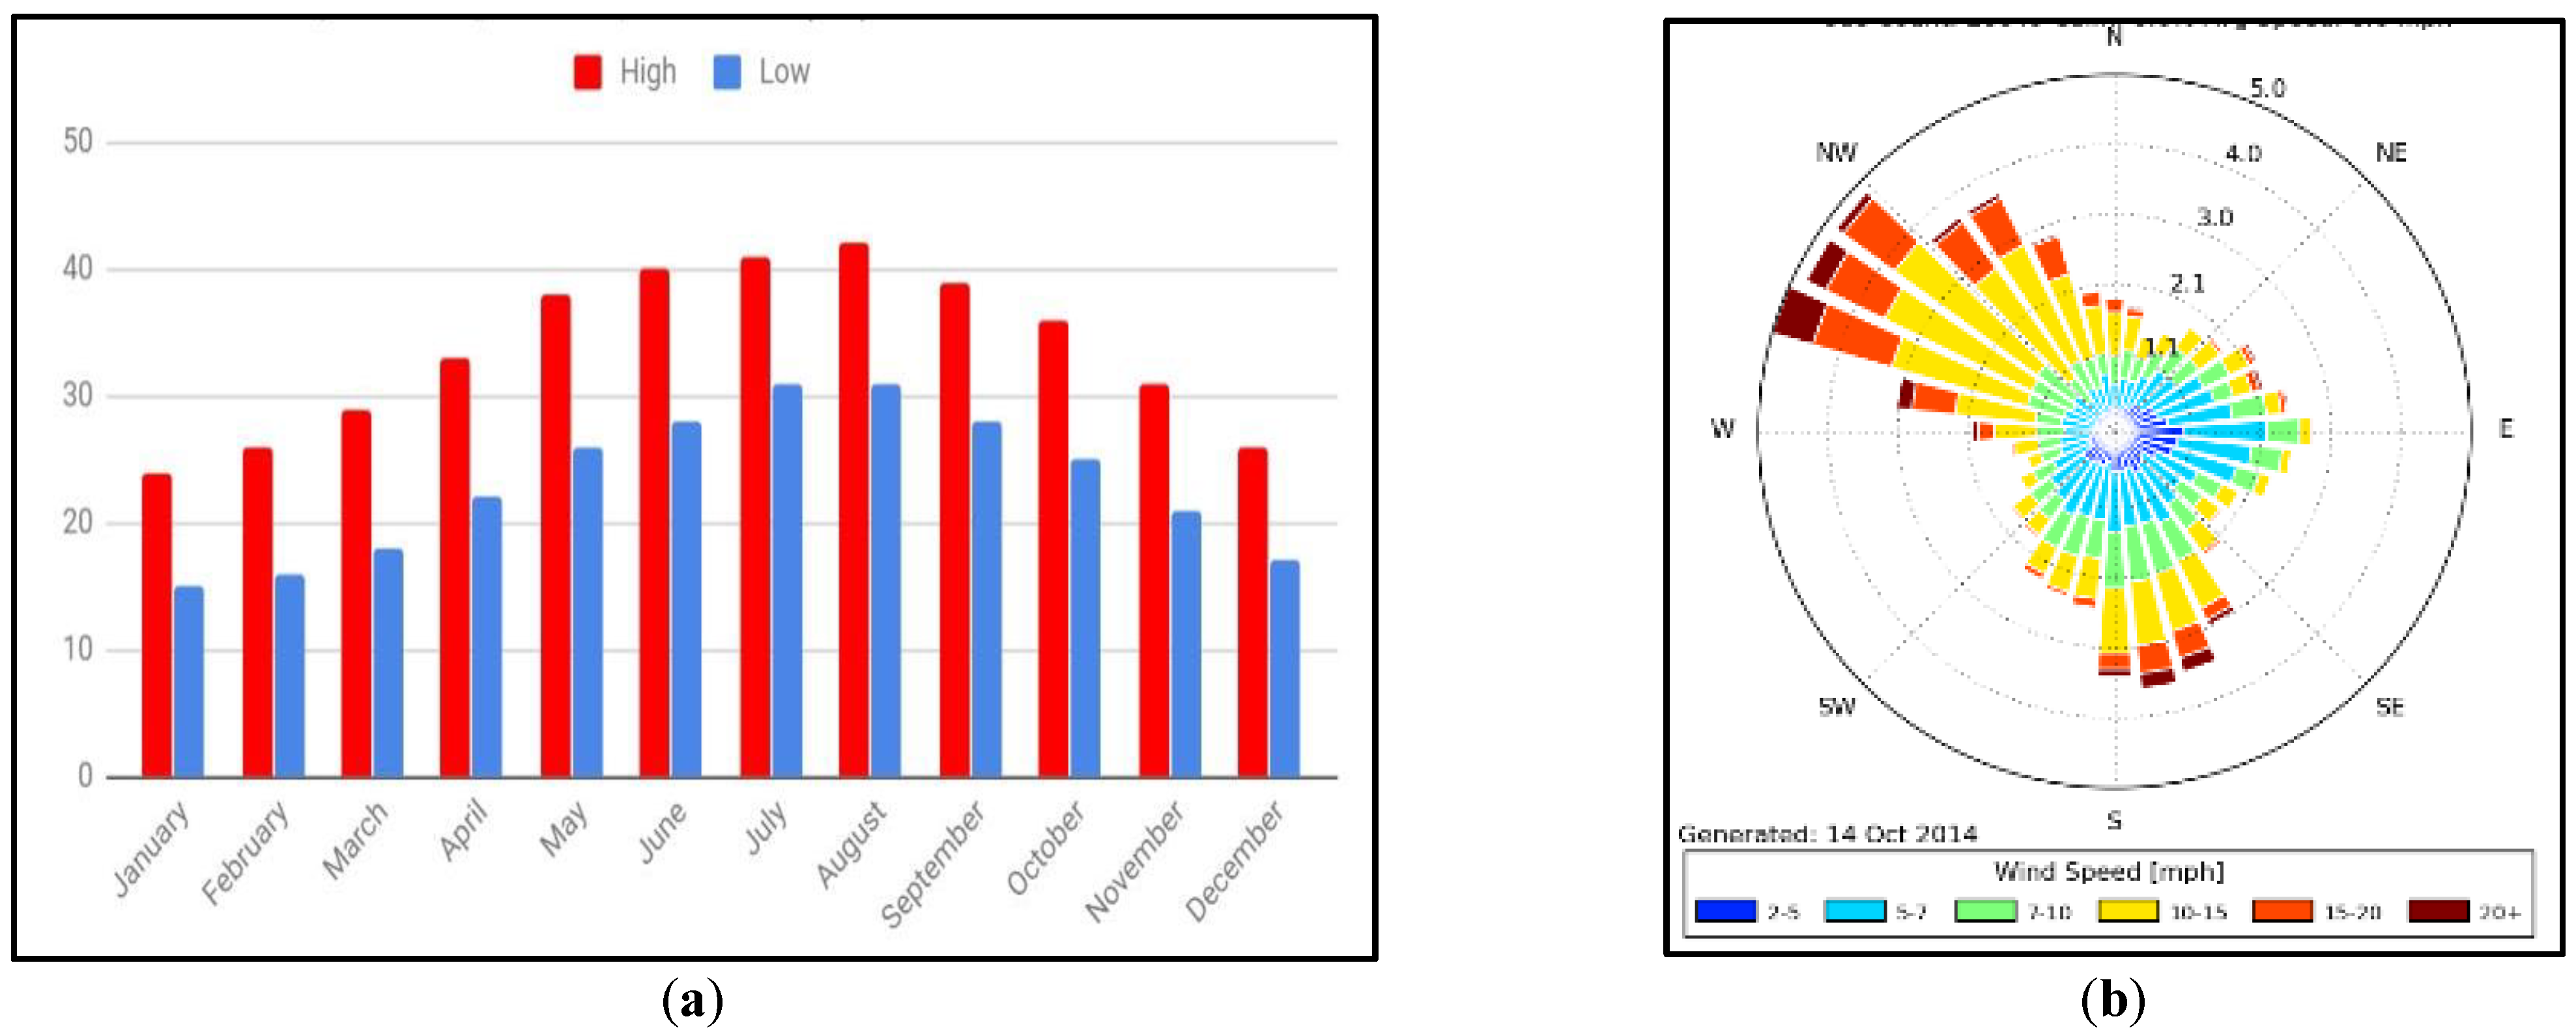
  • Locale—Sharjah, UAE, as a hot, arid climate;
  • Construction items—default concrete walls with moderate wall insulation and roof insulation.
On the other hand, some features were specific to each case:
  • Urban design and form;
  • The buildings’ three-dimensional forms and the ratio of the built-up area to plot area;
  • Street geometries, including their widths and directions.
After modelling all the features for each case study (the dependent features), a simulations was run to calculate the potential outdoor air temperature and the thermal comfort represented as PMV (predicted mean vote).

3. Results and Discussion

3.1. Evaluation of Thermal Conditions

After modelling the two case studies (old and new) in the ENVI-met spaces section and in the ENVI-met core section for the 21st of August, the simulation results were presented through LEONARDO, ENVI-met’s visualization software. The results revealed a difference in the thermal performance via the potential air temperatures. Specifically, the old, traditional heritage area in Sharjah showed better thermal performance with lower air temperatures than the modern one, mostly from 10:00 A.M. to 17:00 P.M., i.e., the daily peak temperature period (Figure 7). This can be explained by the presence of courtyards, the winding narrow streets, and the compacted layout.
Table 3 clearly shows the difference between the max, min, and average potential air temperatures between the two cases. At midday at 12:00 pm on the 21st of August, for example, the old-case maximum temperature was 0.34 °C lower and its average temperature was 0.12 °C lower. The difference in the maximum air temperature grew to 0.61 °C at 13:00, 0.96 °C at 14:00, and 1.00 °C at 15:00. This reduction can be attributed to the form of the urban fabric, even without considering the effects of the traditional materials, and the type of the openings.
The potential air temperature distribution at 12:00 at a height of 1.8 m on the 21st of August in the old district was clearly better than that of the new one. Table 4a visualizes the model for both the old and new districts. The built-up to plot area ratio is around 23% for the modern district and around 43% for the old one, reflecting the organic and semi-attached structures that characterize the old district with its moderately packed buildings, in contrast to the new district’s widely separated buildings distributed over a regular grid. The old district thus provides more roof shade, and its erratic, narrow road network provides shaded areas that lower solar gain. In contrast, the new district’s broad, straight streets, as wide as 15 m, result in much less shade.
Table 4b shows the air temperature distribution over each site at 12:00, at a height 1.8 m, on the 21st of August. The maximum temperature, 41 °C, covered 33% of the new district, but only 27% of the old one. More significantly, in the new district, only 15% of the area cells dropped below 40 °C, in contrast to 35% of cells in the old district. That can be attributed to the semi-attached organic buildings’ various heights, ranging from 5 to 12 m, as well as to the neighborhood’s irregular pathways and courtyards, which increased shading and improved the air quality. In contrast, the newer neighborhood exhibits less variation in building height, a widely spaced grid layout, and, hence, less shade.
Since the displayed heights increase in 0.4 m intervals starting from 0.2 m, a height of 1.8 m was adopted to measure the PMV values as it was the nearest level to the 1.75 m prescribed in the standard PMV model, which was built based on Frangers (1972) for a person aged 35, 1.75 m tall, weighing 75 kg, and walking at a speed of 4 km per hour [40]. According to the PMV distribution illustrated in Table 4c, it is clear that even though the PMV calculations for the old district did not all fall within the comfort zone (+4–4), they were lower than the ones for the new district, so the old district had better thermal comfort with a min PMV of 6.15, while the new district’s min PMV was 6.29. Finally, most of the PMV values for the new area were concentrated around 6.9, whereas they were concentrated around 7.05 for the new district, as shown by the histogram in Table 4d.
To explain the PMV differences between the old and new districts, we used the universal thermal climate index (UTCI), which assesses the correlations between the outside environment and people’s wellbeing, according to the four basic environmental influences on how the human body feels: temperature, humidity, wind, and radiation [59]. At 12:00, the readings concerning the mean radiant temperature (MRT) were lower in the old district (Table 4e), as was the maximum MRT (87.39 °C vs. 87.57 °C, Figure 8). The predominant temperature of 84.5 °C covered 37% of the old district, while the predominant temperature of 85.5 °C extended over 32% of that district (Table 4f). the relative humidity was slightly higher in the old district (Table 4g,h), showing a maximum of 34.11% vs. 34.04% for the new one (Figure 8). The wind speed was lower in the old district, (Table 4i,j) with a maximum of 3.52 m/s vs. 3.56 m/s (Figure 8). That led to better PMV conditions in the old district (6.18–7.24) than in the new district (6.24–7.35). These results demonstrate the opposition between the relative humidity and MRT and show that the lowest PMV measurements occur when the MRT is low and the relative humidity is high. According to Manavvi and Rajasekar [60] as well as Naboni et al. [61], the MRT is a key factor for describing how humans manage their energy to achieve thermal comfort, since it shows how they react to radiation in their surroundings. They associate a lower MRT with a high relative humidity.
Although the results indicated a lower wind speed in the old district, this district also had lower air temperature and PMV values, which is consistent with the findings of Thapar and Yannas [62], who found that low wind speeds do not strongly affect PMV readings when the MRT is low, as the PMV is more governed by the MRT and relative humidity than the wind speed in this case.

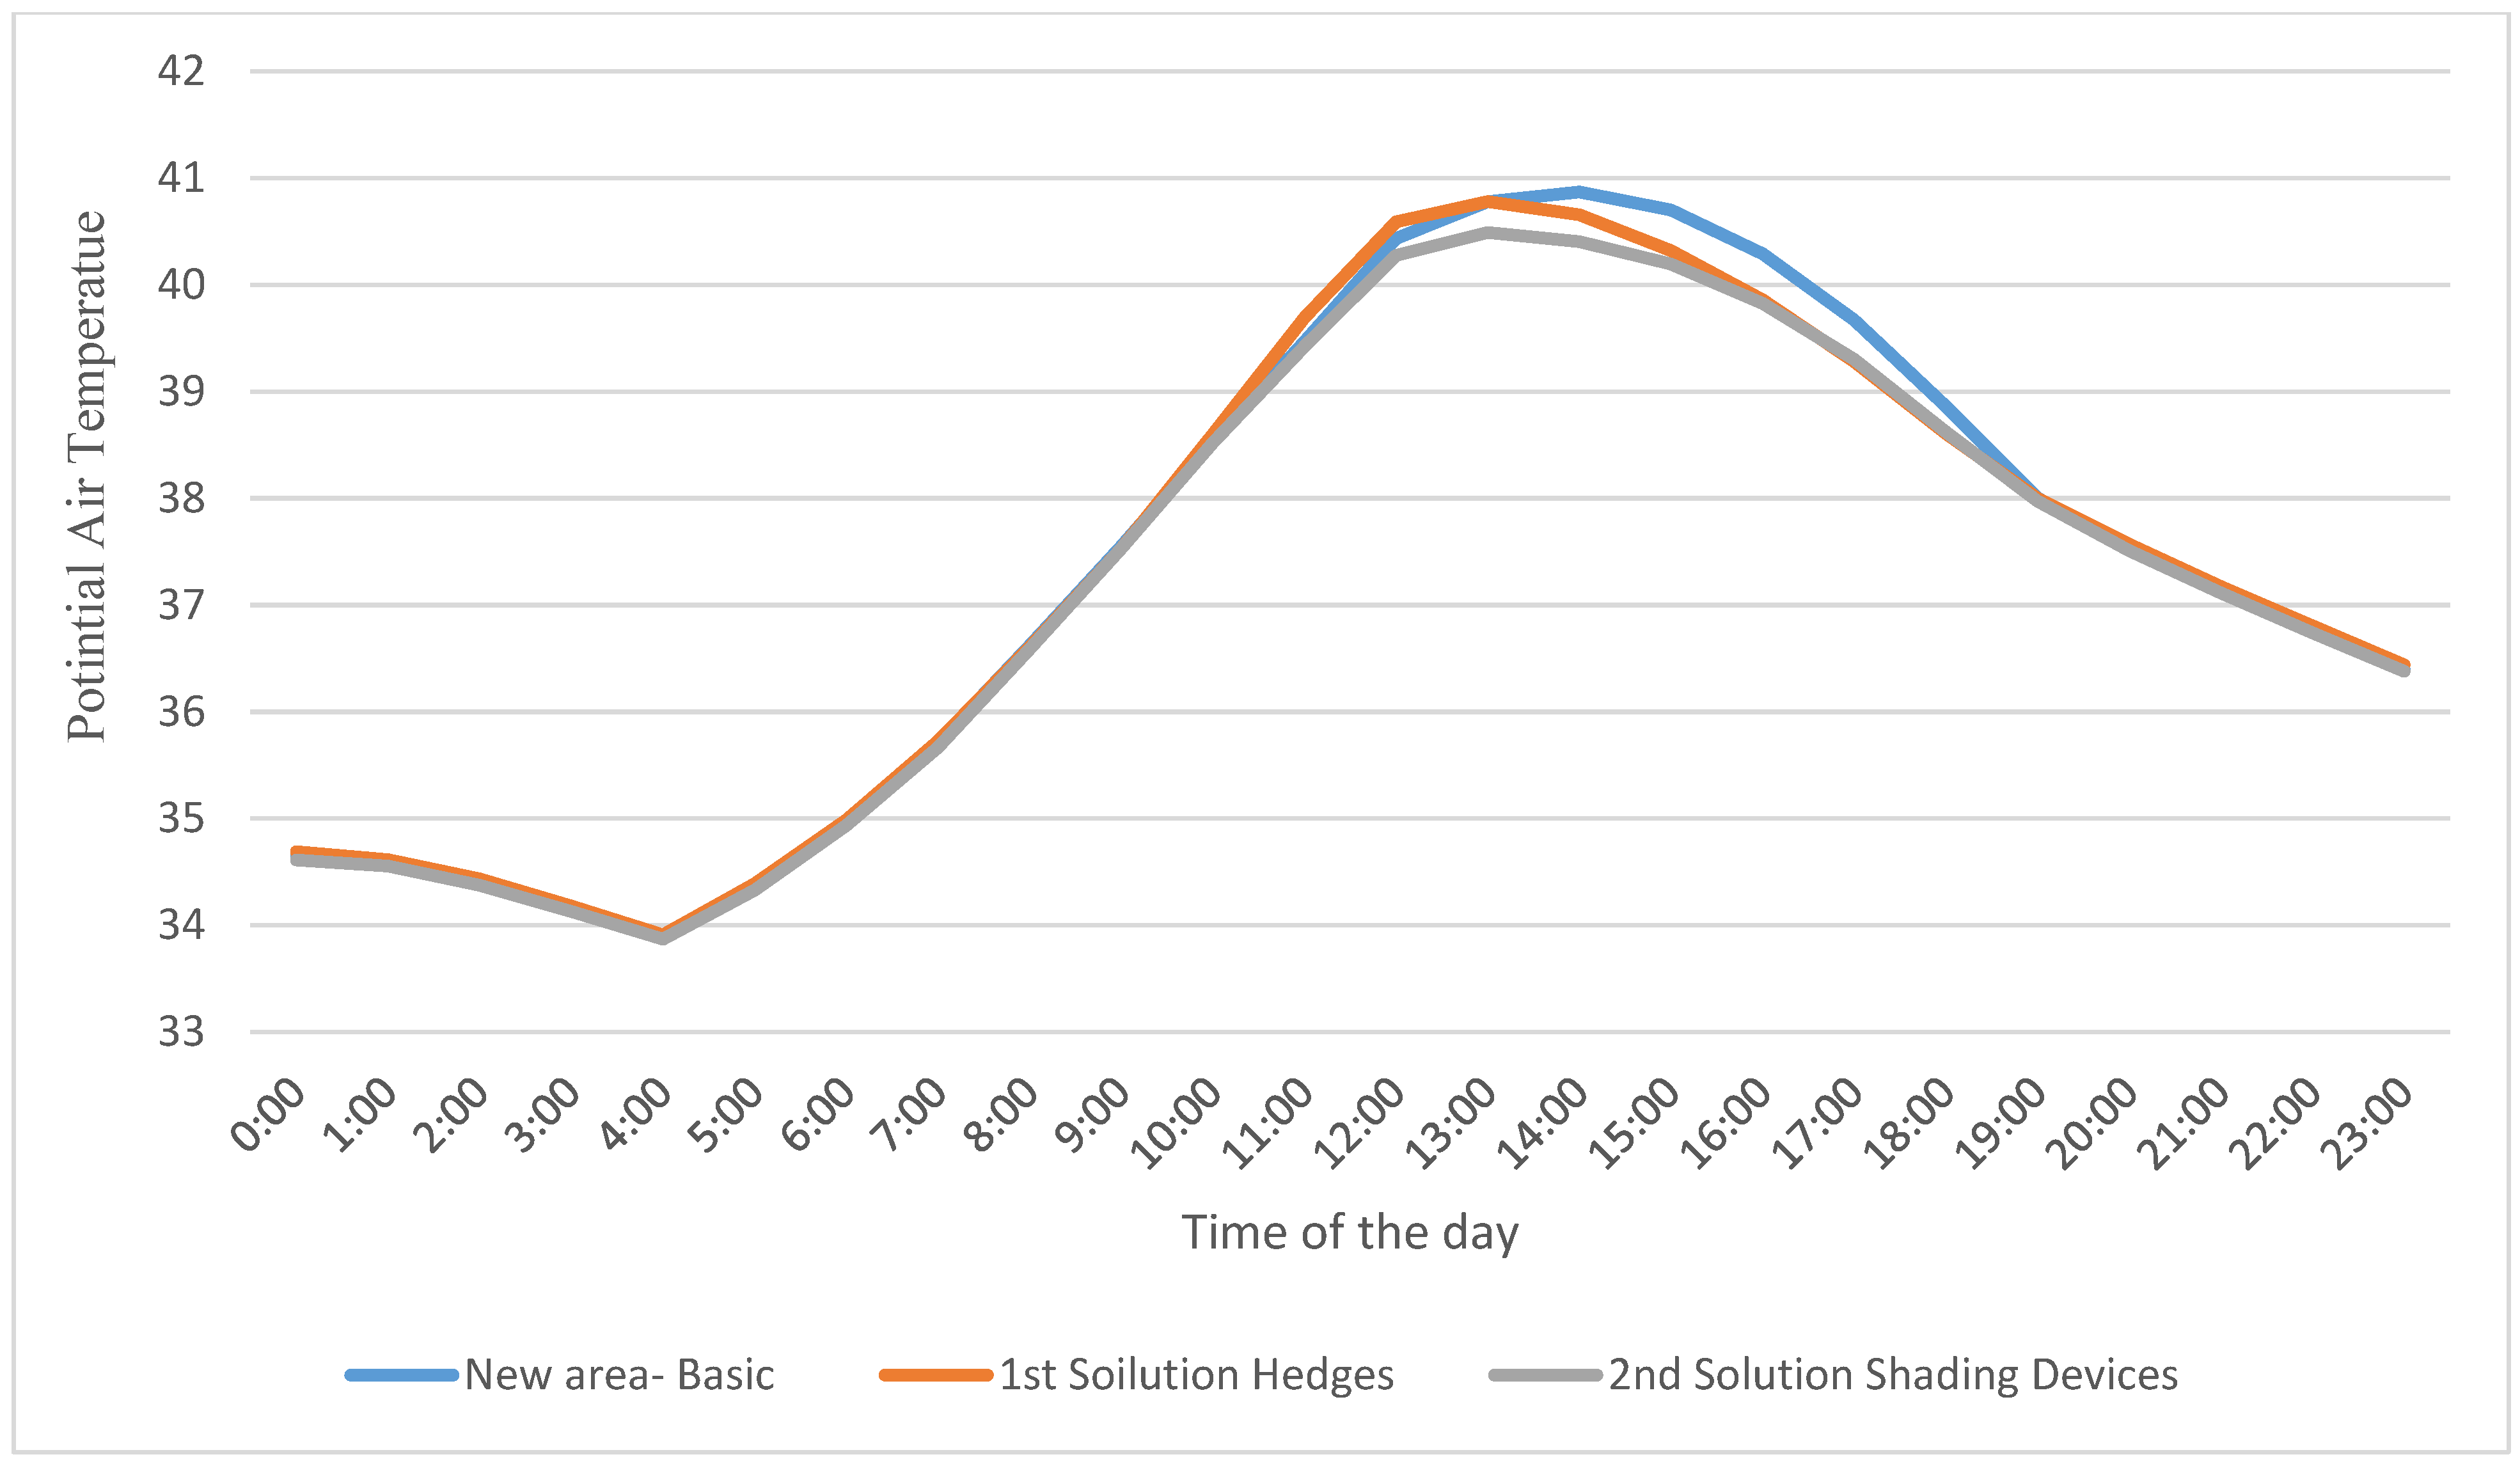
3.2. Suggestions for Improving Thermal Characteristics in the New Area

The previous discussion in Section 3.1 showed the better thermal performance in the old district in Sharjah, which was attributable to the passive design solutions in the old district, namely, its urban layout, irregular narrow streets, and courtyards, all of which increased shade and decreased the potential outdoor air temperatures. We thus propose implementing similar passive design solutions in the new district to increase shade. The primary challenge with these solutions is that they need to be implemented in the architecture of a neighborhood that is already developed, and that precludes some large-scale solutions because of the following concerns:
  • Changing a straight street grid to a winding maze is not practicable;
  • The large building setbacks required by municipal design rules precludes the addition of a greater building mass that would compress the built-up areas;
  • The street width—as much as 15 m—is regulated by municipality laws, precluding the practice of narrowing for increased shade;
  • Since the buildings are already built, it is not possible to add courtyards or to alter their orientations.
Clearly, passive solutions must be applicable to the existing buildings and the general regulations for the urban layout. However, it is not appropriate to suggest modifying the construction masses, streets, and urban design—for example, some solutions may include shading gadgets and hedges next to buildings and in the outdoor open areas (Table 5a)—due to the thermophysical properties of the proposed materials, including their albedo, specific heat (kJ/kg K), thermal conductivity (W/m K), and density (kg/m3) (Table 5b).
1st Solution: Hedges
Varshney and Mitra [63] highlighted the potential of hedges in refining urban temperature fluctuations and air quality. It is anticipated that integrating green hedges into the new district will increase the number of shaded areas and improve thermal circumstances [64]. The hedges are suggested to be aligned with the main winds, i.e., northwest to southeast, in order to avoid impeding the breeze.
2nd Solution: Shading devices
As stated by Bande et al. [65], incorporating shading techniques in outdoor spaces and roadways can modify the thermal conditions in the urban districts, and can be implemented both next to buildings and in open-air spaces.
Table 5. The suggested passive solutions with the unified materials properties for the new district.
a-Suggested Passive Solutions for the New District
Cases
Buildings 12 01811 i039
Perspective—ENVI-metTop View
New Area-Sharqan-Sharjah Basic
Buildings 12 01811 i040
Buildings 12 01811 i041Buildings 12 01811 i042
First solution: Hedges
Buildings 12 01811 i043
Buildings 12 01811 i044Buildings 12 01811 i045
Second solution: Green Shading Devices
Buildings 12 01811 i046
Buildings 12 01811 i047Buildings 12 01811 i048
b-Unified Materials Properties for All the Cases
Thermophysical PropertiesThermal Conductivity (W/m K)Density (kg/m3)Specific Heat (kJ/kg K)Albedo
Buildings 12 01811 i081Concrete pavement light1.3720760.880.25–0.70
Buildings 12 01811 i082Default wall- Moderate insulation1.423500.880.25–0.70
Buildings 12 01811 i083Grass and hedges_-_-_-0.25–0.30
Buildings 12 01811 i084Greening with air gap_-_-_-0.25–0.30
References[66,67][66,67][67,68][69,70]
The two suggested methods for altering the outdoor thermal conditions in the new district’s urban fabric were simulated in ENVI-met for August 21 as before. The results (Figure 9 and Table 6) show a difference in the average potential air temperature per hour. For the New District Baseline, the average temperature (21st August, noon, and 1.8 m high) was 40.435 °C, adding hedges raised it to 40.59 °C, and adding shading devices reduced it to 40.275 °C. Thus, the added shading devices lowered the average potential air temperature by 0.16 °C. While this difference seems, on the surface, insignificant, clearer evidence for an improved thermal performance via the integration of shading devices can be found in the better distribution of the lower temperatures, as shown in Table 7a,b.
Table 7a gives a crystal-clear picture of the enhancement in the new district’s thermal behavior, which results from combining both hedges and shading devices. As before, we consider the air temperature on 21 August at 12:00 PM (a time of a high ambient air temperature and high solar radiation) and see that the first solution—hedges—did improve the area’s overall thermal performance, but to a lesser extent than the shading devices.
Considering the effects over the entire plot, the newly created shaded areas assisted in lowering the air temperature and improving thermal performance. In addition, these shading devices improved the air circulation because of the new air temperature variations, which created differences in the air pressure. Additionally, the green roofs on these shading devices assisted in lowering the temperature through evaporative cooling. By adding additional shaded places between the buildings and in the public open space, the shading devices were able to imitate the shading provided by the buildings themselves in the historic old district.
According to the differences in the histograms regarding the base case and the two solutions, Table 7b verifies that the second solution—green shading devices—had a better positive effect. The smaller number of space cells with the highest temperature of the day (41 °C) gives strong evidence for improved overall outdoor air temperatures; in the base case, the maximum temperature is found in 20.5% of the space cells, compared with 17% when applying the shading devices. Applying the hedge solution, in contrast, increased the maximum temperature coverage to 27% of space cells. In summary, the shading devices reduced the maximum temperature coverage by around 3.5%, with air temperatures reduced overall in comparison to the base case and the hedge solution.
The PMV distribution is displayed in Table 7c. The PMV levels for the base case are seen to be greater than the suggested solutions, showing a clear decrease in PMV levels for the second option in particular, i.e., by incorporating green shading devices. Even though the levels achieved by using the second solution—green shading devices—were higher than the target satisfaction levels, the change is still an improvement regardless. The PMV ranged between 5.28–7.16 for the green shading solution, compared with 6.24–7.35 for the baseline (Figure 10). The universal thermal climate index (UTCI) components, mainly the MRT, affect the PMV values for all cases: the MRT for the best solution ranged between 55.99–85.58 °C, centralized around 84 °C, which covered 37% of the district, an improvement over the baseline case which had temperatures between 76.44–87.57 °C ((Table 7d; Figure 10), centralized around 85.5 °C, which extended to over 32% of the district (Table 7e). Regarding humidity, the second solution with shading devices produced a higher relative humidity (31.96–34.03%) than the baseline (31.35–33.87%) and the hedge solution (31.47–33.95%) (Table 7f,g; Figure 10). The wind speed was slightly lower with shading devices (0.02–3.44 m/s) compared to areas with hedges (0.03–3.47 m/s) and the baseline (0.03–3.56 m/s) (Figure 10; Table 7h,i). The MRT and relative humidity led to better PMV conditions for the second solution, confirmed the opposition between the relative humidity and MRT, and showed that the lowest PMV measurements occurred when the MRT was low and the relative humidity was high. The results indicated that even though the wind speed was lowered by adding shading devices, the shading devices succeeded in improving and lowering both air temperature and PMV values. We attribute this result to the shading devices acting like the compacted pattern of the traditional areas, passively creating more shaded areas.

4. Conclusions

The primary motivations for this study were to diminish climate change and reduce greenhouse gas emissions while creating aesthetically pleasing and healthful metropolitan areas with better thermal conditions. It was obvious from this research’s findings that vernacular architecture and urban design offer good examples for sustainable architecture due to their passive design solutions and better thermal performance than their modern counterparts. Just 15% of the area cells in the new district were below 40 °C on 21 August at 12:00 pm, one of the hottest hours of the day, compared to 35% in the old district. This can be explained by the old neighborhood having better thermal conditions because of its semi-attached, organic buildings ranging from 5 to 12 m in height, as well as the winding, narrow pathways and the presence of courtyards, all of which increase the shaded area and enhance air quality. In contrast, the newer neighborhood had a more uniform building height, and was divided into a grid of wide streets, providing little shade overall. Moreover, the PMV values were favorably impacted by the lower air temperatures in the old district. While the PMV readings in the old district did not fall within the comfort zone (+4–4), they were, nonetheless, lower than those in the new district.
This study demonstrates the potential in using traditional passive design solutions to improve thermal performance in modern and contemporary urban areas to create sustainable cities that can help mitigate climate change. The reduction in the number of spaces cells with the highest temperature of the day provides clear evidence of improvement in thermal conditions by integrating passive shading devices into the new urban district.
The research found that at noon on one of the hottest days of the year, adding shading devices achieved a clear reduction in PMV levels. Even though the levels achieved by using green shading devices exceeded the target comfort range, they were still significantly lowered from the baseline situation. Thus, the shading devices succeeded in improving conditions by providing passive shading similar to the compacted building arrangement of the traditional areas.
The study was limited to two sites in the hot, arid climate of the UAE, so it is suggested to investigate more old and new districts to more precisely determine the effects of traditional passive design solutions on improving urban microclimates. As we considered only one summer day, it is recommended to also investigate other times of the year to create more comprehensive results.

Author Contributions

Conceptualization, M.S. and B.T.; methodology, M.S. and B.T.; software, M.S.; validation, M.S.; formal analysis, B.T.; investigation, B.T.; resources M.S. and B.T.; data curation, M.S.; writing—original draft preparation, M.S.; writing—review and editing, B.T.; visualization, M.S.; supervision, B.T. All authors have read and agreed to the published version of the manuscript.

Funding

This research received no external funding.

Acknowledgments

The authors would like to acknowledge the support received from Ajman University and the Healthy and Sustainable Built Environment Research Center.

Conflicts of Interest

The authors declare no conflict of interest.

References

  1. Sangkakool, T.; Techato, K.; Zaman, R.; Brudermann, T. Prospects of green roofs in urban Thailand–a multi-criteria decision analysis. J. Clean. Prod. 2018, 196, 400–410. [Google Scholar] [CrossRef]
  2. Koo, C.; Park, S.; Hong, T.; Park, H.S. An estimation model for the heating and cooling demand of a residential building with a different envelope design using the finite element method. Appl. Energy 2014, 115, 205–215. [Google Scholar] [CrossRef]
  3. Zhang, J.; Wang, Q.; Xia, Y.; Furuya, K. Knowledge Map of Spatial Planning and Sustainable Development: A Visual Analysis Using CiteSpace. Land 2022, 11, 331. [Google Scholar] [CrossRef]
  4. Monna, S.; Juaidi, A.; Abdallah, R.; Albatayneh, A.; Dutournie, P.; Jeguirim, M. Towards sustainable energy retrofitting, a simulation for potential energy use reduction in residential buildings in Palestine. Energies 2021, 14, 3876. [Google Scholar] [CrossRef]
  5. Nikolopoulou, M.; Steemers, K. Thermal comfort and psychological adaptation as a guide for designing urban spaces. Energy Build. 2003, 35, 95–101. [Google Scholar] [CrossRef]
  6. Hussain, S.; Oosthuizen, P. Numerical investigations of buoyancy-driven natural ventilation in a simple atrium building and its effect on the thermal comfort conditions. Appl. Therm. Eng. 2012, 40, 358–372. [Google Scholar] [CrossRef]
  7. Nenadović, A.; Milošević, J. Creating Sustainable Buildings: Structural Design Based on the Criterion of Social Benefits for Building Users. Sustainability 2022, 14, 2133. [Google Scholar] [CrossRef]
  8. Al Tawayha, F.; Braganca, L.; Mateus, R. Contribution of the vernacular architecture to the sustainability: A comparative study between the contemporary areas and the old quarter of a Mediterranean city. Sustainability 2019, 11, 896. [Google Scholar] [CrossRef] [Green Version]
  9. Salameh, M.M.; Touqan, B.A.; Awad, J.; Salameh, M.M. Heritage conservation as a bridge to sustainability assessing thermal performance and the preservation of identity through heritage conservation in the Mediterranean city of Nablus. Ain Shams Eng. J. 2022, 13, 101553. [Google Scholar] [CrossRef]
  10. Biqaraz, B.; Fayaz, R.; Haghighaat Naeeni, G. A comparison of outdoor thermal comfort in historical and contemporary urban fabrics of Lar City. Urban Clim. 2019, 27, 212–226. [Google Scholar] [CrossRef]
  11. Drach, P.R.C.; Karam-Filho, J. Increasing Ventilation by Passive Strategies: Analysis of Indoor Air Circulation Changes through the Utilization of Microclimate Elements. Appl. Math. 2014, 5, 442–452. [Google Scholar] [CrossRef] [Green Version]
  12. Fernandes, J.; Dabaieh, M.; Mateus, R.; Bragança, L. The influence of the Mediterranean climate on vernacular architecture: A comparative analysis between the vernacular responsive architecture of southern Portugal and north of Egypt. In Proceedings of the World Sustainable Buildings SB14, Barcelona, Spain, 28–30 October 2014. [Google Scholar]
  13. Tawayha, F.; Bragança, L.; Mateus, R. Ecology and environment, an urban scale comparative study between contemporary and vernacular city of Nablus. In SBE16 Brazil & Portugal—Sustainable Urban Communities towards a Nearly Zero Impact Built Environment; Universidade Federal do Espírito Santo (UFES): Vitória, Brazil, 2016; Volume 3, pp. 1589–1598. [Google Scholar] [CrossRef]
  14. Lin, T.P.; Matzarakis, A.; Hwang, R.L. Shading effect on long-term outdoor thermal comfort. Build. Environ. 2010, 45, 213–221. [Google Scholar] [CrossRef]
  15. Tabesh, T.; Sertyesilisik, B. An Investigation into Energy Performance with the Integrated Usage of a Courtyard and Atrium. Buildings 2016, 6, 21. [Google Scholar] [CrossRef] [Green Version]
  16. Du, X.; Bokel, R.; van den Dobbelsteen, A. Architectural spatial design strategies for summer microclimate control in buildings: A comparative case study of Chinese vernacular and modern houses. J. Asian Archit. Build. Eng. 2016, 15, 327–334. [Google Scholar] [CrossRef] [Green Version]
  17. Abanomi, W.; Jones, P.M. Passive cooling and energy conservation design strategies of school buildings in hot, arid region: Riyadh, Saudi Arabia. In Proceedings of the International Conference Passive and Low Energy Cooling for the Built Environment, Santorini, Greece, 19–21 May 2005. [Google Scholar]
  18. Chohan, A.H.; Awad, J. Wind Catchers: An Element of Passive Ventilation in Hot, Arid and Humid Regions, a Comparative Analysis of Their Design and Function. Sustainability 2022, 14, 11088. [Google Scholar] [CrossRef]
  19. Nia, H.A.; Rahbarianyazd, R. Aesthetics of modern architecture: A semiological survey on the aesthetic contribution of modern architecture. Civ. Eng. Archit. 2020, 8, 66–76. [Google Scholar] [CrossRef]
  20. Todes, A. New directions in spatial planning? Linking strategic spatial planning and infrastructure development. J. Plan. Educ. Res. 2012, 32, 400–414. [Google Scholar] [CrossRef]
  21. Bolouhari, S.; Barbera, L.V.; Etessam, I. Learning Traditional architecture for future energy-efficient architecture in the country; Case study: Yazd city. Naqshejahan-Basic Stud. New Technol. Archit. Plan. 2020, 10, 85–93. [Google Scholar]
  22. Meutia, E.; Sahputra, Z.; Irwansyah, M. Architecture in between: Connecting between traditional Acehnese house and the current condition of modern Acehnese community. In IOP Conference Series: Materials Science and Engineering; IOP Publishing: Bristol, UK, 2021; Volume 1087, p. 012036. [Google Scholar]
  23. Hailu, H.; Gelan, E.; Girma, Y. Indoor thermal comfort analysis: A case study of modern and traditional buildings in hot-arid climatic region of Ethiopia. Urban Sci. 2021, 5, 53. [Google Scholar] [CrossRef]
  24. Gamero-Salinas, J.; Kishnani, N.; Monge-Barrio, A.; López-Fidalgo, J.; Sánchez-Ostiz, A. Evaluation of thermal comfort and building form attributes in different semi-outdoor environments in a high-density tropical setting. Build. Environ. 2021, 205, 108255. [Google Scholar] [CrossRef]
  25. Dou, Y. The Influence of Urban Planning on Urban Thermal Comfort. Master’s Thesis, Wageningen University, Wageninge, The Netherland, 2014. [Google Scholar]
  26. Zou, M.; Zhang, H. Cooling strategies for thermal comfort in cities: A review of key methods in landscape design. Environ. Sci. Pollut. Res. 2021, 28, 62640–62650. [Google Scholar] [CrossRef] [PubMed]
  27. Chi, Y.L.; Mak, H.W.L. From Comparative and Statistical Assessments of Liveability and Health Conditions of Districts in Hong Kong towards Future City Development. Sustainability 2021, 13, 8781. [Google Scholar] [CrossRef]
  28. Högström, J.; Brokking, P.; Balfors, B.; Hammer, M. 2013 Approaching sustainability in local spatial planning processes: A case study in the Stockholm region, Sweden. Sustainability 2021, 13, 2601. [Google Scholar] [CrossRef]
  29. Solly, A. Land use challenges, sustainability and the spatial planning balancing act: Insights from Sweden and Switzerland. Eur. Plan. Stud. 2021, 29, 637–653. [Google Scholar] [CrossRef]
  30. Hausladen, G.; Liedl, P.; Saldanha, M. Building to Suit the Climate: A Handbook; Walter de Gruyter: Berlin, Germany, 2012. [Google Scholar]
  31. Perdikis, P. Cool Roofs Benefits: Introduction. Slideshare.net. 2015. Available online: http://www.slideshare.net/ProkopisPerdikis/cool-roofs-benefits-introduction (accessed on 27 August 2022).
  32. Afshari, A.; Nikolopoulou, C.; Martin, M. Life-Cycle Analysis of Building Retrofits at the Urban Scale—A Case Study in United Arab Emirates. Sustainability 2014, 6, 453–473. [Google Scholar] [CrossRef] [Green Version]
  33. Katanbafnasab, M. Assessment of the Energy Impact of Using Building Integrated Photovoltaic and Electrochromic Glazing in Office Building in UAE. Engineering 2013, 5, 56–61. [Google Scholar] [CrossRef]
  34. Al-Masri, N.; Abu-Hijleh, B. Courtyard housing in midrise buildings: An environmental assessment in hot-arid climate. Renew. Sustain. Energy Rev. 2012, 16, 1892–1898. [Google Scholar] [CrossRef]
  35. Beriatos, E. Sustainable Planning and Development; WIT Press: Southampton, UK, 2003. [Google Scholar]
  36. Cantón, M.; Ganem, C.; Barea, G.; Llano, J. Courtyards as a passive strategy in semi dry areas. Assessment of summer energy and thermal conditions in a refurbished school building. Renew. Energy 2014, 69, 437–446. [Google Scholar] [CrossRef]
  37. Clair, P. Low-Energy Design in the United Arab Emirates. Building Design Principles. BEDP Environmental Design Guide. 2009. Available online: http://file:///F:/Low%20energy%20Design%20Guide.pdf (accessed on 8 January 2016).
  38. Detommaso, M.; Gagliano, A.; Marletta, L.; Nocera, F. Sustainable urban greening and cooling strategies for thermal comfort at pedestrian level. Sustainability 2021, 13, 3138. [Google Scholar] [CrossRef]
  39. Salvati, A.; Roura, H.C.; Cecere, C. Assessing the urban heat island and its energy impact on residential buildings in Mediterranean climate: Barcelona case study. Energy Build. 2017, 146, 38–54. [Google Scholar] [CrossRef]
  40. Bueno, B.; Roth, M.; Norford, L.; Li, R. Computationally efficient prediction of canopy level urban air temperature at the neighbourhood scale. Urban Clim. 2014, 9, 35–53. [Google Scholar] [CrossRef] [Green Version]
  41. Ding, D. Solar passive features in vernacular Gyalrong Tibetan houses: A quantitative investigation. Ain Shams Eng. J. 2022, 13, 101525. [Google Scholar] [CrossRef]
  42. UAE Google Earth 2022. Google. Available online: https://earth.google.com/web/search/uae/@24.3540069,53.95590005,-7.62890797a,542166.46467762d,35y,0h,0t,0r/data=Cm4aRBI-CiUweDNlNWU0OGRmYjFhYjEyYmQ6MHgzM2QzMmY1NmMwMDgwYWE3GbwEpz6QbDdAIeV620yF7EpAKgN1YWUYAiABIiYKJAkz87UPAGc5QBH6zVWfqVo5QBm5hSzem7dLQCGdknD9AbBLQA (accessed on 2 October 2022).
  43. Emiratesvoyage.com. Maps of UAE. 2021. Available online: http://emiratesvoyage.com/uae-maps/ (accessed on 19 February 2021).
  44. Air Temperature. A—The Average Monthly Air Temperature throughout the Year in the UAE-Google Search. Google.com. 2022. Available online: https://www.google.com/search?q=a-+The+average+monthly+air+temperature+throughout+the+year+in+the+UAE&rlz=1C1GCEU_enAE929AE929&source=lnms&tbm=isch&sa=X&ved=2ahUKEwiJ3-Pr-Mj1AhW1AmMBHS8VBT0Q_AUoAXoECAEQAw&biw=1536&bih=849&dpr=2.5#imgrc=IRO06uCF4YaV-M (accessed on 23 January 2022).
  45. Wind Rose Abu Dhabi. 2015. Available online: https://www.google.com.sa/search?q=wind+rose+abu+dhabi&espv=2&source=lnms&tbm=isch&sa=X&ei=kvFDVcacOcvnaP3bgZgI&ved=0CAgQ_AUoAQ&biw=1536&bih=758#imgrc=_ (accessed on 21 October 2022).
  46. Hillier, B.; Vaughan, L. The city as one thing. Prog. Plan. 2007, 67, 205–230. [Google Scholar]
  47. Sharjah 2022. Continue to Google Maps. Google.com. Available online: https://www.google.com/maps/place/Street+41+Sharqan/@25.3786226,55.4097254,354m/data=!3m1!1e3!4m6!3m5!1s0x3e5f59ff351df789:0x11b0e05a9d0890ea!4b1!8m2!3d25.3788478!4d55.4096487 (accessed on 17 July 2022).
  48. Sharjah (no date) Google maps. Google. Available online: https://www.google.com/maps/place/Al+Marija+St+-+Shajah/@25.3547247,55.3822908,17z/data=!3m1!4b1!4m5!3m4!1s0x3e5f5a360c99bacd:0xa8bdb16d0bf2ce8e!8m2!3d25.3547247!4d55.3822908 (accessed on 21 October 2022).
  49. Huttner, S. Further Development and Application of the 3D Microclimate Simulation ENVI-Met; Johannes Gutenberg-Universitat in Mainz: Mainz, Germany, 2012; p. 147. [Google Scholar]
  50. Lee, H.; Mayer, H.; Chen, L. Contribution of trees and grasslands to the mitigation of human heat stress in a residential district of Freiburg, Southwest Germany. Landsc. Urban Plan. 2016, 148, 37–50. [Google Scholar] [CrossRef]
  51. Salata, F.; Golasi, I.; de Lieto Vollaro, R.; de Lieto Vollaro, A. Urban microclimate and outdoor thermal comfort. A proper procedure to fit ENVI-met simulation outputs to experimental data. Sustain. Cities Soc. 2016, 26, 318–343. [Google Scholar] [CrossRef]
  52. Simon, H. Modeling Urban Microclimate: Development, Implementation and Evaluation of New and Improved Calculation Methods for the Urban Microclimate Model ENVI-Met. Ph.D. Thesis, Johannes Gutenberg University, Mainz, Germany, 2016. [Google Scholar]
  53. PMV-ENVI-met. apps:biomet_pmv [A Holistic Microclimate Model]. Envi-met.info. 2021. Available online: https://envi-met.info/doku.php?id=apps:biomet_pmv (accessed on 2 September 2021).
  54. Ghaffarianhoseini, A.; Berardi, U.; Ghaffarianhoseini, A. Thermal performance characteristics of unshaded courtyards in hot and humid climates. Build. Environ. 2015, 87, 154–168. [Google Scholar] [CrossRef]
  55. Taleghani, M.; Tenpierik, M.; van den Dobbelsteen, A. Energy performance and thermal comfort of courtyard/atrium dwellings in the Netherlands in the light of climate change. Renew. Energy 2014, 63, 486–497. [Google Scholar] [CrossRef] [Green Version]
  56. Extech, A. 45170: 4-in-1 Environmental Meter Extech Instruments. Extech.com. 2021. Available online: http://www.extech.com/products/45170 (accessed on 3 September 2021).
  57. Khalfan, M.; Sharples, S. Thermal Comfort Analysis for the First Passivhaus Project in QATAR. In Proceedings of the SBE16 Dubai, Dubai, United Arab Emirates, 17–19 January 2016. [Google Scholar]
  58. Feroz, S.M. Achieving Thermal Comfort by Applying Passive Cooling Strategies to Courtyard Houses in Dubai (UAE). Master’s Dissertation, The British University in Dubai (BUiD), Dubai, United Arab Emirates, 2015. [Google Scholar]
  59. Błażejczyk, K.; Jendritzky, G.; Bröde, P.; Fiala, D.; Havenith, G.; Epstein, Y.; Psikuta, A.; Kampmann, B. An introduction to the universal thermal climate index (UTCI). Geogr. Pol. 2013, 86, 5–10. [Google Scholar] [CrossRef] [Green Version]
  60. Manavvi, S.; Rajasekar, E. Estimating outdoor mean radiant temperature in a humid subtropical climate. Build. Environ. 2020, 171, 106658. [Google Scholar] [CrossRef]
  61. Naboni, E.; Meloni, M.; Coccolo, S.; Kaempf, J.; Scartezzini, J.L. An overview of simulation tools for predicting the mean radiant temperature in an outdoor space. Energy Procedia 2017, 122, 1111–1116. [Google Scholar] [CrossRef]
  62. Thapar, H.; Yannas, S. Microclimate and urban form in Dubai. In Proceedings of the PLEA 2008–25th Conference on Passive and Low Energy Architecture, Dublin, Ireland, 22–24 October 2008. [Google Scholar]
  63. Varshney, C.K.; Mitra, I. Importance of hedges in improving urban air quality. Landsc. Urban Plan. 1993, 25, 85–93. [Google Scholar] [CrossRef]
  64. Chen, X.; Wang, X.; Wu, X.; Guo, J.; Zhou, Z. Influence of roadside vegetation barriers on air quality inside urban street canyons. Urban For. Urban Green. 2021, 63, 127219. [Google Scholar] [CrossRef]
  65. Bande, L.; Guerra Cabrera, A.; Marpu, P.; Afshari, A. Urban Smart Shading Devices based on Traditional Gulf Design. In Case Study Located in a District of a Hot-Arid Climate City (Abu Dhabi); IEEE: Piscataway, NJ, USA, 2015; pp. 1–6. [Google Scholar]
  66. Nikiforova, T.; Savytskyi, M.; Limam, K.; Bosschaerts, W.; Belarbi, R. ScienceDirect Methods and results of experimental researches of thermal conductivity of soils. Energy Procedia 2013, 42, 775–783. [Google Scholar] [CrossRef] [Green Version]
  67. Oktay, H.; Argunhan, Z.; Yumrutas, R. An Investigation of the Influence of Thermophysical Properties of Multilayer Walls and Roofs on the Dynamic Thermal Characteristics. Mugla J. Sci. Technol. 2016, 2, 48–54. [Google Scholar] [CrossRef] [Green Version]
  68. Kodesová, R.; Vlasáková, M.; Fér, M.; Teplá, D.; Jakšík, O.; Neuberger, P.; Adamovský, R. Thermal properties of representative soils of the Czech Republic. Soil Water Res. 2013, 8, 141–150. [Google Scholar] [CrossRef] [Green Version]
  69. Kotak, Y.M.S.; Gul, T.M.; Ivanova, S.M. Investigating the Impact of Ground Albedoon the Performance of PV Systems (1), in London: CIBSE Technical Symposium. 2015. Available online: https://www.researchgate.net/publication/275956502_Investigating_the_Impact_of_Ground_Albedo_on_the_Performance_of_PV_Systems/citations (accessed on 21 October 2022).
  70. An, N.; Hemmati, S.; Cui, Y.J. Assessment of the methods for determining net radiation at different time-scales of meteorological variables. J. Rock Mech. Geotech. Eng. 2017, 9, 239–246. [Google Scholar] [CrossRef]
Figure 1. Research methodology outline.
Buildings 12 01811 g001
Figure 2. Two cases, old and new. (a)—Traditional Al Marijah, heart of Sharjah heritage area [42]. (b)—Sharjah, in the United Arab Emirates [42,43]. (c)—The modern Sharqan area [42].
Buildings 12 01811 g002
Figure 3. Climate conditions in the UAE. (a)—Average air temperature [44]. (b)—Wind rose [45].
Buildings 12 01811 g003
Figure 4. New district—Sharqan, Sharjah, UAE [47].
Buildings 12 01811 g004
Figure 5. Old district—Al Marijah, Sharjah, UAE [48].
Buildings 12 01811 g005
Figure 6. Validation of the results of the software. (a) The chosen points for software validation. (b) Extech 45,170 m [56]. (c) The chosen points in the ENVI-met simulation. (d) Graph for both air temperatures: simulated by ENVI-met and measured by Extech 45,170. (e) Scatterplot for average measured and simulated data for the validation.
Buildings 12 01811 g006aBuildings 12 01811 g006b
Figure 7. Potential air temperature in both case studies (old and new) on 21st August.
Buildings 12 01811 g007
Figure 8. The PMV, MRT, humidity, and wind speed for both sites old and new on 21 August at 12:00 pm.
Buildings 12 01811 g008
Figure 9. Average potential air temperature for the base case and the solutions at 12:00 pm on 21st of August at height 1.8 m.
Buildings 12 01811 g009
Figure 10. The PMV, MRT, humidity, and wind for the base new case and the solutions at 12:00 pm on 21st of August at height of 1.8 m.
Buildings 12 01811 g010
Table 1. Some passive design solutions in Al Marijah, old Sharjah.
Traditional Passive Design SolutionsExplanation Image
COURTYARD Courtyards can decrease building temperatures and improve ventilation for the inner spaces via the extra shading and the stack effect [15].Buildings 12 01811 i001
VEGETATION Vegetation can modify thermal conditions through evaporative cooling and low albedo [16]. Buildings 12 01811 i002
SHADING DEVICESShading devices and projected masses help reduce solar gain by increasing the shaded areas [17].Buildings 12 01811 i003
COMPACT URBAN DESIGN A compact urban layout improves thermal comfort outdoors by increasing shade around buildings and in the streets [13]Buildings 12 01811 i004
WIND CATCHERS In comparison to regular windows, wind catchers provide increased passive ventilation, cooling down building interiors on hot summer days, and are more practical and effective [18].Buildings 12 01811 i005
ORIENTATIONBuilding orientation affects the thermal conditions determining the amount of solar gain according to the location and path of the sun [19]. Buildings 12 01811 i006
Table 2. Case study features.
Traditional Old Area
Al Marijah
Modern Area
Sharqan
Aerial viewBuildings 12 01811 i007Buildings 12 01811 i008
Simulation area180 m × 180 m = 32,400 m2180 m × 180 m = 32,400 m2
Top view in ENVI-metBuildings 12 01811 i009Buildings 12 01811 i010
Built-up areaAround 14,000 m2Around 7000 m2
Urban formOrganic Grid
Street geometryNarrow and windingWide and straight
Building heights5 m, 9–12 m5 m, 9 m
Building clustering Attached unitsDetached units
Three-dimensional formBuildings 12 01811 i011Buildings 12 01811 i012
Table 3. Min, max, and average potential air temperatures for both cases old and new on 21st August.
TimeTemperatures °C
Old Area—Al Marijah Modern Area—Sharqan
MinMaxAverage MinMaxAverage
0:0033.4335.2934.36 34.0735.2334.65
1:0033.5235.1334.33 34.1135.0834.6
2:0033.4234.9234.17 33.9834.8534.42
3:0033.2234.6633.94 33.7734.5934.18
4:0032.9634.3933.68 33.4934.3333.91
5:0033.4334.734.07 34.0434.6934.37
6:0033.9435.1934.57 34.6835.2734.98
7:0034.5135.9535.23 35.3636.0735.72
8:0035.7236.836.26 36.336.9436.62
9:0037.1337.737.42 37.2537.8537.55
10:0038.0538.9638.51 38.1438.9338.54
11:0038.140.1639.13 39.0239.9239.47
12:0039.7940.8440.32 39.6941.1840.44
13:0040.064140.53 39.9541.6140.78
14:0040.0440.8640.45 39.9441.840.87
15:0039.840.6440.22 39.7641.6440.7
16:0039.440.2939.85 39.3841.240.29
17:0038.9239.739.31 38.940.4439.67
18:0038.438.8438.62 38.3839.3438.86
19:0037.8938.0837.99 37.8338.1838.01
20:0037.2937.6237.46 37.4337.6337.53
21:0036.8137.2737.04 36.9937.2737.13
22:0036.3336.9336.63 36.5836.9436.76
23:0035.9236.6136.27 36.1836.6136.4
Table 4. The potential air temperature distribution and PMV on both case studies (old and new) at height 1.8 m on 21st of August.
Old Area—Al Marijah Modern Area—Sharqan
Buildings 12 01811 i013
a—Potential air temperature distribution °C
Buildings 12 01811 i014
Buildings 12 01811 i015Buildings 12 01811 i016
b—Histogram for potential air temperature distribution °CBuildings 12 01811 i017Buildings 12 01811 i018
c—PMV
Buildings 12 01811 i019
Buildings 12 01811 i020Buildings 12 01811 i021
d—Histogram for PMVBuildings 12 01811 i022Buildings 12 01811 i023
e—Mean Radiant Temperature (MRT)
Buildings 12 01811 i024
Buildings 12 01811 i025Buildings 12 01811 i026
f—Histogram for MRTBuildings 12 01811 i027Buildings 12 01811 i028
g—Humidity
Buildings 12 01811 i029
Buildings 12 01811 i030Buildings 12 01811 i031
h—Histogram for Humidity Buildings 12 01811 i032Buildings 12 01811 i033
i—Wind speed
Buildings 12 01811 i034
Buildings 12 01811 i035Buildings 12 01811 i036
j—Histogram for wind speed.Buildings 12 01811 i037Buildings 12 01811 i038
Table 6. Average potential air temperature for the base case and the solutions at 12:00 pm on 21st of August at height 1.8 m.
TimeNew Area-Basic1st Solution Hedges2nd Solution Shading Devices
0:0034.6534.6934.61
1:0034.59534.61534.555
2:0034.41534.43534.375
3:0034.1834.1834.13
4:0033.9133.9133.87
5:0034.36534.3934.33
6:0034.97534.98534.935
7:0035.71535.72535.665
8:0036.6236.60536.585
9:0037.5537.5337.53
10:0038.53538.638.52
11:0039.4739.69539.425
12:0040.43540.5940.275
13:0040.7840.7840.49
14:0040.8740.65540.405
15:0040.740.3240.195
16:0040.2939.8639.825
17:0039.6739.2839.3
18:0038.8638.60538.62
19:0038.0053837.975
20:0037.5337.5737.51
21:0037.1337.17537.115
22:0036.7636.80536.74
23:0036.39536.4436.38
Table 7. The potential air temperature distribution and PMV for the base new case and the solutions at 12:00 pm on 21st of August at height of 1.8 m.
Basic Case-New District-Sharqan-SharjahFirst Solution-HedgesSecond Solution-Green Shading Devices
a-Potential Air Temperature distribution °C
Buildings 12 01811 i049
Buildings 12 01811 i050Buildings 12 01811 i051Buildings 12 01811 i052
b-Histogram-
Potential Air Temperature
Buildings 12 01811 i053Buildings 12 01811 i054Buildings 12 01811 i055
c-PMV
Buildings 12 01811 i056
Buildings 12 01811 i057Buildings 12 01811 i058Buildings 12 01811 i059
d-Mean Radiant Temperature-MRT
Buildings 12 01811 i060
Buildings 12 01811 i061Buildings 12 01811 i062Buildings 12 01811 i063
e-Histogram for MRTBuildings 12 01811 i064Buildings 12 01811 i065Buildings 12 01811 i066
f-Humidity
Buildings 12 01811 i067
Buildings 12 01811 i068Buildings 12 01811 i069Buildings 12 01811 i070
g- Histogram for Humidity Buildings 12 01811 i071Buildings 12 01811 i072Buildings 12 01811 i073
h-Wind speed
Buildings 12 01811 i074
Buildings 12 01811 i075Buildings 12 01811 i076Buildings 12 01811 i077
i-Histogram for Wind-speedBuildings 12 01811 i078Buildings 12 01811 i079Buildings 12 01811 i080
Publisher’s Note: MDPI stays neutral with regard to jurisdictional claims in published maps and institutional affiliations.

