Article

Visualization Analysis of Cross Research between Big Data and Construction Industry Based on Knowledge Graph

1
College of Civil Engineering, Henan University of Technology, Zhengzhou 450001, China
2
Henan Key Laboratory of Grain Storage Facility and Safety, Zhengzhou 450001, China
3
Henan International Joint Laboratory of Modern Green Ecological Storage System, Zhengzhou 450001, China
*
Author to whom correspondence should be addressed.
Buildings 2022, 12(11), 1812; https://doi.org/10.3390/buildings12111812
Submission received: 16 September 2022 / Revised: 25 October 2022 / Accepted: 26 October 2022 / Published: 28 October 2022

Abstract

:
Big data technology has triggered a boom in research and applications around the world. The construction industry has ushered in a new technological change in this context. Researchers have conducted in-depth research on the intersection of big data and architecture, but lack quantitative analysis and comprehensive evaluation of the research results. This article draws a series of knowledge maps with the help of the CiteSpace software using the relevant literature in the Web of Science database between 2007 and 2022 as data samples to comprehensively grasp the research development at the intersection of big data and the construction industry. The knowledge base, research hotspots, and domain evolution trends in the intersection of big data and the construction industry are analyzed quantitatively and aided by qualitative analysis through visualization, respectively. The results show that Chinese and American scholars have published more relevant papers in international journals, and some well-known universities in both countries constitute the main group of research institutions. The research hotspots are BIM, data mining, building energy saving, smart cities, and disaster prevention and damage prevention. In the future, the research on the integration and application of the construction industry with emerging technologies, such as big data, BIM, and cloud computing will be connected more closely. This study provides a preliminary overall picture of the research of big data in the field of construction by sorting out and analyzing the existing results.

Graphical Abstract

1. Introduction

The advent of the era of big data is changing the thinking and ways of human life, production, and scientific research [1]. The resulting information technology change has been widely used in agriculture, finance, transportation, manufacturing, construction, and other industries [2]. Governments around the world have implemented policy actions and formulated big data development strategies [3]. The construction industry consists of many fields, such as civil engineering, roads, bridges, and building energy, which generate a large amount of data on drawings, materials, processes, costs, quality, safety, etc., in the planning, design, construction, and operation and maintenance phases. The data involved is extremely extensive and complex, and the collection of all kinds of data makes the construction industry itself a huge data carrier [4]. As one of the traditional industries of the national economy, the traditional development mode of the construction industry relying on a rapid expansion of scale is unsustainable. Due to the influence of the era of big data, it also faces new challenges and opportunities in its development, and it is of great significance to study and promote the high-quality development of the construction industry for both the construction industry and economic development [5]. Through the analysis of big data technology, it can be found that big data technology has the characteristics of convenient and fast data processing, which is especially in line with the development characteristics of modern engineering construction, so the construction field has also set off a research boom for big data [6]. The core value of big data technology lies in mining the potential value of data, which provide real and reliable data basis for building and decision-making by processing data that cannot be used efficiently. In order to quickly analyze, maximize its value, and better promote the development of the construction industry on the basis of ensuring and improving the quality and safety of civil engineering construction [7].
In the current development process of the construction industry, big data technology already shows greater potential for application development, and its specific applications are mainly reflected in the following aspects: The first is to monitor the degree of damage to buildings, where damage detection refers to the detection of the actual damage to buildings under specific circumstances in order to check the damage to buildings after a natural disaster has occurred [8]. In addition, building damage detection data can be integrated to build a database to analyze the damage forms of buildings of different forms, sites, and heights to provide data references for damage detection under similar conditions [9,10], as well as natural disaster prevention using the Internet of Things and big data analysis [11]. Big data technology can also help analyze the energy consumption of buildings and effectively reduce energy and labor consumption [12]. Researchers can analyze office area occupancy data in depth, and use various advanced big data technologies to calculate building occupancy patterns and related schedules [13]. In the construction process, the use of lighting, office equipment, and so on increases the consumption of energy. It is very difficult to carry out statistics and calculations in the way of manpower. Using big data to sort out, calculate, and process data can reduce energy consumption [14]. In addition, some experts have created appropriate energy models based on the energy consumption of energy systems and for predicting future energy consumption to achieve a more accurate grasp of energy consumption by forecasting future electricity consumption in buildings [15]. A lot of data information will also be produced in the field of project cost in engineering construction. In order to give full play to its value, it is necessary to carry out complete and effective collection, classification, and statistical analysis, so as to lay a foundation for the information sharing and integration of big data technology in all aspects of civil engineering cost [16]. Using big data technology to establish an engineering cost database is the first step to enhancing the convenience of data finding and the effectiveness of data management [17]. It is necessary to consider dividing the cost by region as the dividing line to facilitate the staff to understand the material price in time and avoid unnecessary waste of funds in establishing an engineering cost database [18]. Considering the variability of the same material prices between different regions and the market fluctuations, it is necessary to conduct a timely and effective data analysis of engineering cost resources and analyze the trend direction of prices, and predict the engineering cost situation at different stages by comparing current and historical data on the basis of the previous sequence data [19].
In summary, the construction field has also ushered in a new round of technological innovation in the trend of information technology and big data, which has started to widely apply big data technology to the design, construction, decision-making, and management services therein. Therefore, it is of great practical significance to conduct a comprehensive analysis of the application of big data technology in the construction industry. Bilal et al. [4] used a qualitative approach to analyze the current status, opportunities, and future trends of big data in the construction industry. The article highlights that the adoption of big data is still in its infancy and also identifies the pitfalls of big data technologies in the construction industry. This study provides a reference for researchers and practitioners in the construction industry on various big data concepts and terminology. Majdi et al. [20] provided a systematic review of various machine learning techniques used to detect structural damage in civil engineering areas, such as bridges, buildings, dams, tunnels, etc., which helps engineers to make decisions using machine learning and deep learning algorithms in the field of structural health monitoring. Kim et al. [21] reviewed research on the design and implementation of smart building technologies, including energy management systems, renewable energy applications, and current smart technologies used to achieve optimal functionality and performance, reviewing advances in building energy-related technologies. Abioye et al. [5] provided a critical review of the application of artificial intelligence in the building industry. In addition, the opportunities and challenges of AI applications in the construction field are identified. The aforementioned review lacks the use of quantitative methods, it also lacks systematic sorting and bibliometric analysis. Guo et al. [22] analyzed how building safety problems can be solved based on bibliometric methods supported by big data technologies as well as machine learning and face recognition. The combination of bibliometrics and systematic reviews provides an in-depth analysis of the research priorities and future directions of the field and gives scholars a comprehensive understanding of the field. Ashwini et al. [23] presented the main research results of artificial intelligence and image processing in the field of civil engineering based on scientometrics research. This study provides a guide for readers to identify research gaps and use reviews for potential future research. The paper demonstrates that bibliometrics can be used to generate a framework for analysis based on publications, citations, top journals, top institutions, and funding sources. At this stage, the review literature that systematically summarizes research at the intersection of big data and the construction industry is mostly written from a particular perspective. Few scholars have conducted a systematic review and bibliometric analysis of the current state of research and evolutionary trends in this field, and there is a lack of literature that analyzes the current status of research and future research trends in the field through a comprehensive qualitative and quantitative approach. Based on this, the article draws a series of knowledge maps with the help of the CiteSpace software using relevant literature from the Web of Science database between 2007 and 2022 as data samples to provide a preliminary overall picture of big data research in the field of construction. The knowledge base, research hotspots, and domain evolution trends in the intersection of big data and the construction industry are analyzed quantitatively and assisted by qualitative analysis through visualization, respectively. Visualizing the research overview and research dynamics of big data technology in the construction industry provides a valuable reference for a better and faster understanding of the basic overview and research progress at the intersection of big data and construction science.

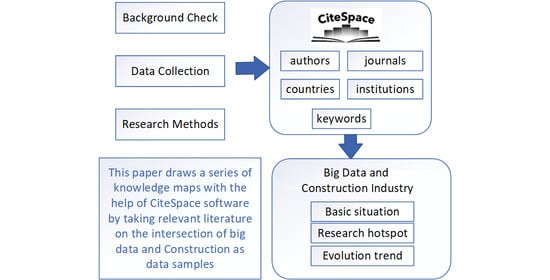
2. Data Collection and Research Methods

Based on bibliometrics and scientific knowledge mapping, this study uses the visualization software CiteSpace to analyze the characteristics, research hotspots, and frontiers of the literature at the intersection of big data and architectural research included in the WOS database.

2.1. Data Collection

CiteSpace was developed based on the data format of WOS. The data downloaded from non-WOS databases needed to be converted into the data format of WOS first. This paper examines the literature related to the intersection of big data and the construction industry, with data sourced from the Web of Science (WOS) database. The Web of Science is the world’s largest comprehensive academic information repository, covering the largest number of disciplines. Using the rich and powerful search function of the Web of Science, you can easily and quickly find valuable scientific information and get a comprehensive understanding of research information about a certain discipline and a certain topic. The impact factor (IF), introduced by the Web of Science, has now become an internationally accepted index for evaluating journals. It is not only a measure of the usefulness and display of a journal but also an important indicator of a journal’s scholarship and even the quality of its papers. To cover the research status at the intersection of big data and the construction industry as comprehensively as possible, a subject search was selected with a cut-off time of 30 June 2022, at 0:00, for the topics “Big Data AND Construction, Civil Engineering, Building Energy, Architecture, Building, Road, Bridge”; a total of 1417 literature data were collected from 1 January 2014 to 30 June 2022, through manual reading and screening. The Web of Science only supports exporting 500 data items at a time currently. We had to select “Save to Other File Formats” in the export ribbon to enter the data export page. We set the relevant parameters on the export page. Then, we selected “Full Record and Cited References” in record content and then selected “Plain Text” in file formats. Then we clicked send to download the first 500 data, and then export the remaining data in the same order as above. All studies in this paper are based on the above data sets. The annual publication volume and annual cumulative publication volume statistics of the intersection of the Web of Science database big data and the construction industry are plotted as shown in Figure 1.

2.2. Research Methods

In the process of literary analysis, knowledge mapping originates from computer graphics, and by integrating cooperation analysis theory and pathfinding network algorithms, modern bibliometrics, and information science, a series of visual maps can be drawn to show the research hotspots, evolutionary trends, and other contents of research topics. It reveals the dynamic development law of the knowledge domain and can quantitatively and visually show the knowledge and the connection between knowledge [24]. The traditional literature analysis method is different from the quantitative literature analysis method using knowledge mapping, which is a qualitative analysis, and is based on a researcher’s subjective reading and summarizing to sort out and judge the literature in a certain research field as a whole [25]. It relies on the researcher’s reading volume and summarizing ability, and is subjective in nature, and it is difficult to grasp the research status comprehensively and accurately from the massive data [26]. With the rise and popularity of internet technology, quantitative analysis represented by knowledge mapping began to be widely used in review research, and the main tools for drawing knowledge maps in academia are CiteSpace, SPSS, VOSviewer, etc. Among them, CiteSpace is a scientific bibliometric visualization and analysis software developed by Prof. Chaomei Chen of Drexel University, based on the Java environment platform, which transforms a large amount of literature into an intuitive knowledge map through the size of nodes, the density of connections and other elements, displays and analyzes, the time zone layout, hot trends, evolutionary trends, and knowledge association status of disciplinary frontiers [27]. Due to its simple operation and clear visualization, this software has attracted widespread attention and applications [28]. We often need to face massive literature in scientific research work. To find out the key literature worthy of intensive reading, we explored the frontiers of the discipline, and found research hotspots that have become the first problems to be solved before carrying out the research. As an excellent bibliometrics software, CiteSpace can visually display the relationship between literature in the form of a scientific knowledge graph in front of the operator. It can not only help us sort out the past research track, but also make us a general understanding of future research prospects. The process of knowledge graph construction is generally divided into nine stages: determining the research topic and related terms, collecting data, extracting research frontier terms, time slicing, threshold selection, network simplification and consolidation, visual display, visual editing and detection, and verification of analysis results. Different maps have different problems and different connotations. A literature co-citation map, and an author co-citation map are used to analyze cited documents (references). An author co-occurrence map, an institution co-occurrence map, a national co-occurrence map, a co-occurrence of feature words, a co-occurrence of keywords, and a co-occurrence of discipline categories were analyzed for cited literature.
After the scientific literature is downloaded and imported into the software, it is processed by algorithms, such as “Pathfinder”, ”Pruning Sliced Networks”, ” and Pruning Sliced Network” to present author publications, institution publications, research hotspots, and evolutionary trend studies in the form of the knowledge graph, and analyze nodes, such as author, institution, and keywords. The resulting visualization map has many nodes. A node represents the object of analysis, and the more frequently it occurs (or is cited), the larger the node. The color and thickness in the inner ring of the node indicate the frequency of occurrence at different time periods. Color changes from cool shades of blue to warm shades of red indicate changes in time from earlier to more recent times. The connection between nodes represents the co-occurrence (or co-citation) relationship, and its thickness represents the intensity of co-occurrence (or co-citation). The software background operation information can be exported from the visual interface, and the frequency and centrality of nodes in the atlas can be obtained. High-frequency nodes represent highly cited nodes, which are the important basis of a certain field. A high centrality node represents a node that forms a co-citation relationship with multiple nodes and has a relationship with multiple nodes. Nodes with both high mediation centrality and high-frequency characteristics are the key nodes in this field, which can be analyzed emphatically.
Based on this, this study uses a combination of quantitative and qualitative methods in general, with an emphasis on the use of quantitative methods. Charts, scientific knowledge mapping, and other methods are used to study and analyze the selected literature data to grasp the current state of research at the intersection of big data and the construction industry. It is also possible to understand the current research hotspots and frontiers, and finally to identify future research directions. The latest version of CiteSpace 6.1.R2 software is used as the visualization tool of the study to draw a series of relevant knowledge maps. Firstly, CiteSpace is used to analyze authors, institutions, countries, and journals for common words to understand the research overview and research dynamics of big data technology in the field of architecture. CiteSpace is then used to analyze the literature and cluster analysis to analyze the research hotspots, frontiers, and trends in the field, then the representative literature is then studied based on the above results, and future research directions are proposed after a comprehensive analysis of all the results. This study systematically reviews a large number of research results from 2014 to 2022 and explores the research trends at the intersection of big data and the construction industry in the past 8 years.

3. Results and Discussions

Based on the data collection in the previous chapter, this chapter constructs a knowledge graph with the help of the CiteSpace software to visualize and analyze the research authors, countries, issuing institutions, journals, research hotspots, and core keywords to understand the development status of research in this field.

3.1. Analysis of Journal Co-Citation Network

Journal co-citation mapping is based on the cited literature publishing journals being cited by the cited literature at the same time, and two papers from two journals being considered by one piece of literature at the same time are considered as one co-citation. The co-citation network of journals can be plotted by CiteSpace. To achieve this, set the value of “Year Per Slice” to one, which represents a time partition of 1 year, and set the node type to Cited Journal. The final knowledge graph of co-cited journals at the intersection of big data and the construction industry was generated after the graph adjustment, as shown in Figure 2, which includes 566 nodes and 3600 connecting lines, and the node size represents the frequency of journal cooperation. The distribution pattern of co-cited journals can be comprehensively reflected by querying relevant information in the background of the chart and summarizing the top 15 cited journals and their centrality, as shown in Table 1.
Figure 2 shows the results of the co-citation analysis of journals published in the literature related to the intersection of big data and the construction industry. The analysis of the citation frequency and centrality of journals provides a visual indication of the level of influence of each journal publication. The top three journals with the highest citation frequency from Table 1 are Automation in Construction, Energy, and Buildings, and Renewable and Sustainable Energy Reviews, with citation frequencies of 231, 230, and 214, respectively. It shows that these three journals are the main publications at the intersection of big data and the construction industry, which are important windows to explore the research progress and development trends in the field, as well as the key focus for understanding the latest research developments in the field in future studies. Centrality is a measure of the importance of nodes in the network by which the importance of journals can be found and measured [29]. Journal of Cleaner Production, Computer-Aided Civil and Infrastructure Engineering, and Journal of Computing in Civil Engineering are the top three journals in centrality. It can be found that citation frequency, as well as centrality, are not directly proportional by comparing journal frequency with centrality ranking and that even if a journal has a high citation frequency, it does not necessarily indicate that the journal is influential. This result indicates that many journals have established co-citation networks through the Journal of Cleaner Production, not only with high citation frequency but also with high centrality. Journal of Cleaner Production is an interdisciplinary international forum for the exchange of information and research on concepts, policies, and technologies to help ensure the sustainable development of societies and regions, and it aims to encourage innovation and creativity in new and improved products. Computer-Aided Civil and Infrastructure Engineering and the Journal of Computing in Civil Engineering are not at the top of the list in terms of citation frequency, but they rank 2nd and 3rd in centrality among all journals, and the importance and authority of these two journals in research at the intersection of big data and the construction industry cannot be overstated. Computer-Aided Civil and Infrastructure Engineering publishes articles on bridges, buildings, the environment, highways, geotechnical, structures, transportation, and management of infrastructure systems. The journal covers areas, such as artificial intelligence, cognitive modeling, internet-based technologies, virtual reality, and visualization techniques, and it is the top journal in interdisciplinary applications in computing. Journal of Computing in Civil Engineering publishes research, implementations, and applications in interdisciplinary areas, such as new programming languages, database management systems, computer-aided design systems, and expert systems for robotics, data mining, and strategic issues, such as computational resources management, implementation strategies, and organization. The above results can guide researchers to quickly find journals that are suitable for publications related to the intersection of big data and the construction industry.

3.2. Analysis of Author Cooperation Network

Identifying the core figures and research teams in the field and presenting the collaborative relationships between different researchers can be performed by analyzing the authors of the publications and their collaborative networks [30]. The author’s co-occurrence map is drawn according to the author’s cooperation in the cited literature. The occurrence of two authors in the same article is regarded as cooperation, which is mainly based on the author co-occurrence frequency matrix. By clicking on the “Author” function in CiteSpace, a network co-occurrence analysis of posting authors is performed based on the CiteSpace visualization tool, and each node in the figure represents each posting author. The size of the nodes indicates the number of articles published by the authors, with larger nodes indicating more articles published by the authors and vice versa. The lines between the nodes represent the cooperation status among the cited authors in the same literature. It means that there is cooperation between authors if there is a link between nodes and vice versa. The collaborative network knowledge graph of authors posting in the intersection of big data and construction industry research literature is shown in Figure 3, with the number of co-occurring nodes being 560, the number of connections being 3599, and the network density being 0.023. The top 20 authors posting according to the final CiteSpace algorithm are listed in Table 2.
As can be seen from Table 2, the most prolific author is Bilal M from the University of West England, whose main research direction is engineering project management and risk assessment, etc. Oyedele LO’s research direction is consistent with Bilal M’s, also from the University of West England, and the next in the number of publications is Liu Y from Peking University, whose main research direction is the application of multisource big data in urban construction, etc. In terms of the influence of scholars, scholars with prominent centrality are indicated with circles in Figure 3, and larger circles indicate larger values of centrality. Combining the top ten authors in terms of the number of publications, we can find that Bilal M, Oyedele LO, and Liu Y are all central scholars in cross-disciplinary fields. Authors with a high number of publications are not necessarily scholars with high centrality. Only when nodes are both high-frequency and high-centered does it mean that they are leading scholars who have had a fundamental impact on the development and evolution of research and whose work deserves more attention. We can determine the strength of representative scholars and core research teams in cross-cutting areas by analyzing the authors’ collaborative networks. Figure 3 shows that researchers with more publications are closely connected and form their clustering groups, such as Wang from the University of Hong Kong and Li, Liu, and Zhang they form a tightly connected network. Additionally, the 11 authors led by Bilal formed a much larger network, which included Oyedele, Alaka, and Owolabi in the top 10 postings. In general, the intersection of big data and the construction industry has matured initially and formed a good scale of author clustering, which has provided more contributions to the research at the intersection. The fragmented scholars should cooperate and communicate more with other scholars to improve and work together for the long-term development of the intersection of big data and the construction industry.

3.3. Analysis of Country Cooperation Network

The national co-occurrence map is drawn according to the cooperation between countries in the cited literature. It is regarded as cooperation if two authors’ countries appear in the same article. By clicking on the “Country” function in CiteSpace, a network co-occurrence analysis of the posting country is performed based on the CiteSpace visualization tool. The cooperation network knowledge map of authors who publish research literature on the intersection of big data and the construction industry is shown in Figure 4; the total number of nodes present in the figure is 83, the number of connections is 427, and the network density is 0.125. The top 20 countries with the number of publications are listed according to the final CiteSpace algorithm in Table 3.
From Table 3, the five countries with the highest number of articles were China, the United States, the United Kingdom, Australia, and Korea, with 428, 398, 184, 81, and 72 articles, respectively. The number of publications alone is a relatively one-sided way of determining the degree of development of each country at the intersection of big data and the construction industry. Therefore, the countries with high research impact at the intersection of big data and the construction industry are China, the United States, and Canada, as can be seen by comparing Figure 4 and Table 3. China and the United States have the closest collaborative exchanges with other countries and are the most active in conducting research, as they lead in both frequency of publication and centrality indicators. They play an important role in international collaborative research, which coincides with the international influence of both countries. Canada also has a significant presence at the intersection of big data and the construction industry as it ranks 3rd in centrality despite having fewer publications. The UK and Australia ranked 3rd and 4th in terms of the number of articles issued, but they were slightly behind Canada in terms of centrality. The UK and Australia still need to strengthen ties and cooperation with other countries to improve relevant technologies and increase international influence. Norway and Poland are also at the forefront of the world’s development at the intersection of big data and the construction industry, but there is still room for growth. This is because they have fewer publications but are at the top of the list in terms of centrality.

3.4. Analysis of Institutional Cooperation Network

The analysis of research institutions and their collaborative networks provides some indication of the core institutions and the strength of their collaboration in a given research area, as well as an understanding of the academic status of each research institution in the field [31]. The co-occurrence map of institutions is drawn according to the cooperation of institutions in the cited literature. The occurrence of two author institutions in the same article is regarded as cooperation. The network cooperation analysis of graduate schools and institutions can be performed by clicking on the “Institution” function in CiteSpace. The collaborative network knowledge graph of research literature publishers at the intersection of big data and the construction industry is shown in Figure 5, with the number of co-occurring nodes being 628, the number of connections being 1142, the network density being 0.0058, and n in top-n is set to 60. It means that the 60 most frequently cited documents are extracted in each time slice. Table 4 shows the top 20 institutions in terms of the number of publications.
The figure shows that a mature cooperation network has been formed among international research institutions, and the number of connected lines shows that international research at the intersection of big data and architecture has a large cooperation relationship, a rich theoretical foundation, and sufficient follow-up momentum. The top five publications are the Chinese Academy of Sciences (36), Tsinghua University (30), Wuhan University (30), Beijing Jiaotong University (27), and Southeast University China (26). The top five institutions in terms of centrality are Hong Kong Polytechnic University (0.14), Tsinghua University (0.13), the University of California System (0.12), the Chinese Academy of Sciences (0.09), and the University of California Berkeley (0.08). Among them, the Chinese Academy of Sciences and Tsinghua University ranked top in terms of publication volume and centrality, which proved that these three institutions have high influence at the intersection of big data and the construction industry, and they strongly promoted the research development at the intersection of big data and construction industry. Further analysis shows that the cooperation network lacks cooperation between universities and research institutions, such as enterprises and graduate schools (institutes), and the cooperation is only limited within countries and it lacks cooperation between institutions in different countries. Cooperation among countries and various types of institutions should be strengthened, and their cooperation will enable researchers in each institution to understand practical needs and inspire researchers to develop new research directions.

3.5. Analysis of Hot Research Topics

Keywords are highly relevant to the research topic of the paper, which reflects the research subject and direction of the literature, and plays a crucial role in revealing the development of the research topic [32]. High-frequency keywords reflect the hotspots of relevant research, research trends, and the relevant structure of knowledge in a specific time period, and the research hotspots and development trends of a subject area can be identified based on the high-frequency keywords [33]. Keyword co-occurrence mapping is based on the co-occurrence of keywords in the cited literature, and two keywords appearing in the same literature are considered one collaboration. The main research content and core ideas in the research field can be found by building a common word network, and clicking the “Keyword” function in CiteSpace software can draw a map of research hotspots at the intersection of big data and the construction industry, as shown in Figure 6. Each node in the knowledge graph represents a research hotspot, and the size of the node represents the degree of the hotspot. The relationship between different keywords is indicated by node linkage, and the number of co-occurrence nodes is 565, the number of linkages is 2488, and the network density is 0.0017.
It can be seen from the keyword knowledge graph: the number of nodes and connected lines is high, indicating that the intersection of big data and building science has become increasingly mature in the last decade. The research scope and research areas are also becoming more and more extensive, and there is relatively more cross-research between the fields. The number of keywords with a frequency of one was counted as 126 using CiteSpace software, the keyword critical value model derived from Zipf’s law according to Dono-hue [24], T   = 1 + 1 + 8 T 1 / 2 (T1 indicates the number of keywords with a word frequency of one), and T = 15.35 was calculated. The high-frequency words with a frequency greater than or equal to 16 times were screened, and the words, such as “big data (410 times)”, “construction”, and some other words that were not strongly targeted were removed. The finalized high-frequency words are “model”, “system”, “smart city”, “management”, and “neural network”. These keywords represent the research hotspots in the intersection of big data and building science, which means that the research at the intersection is mainly focused on the above five topics. The frequency of the “system” in the literature is 50, which is the most frequently co-occurrence term. The cooperation frequency of “model” and “management” are 47 and 35 respectively, ranking second and third. Among them, “system” and “model” have the highest centrality. It can be inferred that the research on cross-cutting areas is mainly focused on architectural modeling and engineering management. After reading the literature, we found that the research hotspots at the intersection of big data and the construction industry are as follows:
  • Smart city: The core of the smart city is to fully apply the new generation of information technology in all walks of life in the city, to realize the deep integration of informatization, industrialization, and urbanization, and the high integration of informatization and urbanization, which can help alleviate the “big city disease”, improve the quality of urbanization, realize fine and dynamic management, and enhance the effectiveness of urban management and improve the quality of life of citizens [34]. IBM officially puts forward the vision of a “Smart City”, hoping to contribute to the world’s urban development in 2010 [35]. The smart city is an advanced stage of urban information development and urban governance. As stated by Lin et al. [36] firstly, the evaluation index system of smart city construction readiness is established through literature research and expert interviews. Secondly, the CRITIC and G1 methods are used to determine the subjective and objective weights of the indicators and carry out the combined design. Thirdly, the Bonferroni operator is used to establish the evaluation model of smart city construction readiness, and the final evaluation value of the scheme is calculated and ranked. Finally, the smart city list of 30 cities in China is taken as the empirical research object to provide a decision-making reference for measuring the readiness of smart city construction. From the perspective of technology development, smart city construction requires the application of a new generation of information technology, such as the Internet of Things and cloud computing, represented by mobile technology, to realize comprehensive sensing, analysis, and integration of all key information in the core system of urban operation, to make intelligent responses to various needs, including people’s livelihood, environmental protection, public safety, urban services, industrial and commercial activities, and to create a better urban life for human beings [37]. Numerous scholars internationally have used sensing data, video data, and big data analytics from IoT technologies to comprehensively sense, and correlate key information to support urban management and urban policies [38], modernize urban green transportation [39], intelligently manage human activity information in cities, and remove data and technical barriers between different smart city systems [40].
  • Model: Emerging building information modeling tools and technologies are designed to share and transfer data and information-based models of buildings through the entire lifecycle process of project planning, operation, and maintenance, enabling engineers and technicians to possess correct understanding and efficient responses to various building information. It can also provide a basis for collaborative work among design teams and various construction entities, including construction and operation units, and can play an important role in improving productivity, saving costs, and shortening schedules. It can be applied not only in design but also in the whole lifecycle of construction projects [41]. The database of BIM is dynamically changing, constantly being updated, changed, and enriched during the application process. Standardized building components and systems change the way information about the built environment is created, stored, and exchanged [42]. Building information modeling (BIM) is seen as an indispensable opportunity for building, engineering, and the construction (AEC) industry and is a revolutionary technology and process. Lin et al. [43] first proposed a new BIM system model to solve the information security problem in mobile cloud architecture. The proposed bcBIM model can guide the architecture design of further BIM information management systems, especially the BIM cloud as a service for further big data sharing. In addition to allowing not only the understanding of large amounts of data through advanced statistical and visualization methods but also the development of predictive models, and analysis of the full lifecycle of building data. It can also analyze the whole lifecycle of construction data by developing predictive models and sorting out the level of data collection, analysis, discovery, and application. The use of big data technology can guide urban planning, construction, management, operation, and decision support [44], which can serve as the initial stage of big data analysis in the building sector in academia and industry.
  • Neural network: The construction industry is one of the largest data industries and one of the less data-driven industries. With the advent of the era of big data, there is an effective way to handle huge data in the construction industry [45]. The use of big data technology can quickly analyze the depth of value in a large amount of data information, and applying it to the intelligent building is conducive to designing and improving the energy-saving process of the building in the optimization of the building structure [46]. Neural networks can learn and build models of complex nonlinear relationships, it can also predict unknown data by inferring unknown relationships between unknown data [47]. Currently, the construction industry has begun to process large amounts of data and extract its value, and the difficulty of sharing data among business information systems has led to the inability to integrate resources that would help in making the decision [48]. International scholars use neural networks in construction to overcome such drawbacks, integrate databases and information sources from suppliers, optimize off-site construction [49], and accurately and reliably identify equipment activities [50]. Improving the overall capability of construction organization and management [51] provides a theoretical basis for achieving data sharing and interoperability between companies and projects [52].
  • Management: In the context of big data, there is a huge change in the management mode aspect of construction projects, which has been transformed and developed from the traditional engineering management approach to an information management approach. The construction industry generates data beyond the existing data management and analysis capabilities within the industry from the start of a project to its delivery [4], and big data technologies can be used to process massive amounts of data by using advanced statistical and visualization methods to inform future decisions [16]. In the process of construction management of engineering buildings nowadays, the requirements for technical understanding are getting higher and higher, and the number of information technologies used by construction units is rising. Widely used technologies include Internet of Things technology, cloud computing technology, and mass storage technology. Using these advanced technologies, staff can be more efficient in construction management [53]. Engineering managers can use big data technology, 5G technology, and Internet of Things technology to create a quality management platform for engineering projects, which can promote the goal of real-time sharing of construction information and enable the participating units to participate in quality management of the project. It is conducive to improving the overall construction quality of the building project [54]. Engineering managers can also use big data mining techniques [55] able to check and analyze the possible quality problems at the construction site building engineering early. The implementation of dynamic management of the whole process of construction projects can optimize the handling of important factors affecting the quality of engineering construction [56]. In the process of construction project quality management, cost management, safety management, project construction quality management, and construction progress management should be carried out for the whole construction project based on big data mining technology to improve the analysis and decision-making work [57].
  • System: In recent years, the development of computer technology and network communication technology has made society highly informative, and the application of information technology and construction technology inside buildings has resulted in a new industry of “building intelligence” [51]. Building intelligent system refers to the building as a platform, and also has three major systems of building equipment, office automation, and communication networks. It integrates structure, systems, services, management, and the optimal combination among them to provide people with a safe, efficient, comfortable, and convenient built environment [58]. Building an intelligent system uses modern communication technology, information technology, computer network technology, monitoring technology, etc., to realize intelligent control and management of buildings through automatic detection, optimal control of buildings, building equipment, and optimal management of information resources, to meet the needs of users for monitoring, management, and information sharing of buildings, thus, making intelligent buildings safe, comfortable, efficient and environmentally friendly, and achieving the goal of reasonable investment and adapting to the needs of the information society [21]. Big data technologies can also guide intelligent prevention by building intelligent information security collaboration systems [59], intelligent disaster warning systems [60], and intelligent traffic coordination systems based on road sensors [61]. Established reliable data-sharing mechanisms protect personal privacy and data security, manage large amounts of data from various sources, and provide guidance for smart prevention [62].

3.6. Analysis of Frontiers Trending

Cluster analysis is a common technique for statistical data analysis and knowledge discovery to identify topics hidden in text data. Based on the relevance of terms, cluster analysis can classify a large number of keywords into several research topics and place the keywords into related topics, which helps to identify research themes, trends, and their interconnections within the research field [28]. The keyword cooperation network was clustered by extracting information tags from keywords. Ten co-leading clusters were identified through screening and deletion, and the keywords implied in each cluster were obtained by using the “Cluster Explorer” function item as shown in Table 5. The evolutionary trend can be analyzed by plotting the cooperation network clustering timeline with CiteSpace software, and the evolutionary trend can be clearly analyzed according to the display of keywords in the plot in different periods. The cooperation network clustering timeline is plotted using “timeline”, as shown in Figure 7. The size of each node represents its frequency, and each node is composed of a circle of the annual cycle. The color of each annual cycle indicates the time of the keyword’s appearance, and the color of the connecting line between the keywords means that the time of their cooperation is gradually increasing from cool to warm color over time.
Figure 7 shows the timepoints at which important results appear in each cluster. For example, Cluster 0 represents a domain that ranges from 2014 to 2020 and contains keywords, such as big data and smart building. Cluster 1 represents a domain that ranges from 2016 to 2020 and contains keywords, such as Internet of Things, BIM, informatization, and cloud computing, and Internet+. Cluster 2 represents domains that range from 2016 to 2020 and contains keywords, such as urban design, digitalization, and building function identification. Among them, there are a series of important milestones between 2016 and 2019, where the application of IoT and AI in the construction industry has developed leaps and bounds. Overall, the development of the field has continuously transitioned from theoretical research to applied research. Based on the chronological combing of key nodes the literature analysis concludes that the evolution of the intersection of big data and the construction industry research can be divided into three stages: exploration period, primary application period, and integrated application period.
The exploration period (#0, #1, #2, and #5) focuses on data collection and management, and the main research directions are concentrated on building information modeling, system framework, big data analysis, and smart city. The proposed building information modeling technology provides a new means to predict, manage, and monitor the environment for project construction and development. Lin et al. [63] proposed an intelligent data retrieval and representation method for cloud BIM applications based on natural language processing, which establishes the relationship between user requirements and relevant data users. It can automatically retrieve and aggregate user-related data, presenting the data in an appropriate form for easy visualization and comprehensive reporting. Wong et al. [64] provided insights into the shortcomings of the existing BIM literature and outlined the most important directions for future research. They suggested that the use of BIM for environmental sustainability monitoring and management throughout the building lifecycle should be considered in future research. In addition, there is a need to utilize cloud-based BIM technology and big data for building sustainability management. In the context of building smart cities. Rathore et al. [36] used big data analysis, computer networks, and big data for IoT-based urban planning and smart city construction. Bellini et al. [61] used reconciliation systems to manage various data sources to provide big data architecture and mechanisms for data validation for smart cities. Chen et al. [65] showed how future smart cities can use wireless networks covering urban areas to build environmental monitoring systems.
The research applications in the primary application period (#3, #5, #7, #8, and #9) focused on the construction phase, with literature published on five main topics, namely construction waste, data analysis, system framework, digital twin, and smart construction. Chen et al. [66] used a large dataset recently obtained in Hong Kong as a result of construction waste management measures to identify factors that influence construction waste. The analysis of big data suggests that public policymakers can develop more targeted regulations that place greater emphasis on location, use, and public-private nature, which are more likely to reduce demolition waste. Wang et al. [42] proposed a conceptual framework to assess the lifecycle of carbon emissions of building demolition waste to inform future building demolition waste recycling efforts. While the procedural, technical, and data models of building information models enable standardized semantic representations of building components and systems, the concept of the digital twin conveys a more comprehensive sociotechnical and process-oriented character to the complex artifacts involved by leveraging the synchronization of cyber and physical bidirectional data flows. Boje et al. [67] reviewed the various applications of BIM in the construction phase, highlighting its limitations and requirements, paving the way for the introduction of the “digital twin of construction” concept, while detailing areas for future research. Rasheed et al. [68] provided an overview of recent advances in methods and techniques related to digital twin construction from a modeling perspective, providing detailed coverage of current challenges and implementation techniques for different stakeholders. Big data analytics is an operational excellence approach to improving the performance of sustainable supply chains. Chen et al. [43] used a big data analytics framework to retrieve the required information for environmental sustainability monitoring and management throughout the building lifecycle.
The main research directions in the integrated application period (#4 and #6) focus on data mining, blockchain, and deep learning. The development of information technology has made it possible to monitor building operations in real-time. A large amount of building operation data is being collected, and advanced data analysis techniques are urgently needed to fully utilize the potential of building big data in improving building energy efficiency. Miller et al. [69] reviewed the literature including unsupervised machine learning techniques applied to nonresidential building performance control and analysis. Amasyali et al. [15] reviewed the research on the development of data-driven building energy prediction models using machine learning methods, based on which, existing research gaps and future research dilemmas are identified. As a key technology for the fourth industrial revolution, blockchain, and digital twins have great potential to facilitate collaboration, data sharing, efficiency, and sustainability in the construction industry. Blockchain can improve data integrity throughout the lifecycle of a project. Perera et al. [70] critically analyzed the potential of blockchain applications in construction through a literature review. Deep learning has become an important research topic in the field of artificial intelligence. Compared with traditional machine learning methods, deep learning algorithms have powerful features for learning and representation capabilities and they are increasingly used in our life. In the field of geotechnical engineering, deep learning has been widely used in various research topics. Zhang et al. [71] provided a comprehensive summary of published literature employing deep learning algorithms and related geotechnical engineering topics. They finally provided an outlook on the challenges and prospects for the development of geotechnical digitization techniques. Building energy consumption prediction is fundamental to building planning, management, and energy efficiency, and deep learning neural networks have recently demonstrated the ability to predict traffic flow by using big data. Wu et al. [72] proposed a neural network-based traffic flow prediction model by mining the spatial features of traffic flow using convolutional neural networks and the temporal features of traffic flow using recurrent neural networks.

3.7. Discussion

This paper uses the CiteSpace software to conduct quantitative analysis and assist qualitative analysis at the intersection of big data and the construction industry by visualizing the relevant literature from the Web of Science database between 2007 and 2022 as data samples. It provides a valuable reference for a better and faster understanding of the basic overview and research progress at the intersection of big data and construction science. The research conclusions and recommendations suggested through the analysis of the knowledge graph and the reading of the classical literature generated by the software are as follows.
  • From the basic situation of research, the research at the intersection of big data and building science has been preliminarily mature. In the future, the cooperation between academic teams should be strengthened to deepen communication and exchanges, and the cooperation between universities, enterprises, research institutes, and other research institutions should be strengthened to jointly commit to the long-term development of the cross-field between big data and the construction industry. From the perspective of research hotspots, the vigorous development of digital technology in the field of engineering construction represented by BIM technology brings new opportunities for the design, construction, operation, and maintenance technology improvement of large-scale construction projects. The arrival of the era of big data has brought opportunities and challenges to the development of cities. The development of smart cities can effectively relieve the severe housing pressure, and also greatly relieve the pressure on energy and resources. Under the background of the continuous development and application of the Internet of Things technology, sensors have more and more applications in civil engineering, and the frequency of data collection is getting higher and higher, which has a good role in promoting the innovation and development of civil engineering technology. The use of big data technology to explore basic laws has become an inevitable trend in the current civil engineering construction and development process, and big data technology has gradually become a supporting technology in the field of civil engineering. Engineers can have a more scientific and reasonable basis through the use of these laws in the construction, maintenance, and management of civil engineering. From the perspective of evolutionary trends, the development of the construction industry is closely related to the development of science and technology. The progress of computer and intelligent technology promotes the development of the construction industry in the direction of recycling, green, sustainable, and intelligent. In the future, the construction industry will be inseparable from the research and application of big data, BIM, the Internet of things, cloud technology, and other emerging technologies, and is committed to the realization of smart cities and green and sustainable buildings. With the rapid development of the social economy and the continuous improvement of people’s living standards, people have higher comprehensive requirements for architecture and new demands for architectural connotations. The reasonable choice of building address, layout, and style will also be an important development direction for the future construction industry.
  • Access to classic literature at the intersection of big data and architecture by querying software backend information. It can be found by reading that big data technology, with its convenient and fast data processing, is particularly in line with the development characteristics of modern civil engineering construction. The construction process of the actual projects of civil engineering, bridges, and tunnels, contains very complicated and diverse content, and the application objects actually targeted by the work stages in different periods are very different. For this, the engineering project can be divided into several stages of work, and the multiple stages mainly include the design stage, construction stage, operation stage, etc. In the whole process, it is necessary to increase the strength of big data applications and give full play to their advantages [73]. In the design phase, where the initial planning of the project directly affects the subsequent structure and function, the application of big data technology to the project will help develop more efficient design models that allow designers to understand various information such as scale, function, and cost [74]. On top of that, big data technologies can also be used to collect and process information similar to civil engineering, identify similarities with civil engineering, and serve as an important guide to optimizing design [75]. The design of artificial intelligence-assisted civil engineering is currently in its infancy, but it has shown great promise. Many details must be paid attention to during the construction phase, and improper control can cause many problems and affect the normal operation of the building. Using the current stage of large-scale data processing technology, construction problems can be avoided and the quality and reliability of construction operations can be improved [76]. Using big data technology to collect information on civil construction problems classifies construction problems and identifies their causes. It helps to take preventive measures based on the actual situation at the construction site to prevent construction problems and ensure that civil construction continues to proceed smoothly as planned [77]. In the construction process, the application of big data technology can be combined with the current investment situation to collect and analyze the supporting conditions of the project and pre-select various construction sites to ensure the rationality of the later construction, which can better improve the construction efficiency and safety of the building [78]. Compared with other stages, the operation and maintenance stage is easier to obtain data information, and the amount of data is relatively large. Therefore, the relevant decisions to be implemented in this part of the work are more diverse [79]. Therefore, importance can be attached to the value of big data technology in this phase of work, such as the use of drones, computer vision, deep learning, and other technologies to complete this phase of work, so as to better exploit the potential of big data and provide reliable scientific data support for the operation and maintenance of buildings.
  • Through the above analysis, we can clarify that the considerations of big data technology in civil engineering mainly contain the following points. Firstly, the data source is the basis of data analysis in the engineering of applying big data technology, which appears to be extremely important in the whole technical application. The location of the sensors needs to be reasonably analyzed to determine the number and location of sensors to better obtain accurate data sources. Because the data source of the construction project mainly comes from the sensor and photographic image acquisition. Similarly, it is necessary to focus on data transmission, analysis, feature extraction, and other issues to improve the effectiveness of data sources when using image equipment for image acquisition of buildings. Secondly, the amount of data to be analyzed needs to be chosen reasonably. As the research becomes more and more extensive over time, the amount of data will continue to accumulate, and too much data accumulation will cause difficulties in analysis. Therefore, it is necessary to continuously try and figure out the size of the data source according to the measurement data, and find the size of data applicable to the project, so as to guarantee the speed and convenience of data analysis. Finally, a reasonable data analysis method should be used. There are various data analysis methods in big data technology, but different analysis methods produce different results in terms of accuracy and time spent. We need to analyze the rationality of the chosen method and compare different analysis methods to select the most appropriate data analysis approach or to improve the analysis methods for certain data when using data analysis methods.

4. Conclusions

In summary, the application value of big data and building science as an emerging interdisciplinary discipline has been recognized by the construction industry. Scholars should try more interdisciplinary cooperative research in subsequent research work, to further promote the development of intersectional research between big data and construction science. This study visualizes the research overview and research dynamics of big data technology in the construction industry by sorting out and analyzing existing results. It provides an initial overview of big data research in the construction field and helps scholars broaden their research horizons. It provides a valuable reference for a better and faster understanding of the basic overview and research progress in the intersection of big data and building science. There are also limitations in this study. The choice of the search strategy and manual screening limits the collection of literature and affect the accuracy of the scientometric and thematic analysis to some extent. Due to the limitations of the data format of the CiteSpace software, which resulted in a small amount of literature data not being identified during the run. A more in-depth content interpretation and analysis based on these limitations are recommended for future studies.

Author Contributions

Conceptualization, G.C.; Methodology, J.H.; Software, J.H.; Validation, C.L.; Formal Analysis, G.C. and K.H.; Investigation, C.L.; Resources, J.W.; Data Curation, J.H.; Writing—Original Draft Preparation, J.H.; Writing—Review and Editing, G.C., K.H. and J.W.; Visualization, J.H.; Project Administration, G.C.; Funding Acquisition, G.C. and J.W. All authors have read and agreed to the published version of the manuscript.

Funding

This research was funded by the BIM Technology Consulting and Site Service of No. 1 Hospital of Qinghua City (Grant No. 182107000007), the Development of Intelligent Pre-Assembly Plant (Grant No. 51001610), and the Innovative Funds Plan of Henan University of Technology (Grant No. 2020ZKCJ05).

Institutional Review Board Statement

Not applicable.

Informed Consent Statement

Not applicable.

Data Availability Statement

Not applicable.

Conflicts of Interest

The authors declare no conflict of interest.

References

  1. Hariri, R.H.; Fredericks, E.M.; Bowers, K.M. Uncertainty in big data analytics: Survey, opportunities, and challenges. J. Big. Data 2019, 6, 44. [Google Scholar] [CrossRef] [Green Version]
  2. Wang, X.D.; Zhu, X.Q.; Wu, G.Q.; Ding, W. Data Mining with big data. IEEE Trans. Knowl. Data Eng. 2014, 26, 97–107. [Google Scholar]
  3. Song, I.Y.; Zhu, Y. Big data and data science: What should we teach? Expert Syst. 2016, 33, 364–373. [Google Scholar] [CrossRef]
  4. Bilal, M.; Oyedele, L.O.; Qadir, J.; Munir, K.; Ajayi, S.O.; Akinade, O.O.; Owolabi, H.A.; Alaka, H.A.; Pasha, M. Big Data in the construction industry: A review of present status, opportunities, and future trends. Adv. Eng. Inf. 2016, 30, 500–521. [Google Scholar] [CrossRef]
  5. Abioye, S.O.; Oyedele, L.O.; Akanbi, L.; Ajayi, A.; Delgado, J.M.D.; Bilal, M.; Akinade, O.O.; Ahmed, A. Artificial intelligence in the construction industry: A review of present status, opportunities and future challenges. J. Build. Eng. 2021, 44, 103299. [Google Scholar]
  6. Abdelrahman, M.M.; Zhan, S.; Miller, C.; Chong, A. Data science for building energy efficiency: A comprehensive text-mining driven review of scientific literature. Energy Build. 2021, 242, 110885. [Google Scholar] [CrossRef]
  7. Srivastava, A.; Jawaid, S.; Singh, R.; Gehlot, A.; Akram, S.V.; Priyadarshi, N.; Khan, B.; Liu, H. Imperative Role of Technology Intervention and Implementation for Automation in the Construction Industry. Adv. Civ. Eng. 2022, 2022, 6716987. [Google Scholar]
  8. Nsengiyumva, W.; Zhong, S.; Luo, M.; Zhang, Q.; Lin, J. Critical insights into the state-of-the-art NDE data fusion techniques for the inspection of structural systems. Struct. Control Health Monit. 2021, 29, e2857. [Google Scholar]
  9. Zhu, S.; Li, D.; Feng, H.; Gu, T.; Hewage, K.; Sadiq, R. Smart city and resilient city: Differences and connections. WIREs Data Min. Knowl. Discov. 2020, 10, e1388. [Google Scholar]
  10. Lee, P.N.; Fry, J.S.; Forey, B.A. A review of the evidence on smoking bans and incidence of heart disease. Regul. Toxicol. Pharmacol. 2014, 70, 7–23. [Google Scholar] [CrossRef] [PubMed]
  11. Azmoon, B.; Biniyaz, A.; Liu, Z.; Sun, Y. Image-Data-Driven Slope Stability Analysis for Preventing Landslides Using Deep Learning. IEEE Access 2021, 9, 150623–150636. [Google Scholar] [CrossRef]
  12. Aguilar, J.; Garces-Jimenez, A.; R-Moreno, M.D.; Garcia, R. A systematic literature review on the use of artificial intelligence in energy self-management in smart buildings. Renew. Sustain. Energy Rev. 2021, 151, 111530. [Google Scholar] [CrossRef]
  13. Erkoreka, A.; Garcia, E.; Martin, K.; Teres-Zubiaga, J.; Del Portillo, L. In-use office building energy characterization through basic monitoring and modelling. Energy Build. 2016, 119, 256–266. [Google Scholar] [CrossRef]
  14. Zekic-Susac, M.; Has, A.; Knezevic, M. Predicting energy cost of public buildings by artificial neural networks, CART, and random forest. Neurocomputing 2021, 439, 223–233. [Google Scholar] [CrossRef]
  15. Amasyali, K.; El-Gohary, N.M. A review of data-driven building energy consumption prediction studies. Renew. Sustain. Energy Rev. 2018, 81, 1192–1205. [Google Scholar] [CrossRef]
  16. Bilal, M.; Oyedele, L.O.; Kusimo, H.O.; Owolabi, H.A.; Akanbi, L.A.; Ajayi, A.O.; Akinade, O.O.; Delgado, J.M.D. Investigating profitability performance of construction projects using big data: A project analytics approach. J. Build. Eng. 2019, 26, 100850. [Google Scholar] [CrossRef]
  17. Chen, S. Construction Project Cost Management and Control System Based on Big Data. Mob. Inf. Syst. 2022, 2022, 7908649. [Google Scholar] [CrossRef]
  18. Liang, Y.P.; Ashuri, B.A.B.; Li, M.S. Forecasting the Construction Expenditure Cash Flow for Transportation Design-Build Projects with a Case-Based Reasoning Model. J. Constr. Eng. Manag. 2021, 147, 04021043. [Google Scholar] [CrossRef]
  19. Cho, D.; Lee, M.; Shin, J. Development of Cost and Schedule Data Integration Algorithm Based on Big Data Technology. Appl. Sci. 2020, 10, 8917. [Google Scholar] [CrossRef]
  20. Flah, M.; Nunez, I.; Ben Chaabene, W.; Nehdi, M.L. Machine Learning Algorithms in Civil Structural Health Monitoring: A Systematic Review. Arch. Comput. Methods Eng. 2020, 28, 2621–2643. [Google Scholar] [CrossRef]
  21. Kim, D.; Yoon, Y.; Lee, J.; Mago, P.J.; Lee, K.; Cho, H. Design and Implementation of Smart Buildings: A Review of Current Research Trend. Energies 2022, 15, 4278. [Google Scholar] [CrossRef]
  22. Guo, P.; Tian, W.; Li, H.; Zhang, G.; Li, J. Global characteristics and trends of research on construction dust: Based on bibliometric and visualized analysis. Environ. Sci. Pollut. Res. Int. 2020, 27, 37773–37789. [Google Scholar] [CrossRef] [PubMed]
  23. Salunkhe, A.A.; Gobinath, R.; Vinay, S.; Joseph, L. Progress and Trends in Image Processing Applications in Civil Engineering: Opportunities and Challenges. Adv. Civ. Eng. 2022, 220, 6400254. [Google Scholar] [CrossRef] [PubMed]
  24. Chen, B.; Shin, S.; Wu, M.; Liu, Z. Visualizing the Knowledge Domain in Health Education: A Scientometric Analysis Based on CiteSpace. Int. J. Environ. Res. Public. Health 2022, 19, 6440. [Google Scholar] [CrossRef]
  25. Dong, Y.; Liu, L.; Han, J.; Zhang, L.; Wang, Y.; Li, J.; Li, Y.; Liu, H.; Zhou, K.; Li, L.; et al. Worldwide Research Trends on Artemisinin: A Bibliometric Analysis From 2000 to 2021. Front. Med. 2022, 9, 868087. [Google Scholar] [CrossRef]
  26. Feng, L.; Shang, S.; Feng, X.; Kong, Y.; Bai, J. Evolution and Trend Analysis of Research Hotspots in the Field of Pollution-Intensive Industry Transfer—Based on Literature Quantitative Empirical Study of China as World Factory. Front. Environ. Sci. 2022, 10, 732734. [Google Scholar] [CrossRef]
  27. Huang, Y.; Zhan, Q.; Wu, C.; Liao, N.; Jiang, Z.; Ding, H.; Wang, K.; Li, Y. Trends and Hotspots in Nanoparticles for the Targeted Delivery of Nucleic Acids: A Ten-Year Bibliometric Study. Front. Pharmacol. 2022, 13, 868398. [Google Scholar] [CrossRef]
  28. Umeokafor, N.; Umar, T.; Evangelinos, K. Bibliometric and scientometric analysis-based review of construction safety and health research in developing countries from 1990 to 2021. Saf. Sci. 2022, 156, 105897. [Google Scholar] [CrossRef]
  29. Xu, X.; Li, Y.; Shi, S.; Lv, J.; Wang, Y.; Zheng, H.; Mao, X.; Wu, H.; Zhang, B.; Song, Q. The Application of Angiotensin Receptor Neprilysin Inhibitor in Cardiovascular Diseases: A Bibliometric Review From 2000 to 2022. Front. Cardiovasc. Med. 2022, 9, 899235. [Google Scholar] [CrossRef] [PubMed]
  30. Xue, J.; Zhang, W.; Rasool, Z.; Zhou, J. A review of supply chain coordination management based on bibliometric data. Alex. Eng. J. 2022, 61, 10837–10850. [Google Scholar] [CrossRef]
  31. Zhang, S.; Huang, M.; Zhi, J.; Wu, S.; Wang, Y.; Pei, F. Research Hotspots and Trends of Peripheral Nerve Injuries Based on Web of Science From 2017 to 2021: A Bibliometric Analysis. Front. Neurol. 2022, 13, 872261. [Google Scholar] [CrossRef] [PubMed]
  32. Zhao, J.; Lu, Y.; Zhou, F.; Mao, R.; Fei, F. Systematic Bibliometric Analysis of Research Hotspots and Trends on the Application of Virtual Reality in Nursing. Front. Public. Health 2022, 10, 906715. [Google Scholar] [CrossRef] [PubMed]
  33. Zhu, G.; Fu, Z.; Su, S.; Tang, Y.; Liu, F.; Yu, W. Global Trends and Hotspots in Trigeminal Neuralgia Research From 2001 to 2021: A Bibliometric Analysis. Front. Neurol. 2022, 13, 894006. [Google Scholar] [CrossRef]
  34. Jin, J.; Gubbi, J.; Marusic, S.; Palaniswami, M. An information framework for creating a smart city through internet of things. IEEE Internet Things J. 2014, 1, 112–121. [Google Scholar] [CrossRef]
  35. Zanella, A.; Bui, N.; Castellani, A.; Vangelista, L.; Zorzi, M. Internet of things for smart cities. IEEE Internet Things J. 2014, 1, 22–32. [Google Scholar] [CrossRef]
  36. Xia, H.S.; Liu, Z.S.; Efremochkina, M.; Liu, X.T.; Lin, C.X. Study on city digital twin technologies for sustainable smart city design: A review and bibliometric analysis of geographic information system and building information modeling integration. Sustain. Cities Soc. 2022, 84, 104009. [Google Scholar] [CrossRef]
  37. Ju, J.; Liu, L.; Feng, Y. Citizen-centered big data analysis-driven governance intelligence framework for smart cities. Telecommun. Policy 2018, 42, 881–896. [Google Scholar] [CrossRef]
  38. Tian, L.; Wang, H.; Zhou, Y.; Peng, C. Video big data in smart city: Background construction and optimization for surveillance video processing. Future Gener. Comput. Syst. 2018, 86, 1371–1382. [Google Scholar] [CrossRef]
  39. Zhou, J.; Wang, P.; Xie, L. Research on Resource Allocation Optimization of Smart City Based on Big Data. IEEE Access 2020, 8, 158852–158861. [Google Scholar] [CrossRef]
  40. Marinakis, V.; Doukas, H.; Tsapelas, J.; Mouzakitis, S.; Sicilia, A.; Madrazo, L.; Sgouridis, S. From big data to smart energy services: An application for intelligent energy management. Future Gener. Comput. Syst. 2020, 110, 572–586. [Google Scholar] [CrossRef]
  41. Liu, X.; Wang, X.Y.; Wright, G.; Cheng, J.C.P.; Li, X.; Liu, R. A State-of-the-art review on the integration of building information modeling (bim) and geographic information system (GIS). ISPRS Int. J. Geo-Inf. 2017, 6, 53. [Google Scholar] [CrossRef] [Green Version]
  42. Leon-Garza, H.; Hagras, H.; Pena-Rios, A.; Conway, A.; Owusu, G. A type-2 fuzzy system-based approach for image data fusion to create building information models. Inf. Fusion 2022, 88, 115–125. [Google Scholar] [CrossRef]
  43. Zheng, R.Y.; Jiang, J.L.; Hao, X.H.; Ren, W.; Xiong, F.; Ren, Y. bcBIM: A Blockchain-Based big data model for bim modification audit and provenance in mobile cloud. math. Probl. Eng. 2019, 2019, 5349538. [Google Scholar] [CrossRef] [Green Version]
  44. Yu, Z.; Zheng, X.; Huang, F.; Guo, W.; Sun, L.; Yu, Z. A framework based on sparse representation model for time series prediction in smart city. Front. Comput. Sci. 2020, 15, 151305. [Google Scholar] [CrossRef]
  45. Bello, S.A.; Oyedele, L.O.; Akinade, O.O.; Bilal, M.; Davila Delgado, J.M.; Akanbi, L.A.; Ajayi, A.O.; Owolabi, H.A. Cloud computing in construction industry: Use cases, benefits and challenges. Autom. Constr. 2021, 122, 103441. [Google Scholar] [CrossRef]
  46. Chen, Z.; Jiang, C. Building occupancy modeling using generative adversarial network. Energy Build. 2018, 174, 372–379. [Google Scholar] [CrossRef]
  47. Chen, X.; Wang, H.; Tian, B. Visualization model of big data based on self-organizing feature map neural network and graphic theory for smart cities. Cluster. Comput. 2018, 22, 13293–13305. [Google Scholar] [CrossRef]
  48. Bae, J.; Choi, K.; Oh, J.H. Multicontextual Machine-Learning Approach to Modeling Traffic Impact of Urban Highway Work Zones. Transp. Res. Rec. 2017, 2645, 184–194. [Google Scholar] [CrossRef]
  49. Gbadamosi, A.Q.; Oyedele, L.; Mahamadu, A.M.; Kusimo, H.; Bilal, M.; Delgado, J.M.D.; Muhammed-Yakubu, N. Big data for Design Options Repository: Towards a DFMA approach for offsite construction. Autom. Constr. 2020, 120, 103388. [Google Scholar] [CrossRef]
  50. Rashid, K.M.; Louis, J. Times-series data augmentation and deep learning for construction equipment activity recognition. Adv. Eng. Inf. 2019, 42, 100944. [Google Scholar] [CrossRef]
  51. You, Z.; Feng, L. Integration of Industry 4.0 Related Technologies in Construction Industry: A Framework of Cyber-Physical System. IEEE Access 2020, 8, 122908–122922. [Google Scholar] [CrossRef]
  52. You, Z.; Wu, C. A framework for data-driven informatization of the construction company. Adv. Eng. Inf. 2019, 39, 269–277. [Google Scholar] [CrossRef]
  53. Ngo, J.; Hwang, B.G. Critical Project Management knowledge and skills for managing projects with smart technologies. J. Manag. Eng. 2022, 38, 05022013. [Google Scholar] [CrossRef]
  54. Liu, H.; Zhang, H.; Zhang, R.X.; Jiang, H.B.; Ju, Q.Q. Competence model of construction project manager in the digital era—The case from China. Buildings 2022, 12, 1385. [Google Scholar] [CrossRef]
  55. Zheng, J.; Wen, Q.; Qiang, M. Understanding demand for project manager competences in the construction industry: Data mining approach. J. Constr. Eng. Manag. 2020, 146, 04020083. [Google Scholar] [CrossRef]
  56. Valipour, A.; Yahaya, N.; Md Noor, N.; Antucheviciene, J.; Tamosaitiene, J. Hybrid SWARA-COPRAS method for risk assessment in deep foundation excavation project: An iranian case study. J. Civ. Eng. Manag. 2017, 23, 524–532. [Google Scholar] [CrossRef] [Green Version]
  57. Kifokeris, D.; Xenidis, Y. Constructability: Outline of Past, Present, and Future Research. J. Constr. Eng. Manag. 2017, 143, 04017035. [Google Scholar] [CrossRef]
  58. Hosamo, H.H.; Svennevig, P.R.; Svidt, K.; Han, D.; Nielsen, H.K. A Digital Twin predictive maintenance framework of air handling units based on automatic fault detection and diagnostics. Energy Build. 2022, 261, 111988. [Google Scholar] [CrossRef]
  59. Wu, S.; Guo, D.; Wu, Y.; Wu, Y. Future Development of Taiwan’s Smart Cities from an Information Security Perspective. Sustainability 2018, 10, 4520. [Google Scholar] [CrossRef] [Green Version]
  60. Kim, J.S.; Kim, B.S. Analysis of Fire-Accident Factors Using Big-Data Analysis Method for Construction Areas. KSCE J. Civ. Eng. 2017, 22, 1535–1543. [Google Scholar] [CrossRef]
  61. Bellini, P.; Benigni, M.; Billero, R.; Nesi, P.; Rauch, N. Km4City ontology building vs data harvesting and cleaning for smart-city services. J. Vis. Lang. Comput. 2014, 25, 827–839. [Google Scholar] [CrossRef] [Green Version]
  62. Kim, K.; Kim, H.; Kim, H. Image-based construction hazard avoidance system using augmented reality in wearable device. Autom. Constr. 2017, 83, 390–403. [Google Scholar] [CrossRef]
  63. Lin, J.R.; Hu, Z.Z.; Zhang, J.P.; Yu, F.Q. A Natural-Language-Based Approach to Intelligent Data Retrieval and Representation for Cloud BIM. Comput.-Aided Civ. Infrastruct. Eng. 2016, 31, 18–33. [Google Scholar] [CrossRef]
  64. Wong, J.K.W.; Zhou, J. Enhancing environmental sustainability over building life cycles through green BIM: A review. Autom. Constr. 2015, 57, 156–165. [Google Scholar] [CrossRef]
  65. Chen, Y.; Han, D. Water quality monitoring in smart city: A pilot project. Autom. Constr. 2018, 89, 307–316. [Google Scholar] [CrossRef]
  66. Chen, X.; Lu, W. Identifying factors influencing demolition waste generation in Hong Kong. J. Clean. Prod. 2017, 141, 799–811. [Google Scholar] [CrossRef] [Green Version]
  67. Boje, C.; Guerriero, A.; Kubicki, S.; Rezgui, Y. Towards a semantic Construction Digital Twin: Directions for future research. Autom. Constr. 2020, 114, 103179. [Google Scholar] [CrossRef]
  68. Becker, M.; Elsmann, T.; Latka, I.; Rothhardt, M.; Bartelt, H. Chirped Phase Mask Interferometer for Fiber Bragg Grating Array Inscription. J. Light. Technol. 2015, 33, 2093–2098. [Google Scholar] [CrossRef]
  69. Miller, C.; Nagy, Z.; Schlueter, A. A review of unsupervised statistical learning and visual analytics techniques applied to performance analysis of non-residential buildings. Renew. Sustain. Energy Rev. 2018, 81, 1365–1377. [Google Scholar]
  70. Perera, S.; Nanayakkara, S.; Rodrigo, M.N.N.; Senaratne, S.; Weinand, R. Blockchain technology: Is it hype or real in the construction industry? J. Ind. Inf. Integr. 2020, 17, 100125. [Google Scholar] [CrossRef]
  71. Zhang, W.; Li, H.; Li, Y.; Liu, H.; Chen, Y.; Ding, X. Application of deep learning algorithms in geotechnical engineering: A short critical review. Artif. Intell. Rev. 2021, 54, 5633–5673. [Google Scholar] [CrossRef]
  72. Wu, Y.; Tan, H.; Qin, L.; Ran, B.; Jiang, Z. A hybrid deep learning based traffic flow prediction method and its understanding. Transp. Res. Pt. C-Emerg. Technol. 2018, 90, 166–180. [Google Scholar] [CrossRef]
  73. Huang, Y.; Shi, Q.; Zuo, J.; Pena-Mora, F.; Chen, J.; Yi, W. Research Status and Challenges of Data-Driven Construction Project Management in the Big Data Context. Adv. Civ. Eng. 2021, 2021, 6674980. [Google Scholar] [CrossRef]
  74. Catbas, F.N.; Malekzadeh, M. A machine learning-based algorithm for processing massive data collected from the mechanical components of movable bridges. Autom. Constr. 2016, 72, 269–278. [Google Scholar] [CrossRef] [Green Version]
  75. Scianna, A.; Gaglio, G.F.; La Guardia, M. Structure Monitoring with BIM and IoT: The Case Study of a Bridge Beam Model. ISPRS Int. J. Geo-Inf. 2022, 11, 173. [Google Scholar] [CrossRef]
  76. Wang, D.; Fan, J.; Fu, H.; Zhang, B. Research on Optimization of Big Data Construction Engineering Quality Management Based on RNN-LSTM. Complexity 2018, 2018, 9691868. [Google Scholar] [CrossRef]
  77. Fang, W.; Luo, H.; Xu, S.; Love, P.E.D.; Lu, Z.; Ye, C. Automated text classification of near-misses from safety reports: An improved deep learning approach. Adv. Eng. Inf. 2020, 44, 101060. [Google Scholar] [CrossRef]
  78. Gumusay, M.U.; Koseoglu, G.; Bakirman, T. An assessment of site suitability for marina construction in Istanbul, Turkey, using GIS and AHP multicriteria decision analysis. Environ. Monit. Assess. 2016, 188, 677. [Google Scholar] [CrossRef]
  79. Sakkas, N.P.; Abang, R. Thermal load prediction of communal district heating systems by applying data-driven machine learning methods. Energy Rep. 2022, 8, 1883–1895. [Google Scholar] [CrossRef]
Figure 1. The number of articles published, and the annual cumulative number of articles published.
Buildings 12 01812 g001
Figure 2. Journal co-citation network.
Buildings 12 01812 g002
Figure 3. Author cooperation network map.
Buildings 12 01812 g003
Figure 4. Country cooperation network map.
Buildings 12 01812 g004
Figure 5. Institutional cooperation network map.
Buildings 12 01812 g005
Figure 6. Keyword cooperation network map.
Buildings 12 01812 g006
Figure 7. Keywords clustering time chart.
Buildings 12 01812 g007
Table 1. Journals information table of the top 15 cited frequency.
RankerCited FrequencyCentralityJournal
12310.03Automation in Construction
22300.02Energy and Buildings
32140.01Renewable and Sustainable Energy Reviews
42130.03Applied Energy
52070.02Transportation Research Record
62000.03IEEE Access
71980.01Building and Environment
81930.09Journal of Cleaner Production
91840.02Sensors
101740.04Transportation Research Part C-Emerging Technologies
111650.04Lecture Notes in Mathematics
121460.04Expert Systems with Applications
131200.05Future Generation Computer Systems-The International Journal of Escience
141110.05Journal of Computing in Civil Engineering
151000.06Computer-Aided Civil and Infrastructure Engineering
Table 2. Author information table of the top 20 published articles.
AnkerCountCentralityAuthorAnkerCountCentralityAuthor
1210.05Bilal M1190.05Li QQ
2160.02Oyedele LO1290.00Mosavi A
3150.09Liu Y1390.01Owolabi HA
4130.00Lu WS1490.01Zhang Y
5130.05Wang Y1580.00Yang X
6120.00Akinade OO1680.01Zhang J
7110.00Li X1770.00Ajayi SO
8100.01Liu X1870.00Alaka HA
990.01Fan C1970.01Chen X
1090.01Lee S2070.01Delgado JMD
Table 3. Information table of the top 20 major research countries with the published article.
AnkerCountCentralityCountryAnkerCountCentralityCountry
14280.27China11330.03Japan
23980.20USA12310.03Iran
31840.08England 13260.00Singapore
4810.05Australia 14220.02Sweden
5720.06Korea15210.04Pakistan
6550.04Italy16210.05Poland
7520.02Spain 17190.07Norway
8470.11Canada18190.04Netherlands
9390.00Germany19180.02Turkey
10340.04India20180.02Brazil
Table 4. Information table of the top 20 major research institutions with published articles.
AnkerCountCentralityInstitution
1360.09Chinese Academy of Sciences
2300.13Tsinghua University
3300.07Wuhan University
4270.06Beijing Jiaotong University
5260.05Southeast University China
6260.04Tongji University
7250.14Hong Kong Polytechnic University
8250.06Shenzhen University
9210.12University of California System
10210.03University of Hong Kong
11190.05National University of Singapore
12190.02Sun Yat Sen University
13180.06Central South University
14170.04University System of Maryland
15170.03Massachusetts Institute of Technology Mit
16160.08University of California Berkeley
17160.01University of Maryland College Park
18160.01University of Chinese Academy of Sciences Cas
19150.04University of London
20150.04Zhejiang University
Table 5. Clustering hidden keywords.
AnkerKeywordsImplicit Keyword
#0Smart CityInternet Of Things; Sustainability
#1Built EnvironmentMachine Learning; Smart City; Artificial Intelligence; Urban Vitality
#2Traffic Flow PredictionModel; Time Series Prediction; Identification; Regression
#3Building Energy EfficiencyThermal Comfort; Smart City; Reuse; Trnsys
#4Structural Health MonitoringDeep Learning; Machine Learning; Artificial Intelligence; Neural Networks
#5Particle Swarm OptimizationIndustry Foundation Classes (Ifc); Vibration Analysis; Open Data; Building Information Modeling (Bim)
#6Urban Informatics3d Reconstruction; Deep Learning; Physical Activity; Internet Of Things
#7Social MediaTemperature; Climate Change; Risk Assessment; Air Pollution
#8Literature ReviewCutting Test; Trajectory Data; Deep-Buried Tunnel; Precursor
#9Urban Transportation Data and Information SystemsRail Transit Systems; Data and Data Science; Public Transportation; Spatial Interactions
Publisher’s Note: MDPI stays neutral with regard to jurisdictional claims in published maps and institutional affiliations.

