Abstract
In electrical substations, glass-fibre reinforced polymer (GFRP) insulators provide an alternative to porcelain insulators for better seismic performance. The bonded connection between the composite tube and the metal end fitting is a weak link under earthquake actions, and the failure risk of ultra-high voltage (UHV) substation equipment with GFRP composite insulators can be considerable in places with high seismicity. This study solved the problem by retrofitting and experimentally qualifying the seismic performance of surge arresters made of composite insulators. To ensure safety under a bending moment corresponding to the seismic demand, the bonded sleeve joint between the tube and end fitting was retrofitted by shear stiffeners and higher strength end fitting. A full-scale shaking table test was carried out to verify the performance of the retrofitted surge arrester, and the seismic responses to increasing earthquake actions were analyzed. The specimens in this study were full-scale, had the largest dimensions among substation equipment of the same type, and were subjected to an extremely high earthquake action of 0.5 g; therefore, the seismic testing results produced in this study can serve as an important reference for the industry.
1. Introduction
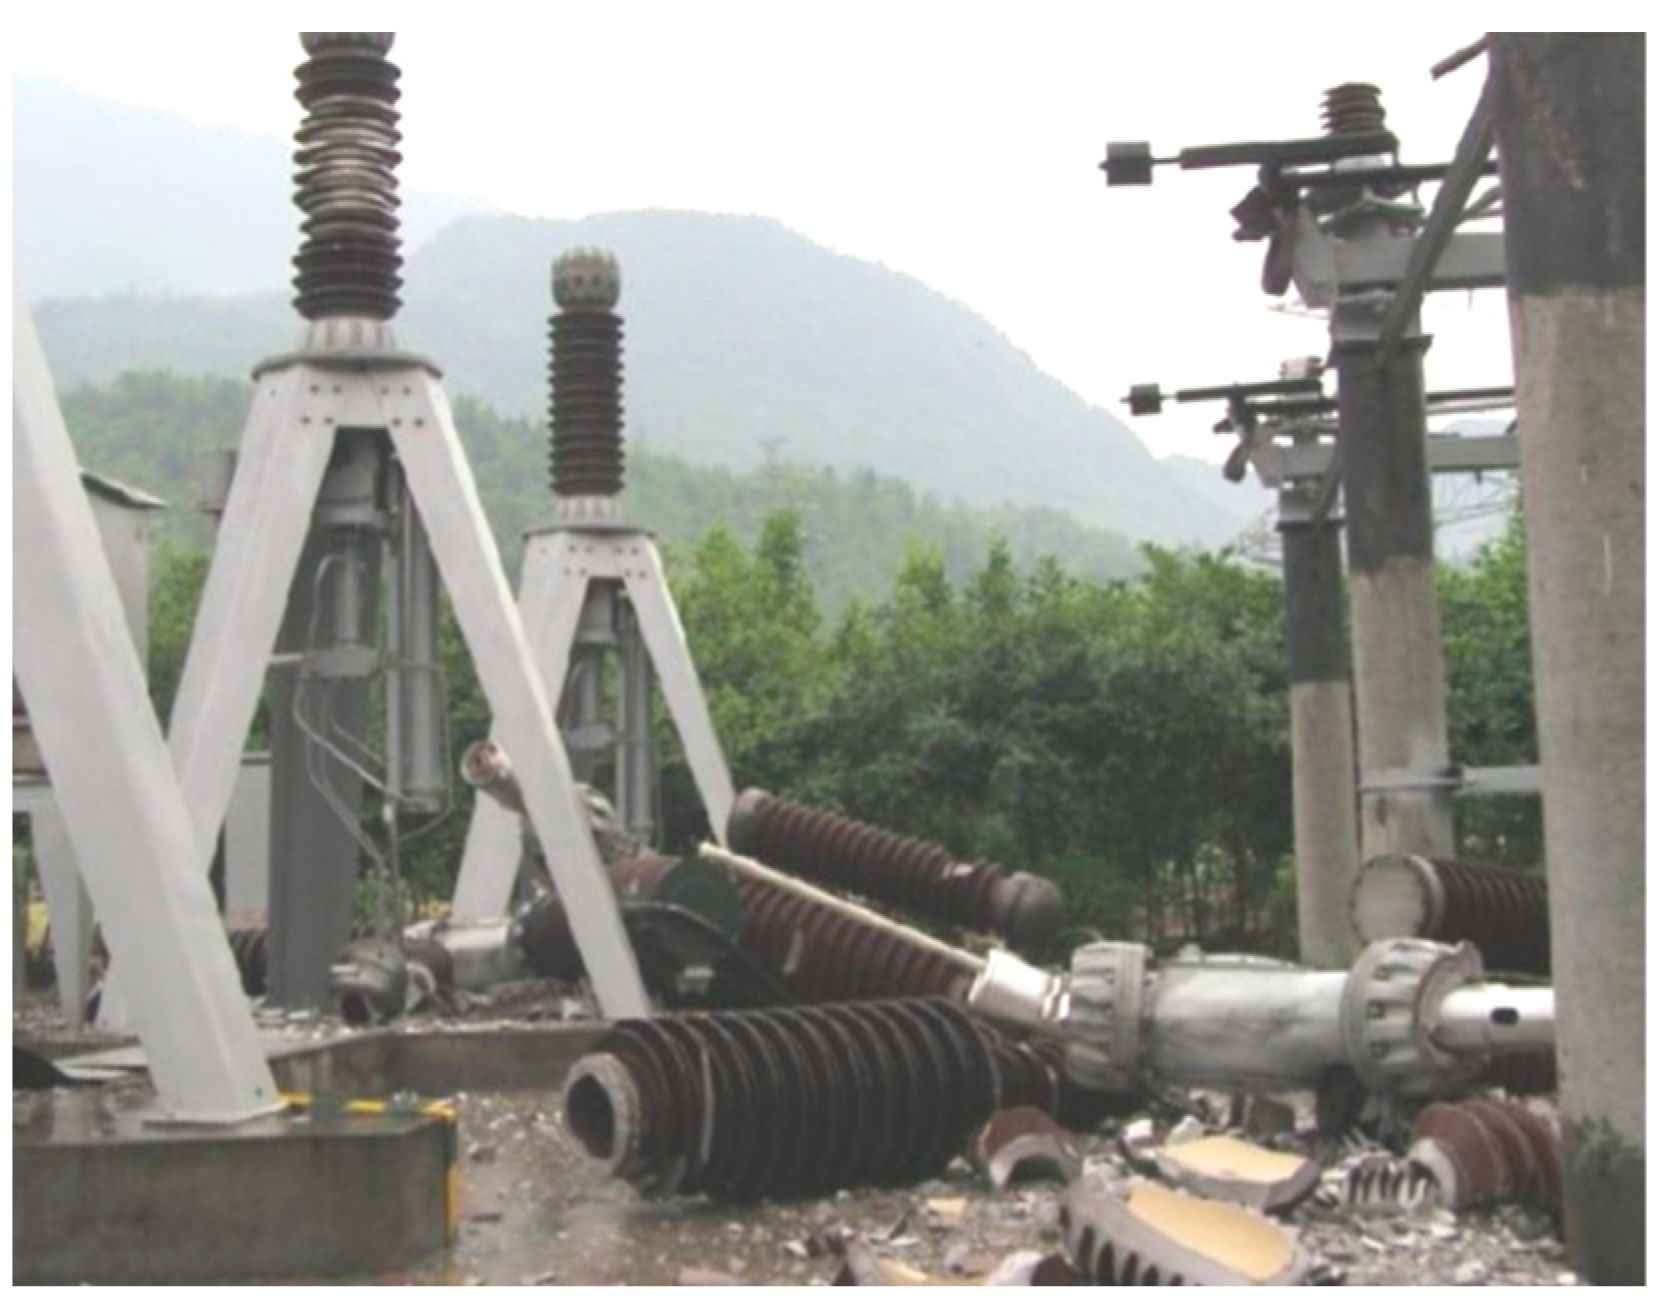
The seismic safety of electrical equipment in substations is essential to the reliability of a power system [1,2,3]. Substations install a range of cylindrical electrical equipment, such as surge arresters, capacitor voltage transformers, and post insulators. These items are traditionally manufactured using porcelain insulators composed of ceramic material that is brittle and fragile, resulting in a significant risk of failure in earthquakes. Figure 1 shows porcelain insulators that were damaged in the 2008 Wenchuan earthquake in China [4]; similar failures occurred in the 1977 Vrancea earthquake in Romania [5], the 1989 Loma Prieta earthquake in the United States [6], the 2011 Tohoku earthquake in Japan [7], the 2011 Christchurch earthquake in New Zealand [8], and the 2013 Lushan earthquake in China [9]. Due to insulation clearance requirements, electrical equipment in ultra-high voltage (UHV) substations, which are the substations with the highest voltage, becomes substantially taller [10,11]. The normal height of cylindrical electrical equipment in the primary circuit of a substation, such as the 1000 kV surge arrester examined in this study, is approximately 10–15 m, and the diameter of an insulator is approximately 0.3–0.7 m. In seismic hazardous areas, the usage of porcelain insulators for UHV electrical equipment may pose a significant seismic risk [12].
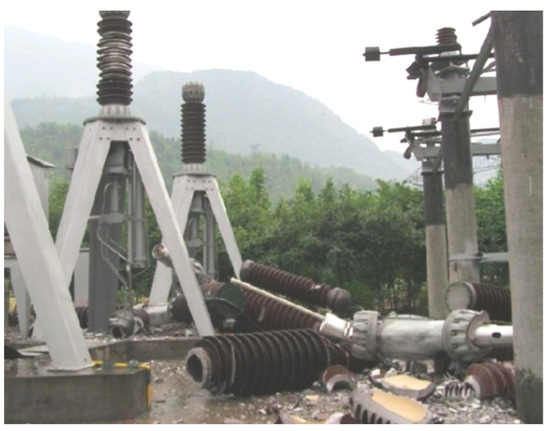
Figure 1.
Seismic failure of porcelain insulators in the M7.9 Wenchuan earthquake in 2008.
Insulators made of glass-fibre reinforced polymer (GFRP), referred to herein as composite insulators [13], are potential alternatives for replacing porcelain insulators due to the high strength and excellent electrical insulation properties of GFRP [14]. Composite insulators in substations have a service history dating back to the 1980s [15], but there has been no report on their performance after earthquakes. In the past ten years, composite insulators have emerged in UHV substations, with the majority being used in lightweight post insulators. Several earlier studies found that UHV equipment with composite insulators still lacked seismic strength, necessitating the use of special seismic isolation devices [16,17]. As a result, the adaptability of composite insulators in substations located in regions of high seismicity is hindered.
Composite insulators are made of GFRP tubes and metal flanges at both ends. The joints between the GFRP tube and the metal flange could be vulnerable to lateral loads by earthquakes [18]. The joints are categorized into three types: crimped joint [19,20], bolted sleeve joint [21,22], and bonded sleeve joint [23,24]. For crimped joints, the procedure of crimping produces significant residual stress, which works well for solid core insulators [25,26] but is not good for hollow core insulators, as the crimping process could crack the tube. Through bolts link the sleeve of the flange to the composite tube in a bolted sleeve joint. The penetration of bolts to the hollow core beam is often used in the beam-column joints [27,28] of composite structure buildings. For electrical equipment, the cavity of the insulator often houses valve plates and should not be penetrated. A bonded sleeve joint joins the GFRP tube and the sleeve of flange with an adhesive layer, which is more appropriate for hollow core insulators. Studies on bonded connections in engineering structures mostly focus on axial loads or torque loads [29,30,31], but bending is a less-researched subject [32]. However, composite insulators in substation equipment are primarily subjected to bending resulting from wind or earthquake actions. Cracking of the metal flange, tearing of the composite tube at the bonding zone, and slippage at the bonding interface were identified as potential failure modes based on bending tests of composite insulators [33,34,35,36,37]. However, investigations on retrofitting the bonded sleeve joint of composite insulators to undertake larger seismic actions are scarce.
Clause 8.6 of the standard Q/GDW 11391 [38] recommends performing an electrical test following seismic testing to validate its electrical functionality. Thus, it is recommended to use full-scale or “real” equipment as a test specimen so that electrical testing can be performed. Currently, full-scale shaking table tests of cylindrical electrical equipment with composite insulators are still limited. For example, 230 kV switches [39] and transformer bushings in various voltage levels [40] were tested in the United States, and a 380 kV circuit breaker [41] was tested in Italy. Some kinds of UHV equipment, such as a 1000 kV composite gas-insulated switch bushing [42] and ±800 kV composite post insulator [43], have been tested. Previous studies have not dealt with a full-scale test of a 1000 kV surge arrester with GFRP composite insulators.
The objective of this study was to improve and validate the seismic performance of a 1000 kV surge arrester with GFRP composite insulators to meet safety requirements under an extreme seismic action, thereby making the newly designed equipment suitable for installation in any seismic hazard zone in China. The 1000 kV surge arrester is an essential item in UHV substations, with the heaviest weight of all types of cylindrical equipment. The decision to retrofit was made since similar equipment had only passed 0.2 g PGA seismic testing [16]. In this study, the specimen and input motion in seismic qualification are introduced in Section 2. The retrofitting design is given in Section 3, along with the bending test results of the retrofitted specimen. The seismic performance of the retrofitted equipment is validated in Section 4 using a full-scale shaking table test.
2. Input Motion, Specimen Description, and Seismic Demand Analysis
2.1. Input Motion
The 1000 kV surge arrester was designed to be installed in substations in high seismic hazard areas, including one target substation located in the northern China earthquake zone. It is a major earthquake zone, where the historic M 7.8 Tangshan earthquake happened in 1976. The design earthquake action was 0.5 g peak ground acceleration (PGA) for 2% exceedance probability in 50 years. The vital importance of the UHV substation in the electrical grid system requires the installed equipment to have a safety margin larger than 1.67 under the design earthquake action, according to Chinese standard GB 50260 [44].
The acceleration spectrum defined in the Chinese standards [44,45] was plotted on the left side of Figure 2, with a notation of RS 0.5 g. The acceleration spectrum with a resonant period range of [0.1 s, 0.9 s] was chosen, making it independent of foundation soil types. The tested equipment can be appropriate for installation in substations with various types of foundation soil. This differs from the site-specific design of buildings and bridges. The electrical industry prefers this type of equipment standardization due to the advantages of employing standard production lines and having efficient stock management.

Figure 2.
Acceleration spectrum of 0.5 g and 1.4 × 0.5 g PGA earthquake action in GB 50260 standard (left) and artificial seismic wave compatible to the spectrum (right).
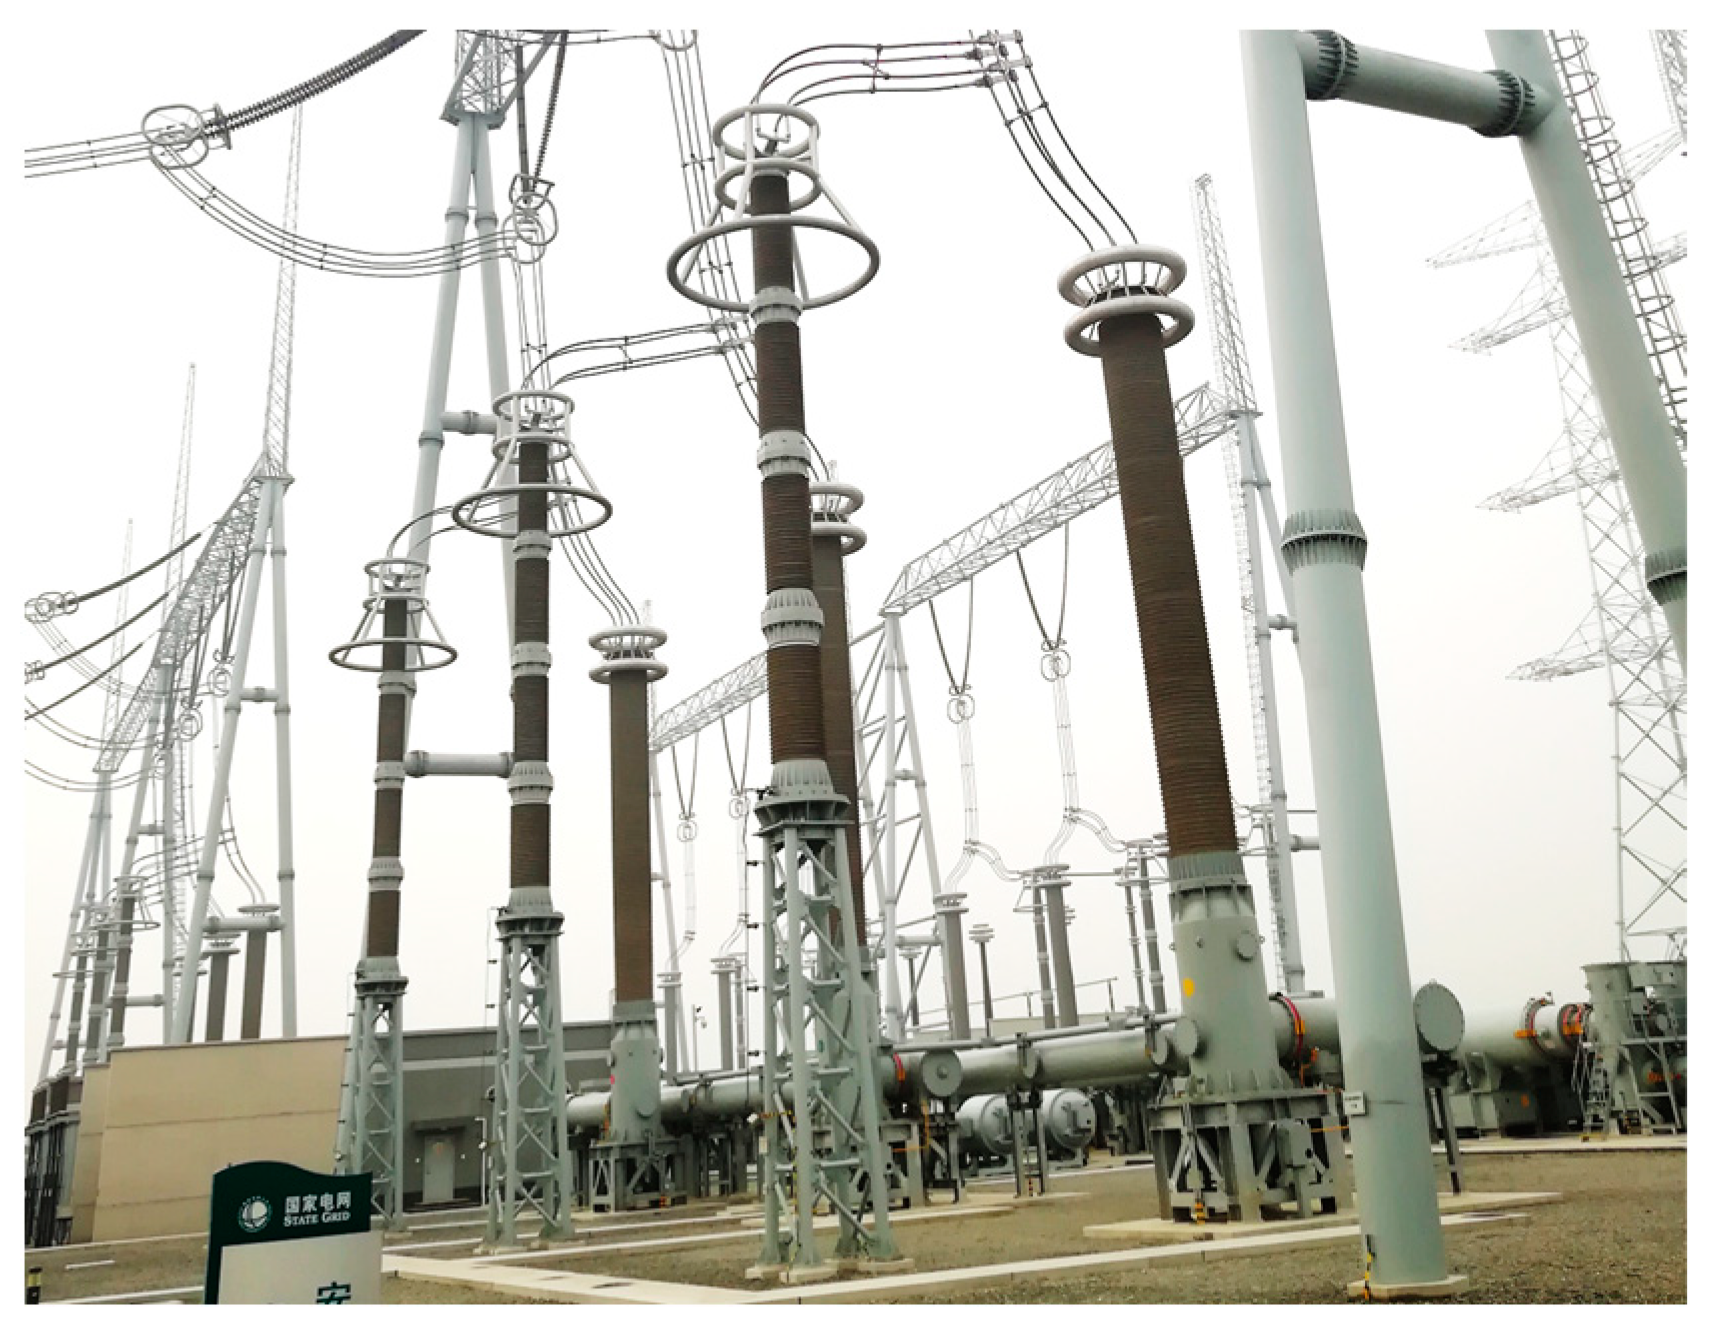
In substations, the 1000 kV surge arrester would be mounted on the top of a 5~8 m steel supporting frame, as shown in Figure 3. Note that the height of the supporting structure is determined by the requirement of ground insulation distance and the position of nearby equipment interconnected with the surge arrester. The supporting structure can be different even in the same substation. The seismic design and qualification of the surge arrester usually consider a conservative dynamic amplification factor of 1.4, in order to take the influence of the supporting structure into consideration [46]. Conversely, the supporting structures are designed to have a dynamic amplification factor less than 1.4 [38]. During the testing, a linear amplification factor of 1.4 was directly applied to the input excitation, resulting in an input PGA of 1.4 × 0.5 g. The acceleration spectrum is plotted on the left side of Figure 2, with a notation of RS 1.4 × 0.5 g.
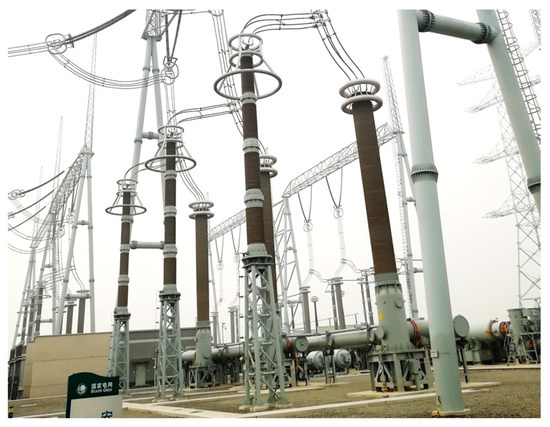
Figure 3.
The 1000 kV surge arrester with supporting structure installed in an UHV electrical substation.
According to various standards on the seismic design of electrical equipment, including IEEE 693 [47], GB 50260 [44] and Q/GDW 11391 [38], spectral matching is the primary consideration [48] for input motion in the seismic qualification of a shaking table test. It is typically necessary that the test spectrum (TS) envelops the required spectrum (RS) within a tolerance of −10%/+50%. As a result, the artificial input motion depicted in Figure 2 was used, as suggested by Q/GDW 11132 [45]. This artificial earthquake wave was created by modifying the ground motion data from the Landers earthquake to match the RS in GB 50260 [44].
2.2. Specimen Description and Seismic Demand Analysis
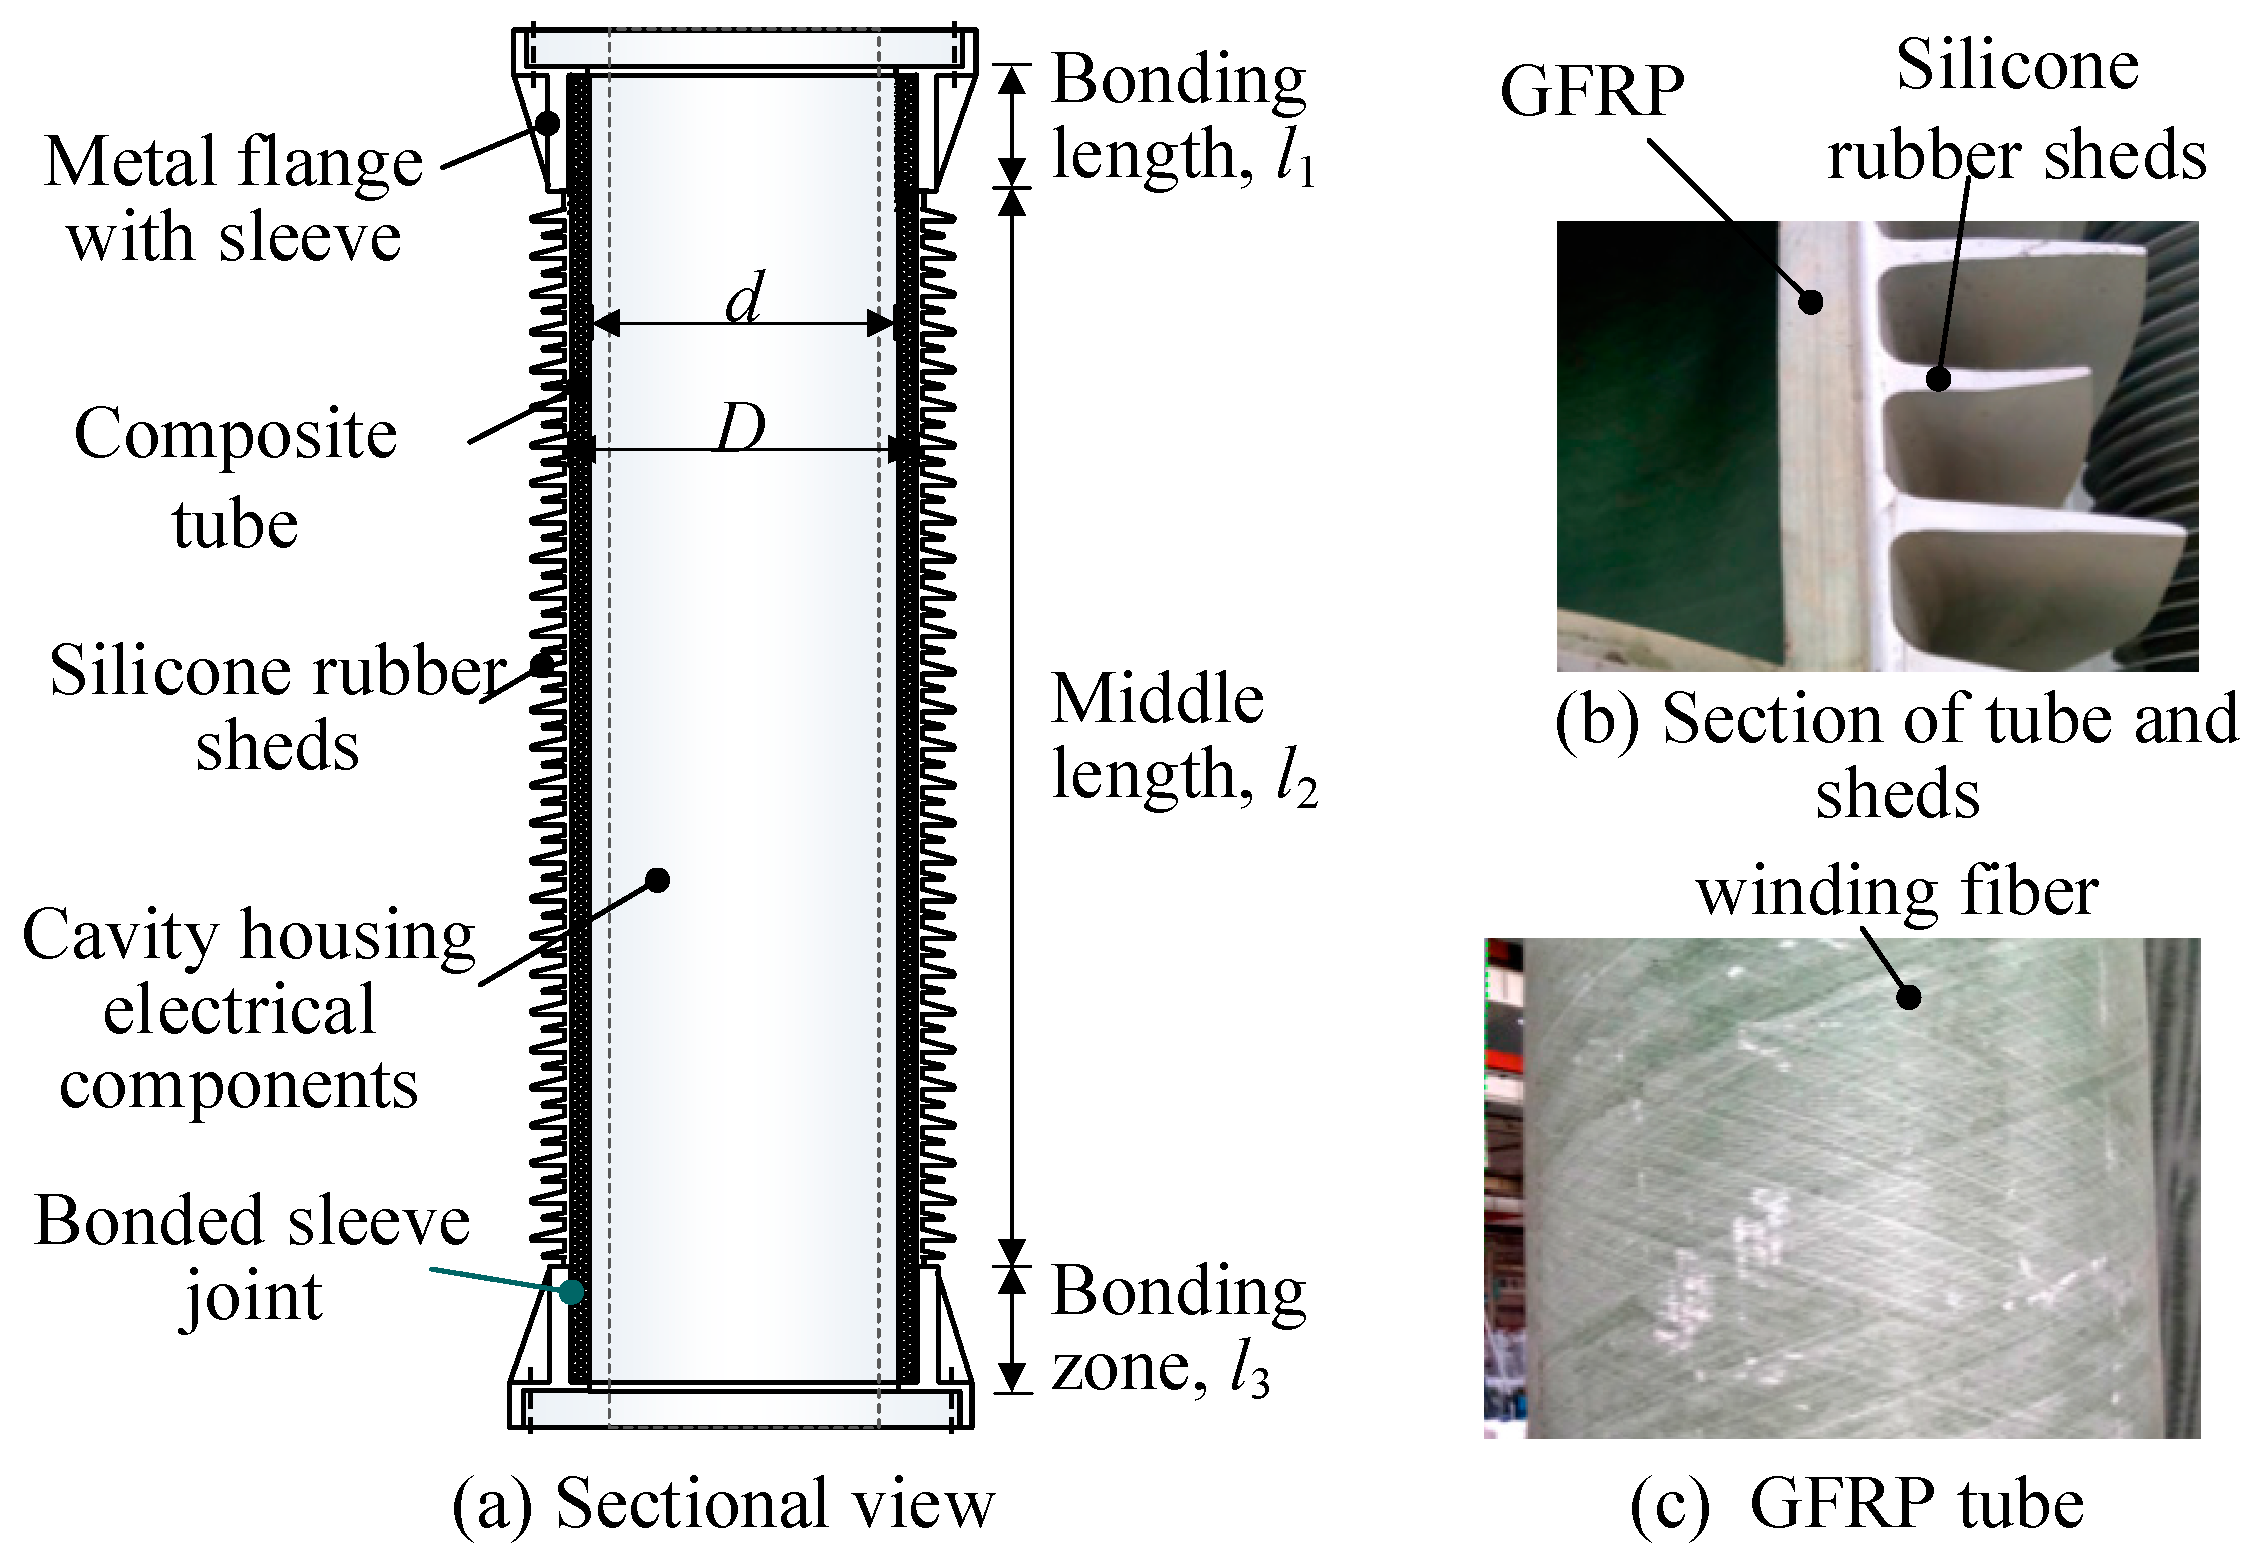
An example of a hollow core composite insulator for cylindrical electrical equipment is shown in Figure 4 [33]. The main component of the insulator is a hollow core GFRP tube made by a fibre winding process. Epoxy adhesive is used to join the tube with metal flanges at both ends. The metal flange comprises a sleeve bonded to the composite tube and a flange plate bolted to a nearby insulator in the column. Silicone rubber sheds attached to the outer surface of the tube and the electrical valve plates inside the tube are non-structural components.
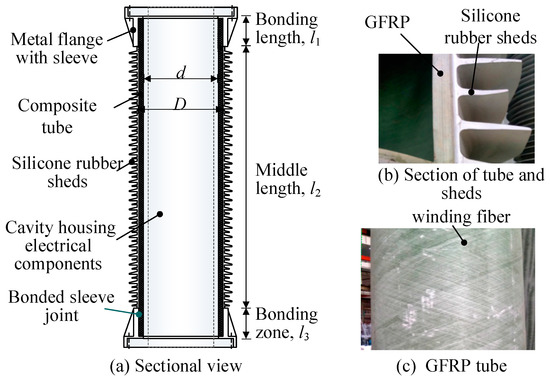
Figure 4.
A section view of the hollow core composite insulator.
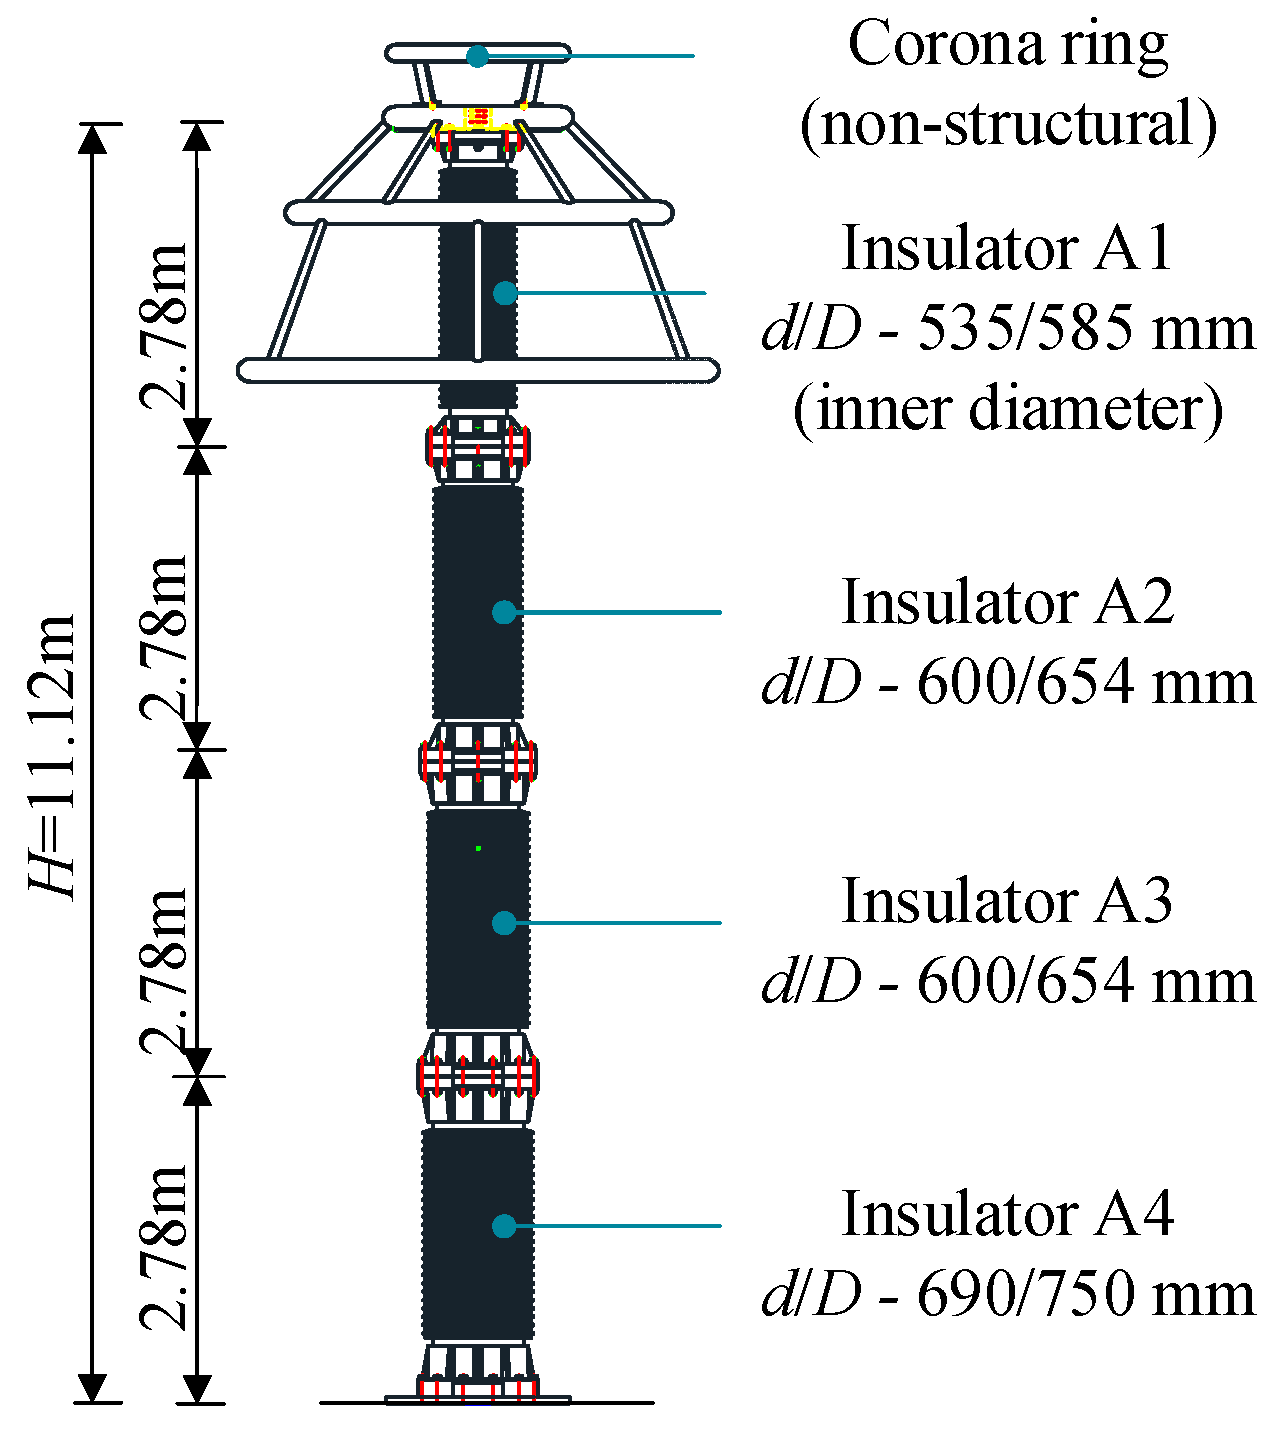
As depicted in Figure 5, the 1000 kV surge arrester, which was the specimen in this study, consisted of four 2.78 m long composite insulators. The inner diameters, di, of the GFRP tube were determined by the varistor installed inside the tube; the diameters were 535 mm, 600 mm, 600 mm, and 690 mm for insulators A1, A2, A3, and A4, respectively. The outer diameter, Di, was equal to d + 2t, in which t was the thickness of the hollow core composite tube. The density of the GFRP composite was around 1800 kg/m3, and the elastic modulus was around 22 GPa. Components such as the metal end fitting and non-structural components were not modelled, but their masses were added to the model. It weighed 600 kg at the top, representing the corona ring and bus bar at top. The masses for insulators A1 to A4, excluding the mass of the composite tube, were 530 kg, 540 kg, 640 kg, and 640 kg.
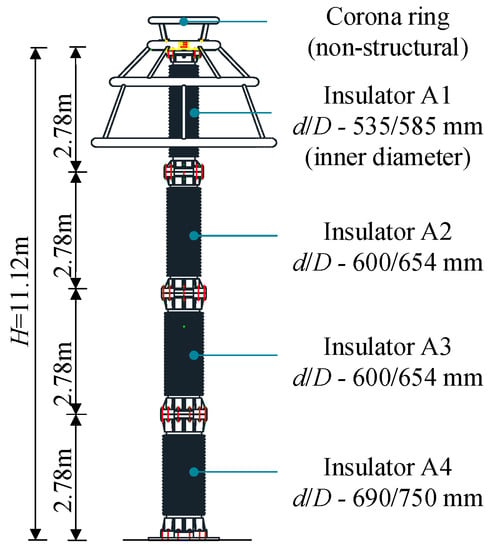
Figure 5.
Dimensions of the 1000 kV surge arrester with four composite insulators.
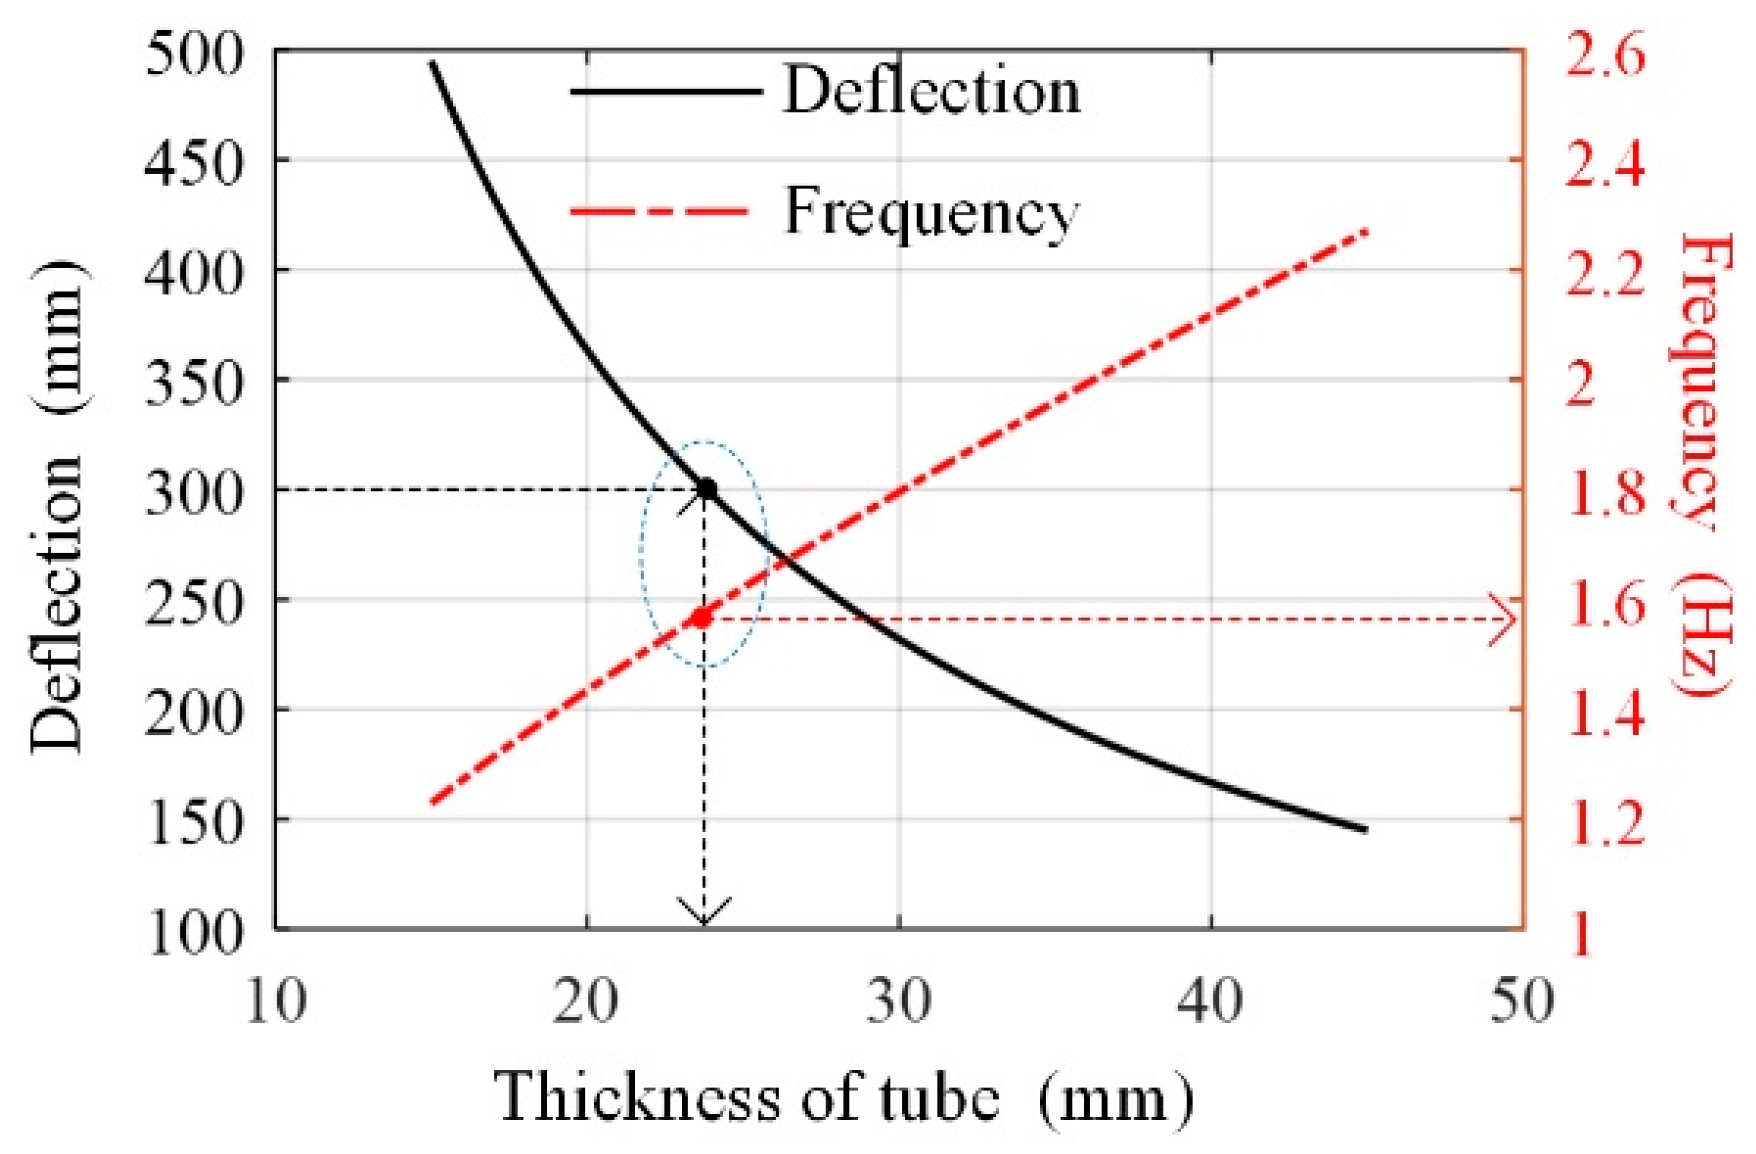
The seismic demand on the displacement of the cantilever structure is generally related to the rigidity of composite tubes. The criteria limit for the deflection of the cylindrical electrical equipment was 1/18 of its length, or 600 mm [49]. The safety margin requirement of 1.67 limited it to 360 mm. Considering uncertainties in modelling, our target of deflection was set to 300 mm in the design of the composite tube. A finite element (FE) model of the specimen with the beam element was built, as shown on the left side of Figure 5, and the thickness of the composite tube was taken as a variable, changing from 10 mm to 50 mm. The response spectrum method was adopted in this parametric analysis. Figure 6 shows that the targeted 300 mm deflection corresponded to a 24 mm thickness of the tube and 1.58 Hz of fundamental frequency. Thus, the thickness of the tube for the insulator at the top was chosen as 25 mm, and a slightly larger thickness, 30 mm, was selected for the insulator at the bottom. The inner/outer diameters of the four insulators became 535/585, 600/654, 600/654, and 690/750 (in millimetres). These values were adopted in the production and experiments in this study.
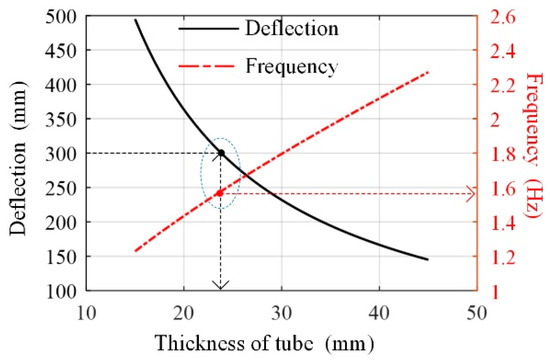
Figure 6.
Relationship among tube thickness, deflection at the top, and primary frequency.
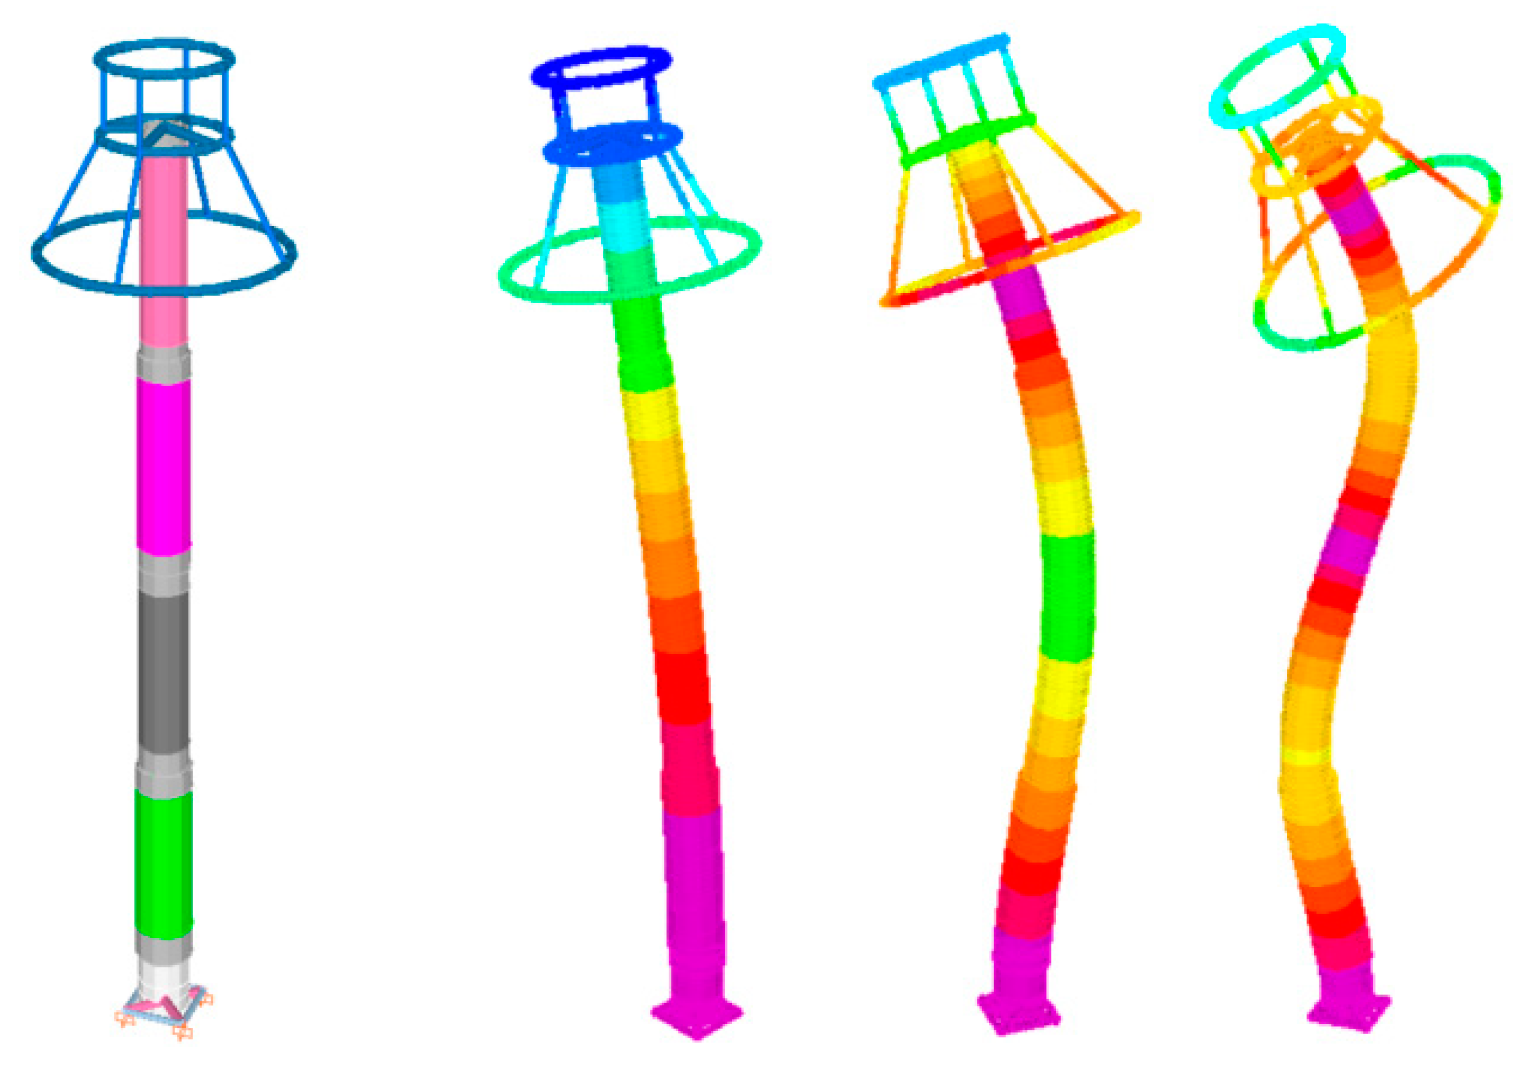
The vibration modes of the equipment are shown on the right of Figure 7, and the frequencies of the first three modes were 1.73 Hz, 8.8 Hz, and 22.5 Hz. By inputting the 1.4 × 0.5 g PGA seismic motion, a time history analysis was carried out to estimate the seismic demand of the specimen. As depicted in Figure 8, the bending moment at the base was 665 kN·m, and the displacement at the top was 265 mm. A safety margin of 1.67 demanded that the composite insulator should withstand a bending moment of 1112 kN·m.
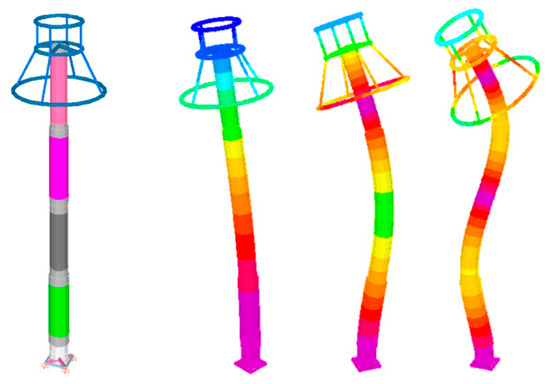
Figure 7.
FE model of the 1000 kV surge arrester (left) and the first three mode shapes (right).

Figure 8.
Seismic demand estimation of the 1000 kV surge arrester based on the linear FE model, according to the acceleration spectrum in the GB 50260 and Q/GDW 11391 standard.
3. Bending Test of Composite Insulator with Retrofitted Bonded Sleeve Joints
3.1. Bonding Failure at the Joint of Composite Insulators under Bending
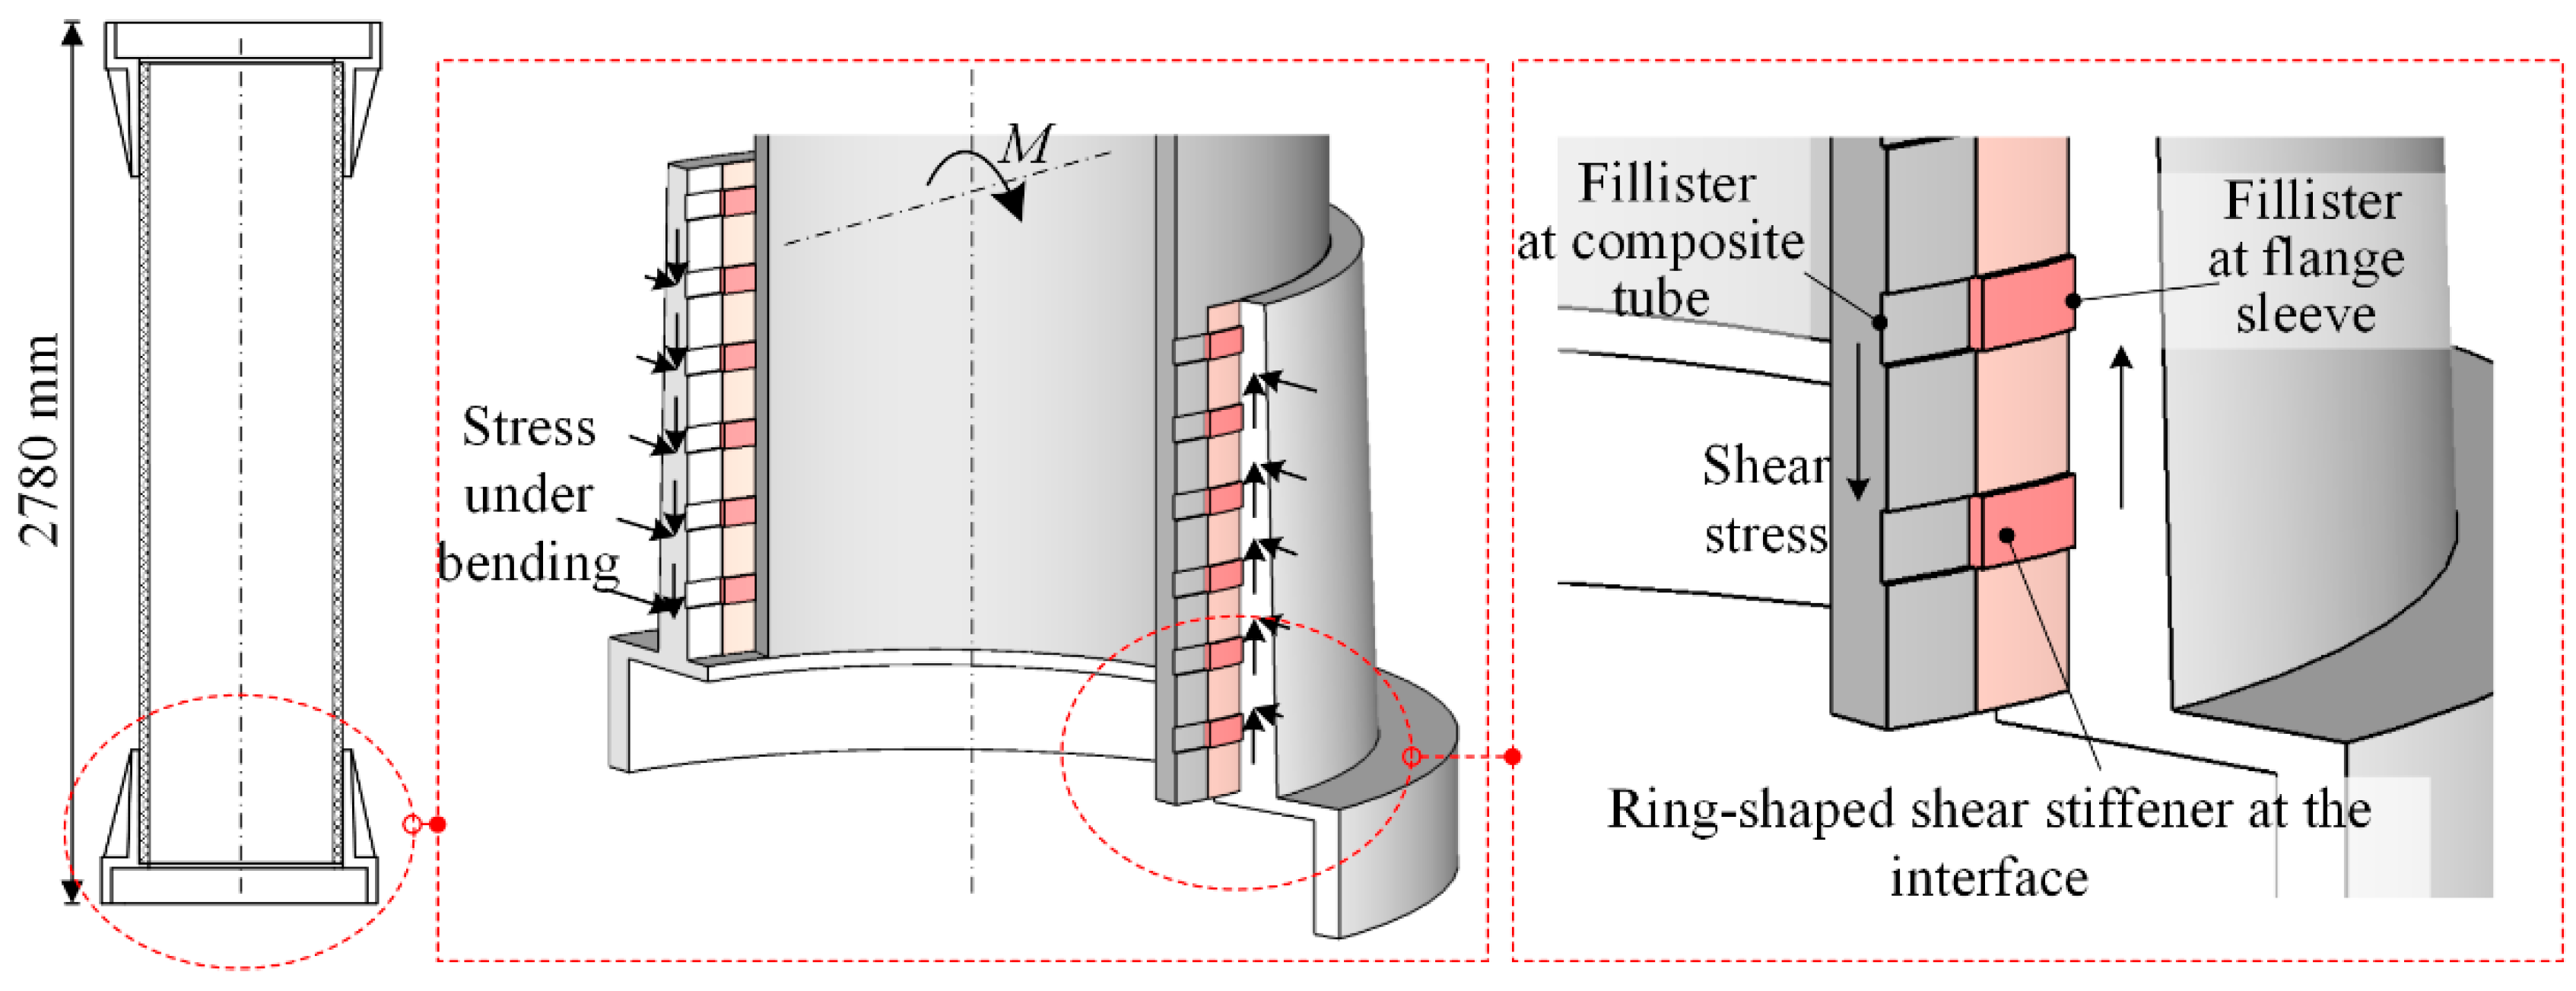
As depicted in Figure 4, the bonded sleeve joint of the composite insulator utilized epoxy as the adhesive, and a layer of epoxy was created between the inner face of the metal sleeve and the outer face of the composite tube. Figure 9 illustrates that the bending moment is resisted by tangential shear and lateral pressure stress at the cohesive joint.

Figure 9.
The bonded connection at the end of the composite insulator.
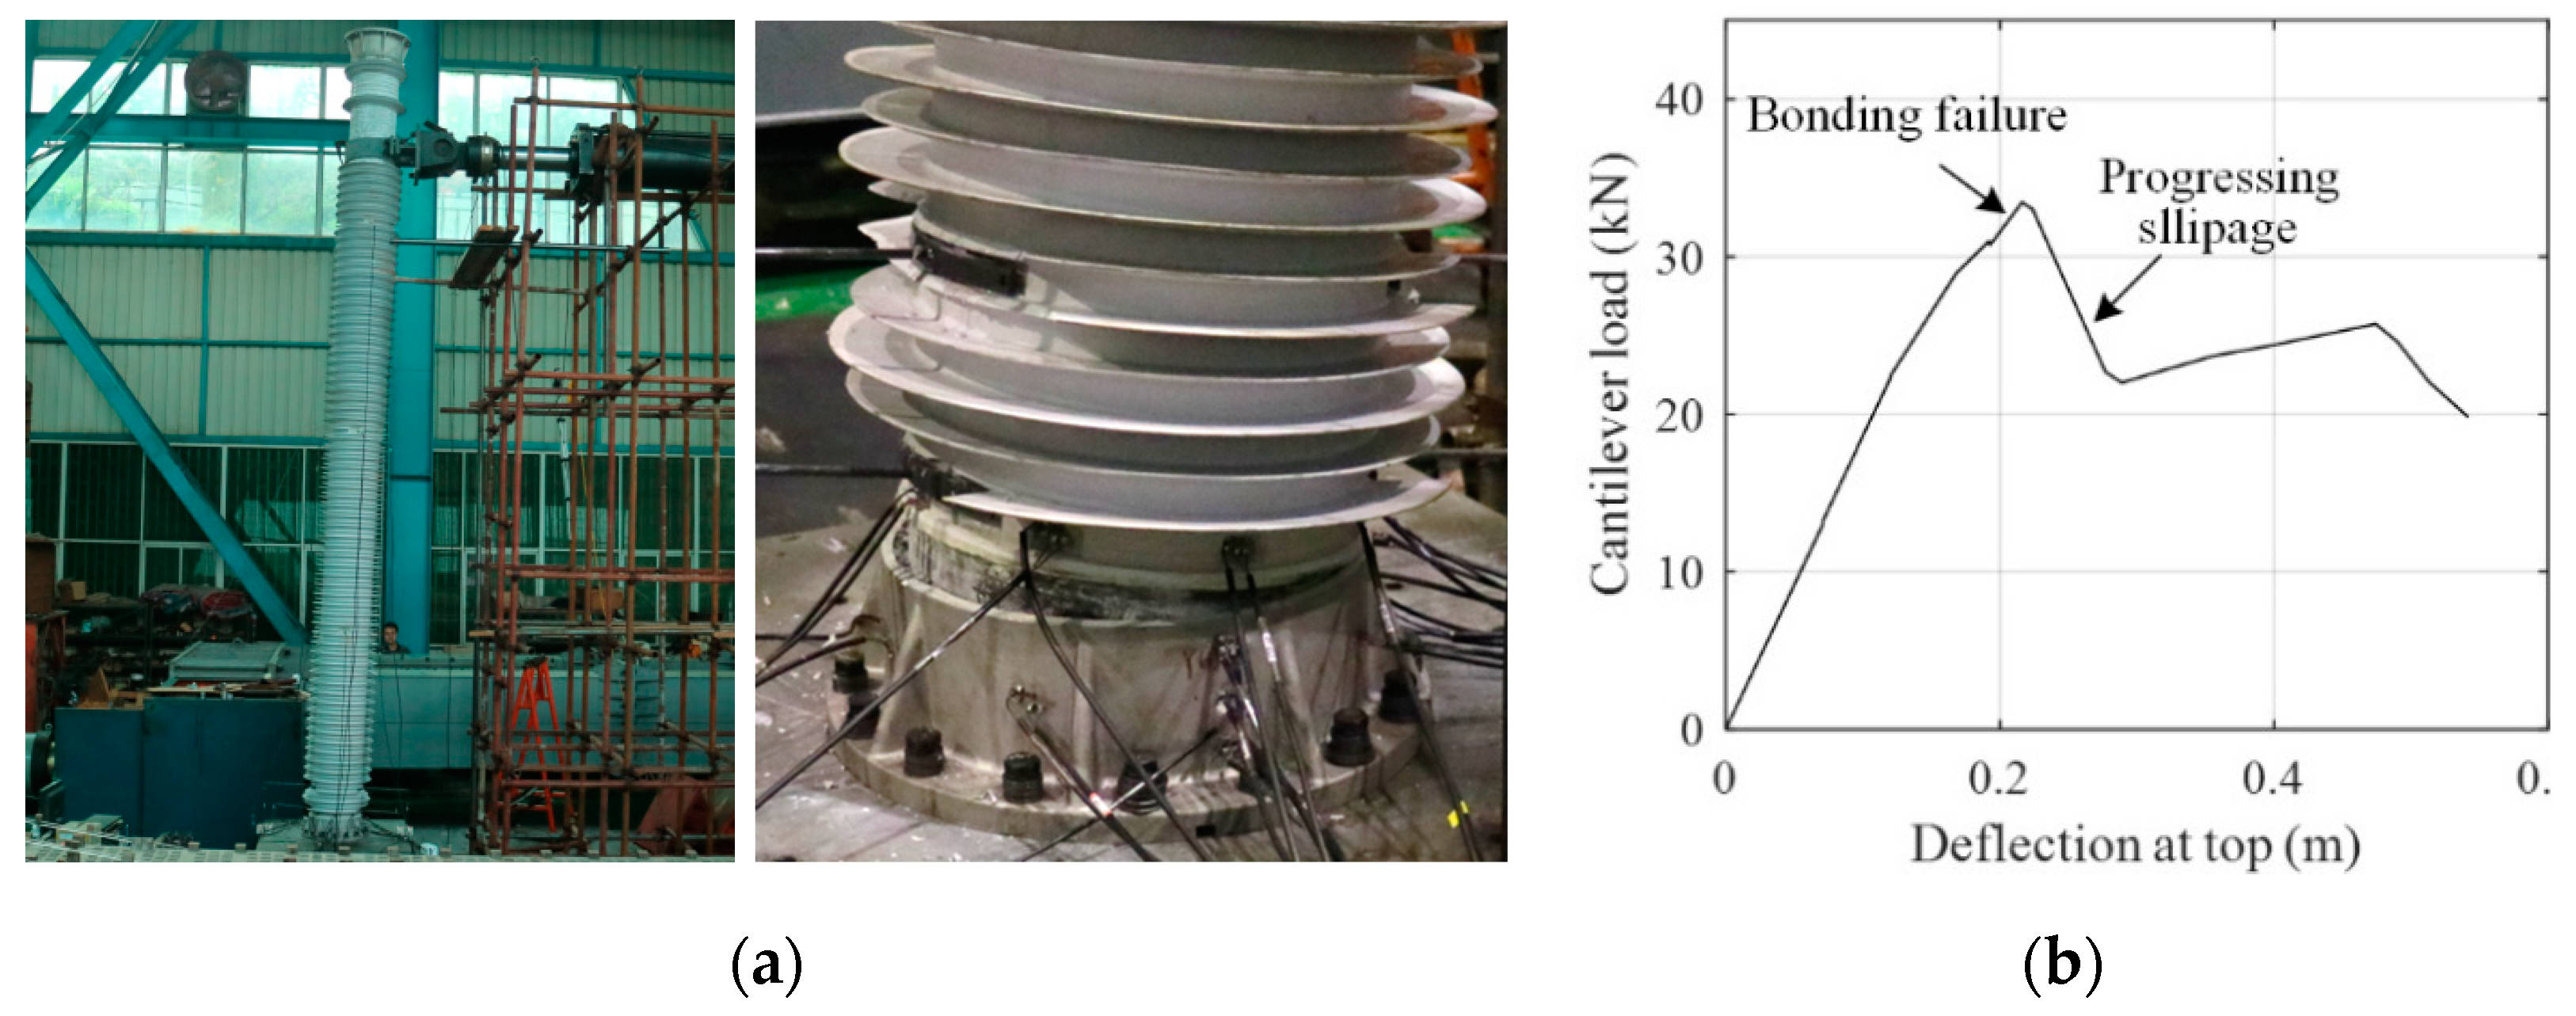
When the combined stress reaches a threshold, bonding failure may happen. Previous testing on an 800 kV composite post insulator by the authors [33], as seen on Figure 10a, revealed that the bonded joint at connection was a significant weak point. When the load reached 33 kN, slippage or pull-out occurred at the bonding interface, resulting in a significant loss of stiffness and loading capacity, as indicated by a sharp turn in the loading–deflection curve shown in Figure 10b. The maximum stress on the composite tube was approximately 80 MPa, considerably lower than the bending strength of the tube.
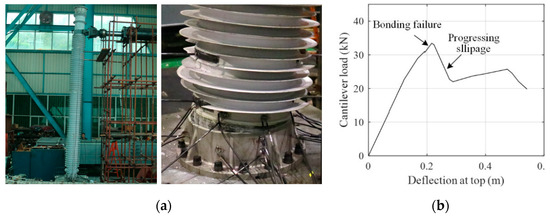
Figure 10.
Bonding failure of an 800 kV composite insulator under a cantilever bending test (a) and loading–deflection curve (b) [33].
3.2. Bending Test of Composite Insulator Retrofitted with Shear Stiffeners
The bending failure of the composite insulator was found to be localized at the joint, indicating that retrofitting may be focused on the bonded sleeve joints and the remaining components could remain unchanged. Examining the joint revealed debonding at the interface of the aluminium and epoxy layer, with no adhesion remaining on the inner face of the aluminium flange, indicating the bonding strength between the epoxy and aluminium was insufficient.
In order to enhance bonding, the manufacturer of the composite insulators designed shear stiffeners at the bonding interface. As illustrated in Figure 11, fillisters were cut into the inner surface of the sleeve and the outer surface of the GFRP tube, thus creating a sequence of ring-shaped voids that were to be filled with epoxy. When the epoxy had fully solidified, it turned into ring-shaped stiffeners inserted between the flange sleeve and GFRP tube. Figure 11 illustrates the distribution of shear stresses at the flange sleeve and the composite tube under bending moment. The stiffeners improved the shear resistance at the bonding interface, thereby retrofitting the composite insulator for the bending load.
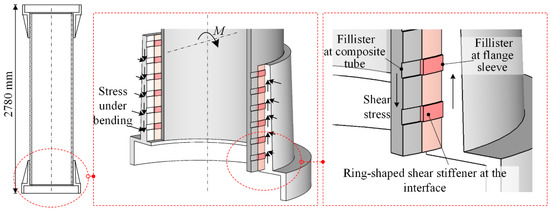
Figure 11.
Section of the bonded sleeve joint for the GFRP composite insulator retrofitted by ring-shaped shear stiffeners.
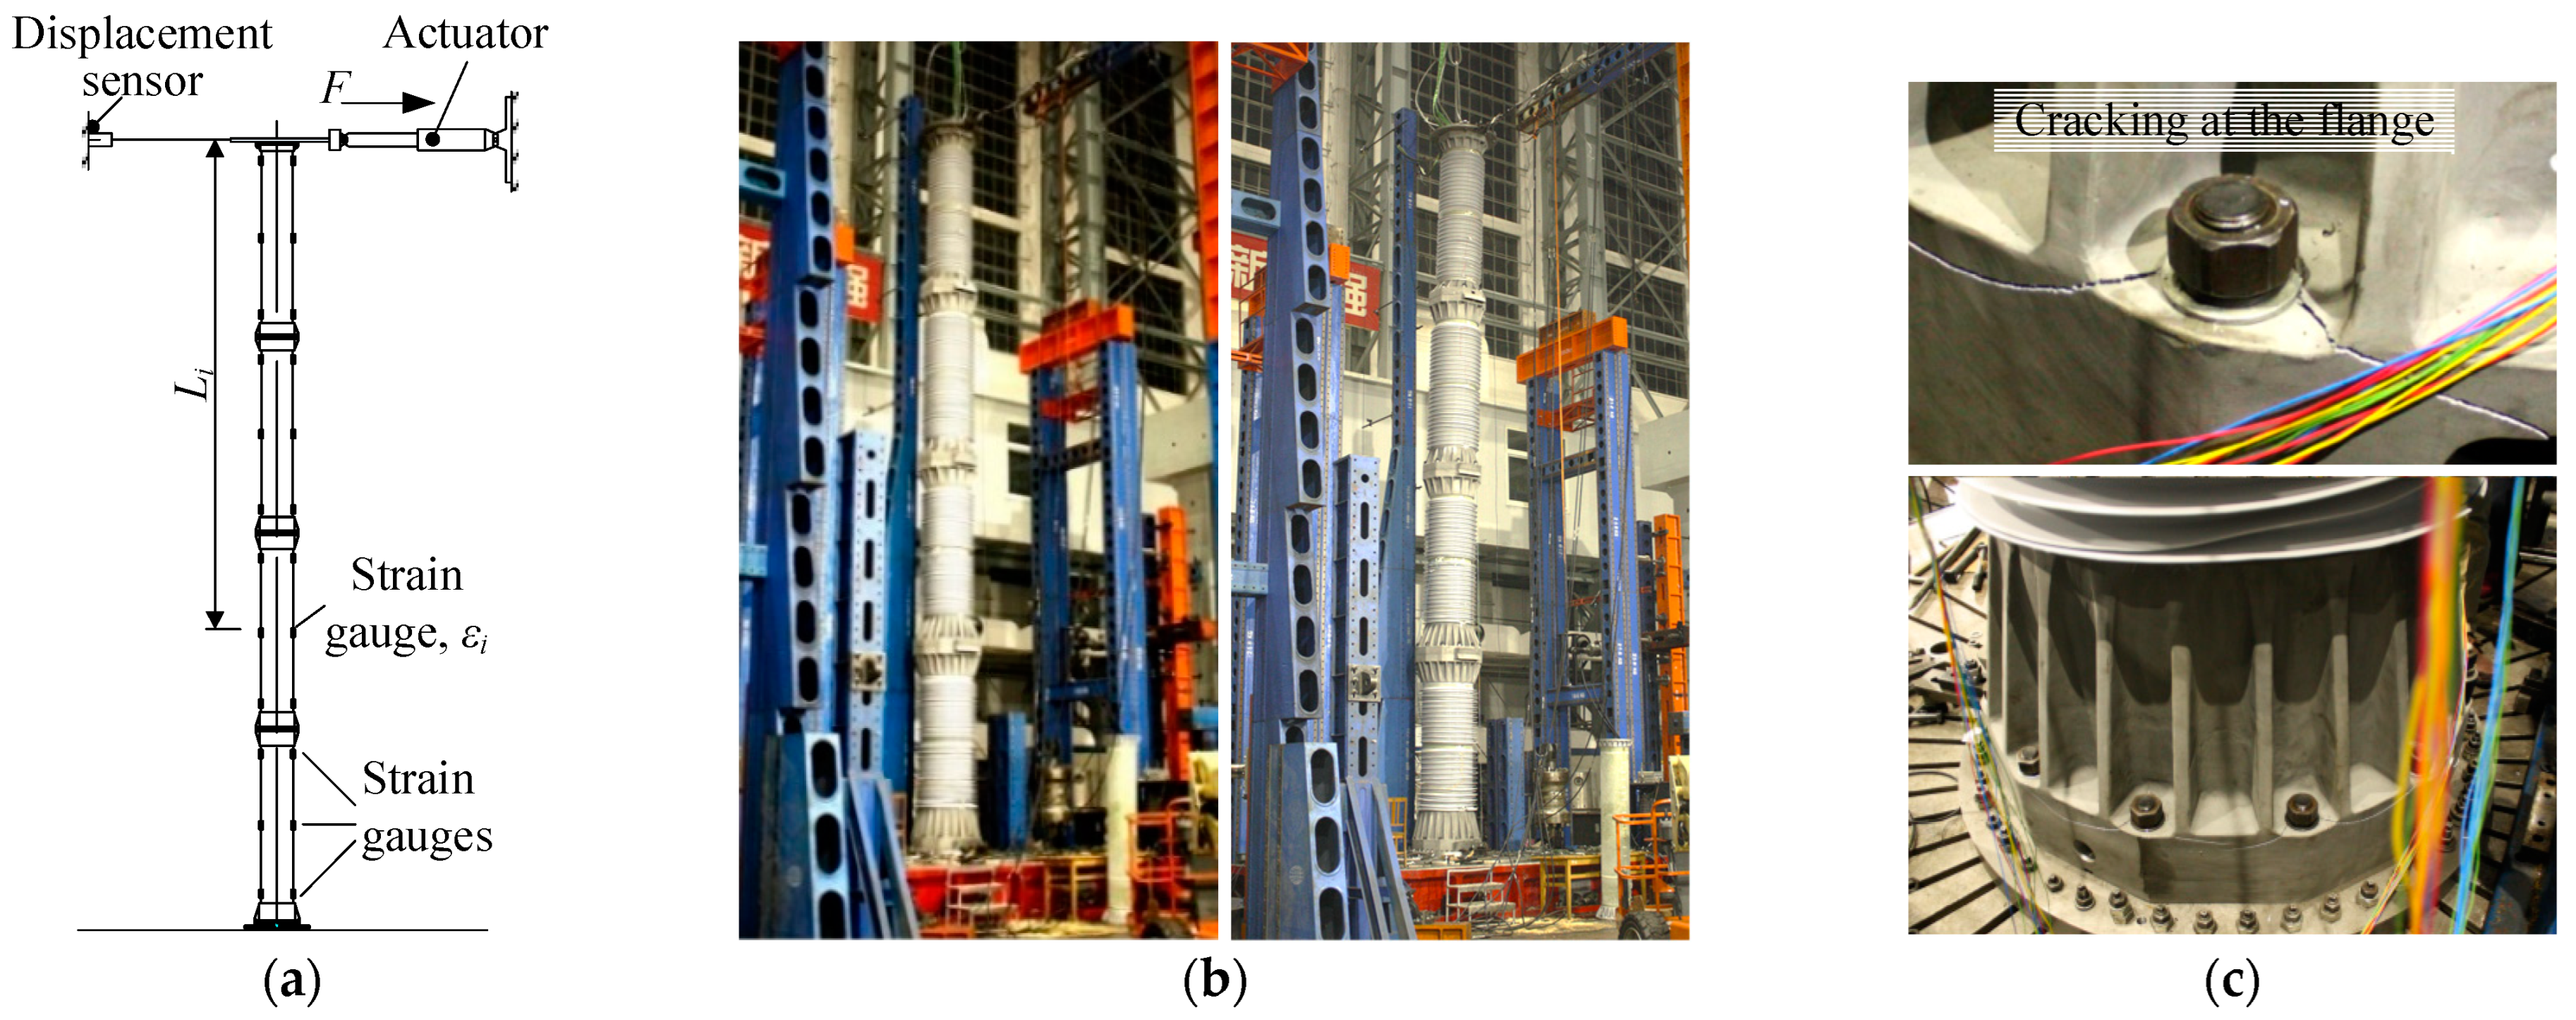
A full-scale bending test was conducted to evaluate the performance of the aforementioned retrofitting on the composite insulators of the 1000 kV surge arrester. Figure 12 shows the specimen, which was made up of 4 insulators and was 11.2 m long. The joints at the insulators had ring-shaped shear stiffeners applied for retrofitting, and the flange was made of cast aluminium. Figure 12a depicts the setup for the bending test. Figure 12b illustrates the application of a cantilever force at the top, where the displacement was measured. The pull force at the top gradually increased until the bending failure of the specimen. The testing setup and loading protocol followed the procedure in [49].
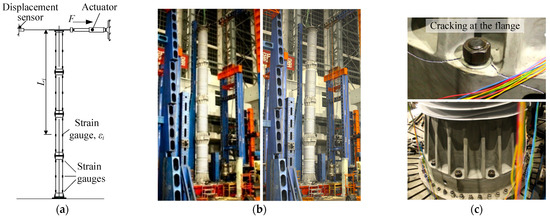
Figure 12.
Cantilever bending test of composite insulators retrofitted by shear stiffeners. (a) Test setup. (b) Specimen and loading facility. (c) Cracking of the flange.
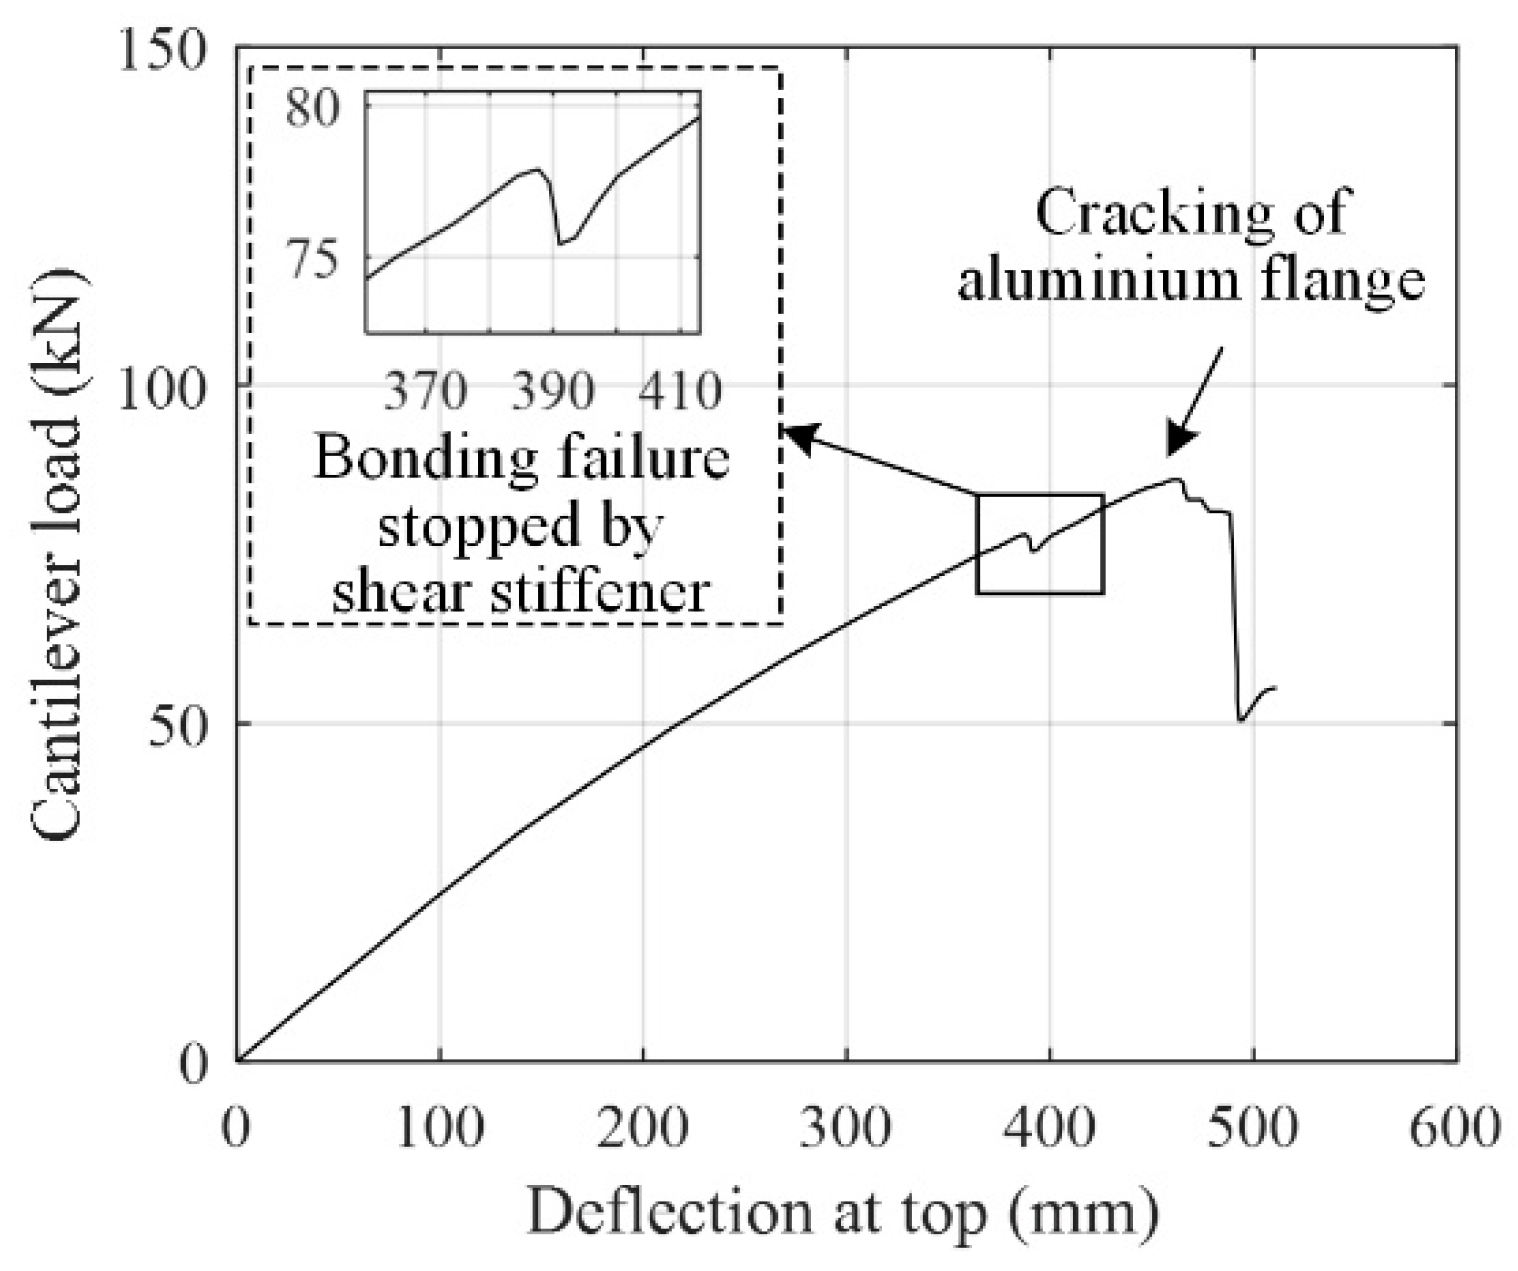
Figure 13 shows the loading–deflection curve of the bending test. When the loading reached 78 kN (corresponding to an 867 kN·m bending moment), audible sound emission and a minor drop in force occurred, indicating the debonding at the interface. However, as shown in the zoomed window of Figure 13, the specimen continued to undertake lateral loads, proving that the shear stiffeners were successful in preventing the development of bonding failure at the interface. Following that, an abrupt failure occurred at the base when loading reached 85.8 kN or 954 kN·m, as shown in Figure 12c. Interestingly, the break appeared at the cast aluminium sleeve, contrasted sharply with the debonding at the interface in the previous test (shown in Figure 10). By referring to the crack’s location and orientation, it can be concluded the crack was brought on by tension stress, implying the cast aluminium flange’s lack of tensile strength. The ultimate bending moment at the bottom was 963 kN·m, lower than the targeted 1112 kN·m predicted in Section 2.
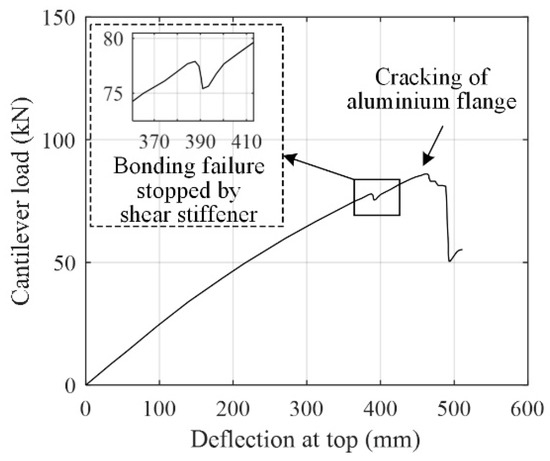
Figure 13.
Cantilever loading–deflection curve recorded in bending test I.
3.3. Bending Test of Composite Insulator Retrofitted with Cast Iron Flanges
A second attempt to retrofit the specimen was carried out, in order to complete the partially successful design in Section 3.2. The strength of the flange could be greatly increased by exchanging the cast aluminium flange at the base for a cast iron flange. The specimen’s weight only slightly increased as a result, and the cast iron flange could be made using the same mould. Therefore, the specimen was kept the same as the one in Section 3.2, with the exception that the flange at the base was made of cast iron.
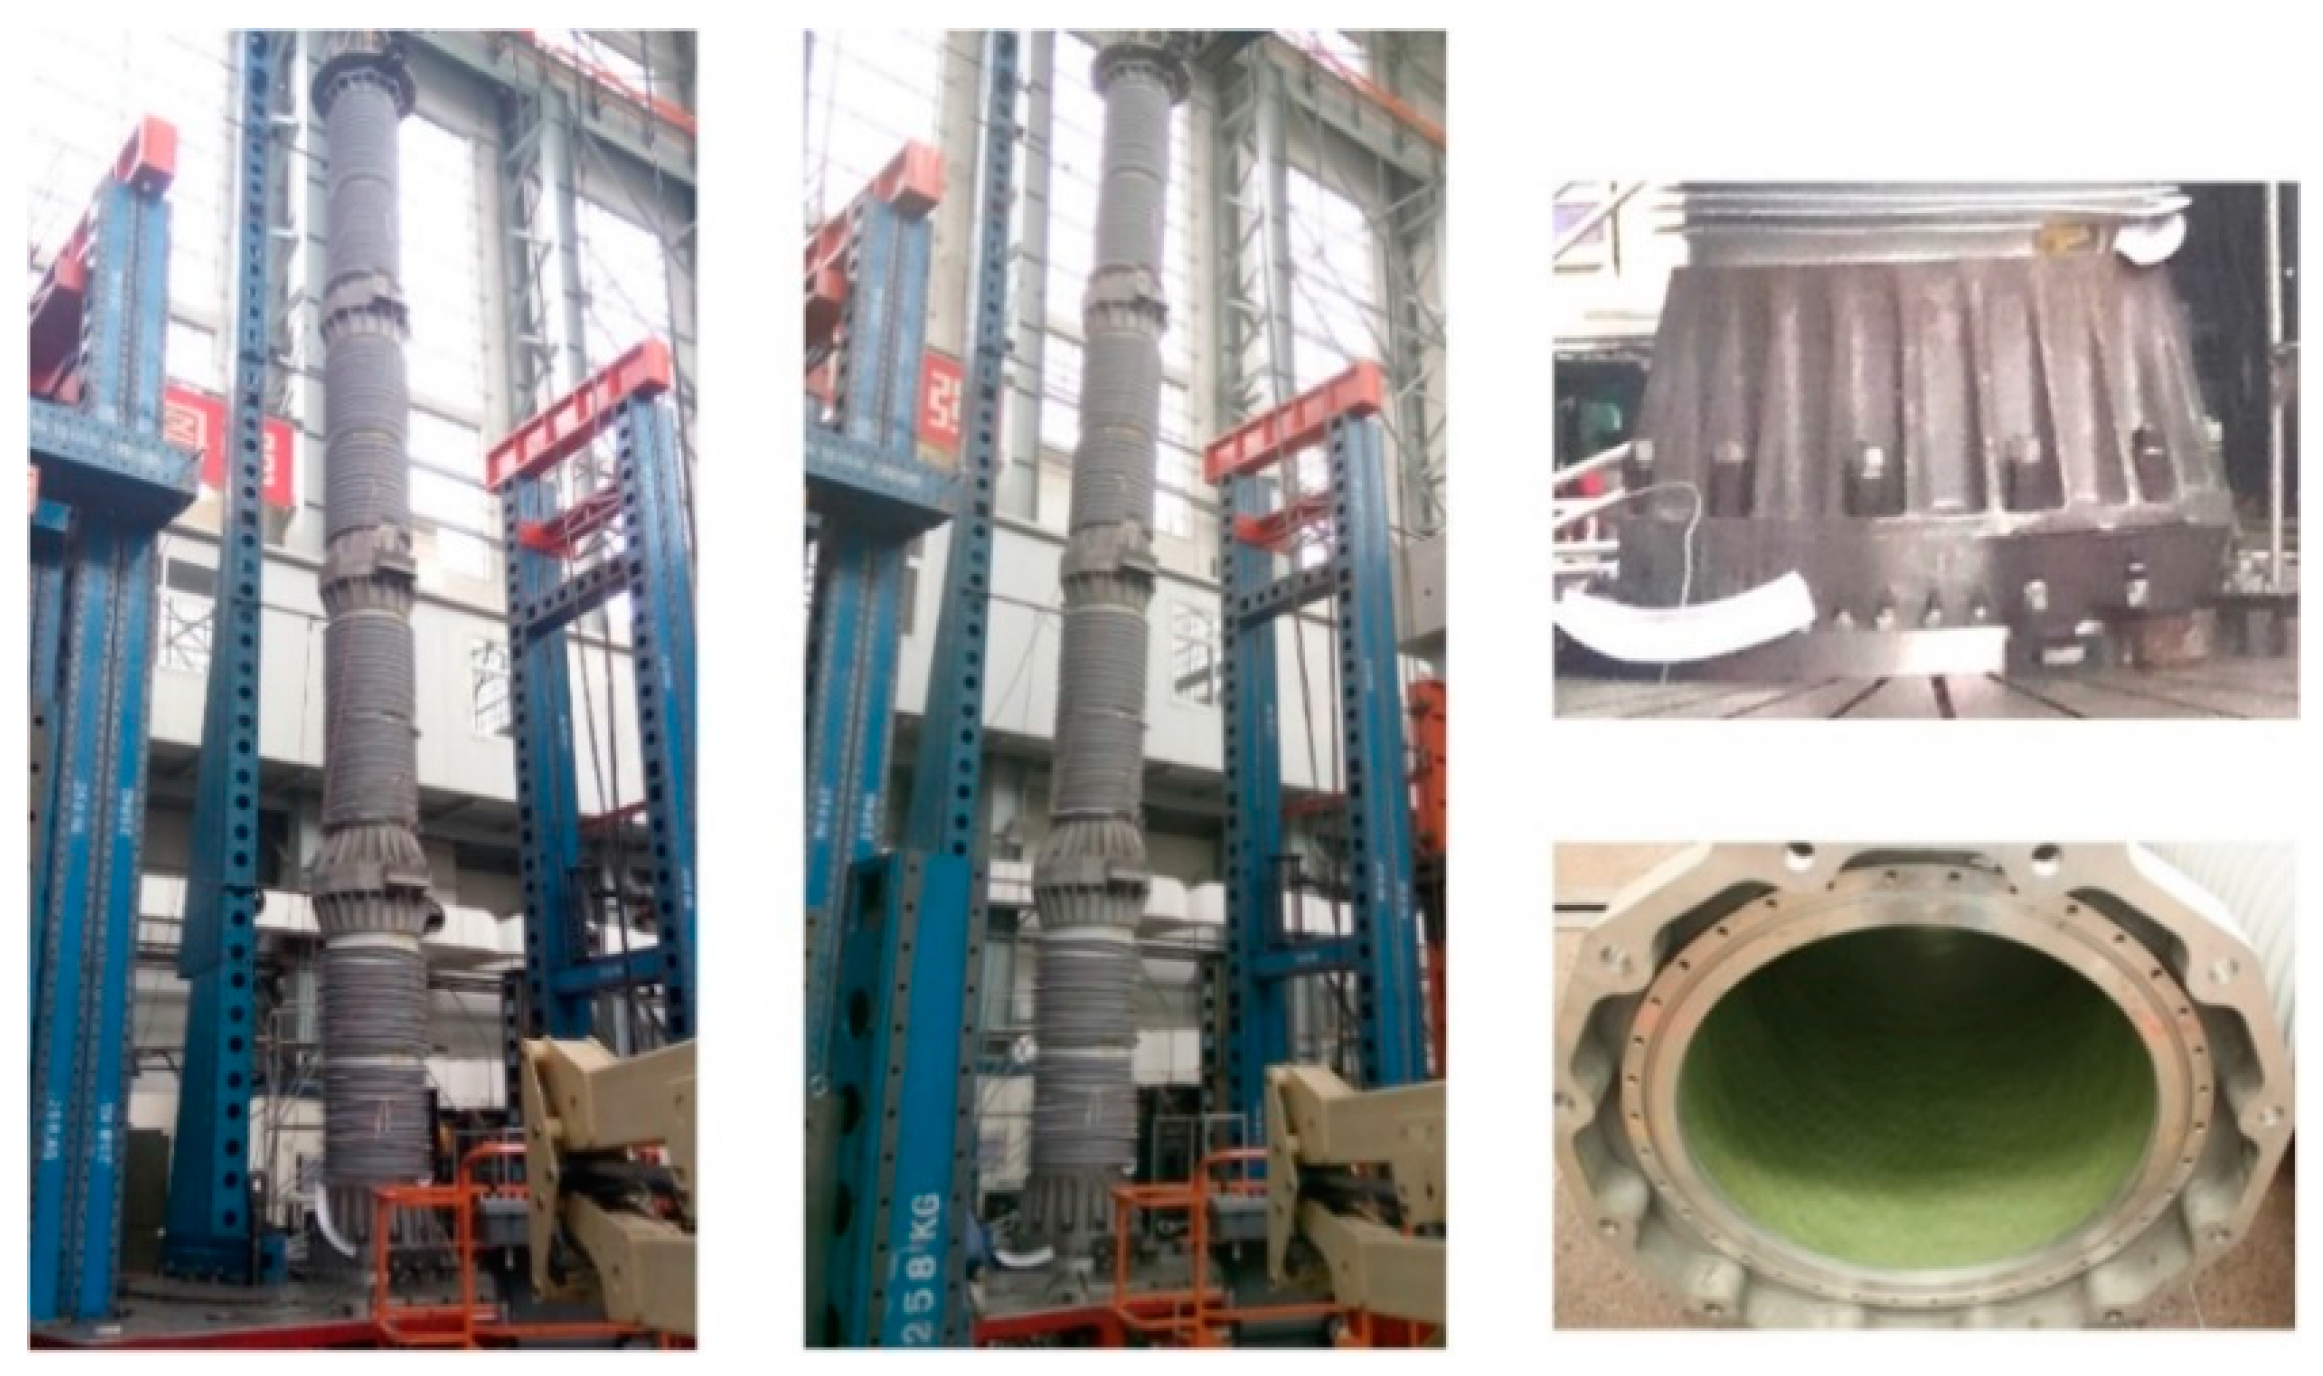
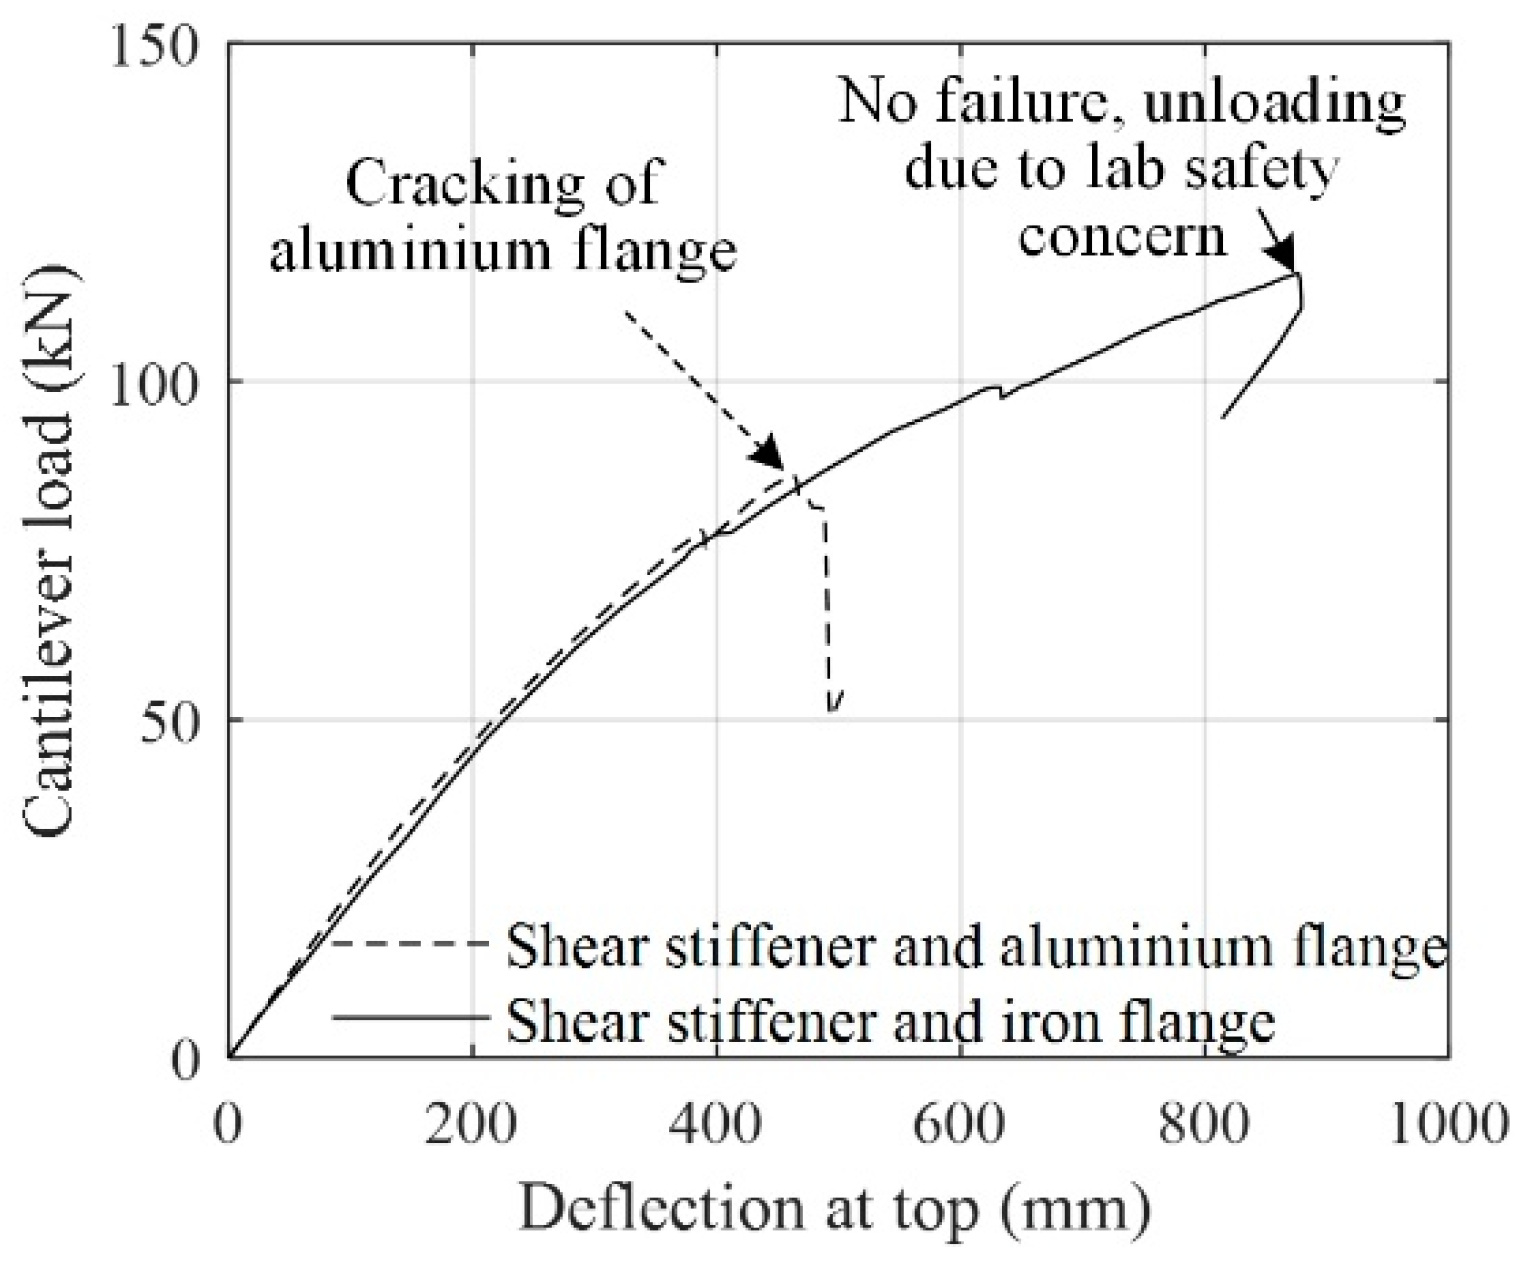
Figure 14 shows a repeat of the bending test, and Figure 15 depicts the loading–deflection curve. An acoustic event was initially heard when the load was 74.7 kN. The force was close to the 78 kN in Section 3.2, which corresponded to the initial debonding at the joint that was stopped by the shear stiffeners. After that, a major acoustic emission event occurred when the load was 96 kN with 780 mm deflection. The resistance force slightly decreased, and the stiffness deterioration became more pronounced. This incident could be caused by the partial breakdown of some shear stiffeners. Notably, the specimen continued to withstand bending loads after 1067 kN·m, which indicated the structure’s earthquake resilience.
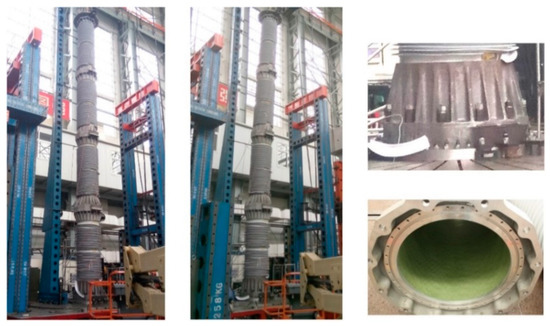
Figure 14.
Cantilever bending test of composite insulators retrofitted by shear stiffeners and cast iron flange.
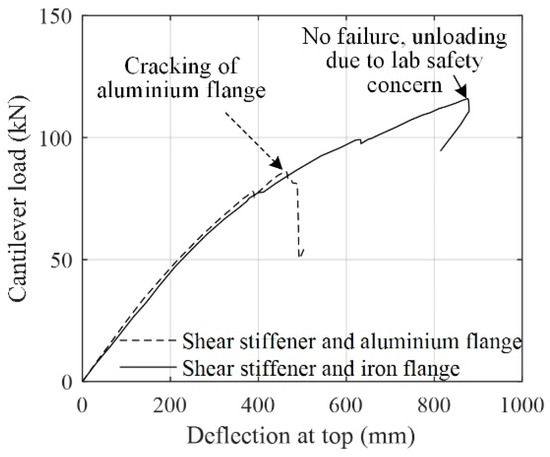
Figure 15.
Cantilever loading–deflection curve recorded in bending test II.
When the load reached 117 kN or 1301 kN·m with 1080 mm deflection at the top and 115 MPa stress at the tube, the testing was ended. The testing was terminated because of safety concerns in the laboratory. This load was considerably larger than that of the estimated seismic demand in Section 2. As shown on the right side of Figure 12, the specimen was inspected after the test. The effectiveness of the retrofitting at the bonded sleeve joint was demonstrated by the absence of slippage in the bonded interface or crack on the metal flange.
4. Seismic Performance Validation by Full-Scale Shaking Table Test
4.1. Testing Design
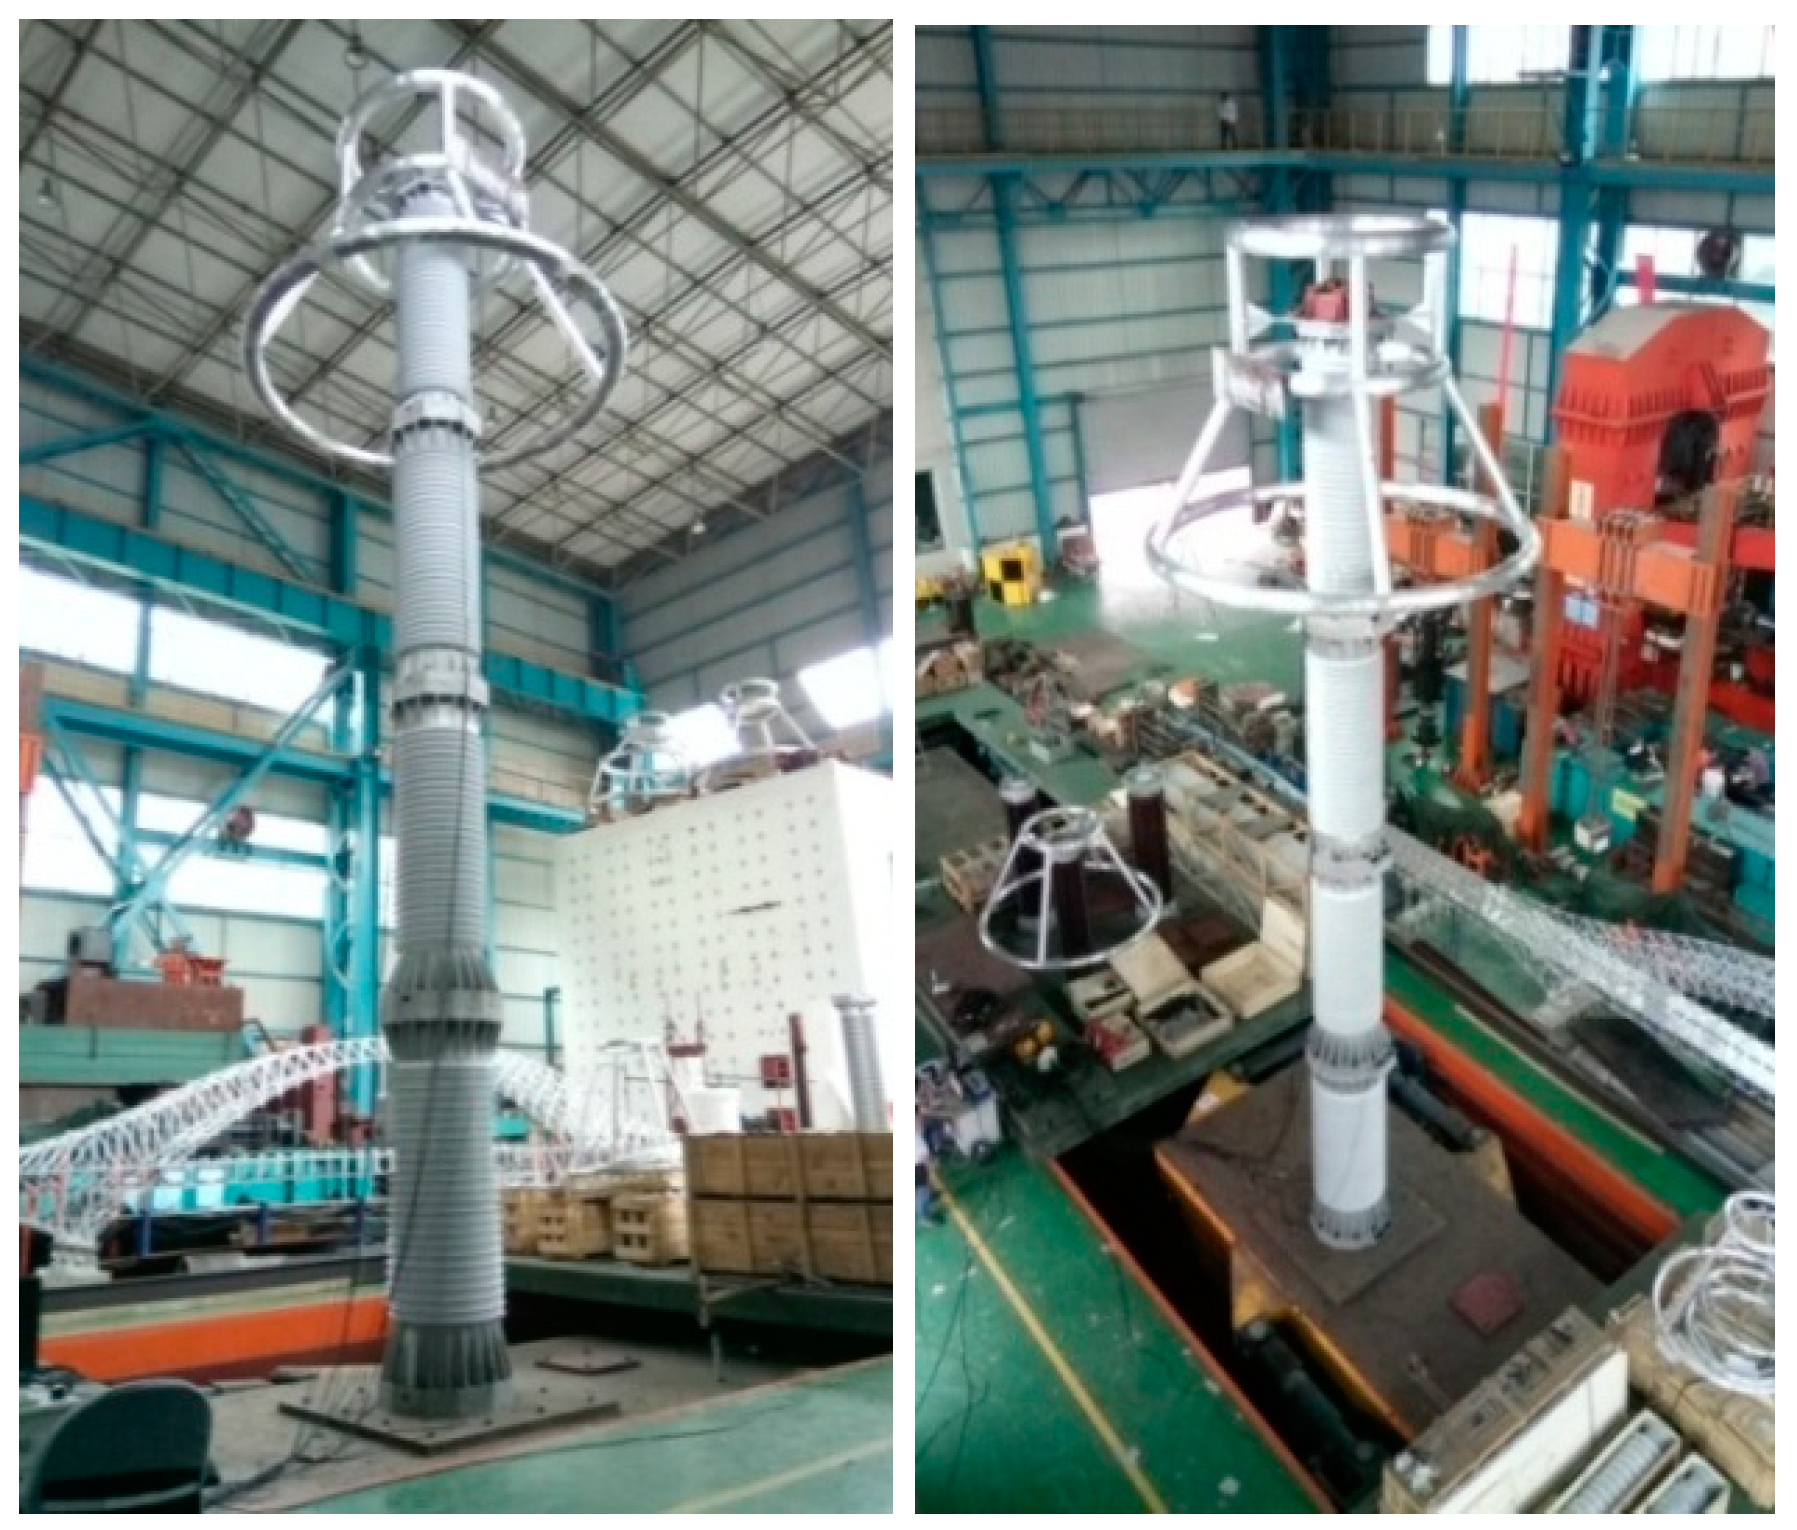
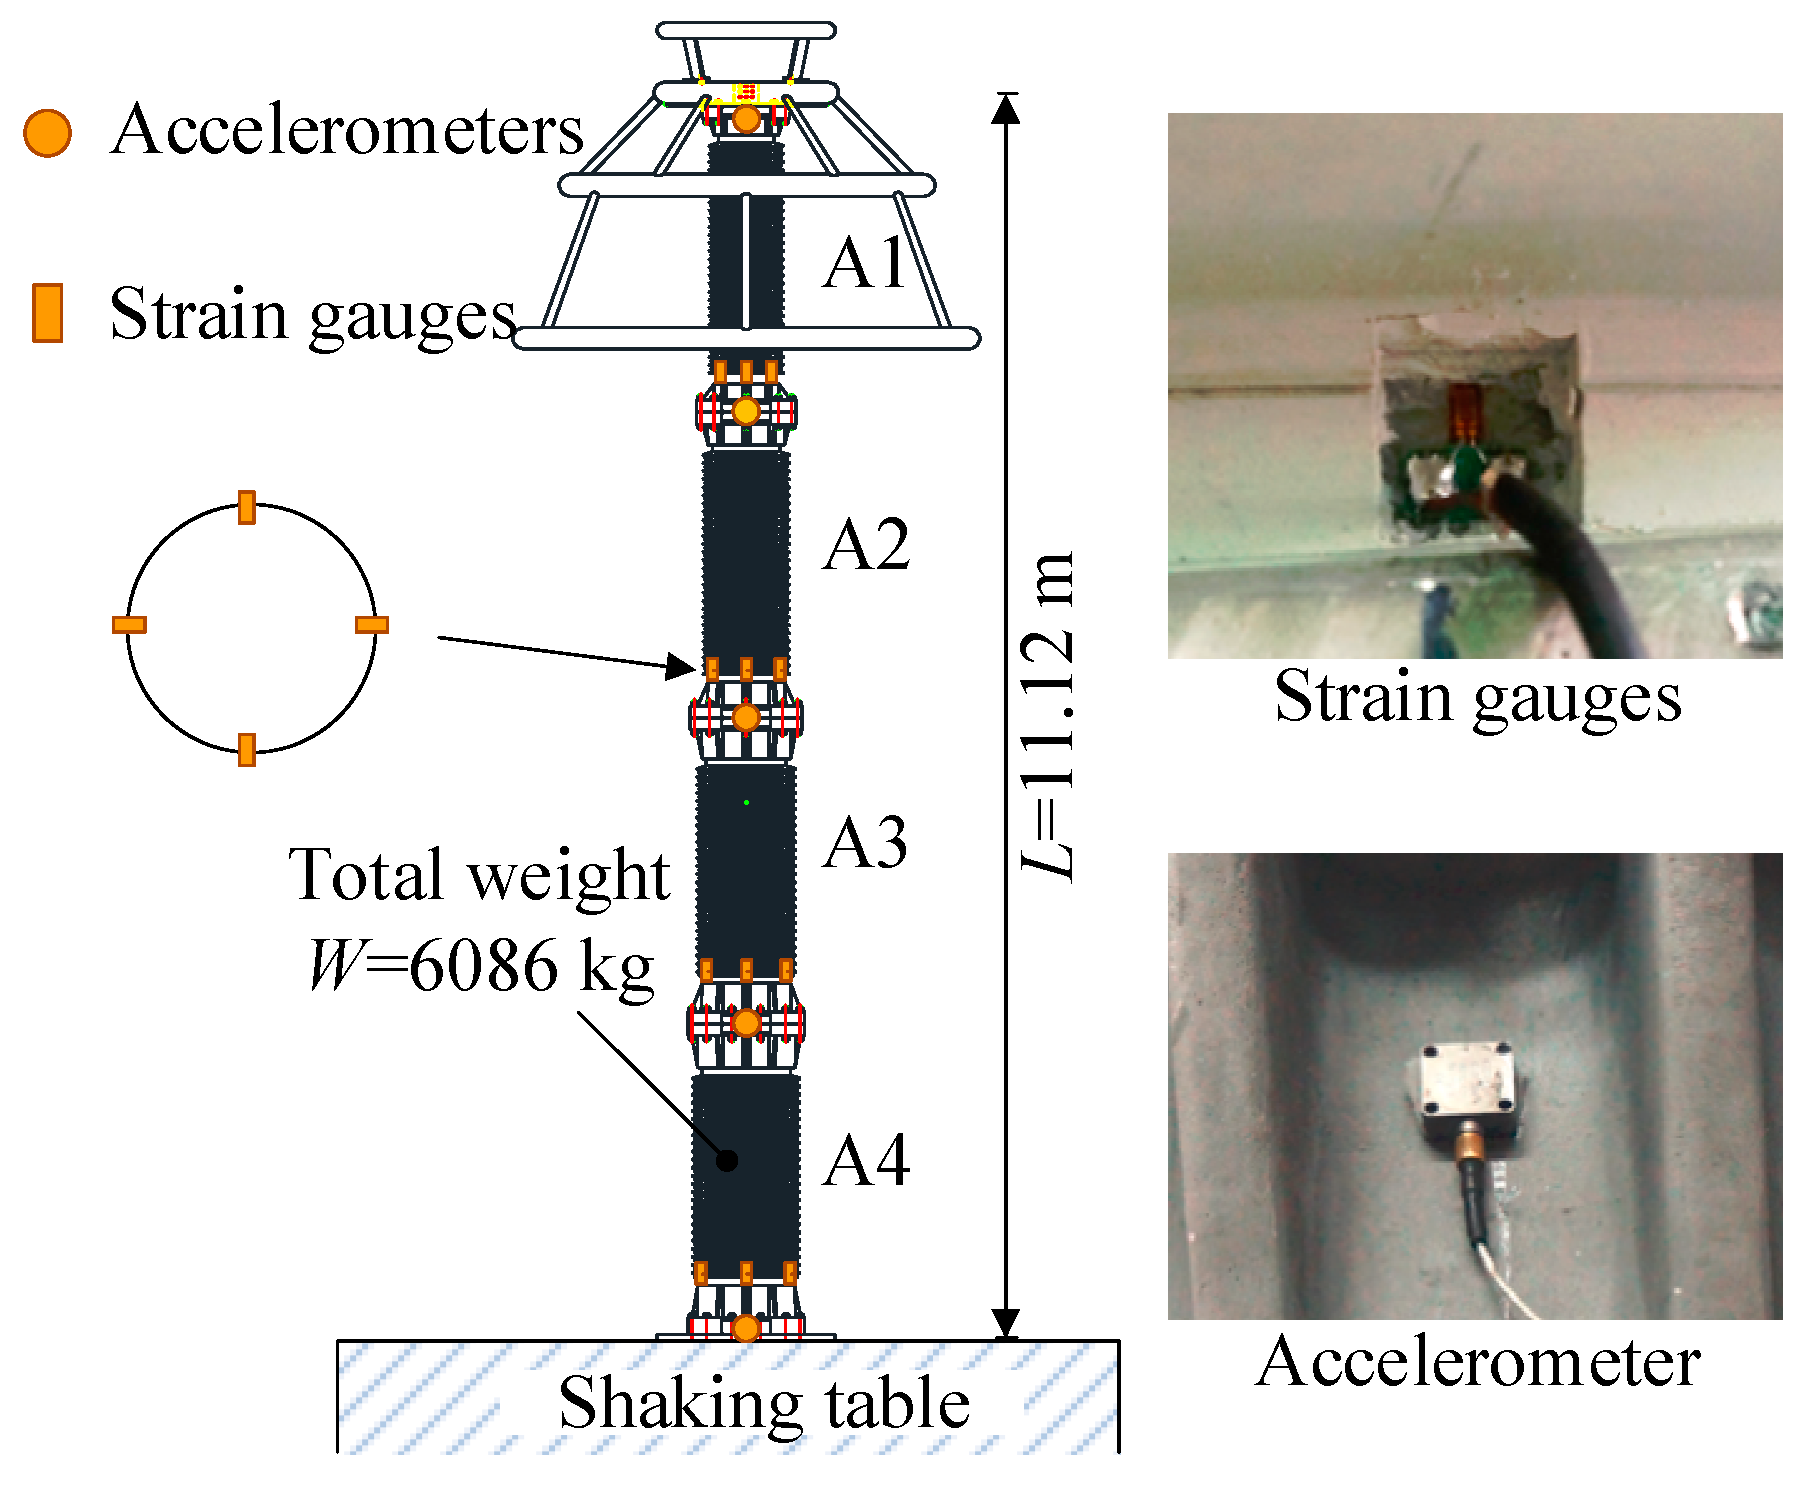
In this section, a full-scale shaking table test was conducted as a direct method of seismic performance validation of the surge arrester with the retrofitted composite insulators. All of the electrical parts had been assembled inside the surge arrester, and the insulators utilized were the same as those in the flexural test. The specimen was fixed on a 4 m by 6 m shaking table, as shown in Figure 16. Sensors were arranged as shown in Figure 17. It included strain gauges at the bottom of each insulator and accelerometers at the top. Displacements of the specimen can be acquired by integrating the acceleration curve, and deflections of the specimen can be obtained by subtracting the displacement at the top of the specimen from the displacement at the shaking table.
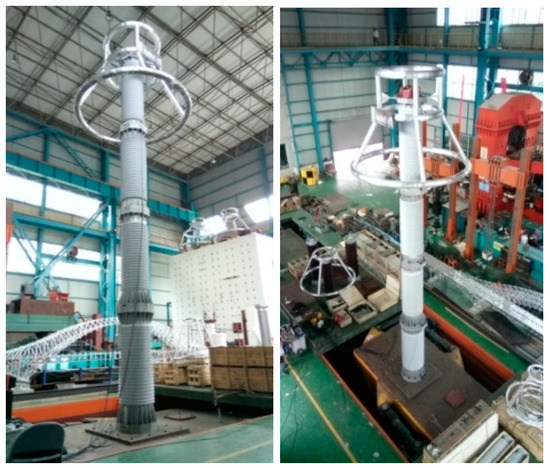
Figure 16.
Shaking table test of the 1000 kV surge arrester with GFRP insulators.
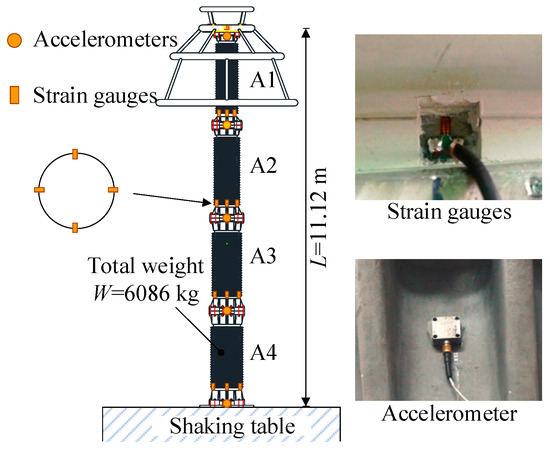
Figure 17.
Sensor arrangement in the testing.
The testing schedule is listed in Table 1. The influence of vertical stimulation was minimal due to the axial symmetric shape of the equipment and upright installation position. In the test, the base excitation was input in a single horizontal direction. The GB 50260 compatible artificial ground motion forms the major testing cases, as explained in the selection of input motion in Section 2.1.

Table 1.
Testing schedule.
Typically, in shaking table testing, both the artificial ground motion and the recorded ground motion excitation should be used. However, over-testing should be avoided for consistency in the succeeding test since the same full-scale specimen was used in electrical performance testing after seismic qualification. The recorded seismic motion excitation test was therefore not planned. The target PGA in the testing schedule increased from 1.4 × 0.1 g to 1.4 × 0.5 g in five tests so that the trend in the earthquake response against the magnitude of excitation could be analyzed.
4.2. Testing Result
- (1)
- Result in 1.4 × 0.4 g input test case
In this section, the result for 1.4 × 0.4 g test case is presented. Figure 18 shows the input acceleration at the table surface as well as the response acceleration spectrum. In the testing, the PGA was close to 0.60 g, and the TS could match the RS in the standard.

Figure 18.
Input excitation and test response spectrum in the testing of the 1.4 × 0.4 g test case.
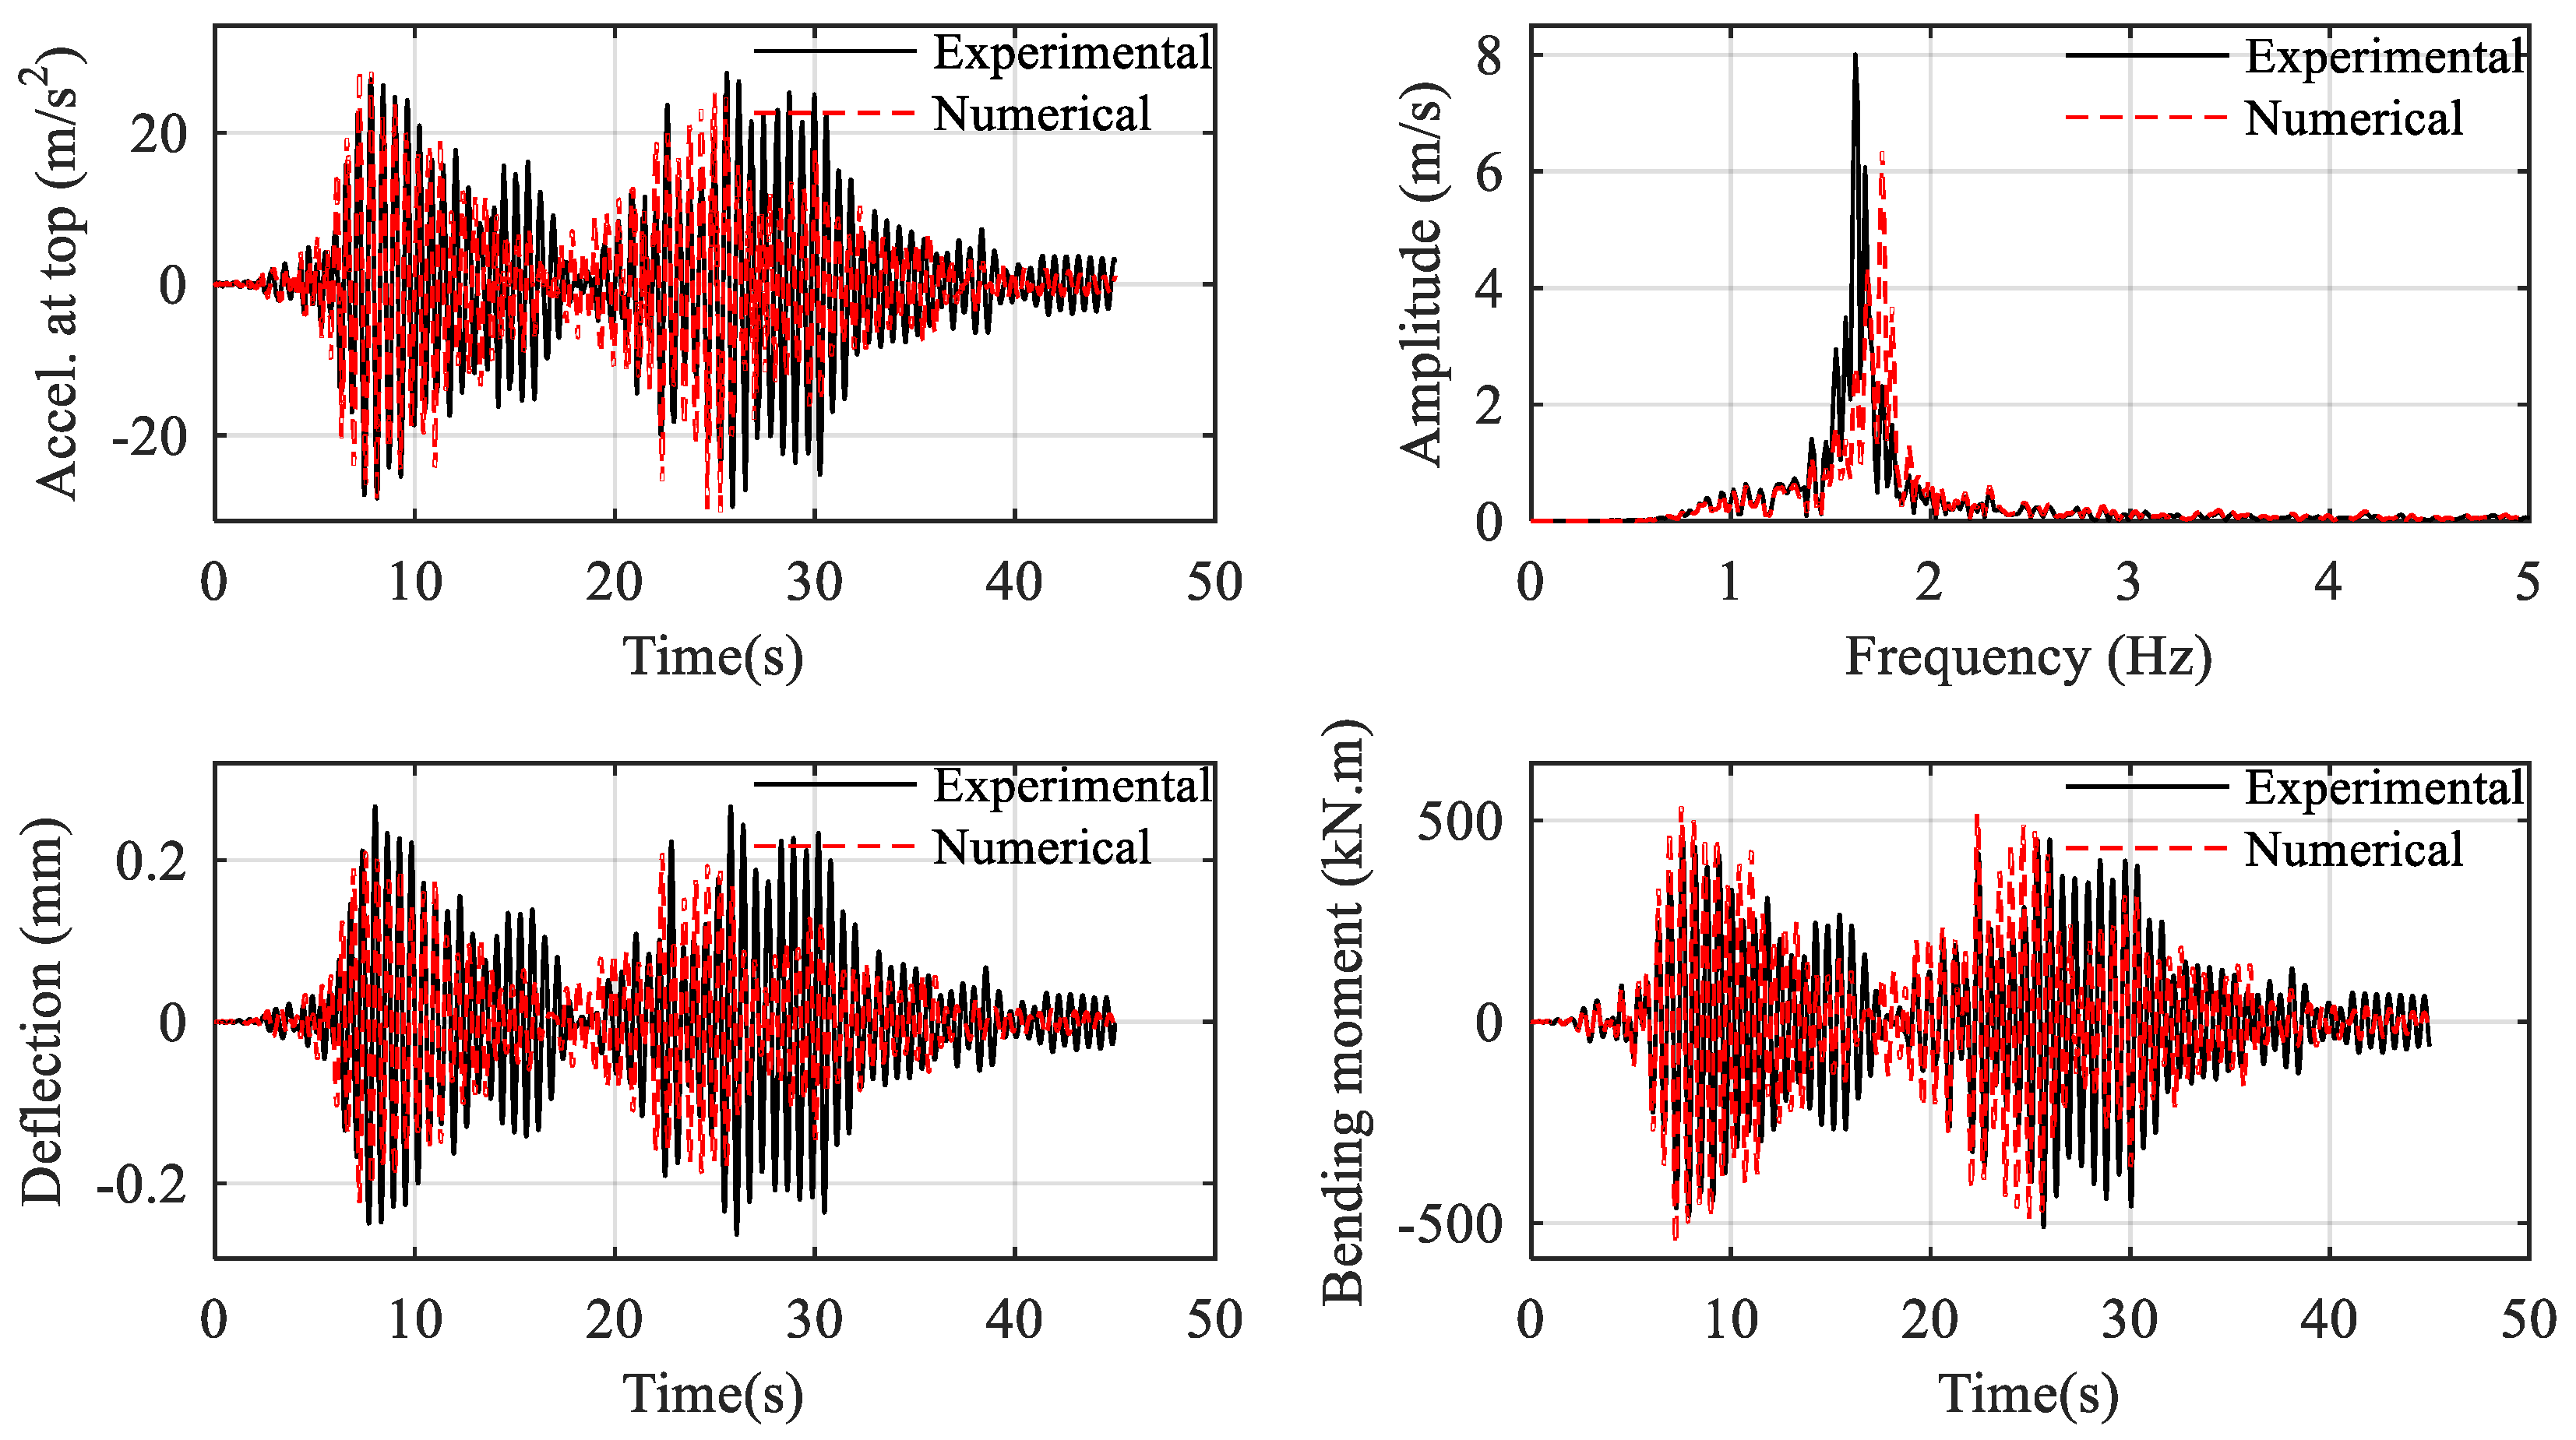
The curves of major response items are shown in Figure 19. For acceleration at the top, the testing result was 29.43 m/s2, and the corresponding numerical result was 30.08 m/s2, which had a different rate of −2.2%. For displacement at the top, the testing result was 0.267 m, and the corresponding numerical result was 0.224 m, which had a different rate of 16%. For bending moment, the testing results were 211 kN·m, 381 kN·m, and 525 kN·m at the bottom of insulators A2, A3, and A4, respectively, and the corresponding numerical results were 214 kN·m, 375 kN·m, and 555 kN·m, which had a different rate of 1.60%, −1.51%, and 5.80%. The comparisons demonstrated the validity of the numerical model.
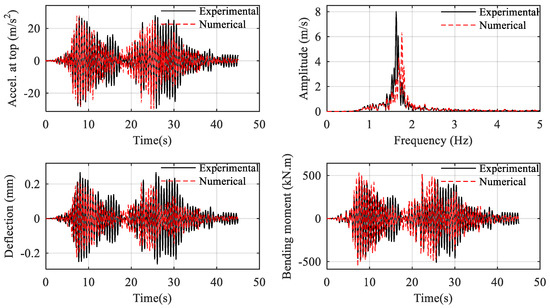
Figure 19.
Comparison of testing and numerical results in the 1.4 × 0.4 g test case.
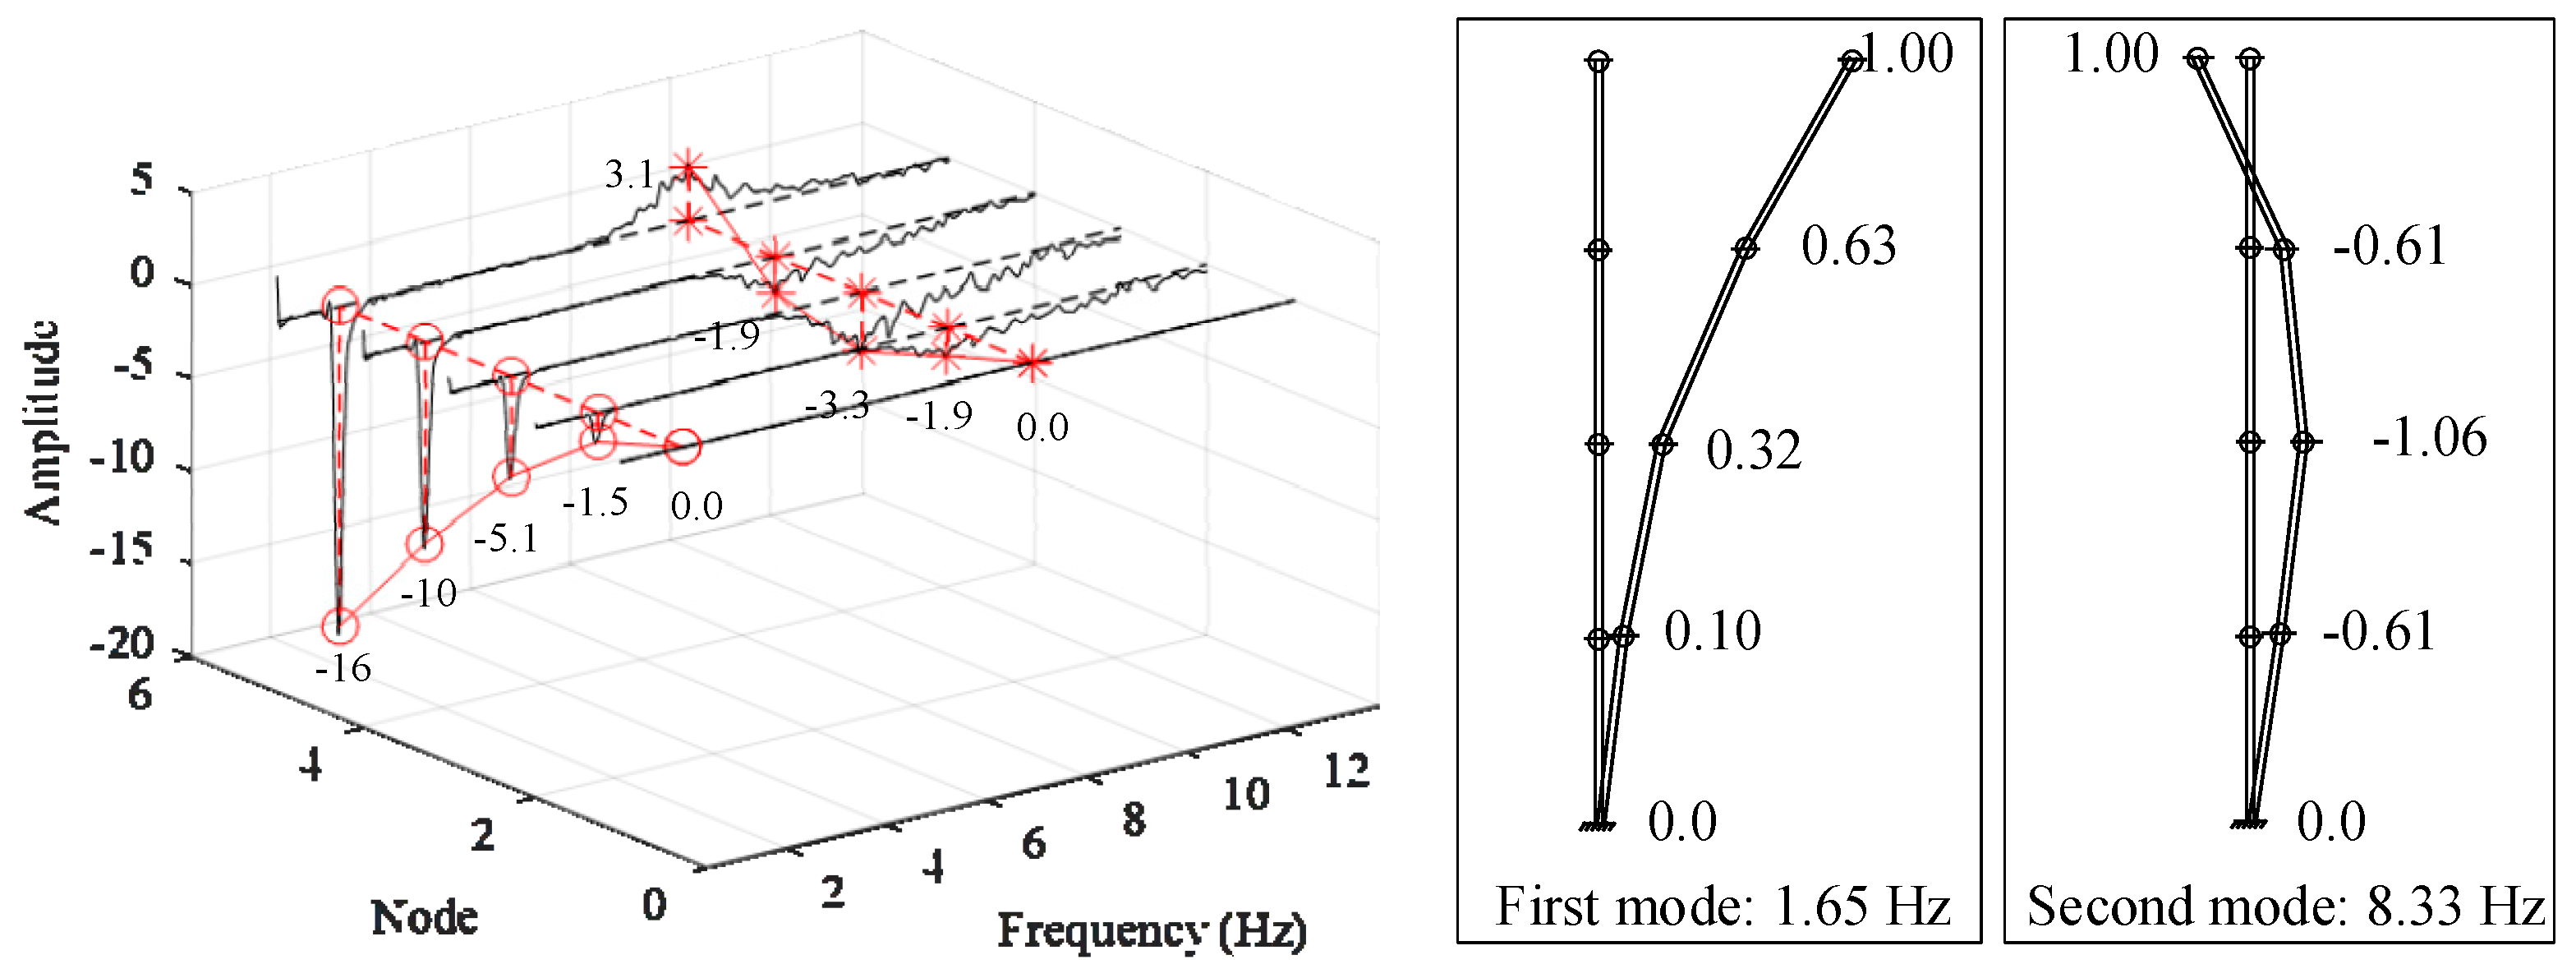
The relationship between the input motion and the seismic response of the specimen was used to identify the vibration modes of the specimen. The transfer function, T(f), between acceleration at the top of each insulator and acceleration at the table surface was calculated using [50], in which was the cross power spectral density between the output and the input, and was the power spectral density of input. The imaginary part curves of the transfer function are shown on the left side of Figure 20. The peaks of the curves represent the coordinates of a mode shape, as shown on the right side of Figure 20. The fundamental frequency was 1.69 Hz in the test and 1.73 Hz in the analysis, which had a different rate of 2.2%. The second mode frequency was 8.7 Hz in the test and 9.3 Hz in the analysis, which had a different rate of 7%. The mode shapes in the test (as shown on the right side of Figure 20) could also match the mode shapes in numerical analysis (Figure 7).
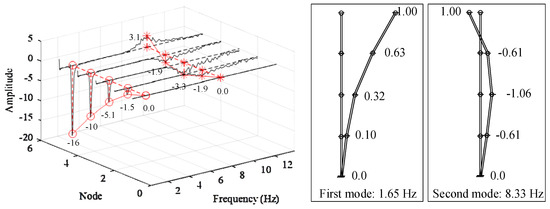
Figure 20.
Transfer functions and vibration modes were obtained from the shaking table test.
- (2)
- Result in 1.4 × 0.5 g input test case
The 0.5 g level input represented the most severe seismic action for the 1000 kV surge arrester. This was the most crucial test case for confirming the seismic performance of the GFRP insulator retrofitted in this study. Figure 21 shows the input acceleration and spectrum. The PGA was 0.74 g, and a lowpass filter eliminated the composition of base excitation with periods longer than 1.2 s to avoid driving the shaking table facility beyond the permissible displacement. In the main frequency range of 1–10 Hz, the TS could well match the RS.

Figure 21.
Input excitation and test response spectrum in the testing of 1.4 × 0.5 g test case.
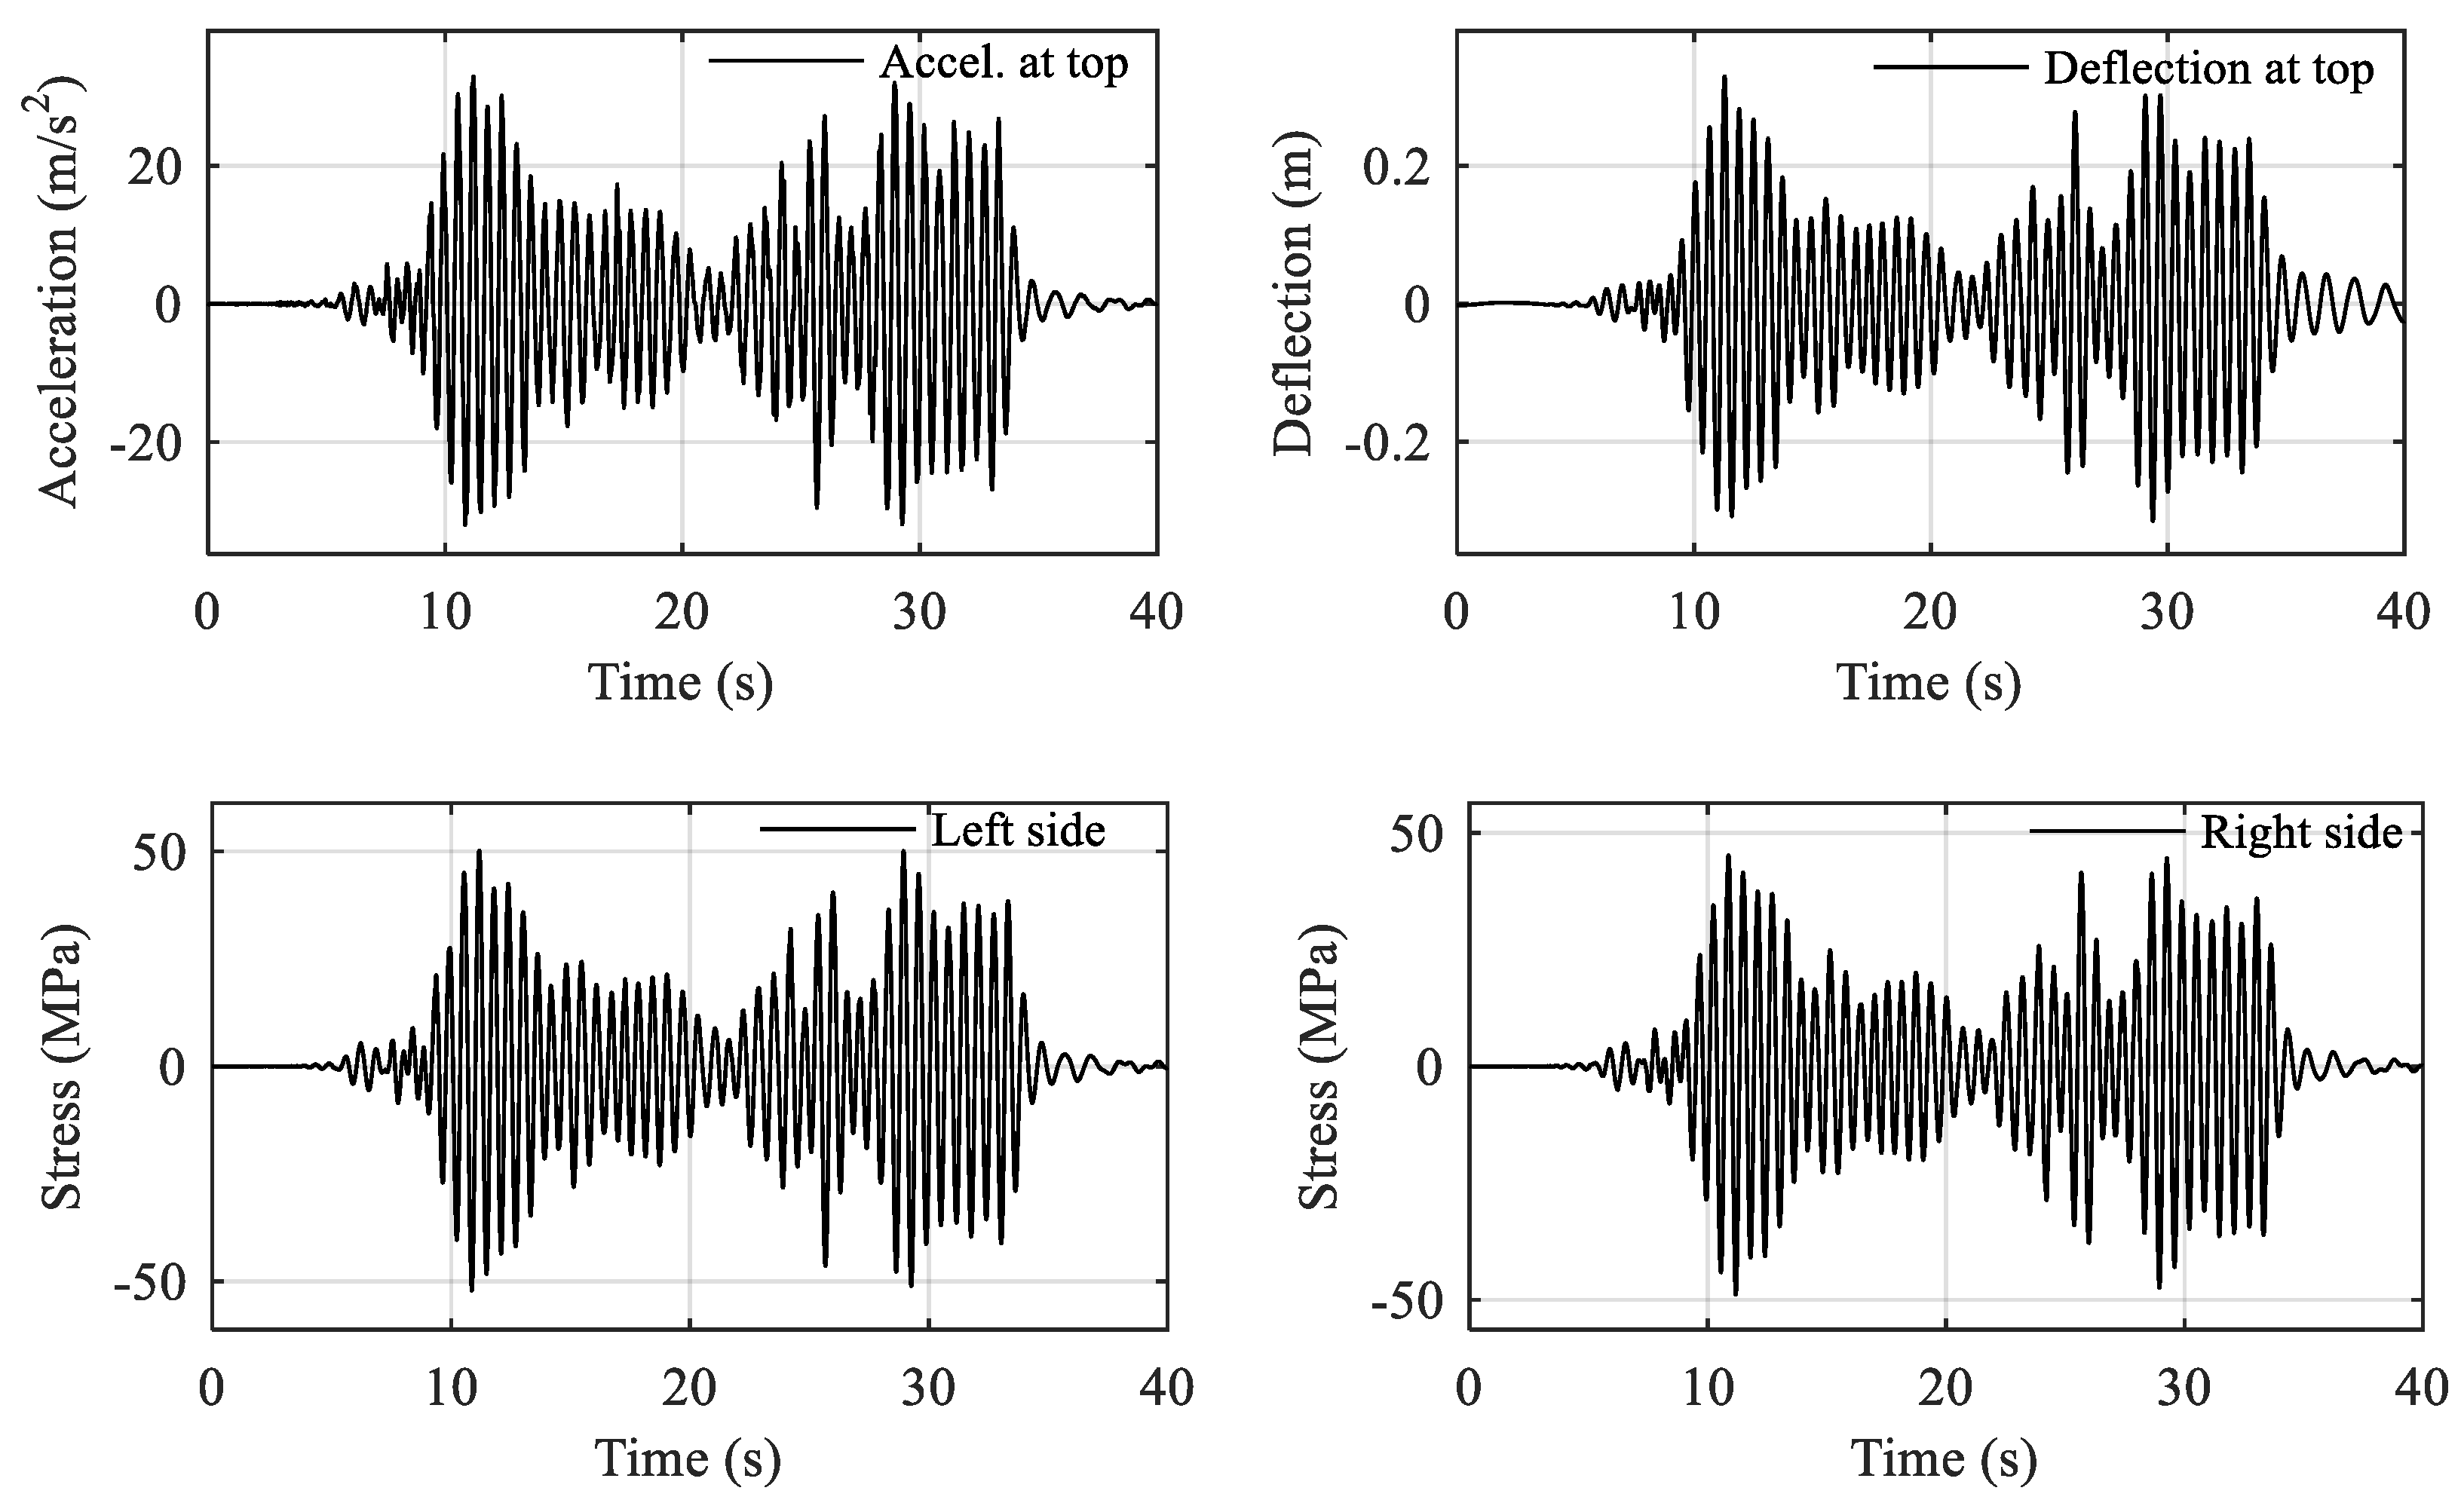
The response time histories in the test are shown in Figure 22. The maximum acceleration at the top was 32.93 m/s2, which was 4.5 times larger than the excitation. The maximum deflection at the top was 334 mm, smaller than the criterion value of 360 mm. The bending moment was obtained by strain measurement at the base of the composite tube. The maximum stress was 52.1 MPa on the left side and 48.1 MPa on the right side, corresponding to 593 kN·m of bending moment. For the flexural test result, the local bonding damage at the joint of the insulator happened when the bending moment was 1013 kN·m at the position of strain measurement (or 1067 kN·m at the bottom). The shaking table test results of 593 kN·m corresponded to a safety margin of 1.7, meeting the safety margin requirement of 1.67. Additionally, the continued load resisting capacity in the flexural test indicated its resilience in earthquakes. In contrast, the bonded joint broke at 867 kN·m, which was below the safety margin requirement, if no retrofitting design of shear stiffener was made. The joint failed in 954 kN·m, which was close to the safety margin requirement but less resilient due to the failure mode of sudden fracture, if there was no retrofitting with a cast iron flange.
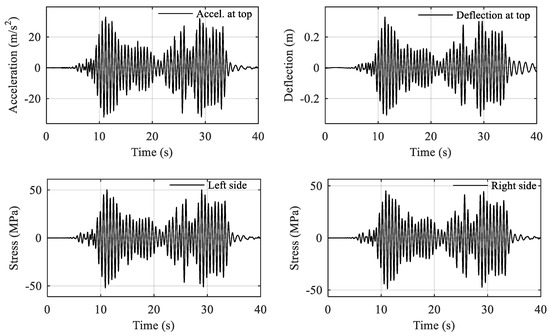
Figure 22.
Seismic responses of the specimen in the 1.4 × 0.5 g input test.
In this test case, the deflection of the specimen was around 330 mm, which was 25% larger than the 265 mm estimated by seismic demand analysis but was still below the acceptable limit of 360 mm. It indicated that the specimen had seen a certain degree of rigidity deterioration. In the substation design of electrical equipment with composite insulators, a 25% larger deflection can be empirically considered in cases of high seismic action when the deflection demand is predicted using a linear elastic model. As the slackness of the interconnection conductor is essential for decoupling the earthquake response from nearby equipment, this recommendation derived from the full-scale tests is noteworthy.
4.3. Trend Analysis of Seismic Responses among Different Testing Cases
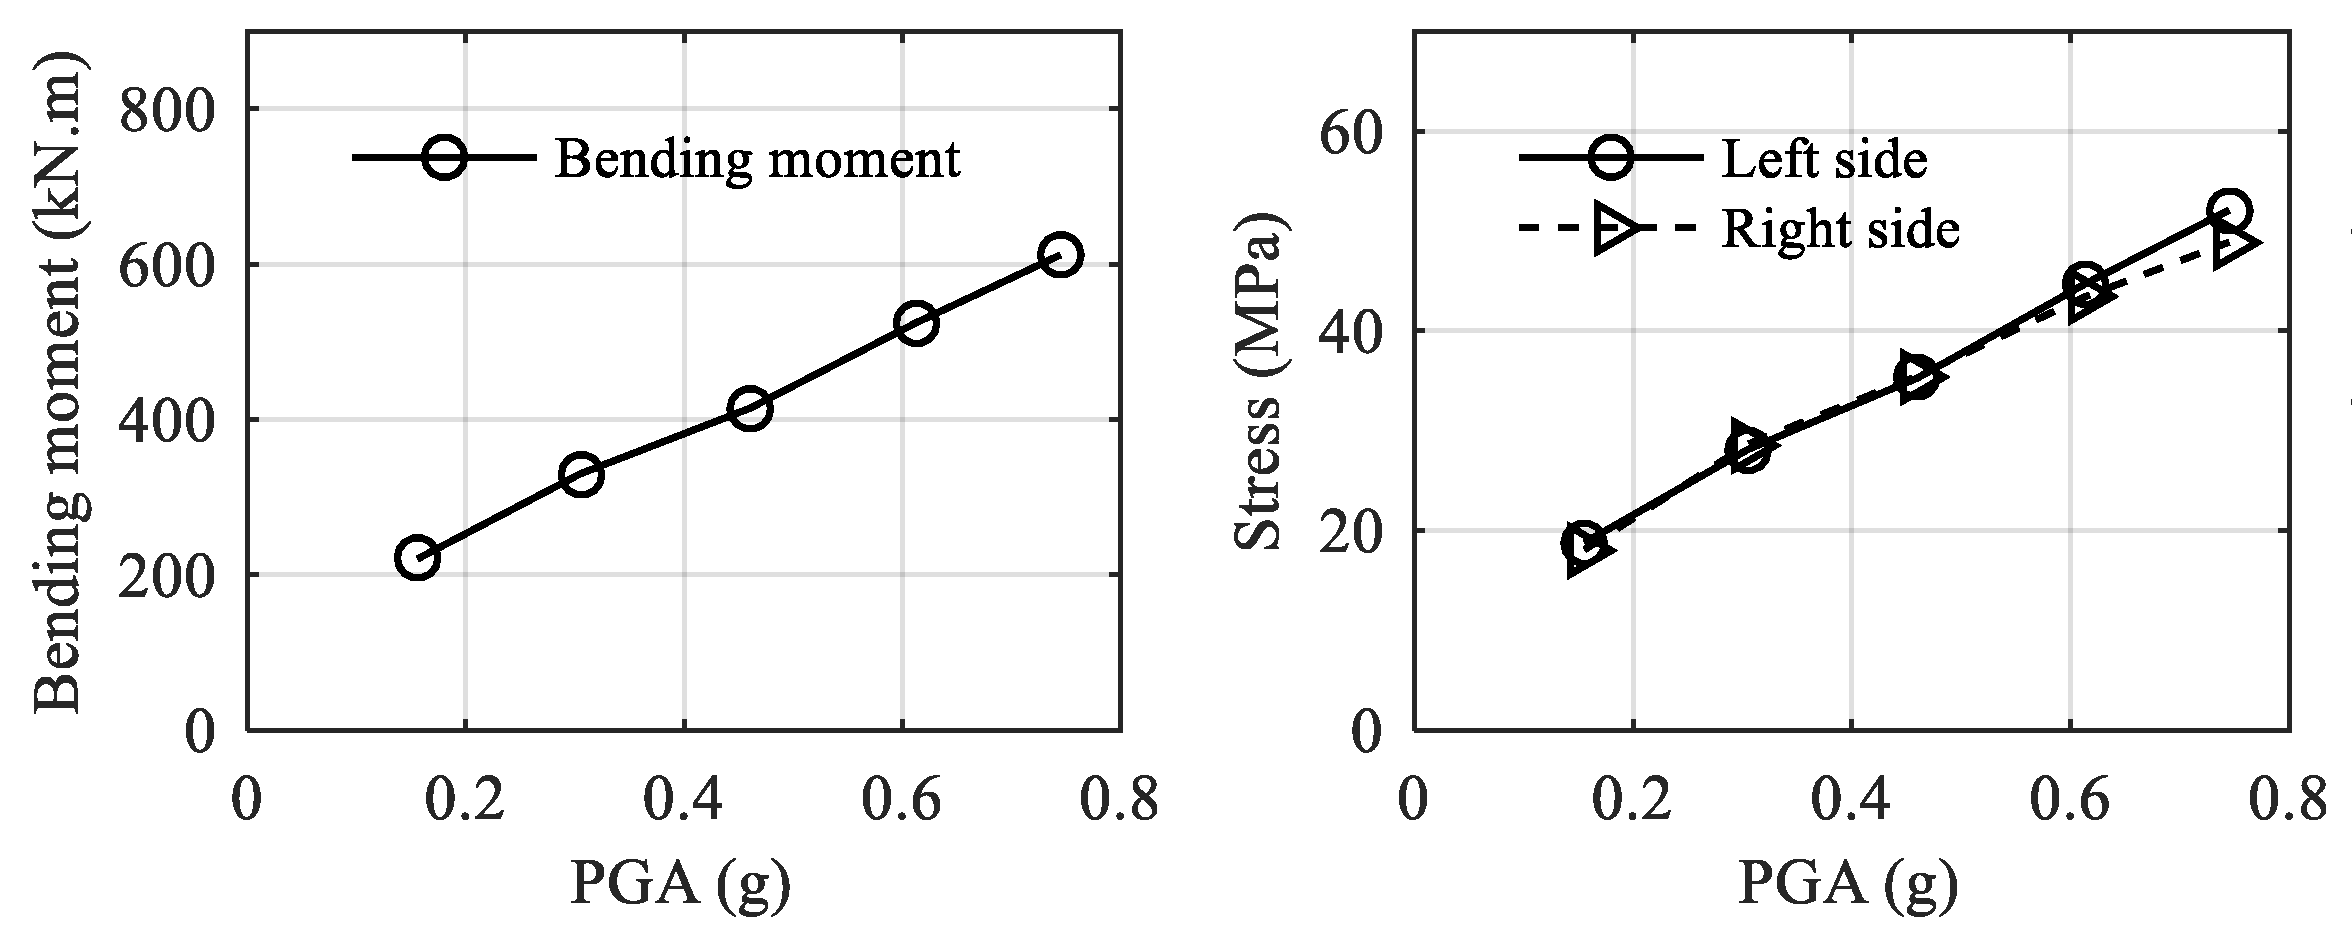
Figure 23 graphically shows the trends in responses of acceleration, deflection, bending moment and stress. The structural frequencies were stable amongst different excitation levels of testing, with a mild decreasing rate of 5% from 1.73 Hz to 1.64 Hz. Acceleration, deflection, and moment of bending were linear to the applied PGA, indicating the specimen mostly responded in a linear elastic range.

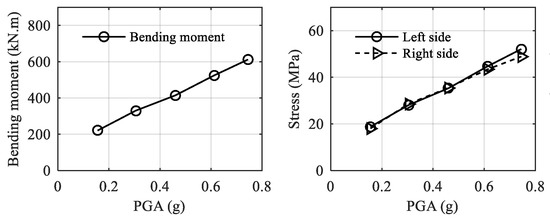
Figure 23.
The summary of seismic responses of the specimen with incremental PGAs.
The damping of the specimen can be analyzed by the dynamic parameter identification procedure [51]. The structure was simplified as an SDOF system, described as . The input acceleration at the base and response acceleration at the top were taken as the input and output of the SDOF system, respectively. An equivalent viscous damping ratio was employed to describe the damping effect of the structure, and the model analysis functions in the Matlab Control System Toolbox [52] were used to identify system damping based on the transfer function between the input and the output. As shown in Figure 24a,b, the amplitude of the transfer function was decreased, indicating a significant increase in damping. The damping ratios resulting from curve fitting operations are shown in Figure 24c, increasing from 2% in the 1.4 × 0.1 g PGA test to 6% in the 1.4 × 0.5 g PGA test. The flexural testing showed that the stiffness degradation happened when the bending moment was 580 kN·m. The 593 kN·m in the shaking table test indicated the specimen had just entered a state of mild stiffness degradation, and damage to the specimen was very small, if there was any. It demonstrated that the damping ratio of composite insulators was a sensitive indicator for detecting structural deterioration. This establishes the basis for further investigation in using the change in damping ratio to detect damage to substation equipment with composite insulators.

Figure 24.
Curve fitting of the transfer function for damping identification. (a) 1.4× 0.1 g testing case. (b) 1.4 × 0.5 g testing case. (c) Damping ratios in different testing cases.
5. Conclusions
This study employed full-scale testing to investigate the seismic performance of the retrofitted composite insulators used in the 1000 kV surge arrester. The conclusions reached are as follows:
- (1)
- The bonded sleeve joint between the GFRP tube and the metal end fitting was a weak point for the bending strength of the composite insulator, which can be retrofitted by introducing ring-shaped shear stiffeners at the joint and replacing the cast iron flange with an aluminium one.
- (2)
- Full-scale cantilever bending tests were carried out to assess the bending strength of the retrofitted composite insulator. The shear stiffener was seen to prevent bonding failure at the joint and increase the specimen’s bending strength. The numerical modelling and design optimizations of shear stiffeners are open to further study.
- (3)
- The full-scale shaking table test of the 1000 kV surge arrester with retrofitted insulators demonstrated the equipment’s satisfactory performance during an extreme seismic action of 1.4 × 0.5 g PGA, making it suitable for installation in the UHV substation in regions with high seismic risk.
- (4)
- The responses of the equipment during the shaking table test were mainly in the elastic range, but its damping ratio increased from 2% to 6%, indicating that the damping ratio is a sensitive parameter for the damage detection of equipment with composite insulators.
Author Contributions
Conceptualization, S.L. and Y.C.; methodology, Z.L.; validation, S.L. and H.W.; formal analysis, S.L. and Y.X.; writing—original draft, S.L. and Y.X.; writing—review and editing, S.L. and N.L.; project administration, Z.L. and H.W.; supervision, N.L.; funding acquisition, Y.C. All authors have read and agreed to the published version of the manuscript.
Funding
This research was funded by the Scientific Research Program of State Grid Corporation of China (Grant No. 5200-202156074A-0-0-00) and the State Grid Fujian Electric Power Co., Ltd. (Grant number SGFJJY00BDJS2100019), titled ‘Key technology and application research on design and installation reliability assessment for main equipment in the UHV substations’.
Data Availability Statement
Not applicable.
Acknowledgments
The tests in the study were organized by the State Grid Corporation of China and the China Electric Power Research Institute.
Conflicts of Interest
The authors declare no conflict of interest.
References
- Chalishazar, V.H.; Brekken, T.K.A.; Johnson, D.; Yu, K.; Newell, J.; Chin, K.; Weik, R.; Dierickx, E.; Craven, M.; Sauter, M.; et al. Connecting Risk and Resilience for a Power System Using the Portland Hills Fault Case Study. Processes 2020, 8, 1200. [Google Scholar] [CrossRef]
- Tofani, A.; D’agostino, G.; di Pietro, A.; Giovinazzi, S.; Pollino, M.; Rosato, V.; Alessandroni, S. Operational Resilience Metrics for Complex Inter-Dependent Electrical Networks. Appl. Sci. 2021, 11, 5842. [Google Scholar] [CrossRef]
- Dinh, N.H.; Kim, J.Y.; Lee, S.J.; Choi, K.K. Seismic Vulnerability Assessment of Hybrid Mold Transformer Based on Dynamic Analyses. Appl. Sci. 2019, 9, 3180. [Google Scholar] [CrossRef]
- Yu, Y.; Li, G.; Li, P.; Zhu, Q. Investigation and Analysis of Electric Equipment Damage in Sichuan Power Grid Caused by Wenchuan Earthquake. Power System Technology 2008, 32, 1–6. [Google Scholar]
- Pavel, F.; Vacareanu, R. Seismic Risk Assessment for Elements of the Electric Network in Romania. Buildings 2022, 12, 244. [Google Scholar] [CrossRef]
- Ang, H.S.; Pires, J.A.; Villaverde, R. A Model for the Seismic Reliability Assessment of Electric Power Transmission Systems. Reliab. Eng. Syst. Saf. 1996, 51, 7–22. [Google Scholar] [CrossRef]
- Kazama, M.; Noda, T. Damage Statistics (Summary of the 2011 off the Pacific Coast of Tohoku Earthquake Damage). Soils Found. 2012, 52, 780–792. [Google Scholar] [CrossRef]
- Kwasinski, A.; Eidinger, J.; Tang, A.; Tudo-Bornarel, C. Performance of Electric Power Systems in the 2010-2011 Christchurch, New Zealand, Earthquake Sequence. Earthq. Spectra 2014, 30, 205–230. [Google Scholar] [CrossRef]
- You, H.; Zhao, F. M7.0 Earthquake in Lushan and Damage Cause Analysis of Power Facilities. Electr. Power Constr. 2013, 34, 100–104. [Google Scholar] [CrossRef]
- Salem, A.A.; Lau, K.Y.; Abdul-Malek, Z.; Zhou, W.; Al-Ameri, S.; Al-Gailani, S.A.; Rahman, R.A. Investigation of High Voltage Polymeric Insulators Performance under Wet Pollution. Polymers 2022, 14, 1236. [Google Scholar] [CrossRef]
- Koo, J.H.; Seong, J.K.; Hwang, R.; Lee, B.W. Experimental Assessment on Air Clearance of Multiple Valve Unit Considering Switching Impulse and Dc Superimposed Switching Impulse. Energies 2020, 13, 2958. [Google Scholar] [CrossRef]
- Liu, Z.; Cheng, Y.; Lu, Z. Shake Table Test on UHV Standardization Lightning Arrester Installed with Shear-Type Lead Dampers. High Volt. Eng. 2018, 44, 2595–2602. [Google Scholar]
- Saleem, M.Z.; Akbar, M. Review of the Performance of High-Voltage Composite Insulators. Polymers 2022, 14, 431. [Google Scholar] [CrossRef] [PubMed]
- Papailiou, K.O.; Schmuck, F. Silicone Composite Insulators: Materials, Design, Applications; Springer: Berlin/Heidelberg, Germany, 2013. [Google Scholar] [CrossRef]
- EPRI. Survey of Utility Experiences with Composite/Polymer Components in Transmission Class (69-765 KV Class) Substations; EPRI: Palo Alto, CA, USA, 2004. [Google Scholar]
- Cheng, Y.; Li, S.; Lu, Z.; Liu, Z.; Zhu, Z. Seismic Risk Mitigation of Cylindrical Electrical Equipment with a Novel Isolation Device. Soil Dyn. Earthq. Eng. 2018, 111, 41–52. [Google Scholar] [CrossRef]
- Yang, Z.; Xie, Q.; He, C.; Xue, S. Numerical Investigation of the Seismic Response of a UHV Composite Bypass Switch Retrofitted with Wire Rope Isolators. Earthq. Eng. Eng. Vib. 2021, 20, 275–290. [Google Scholar] [CrossRef]
- Fang, H.; Bai, Y.; Liu, W.; Qi, Y.; Wang, J. Connections and Structural Applications of Fibre Reinforced Polymer Composites for Civil Infrastructure in Aggressive Environments. Compos. B Eng. 2019, 164, 129–143. [Google Scholar] [CrossRef]
- Kumosa, M.; Armentrout, D.; Kumosa, L.; Han, Y.; Carpenter, S.H. Analyses of Composite Insulators with Crimped End-Fittings: Part II—Suitable Crimping Conditions. Compos. Sci. Technol. 2002, 62, 1209–1221. [Google Scholar] [CrossRef]
- Kumosa, M.; Han, Y.; Kumosa, L. Analyses of Composite Insulators with Crimped End-Fittings: Part I—Non Linear Finite Element Computations. Compos. Sci. Technol. 2002, 62, 1191–1207. [Google Scholar] [CrossRef]
- Luo, F.J.; Yang, X.; Bai, Y. Member Capacity of Pultruded GFRP Tubular Profile with Bolted Sleeve Joints for Assembly of Latticed Structures. J. Compos. Constr. 2015, 20, 4015080. [Google Scholar] [CrossRef]
- Luo, F.J.; Bai, Y.; Yang, X.; Lu, Y. Bolted Sleeve Joints for Connecting Pultruded FRP Tubular Components. J. Compos. Constr. 2016, 20, 4015024. [Google Scholar] [CrossRef]
- Qiu, C.; Feng, P.; Yang, Y.; Zhu, L.; Bai, Y. Joint Capacity of Bonded Sleeve Connections for Tubular Fibre Reinforced Polymer Members. Compos. Struct. 2017, 163, 267–279. [Google Scholar] [CrossRef]
- Fawzia, S.; Zhao, X.L.; Al-Mahaidi, R. Bond-Slip Models for Double Strap Joints Strengthened by CFRP. Compos. Struct. 2010, 92, 2137–2145. [Google Scholar] [CrossRef]
- Duriatti, D.; Béakou, A.; Levillain, R. Optimisation of the Crimping Process of a Metal End-Fitting onto a Composite Rod. Compos. Struct. 2006, 73, 278–289. [Google Scholar] [CrossRef]
- Prenleloup, A.; Gmür, T.; Botsis, J.; Papailiou, K.O.; Obrist, K. Stress and Failure Analysis of Crimped Metal–Composite Joints Used in Electrical Insulators Subjected to Bending. Compos. Part A Appl. Sci. Manuf. 2009, 40, 644–652. [Google Scholar] [CrossRef]
- Qureshi, J. A Review of Fibre Reinforced Polymer Structures. Fibers 2022, 10, 27. [Google Scholar] [CrossRef]
- Lacey, A.W.; Chen, W.; Hao, H.; Bi, K. Review of Bolted Inter-Module Connections in Modular Steel Buildings. J. Build. Eng. 2019, 23, 207–219. [Google Scholar] [CrossRef]
- Castagnetti, D.; Corigliano, P.; Barone, C.; Crupi, V.; Dragoni, E.; Guglielmino, E. Predicting the Macroscopic Shear Strength of Tightened-Bonded Joints from the Intrinsic High-Pressure Properties of Anaerobic Adhesives. Metals 2022, 12, 1141. [Google Scholar] [CrossRef]
- Rośkowicz, M.; Godzimirski, J.; Komorek, A.; Jasztal, M. The Effect of Adhesive Layer Thickness on Joint Static Strength. Materials 2021, 14, 1499. [Google Scholar] [CrossRef]
- Orefice, A.; Mancusi, G.; Dumont, S.; Lebon, F. An Experimental/Numerical Study on the Interfacial Damage of Bonded Joints for Fibre-Reinforced Polymer Profiles at Service Conditions. Technologies 2016, 4, 20. [Google Scholar] [CrossRef]
- Zhang, Z.; Wu, C.; Nie, X.; Bai, Y.; Zhu, L. Bonded Sleeve Connections for Joining Tubular GFRP Beam to Steel Member: Numerical Investigation with Experimental Validation. Compos. Struct. 2016, 157, 51–61. [Google Scholar] [CrossRef]
- Li, S.; Tsang, H.-H.; Cheng, Y.; Lu, Z. Seismic Testing and Modeling of Cylindrical Electrical Equipment with GFRP Composite Insulators. Compos. Struct. 2018, 194, 454–467. [Google Scholar] [CrossRef]
- Roh, H.; Oliveto, N.D.; Reinhorn, A.M. Experimental Test and Modeling of Hollow-Core Composite Insulators. Nonlinear Dyn. 2012, 69, 1651–1663. [Google Scholar] [CrossRef]
- Epackachi, S.; Dolatshahi, K.M.; Oliveto, N.D.; Reinhorn, A.M. Mechanical Behavior of Electrical Hollow Composite Post Insulators: Experimental and Analytical Study. Eng. Struct. 2015, 93, 129–141. [Google Scholar] [CrossRef]
- Bonhôte, P.; Gmür, T.; Botsis, J.; Papailiou, K.O. Stress and Damage Analysis of Composite–Aluminium Joints Used in Electrical Insulators Subject to Traction and Bending. Compos. Struct. 2004, 64, 359–367. [Google Scholar] [CrossRef]
- Wang, H.; Cheng, Y.; Lu, Z.; Zhu, Z.; Zhang, S. Research on Bending Rigidity at Flange Connections of UHV Composite Electrical Equipment. Shock Vib. 2020, 2020. [Google Scholar] [CrossRef]
- Cheng, Y.; Zhu, Z.; Lu, Z.; Huang, B.; Li, S. Q/GDW 11391-2015 Technical Code for Seismic Test of High Voltage Pillar Type Electrical Equipment; Technical Standard; State Grid Corporation of China: Beijing, China, 2015; pp. 1–22. [Google Scholar]
- Whittaker, A.S.; Fenves, G.L.; Gilani, A.S.J. Seismic Evaluation and Analysis of High-Voltage Substation Disconnect Switches. Eng Struct 2007, 29, 3538–3549. [Google Scholar] [CrossRef]
- Fahad, M. Seismic Evaluation and Qualification of Transformer Bushings; State University of New York at Buffalo: Buffalo, NY, USA, 2013. [Google Scholar]
- Alessandri, S.; Giannini, R.; Paolacci, F.; Amoretti, M.; Freddo, A. Seismic Retrofitting of an HV Circuit Breaker Using Base Isolation with Wire Ropes. Part 2: Shaking-Table Test Validation. Eng. Struct. 2015, 98, 263–274. [Google Scholar] [CrossRef]
- He, C.; He, Z.; Xie, Q. Experimental Evaluations on Seismic Performances of Porcelain and GFRP Composite UHV GIS Bushings. Materials 2022, 15, 4035. [Google Scholar] [CrossRef]
- Cheng, Y.; Liu, Z.; Lu, Z.; Zhu, Z.; Li, S.; Liu, H. Experimental Study on Seismic Performance and Structural Characteristics of ±800 KV Composite Post Insulators. Electr. Power 2017, 50, 89–96. [Google Scholar] [CrossRef]
- GB. Chinese Standard—GB50260 Code for Seismic Design of Electrical Installations; China Planning Press: Beijing, China, 2013. [Google Scholar]
- Zebing, D.; Zhicheng, L.; Yongfeng, C.; Zhubing, Z.; Min, Z.; Fengxin, Z.; Hongbing, Y. Q/GDW 11132 Technical Specification for Seismic Design of Ultra-High Voltage Porcelain Insulating Equipment and Installation/Maintenance to Energy Dissipation Devices; Technical Standard; State Grid Corporation of China: Beijing, China, 2013; pp. 1–31. [Google Scholar]
- Li, S.; Tsang, H.H.; Cheng, Y.; Lu, Z. Considering Seismic Interaction Effects in Designing Steel Supporting Structure for Surge Arrester. J. Constr. Steel Res. 2017, 132, 151–163. [Google Scholar] [CrossRef]
- IEEE. IEEE 693 Recommended Practice for Seismic Design of Substations; IEEE: New York, NY, USA, 2005. [Google Scholar]
- Kayhan, A.H.; Demir, A.; Palanci, M. Multi-Functional Solution Model for Spectrum Compatible Ground Motion Record Selection Using Stochastic Harmony Search Algorithm. Bullet. Earthq. Eng. 2022, 20, 6407–6440. [Google Scholar] [CrossRef]
- Cheng, Y.; Zhang, F.; Li, S.; Lu, Z.; Huang, B.; Huang, H.; Zhang, Z.; You, H. Q/GDW 11594-2016 Seismic Performance Testing Method for Composite Post Insulator; Technical Standard; State Grid Corporation of China: Beijing, China, 2016; pp. 1–13. [Google Scholar]
- Solomon, O.M., Jr. PSD Computations Using Welch’s Method. Sandia Rep. 1991, 91, 1–64. [Google Scholar] [CrossRef]
- Gattulli, V.; Potenza, F.; Piccirillo, G. Multiple Tests for Dynamic Identification of a Reinforced Concrete Multi-Span Arch Bridge. Buildings 2022, 12, 833. [Google Scholar] [CrossRef]
- Mathworks Control System Toolbox. Available online: www.mathworks.com (accessed on 20 June 2021).
Publisher’s Note: MDPI stays neutral with regard to jurisdictional claims in published maps and institutional affiliations. |
© 2022 by the authors. Licensee MDPI, Basel, Switzerland. This article is an open access article distributed under the terms and conditions of the Creative Commons Attribution (CC BY) license (https://creativecommons.org/licenses/by/4.0/).

