Article

Optimization of Urban Block Form by Adding New Volumes for Capacity Improvement and Solar Performance Using A Multi-Objective Genetic Algorithm: A Case Study of Nanjing

School of Architecture, Southeast University, Sipailou 2#, Nanjing 210096, China
*
Author to whom correspondence should be addressed.
Buildings 2022, 12(10), 1710; https://doi.org/10.3390/buildings12101710
Submission received: 29 August 2022 / Revised: 8 October 2022 / Accepted: 11 October 2022 / Published: 17 October 2022
(This article belongs to the Special Issue Building Energy Consumption and Urban Energy Planning)

Abstract

:
During urban renewal, multi-story residential blocks face a contradiction of balancing residential capacity improvement and solar constraint. This paper constructed a set of automatic workflows for adding new volumes to existing buildings, and a multi-objective optimization was applied with a Wallacei plug-in in Grasshopper to optimize the solar radiation, solar hours, and block capacity. First, this study established three building addition modes of existing blocks in the horizontal direction, vertical direction, and mixed direction, respectively. Three optimization objectives—maximum floor area ratio, maximum average radiation amount, and minimum solar shade—were defined. Second, the net increase in the floor area ratio of the block was calculated to balance capacity improvement and solar constraint. Third, the advantages of the three addition modes under different orientations were discussed. Among all three modes, the mixed addition mode had the best capacity improvement effect, with a 70% increase in floor area ratio. The vertical addition mode had the least impact on the solar shade of existing buildings. The horizontal addition mode could further improve the floor area ratio in areas where building height was strictly limited. The results can provide insights and inspiring guidelines for the renewal of the existing residential blocks to solve the floor area ratio constraint from solar radiation, as well as achieve urban function reconstruction and vitality regeneration.

1. Introduction

The world population is expected to grow to 10 billion by 2050, with 68% living in urban areas [1]. Rapid population agglomeration leads to the excessive expansion of the urban construction area, which seriously impacts the ecosystem around the city. To ensure a sustainable development of the ecological environment, the urban construction in the new period will shift from the extension development mode to the retrofitting of the existing urban environment [2]. The renovation of existing multi-story residential areas is an important type, which has attracted increasing attention from citizens due to its abundant use and close relationship with residents’ daily lives. Chinese cities offer an example, as they have two typical urban retrofit modes. The early mode is the demolition and reconstruction mode, in which the utilization of existing buildings is insufficient, while the neighborhood is dismantled. The second and current mode is mainly based on government investment, meaning the environmental quality of the residential area has been significantly improved via landscaping, installation of elevators, and building façade renovation [3]. However, this mode makes it difficult to achieve an economic benefit because it does not improve the building area, which causes difficulties when trying to promote the mode on a large scale due to the constraints of the local financial conditions.
The renewal of the existing urban residential blocks therefore urgently needs a new mode to meet the dual objectives of existing building conservation and capacity improvement. In fact, many famous cities globally have experienced a continuous increase in the floor area ratio during the development process of the old city area to meet the needs of urban development. Through the retrofit of existing residential areas with such patterns, new floor area can be obtained without increasing the urban boundary. The integration of building renovation and capacity improvement presents a possible mode for the renewal of existing urban residential blocks. The first challenge in this mode is the impact of solar access on the existing residential buildings due to the additional building volumes. Most existing multi-story residential blocks adopt a determinant linear layout pattern with a height of five–seven floors. Constrained by the current solar codes, the north–south distance of the buildings is strictly controlled according to the solar codes to ensure the minimum solar requirements of the bottom-floor residents in winter [4,5]. If the additional buildings must still ensure that all existing residences can meet the minimum solar code requirements, the possibility of building additions will be greatly restricted.
To increase the possibility of renovating existing residences, this paper attempts to propose a novel concept, the “net floor area ratio” (NFAR), which refers to the gross floor area ratio of the additional buildings subtracting what does not meet the solar code. The larger the NFAR, the higher the economic benefits that can be obtained from the renewal of the block, which improves the potential of community renovation. Although the addition of new buildings results in the solar shade of some existing buildings without meeting the solar codes, the area of the newly added buildings is larger than that of the buildings affected by the solar shade. The solar-affected segment can instead convert the residential functions into public service, and the affected households can be transferred to new buildings. This research focuses on how to obtain the maximum NFAR and the balance of solar performance through accurate building mass design based on a multi-objective optimization algorithm. The results could encourage residents to self-renew their living environments, which will change the monotonous layout of the existing residential buildings and promote urban vitality.

1.1. Literature Review

The current research on the correlation between solar performance and urban form mainly includes four aspects: (1) maximum volume control of buildings based on the guarantee of solar access, (2) correlation research between urban form and solar radiation gain, (3) assessment of solar energy utilization potential in existing urban areas, and (4) multi-objective optimized building layout based on comprehensive utilization of solar energy.
  • Maximum building volume control based on solar access
In the 1970s, Ralph L. Knowles proposed the “solar envelope” concept, which can calculate the maximum volume of buildings in the target block while ensuring the solar access of surrounding plots [6]. The professional skill requirements of operators and the limitations of computer technology, however, meant that the concept was mainly applied in small blocks. In 2009, to expand the application scope of the solar envelope, Carlo Ratti et al. used MATLAB in an urban design competition for Milan blocks to quickly generate complex solar envelope shapes for large-scale blocks [7]. This method offers the benefit of being able to obtain the maximum buildable volume in the plot while ensuring the adjacent solar rights of the plot, but the method lacks effective control over the building layout inside the solar envelope. Subsequently, Okeil (2010) considered the different needs for solar energy in winter and summer and proposed the “residential solar block” (RSB) model [8]. In 2015, Vartholomaios integrated the solar envelope and the RSB model to propose a compact “urban residential block envelope” (RSBE) by combining the block scale’s solar envelope and the building scale’s solar access [9].
In a high-density urban environment, mutual occlusion between buildings makes it difficult to apply the solar envelope. The “solar channel,” opposite to the solar envelope, is based on the precise solar requirements of the surrounding buildings to control building volumes inside the block. This method originated from the conceptual design exploration of MVRDV Architects. For instance, the “New Babylon plan” intended to add buildings above the existing city to increase the urban capacity. The solar channel concept was applied to ensure the solar requirements of the existing buildings. Based on the reverse utilization of the solar envelope, taking the city of Tallinn as an example, Francesco De Luca obtained the maximum volume of high-rise buildings while ensuring the basic solar demand of surrounding buildings through the cumulative calculation of solar time [10,11]. At present, both the solar envelope and the solar channel methods can only roughly define the outline of the building volume.
2.
Correlation research between urban form and solar radiation gain
In the initial stage of urban design at the district scale, Nault E et al. adjusted the influence of morphological indicators, such as compactness, on the solar energy potential. The study found that different block types can predict the solar energy potential through different combinations of morphological parameters and that a single parameter matrix should be avoided in complex urban environments [12,13]. Zhang Ji et al. studied the impact of six types of block forms on the solar potential and building energy efficiency in a high-density urban environment in Singapore. The results of their research indicated that compared with other models under the same planning conditions, courtyard blocks can achieve nearly two times the amount of solar gains. The results also showed that the roof solar gain and average building energy consumption decreased by 25% [14]. Christina Chatzipoulka et al. used 24 real-world urban fragment models in London as samples to study how urban geometry influences the solar radiation of building façades and ground surfaces in different periods. The researchers found that the impact of urban form on the solar potential is greater in winter than in summer [15]. Jonathan Natanian et al. studied the energy consumption impact of building groups due to changes in solar utilization for five block types under different plot ratios, window-to-wall ratios, and functional combinations. The results showed that the monthly average energy consumption among different types can be up to 50% in the dry-hot area of the Middle East [16]. Poon K found that the correlation between the ten geometric parameters of the block and the solar radiation was the highest, with R2 = 0.61, and the R2 of the other indicators was lower than 0.36. Based on a parametric study of 18 block types in Singapore, Shi Z et al. proposed that the main urban design parameters be considered to achieve multi-objective requirements for plot ratio and solar energy utilization [17]. In addition to the impact of block form on solar radiation gain, other studies have focused on the impact of street canyon [18]. Du K et al. used Baidu Street View images to discuss the influence of parameters such as sky visibility, greening ratio, and buildings on the solar time of street canyons in Beijing [19]. Rosado et al. studied how the degree of setback for buildings on both sides of the street affects the solar-reflected radiation in the street [20]. Under the Singapore climate conditions, Morini E et al. studied the cooling differences of different solar radiation reflective materials in streets with different aspect ratios [21].
3.
Assessment of solar energy utilization in the built environment
Vartholomaios utilized the machine-learning approach to model the solar irradiation of urban and terrain 3D models [22]. Huang Z used deep-learning techniques to analyze the potential of urban-scale rooftop solar energy generation through image analysis in Wuhan [23]. Xu S et al. proposed the occlusion rate index and predicted the total value of solar photovoltaic utilization potential in large-scale cities through the calculation of block shape types. According to this prediction method, Wuhan can reach 168.02 Gwh of photovoltaic power generation [23]. Using seven office buildings in Brasilia as examples, Martins T studied the generation efficiency resulting from different arrangements of solar photovoltaic panels on the building façade and roof [24]. Karteris M et al. used statistical models to calculate the area suitable for installing solar photovoltaic panels on the building roofs in Greek cities. Among them, the suitable range for the installation of photovoltaic panels on the multi-story building roofs was only 25–50% of the total roof area [25,26]. At present, this part of the research mainly focuses on the potential or related constraints of solar energy utilization based on the existing urban form and less on how to optimize the urban form based on the utilization of solar energy.
4.
Optimization of building layout based on comprehensive utilization of solar energy
When focusing on a single building performance, the objective can be achieved by adjusting the varied combinations of morphological parameters. A Yezioro et al. provided guidance for obtaining appropriate solar access in urban public spaces by adjusting the aspect ratio of courtyard buildings around the open squares [27]. Baghat R et al. used Egyptian cities as samples to study how to minimize the solar radiation of surrounding buildings through the varied morphological parameters of open space and then compared the impact weights of various morphological parameters. Lobaccaro G et al. adjusted the morphological parameters of the block to maximize solar gain in three types of blocks: independent residential, determinant house, and high-rise apartment. The study showed that the solar radiation can be increased by 25% through morphological optimization [28].
Multi-objective optimization algorithm tools can help achieve complex performance requirements. Pareto optimality is a typical multi-objective optimization method. Pareto optimal, or non-dominated, solutions means that no other solutions can improve the performance of one objective without reducing the performance of other objectives. The result of the multi-objective algorithm is the formation of a set of non-dominated solutions, known as the Pareto front [29]. Using a Brazilian city as an example, A. I. Martins T et al. adjusted the urban height morphological parameters through a multi-objective optimization algorithm to maximize active solar energy utilization, minimize solar radiation, and ensure appropriate internal lighting requirements [30]. Wang Wei et al. used the Wallacei multi-objective search algorithm to discuss the optimization of the block shape based on solar energy utilization [31]. The schemes generated by the multi-objective optimization method in the previous studies are limited by the existing solar codes. Taleb H et al. proposed a sustainable urban design method, which adjusts the building form and orientation through a parametric method to achieve better solar radiation and urban ventilation [32,33]. Kampf J et al. used a multi-objective optimization method to maximize the comprehensive benefits of active and passive solar energy utilization by adjusting the building height, roof height, roof orientation, and other morphological parameters within the limited building volume [34,35]. Zhang L et al. used Octopus, a multi-objective optimization tool in Grasshopper, to study the free-form optimization of large buildings in cold climate conditions to obtain better solar radiation and building space efficiency [36].
In sum, the existing research mainly focuses on the prediction of building volume and layout method under the constraint of solar access or on solar energy utilization efficiency of different urban block forms. At present, there remains a lack of relevant research on the building addition of existing residential blocks based on solar utilization. An adequate retrofit design strategy should find an equilibrium between the urban block form and solar requirements.

1.2. Research Objectives

This paper mainly focuses on three objectives:
5.
To establish a framework based on a multi-objective optimization algorithm to evaluate the interactive relationship between building capacity improvement and the impact of solar gains in the existing residential plots.
6.
To verify the feasibility of the above framework by applying the three additional modes (horizontal, vertical, and composite) to a specific residential block in Nanjing. This study could provide insights on the regeneration of existing residential areas in other cities around the world with similar solar conditions.
7.
To compare the advantages and disadvantages of the three additional modes under the multi-objective requirements and explore the possibility of applying the modes in different orientation scenarios.
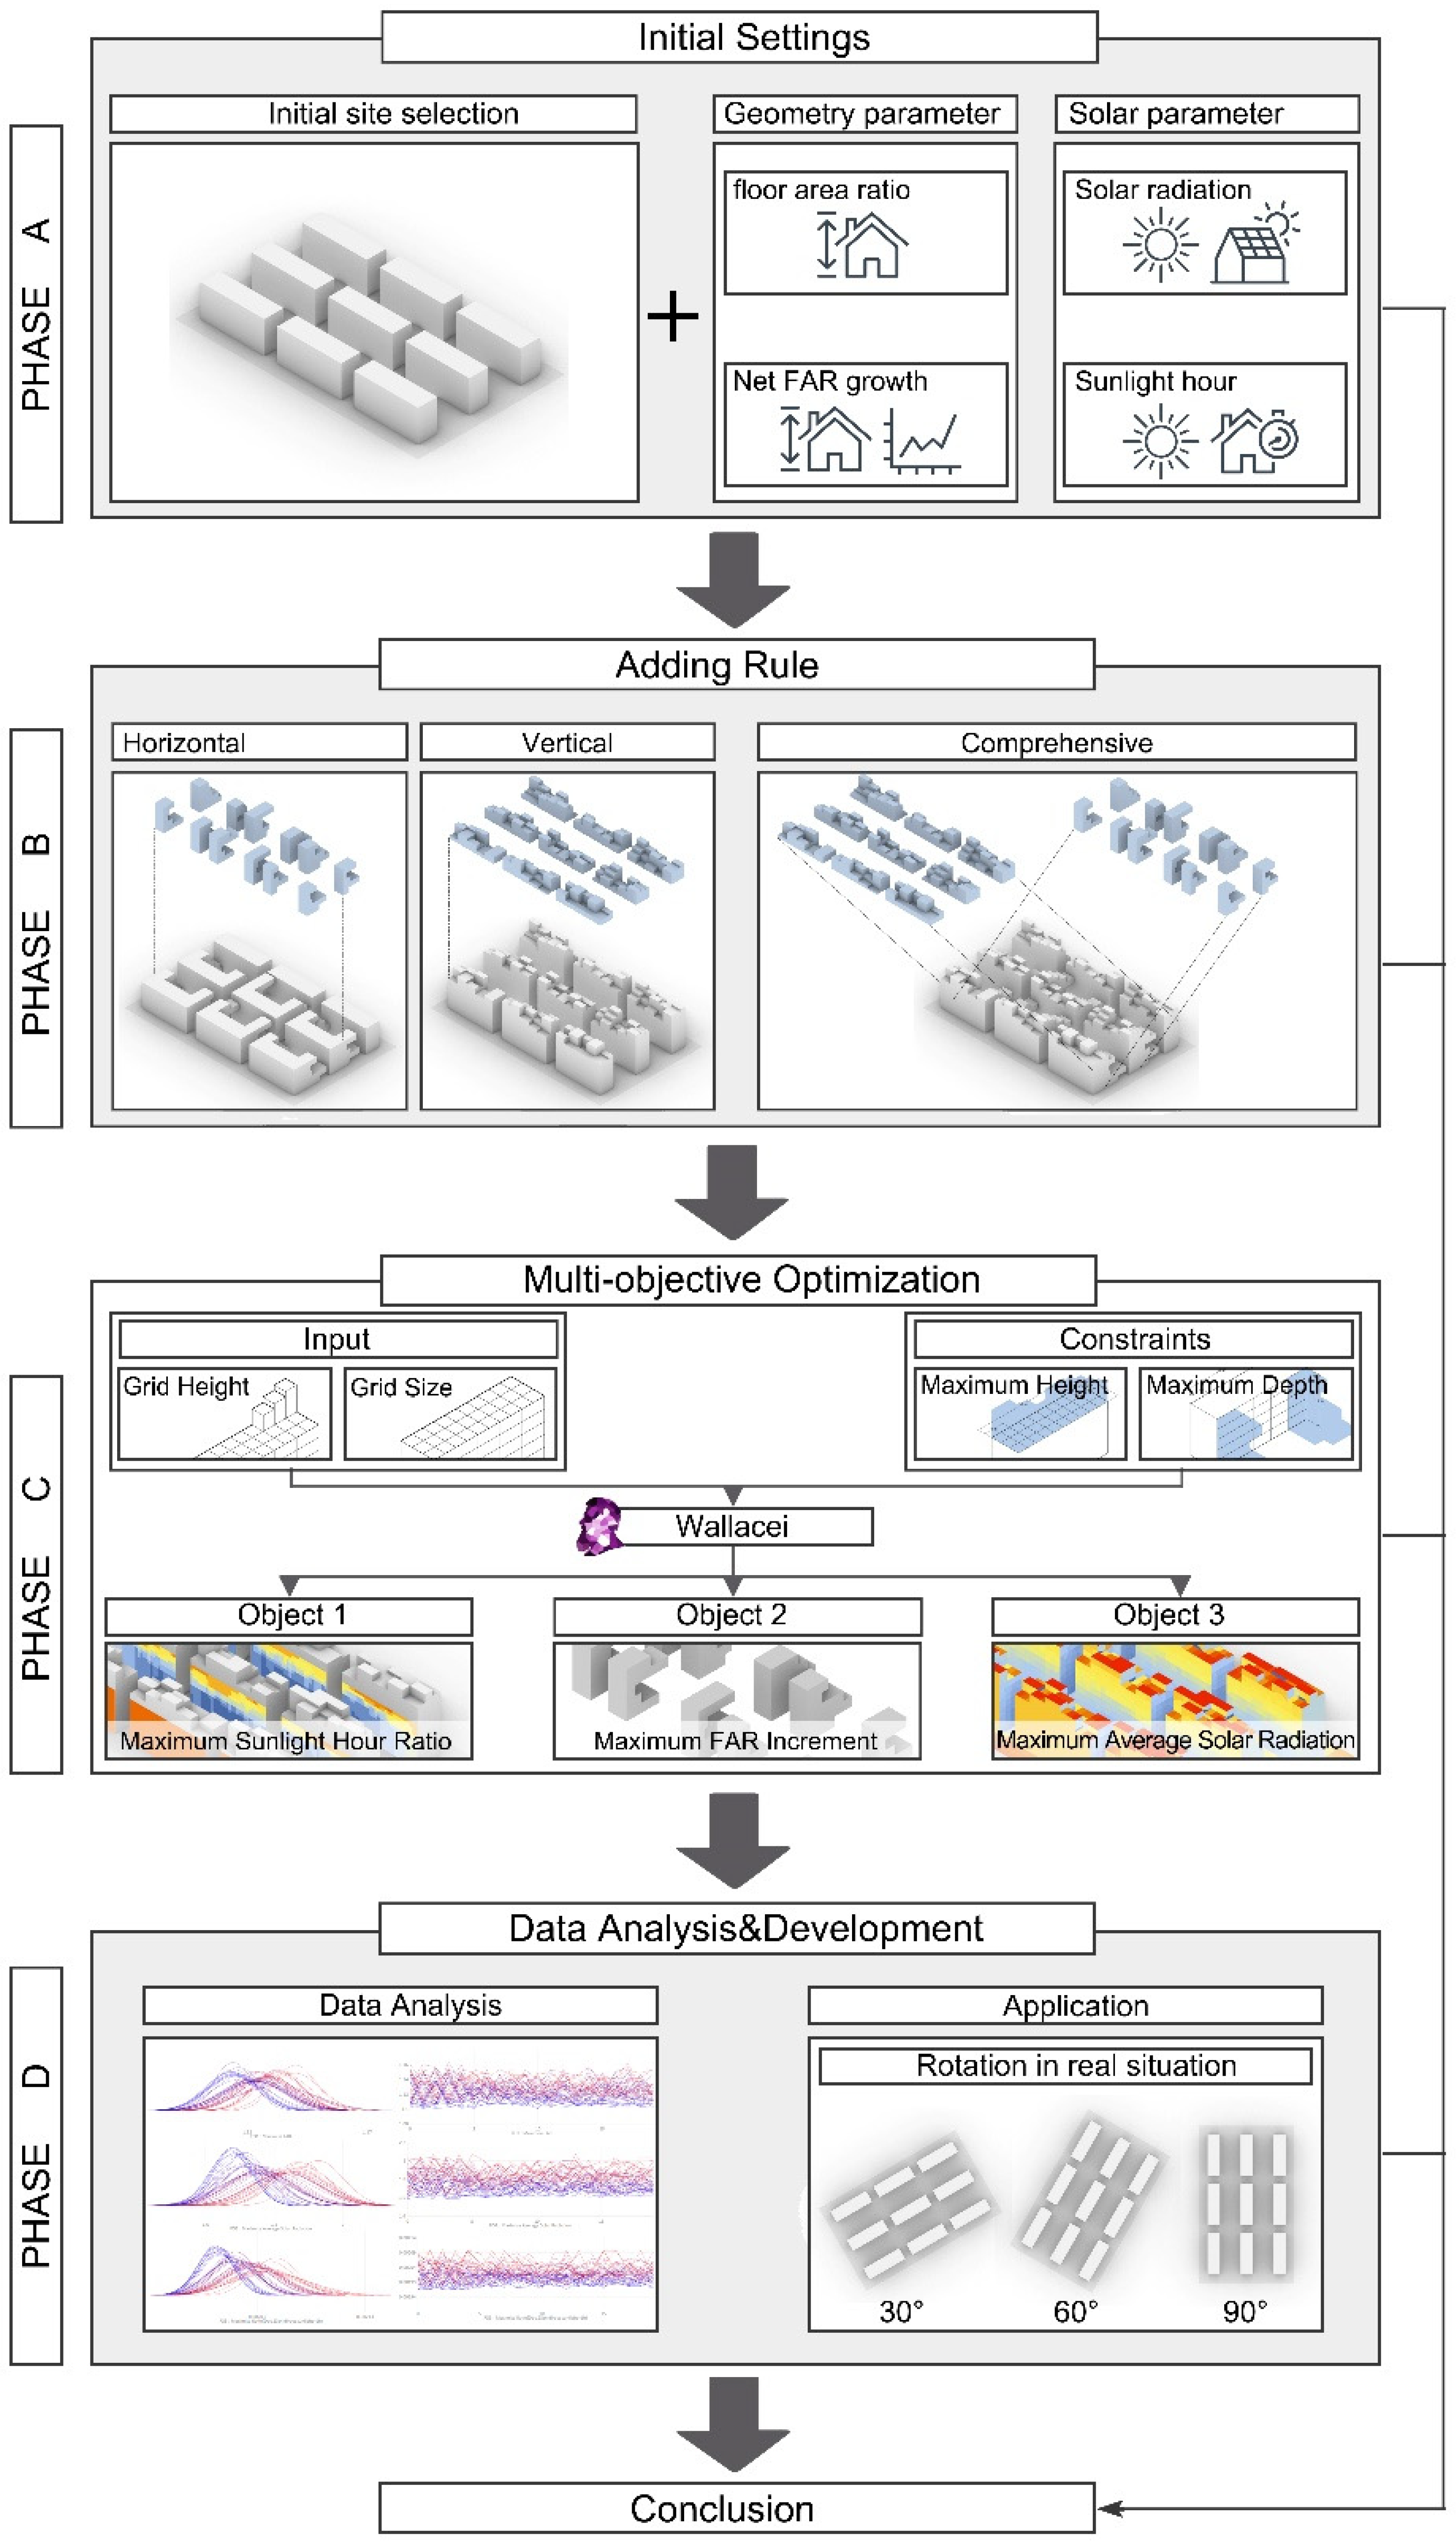
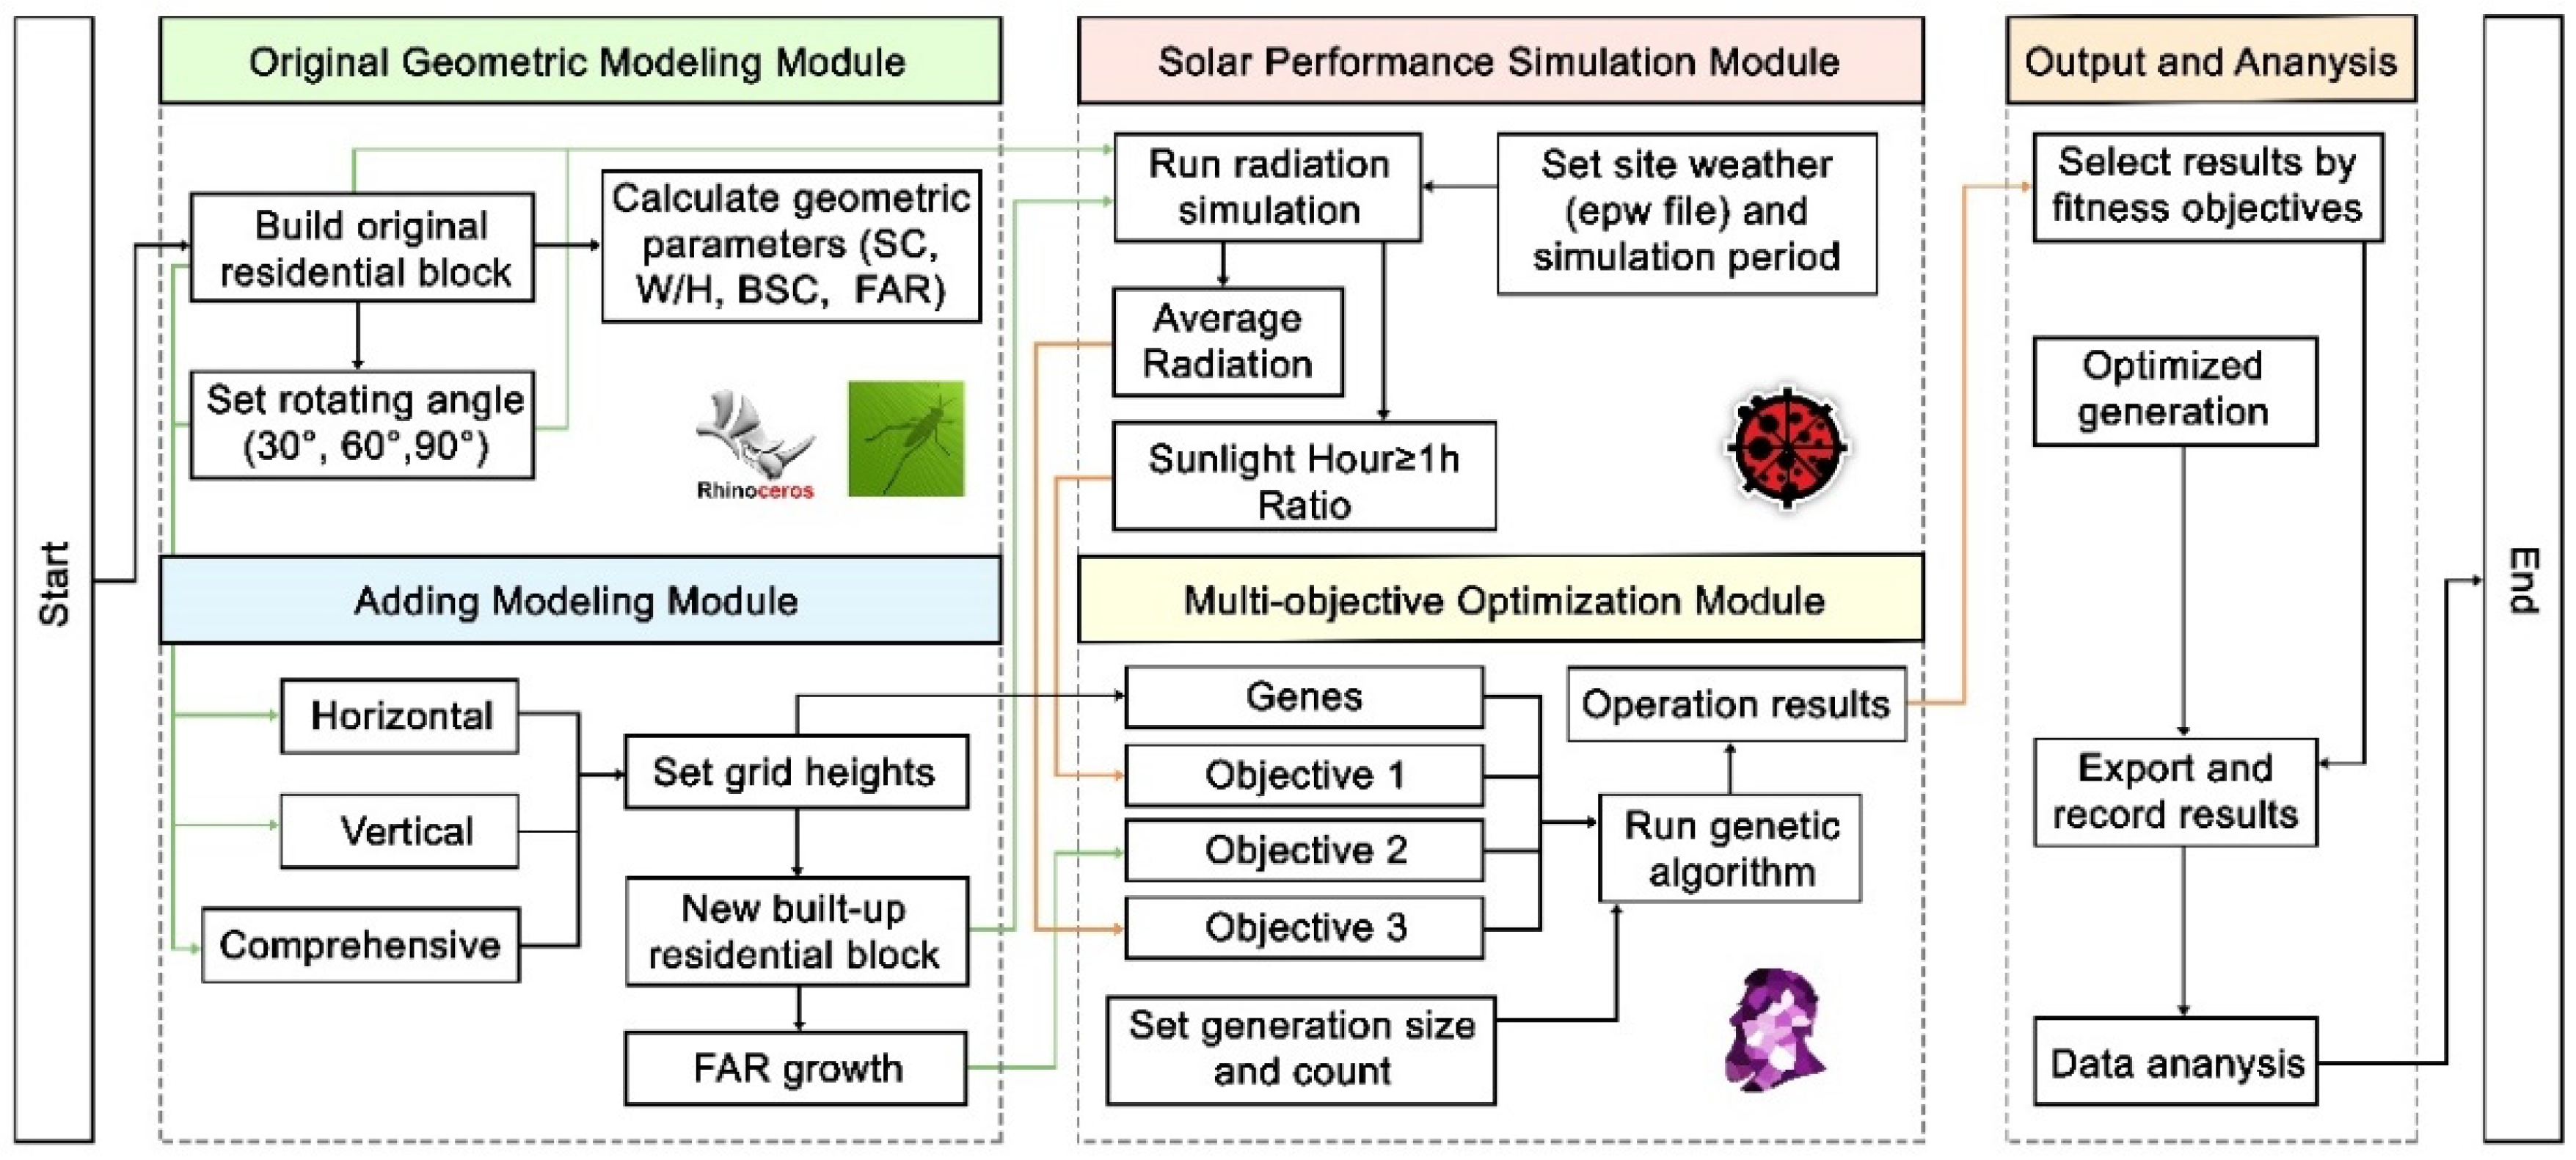
2. Methodology

The research method mainly consists of four parts: (1) initial sample selection of the typical multi-story residential block, (2) establishment of three types of addition rules for existing buildings, (3) multi-objective algorithm workflow construction and simulation, and (4) data analysis and application in different scenarios (Figure 1).

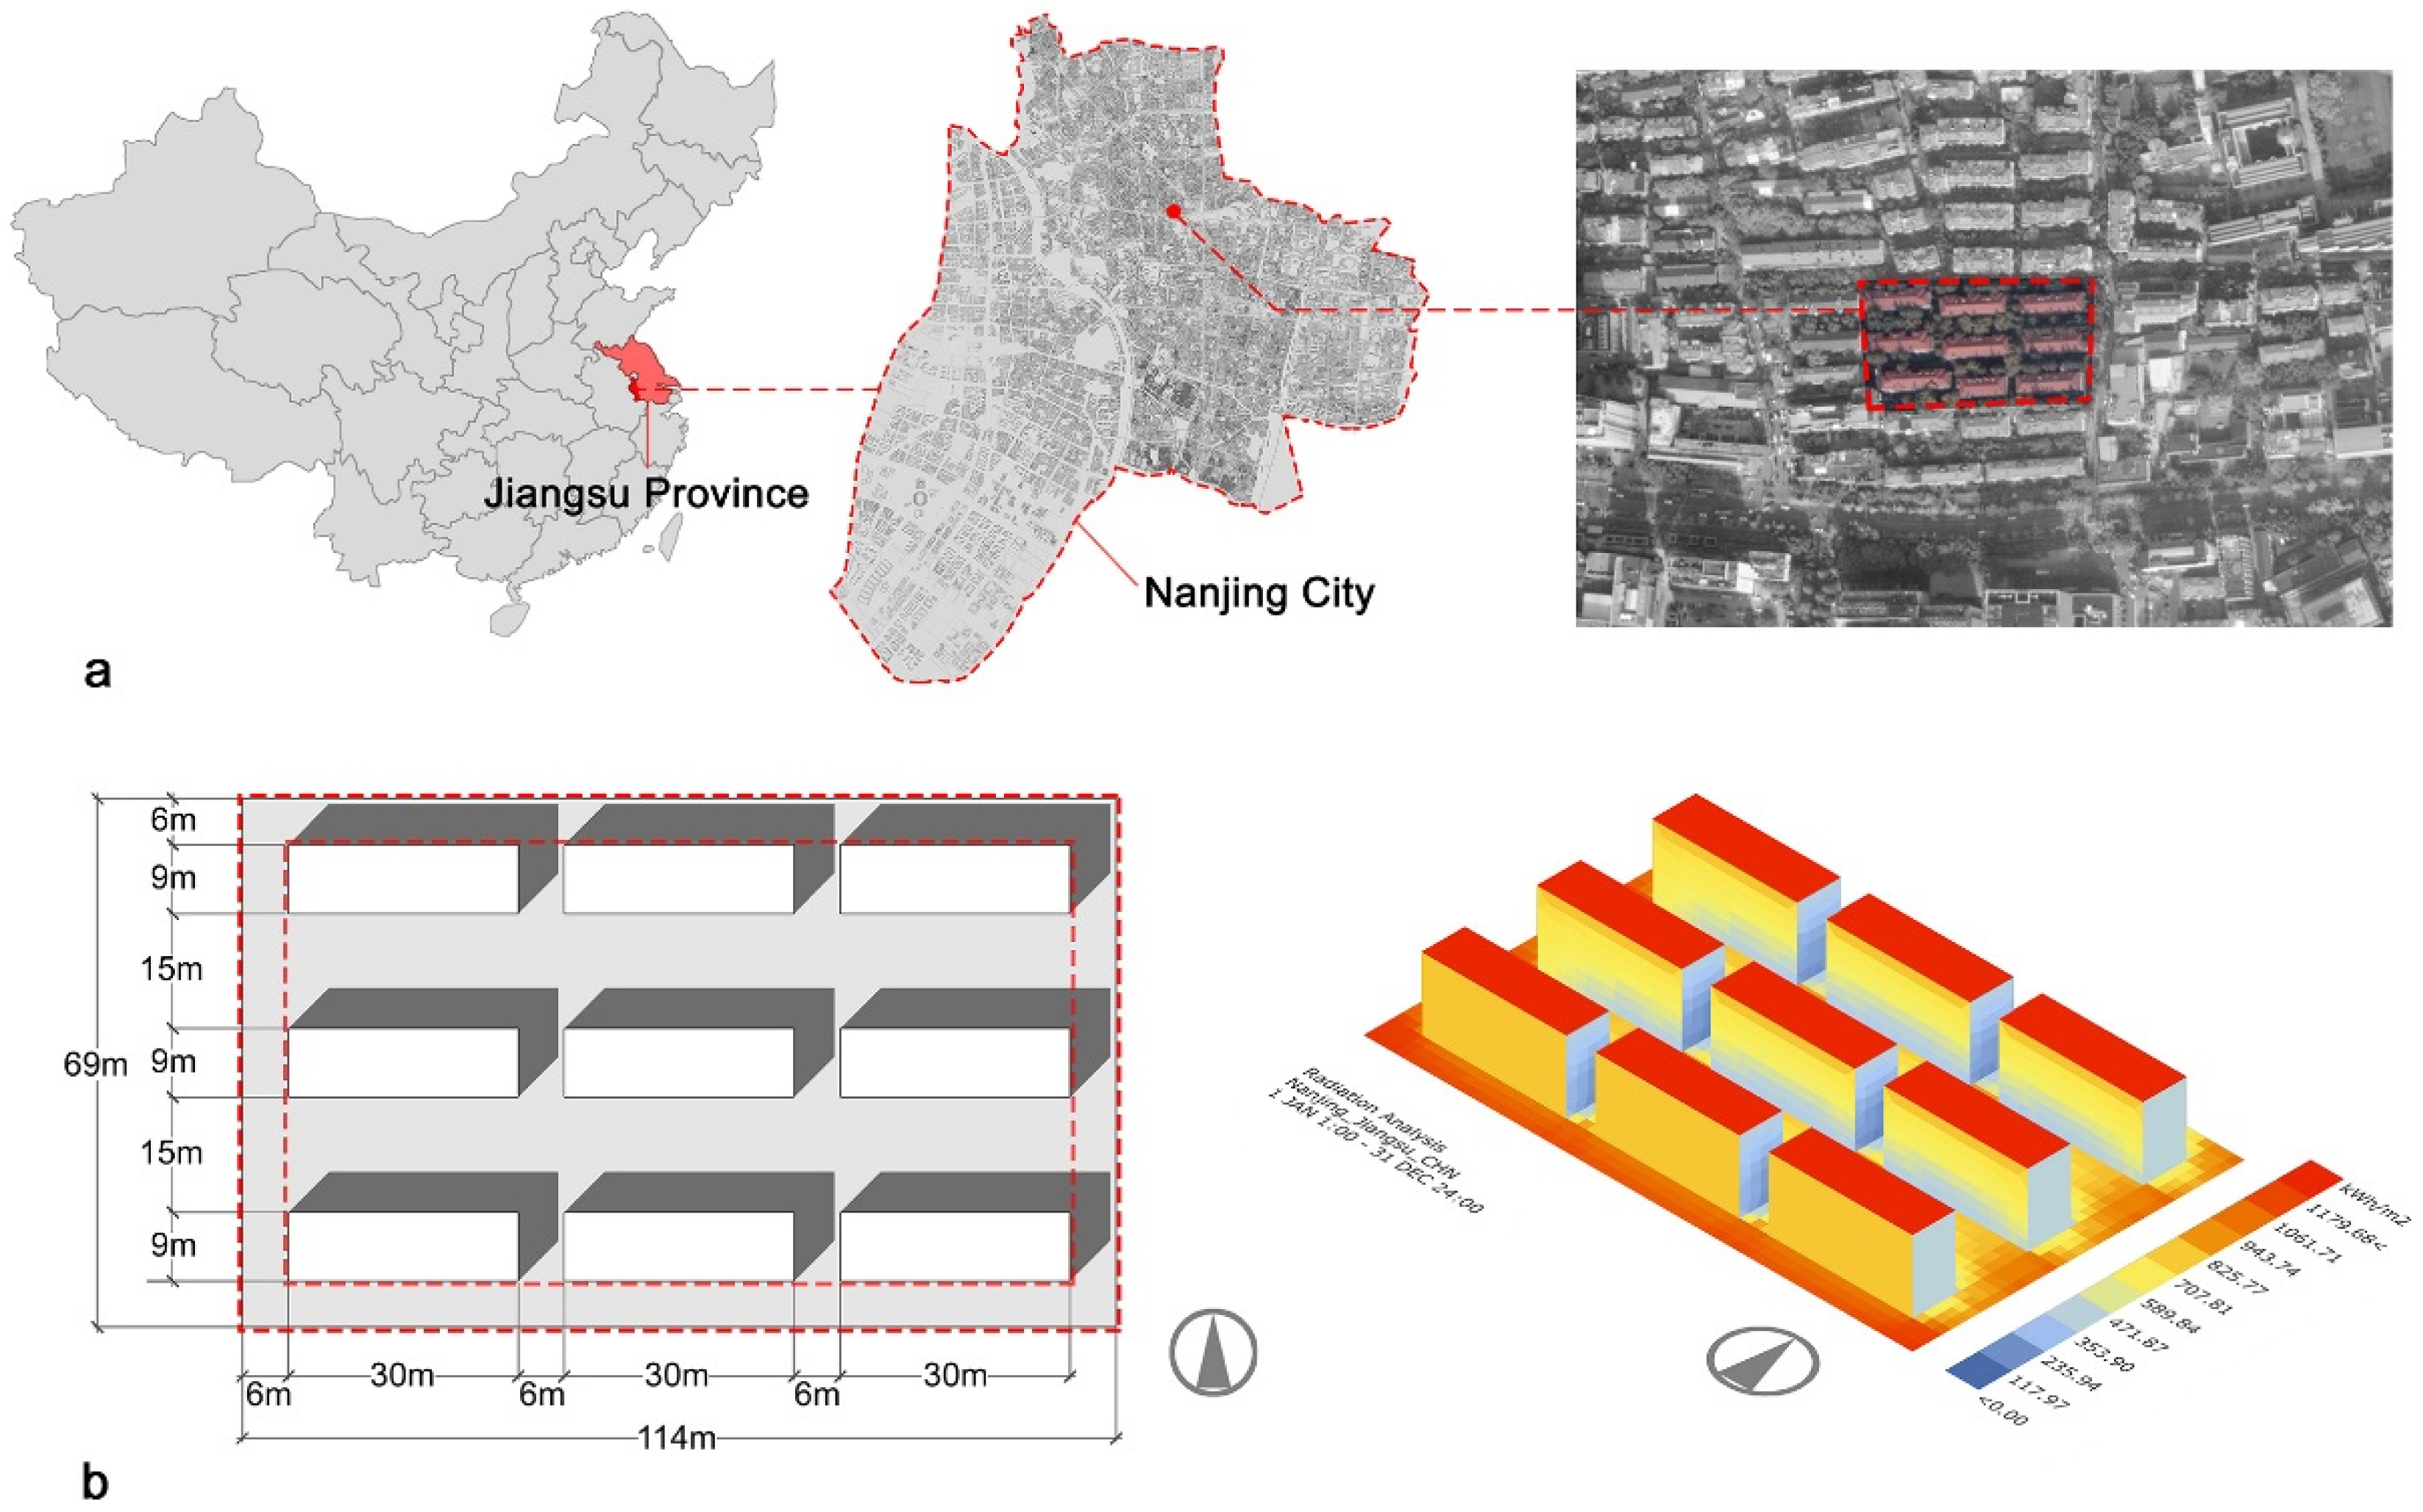
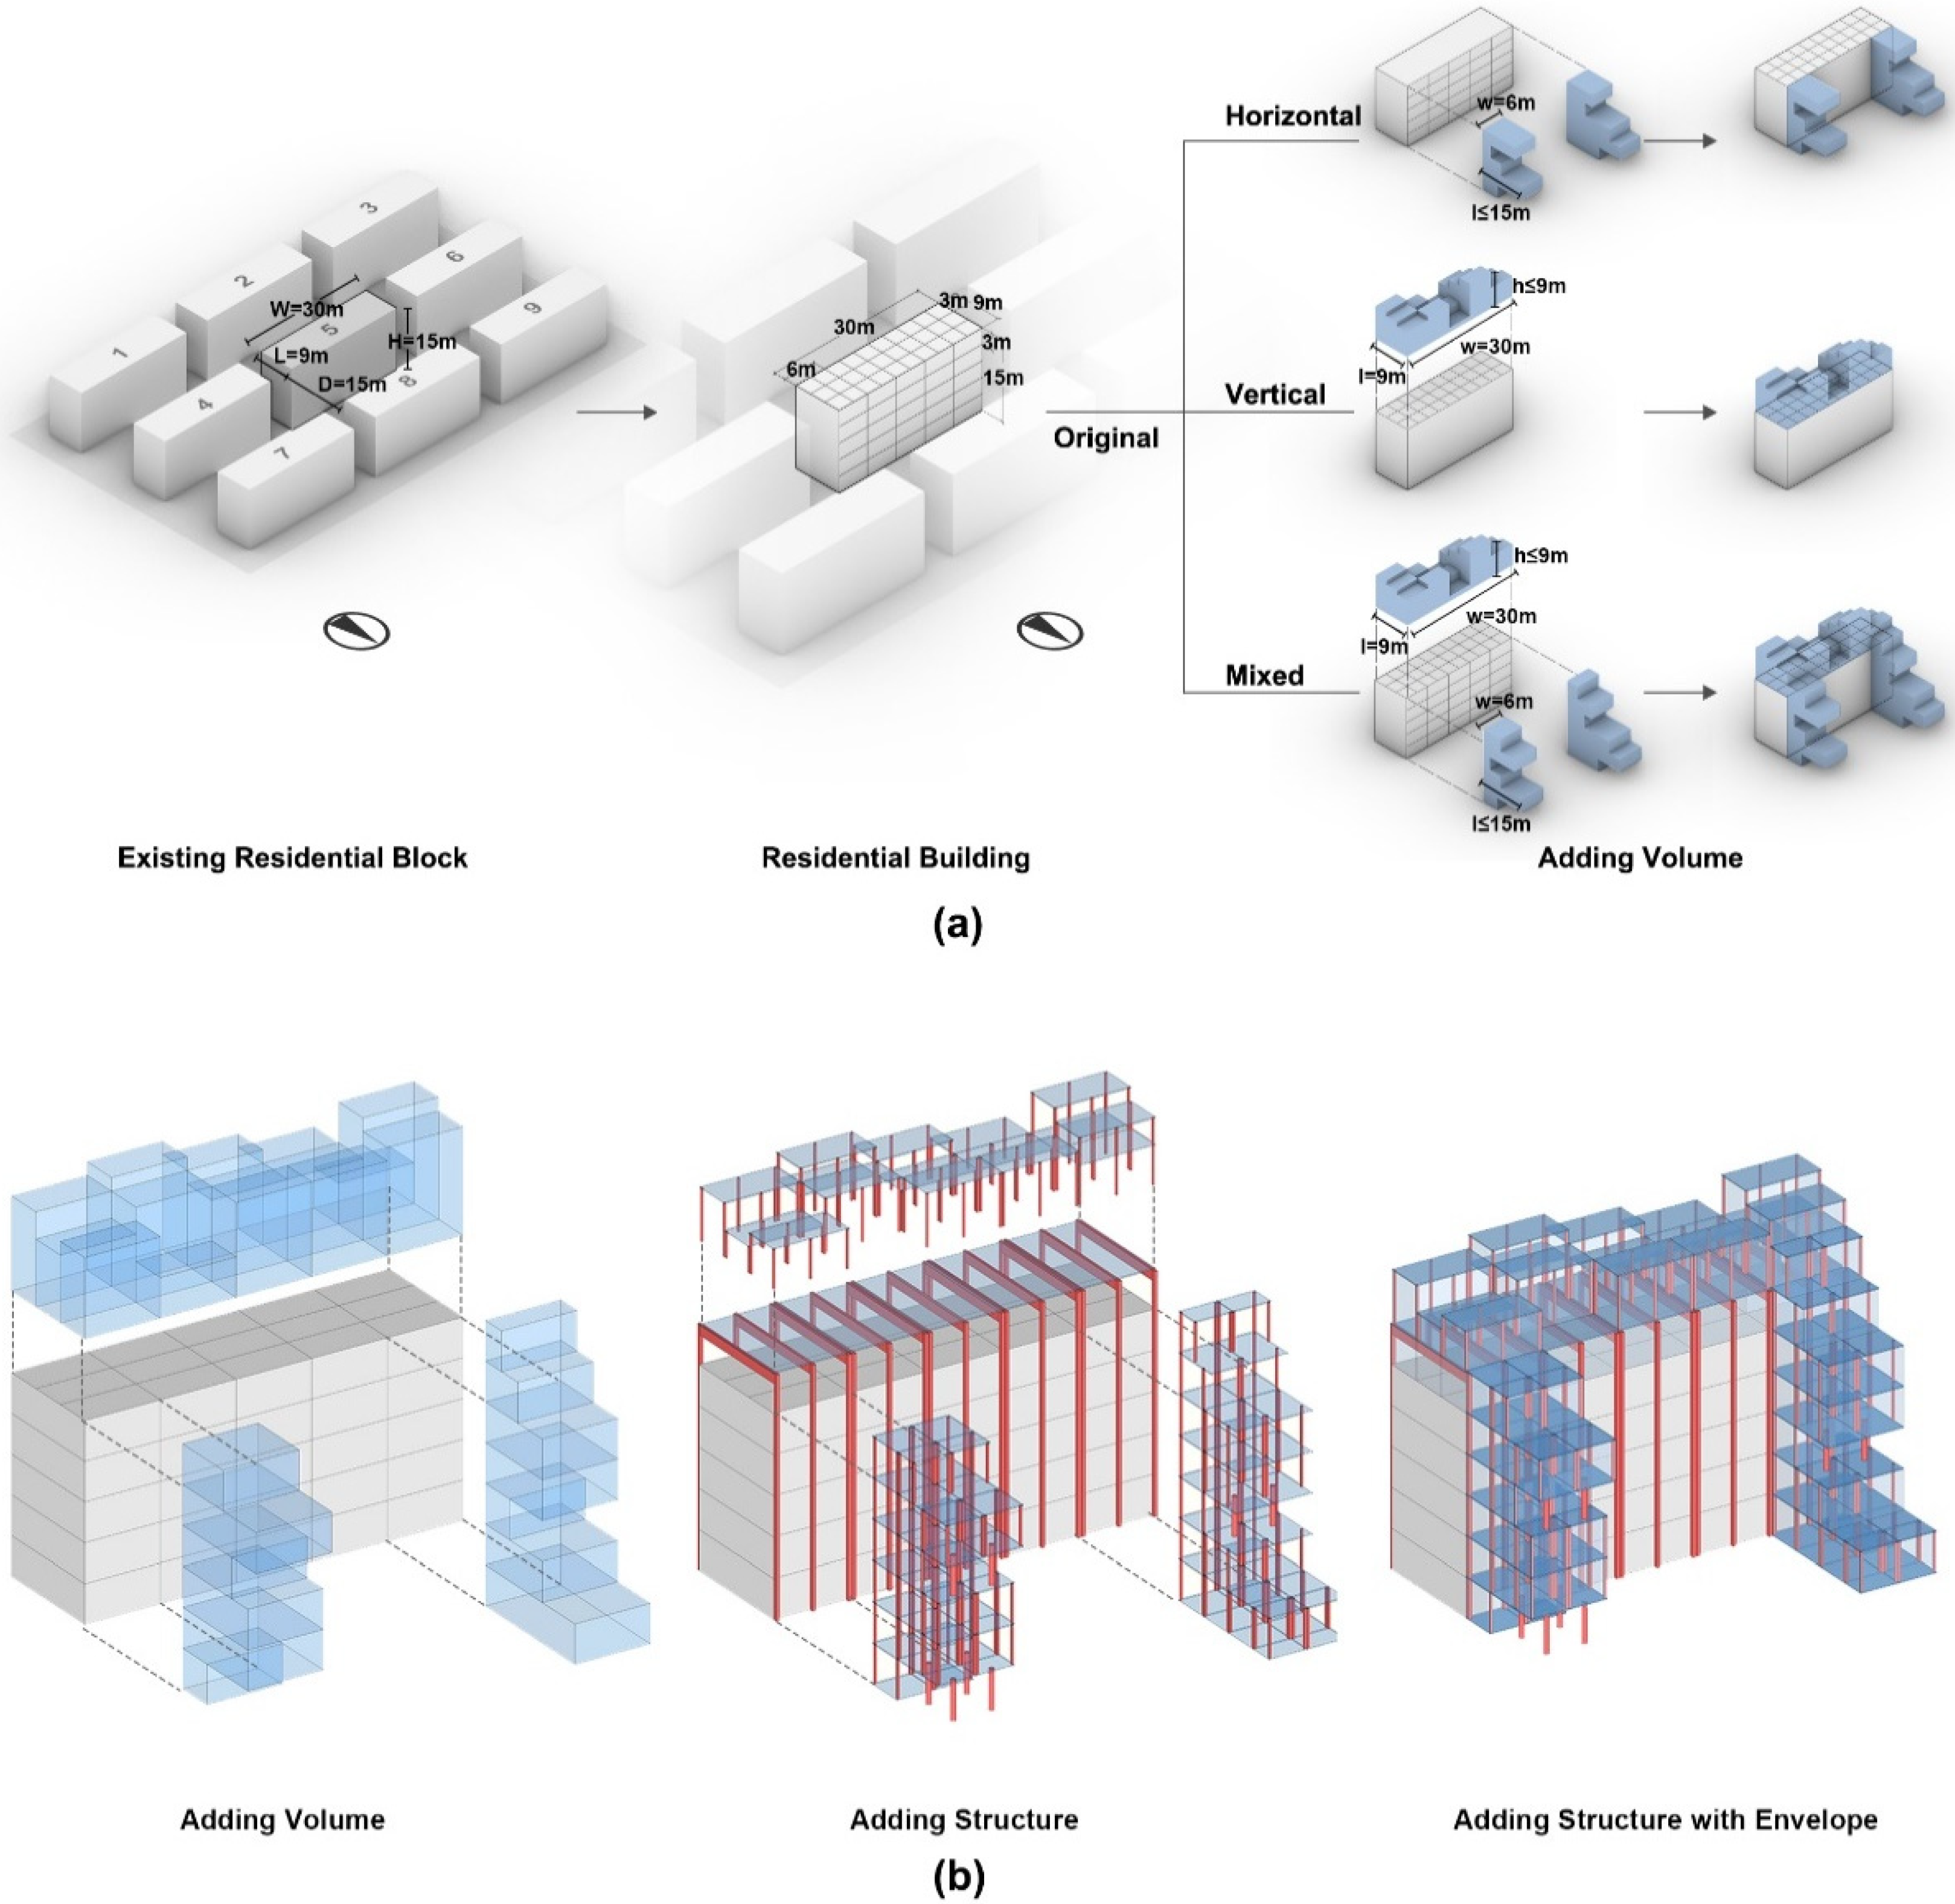
2.1. Initial Unit Settings

The research site selected for this paper is in Nanjing, the capital of Jiangsu Province, located in the Yangtze River Delta of China. The site has a typical climate with a hot summer and cold winter. Many multi-story residences were built in the 1980s and 1990s in the old city of Nanjing. The boundary of the site is rectangular, facing north–south, with an area of 7866 m2; the site has an east–west length of 114 m and a north–south length of 69 m. The current floor area ratio is 1.54. The residential block consists of nine residential buildings, arranged in three parallel rows. The distance between each row is 15 m, and the distance between buildings is 6 m. The setback of the block is 5 m. All initial building heights are 15 m with five floors. Each floor has four residential units. The side units are 9 m wide with two bedrooms and a living room in the south. The two middle units are 6 m wide, each with a south-facing bedroom and living room. There are 180 residential units in the block. Based on the solar time simulation analysis of the existing units, all 180 residential units meet the 1 h solar standard on the winter solstice (Figure 2).

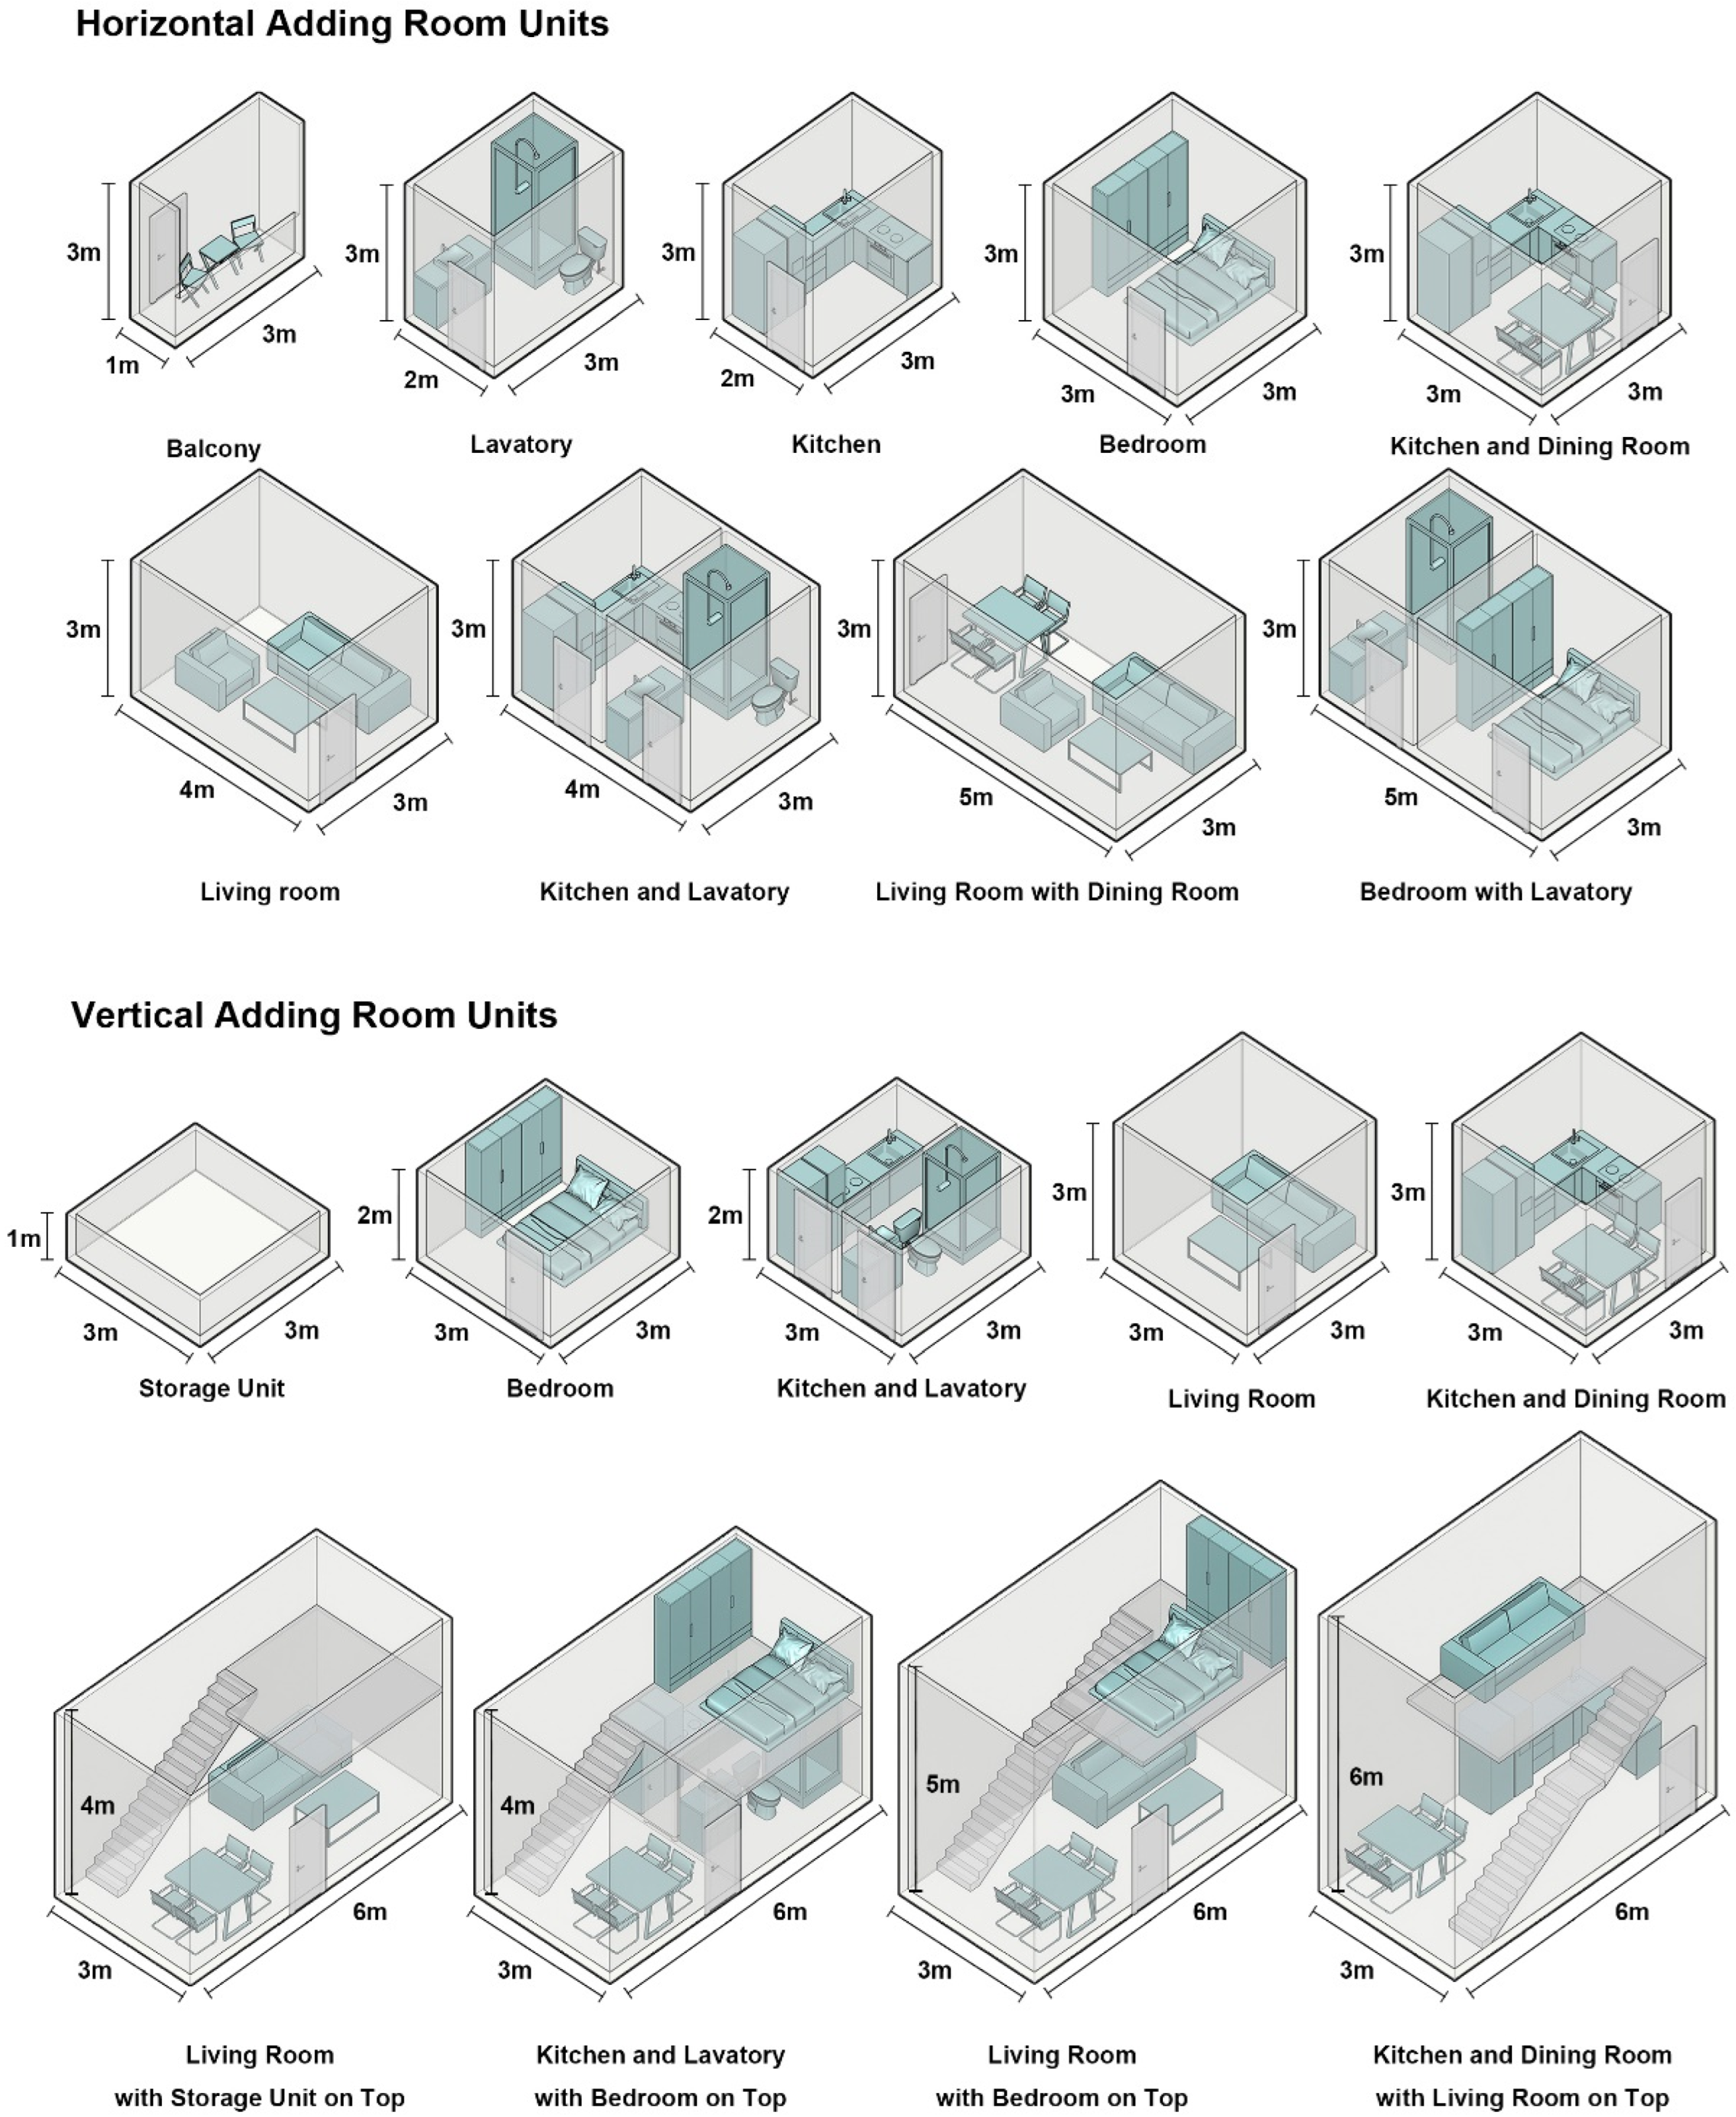
2.2. The Rule of Building Addition

The surfaces of the existing buildings, including the roofs and façades, are divided into square grids with a side length of 3 m. The grid size is set at 3 m according to the basic modules of the buildings used and the accuracy of the additional building volume. This study proposes three building addition methods: horizontal, vertical, and composite additions. The horizontal addition extends out from the east and west ends of the north façade of the building with a width of 6 m. The vertical addition mainly relies on the roof of the building, and the height of the additional building is obtained by adjusting the height of the roof grid. The composite addition is a combination of the horizontal and vertical additions. According to the accuracy of the building volume, the real floor height requirements, and the feasibility of data calculation, the minimum unit of the vertical addition is 3 m, and the minimum unit of the horizontal addition is 1 m (Figure 3a).
In order to support the volume of the additional building, two structural combination modes are proposed for vertical and horizontal additional building modes. One is the steel structure frame attached to the surface of the existing building, which can support the vertical additional building and reinforce the existing building structure. The other is a structure with independent columns and crossbeams to support the horizontal additional building and to minimize the impact of the newly added structure on the ground public space, as shown in Figure 3b.
The shape of the new volume is based on the function of the interior of the house, such as 1 m × 3 m for the balcony, 2 m × 3 m for the toilet or kitchen, 3 m × 3 m for the bedroom, and 3 m × 4 m for the living room. The larger volume is based on the combination and deformation of the above modules, as shown in Figure 4. In this study, the geometric parameters of the added building can be described by Equations (1)–(3).
H + h ≤ 24 m, H = 15 m, h ≤ 9 m
lD, D = 15 m
w = 30 m or w = 6 m

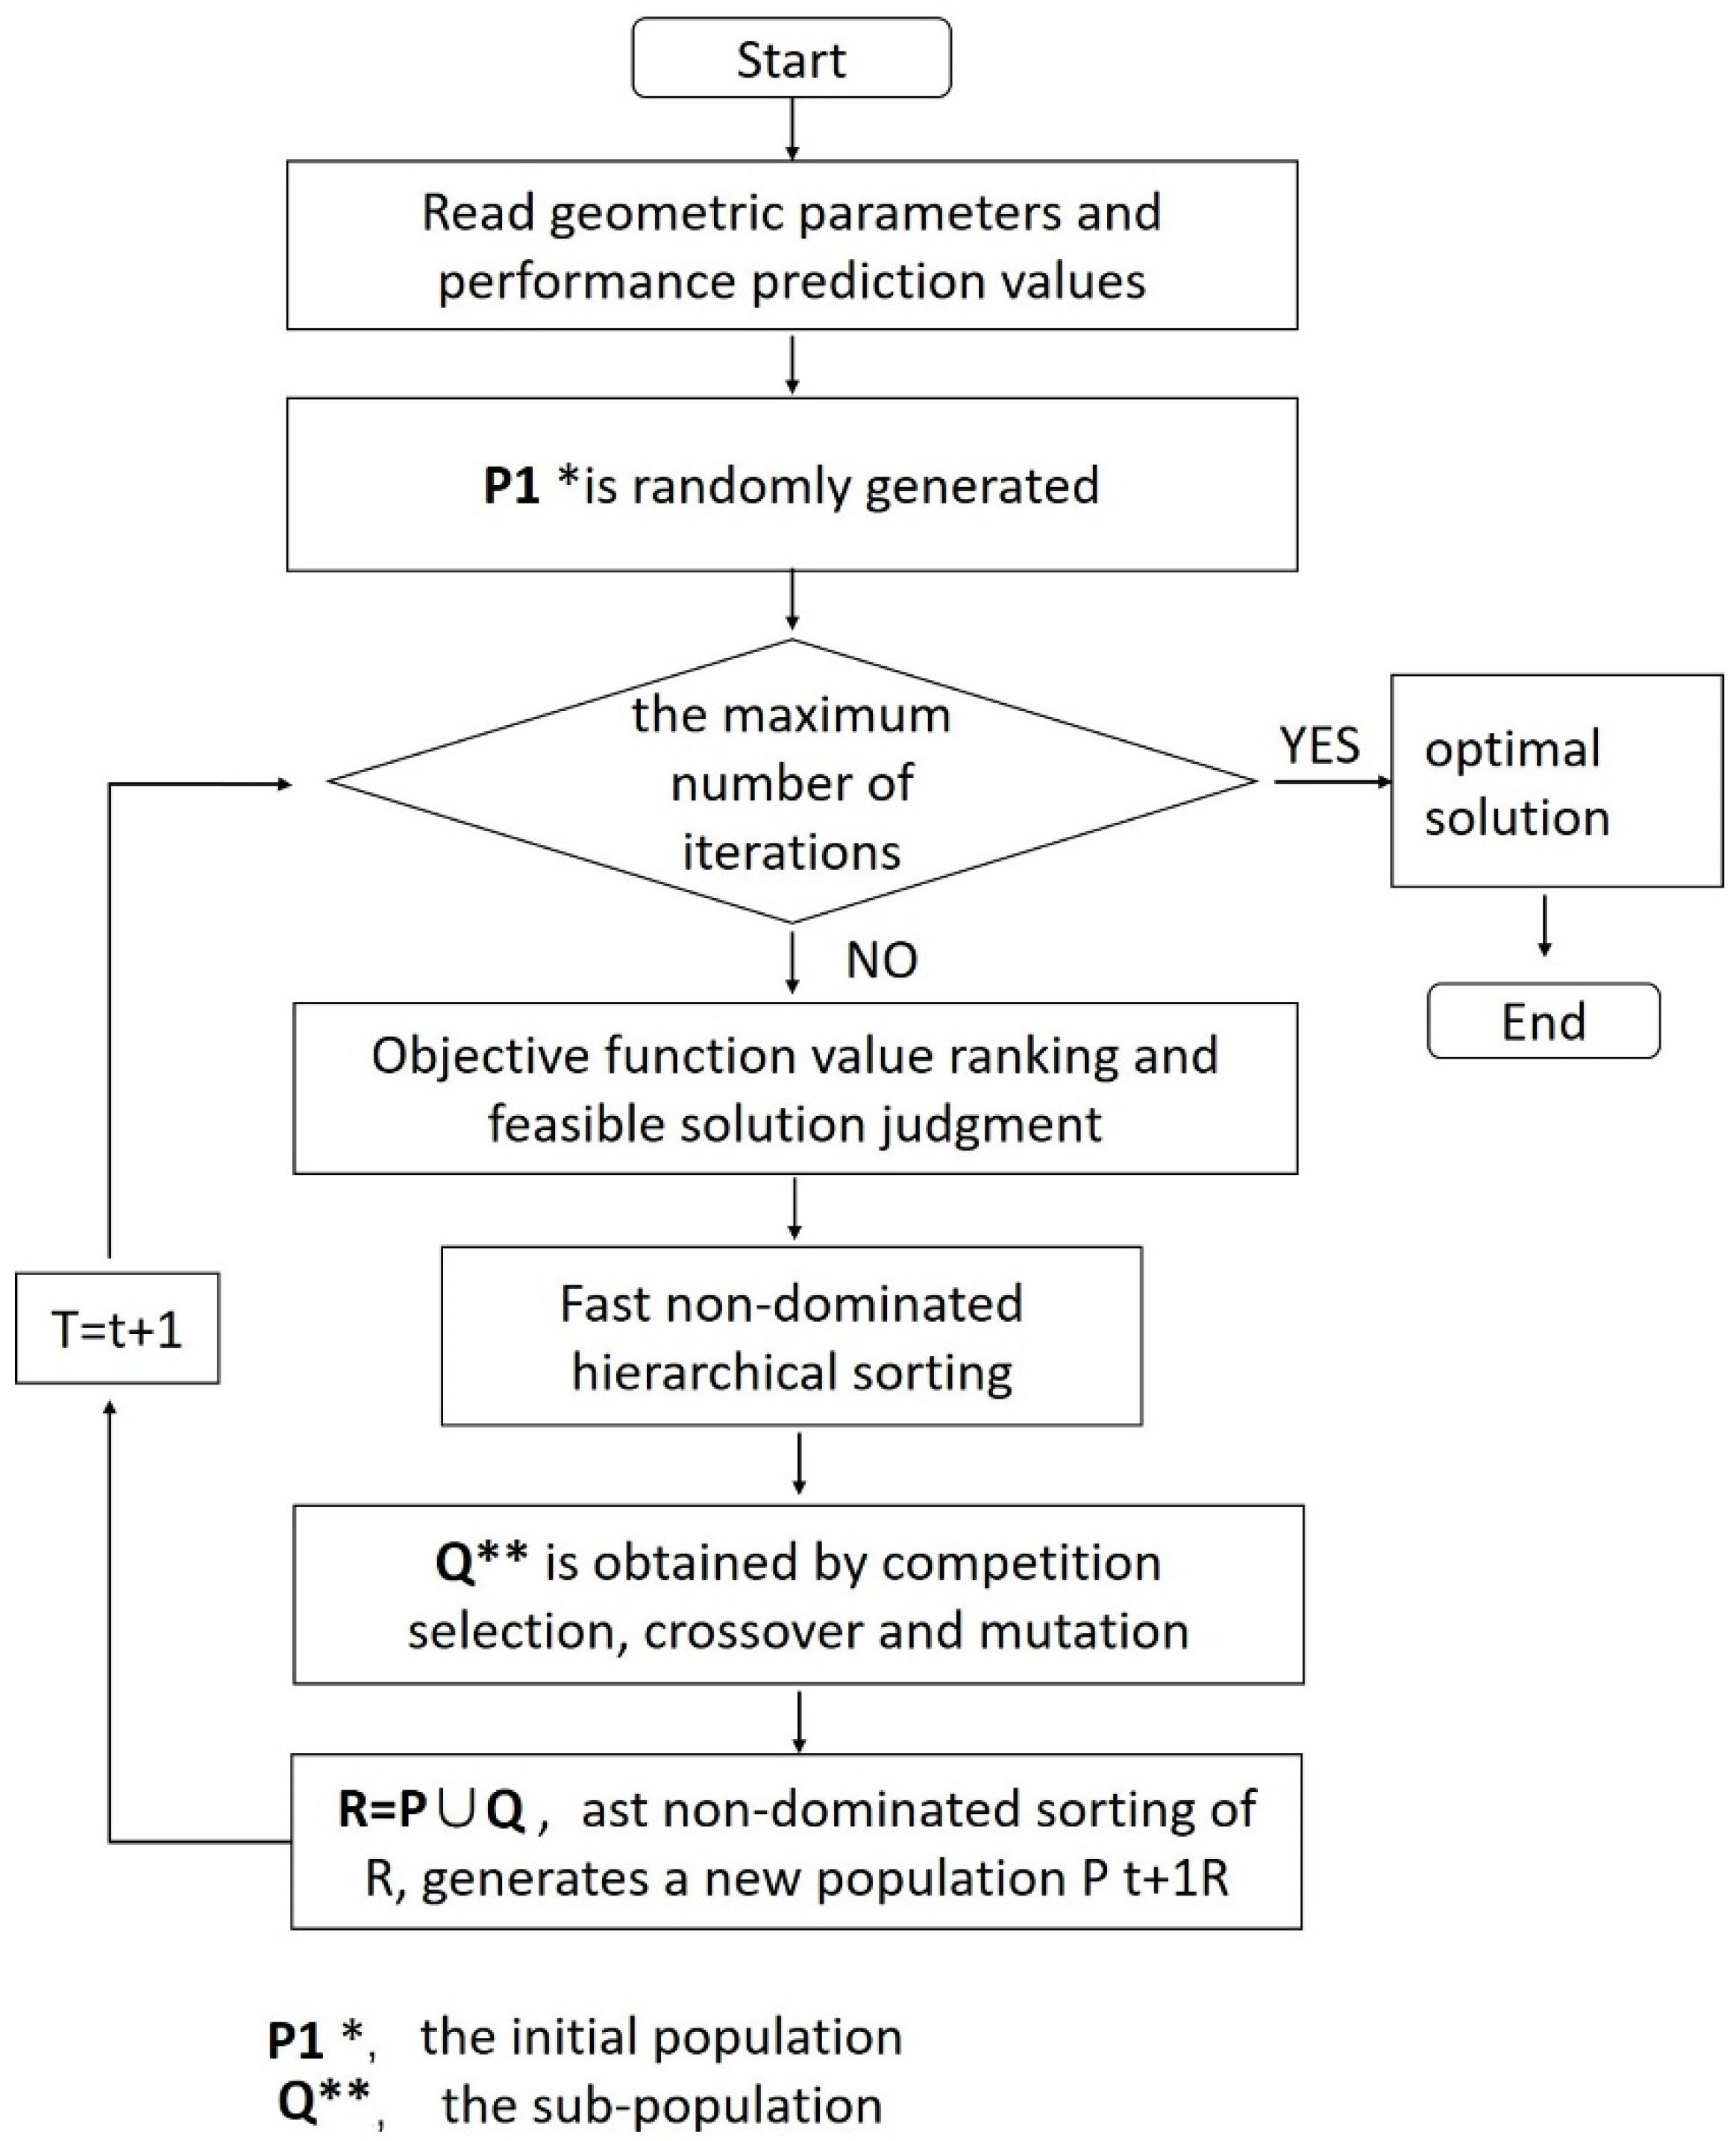
2.3. Multi-Objective Algorithm Workflow Construction and Simulation

The intelligent algorithm workflow constructed by the visual programing platform of Rhinoceros and Grasshopper mainly involves five modules (Figure 5). The first module is the construction of the initial three-dimensional model of the residential block and the statistics of morphological indicators. The second module is the additional building volume generation. By adjusting the grid’s parameter, the set can provide a gene library for the optimization algorithm. The morphological indicators corresponding to each scheme are automatically calculated and recorded. The third module is the solar performance simulation, for which a Ladybug plug-in is applied to simulate the average annual solar radiation value on the surfaces of the buildings and the site. The solar time of the building façade during the winter solstice is also calculated. The fourth module is a multi-objective optimization process, which uses the Wallacei plug-in to set multiple search targets according to research needs and then determines the algebra and scale of each generation. Wallacei X is the key built-in and integrated NSGA-II, one multi-objective optimization algorithm, which has been widely applied in optimization studies (Figure 6). The fifth module is the result output and data analysis, which involves conducting an overall analysis of the relevant parameter distribution of the screened scheme set.
In this research, the main objectives can be described in Equations (4)–(6), and Equation (7) concludes the multi-objective functions.
m a x f N F A R = i = 1 n = 9 g ( h i ,   l i , w i )
m a x f A S R = i = 1 n = 9 g ( h i ,   l i , w i )
m a x f R B F A = i = 1 n = 9 g ( h i ,   l i , w i )
Max   F = [ f N F A R ,   f A S R ,   f R B F A ] T
s . t .   h i     [ 1 , 2 , 3 , 4 , 5 , 6 , 7 , 8 , 9 ] l i     [ 1 , 2 , 3 , 4 , 5 , 6 , 7 , 8 , 9 , 8 , 9 , 10 , 11 , 12 , 13 , 14 , 15 ] w i     [ 6 , 30 ]
where m f N F A R ,   f A S R ,   f R B F A are three objectives maximizing the net floor area ratio, average solar radiation, and the ratio of the qualified building façade area. The constant, 9, is the number of existing buildings referred to in Figure 3a. h i ,   l i , w i are building height, building length, and building height of the additional buildings.
Grasshopper, a parametric design add-in program of Rhinoceros, is used in this research to integrate the geometry and performance issues of the model. This method allows the researchers to dynamically generate the parametric models by changing the input variables without having any knowledge about scripting. Parametric modeling is used for generation, and the modeling makes dynamic and precise adjustments of the building volume and layout. The simulation and calculation processes for solar radiation, solar time, and floor area ratio are performed on the same parametric platform to avoid errors and accuracy problems of data exchanges between different software [37].
To achieve the accuracy and efficiency of solar radiation and solar time simulation, Ladybug, an open-source environmental simulation plug-in for Grasshopper, is used in this paper to calculate the annual solar radiation gain and solar time of winter solstice. The input meteorological data were downloaded from an Energy-plus Weather file for a specific location. The solar radiation on the model surface of each grid was calculated. The simulation results were verified and shown to be reasonable [16,33,38,39].
In this paper, Wallacei, a plug-in for Grasshopper, is applied to perform the optimization. Wallacei applies evolutionary principles to parametric design and solution finding, uses a multi-objective optimization process, and allows for producing a set of trade-off solutions among varied objectives. Above all, Wallacei makes the optimization process visual and controllable. The multi-objective genetic algorithm is used to optimize the urban block form and to generate a Pareto frontier and several solutions that meet three objectives, which supports the urban designers choosing the scheme based on their requirements. The initial settings for this research are detailed in Table 1.

2.4. Data Analysis and Application in Different Scenarios
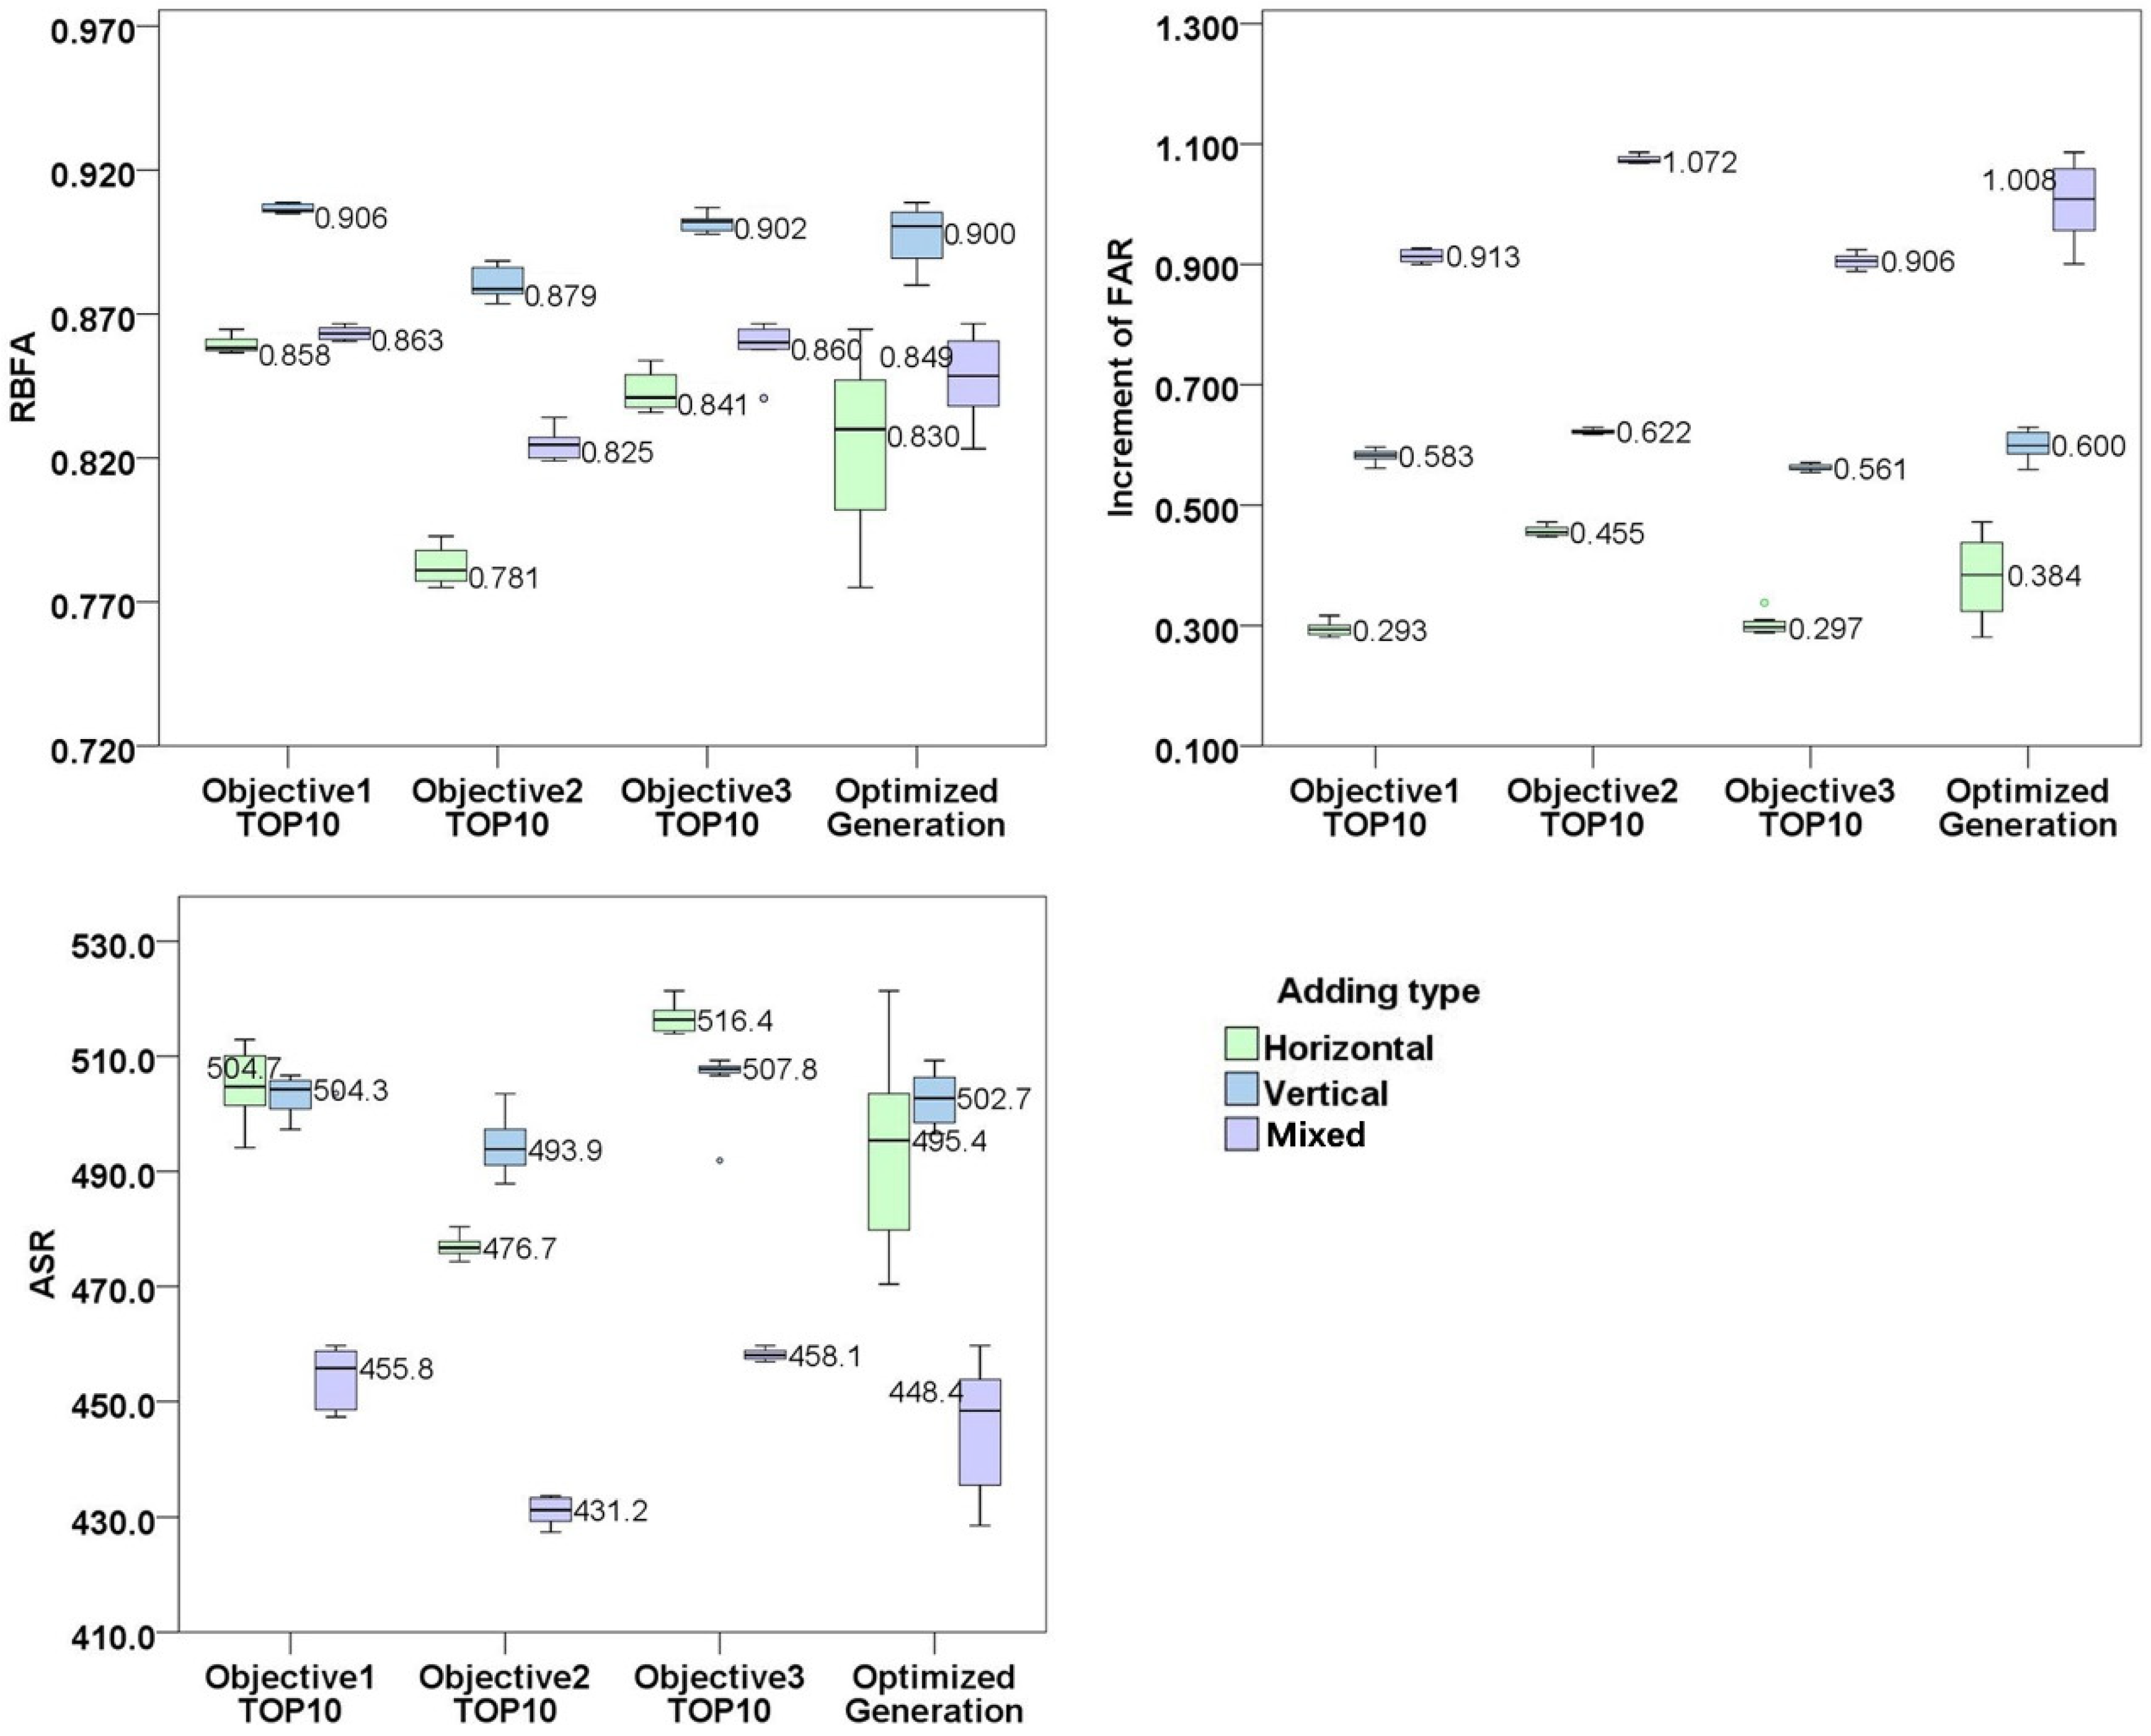
To quantitatively evaluate the three objectives of minimizing the over-shaded building façades, maximizing construction intensity, and maximizing solar radiation proposed in the research, three basic indicators—(ratio of building façade area, floor area ratio, and the average solar radiation)—are used in the study. The maximization of the plot ratio pertains to the maximum benefit that can be obtained from the renovation of the residential block. The average solar radiation represents the potential of the block to utilize solar radiation, and the ratio of building façade area represents the degree of insolation unaffected by building additions. The calculation methods for each index are as follows (Table 2).
In this study, the previous three objectives were set for the three addition methods. First, 50 schemes were selected for each additional construction mode; 10 of those schemes were screened out according to the three single-objective priorities, and 20 schemes were screened out in the optimized generation. Data analysis is carried out for the selected scheme along with the corresponding construction intensity, solar radiation, and over-shaded building façade area ratio. Then, the method is applied to three different scenarios with the orientation of 30°, 60°, and 90° from south to west. The increase in FAR and solar performance indices is discussed for each additional mode, and the preferred additional method for different orientation scenarios is proposed.

3. Results

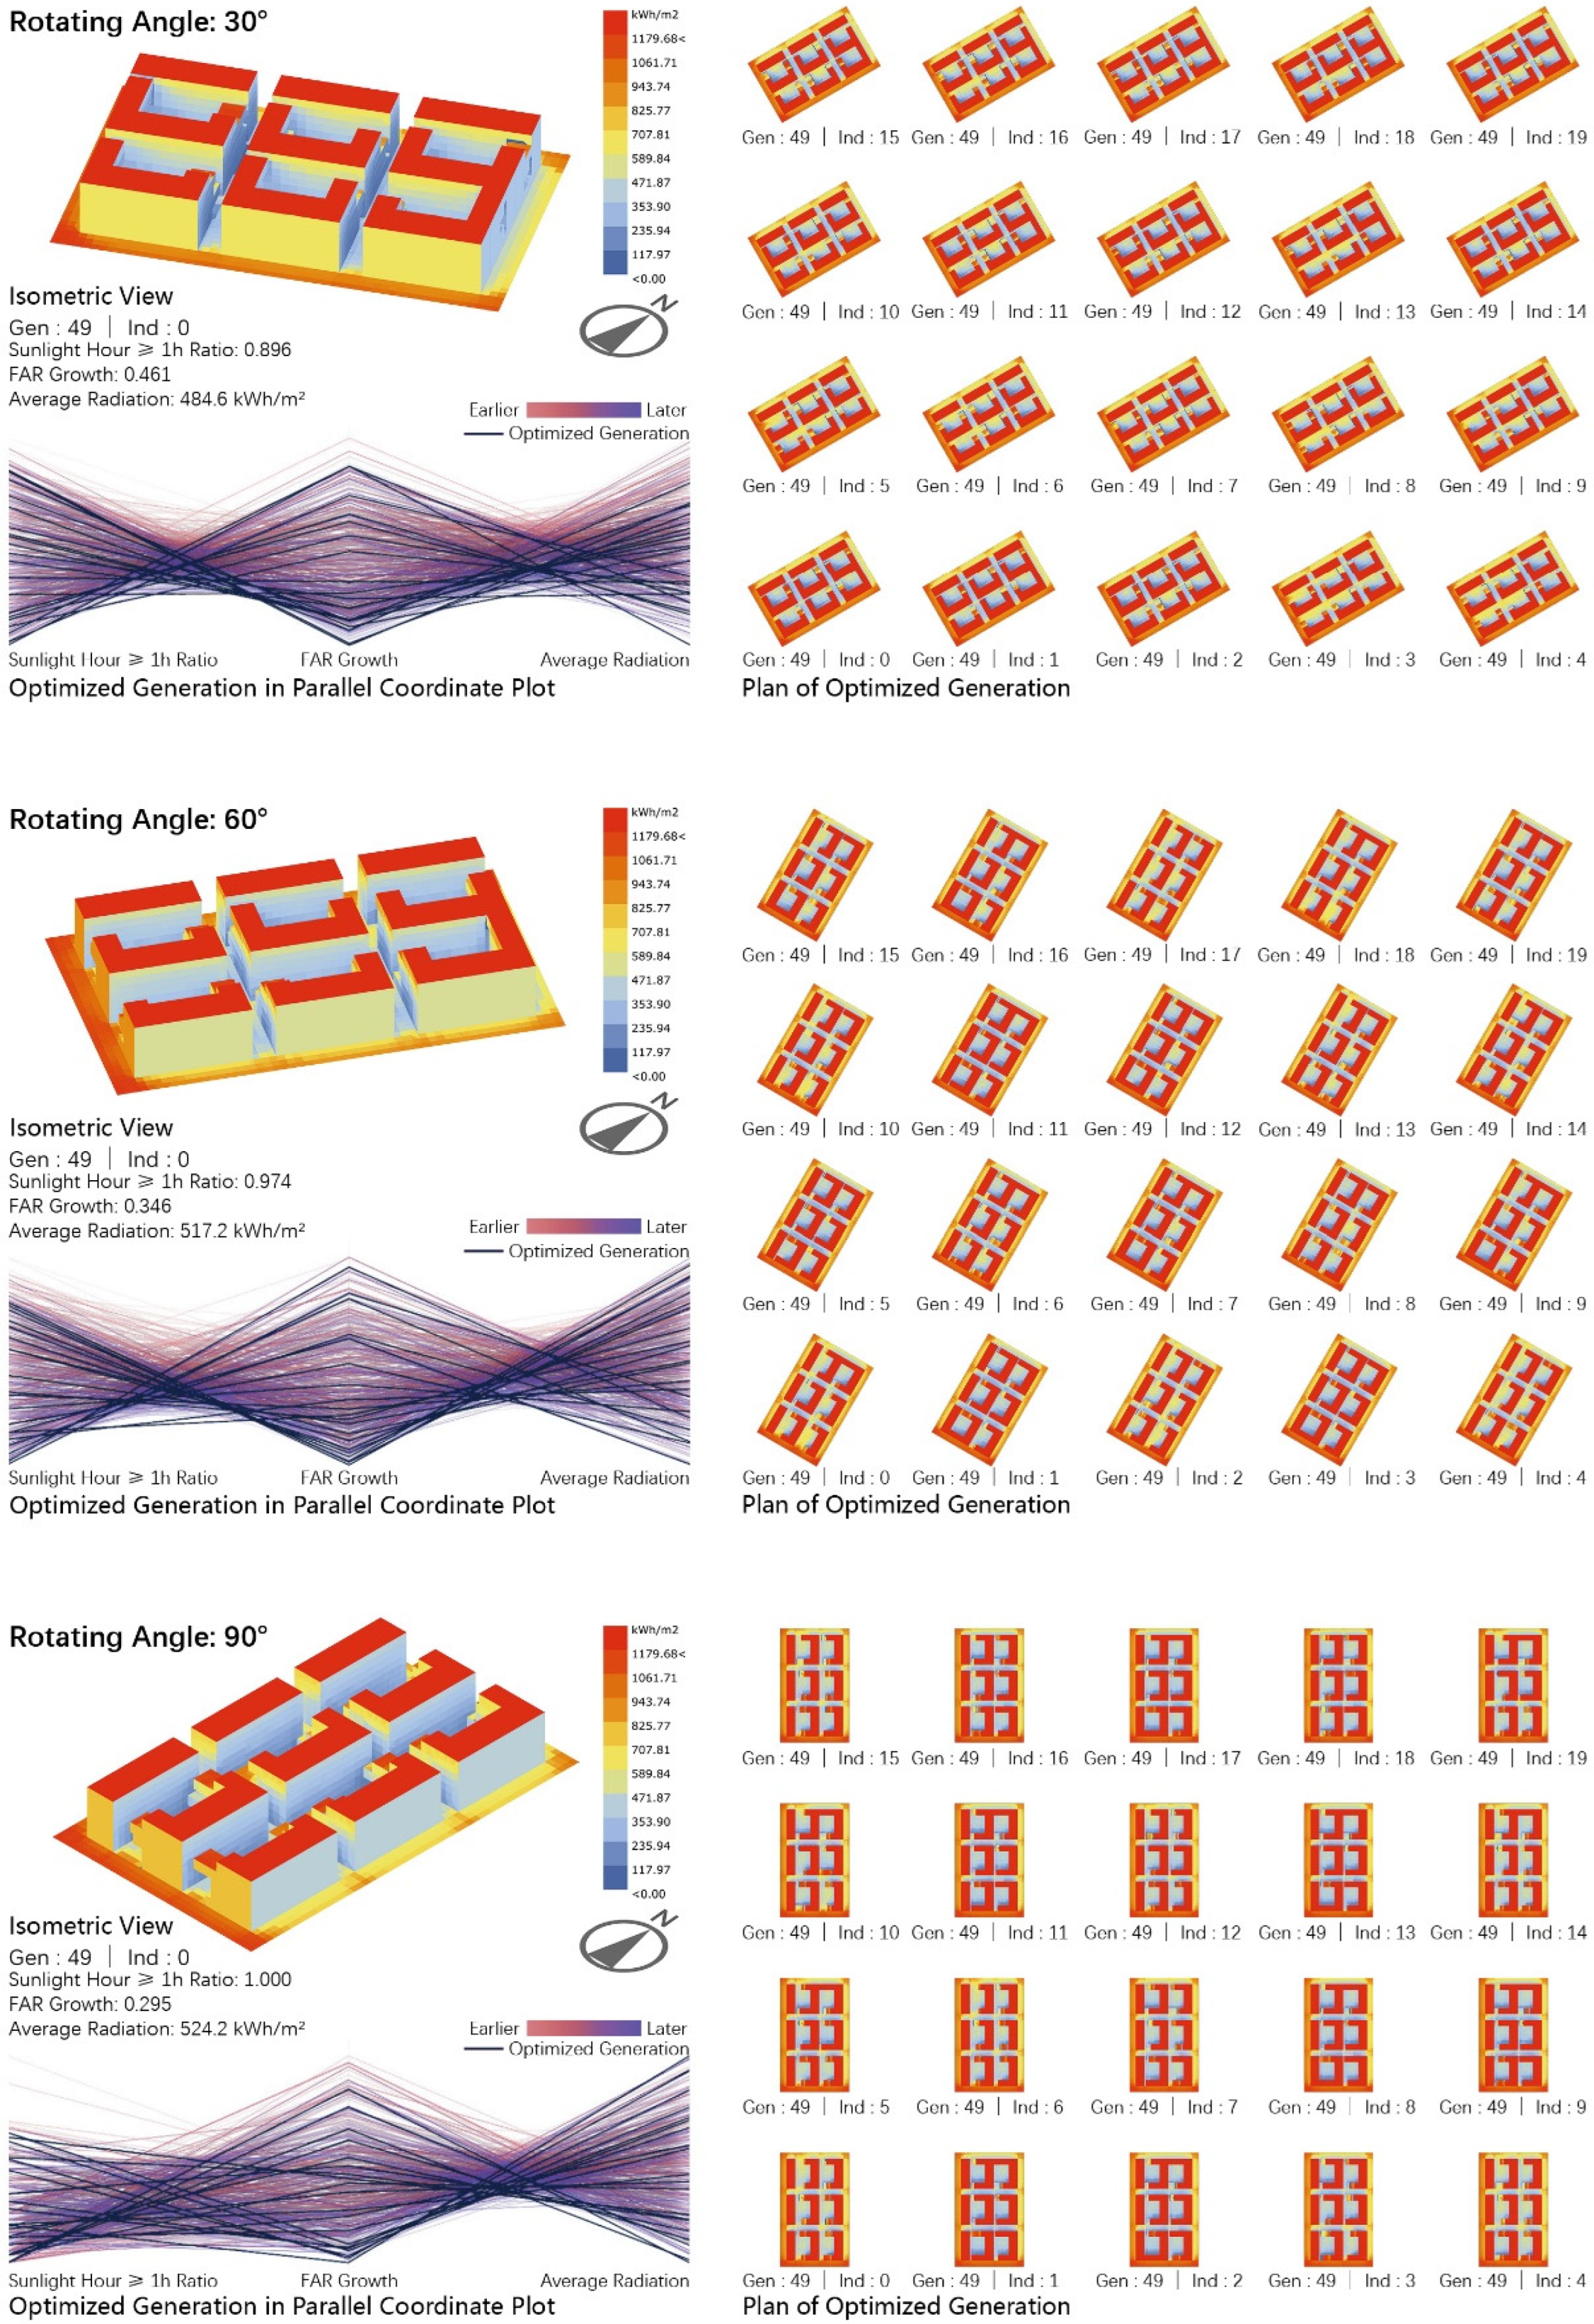
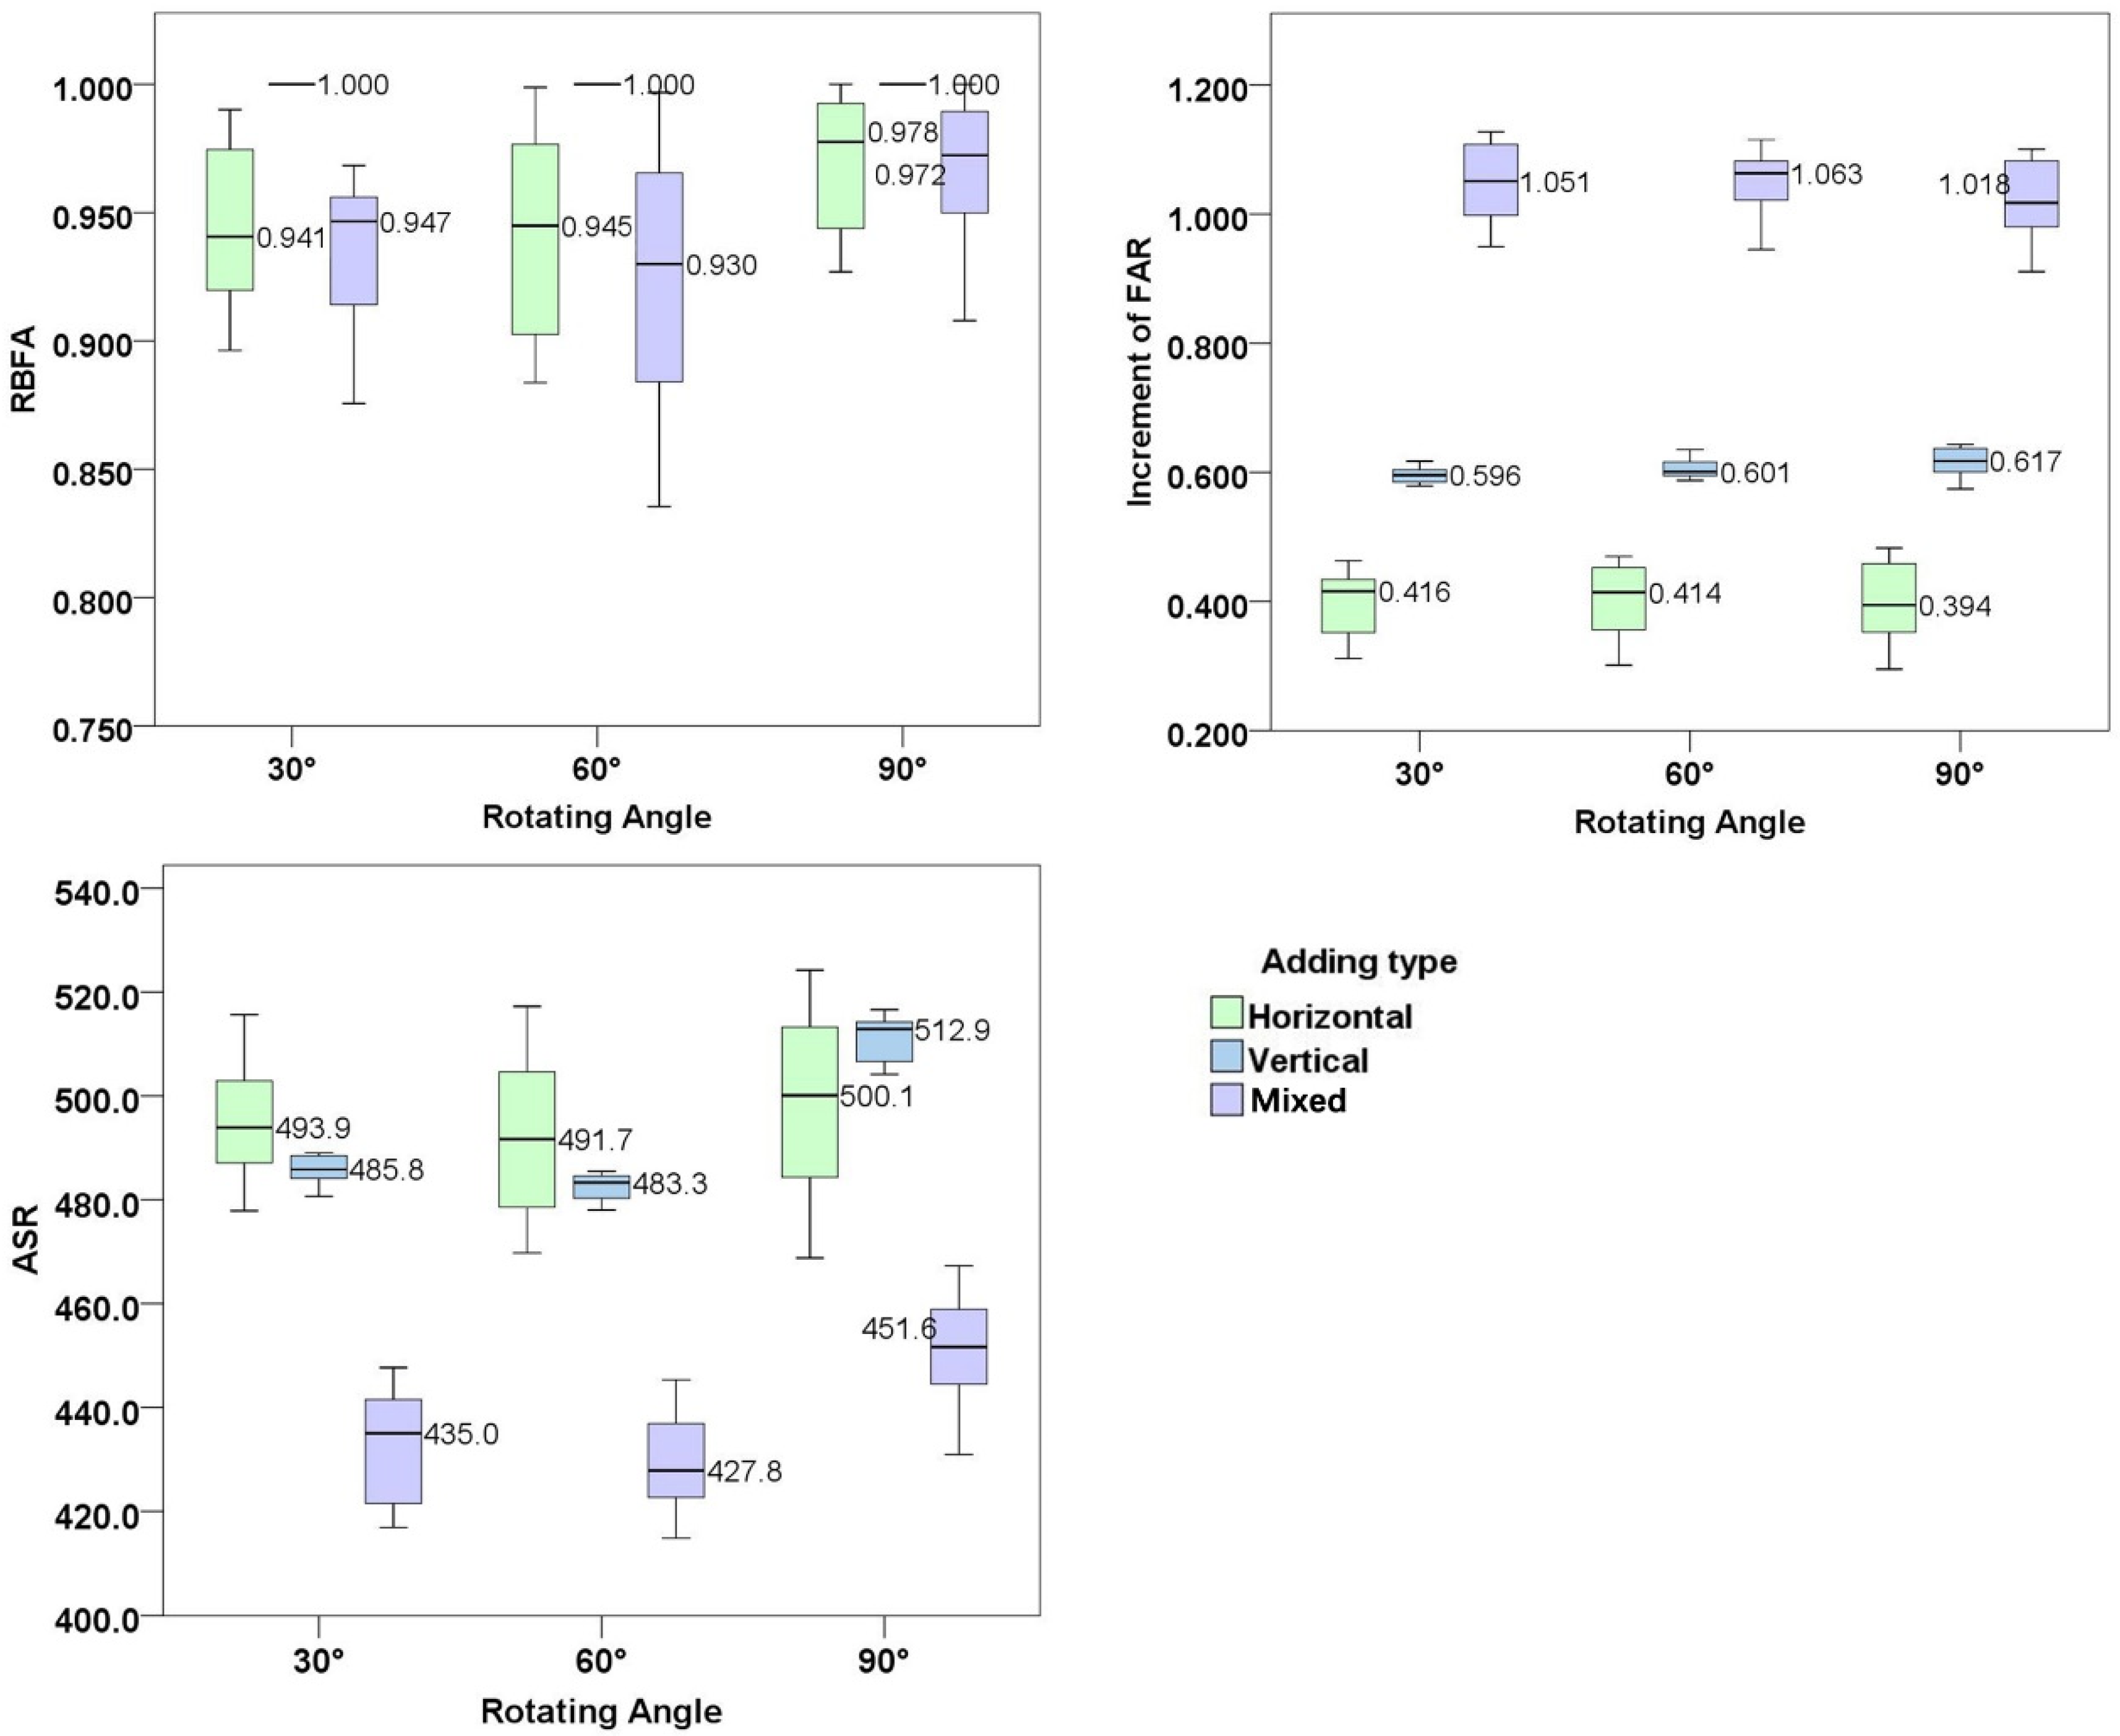
3.1. Horizontal Addition Mode

According to the screened rules of the previous schemes, 50 horizontal addition schemes were selected. The overall average FAR increased by 0.363. The ASR was 497.6 kWh/m2, about 11.4% less than the existing residential block, while the RBFA was 87.9%. Meanwhile, the increase in NFAR was about 0.177.
According to Objective 1 (minimize the over-shaded building façade area), 10 schemes were screened out. The average FAR increased by 0.294, and the ASR was 505.0 kWh/m2, about 10.1% less than the existing residential block. The RBFA was 91.2%. The average increase in NFAR was about 0.159. According to Objective 2 (maximize the FAR), 10 schemes were screened out. The average FAR increased by 0.457, and the average building density increased from 0.309 to 0.416. The ASR was 476.8 kWh/m2, a decrease of 15.1% compared with the existing residential area. The RBFA was 83.5%, and the increase in NFAR was about 0.202. Ten schemes were screened out based on Objective 3 (maximize average solar radiation). The ASR was 516.7 kWh/m2, a decrease of 8.0% compared with the existing residential block. The average FAR increased by 0.301, and the RBFA was 89.5%. The average NFAR increased by about 0.14. For the 20 schemes in the optimized generation of solutions, the average FAR increased by 0.382. The ASR was 494.7 kW/m2, a decrease of 11.9% compared with the existing residential block. The RBFA was 87.7%. The average increase in NFAR was about 0.193 (Figure 7).
The horizontal increase model achieved a certain degree of increase in the volume ratio, while the average solar radiation was greatly reduced. Among the selected plan groups, the average solar radiation was reduced by 11.4%. This reduction occurred for two main reasons. First, after the buildings were horizontally added, the distance between the buildings in the north–south direction narrowed, resulting in an increase in the solar occlusion between the buildings. Second, the complex volume of the building led to the building self-shading, which reduced the overall average solar radiation.

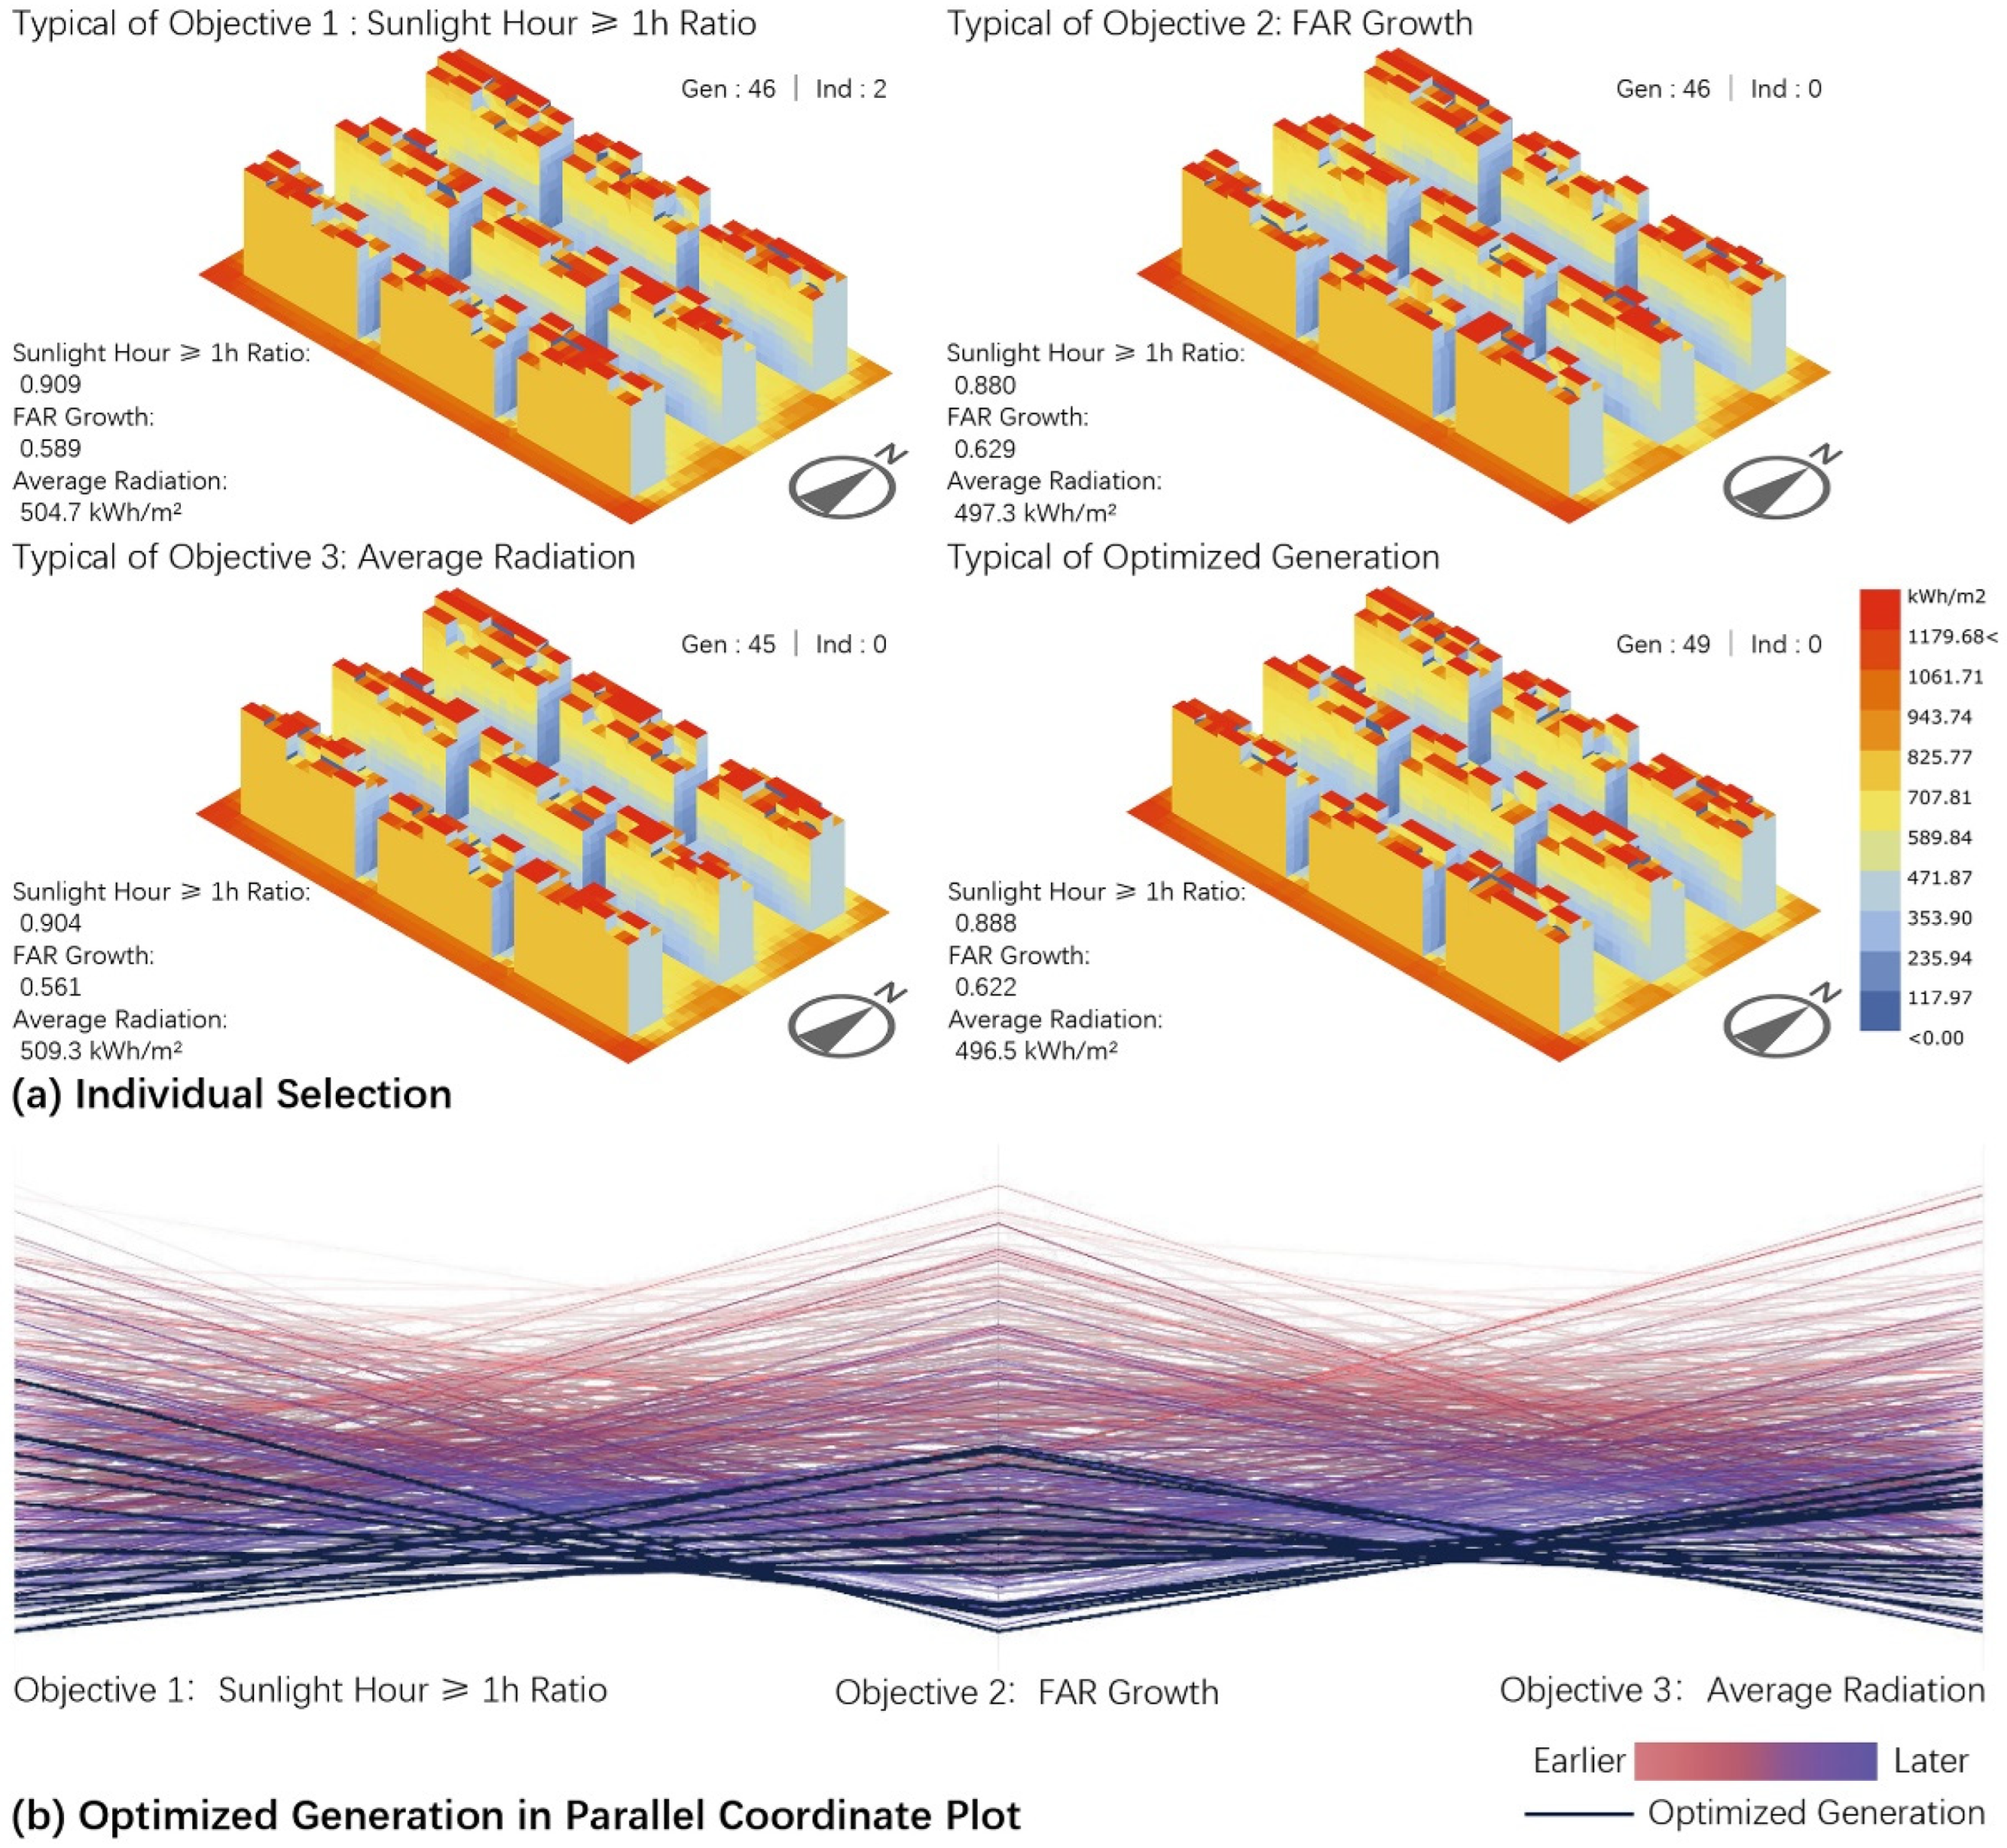
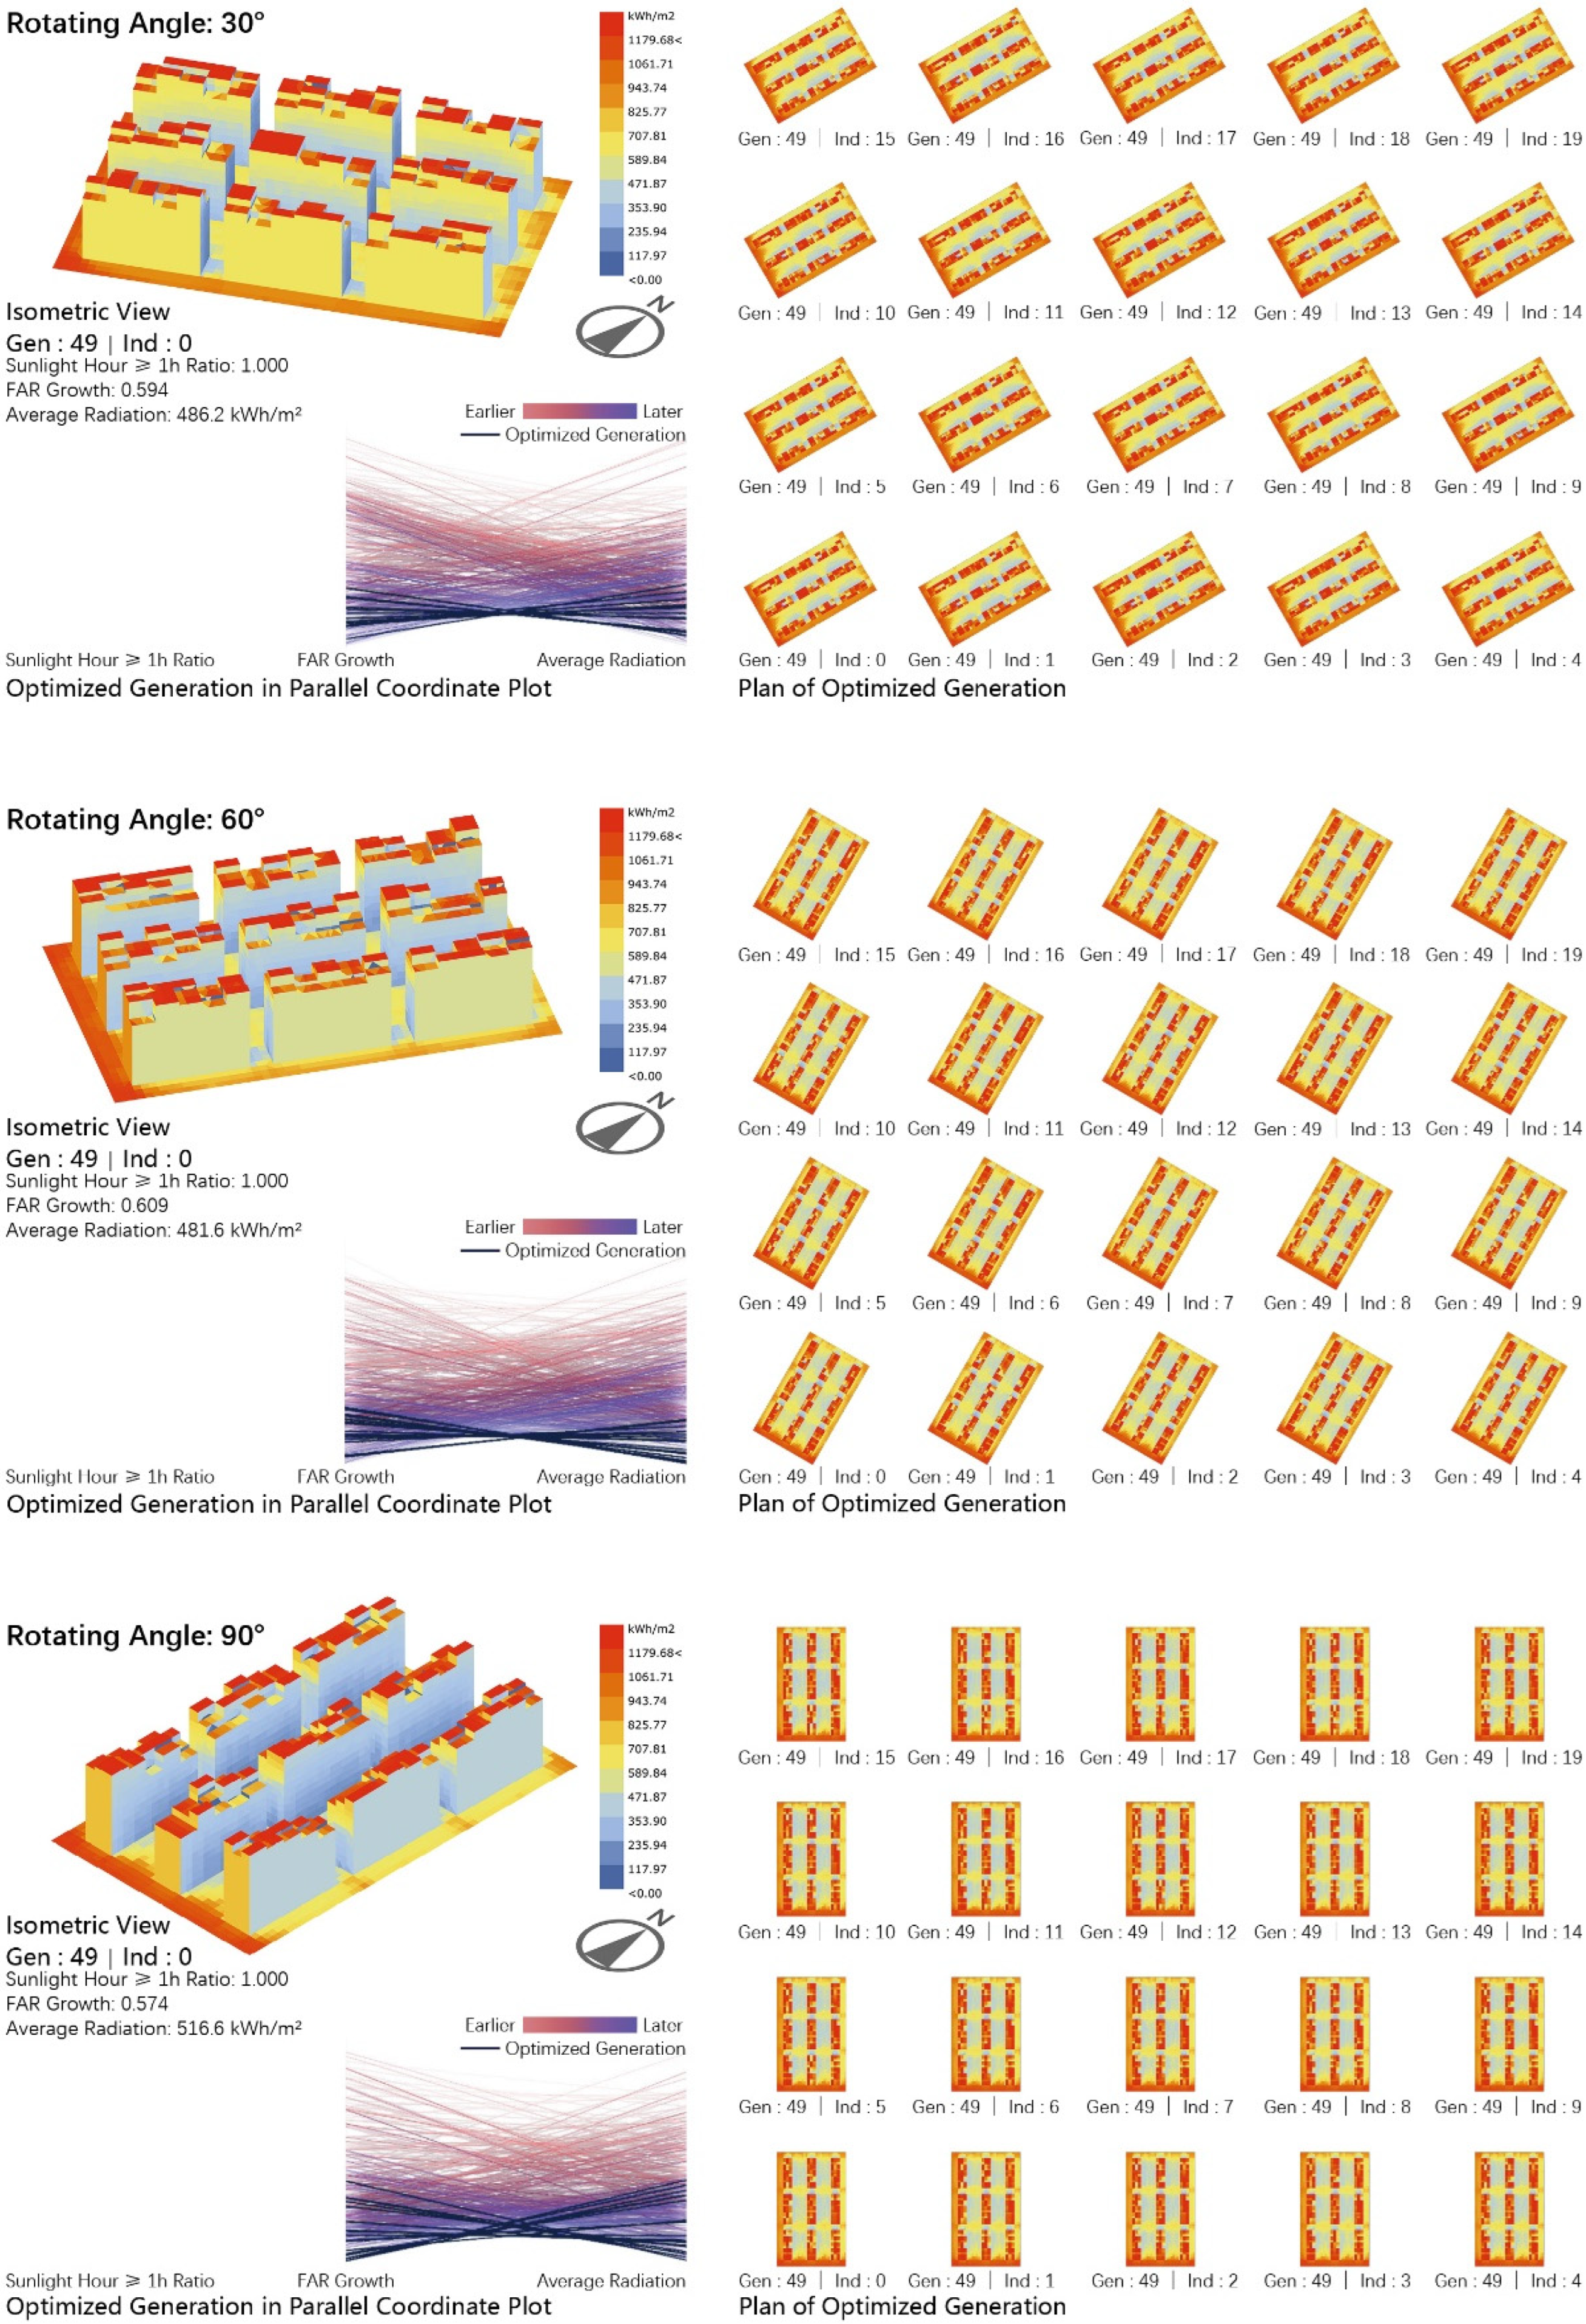
3.2. Vertical Addition Mode

A total of 50 vertical addition schemes were screened out according to the previous method. The average FAR increased by 0.593. The ASR was 501.8 kWh/m2, a decrease of 10.6% compared with the existing residential area, and the RBFA was 95%. Combined with the FAR and the RBFA, the average increase in NFAR was about 0.515.
Ten schemes were screened out according to Objective 1 (minimize the area of façades affected by solar shade). The RBFA was 96%, and the average FAR increased by 0.581. The ASR was 503.5 kWh/m2, about 10.3% less than the existing residential block. The average increase in NFAR was about 0.518. For the 10 schemes screened out based on Objective 2 (maximize the floor area ratio), the average FAR increased by 0.623. The average solar radiation was 493.3 kWh/m2, which was 12.1% lower than that of the existing residential buildings. The RBFA was 93.3%. The average increase in NFAR was about 0.518. According to Objective 3 (maximize the average solar radiation), 10 schemes were selected. The ASR was 507.8 kWh/m2, a decrease of 9.6% compared to the existing residential area. The average FAR increased by 0.562. The RBFA was 95.5%, and the average increase in NFAR was about 0.49. Among them, the maximum FAR increase was 0.571, and the corresponding ASR was 506.4 kWh/m2. The optimized generation output 20 schemes; the average FAR increased by 0.599, and the ASR was 502.2 kWh/m2, a decrease of 10.6% compared with the existing residential block. The RBFA was 95.05%. The average increase in NFAR was about 0.523 (Figure 8).
Compared with the horizontal addition mode, the vertical addition mode had a slightly higher FAR increase of 63.4%. The ASR was 0.84% higher, and the proportion of the affected solar façades was reduced by 58.7%. One reason for the result is that for the horizontal increase mode, the last row of buildings was constrained by the site boundary, while the vertical increase mode was not. In addition to that, the vertical increase mode did not increase the building density and had minimal impact on the open space between buildings.

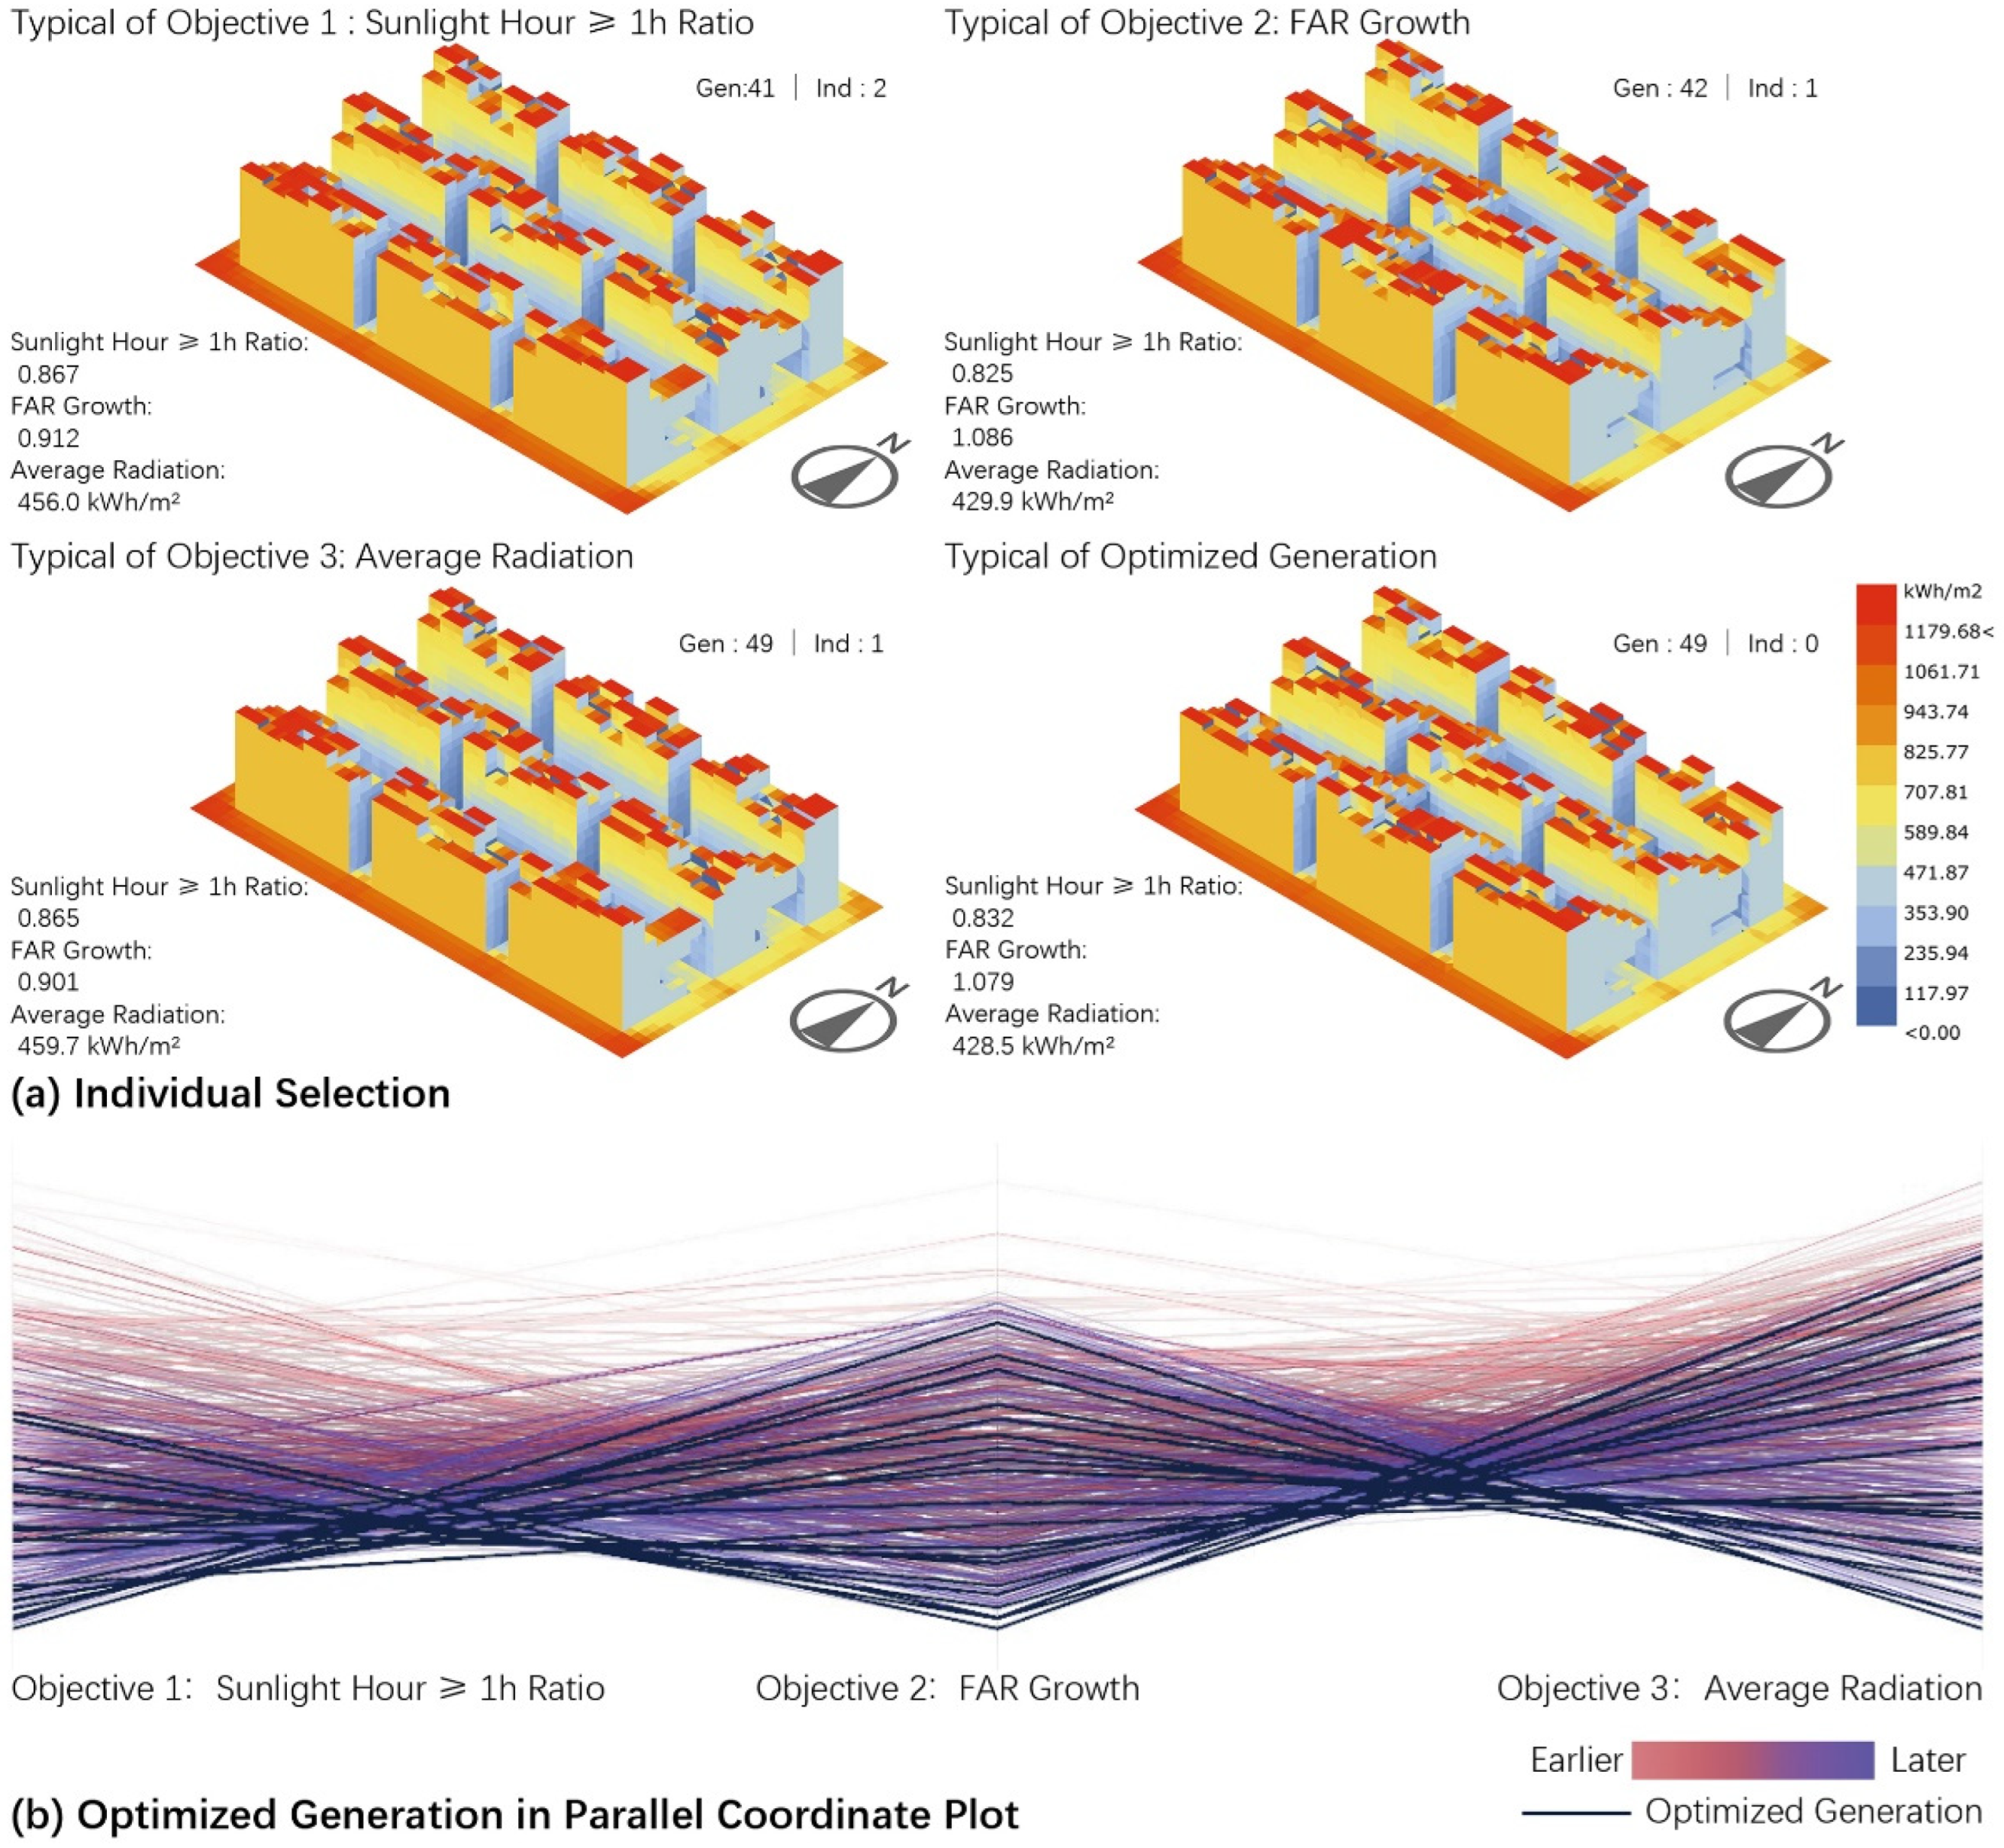
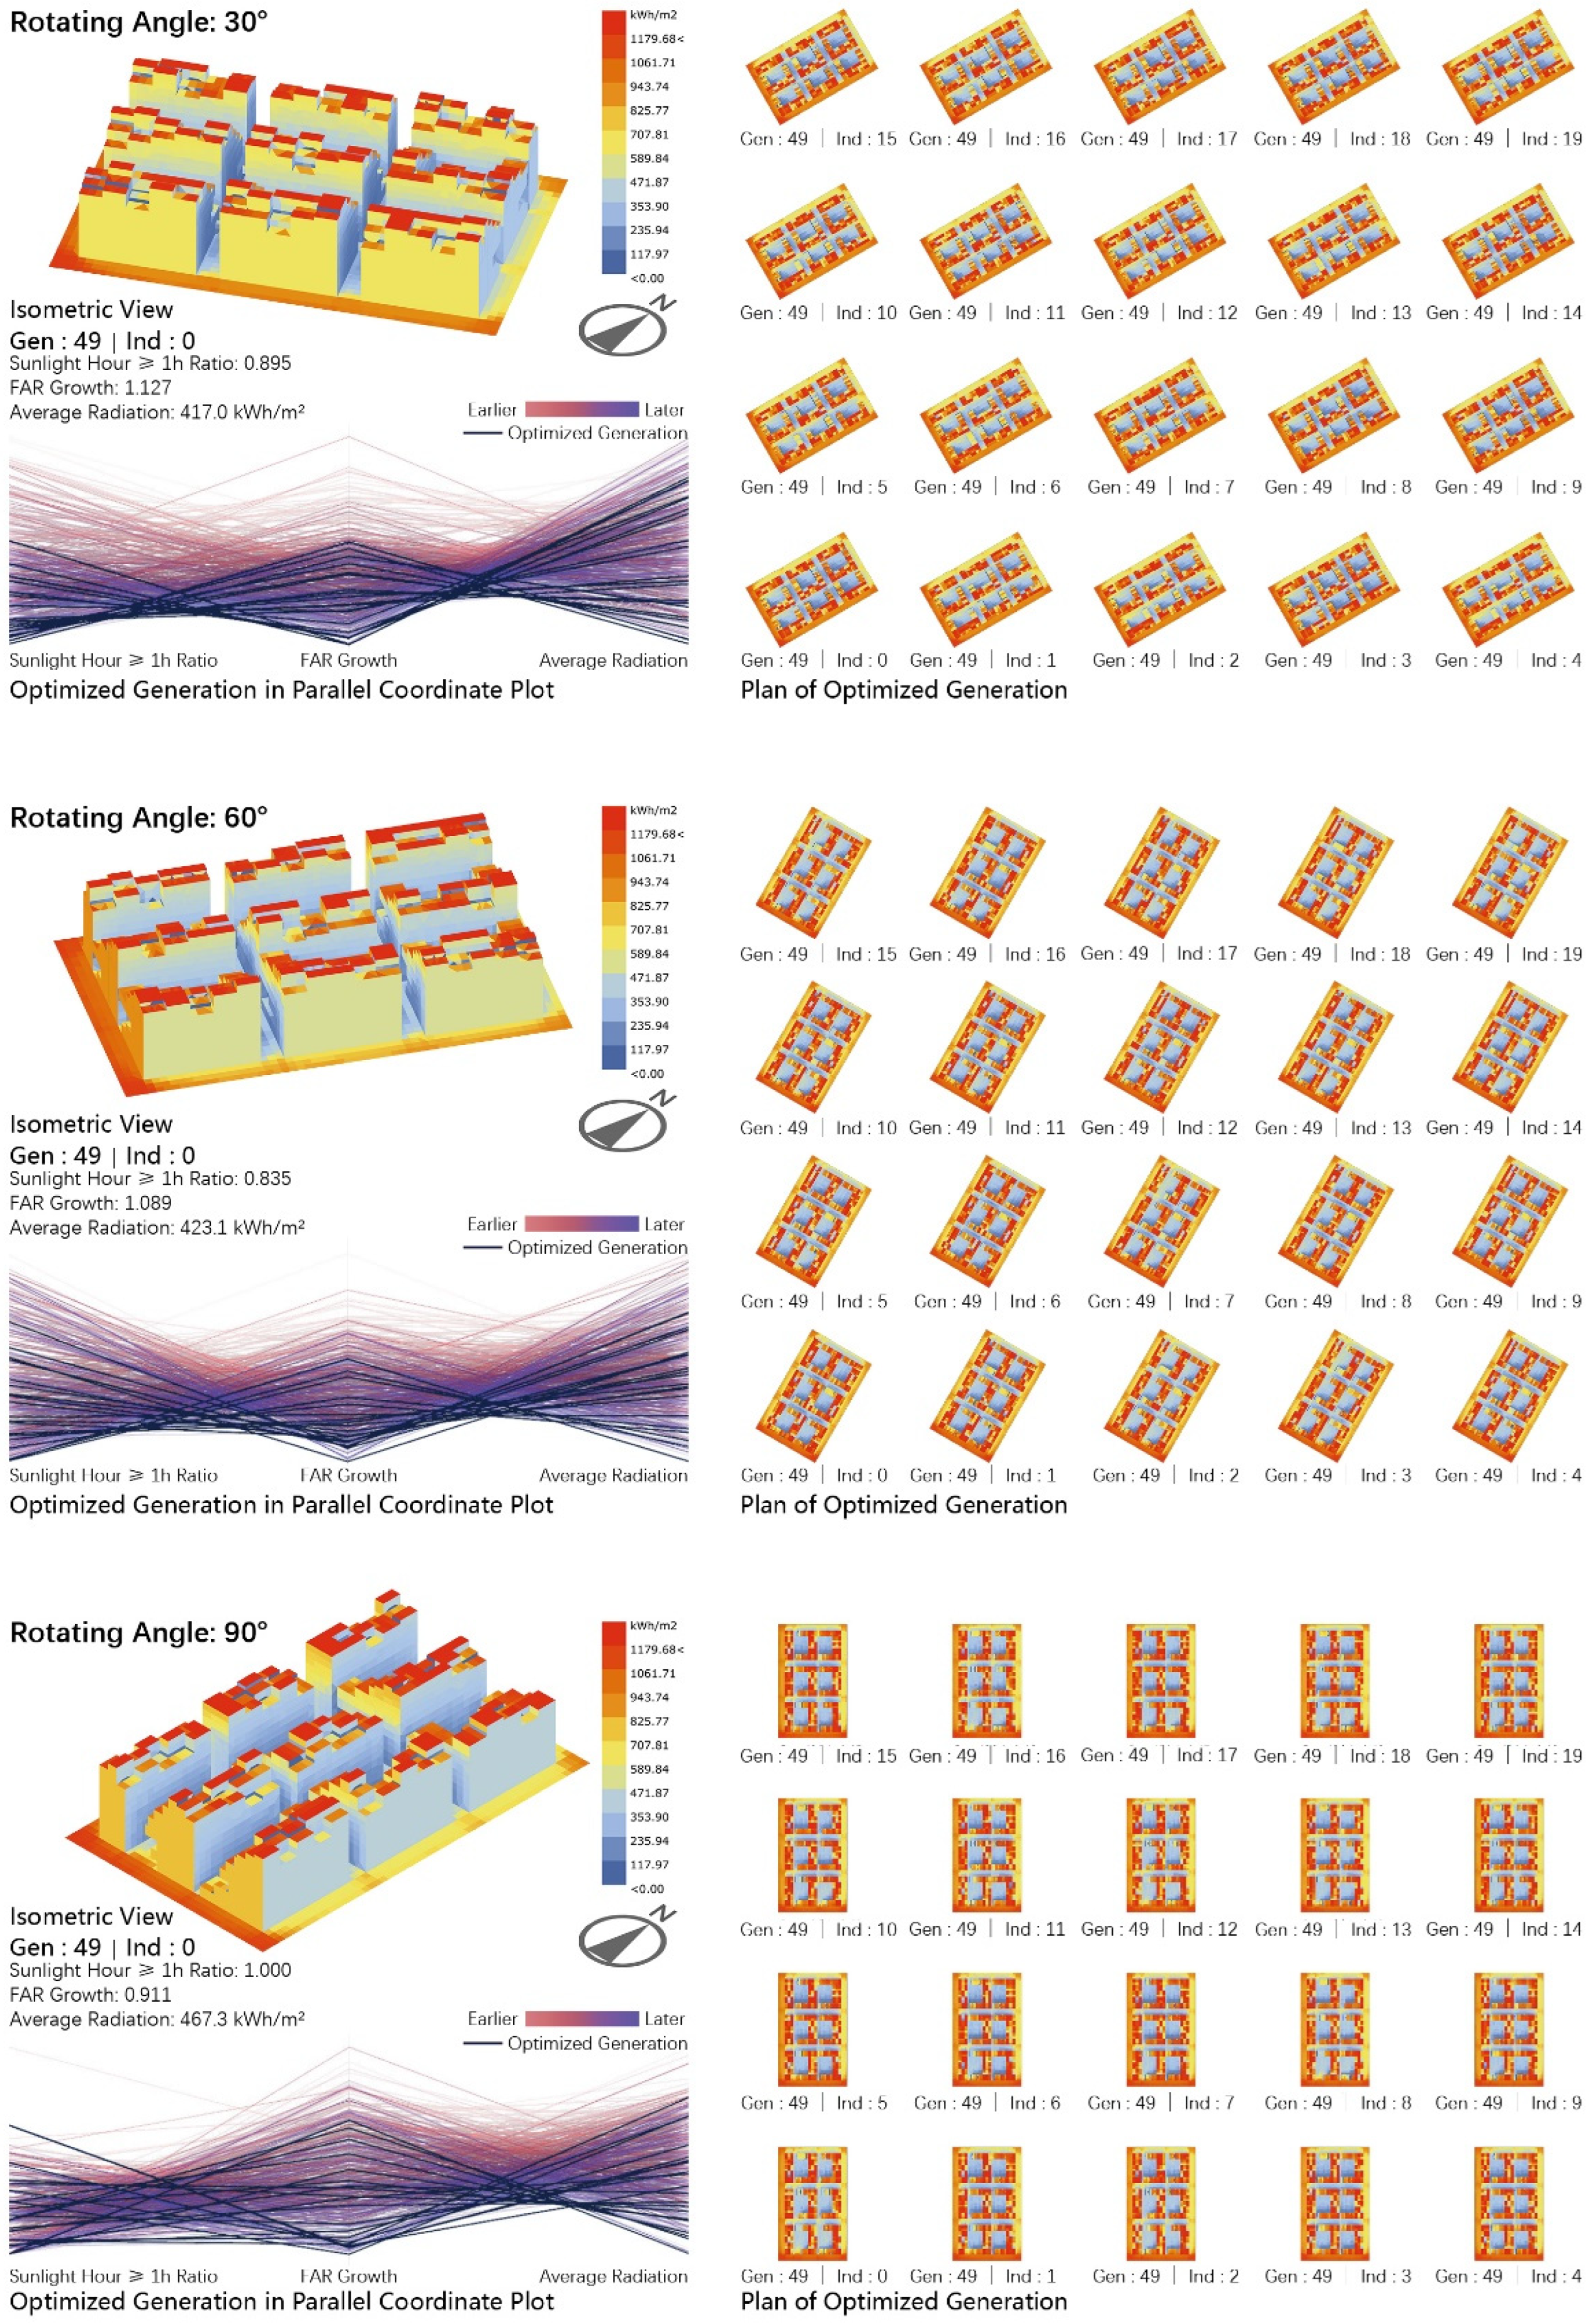
3.3. Mixed Addition Mode

The mixed addition mode combines the above-mentioned horizontal and vertical modes. Based on the 50 addition schemes selected from the solutions, the ASR indicated a decrease of 20.4% compared with the existing residential area. The RBFA was 90.1%, and the average increase in NFAR was about 0.828, the highest among all three addition modes.
According to Objective 1 (minimize the area of façades affected by solar shade), 10 schemes were screened out. The RBFA was 91.6%, the average FAR increased by 0.913, and the ASR was 453.8 kWh/m2, a decrease of 19.2% compared to the existing residential blocks. The increase in NFAR was about 0.784. For the 10 schemes screened out based on Objective 2 (maximize the floor area ratio), the average FAR increased by 1.07. The ASR was 431.0 kWh/m2, a 23.2% reduction compared with the existing buildings. The RBFA was 87.7%. The average increase in NFAR was about 0.885. According to Objective 3 (maximize the average solar radiation), 10 schemes were screened out. The ASR was 458.2 kWh/m2, 18.4% less than the existing buildings. The average FAR increased by 0.906. The RBFA was 91.1%, and the average increase in NFAR was about 0.768. The optimized generation output 20 schemes; the average FAR increased by 1.004, and the ASR was 445.2 kWh/m2, a decrease of 20.7% compared with the existing residential block. The RBFA was 90.1%, and the average increase in NFAR was about 0.852 (Figure 9 and Figure 10).
Compared with the single horizontal or vertical construction mode, the composite addition mode obtained the largest FAR, which increased from 1.545 to 2.525. However, the ASR of the block surface was the lowest, at about 446.7 kWh/m2. Notably, although the ASR of the mixed addition mode was lower than for the other two modes, the RBFA was higher than that of the horizontal addition mode. The main reason is that the occlusion of the vertical addition part was small, which significantly reduced the solar occlusion of the comprehensive mode compared to the horizontal one.

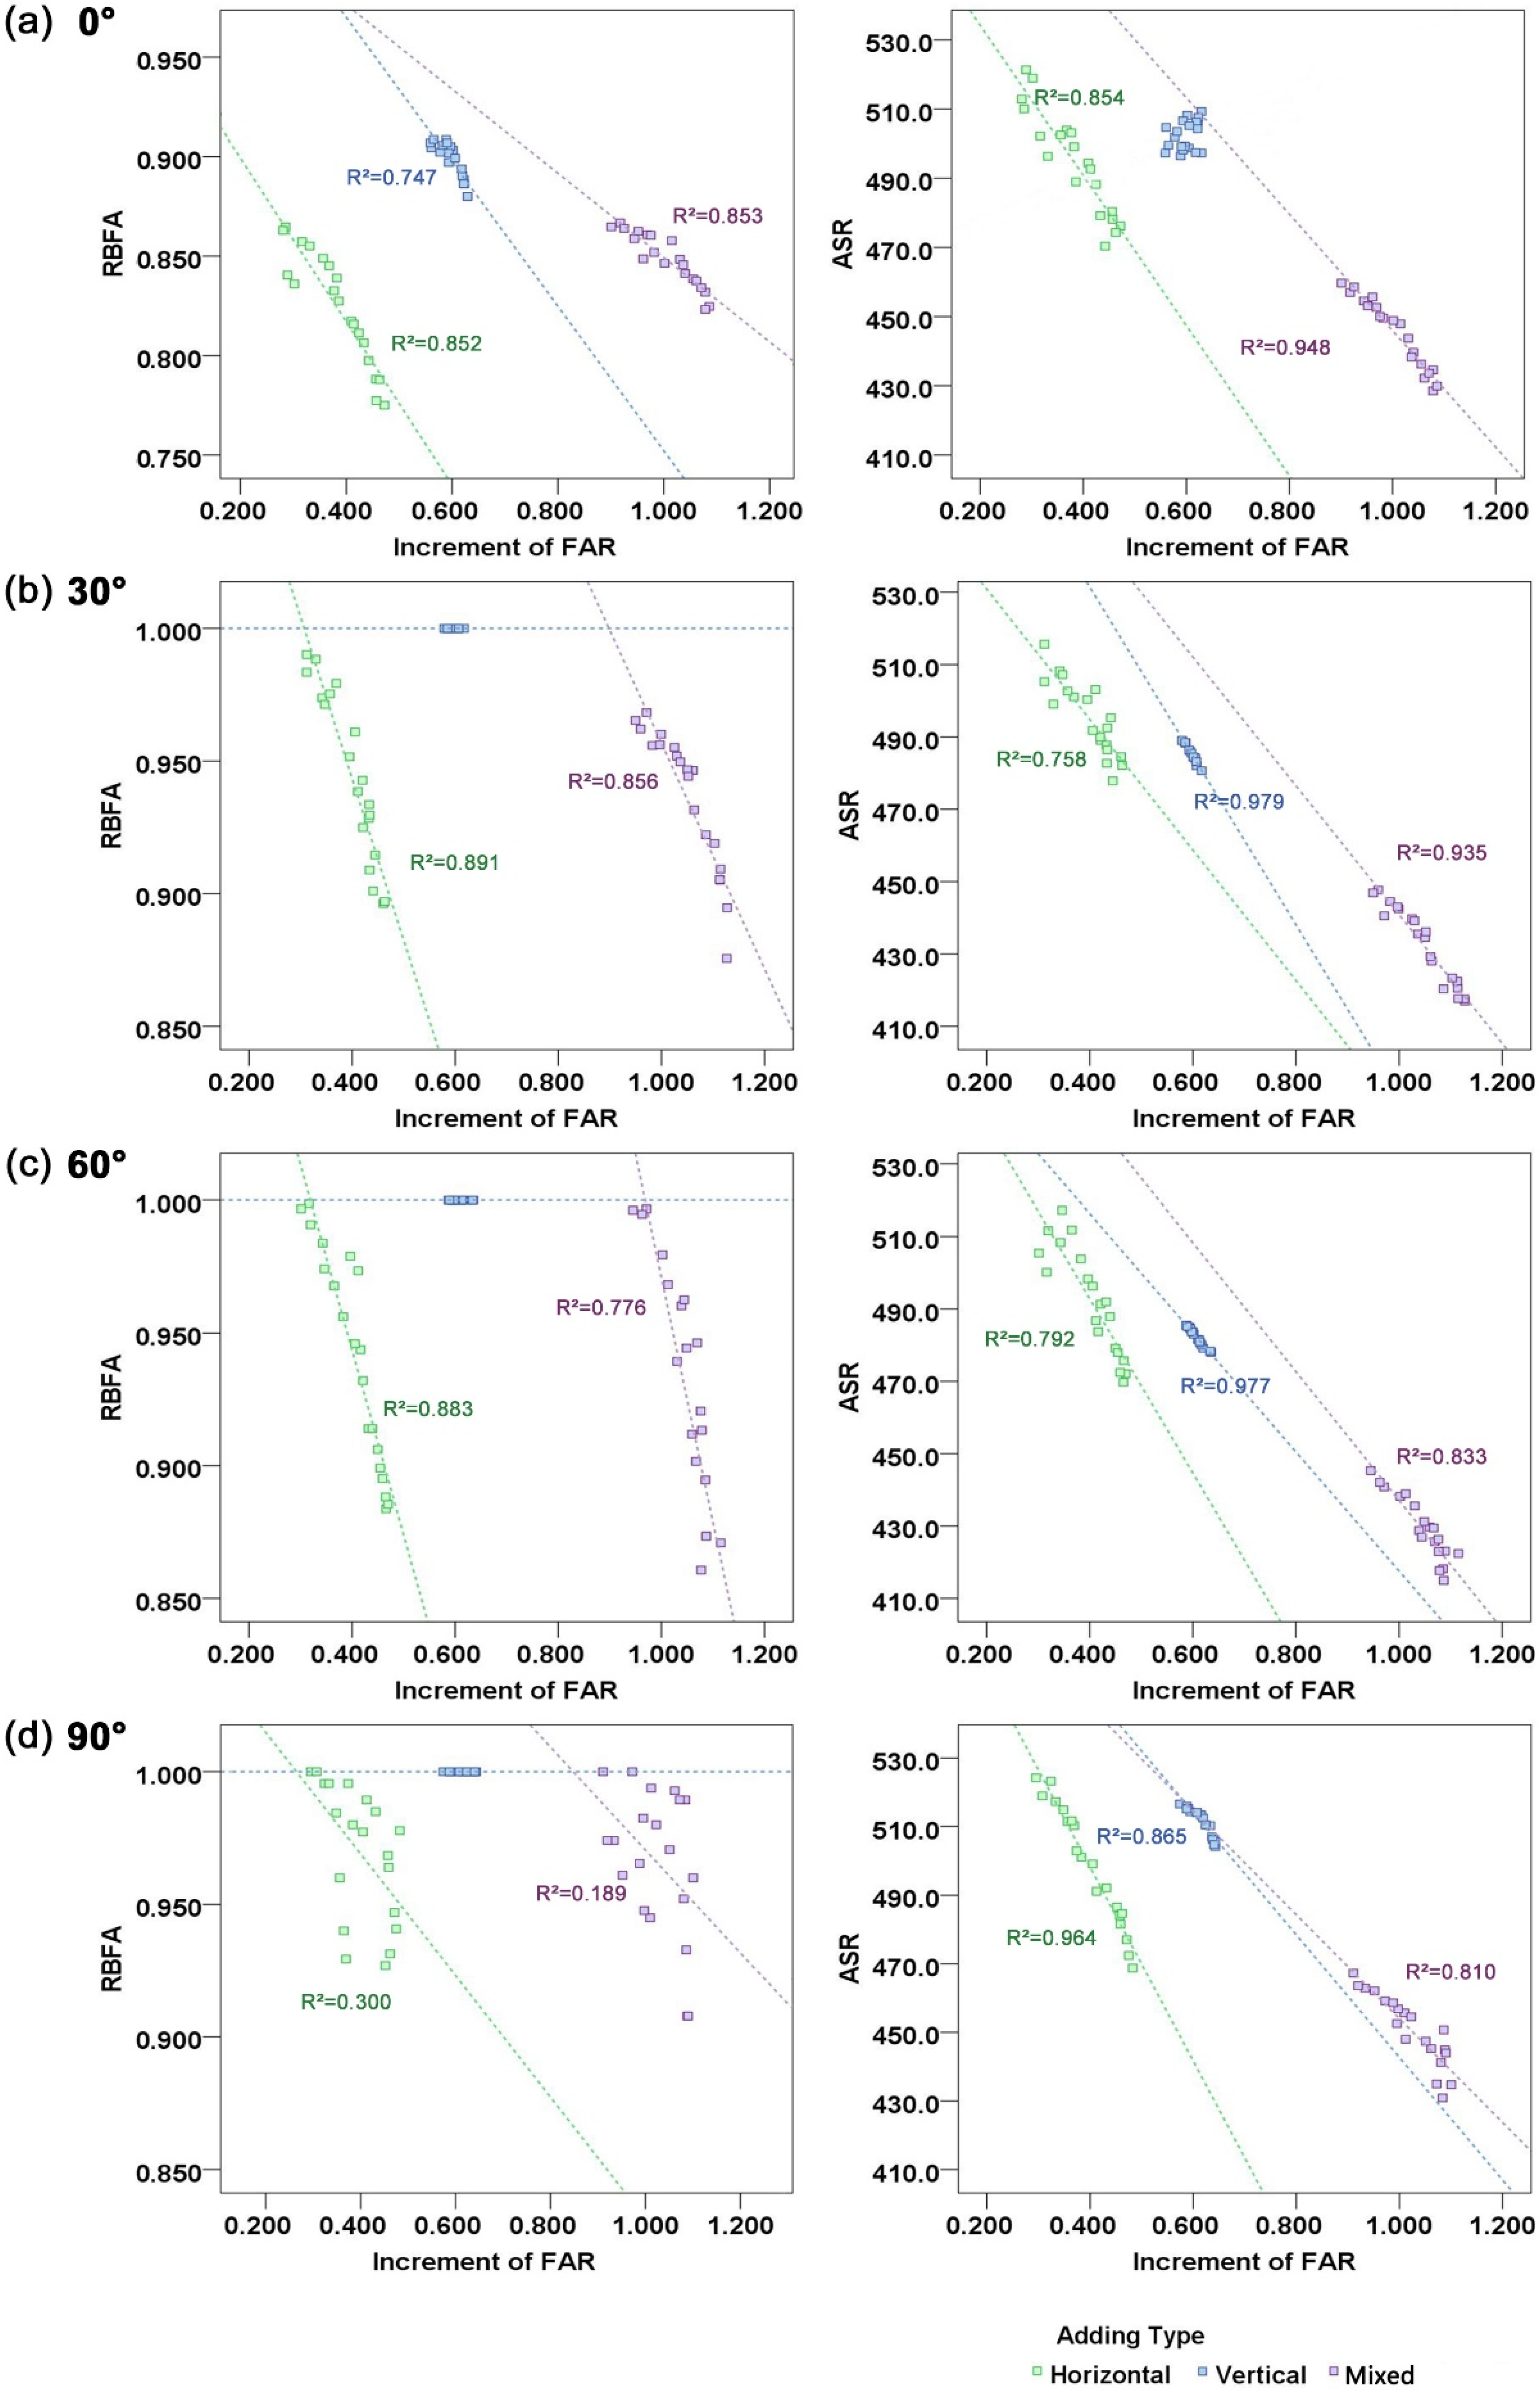
3.4. Influence of Different Orientations

The three addition modes from north to south were applied to three different orientations—30°, 60°, and 90° south–east—to explore the index changes of each mode under different orientation conditions. This part of the analogy was based on the 20 correlation solutions from the last generation of the algorithm. With the orientation of the plot shifting from north–south to east–west, the floor area ratios of the three construction modes showed a different trend. When the horizontal construction mode was 30° and 60° east–southeast, the increase in the floor area ratio was larger than 0.41, and the minimum value was about 0.38 when the direction was north–south. The plot ratio increases in the vertical addition mode were approximately 0.6 when facing the north–south (30°) and south–east (60°) directions; the largest value was close to 0.62 for the east–west orientation. The floor area ratio variation trend of the mixed addition model effect based on orientation resembled that of the horizontal construction model. When the orientation was 30° and 60° east–southeast, the increase in the plot ratio was larger than 0.105, and the lowest was about 1 when the orientation was north–south. The ratio of building façade of the three models increased significantly with the deviation from the north–south direction. When the vertical addition mode was 30°, 60°, and 90° east–south, the value was 1, indicating that all residential units met the solar code requirements. The demand was 17% higher than that of the north and south, and the other two addition modes also showed an increase of about 10%. Due to prioritizing the average solar radiation, the three construction modes showed a “V”-shaped curve with the change in orientation. When the orientation was east–west, each mode reached its maximum mean solar radiation, with a variation range of 2–5%. Notably, when the orientation was east–west, the average solar radiation and floor area ratio that could be obtained by the vertical construction mode were significantly improved compared with the other angles, which increased by 6% and 3%, respectively. One of the main reasons for the result is that the building can only receive solar radiation on one side of the main façade when facing north–south, while the two sides of the building can receive a larger amount of solar radiation when facing east–west. Due to the increase in the amount of solar gain, the corresponding room for improvement of the floor area ratio was also further increased according to the algorithm rules set in this study (Figure 11, Figure 12, Figure 13 and Figure 14).

3.5. Comparison of the Maximum Values of Each Objective in Multiple Orientations in Three Additional Modes

By comparing the extreme values of different targets in different orientation scenarios of the three addition modes, Figure 13 indicates that the horizontal addition mode has a larger ASR, the vertical addition mode has the largest RBFA, and the mixed addition mode has the highest FAR increments. As the orientation varied from north–south to east–west, the RBFA of the three modes of sunlight all showed an increasing trend, especially when changing between 0° and 30°. Specifically, the RBFA of the three modes of building all significantly improved by more than 10%, with the vertical addition mode meeting all the solar requirements. The ASR of the three modes showed a fluctuating trend with the change of the site orientation. The ASR of the horizontal addition mode was the lowest at 30° south–east, while the vertical and composite addition modes were in the south–east. The ASR was the lowest at 90° east–southeast in all three modeling times. The ASR of the vertical addition mode was most affected (about 6%) by the change in orientation, and the horizontal addition mode had the smallest change (about 2%). When the orientation was east, the increase in the horizontal addition mode’s FAR was about 15% larger than that of the other three angles. Based on the above comparative research, understanding the main characteristics of various addition models helps facilitate mode selection for different requirements in the early stage of urban design (Table 3).

4. Discussion

4.1. Comparisons of Three Addition Modes

The three building addition modes proposed in this paper each have their own advantages with different environmental constraints and varied objectives. The advantage of the horizontal addition mode is that it can increase the floor area ratio without increasing the building height. This mode has a good application prospect in the urban districts where building height is strictly limited. However, the addition mode would consume part of the open space. The vertical addition mode is opposite to the horizontal mode and does not occupy the open space. The increase in the FAR mainly depends on the vertical dimension. In the vertical addition mode, the increase in the average FAR is 2.5 times that of the horizontal mode. The mixed addition mode can significantly improve the FAR, the building height, and the density. This mode is more suitable for the urban function transformation from residential to public services with lower solar but higher intensity requirements. The application of the genetic algorithm maintains the ASR of the mixed addition mode at an average value of about 446.7 kWh/m2, about 20.4% lower than the current average solar radiation. Since different addition modes have their own characteristics, in the early stage of urban design, the addition mode must be accurately selected according to different surrounding constraints and internal requirements.

4.2. Inspiration for Three-Objective Optimization

The solutions were selected according to three different objectives in this research. Objective 1 highlighted the consideration of solar shading on the existing residential buildings. The average RBFA of the three models is 93%. The vertical addition mode has the highest RBFA (95%). The improvements in the FAR and ASR for this objective are 0.596 and 487.5 kWh/m2, respectively. The RBFA for Objective 1 is about 3% higher than that for the objective of maximizing the plot ratio. Objective 2 aims to maximize the plot ratio. The average increase in FAR is about 0.718 for the three addition mode schemes, 46.5% higher than for the existing block. The ASR and RBFA of the schemes for this objective are 467.1 kWh/m2 and 88.2%, respectively. The increase in FAR of the mixed addition mode is the most significant, with a maximum value close to 1.1, about 10% higher than that of the other two objectives. Objective 3 emphasizes maximizing the average solar radiation. The ASR of the three addition modes is about 494.2 kWh/m2, 12% lower than the existing block. The increases in FAR and RBFA are 0.590 and 92%, respectively. The ASR for this objective orientation is about 9% higher than that of prioritizing the FAR maximization. Based on different objective orientations, the relative performance indicator values of each scheme set vary from 10% to 25%. Therefore, in the process of urban design, the relevant morphological parameters can be adjusted to achieve a balance between multiple objectives according to the varied requirements.

4.3. Impact of the Increase in FAR on Solar Performance

A comparison of the correlation analysis for the increase in FAR and the solar performance indicators, including ASR and RBFA, under the four different orientation conditions shows that the increase in FAR has different degrees of correlation with the RBFA and ASR. In terms of the correlation between the increase in the plot ratio and the RBFA, when the horizontal addition mode and the mixed addition mode range from 0° to 60°, an obvious linear negative correlation exists between the two, and the R2 is between 0.77 and 0.89. At 90°, the correlation between the two is weaker. When the vertical addition mode is in the south orientation, the increase in FAR is significantly negatively correlated with the RBFA. However, the RBFA value is 100% when the orientation is larger than 30° from south to east. This means that RBFA is no longer affected by the increase in FAR. Regarding the relationship between the increase in FAR and ASR, the horizontal and composite addition modes both show significant linear negative correlations in each orientation, with R2 ranging from 0.76 to 0.96. The vertical addition model shows a significant linear negative correlation at other angles, except that the correlation between the increase in FAR and ASR is weak in the positive south direction. Notably, although a weak correlation exists in some cases between the increase in FAR and solar performance indicators, the range of relevant solar indicators is relatively clear. It is worth mentioning that when the vertical addition mode is in a north to south orientation, the solar can access the rear buildings from the horizontal direction. Therefore, the random distribution of the height of the added buildings leads to no obvious correlation between the increase in FAR and the change of ASR. The value of R2 (0.11) in the fitted curve indicated that there was no obvious correlation between these two groups of data. The general relationship between solar performance and the increase in FAR is also helpful for urban and architecture designers to balance the FAR increments and solar performance in the early design phase (Figure 15).

4.4. Limitations

This paper mainly discusses the influence of different building addition modes on the improvement of FAR and solar utilization with the protection of the existing buildings. Five limitations should be addressed for future research. First, the effect of building additions on the outdoor microclimate is not included in this study. According to the previous research [20], each addition mode will have a significant impact on the aspect ratio of the block canyons, which will lead to changes in the microclimate conditions and affect the outdoor thermal comfort. Further research should comprehensively consider the impact of building addition modes on the outdoor thermal comfort. Second, the research focuses on discussing the impact of building volume changes on solar access and does not consider the effects of vegetation on the solar shade. The distribution and the type of trees have certain influences on the actual solar gains of the building. To ensure the solar requirement of some green plants, the size and position of the addition volume of the building must be further restricted. Third, according to the calculation efficiency, a simplified model is used for the building model in the simulation. The self-shading caused by the unevenness of the building façade, the influence of the window-to-wall ratio on indoor lighting, and the effect of the building surface material on the reflection of solar radiation are not discussed in this study. In addition, to meet the structural requirements of the added building, the newly added structural components may have a certain impact on the solar distribution on the building surface. How relevant architectural details impact the results therefore needs to be considered in further research. Fourth, in a high-density built environment, the distribution of shadows caused by the existing buildings outside can lead to differences in the addition scheme. The increase in the block capacity will also lead to an increased pressure from the surrounding traffic. The interactive relationship between the block form and the urban environment should thus be the focus of further research. Finally, the initial climate data used in this study are for the mid-latitude city Nanjing, and the relevant conclusions are only applicable to cities with similar solar conditions. In different climatic conditions, such as equatorial regions or high-latitude regions, the solar conditions vary greatly, so the applicability of this addition method must be further studied.

5. Conclusions

Urban design is essentially a process of seeking a set of optimal solutions to deal with complex issues. Urban designers must comprehensively integrate and balance the various optimization objectives, which are usually contradictory; therefore, the multi-objective optimization method was introduced to urban design. This paper constructs a method for revealing the capacity improvement potential of existing multi-story residential blocks, the FAR of which is constrained by the solar radiation requirement. The feasibility of this method was verified by applying and testing it in the renovation of multi-story residential areas common in the current urban retrofit. Solutions for building additions were generated using the multi-objective optimization genetic algorithm to balance the increase in the floor area ratio and the corresponding solar requirements. The main conclusions of the study are as follows.
First, this method can significantly improve the FAR of existing residential areas while meeting the corresponding solar requirements. The increase in FAR for the horizontal addition mode can obtain an increase of about 0.36; the vertical increase mode can obtain a FAR increase of 0.59; and the comprehensive mode can obtain a floor area ratio increase of 0.98. Different objective orientations have a certain influence on the increase in FAR. When the main objective is to maximize the FAR, a 50% higher increase in FAR is achieved than that of the other two objectives, namely maximizing the ASR and minimizing the solar shade area.
Second, to find the balance between building addition and solar requirement, the NFAR concept is proposed in this paper. The façade of some buildings is shaded to achieve more building capacity. Based on this concept, the additional scheme only needs to ensure that the area of the new part is larger than the building area affected by shading. This concept provides more flexible space for residential renewal. With 10–20% of the existing floor area affected by shading, it can gain about five times more incrementally added floor area.
Third, different orientations have different effects on the three addition modes. When facing south, the three modes obtain the lowest increase in FAR. At 30° and 60° south to east, the horizontal and mixed addition modes have a larger increase in FAR, while the vertical addition mode can obtain a larger increase in FAR when facing east. Notably, when facing 30° to 90° south to east, all the existing buildings can meet the current solar codes via vertical addition.
When the orientation changes from south to east, the ASR decreases differently with the increase in floor area ratio in the three addition modes. The decrease in ASR in the horizontal addition mode is less affected by the change of orientation, and the decrease is between 8 and 9%. The decrease amplitude of ASR of the vertical and comprehensive augmentation models is similar, but it is about 4% higher than that of south–east 30° and south–east 60°, about 20 kwh/m2, in south–west and east–west directions.
Urban renewal is not only a simple renovation or beautification of the urban landscape, but it is also accompanied by the replacement of functions and changes in the block capacity to achieve comprehensive urban benefits. The multi-objective optimization method and the NFAR concept proposed in this paper provide a significant reference for urban retrofitting, functional reconstruction, and vitality regeneration.

Author Contributions

Conceptualization, J.L.; Data curation, Y.W. and Y.X.; Funding acquisition, J.L.; Investigation, Y.X. and H.X.; Methodology, J.L.; Resources, Y.S.; Software, Y.W. and Y.X.; Supervision, Y.S.; Writing–original draft, J.L.; Writing–review & editing, J.L. All authors have read and agreed to the published version of the manuscript.

Funding

The work described in this paper was sponsored Supported by the Natural Science Foundation of China (NSFC#52008084) and the Natural Science Foundation of Jiangsu Province (#SBK2020041493). Any opinions, findings, conclusions, or recommendations expressed in this paper are those of the authors and do not necessarily reflect the views of the organizations.

Data Availability Statement

The data is available when required.

Conflicts of Interest

The Authors declare that they have no known conflict of interests that could appeared to influence the work published in this paper.

Nomenclature

ASRannual average solar radiation
BSAblock surface area, the sum of site area and building surface area
FARfloor area ratio, gross floor area per site area
NFAnet floor area, the gross floor area ratio of the additional buildings subtracting what does not meet the solar code
NFARnet floor area per site
NSGA-IInon-dominated sorting genetic algorithms II
QBFqualified building façade, the area of the building façade receiving solar time for over 1 h on the winter solstice day
RBFAratio of building façade area, qualified building façade area per building façade area (south façade)
H buildingexisting building height
L buildingexisting building length
W buildingexisting building width
D buildingdistance between buildings in south to north direction
hadditional building height
ladditional building length
wadditional building width

References

  1. Mirzabeigi, S.; Razkenari, M. Design Optimization of Urban Typologies: A Framework for Evaluating Building Energy Performance and Outdoor Thermal Comfort. Sustain. Cities Soc. 2022, 76, 103515. [Google Scholar] [CrossRef]
  2. Liu, T.; Wang, J.; Zhu, Y.; Qu, Z. Linking Economic Performance and Sustainable Operations of China’s Manufacturing Firms: What Role Does the Government Involvement Play? Sustain. Cities Soc. 2021, 67, 102717. [Google Scholar] [CrossRef]
  3. Pan, W. What Type of Mixed-Use and Open? A Critical Environmental Analysis of Three Neighborhood Types in China and Insights for Sustainable Urban Planning. Landsc. Urban Plan 2021, 216, 104221. [Google Scholar] [CrossRef]
  4. GB 50368-2005; Residential Building Code. China Architecture & Building Press: Beijing, China, 2005.
  5. GB 50180-2018; Standard for Urban Residential Area Planning and Design. China Architecture & building Press: Beijing, China, 2018.
  6. Knowles, R.L. The Solar Envelope: Its Meaning for Energy and Buildings. Energy Build. 2003, 35, 15–25. [Google Scholar] [CrossRef]
  7. Morello, E.; Ratti, C. Sunscapes: “Solar Envelopes” and the Analysis of Urban DEMs. Comput. Environ. Urban Syst. 2009, 33, 26–34. [Google Scholar] [CrossRef]
  8. Okeil, A. A Holistic Approach to Energy Efficient Building Forms. Energy Build. 2010, 42, 1437–1444. [Google Scholar] [CrossRef]
  9. Vartholomaios, A. The Residential Solar Block Envelope: A Method for Enabling the Development of Compact Urban Blocks with High Passive Solar Potential. Energy Build. 2015, 99, 303–312. [Google Scholar] [CrossRef]
  10. de Luca, F.; Dogan, T.; Sepúlveda, A. Reverse Solar Envelope Method. A New Building Form-Finding Method That Can Take Regulatory Frameworks into Account. Autom. Constr. 2021, 123, 103518. [Google Scholar] [CrossRef]
  11. de Luca, F.; Dogan, T. A Novel Solar Envelope Method Based on Solar Ordinances for Urban Planning. Build. Simul. 2019, 12, 817–834. [Google Scholar] [CrossRef]
  12. Nault, E.; Peronato, G.; Rey, E.; Andersen, M. Review and Critical Analysis of Early-Design Phase Evaluation Metrics for the Solar Potential of Neighborhood Designs. Build. Environ. 2015, 92, 679–691. [Google Scholar] [CrossRef]
  13. Nault, E.; Waibel, C.; Carmeliet, J.; Andersen, M. Development and Test Application of the UrbanSOLve Decision-Support Prototype for Early-Stage Neighborhood Design. Build. Environ. 2018, 137, 58–72. [Google Scholar] [CrossRef] [Green Version]
  14. Zhang, J.; Xu, L.; Shabunko, V.; Tay, S.E.R.; Sun, H.; Lau, S.S.Y.; Reindl, T. Impact of Urban Block Typology on Building Solar Potential and Energy Use Efficiency in Tropical High-Density City. Appl. Energy 2019, 240, 513–533. [Google Scholar] [CrossRef]
  15. Chatzipoulka, C.; Compagnon, R.; Nikolopoulou, M. Urban Geometry and Solar Availability on Façades and Ground of Real Urban Forms: Using London as a Case Study. Sol. Energy 2016, 138, 53–66. [Google Scholar] [CrossRef] [Green Version]
  16. Natanian, J.; Aleksandrowicz, O.; Auer, T. A Parametric Approach to Optimizing Urban Form, Energy Balance and Environmental Quality: The Case of Mediterranean Districts. Appl. Energy 2019, 254, 113637. [Google Scholar] [CrossRef]
  17. Shi, Z.; Fonseca, J.A.; Schlueter, A. A Parametric Method Using Vernacular Urban Block Typologies for Investigating Interactions between Solar Energy Use and Urban Design. Renew. Energy 2021, 165, 823–841. [Google Scholar] [CrossRef]
  18. Poon, K.H.; Kämpf, J.H.; Tay, S.E.R.; Wong, N.H.; Reindl, T.G. Parametric Study of URBAN Morphology on Building Solar Energy Potential in Singapore Context. Urban Clim. 2020, 33, 100624. [Google Scholar] [CrossRef]
  19. Du, K.; Ning, J.; Yan, L. How Long Is the Sun Duration in a Street Canyon?—Analysis of the View Factors of Street Canyons. Build. Environ. 2020, 172, 106680. [Google Scholar] [CrossRef]
  20. Rosado, P.J.; Ban-Weiss, G.; Mohegh, A.; Levinson, R.M. Influence of Street Setbacks on Solar Reflection and Air Cooling by Reflective Streets in Urban Canyons. Sol. Energy 2017, 144, 144–157. [Google Scholar] [CrossRef] [Green Version]
  21. Morini, E.; Castellani, B.; de Ciantis, S.; Anderini, E.; Rossi, F. Planning for Cooler Urban Canyons: Comparative Analysis of the Influence of Façades Reflective Properties on Urban Canyon Thermal Behavior. Sol. Energy 2018, 162, 14–27. [Google Scholar] [CrossRef]
  22. Vartholomaios, A. A Machine Learning Approach to Modelling Solar Irradiation of Urban and Terrain 3D Models. Comput Env. Urban Syst. 2019, 78, 101387. [Google Scholar] [CrossRef]
  23. Huang, Z.; Mendis, T.; Xu, S. Urban Solar Utilization Potential Mapping via Deep Learning Technology: A Case Study of Wuhan, China. Appl. Energy 2019, 250, 283–291. [Google Scholar] [CrossRef]
  24. Martins, T.A. de L.; Adolphe, L.; Bastos, L.E.G.; Martins, M.A. de L. Sensitivity Analysis of Urban Morphology Factors Regarding Solar Energy Potential of Buildings in a Brazilian Tropical Context. Sol. Energy 2016, 137, 11–24. [Google Scholar] [CrossRef]
  25. Karteris, M.; Slini, T.; Papadopoulos, A.M. Urban Solar Energy Potential in Greece: A Statistical Calculation Model of Suitable Built Roof Areas for Photovoltaics. Energy Build. 2013, 62, 459–468. [Google Scholar] [CrossRef]
  26. Karteris, M.; Theodoridou, I.; Mallinis, G.; Papadopoulos, A.M. Façade Photovoltaic Systems on Multifamily Buildings: An Urban Scale Evaluation Analysis Using Geographical Information Systems. Renew. Sustain. Energy Rev. 2014, 39, 912–933. [Google Scholar] [CrossRef]
  27. Yezioro, A.; Capeluto, I.G.; Shaviv, E. Design Guidelines for Appropriate Insolation of Urban Squares. Renew. Energy 2006, 31, 1011–1023. [Google Scholar] [CrossRef]
  28. Lobaccaro, G.; Lisowska, M.M.; Saretta, E.; Bonomo, P.; Frontini, F. A Methodological Analysis Approach to Assess Solar Energy Potential at the Neighborhood Scale. Energies 2019, 12, 3554. [Google Scholar] [CrossRef] [Green Version]
  29. Machairas, V.; Tsangrassoulis, A.; Axarli, K. Algorithms for Optimization of Building Design: A Review. Renew. Sustain. Energy Rev. 2014, 31, 101–112. [Google Scholar] [CrossRef]
  30. Martins, T.A.l.; Adolphe, L.; Bastos, L.E.g. From Solar Constraints to Urban Design Opportunities: Optimization of Built Form Typologies in a Brazilian Tropical City. Energy Build. 2014, 76, 43–56. [Google Scholar] [CrossRef]
  31. Wang, W.; Liu, K.; Zhang, M.; Shen, Y.; Jing, R.; Xu, X. From Simulation to Data-Driven Approach: A Framework of Integrating Urban Morphology to Low-Energy Urban Design. Renew. Energy 2021, 179, 2016–2035. [Google Scholar] [CrossRef]
  32. Taleb, H.; Taleb, D. Enhancing the Thermal Comfort on Urban Level in a Desert Area: Case Study of Dubai, United Arab Emirates. Urban Urban Green. 2014, 13, 253–260. [Google Scholar] [CrossRef]
  33. Taleb, H.; Musleh, M.A. Applying Urban Parametric Design Optimisation Processes to a Hot Climate: Case Study of the UAE. Sustain. Cities Soc. 2015, 14, 236–253. [Google Scholar] [CrossRef]
  34. Kämpf, J.H.; Robinson, D. Optimisation of Building Form for Solar Energy Utilisation Using Constrained Evolutionary Algorithms. Energy Build. 2010, 42, 807–814. [Google Scholar] [CrossRef]
  35. Kämpf, J.H.; Montavon, M.; Bunyesc, J.; Bolliger, R.; Robinson, D. Optimisation of Buildings’ Solar Irradiation Availability. Sol. Energy 2010, 84, 596–603. [Google Scholar] [CrossRef]
  36. Zhang, L.; Zhang, L.; Wang, Y. Shape Optimization of Free-Form Buildings Based on Solar Radiation Gain and Space Efficiency Using a Multi-Objective Genetic Algorithm in the Severe Cold Zones of China. Sol. Energy 2016, 132, 38–50. [Google Scholar] [CrossRef]
  37. Xia, B.; Li, Z. Optimized Methods for Morphological Design of Mesoscale Cities Based on Performance Analysis: Taking the Residential Urban Blocks as Examples. Sustain. Cities Soc. 2021, 64, 102489. [Google Scholar] [CrossRef]
  38. Mahmoud, A.H.A.; Elghazi, Y. Parametric-Based Designs for Kinetic Facades to Optimize Daylight Performance: Comparing Rotation and Translation Kinetic Motion for Hexagonal Facade Patterns. Sol. Energy 2016, 126, 111–127. [Google Scholar] [CrossRef]
  39. Zhang, J.; Liu, N.; Wang, S. Generative Design and Performance Optimization of Residential Buildings Based on Parametric Algorithm. Energy Build. 2021, 244, 111033. [Google Scholar] [CrossRef]
Figure 1. Framework of the research.
Buildings 12 01710 g001
Figure 2. (a) Site location, (b) initial morphology and solar information.
Buildings 12 01710 g002
Figure 3. Illustration of the additional buildings of the existing urban block. (a) Three addition rules of the existing buildings. (b) The structure system of the additional buildings.
Buildings 12 01710 g003
Figure 4. Functional module unit of the extra attached buildings.
Buildings 12 01710 g004
Figure 5. Optimization process of the design under three objectives.
Buildings 12 01710 g005
Figure 6. Block diagram for NSGA-II algorithm.
Buildings 12 01710 g006
Figure 7. Selected solutions of the horizontal addition mode.
Buildings 12 01710 g007
Figure 8. Selected solutions of the vertical addition mode.
Buildings 12 01710 g008
Figure 9. Selected solutions of the mixed addition mode.
Buildings 12 01710 g009
Figure 10. Objective values of the selected solutions for the three addition modes.
Buildings 12 01710 g010
Figure 11. Solutions of the horizontal addition mode for the varied orientations.
Buildings 12 01710 g011
Figure 12. Solutions of the vertical addition mode for the varied orientations.
Buildings 12 01710 g012
Figure 13. Solutions of the mixed addition mode for the varied orientations.
Buildings 12 01710 g013
Figure 14. Objective values of the three addition modes for the varied orientations.
Buildings 12 01710 g014
Figure 15. Correlation between increase in FAR and solar performance. (a) Orientation south, (b) orientation 30° south to east, (c) orientation 60° south to east, (d) orientation east.
Buildings 12 01710 g015
Table 1. Initial settings for the simulation.
Input ParametersValues
WeatherCHN_Jiangsu.Nanjing.582380_CSWD
Simulation period00:00 on January 1 to 24:00 on December 31
Grid size for simulation1 m × 1 m
Measurement point2 mm above the grid
Generation number50
Population size20
Random seed1
Table 2. Formulae for this research.
ParameterAcronymFormula
Floor area ratioFAR F A R = G r o s s   f l o o r   a r e a S i t e   a r e a
Average solar radiationASR A S R = T o t a l   s o l a r   r a d i a t i o n B l o c k   s u r f a c e   a r e a
Ratio of building façade areaRBFA R B F A =   Q u a l i f i e d   b u i l d i n g   f a c a d e   * B u i l d i n g   f a c a d e   a r e a
Net floor area ratioNFAR   N F A R = N e t   f l o o r   a r e a   * * S i t e   a r e a
* The area of the building façade receiving solar time over 1 h on the winter solstice day. ** Additional floor area subtracts the solar shaded floor area.
Table 3. The maximum values of each objective in multiple orientations in three additional modes.
30°60°90°
HorizontalFO10.865FO10.990FO10.999FO11.000
FO20.472FO20.463FO20.470FO20.530
FO3521.4 kwh/m2FO3515.6 kwh/m2FO3517.2 kwh/m2FO3524.2 kwh/m2
VerticalFO10.909FO11.000FO11.000FO11.000
FO20.629FO20.622FO20.642FO20.643
FO3509.3 kwh/m2FO3490.7 kwh/m2FO3485.4 kwh/m2FO3516.6 kwh/m2
MixedFO10.867FO10.968FO10.997FO11.000
FO21.086FO21.127FO21.115FO21.101
FO3459.7 kwh/m2FO3447.7 kwh/m2FO3445.3 kwh/m2FO3467.3 kwh/m2
Note: FO1 = Maximum solar hour > 1 h ratio; FO2 = Maximum FAR growth; FO3 = Maximum average solar radiation.
Publisher’s Note: MDPI stays neutral with regard to jurisdictional claims in published maps and institutional affiliations.

