Article

Study on Wind Load Characteristics and Wind-Induced Response of Supertall Buildings with Single-Sided Large-Span Straight Platforms

Department of Civil Engineering, Northeast Forestry University, Harbin 150040, China
*
Author to whom correspondence should be addressed.
Buildings 2022, 12(10), 1694; https://doi.org/10.3390/buildings12101694
Submission received: 15 August 2022 / Revised: 5 October 2022 / Accepted: 9 October 2022 / Published: 14 October 2022
(This article belongs to the Special Issue Advances in Wind Effects on Buildings)

Abstract

:
The presence of large-span straight platforms can complicate the airflow around buildings and alter surface wind pressure, gas bypass and wind response in supertall buildings. The article uses the Reynolds-averaged Navier–Stokes (RANS) method in Computational Fluid Dynamics (CFD) to investigate the differences in surface mean wind pressure, gas bypass, wind coefficients, displacement and acceleration responses between the models with and without platforms, and the wind load on the platforms themselves at different wind directions. The results show that: the presence of platforms generally reduces the maximum negative pressure coefficient on the building surface, reaching a maximum reduction of 31.56% at 30°, and causes a small increase in the maximum positive pressure coefficient, reaching a maximum increase of 5.30% at 0°. The mean wind pressure on the lower surface of the platform is greater than the upper surface. The target building has a lower frequency of vortex shedding than the reference model, with a maximum reduction of 5.68%. The presence of platforms increases the vertex displacement of the building by up to 22.85% and decreases the vertex acceleration by up to 9.14%. These results can be used as references for the ventilation, comfort and safety assessment of similar supertall buildings.

1. Introduction

With the advancement of building construction technology and the shortage of urban land, building structures are gradually moving towards the supertall, and building shapes are becoming more varied for functional and aesthetic reasons [1]. Variations in the number of sides, helix angles, chamfers and cut angles of a building can affect the response characteristics and aerodynamic performance of the building structure [2,3]. In addition, accessory structures on the building surface such as balconies [4,5,6], vertical panels [7], grid frames [8,9], solar panels [10,11], etc., can affect the surface wind pressure. Zheng et al. [12] found that the presence of balconies increased the Cp,avg on the windward and leeward sides by 5.2% and 8.9%, respectively, and the average wind speeds in the balcony space increased along the increasing of the balcony depth. Yuan et al. [13] simulated façade appurtenances of high-rise buildings with thin horizontal splitter plates and found that the maximum negative peak pressure coefficient decreased by 22% to 42% with different appendage arrangements. For supertall buildings with single-sided large-span straight platforms, the platform outreach length is much greater than that of conventional building balconies and other structures and the air bypass and aerodynamic effects of the overhanging structure are also more complex [14,15], and the arrangement of the platforms will cause the building to exhibit different characteristics and responses at different wind directions. These factors can lead to different surface wind pressures, gas bypass and wind-induced response in supertall buildings in comparison to conventional rectangular-section supertall buildings, and can also have an impact on the comfort, safety, air quality and heat transfer of wind in platform spaces [16,17,18,19,20,21,22].
Studies of such problems are currently usually carried out using wind tunnel tests and numerical simulations [5,12,23,24,25]. Compared with wind tunnel tests, numerical simulations are characterized by low cost, a high degree of freedom and adaptability. In recent years, with the development of computer science and Computational Fluid Dynamics (CFD) [26], CFD numerical simulation has gradually become a new and effective method for studying problems such as indoor and outdoor air flow in structures and building energy consumption. The simulation of the three-dimensional turbulence model is important in CFD simulations, and currently non-direct numerical simulation methods are mainly used. The non-direct numerical simulation method means that the pulsation characteristics of the turbulent flow are not directly calculated but seek to make some approximation and simplification of turbulence, and are classified as Large-eddy Simulation (LES), statistical averaging and Reynolds-averaged Navier–Stokes (RANS) simulation. In terms of research on non-direct numerical simulation methods, with continuous refinement and improvement of RANS simulations by researchers and the introduction of methods such as Scale-adaptive Simulation (SAS) and LES, the accuracy of numerical simulation is constantly improved. Tominaga [27], Kahsay [28] and other researchers have verified the consistency of the simulation results with the tests when these simulation methods are applied to tall buildings. The reliability of the RANS method was demonstrated by Montazeri and Blocken [29] and Ai et al. [30] based on studies of buildings with external shades or balconies. Therefore, in this study the SST k ω model of RANS was used for the simulation and analysis of the full-scale closure model. At present, the existing literature mainly focuses on the influence of the auxiliary structure on the wind pressure and force of the main building while there are few studies on the wind pressure and force of the auxiliary structure itself [31,32,33,34,35]. This paper investigates the mean surface wind pressure distribution characteristics, gas bypass and wind response of a supertall building with single-sided large-span straight platforms, to examine how the presence of large-span straight platforms affects the parameters above the supertall building, and to analyze the wind loads on the platforms. In addition, as the platforms in this study are arranged on one side, different wind directions will have different effects on the building, so this paper also investigates the most unfavorable wind direction working condition for the building forces. This study can be used as a reference for the design, construction, safety and comfort assessment of similar building structures.
This paper contains four sections. In Section 2, the calculation settings and parameters are briefly described and validation of the CFD results is provided. Section 3 analyzes the surface wind pressure coefficients, gas bypass conditions, wind coefficients and the wind-induced response of the building models. The main conclusions of this study are discussed in Section 4.

2. CFD Numerical Modelling and Validation

The Fluent module under the commercial CFD software ANSYS 2020R2 was used to perform the simulations. The calculations were carried out using a 3D double-precision, pressure-based solver and the air model was an incompressible constant density air model. The convective terms were discretized in a second-order windward format with high accuracy and the velocity-pressure coupling was performed using the SIMPLE algorithm. The numerical simulation of turbulence used the RANS method, the core of which is not to solve the transient Navier–Stokes equation directly but to solve the time-averaged Reynolds equation (Equation (1a)). Depending on the assumptions made or the treatment of Reynolds stress, the commonly used turbulence models can be divided into Reynolds stress models and vortex viscosity models. In the vortex viscosity model, instead of dealing directly with the Reynolds stress term, the turbulent viscosity proposed by Boussinesq in the vortex viscosity assumption is introduced, and the Reynolds stress in the assumption is related to the mean velocity gradient as shown in Equation (1b). The eddy current viscosity model for this study used the SST k ω two-equation model. The turbulent kinetic energy and turbulent dissipation rate are in a first order windward spatially discrete format. The convergence criterion for the iterations is that the relative iterative residuals for all control equations are less than 1 × 10⁻⁴:
t ρ u i + x i ρ u i u j = p x i + x j μ x i ρ u i u j ¯ + S i
ρ u i u j ¯ = μ t u i x j + u j x i 2 3 ρ k + μ t u i x i δ i j  
k = u i u j ¯ 2
where t is time; ρ is density; p is pressure on the fluid micro-element; u i , u j is the time-averaged velocity; superscript ¯   represents the average over time; superscript represents the pulsation value; S i is the generalized source term of the momentum conservation equation; and i , j takes values in the range 1,2,3, representing the x, y and z directions respectively; μ is the hydrodynamic viscosity; μ t is the turbulent viscosity; k is the turbulent energy; δ i j is the “Kronecker delta” symbol.
The modelling parameters and meshing in this study are shown in Figure 1. The target building is 207 m high, with the construction of four single-sided large-span straight platforms. The platforms are located on the 14th, 23rd, 32nd and 38th floors. The overhang lengths of those four platforms are 23 m, 13 m, 13 m and 28 m, respectively, and the ground clearances are 80 m, 125 m, 170 m and 199.85 m, respectively. The four straight platforms are labelled platform A, platform B, platform C and platform D in descending order of height, as shown in Figure 1a. Considering the building is symmetrical along the XY plane, only wind directions θ = 0°, 30°, 60°, 90°, 120°, 150° and 180° were calculated. The model was built after reasonable simplification of the building, and a reference model without straight platforms was also established. Yang Wei [36] found that when the SST model was used, the increase in the Reynolds number of the incoming flow caused by the increase in the scale of the model had almost no effect on the calculation results, so the full-scale simulation was used in this study. The dimensions of the calculation domain were 1400 m × 900 m × 600 m, with the building placed 1/3 of the way from the inlet boundary; the blockage rate was calculated to be less than 3%. The computational domain was divided by structured hexahedral grids. There was 150 m diameter cylindrical encryption zone around the building. The blunt body bypassing flow was subject to a series of complex flows such as separation, reattachment, ramming, encircling and vortex, etc. The complex flow phenomena near the wall were simulated by setting up a near-wall boundary layer. The 10 boundary layers on the building surface had a growth rate of 1.1. The Yplus values for the first layer of the grid were distributed between 0 and 2, close to 1, which meets the simulation accuracy requirements. To verify the irrelevance of the meshes, the reference model was meshed with three different sizes of meshes, G1, G2, G3, with the mesh numbers of 1.94 million, 1.63 million and 1.34 million, respectively. Twenty pressure measurement points were arranged along the perimeter of the building at 2/3H of the reference model, and the same boundary conditions were used to simulate the three meshes, as shown in Figure 1g. As can be observed from Figure 1h, the difference in the mean wind pressure coefficients Cp for each pressure measurement point in the three grids was small, with an average difference of 2.45% between G1 and G2 and an average difference of 4.66% between G2 and G3, so the grid division method in this paper did not have a significant effect on the simulation results. In this study, the G2 meshing method was adopted to mesh the target model, and the total number of meshes was about 2.17 million. To verify the reliability of the simulation, the standard CAARC model was established using the same computational domain, grid scale and boundary conditions, and 20 wind pressure coefficient monitoring points were set up at model 2/3H for comparison with existing wind tunnel pressure measurement test data.
The velocity entry boundary was used for the entrance boundary and the mean wind speed profile was fitted using an exponential rate, according to the Class C turbulent landform in the Chinese Loads Code [37] for the design of building structures. The mean wind profile and turbulence profile along the downwind direction was obtained by the following equations:
V z = V 10 × 1.5 α ; z 15 m V 10 × z 10 α ; 15 m < z < 450 m V 10 × 45 α ; z 450 m
I z = I 10 × 1.5 α ; z 15 m I 10 × z 10 α ; 15 m < z < 450 m I 10 × 45 α ; z 450 m
where z is height above ground; V z is average wind speed at z height; V 10 is average wind speed at a height of 10 m, taken from Table 1: V 10 = 28.28   m / s ; α is wind speed profile index, Class C landscapes; I z is turbulence at z height; I 10 is nominal turbulence at 10 m height, take values as per Table 1.
The turbulence characteristics of the incoming flow are set by giving an expression for the turbulent kinetic energy k and specific dissipation rate ω of the flow field at the inlet. In the SST k ω model, k = 1.5 V z × I z 2 , ω = k 0.5 0.09 0.25 l and l is the turbulence integration scale. according to the Japanese Building Code (AIJ-04) [38], l = 100 z / 30 0.5 , 30 m < z z g 100 , z 30 m , as shown in Figure 2b. The outlet boundary condition type is Outflow for fully developed flows, the boundary type on the left and right sides and top surface of the computational domain is Symmetry for physical geometries with mirror symmetry, and the boundary type on the bottom surface of the computational domain and the surface of the building model is Slip-free Wall for constrained fluid and solid areas. Seven measurement points of different heights were selected in front of the building model at 400 m to measure its velocity Vp and turbulence Ip. The results were compared with the theoretical values as shown in Figure 2a. A comparison of the mean wind pressure at the surface measurement points of the CAARC model used for validation with existing wind tunnel test data [39] is shown in Figure 3. As can be seen from the figure, the numerical simulation of the mean wind pressure coefficients on the windward side agrees well with the experimental results. At both sides and the leeward side, the negative pressure is overall slightly greater than the experimental results of NPL, Bristol, Monash and NEA(a) and less than NEA(b). Kahsay [28] and Blocken [16] suggested that this problem may be caused by differences in the SST model for shunt and reattachment simulations and the respective wind tunnel tests. But in general, the wind pressure coefficients from the CFD simulations were within a reasonable range, and therefore it can be concluded that the model is capable of providing reliable results for this study.

3. Analysis of Results and Discussion

3.1. Surface Wind Pressure Analysis

The distribution of mean wind pressure on the surface of a building varies at different wind directions. Figure 4 shows the mean wind pressure distribution on the building surface for seven operating conditions from 0° to 180°. It can be seen that when the building is facing the wind at the corners (θ = 30°, 60°, 120°, 150°), the maximum value of the surface wind pressure is less than the maximum value of the surface mean wind pressure when the building is facing the wind in a certain plane (θ = 0°, 90°, 180°) due to the diversion effect of the corners. Comparing the wind pressure distribution on the surface of platforms facing the wind (0°) with that of platforms facing the wind (180°), it can be concluded that the difference in the maximum wind pressure is not significant as the area of the windward side is the same in both cases. However, when the platforms are straight ahead into the wind, the increasing wind speed along the height and the diverging effect of the platform create a local area of high pressure under each platform square. A similar phenomenon occurs at θ = 30° and θ = 60° and disappears completely by θ = 90°. Moreover, the smaller the wind direction, the more pronounced is the phenomenon. When θ = 90°, the side of the platform is facing the wind and the airflow occurs up and down, after which it is attached again. As can be seen from the wind pressure diagram of the front of the building in Figure 4d, the wind pressure starts from the side and gradually increases towards the bottom and top right. When θ = 180°, the air flows diagonally downwards around the top surface, with some of the air flowing back into the back of the building due to gravity, and when some of the air flow hits the back of the building in the opposite direction, the platform splits the air flow, creating a smaller vortex between each of the two platforms, which creates a zone of decreasing pressure between the two platforms from the center to the perimeter. This phenomenon is more pronounced between the platforms in the middle of the building.
Figure 5 shows the mean wind pressure distribution on the upper and lower surfaces of each of the large-span straight platforms. It can be seen that the mean wind pressure on the lower surface of each platform is greater than the mean wind pressure on the upper surface. The reason for this phenomenon is that the splitting effect of the platform sides causes the incoming flow to separate at the top and bottom corner points of the leading edge to form a separate shear layer, thus creating a negative pressure zone near the platform surface. In addition, each platform is affected by the platform or ground below it as a result of the upward movement of the airflow below the platform, acting on its lower surface. This phenomenon is particularly evident in platform A at the top of the building, mainly because the airflow over platform A is almost unobstructed by the building walls and its diversion is more pronounced, creating a larger negative pressure zone and a smaller negative pressure value. At θ = 0° to θ = 90°, the wind pressure maximum zone of the platform gradually moves from the center to the side as the wind direction increases. When the platform is facing the wind at an angle, a horizontally oriented conical vortex is formed at the leading edge of the platform and a high negative pressure zone is formed at the windward corner.
Figure 6 shows the maximum and minimum values of the wind pressure coefficients on the façade and roof for the target and reference models. It can be found that the presence of the large-span straight platforms causes a small general increase in the maximum positive pressure coefficient on the building facade and roof, reaching a maximum increase of 5.30% at 0°. However, the maximum negative pressure coefficient generally decreases as θ approaches 90° from both sides and reaches a maximum decrease of 31.56% at 30°. Figure 7 shows the maximum and minimum values of wind pressure coefficients for each platform at different wind directions. It can be seen that each platform has the maximum positive surface wind pressure coefficient at θ = 0° and the maximum negative surface wind pressure at θ = 30°. Between θ = 0° and θ = 180°, the positive surface wind pressure coefficient decreases most gradually, while the negative wind pressure coefficient varies with no obvious regularity. The maximum value of the positive wind pressure coefficient decreases with the height of the large span of the straight platform, but the decrease is limited, which indicates that the positive wind pressure coefficient is less affected by the height. In addition, platform A experiences maximum negative pressure from θ = 0° to θ = 150°, and its pressure differential is greater than that of the other platforms, making the forces more unfavorable.

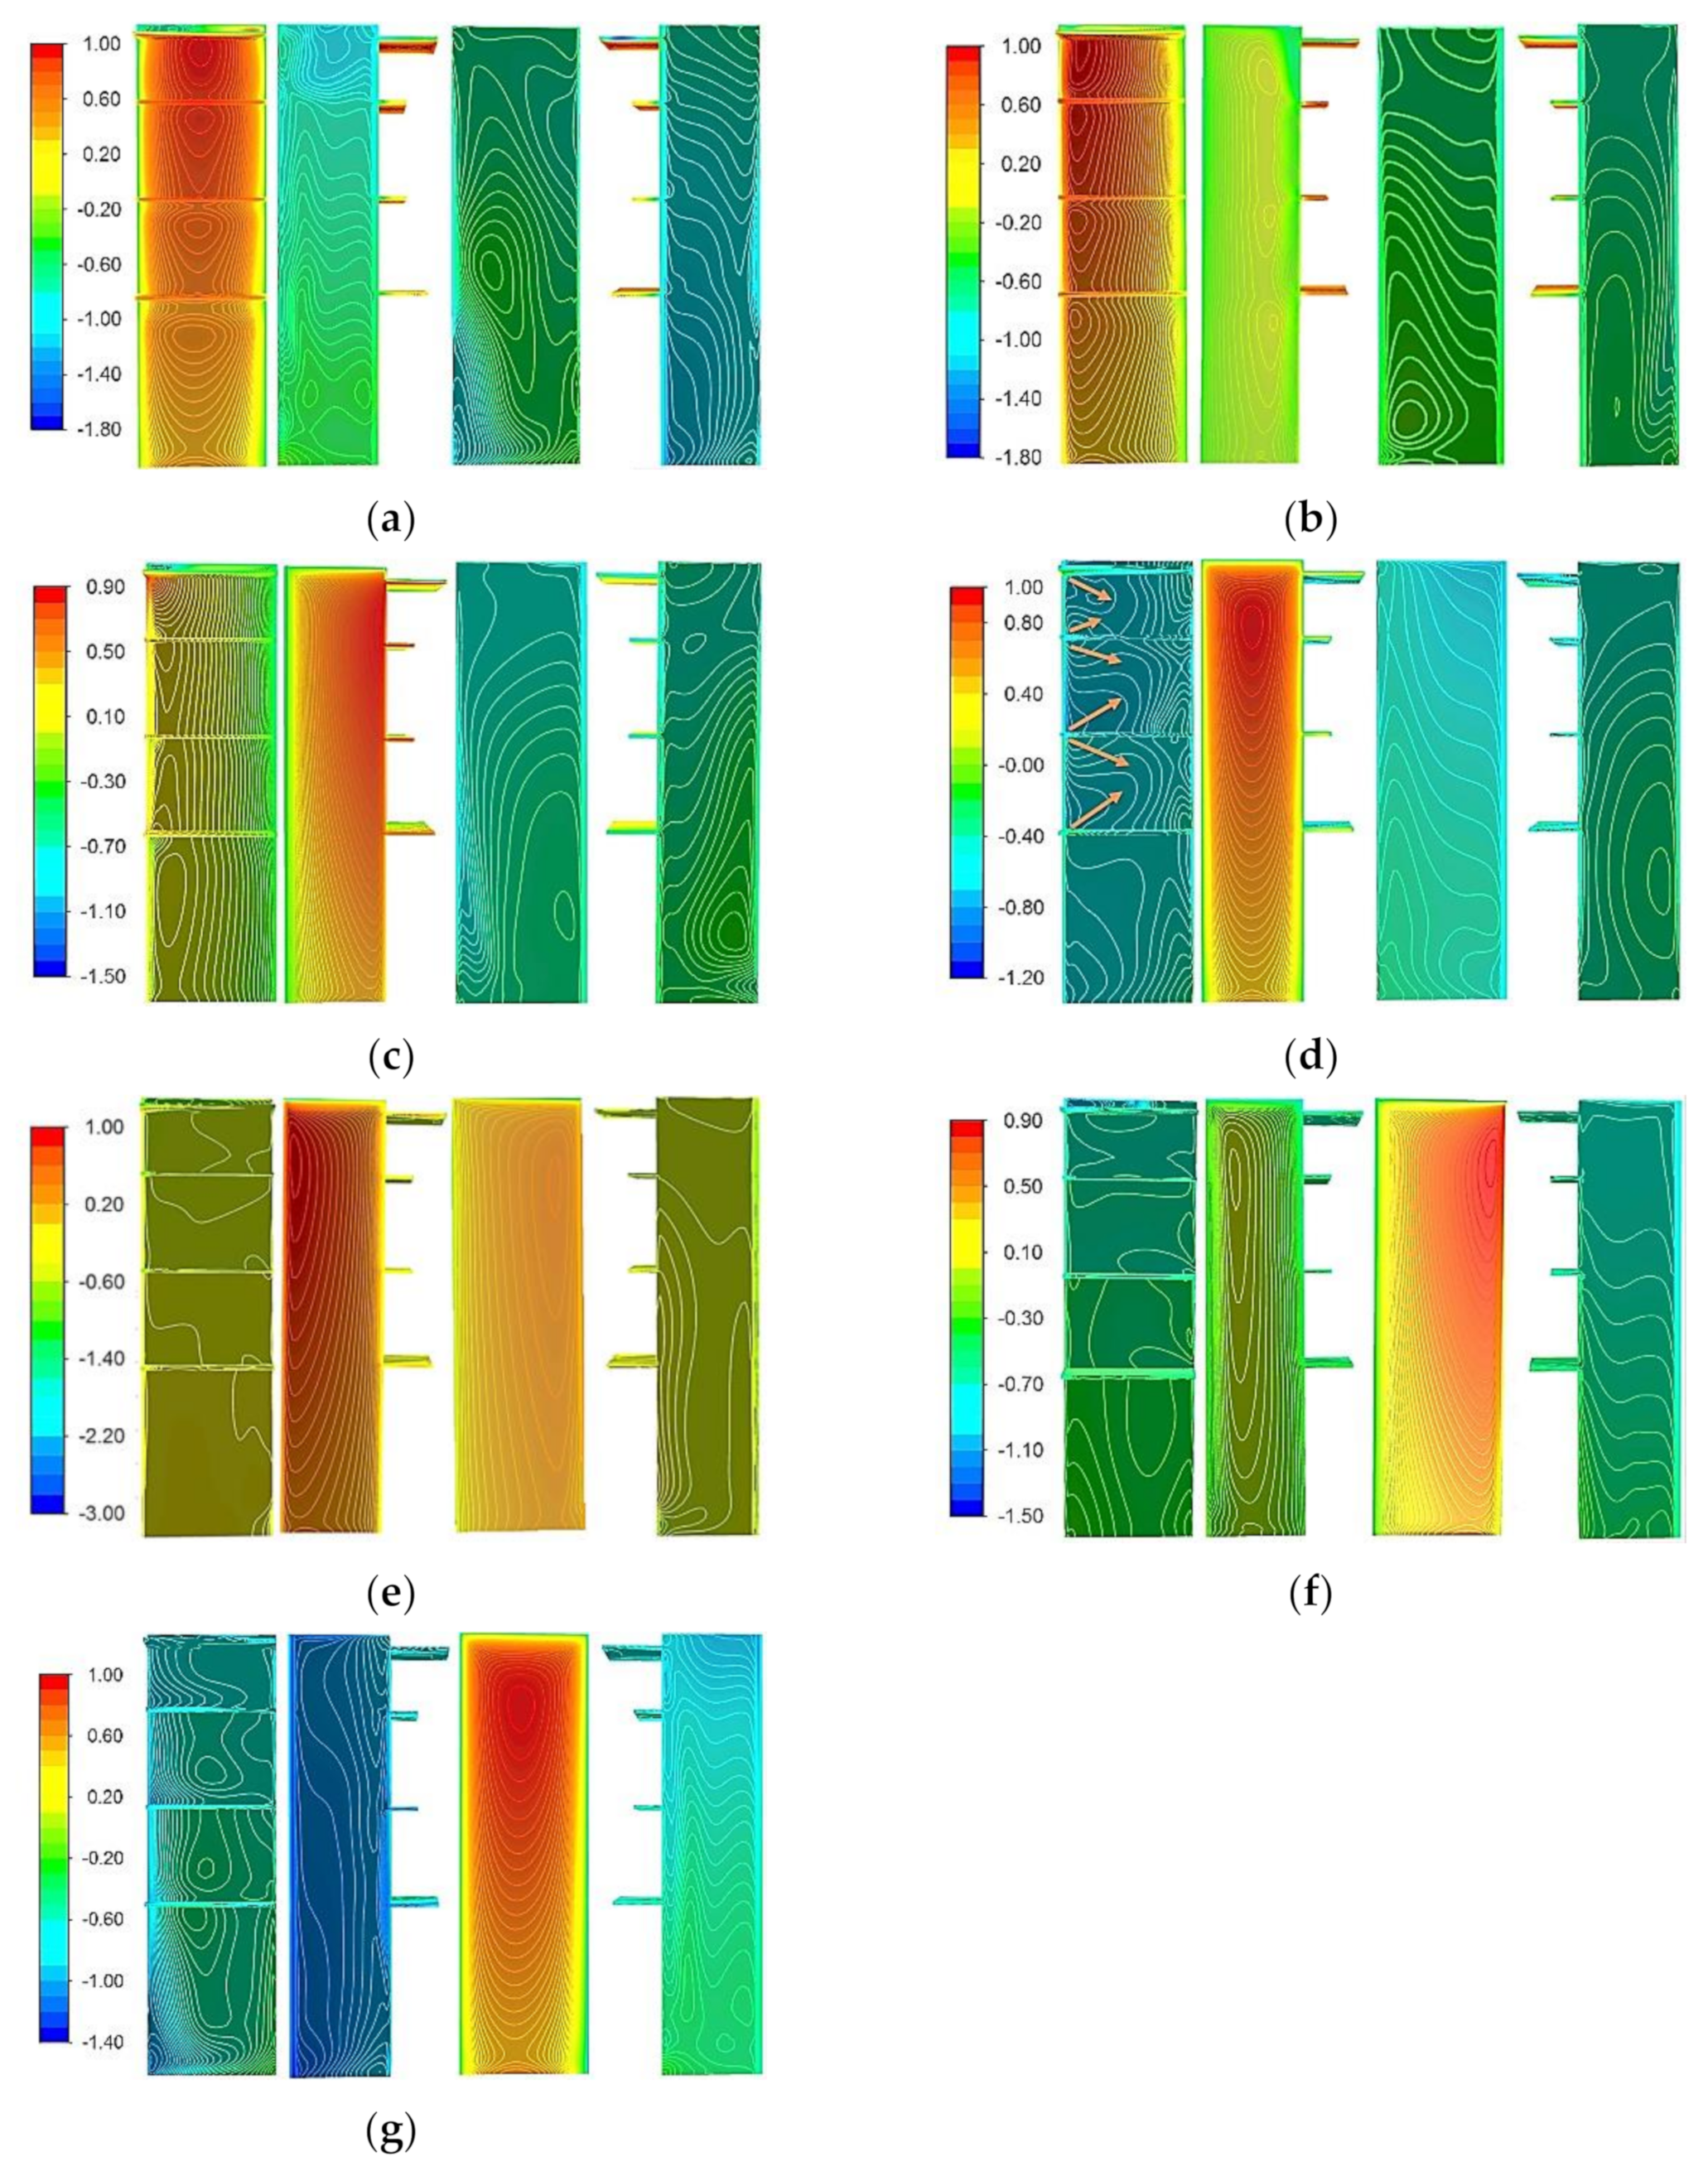
3.2. Analysis of the Gas Bypass Situation

Vortex shedding cycle variations cause changes in building base moment, lift and drag. For the most unfavorable 0° wind direction condition, the lift and drag variation cycles coincide with the vortex shedding cycle and the drag reaches a maximum value each time the vortex sheds. Therefore, the drag peaks twice in a vortex shedding cycle, which means that it goes through two drag variation cycles. Separation occurs when the airflow encounters the platform, which creates lift in the vertical direction. The lift reaches its maximum before the upper surface vortex falls off, and at the moment of shedding, the lift decreases. After that, the vortex on the lower surface begins to develop, and the vortex produces a downward force as the flow separates, contrary to the direction of lift, and the lift reaches the trough when the vortex is about to fall off.
Figure 8 shows the lift time histories and vortex shedding frequencies for the two building models at different wind directions. It can be seen that the presence of platforms causes a small reduction in the frequency of vortex shedding. Moreover, the effect on the frequency of vortex shedding is greater when the platforms are leeward than when they are windward. Figure 9 shows the gas bypassing and vortex shedding in the XZ plane at Y = 100 m for the two building models at θ = 0°, 30°, 90° and 180°. As can be seen from the figure, in the case of constant wind speed, vortex shedding is mainly affected by the wind direction and windward area. At wind directions 0° and 180°, the windward area is larger and the vortex shedding is greater; at θ = 90°, the windward area is smaller and the vortex shedding is smaller; when the corner is windward, the vortex shedding is smaller. Comparing Figure 9a,c,e,g of the horizontal vortex shedding of the target model and Figure 9b,d,f,h of the horizontal vortex shedding of the reference model, it can be found that the large-span straight platforms have no significant effect on the vortex shedding of the building model when the incoming velocity and wind direction are the same.
Figure 10 shows the gas bypassing in the XY plane for θ = 0°, 30°, 90° and 180° for the two building models at Z = 0 m. From Figure 10a–d, it can be seen that the presence of the top straight platform creates a more pronounced reattachment effect on the top surface of the building when θ = 0° and θ = 30°. Meanwhile, the reattachment effect generates a vortex in the back space of the building and the scale of the vortex at the back of the building with the straight platforms is larger compared to the reference model; therefore, it creates a larger negative pressure zone. As can be seen from Figure 10e,f, the airflow is similar around the top of the two building models when θ = 90°, but the airflow disturbance caused by the single-sided large-span straight platforms causes the vortex shedding period of the building models to become longer. Figure 10g,h shows that when θ = 180°, the area of the negative pressure region on the back of the reference model decreases smoothly with height, while the area of the negative pressure region on the back of the target model also decreases with height, but with a sudden change at the height where the platforms are located.

3.3. Wind Vibration Response Analysis

As changes in wind direction will cause changes in wind pressure and vortex shedding on the building surface, and wind pressure and vortex shedding will cause changes in the wind vibration response of supertall buildings, the base bending moment can reflect the wind vibration response of supertall buildings under certain circumstances. Therefore, the variation of the base moment at different wind directions was investigated to determine the downwind and crosswind base moments and base moment coefficients. From the base moment, the first-order linear vibration pattern was used to derive the first-order inherent frequency of the structure through software simulation, and the displacement and acceleration responses of the building in the downwind and crosswind directions were derived and calculated.

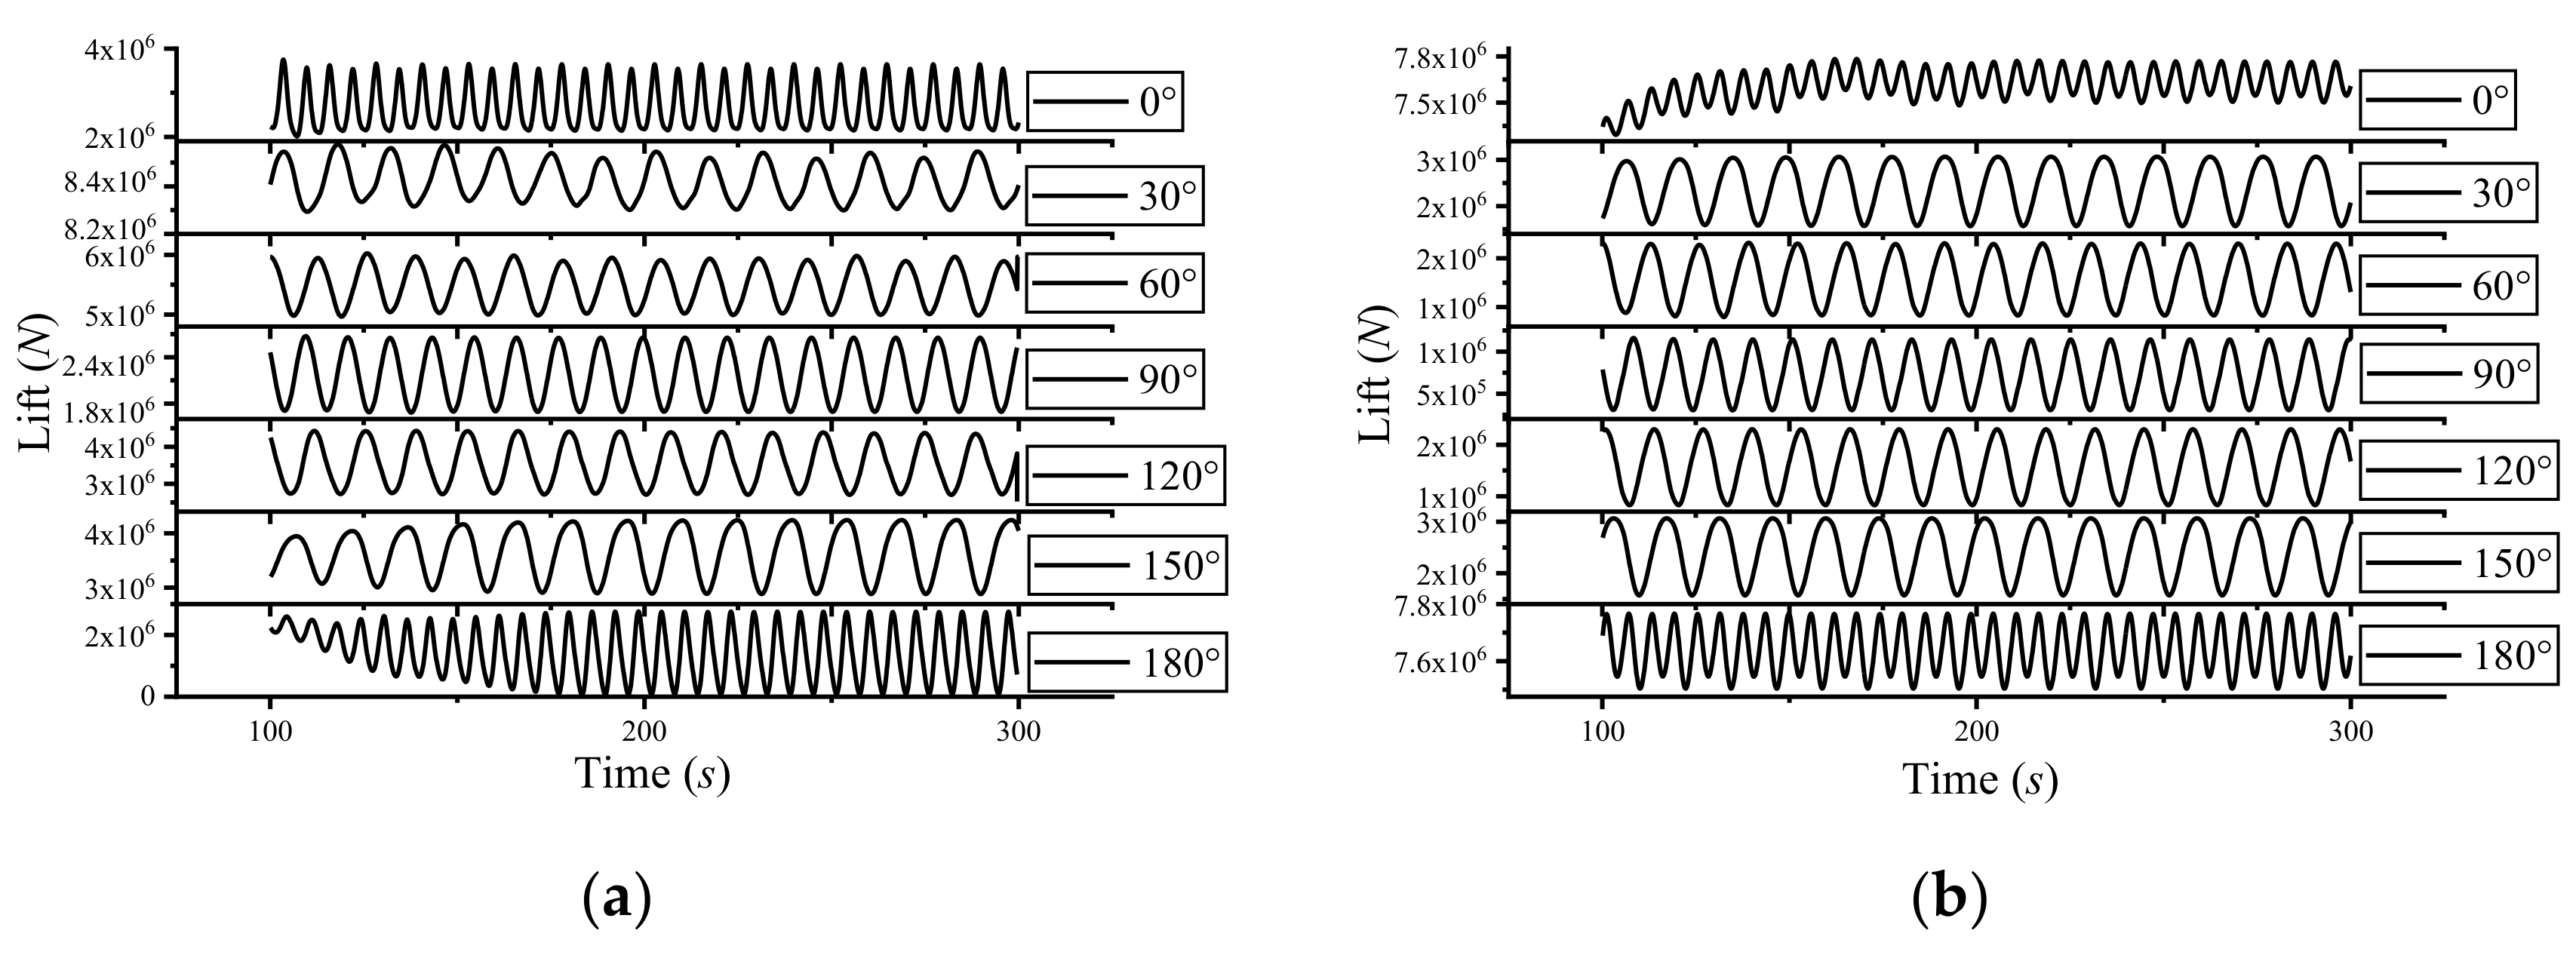
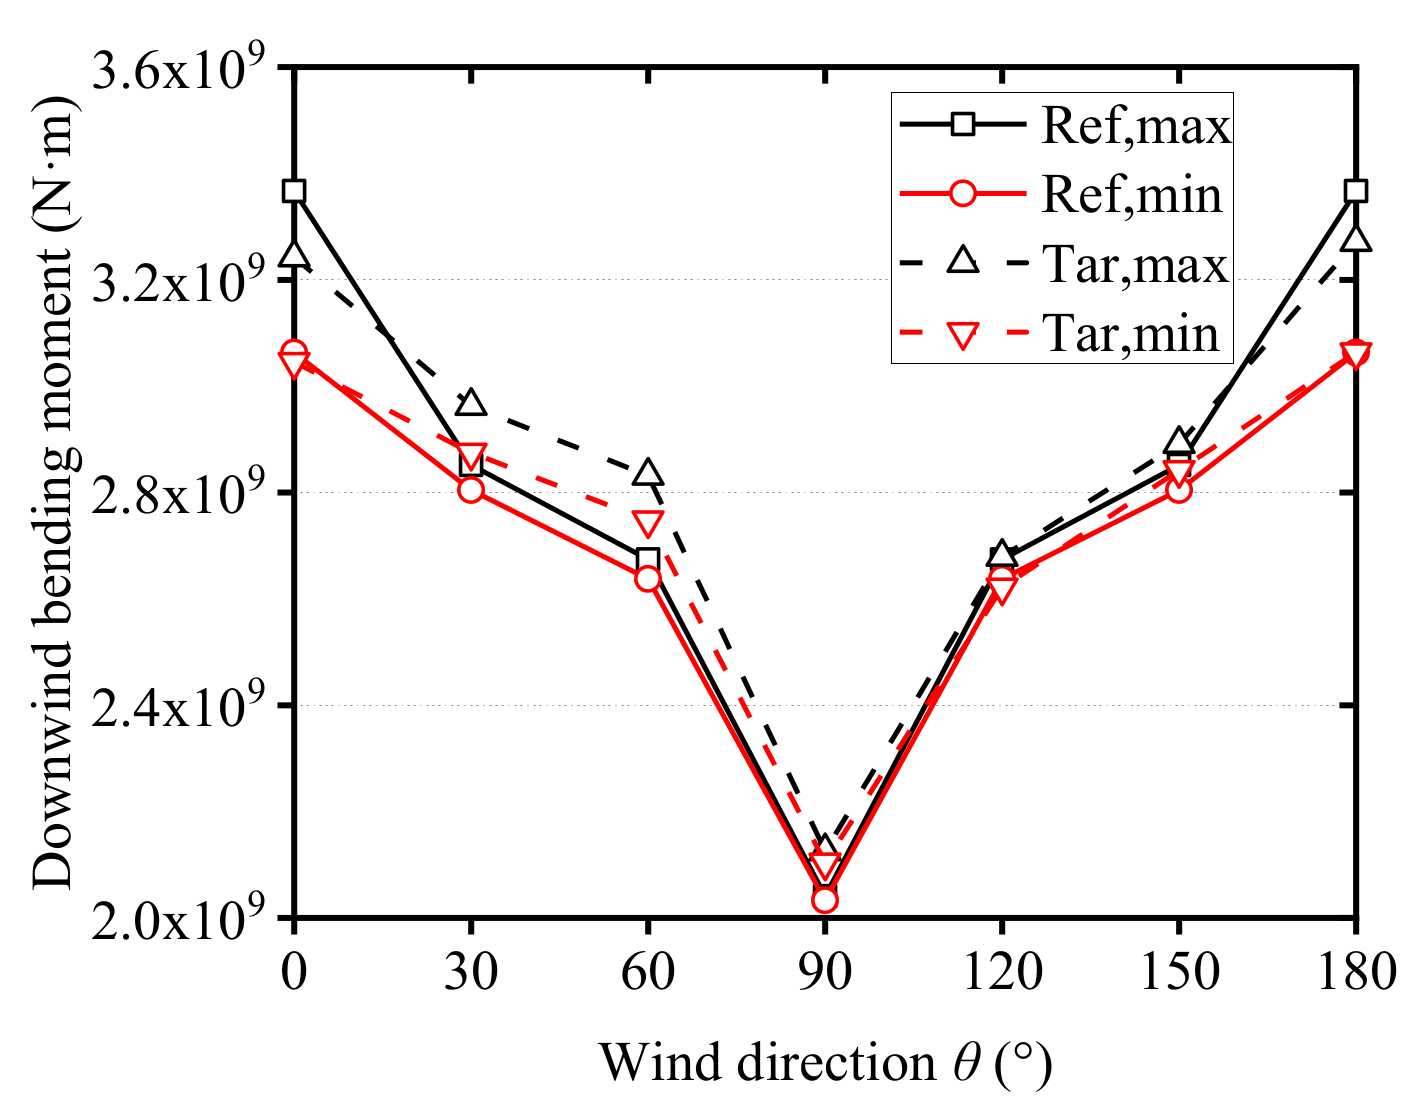
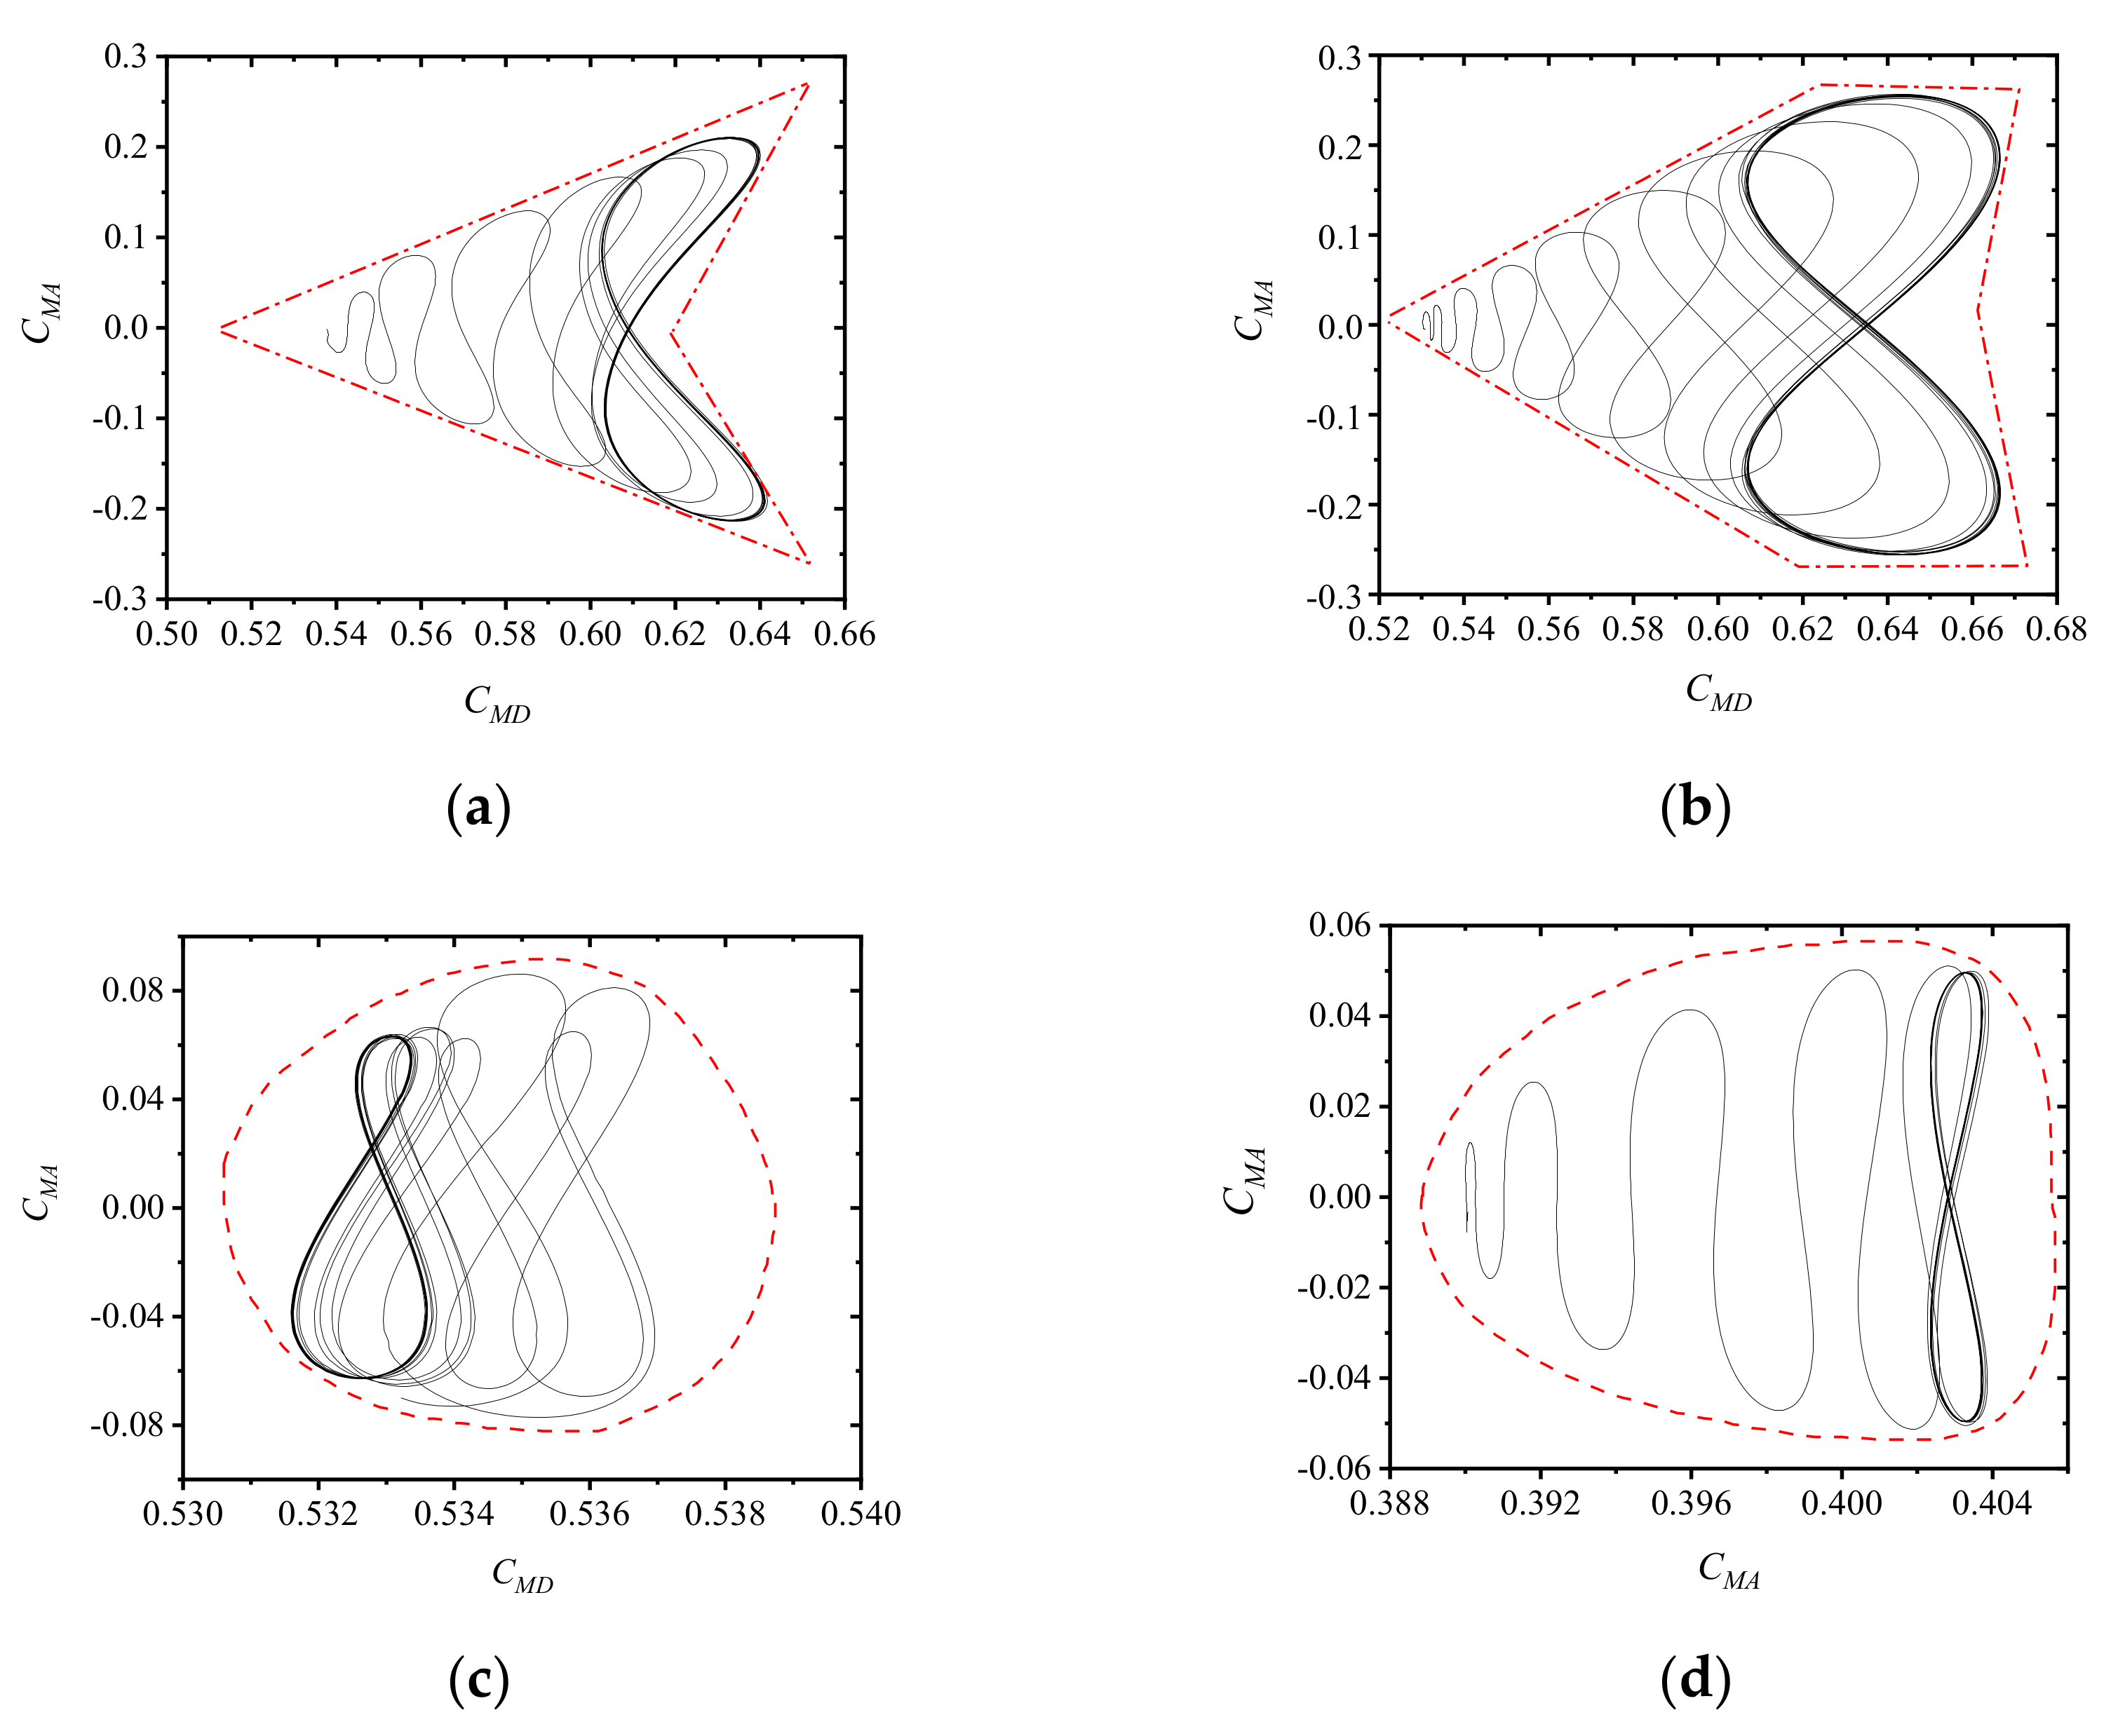
3.3.1. Base Bending Moment

The maximum and minimum values of the crosswind and downwind base moments for the two models at different wind directions are shown in Figure 11 and Figure 12. The most unfavorable conditions are θ = 0° and θ = 180°, where there is a lack of diversion at the corner of the building due to the large upwind area. In that case, the building is subjected to the maximum crosswind base moment and downwind moment, and the maximum crosswind moment and maximum downwind moment of the building with platforms are smaller than those of the building without platforms. At θ = 0°, the crosswind base moment and the downwind base moment are reduced by the greatest amount, up to 17.38% and 3.69%, respectively. The presence of platforms increases the crosswind base moment by a small amount at θ = 30° to θ = 90°. The presence of large-span straight platforms reduces the crosswind base moment of the building from θ = 120° to θ = 180°. Analysis of the above results shows that there is a difference in the effect of large-span straight platforms on the crosswind base moment when located in the windward or leeward direction. It can be seen from Figure 12 that the large-span straight platforms only reduce the moment when θ is close to 0° and 180°, and when θ is in the interval from 30° to 150° it increases the moment slightly. When θ = 90°, the windward base moment is minimized because the windward area is the smallest. As the large-span straight platforms of the building model are arranged on a single side and are spatially asymmetrical, its base torsional moment will differ from that of the reference model. Figure 13 shows the base torsional moment for the two building models at different wind directions, with the positive and negative signs in the figure representing the direction of twisting. It can be seen from the graphs that the maximum forward and reverse torques to which the target model was subjected are much greater than those to which the reference model was subjected. At θ = 0°, the target model was subjected to slightly less forward and reverse torques than the reference model. At θ = 30° to θ = 120°, the target model was subjected to larger reverse torques. When θ = 180°, the target model was subjected to significantly higher forward and reverse torques compared to the reference model due to the influence of periodic vortex shedding on the platforms at its back. Therefore, when constructing similar buildings, it is important to enhance their torsional strength appropriately.
The base moment coefficient of the building is calculated as: C M = M 1 2 ρ U ref 2 BH 2 , where M is the base moments; ρ is the air density; U ref is the incoming wind speed at the top of the model; B is the width of the windward side of the model; and H is the height of the model. In order to investigate the effect of the single-sided large-span straight platforms on the correlation between the crosswind base moment coefficients CMA and downwind base moment coefficients CMD of the building, the phase plane trajectories of the CMA and CMD were plotted for the two building models at 0° and 90° wind angle conditions, as shown in Figure 14. From Figure 14a,b, it can be seen that the trajectory diagram of the building model with straight platforms at θ = 0° is triangular in shape in the area enclosed by one side of the horizontal axis. Therefore, it is more likely that the CMA and CMD reach the maximum value at the same time, and the correlation between the two is stronger. While the trajectory diagram of the reference model is semi-elliptical in shape in the area enclosed by one side of the horizontal axis, it is less likely that the CMA and CMD reach the maximum value at the same time, and the correlation between the two is weaker. From Figure 14c,d, it can be seen that the trajectory of the target model at θ = 90° is less symmetrical along the transverse axis because the large span straight platforms of the target model is arranged along one side, but is more similar; and its trajectory diagram is triangular and semi-circular in the area enclosed by one side of the transverse axis, while the trajectory diagram of the reference model is triangular and semi-elliptical in the area enclosed by one side of the transverse axis, indicating that the correlation between the CMA and CMD of the target model at 90° is weaker than that of the reference model.
Figure 15a shows the variation of the maximum and minimum values of the absolute value of the drag coefficient ∣Cd∣ with the wind direction for the two building models. The peak values of ∣Cd∣ for the building model with single-sided large-span straight platforms occur at 0° and 180°. When the wind direction θ changes from 0° to 90°, ∣Cd∣ first decreases then increases and reaches a smaller peak at 90°. Afterwards, when the wind direction θ changes from 90° to 180°, ∣Cd∣ first decreases then increases. Compared to the reference model, the large-span straight platforms increase ∣Cd∣ at wind angles close to 90° but decrease ∣Cd∣ at other angles. The value of ∣Cd∣ is reduced by 18.65% at the angle of 150°. Figure 15b shows the variation of the lift coefficient Cl with wind direction for the two building models. The peak of Cl for the model with the straight platform occurs at 30°. Cl increases from 0° to 30° and decreases from 30° to 180°. Comparison with the reference model reveals that the presence of large-span straight platforms decreases Cl at wind directions close to 0° and 180°, with a reduction of up to 64.56% at 180°, while the wind angle of 30° to 180° increases Cl, with the largest increase of up to 122.1% at 30°. Overall, however, the maximum values of ∣Cd∣ and Cl for the target model are smaller than those of the reference model.

3.3.2. Analysis of Structural Self-Oscillation Characteristics

The object of this study was modelled by means of computer-aided design calculation software PKPM for building structures. Both the target and reference models are frame—double core structures with beams and columns in section profiled steel and concrete. The concrete grade is C60 and the thickness of the core is 900 mm. The constant and live loads on the floor are set at 0.5 KN/m2 and 2.0 KN/m2, respectively. The first three order vibration patterns and periods are calculated in Table 2.
Scholars around the world have done a great deal of research on the first-order inherent frequency of high-rise structures and have put forward many empirical formulas [31]. Zhengwei Zhang included information on 106 high-rise buildings with heights between 80 m and 600 m, obtained the first-order self-oscillation period data through finite element software electro computation, and used the least squares method to fit an empirical formula for the translational period of the building base order. Using data from Zhengwei Zhang and Guota Wang and supplementing it with a number of buildings with high aspect ratios, Wang Lei fitted the new formulae using the form of the formulae used in the norms in China. A comparison of the electro-computational results with the results obtained from the empirical formulae fitted by Zhang and Wang is shown in Table 3, which shows that the X-directional first-order self-oscillation period is between the results obtained from Zhang and Wang’s empirical formulae. As the building is a double core structure, the Y-directional first-order self-oscillation period inside and outside the electro-computation is slightly smaller than that obtained from Zhang and Wang’s empirical formulae. The comparison shows that the electrical results are within a reasonable range and have a certain degree of reliability, and the electrical results are used to calculate the displacement, velocity and acceleration response of the tall building.

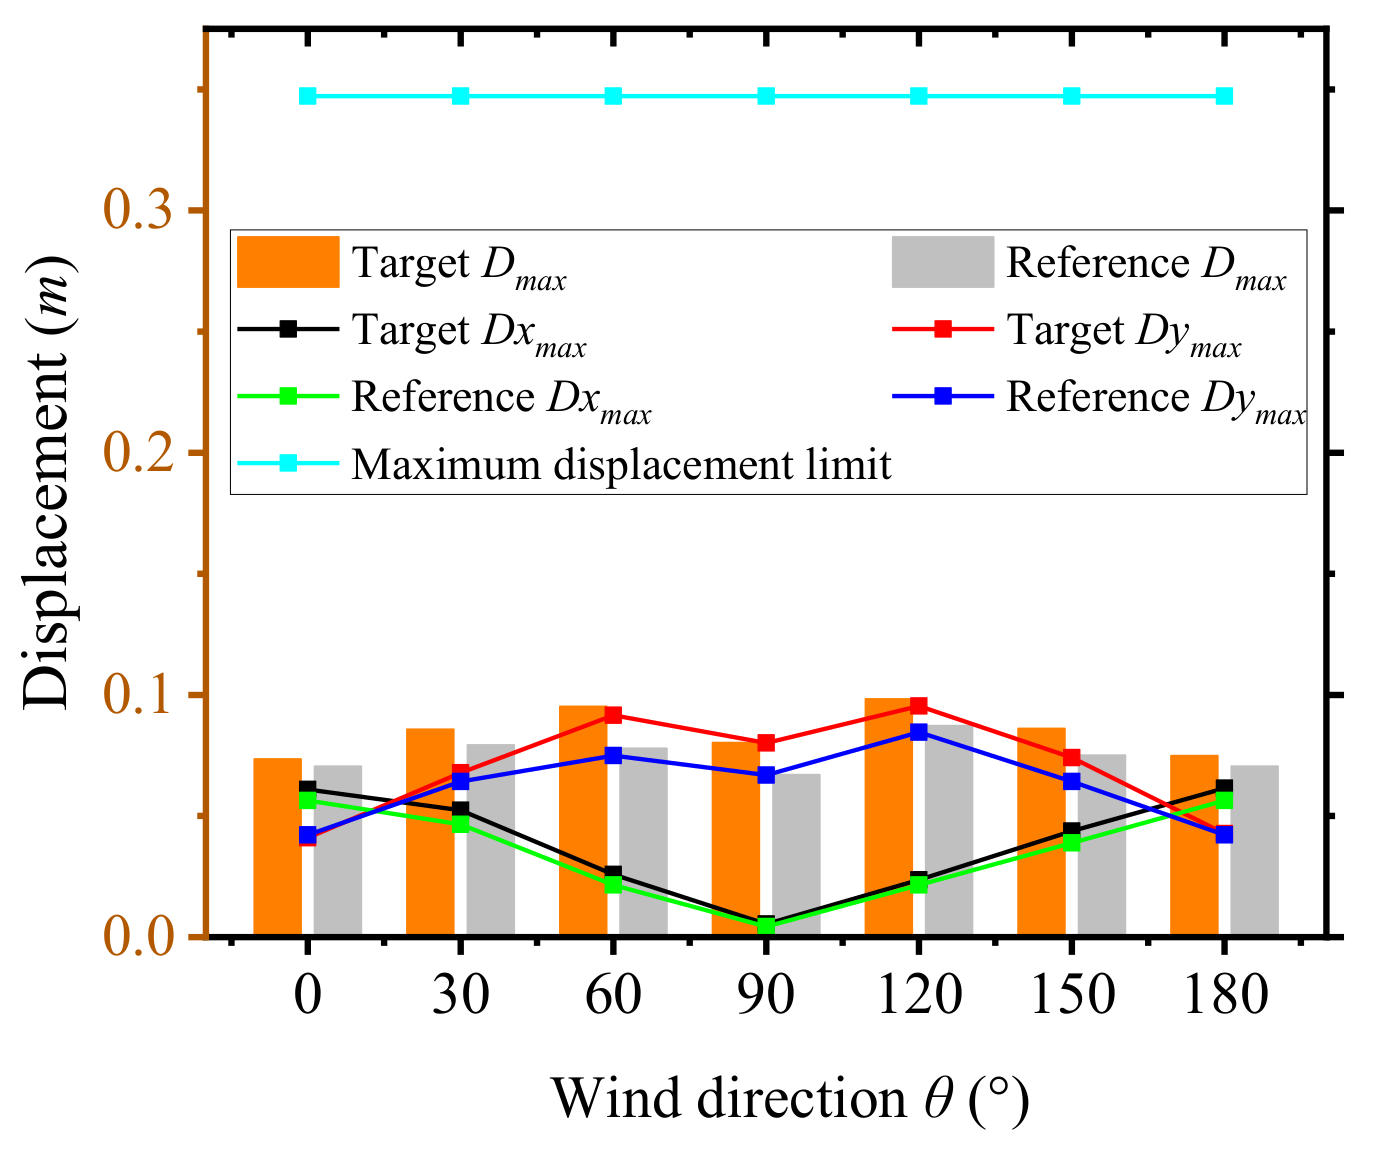
3.3.3. Displacement and Acceleration Response

For supertall buildings, the structural response is mainly derived from first-order vibration modes. When only first-order linear vibration modes are considered, the first-order generalized force mass M 1 , generalized stiffness K 1 , and generalized force P 1 , are obtained as follows [40]:
M 1 = 0 H m z φ 2 z d z = 0 H ρ BD z H 2 d z = ρ BDH / 3 K 1 = 2 π f 1 2 M 1 = 4 π 2 f 1 2 ρ BDH / 3 P 1 t = φ 1 T p t = z H P z , t = M H
where φ z is the corresponding first order vibration pattern in each axial direction of the structure; ρ is the building density, which changes the displacement response in general by affecting the generalized stiffness and is derived from the computer-aided design calculation software for building structures; m z is the mass per unit height of the structure; B, D and H are the geometric dimensions of the structure; and M is the base bending moment.
Using the kinetic equations to relate the first order generalized forces to the base bending moments:
M 1 q 1 t + C 1 q 1 t + K 1 q 1 t = P 1 t = M H
The structure vertex displacement x z , t is obtained as follows:
x z , t = q 1 t z H
The solution of Equation (5) in the frequency domain is based on the theory of random vibration [41]:
S q 1 f = H 1 f 2 × S P 1 f
H 1 f = 1 K 2 1 f / f 1 2 2 + 4 ξ 1 2 f / f 1 2
where S q 1 f is the generalized displacement power spectrum; H 1 f 2 is the mechanical derivative function; S P 1 f is the generalized force power spectrum; ξ 1   is the first order modal damping ratio, taken as per Table 2. Integration of Equation (6) yields the pulsation displacement variance, which is:
σ q 1 2 = 0 S q 1 f d f = 0 H 1 f 2 · S P 1 f d f = I B 2 + I R 2
The pulsation displacement variance can be considered the sum of the squares of the background response I B and the resonant response I R , both of which and the resonant-to-background response ratio are calculated according to Equation (10) [42], where S M f 1 is the generalized base moment power spectrum, which can be obtained from non-constant calculations of the building; σ M is the mean squared difference of the base moment:
I B = σ P 1 K 1 = σ M HK 1 I R = 1 K 1 π f 1 4 ξ 1 S P 1 f 1 1 HK 1 π f 1 4 ξ 1 S M f 1 C R 2 = I R 2 B R 2 = π 4 ξ 1 f 1 × S M f 1 σ M 2
Substituting Equation (10) into Equation (6) gives the mean squared deviation of the pulsating displacement response σ x , B z as:
σ x , B z = z H 2 K 1 σ M , σ x , R z = σ x , B z × C R
For the average displacement response x ¯ H , the calculation is performed according to Equation (12):
x ¯ H = M HK 1 = 3 M 4 π 2 f 1 2 ρ BDH 3
The maximum value of the generalized displacement response D j max of the building is obtained as follows:
D j max = x ¯ H + g × σ x
where j represents the body axes X and Y and is the displacement response extremum factor, which can be calculated according to the method of random vibration [41]. The vertex displacements along the body axis in the X and Y directions for the two building models at different wind directions are shown in Figure 16. It can be indicated that the maximum displacement Dxmax in the x-direction of the two building models decreases from 0° to 90° and increases from 90° to 180°. The maximum displacement Dymax in the y-direction of the two building models is smallest at 0° and 180° and is largest at 60° and 120°. The maximum total displacement response of the target and reference models occurs at a wind direction of 120°. At different wind directions, the Dxmax and Dymax of the building model with single-sided large-span straight platforms are both greater than those of the reference model, indicating that the presence of the platforms increases the apex displacement of the building and that the Dxmax reaches a maximum increase of 25% at 90° and the Dymax reaches a maximum increase of 22.29% at 60°. The total displacement Dmax increases the most at 60°, up to 22.85%. Similarly, wind-induced acceleration has a significant variation as the wind angle changes.
According to the theory of random vibration [41], the root variance of the acceleration response at z height of the structure can be expressed by the following formula:
σ a z = z H 2 M 1 π f 1 4 ξ 1 S M f 1
The root mean square of acceleration at the apex of the two building models is shown in Figure 17. The root mean square of acceleration of the target model in the X and Y directions of the body axis is smaller than that of the reference model at different wind directions, indicating that the large-span straight platforms can reduce the acceleration response of the rectangular-section supertall building to a certain extent and the reduction is greatest at θ = 0°, up to 9.14%. The X-directional acceleration response along the body axis is greater than the Y-direction for building models at θ = 0°, 30° and 150° and 180°, while the X-directional acceleration response along the body axis is less than the Y-direction for the other wind angle conditions. The maximum total acceleration response of the target model occurs at the wind direction of 30°, while the maximum total acceleration response of the reference model occurs at wind directions of 0° and 180°. It should be noted that since this paper only considers the effect of first-order linear vibration patterns, the above unique and acceleration results may have some deviations compared to the actual situation.

4. Conclusions

This paper used numerical simulations to analyze and calculate the wind load characteristics and wind-induced response of a supertall building with the construction of multiple single-sided large-span straight platforms. The possible effects of the platforms attached to supertall buildings were investigated by comparing it with a reference model without platforms. Within the parameters assessed in this study, the following conclusions can be drawn:
  • The presence of single-sided large-span straight platforms changes the mean wind pressure distribution on the building surface. The changes were more pronounced when located on the windward side, i.e., between 0° and 90°. The most adverse positive and negative wind pressures on both the building façade and roof were generated at θ = 0°. At different wind directions, the presence of single-sided large-span straight platforms generally reduced the maximum negative pressure coefficient on the building surface, reaching a maximum reduction of 31.56% at 30°, and caused a small increase in the maximum positive pressure coefficient, reaching a maximum increase of 5.30% at 0°. When the platforms were facing the wind, an area of high pressure was created between the platforms. The mean wind pressure on the lower surface of the platform was greater than that on the upper surface. When θ ranged from 0° to 90°, the maximum pressure on the upper and lower surfaces was almost shifted from the center of the platform to the side as the wind direction θ increased, and the pressure difference was greatest on the platform near the top of the building. The platforms reduced the maximum negative pressure on the building surface and had less effect on the maximum positive pressure;
  • The frequency of vortex shedding in the supertall building with the construction of multiple single-sided large-span straight platforms was slightly less than in the reference building. The platforms had a small effect on the horizontal vortex shedding of the building model. However, the presence of platforms changed the gas bypass as the wind direction θ changed in the vertical direction. When θ = 0° and θ = 30°, the vortex scale at the back of the target building was larger and the negative pressure zone formed was also larger. When θ = 90°, the bypass at the top of the two building models was similar, whereas the area of the negative pressure region on the back of the target model changed abruptly at the height where the platforms were located when θ = 180°;
  • At θ = 0° and θ = 180°, the building model was subjected to the maximum crosswind moment and downwind moment, and the maximum crosswind moment and maximum downwind moment with the target building were smaller than those of the reference building. The forward and reverse torques of the target model were greatest at θ = 180° and were much greater than the reference model, while in most other operating conditions they were smaller than the reference model. The CMA and CMD correlations for the target building model were stronger than the reference model at θ = 0°; at θ = 90°, the correlations were weaker than the reference model. The maximum values of ∣Cd∣ and Cl for the building model with large-span straight platforms were smaller than those for the reference model;
  • The presence of single-sided large-span straight platforms increased the vertex displacement response and decreased the vertex acceleration response of the building, with a maximum increase in vertex displacement response of 22.85% and a maximum decrease in vertex acceleration response of 9.14%. The maximum total displacement response for both the target and reference models occurred at a wind direction of θ = 120°, while the maximum total acceleration response for the target model occurred at θ = 30° and the maximum total acceleration response for the reference model occurred at θ = 0° and 180°.
The results of this study can be used as a reference for the design, construction and safety assessment of supertall buildings of similar construction, and can be used to improve the ventilation, heat transfer and air quality of buildings.

Author Contributions

Conceptualization, J.J. and L.Z.; methodology, L.Z. and L.D.; software, L.Z.; validation, L.Z. and L.D.; formal analysis, J.J. and L.Z.; investigation, L.Z.; resources, J.J.; data curation, L.Z.; writing—original draft preparation, L.Z.; writing—review and editing, J.J. and L.D.; visualization, L.Z.; supervision, J.J. and L.D.; project administration, J.J. and L.Z.; funding acquisition, J.J. and L.Z. All authors have read and agreed to the published version of the manuscript.

Funding

This research was funded by the National Natural Science Foundation of China (Grant No. 51908108).

Institutional Review Board Statement

Not applicable.

Informed Consent Statement

Not applicable.

Data Availability Statement

The data used to support the findings of this study are available from the authors upon request.

Conflicts of Interest

The authors declare no conflict of interest.

References

  1. Tanaka, H.; Tamura, Y.; Ohtake, K.; Nakai, M.; Kim, Y.C. Experimental investigation of aerodynamic forces and wind pressures acting on tall buildings with various unconventional configurations. Wind Eng. Ind. Aerod. 2012, 107, 179–191. [Google Scholar] [CrossRef]
  2. Kim, Y.C.; Bandi, E.K.; Yoshida, A.; Tamura, Y. Response characteristics of super-tall buildings-Effects of number of sides and helical angle. Wind Eng. Ind. Aerod. 2015, 145, 252–262. [Google Scholar] [CrossRef]
  3. Zhang, Z.W.; Quan, Y.; Gu, M. Effects of corner chamfering and rounding modification on aerodynamic coefficients of square tall buildings. China Civ. Eng. J. 2013, 46, 12–20. [Google Scholar]
  4. Maruta, E.; Kanda, M.; Sato, J. Effects on surface roughness for wind pressure on glass and cladding of buildings. Wind Eng. Ind. Aerod. 1998, 74–76, 651–663. [Google Scholar] [CrossRef]
  5. Zheng, X.; Montazeri, H.; Blocken, B. CFD simulations of wind flow and mean surface pressure for buildings with balconies: Comparison of RANS and LES. Build. Environ. 2020, 173, 106747. [Google Scholar] [CrossRef]
  6. Ai, Z.; Mak, C.; Niu, J.; Li, Z. The assessment of the performance of balconies using computational fluid dynamics. Build. Serv. Eng. Technol. 2011, 32, 229–243. [Google Scholar] [CrossRef]
  7. Yang, Q.S.; Liu, Z.H.; Hui, Y.; Li, Z.N. Modification of aerodynamic force characteristics on high-rise buildings with arrangement of vertical plates. Wind Eng. Ind. Aerod. 2020, 200, 104155. [Google Scholar] [CrossRef]
  8. Quan, Y.; Kuang, J.; Gu, M. E Effects of grid curtains on the wind loads of a high-rise building. Struct. Des. Tall. Spec. 2016, 25, 245–262. [Google Scholar] [CrossRef]
  9. Huang, D.M.; He, S.Q.; Zhu, X. Effect of surface roughness on wind load and wind-induced vibration response of super high-rise buildings. J. Hunan. Univ Nat. Sci. Ed. 2017, 44, 41–51. [Google Scholar]
  10. Toja-Silva, F.; Peralta, C.; Lopez-Garcia, O.; Navarro, J.; Cruz, I. Effect of roof-mounted solar panels on the wind energy exploitation on high-rise buildings. Wind Eng. Ind. Aerod. 2015, 145, 123–138. [Google Scholar] [CrossRef] [Green Version]
  11. Kopp, G.A. Wind Loads on Low-Profile, Tilted, Solar Arrays Placed on Large, Flat, Low-Rise Building Roofs. J. Struct. Eng. 2014, 140, 04013057. [Google Scholar] [CrossRef]
  12. Zheng, X.; Montazeri, H.; Blocken, B. CFD analysis of the impact of geometrical characteristics of building balconies on near-façade wind flow and surface pressure. Build. Environ. 2021, 200, 107904. [Google Scholar] [CrossRef]
  13. Yuan, K.; Hui, Y.; Chen, Z. Effects of facade appurtenances on the local pressure of high-rise building. Wind Eng. Ind. Aerod. 2018, 178, 26–37. [Google Scholar] [CrossRef]
  14. Lam, K.M.; To, A.P. Generation of wind loads on a horizontal grandstand roof of a large aspect ratio. Wind Eng. Ind. Aerod. 1995, 54–55, 345–357. [Google Scholar] [CrossRef]
  15. Barnard. Predicting wind loading on cantilevered canopy roof structures. Wind Eng. Ind. Aerod. 2000, 85, 47–57. [Google Scholar] [CrossRef]
  16. Blocken, B.; Defraeye, T.; Derome, D.; Carmeliet, J. High-resolution CFD simulations for forced convective heat transfer coefficients at the facade of a low-rise building. Build. Environ. 2009, 44, 2396–2412. [Google Scholar] [CrossRef]
  17. Llaguno-Munitxa, M.; Bou-Zeid, E.; Hultmark, M. The influence of building geometry on street canyon air flow: Validation of large eddy simulations against wind tunnel experiments. Wind Eng. Ind. Aerod. 2017, 165, 115–130. [Google Scholar] [CrossRef] [Green Version]
  18. Omrani, S.; Garcia-hansen, V.; Capra, B.; Drogemuller, R. On the effect of provision of balconies on natural ventilation and thermal comfort in high-rise residential buildings. Build. Environ. 2017, 123, 504–516. [Google Scholar] [CrossRef]
  19. Murena, F.B.; Mele, B. Effect of balconies on air quality in deep street canyons. Atmos. Pollut. Res. 2016, 7, 1004–1012. [Google Scholar] [CrossRef] [Green Version]
  20. Pourshab, N.; Tehrani, M.D.; Toghraie, D.; Rostam, S. Application of double glazed façades with horizontal and vertical louvers to increase natural air flow in office buildings. Energy 2020, 200, 117486. [Google Scholar] [CrossRef]
  21. Ghasemi, M.; Toghraie, D.; Abdollahi, A. An experimental study on airborne particles dispersion in a residential room heated by radiator and floor heating systems. J. Build. Eng. 2020, 32, 101677. [Google Scholar] [CrossRef]
  22. Dabiri, S.; Khodabandeh, E.; Poorfar, A.K.; Mashayekhi, R.; Toghraie, D.; Zade, S.A.A. Parametric investigation of thermal characteristic in trapezoidal cavityreceiver for a linear Fresnel solar collector concentrator. Energy 2020, 153, 17–26. [Google Scholar] [CrossRef]
  23. Su, X.B. The Analysis of Wind Load and Characteristic of Flow around High-Rise Buildings with CFD. Master’s Thesis, Hunan University, Changsha, China, 2014. [Google Scholar]
  24. Tominaga, Y.; Stathopoulos, T. Numerical simulation of dispersion around an isolated cubic building: Model evaluation of RANS and LES. Build. Environ. 2010, 45, 2231–2239. [Google Scholar] [CrossRef] [Green Version]
  25. Costola, D.; Blocken, B. Overview of pressure coefficient data in building energy simulation and airflow network programs. Build. Environ. 2009, 44, 2027–2036. [Google Scholar] [CrossRef] [Green Version]
  26. Fletcher, C.A.J. Computational Techniques for Fluid Flow Dynamic, 2nd ed.; Springer: Berlin, Germany, 1990. [Google Scholar]
  27. Tominaga, Y.; Mochida, A.; Murakami, S.; Sawaki, S. Comparison of various revised k–ε models and LES applied to flow around a high-rise building model with 1:1:2 shape placed within the surface boundary layer. Wind Eng. Ind. Aerod. 2008, 96, 389–411. [Google Scholar] [CrossRef]
  28. Kahsay, M.T.; Bitsuamlak, G.T.; Tariku, F. CFD simulation of external CHTC on a high-rise building with and without façade appurtenances. Build. Environ. 2019, 165, 106350. [Google Scholar] [CrossRef]
  29. Montazeri, H.; Blocken, B. CFD simulation of wind-induced pressure coefficients on buildings with and without balconies: Validation and sensitivity analysis. Build. Environ. 2013, 60, 137–149. [Google Scholar] [CrossRef]
  30. Ai, Z.T.; Mak, C.M.; Niu, J.L.; Li, Z.R.; Zhou, Q. The effect of balconies on ventilation performance of low-rise buildings. Indoor Built Environ. 2011, 20, 649–660. [Google Scholar] [CrossRef]
  31. Wang, L. Study on Aerodynamic Forces and Wind-induced Responses of Super High-rise Buildings with Large Aspect Ratio. Master’s Thesis, Beijing Jiaotong University, Beijing, China, 2018. [Google Scholar]
  32. Yan, B.W.; Li, Q.S. Wind tunnel study of interference effects between twin super-tall buildings with aerodynamic modifications. Wind Eng. Ind. Aerod. 2016, 156, 129–145. [Google Scholar] [CrossRef]
  33. Ai, Z.T.; Mak, C.M. Large eddy simulation of wind-induced interunit dispersion around multistory buildings. Indoor Air 2016, 26, 259–273. [Google Scholar] [CrossRef]
  34. Stathopoulos, T.; Zhu, X. Wind pressure on building with mullions. Struct. Eng. 1990, 116, 2272–2291. [Google Scholar] [CrossRef]
  35. Stathopoulos, T.; Zhu, X. Wind pressure on building with appurtenances. Wind Eng. Ind. Aerod. 1988, 31, 265–281. [Google Scholar] [CrossRef]
  36. Yang, W. Numerical Simulation Study of Structural Wind Load and Response Based on RANS. Ph.D. Thesis, Tongji University, Shanghai, China, 2004. [Google Scholar]
  37. GB 50009―2012. Load Code for the Design of Building Structures; China Architecture & Building Press: Beijing, China, 2012. [Google Scholar]
  38. AIJ 2004. Recommendations for Loads on Buildings; Architectural Institute of Japan: Tokyo, Japan, 2004. [Google Scholar]
  39. Melbourne, W.H. Comparison of measurements on the CAARC standard tall building model in simulated model wind flows. Wind Eng. Ind. Aerod. 1980, 6, 73–88. [Google Scholar] [CrossRef]
  40. Ge, N.; Chen, H.B.; Zhou, X.Y. Evaluation of wind induced dynamic response for high-rise buildings with uneven rigidity and mass distribution. Spat. Struct. 2010, 16, 41–46. [Google Scholar]
  41. Nigam, N.C. Introduction to Random Vibrations, 2nd ed.; MIT Press: Cambridge, MA, USA, 1983. [Google Scholar]
  42. Wind Tunnel Experimental Guidelines Research Committee. Guidelines for Wind Tunnel Experiments in Buildings; China Architecture and Building Press: Beijing, China, 2011. [Google Scholar]
Figure 1. Modelling and meshing. (a) The Tar Model and the Ref Model; (b) Computational domain conditions; (c) CAARC Model; (d) CAARC model measurement point setup; (e) Overall model meshing; (f) Details of near-ground meshing; (g) Mesh division method and measurement point arrangement for grid-independent verification; (h) Mean wind pressure coefficients at measurement points for grid-independence verification.
Buildings 12 01694 g001
Figure 2. Numerical simulation of wind field characteristics at the entrance. (a) Velocity and turbulence profiles; (b) Turbulence integration scales.
Buildings 12 01694 g002
Figure 3. The comparison of the wind pressure at the surface measurement points of the CAARC model with wind tunnel test data.
Buildings 12 01694 g003
Figure 4. Distribution of wind pressure coefficients on building surfaces at different wind directions. (a) Case 1. θ = 0°; (b) Case 2. θ = 30°; (c) Case 3. θ = 60°; (d) Case 4. θ = 90°; (e) Case 5. θ = 120°; (f) Case 6. θ = 150°; (g) Case 7. θ = 180°.
Buildings 12 01694 g004
Figure 5. Distribution of wind pressure coefficients on each platform surface at different wind directions. (a) Case 1. θ = 0°; (b) Case 2. θ = 30°; (c) Case 3. θ = 60°; (d) Case 4. θ = 90°; (e) Case 5. θ = 120°; (f) Case 6. θ = 150°; (g) Case 7. θ = 180°.
Buildings 12 01694 g005aBuildings 12 01694 g005b
Figure 6. Wind pressure coefficient on the surface of the building facade at different wind directions.
Buildings 12 01694 g006
Figure 7. Wind pressure coefficients on each platform surface for different wind directions.
Buildings 12 01694 g007
Figure 8. (a) Lift time history of the target model; (b) Lift time history of the reference model; (c) Vortex shedding frequency of the two building models at different wind angles.
Buildings 12 01694 g008aBuildings 12 01694 g008b
Figure 9. Velocity magnitude in the XZ plane at Y = 100 m. (a) Case 1. The target model, θ = 0°; (b) Case 2. The reference model, θ = 0°; (c) Case 3. The target model, θ = 30°; (d) Case 4. The reference model, θ = 30°; (e) Case 5. The target model, θ = 90°; (f) Case 6. The reference model, θ = 90°; (g) Case 7. The target model, θ = 180°; (h) Case 8. The target model, θ = 180°.
Buildings 12 01694 g009
Figure 10. Velocity magnitude in the XY plane at Z = 0 m. (a) Case 1. The target model, θ = 0°; (b) Case 2. The reference model, θ = 0°; (c) Case 3. The target model, θ = 30°; (d) Case 4. The reference model, θ = 30°; (e) Case 5. The target model, θ = 90°; (f) Case 6. The reference model, θ = 90°; (g) Case 7. The target model, θ = 180°; (h) Case 8. The target model, θ = 180°.
Buildings 12 01694 g010
Figure 11. Crosswind moments of the target and reference models for different wind directions.
Buildings 12 01694 g011
Figure 12. Downwind moments of the target and reference models for different wind directions.
Buildings 12 01694 g012
Figure 13. Torsional moments of the target and reference models for different wind directions.
Buildings 12 01694 g013
Figure 14. Phase plane trajectory diagrams for crosswind and downwind basal moment coefficients (CMA and CMD). (a) Case 1. The target model, θ = 0°; (b) Case 2. The reference model, θ = 0°; (c) Case 3. The target model, θ = 90°; (d) Case 4. The reference model, θ = 90°.
Buildings 12 01694 g014
Figure 15. (a) Variation of drag coefficient ∣Cd∣ with wind direction; (b) Variation of lift coefficient Cl with wind direction.
Buildings 12 01694 g015
Figure 16. Maximum value of displacement of the building model along the vertices of the body axes.
Buildings 12 01694 g016
Figure 17. Maximum value of acceleration of the building model along the vertices of the body axes.
Buildings 12 01694 g017
Table 1. Wind profile characteristics corresponding to different ground roughness categories.
Ground Roughness CategoryABCD
Average wind speed profile index α 0.120.150.220.30
Gradient wind height z g m 300350450550
Starting height of wind profile z b m 5101530
Nominal turbulence I 10 0.120.140.230.39
Table 2. Self-oscillation period and vibration direction of building structures.
Vibration TypeThe Target ModelThe Reference Model
Cycle Time (s)TypeDamping RatioModelCycle Time (s)TypeDamping RatioModel
15.2577X4.69%Buildings 12 01694 i0014.7702X4.61%Buildings 12 01694 i002
23.7121Y4.86%3.4110Y4.82%
32.4417T4.93%2.1799T4.91%
Table 3. Comparison of the electro-computed results with those obtained from the existing fitted empirical formulae.
Vibration DirectionElectrical Calculation ResultsZhengwei Zhang
T 1 = 0.015 H + 1.28
Wang Lei
T 1 = 4.54 + 0.03 H B 3
X5.25774.3856.2612
Y3.71214.3856.1262
T2.4417
Publisher’s Note: MDPI stays neutral with regard to jurisdictional claims in published maps and institutional affiliations.

