Abstract
This study aims to create an iconic dust-control skyscraper that resembles an environmentally friendly structure, by adapting a new dust simulation design approach. This method seeks to reduce dust dispersion in the air, control dust movement, and siphon it from the ambient air to purify the surrounding environment by implementing design techniques in the skyscrapers of the UAE. To tackle this critical but often overlooked issue, this study focuses on building typologies along the Sheikh Zayed road region in Dubai city due to the area’s importance and the existence of numerous renowned skyscrapers. An analytical study was conducted to categorize the typologies, followed by a performance analysis to assess the impact of accumulated dust on solar radiation and the overall thermal performance of the structures. Fourteen cases were evaluated using ANSYS simulation software selected for their basic typologies and their possible existence in reality. The study’s design guidelines were set according to the results conducted from running the simulation, as the findings suggested that wind streamlines may easily travel around a circular-shaped structure, while a building’s sharp edges act as wind barriers, driving the wind away from the structure and allowing dust to collect on the surfaces. The ideal example, according to the study’s conclusions, was the trapezoid form (case 14), which was established by simulation results that demonstrated a 3.4% reduction in roof conduction and a 1.3% reduction in yearly cooling. On the other hand, a biomimetic design approach was also integrated into the study to devise a design concept that effectively responds to nature. Preliminary ideas and potential future avenues for this project are also discussed.
Keywords:
dust simulation; thermal performance; cooling load; tall buildings; ANSYS; hot climate; UAE 1. Introduction and Background
Skyscrapers are one of the technological advancements that emerged right after the Industrial Revolution, symbolizing authority and prosperity on an urban scale. They became known as structures with distinguishable dimensions that overcame pyramids, cathedrals, and even gigantic watch towers [1]. The concept of skyscrapers began to evolve rapidly in the late nineteenth century and continued through the twentieth century. Their construction was associated with major economic interests, urban planning, and aspirations to reach new heights, leading to intense competition among architects worldwide [2]. However, the primary constituents of any successful design are practicality and an expressive aesthetic. To achieve this, a design must effectively cope and adapt based on its location and the surrounding environmental conditions [3]. The United Arab Emirates (UAE) is well known for its various elegant and iconic skyscrapers, among them the highest skyscraper in the world, the Burj Khalifa. With its harsh desert climate, its architecture could be classified as desert architecture, which can also be referred to as “Architecture of the Extremes” [4]. This title emphasizes the need to recognize the concerns often faced by desert architecture. This architectural style magnifies the dimensions of every problem related to human dwellings. To address these related issues, the following aspects must be observed: human comfort and the local technical, cultural, and economic factors [3]. Human comfort is closely related to psychological comfort and environmental comfort factors. To meet the challenges of desert architecture, both factors should be considered. One of the psychological factors that impacts people’s state of mind is visibility. In countries with a desert climate, visibility is often obstructed due to climatic conditions. This limits people’s ability to appreciate the beauty of the surrounding scenes, whether they are architectural or natural. They will be left with degraded scenic vistas that may affect their psychology and physiology [5]. As for the second factor of human comfort, environmental comfort can be identified by the level of thermal comfort, sunlight and glare, and sand and dust. Thermal comfort refers to the need to adjust dwellings according to the climatic conditions to make them comfortable for human habitation. While intense sunlight may affect the health of the human eye and interfere in controlling some design features such as glazing, the environmental effect dust and sand have on built structures and human life is the main concern of this research [3]. Many passive design strategies have been used to reduce energy consumption in different climate conditions [6,7,8]. Tall buildings consume massive quantities of energy and require a high-operational cost [9]. According to the UN Framework Convention on Climate Change, the UAE is highly vulnerable to global warming. As temperatures soar, rainfall dries, and storms increase while rising sea levels threaten its low-lying coast [10]. To better understand its influence, it is necessary to study the nature and characteristics of dust and its relation to energy consumption. The accumulation of dust on a structure’s exterior surfaces substantially impacts its overall thermal performance. The building envelope is exposed to intense solar radiation in a desert climate, which increases the cooling load necessary to offset heat gain during the summer [11].
2. Literature Review
Dust consists of small and dry inorganic particles in a solid state. Those particles float in the air thanks to natural and mechanical forces. Wind and volcanic activities are examples of the natural forces affecting dust while grinding, crushing, drilling, demolition, conveying, shoveling, milling, bagging, sweeping, and other human activities represent the mechanical forces [12,13]. The diameter of a dust particle ranges from around 1 to 100 µm, which allows them to settle heavily under gravity’s effect and also facilitates their penetration into closed structures and the human respiratory system. However, particles diffusion does not depend exclusively on gravity, as they are also affected by electrical forces. In addition, dust-particle types vary, as they can be: mineral: free crystalline silica (quartz), cement, and coal; metallic: nickel, lead, beryllium, and cadmium; organic: flours, pollens, tea, cellulose, and cotton; biohazards: spores and molds; and chemical: pesticides and bulk chemicals [12]. A critical characteristic of dust is its harmful influence whether on rigid structures or human beings. Long-term exposure to wind that carries dust and sand leads to a rapid degradation process of structural elements. More importantly, it causes serious health problems. Issues resulting from dust and sand dispersion are considered a severe dilemma that requires critically examined solutions. Previous practices have attempted to overcome these challenges using obstructions, however, given that these tiny particles are widespread in the air, natural air flow was also obstructed. Specific objectives were then set to reduce the existence of those particles in the air. The first objective aimed to avoid their propagation from their sources. A second objective attempted to control their movement and prevent them from penetrating livable structures. Aerodynamics was applied, and simple tricks were developed and applied. For instance, different types of stabilizers, such as cement, asphalt, and lime, were used to prevent dust and sand from escaping their original medium. In addition, planting trees was considered a helpful method to purify the surrounding environment from dust [3]. Moreover, low walls or fences were integrated with the structures. Low walls managed to stand in the way of the low wind loaded with dust and sand. As a result, the particles started to accumulate at the bottom of the wall, eventually forming a pile of dust and sand that managed to redirect the wind upward, away from the building’s windows and openings. This technique was also used to create sand-free courtyards and open areas between buildings, benefiting from the pressure difference created by the wind flow. It can be concluded that eliminating dust and sand from the ambient air in a certain region is a complex approach, as it depends on the geometry and dimensions of the local structures. Furthermore, the accumulation of dust on a structure’s exterior surfaces substantially impacts its overall thermal performance. Several studies have investigated this matter. Ref. [14] evaluated the performance of a grid-connected photovoltaic system due to the impact of dust accumulation and aerosols. The qualitative results revealed that the PV panels experienced an estimated 5.6% decrease in efficiency. Similarly, ref. [15] investigated the relationship between direct-beam solar transmittance received by a tilted photovoltaic panel and sand-dust accumulation. The study suggested a new correlation aimed to assist PV designers in predicting the intensity of solar radiation that reaches the modules once the amount of dust amassed on a PV panel is known. Ref. [16] studied the impact of dust accumulation on cool roofs, targeting the solar reflectivity of coating materials. Likewise, ref. [17] analyzed the thermal performance of a building roof in terms of absorptivity and solar heat gain in a hot dry climate following the accumulation of dust. The results demonstrated that the roof’s solar absorptivity increased with the accumulation of smaller and less dense dust particles, increasing the annual cooling requirements by 45–181 kWh/m2 per year. Therefore, it can be determined that a design should be strategically planned according to the environment that it is embedded in, reflecting some technical, cultural, and economic aspects of that environment. The construction techniques, the materials, and the financial plan contribute to boosting the quality of the design outcome [3]. In this context, dust simulation is conducted via software mimicking the concept of an actual wind tunnel to understand the behavior of wind that is loaded with dust. Similar principles have been used in other research fields, such as snow simulation, to study the impact of snowdrifts on buildings’ surfaces [18]. To understand the process, the working mechanism of the wind tunnel must be clarified. The wind tunnel is a testing apparatus used to simulate natural wind, investigate wind flow around the tested objects, and understand how those bodies interact with the wind. Once a testing object is inserted into a wind tunnel, it becomes subject to a flow that replicates the velocity and turbulence profiles of actual wind circumstances. In most wind tunnel laboratories, standard wind profiles are provided, and the one closest to the actual conditions is chosen. Analytical methods are usually used to correct any minor differences between actual and experimental profiles. The wind can be injected with smoke, snow, and in this case dust particles. The scale of the testing model relative to the wind tunnel cross-sectional area plays an important role in affecting the obtained results. In other words, the wind tunnel boundaries will force the flow through a narrow cross-sectional area, and so the flow will be accelerated, and the wind forces will be higher. In this case, the effect of the wind tunnel on the testing object is called the blockage effect [19]. However, the simulation software (ANSYS) eliminates the limitations of the physical wind tunnel, allowing for more flexibility and control over wind conditions. This study also incorporates a biomimetic design approach. The word biomimetic comes from two Greek words; ‘bios’ which means life, and ‘mimesis’ which means to imitate. The biomimetic approach reflects an imitation of a natural process, system, or even an element that can solve a particular problem. Although this approach can lead to many sustainable architectural designs, the number of existing case studies is very low, as the application of the biomimetic approach is not very widespread [20]. Since this study aims to achieve a structure that effectively collects dust from the ambient air, a similar process in nature was investigated. To relate and connect the two processes and produce a building that imitates nature, the wind pollination process has been examined. The study concept and the natural process of pollination are very similar, as shown in Figure 1. While both collect small particles from the surrounding air, the study’s main inspiration process is “collecting the particles to prosper”. In other words, plants seem to collect pollen from the air to reproduce by producing fruits. The same idea could be used in this study. Dust will be collected and used for growing plants over the building’s exterior envelope. Such a design approach would help achieve a healthy outdoor environment that promotes livability in the UAE. This adds a new definition to livability in several studies in the UAE by [21,22]. Therefore, this study aims to create an iconic skyscraper that defies the aeolian environmental challenges of the UAE climate; a structure that improves the surrounding area, provides a comfortable indoor and outdoor environment, and responds to nature. This goal was achieved by investigating the following:
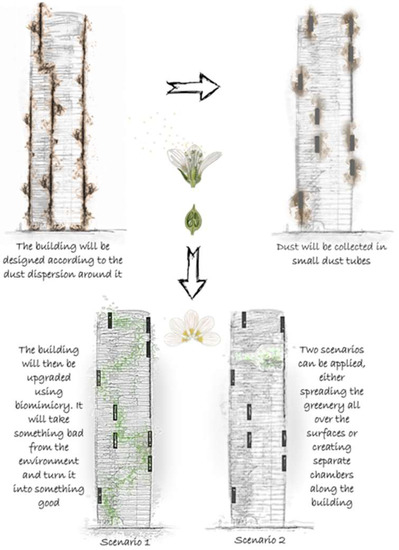
Figure 1.
Integrating the wind pollination process to improve the original design from dust simulation (source: the authors).
- The interaction process that occurs between wind, dust, and buildings, using simulations and analysis programs.
- The main typologies of skyscrapers in Dubai and the way they respond to wind and dust as well as the impact of merging different typologies on dust accumulation.
3. Research Methodology and Tools
Understanding dust behavior as well as the factors affecting the dispersion of dust around skyscrapers is key to being able to control this phenomenon. Thus, a series of simulations were conducted to acquire the information to design a dust-siphon skyscraper. Both Rhinoceros and ANSYS software were utilized during this study. Initially, Rhinoceros software, a 3D modeling software, was used to study the different forms of existing buildings on Sheikh Zayed Road in Dubai city. After categorizing and remodeling the typologies into simpler forms, the motion of the surrounding wind was analyzed, and the process of dust dispersion was simulated using ANSYS 17.2. Ref. [13] is a program that simulates the interactions that occur within multiple disciplines such as fluid dynamics, physics, and structural analysis. The program was used to predict the behavior of the dust and the different possible pathways that it could take during the dispersion process. After running the simulations and doing multiple tests, different typologies were retrieved, analyzed, and studied. Next, a thermal performance analysis was conducted to study the impact of dust accumulation on the exterior surface of each typology’s solar absorptivity and transmissivity. The change in the annual cooling load was also assessed. Finally, the optimal choice was then selected, and an exemplary skyscraper that controls the surrounding dust motion and siphons was designed with that option’s format. Figure 2 illustrates the research methodology and tools utilized to achieve the study’s objective.
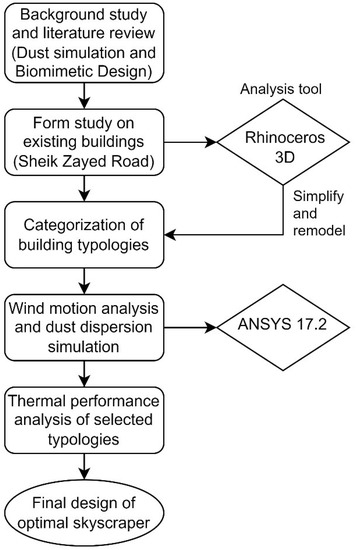
Figure 2.
Research methodology flowchart.
The simulation of the dust is considered a multiphase flow. The modeling of a multiphase flow can be solved using either Euler–Euler or Euler–Lagrange approaches in ANSYS Fluent. The dust in this study was simulated by the Euler–Lagrange approach using a discrete phase model after assuming the volume fraction of the dust was low, and that the interaction between the particles could be neglected. The details of the model followed the ANSYS guide [23]. In the Lagrangian discrete phase model, the air phase was treated as a continuum phase, and the velocity of air was found by solving the Navier–Stokes (momentum) equation, as shown in Equation (1). In contrast, the dispersed phase was treated by tracking a large number of dust particles.
where , and are the static pressure, gravitational body force, and external body force, respectively. The stress tensor is given by
where and are the molecular viscosity and the unit tensor, respectively. The effect of volume dilation appears in the second term on the right-hand side.
The dust-particle trajectory is computed individually at specified intervals during the fluid phase calculation. The trajectory of dust particles is predicted by equating the inertia of the dust particle and all the forces acting on the dust particle, as shown in Equation (3):
where , and are the particle (dust) mass, the fluid phase velocity (air), the dust velocity, the air density, the dust density, additional force, and the drag force, respectively. The dust-particle relaxation time [x] is calculated by:
where and are the dust-particle diameter and the drag coefficient, respectively. The relative Reynolds number (Re) is defined as shown in Equation (5).
The spherical drag law was used to calculate the drag coefficient for smooth dust particles, as shown in Equation (6):
where and are constants given by [24] and applied over several ranges of Re numbers.
The 3 m/s was used as the inlet velocity of the continuous fluid phase (air) whereas the mass flowrate 3 Kg/s was used for the discrete phase (dust particle) during the simulation for all cases. The dust particles were injected from the bottom side of the building and the interaction between the dust particles was neglected.
4. Case Study: Sheikh Zayed Road Typologies
A case study was conducted on different skyscrapers located on Sheikh Zayed Road in Dubai, UAE. Each building was analyzed in terms of its type, height, number of floors, and, most importantly, typology. To determine the most dominant typologies, schedules were constructed upon categorizing the different typologies. The number of skyscrapers of the same typology in the selected area was then calculated, as shown in Figure 3. Fourteen simple shapes were chosen to represent the most common building typologies. Using ANSYS 17.2, a simulation was run on each shape, predicting the motion of the wind, and studying the behavior of dust around each building form. Analyzing the wind profile is key to understanding dust behavior. Nevertheless, dust movement and dispersion processes are very sophisticated and difficult to simulate, especially those in open air. Since dust particles have different sizes, they behave differently while being dispersed. Due to their varying sizes, the larger particles will exist in the lower levels, as they are more affected by gravity, while the smaller particles will exist in the upper levels. Furthermore, the smaller particles seem to move with the wind stream with the tiniest resistance, while the larger particles deviate from the wind streamlines moving in their pathways. Therefore, a scenario that represents an approximate imitation of the actual wind and dust conditions can be assumed. It presumes the existence of dust at the lower levels around the building, blown by the generated wind at a velocity of 3 m/s, which is considered an average wind velocity in the UAE [25]. The procedure was repeated for each building shape, providing images that represent the wind velocities and streamlines at different locations and different levels, as well as the behavior of dust particles around each building shape. For each case, vertical and horizontal contours of the wind movement, the wind streamlines, and the dust-particle-movement graphs were retrieved from the software. Table 1 summarizes each of the simulated building shapes based on the examined typologies observed along Sheikh Zayed Road.
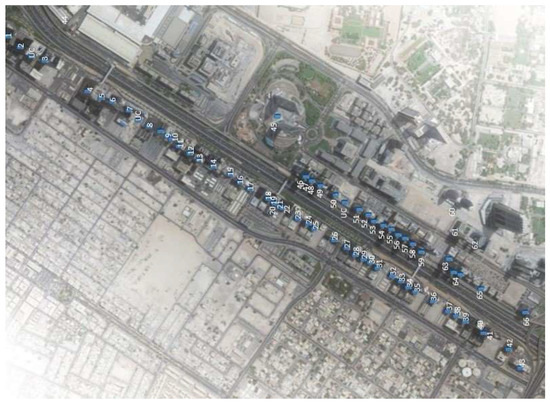
Figure 3.
Sheikh Zayed road map with the skyscrapers shown on it (source: the author).

Table 1.
Simulated building shapes.
5. Results and Discussion
5.1. ANSYS 17.2 Simulation Results
This section presents fourteen simulations of the accumulation and performance of dust around the main basic shapes (circle, square, rectangle, triangle, and trapezoid) and their possible existence in reality.
5.1.1. Circle Case
The retrieved wind velocity contours explain wind movement around a building with a circular plan, where part of the wind streamlines hit the building at the center of its windward surface to have a velocity of zero, forming what is known as the stagnation point (represented in black). Since the circle does not have a straight surface that stands against the wind, the other parts slowly slip on the windward surface, in a smoother rather than sharper pattern. Therefore, the wind will move with an increasing velocity around the building sides (represented in a white color gradient), leaving motionless air volume at the leeward surface (represented in black). This procedure is clearly demonstrated in Figure 4. On observing the dust-particle-movement graphs, it can be concluded that the dust particles tend to move with the wind streamlines until they reach the motionless air volume at the leeward surface. Particles then start to escape the natural wind flow, forming vertically growing vortices that climb the building’s leeward surface and accumulate on it.
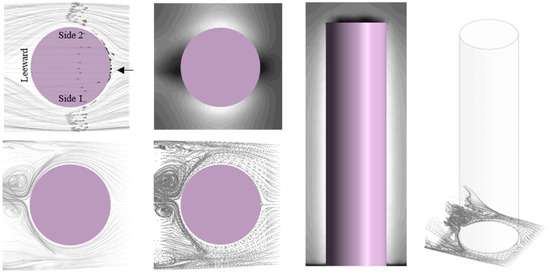
Figure 4.
Circle-case wind streamlines and contours and dust-particle pathways (source: the author).
5.1.2. Rectangle Case
The velocity contours of this case show that part of the wind streamlines hit the building at the center of its windward surface to have a velocity of zero (represented in black). The other parts slowly slip on the windward surface, due to the friction, reaching out to the building edges, to escape the surface with an increasing velocity (represented in a white color gradient). Thus, the two sides and the leeward surface are surrounded by motionless air (represented in black). The procedure is clearly demonstrated in Figure 5. Similar to the circle case, dust particles tend to move with the wind streamlines until they start escaping to the spaces that host the motionless air. Additionally, the difference between this case and the circle case is that due to the length of the rectangle sides, dust seems to accumulate more on the portions of the side surfaces that are closer to the windward surface.
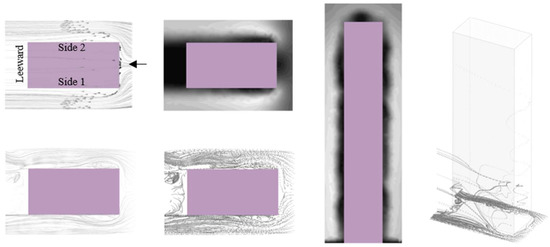
Figure 5.
Rectangle-case wind streamlines and contours and dust-particle pathways (source: the author).
5.1.3. Rotated Rectangle (45°)
The velocity contours show how the wind moves around a building with a rotated rectangular plan. It can be observed (in Figure 6) that as soon as the wind hits the windward surfaces of the building, part of its streamline will stop moving (represented in black). Meanwhile, the other parts will continue to slip on those surfaces with an increasing velocity (represented in a grey gradient), reaching out to the building’s edges to escape the surfaces as they continue their trajectory. Thus, the leeward surfaces are surrounded by motionless air (represented in black) as displayed in Figure 6. Moreover, it can be concluded that the dust particles tend to move with the wind streamlines until they reach the corners of the building. Next, the particles start to form vortices that carry dust to the backside of the building, where the motionless air exists. As a result, dust will settle on the leeward surfaces of the building.
5.1.4. Rectangle with Additions
The velocity contours explain how the wind moves around a building with a modified rectangular plan. Part of the wind streamlines hit the building at the center of its windward surface to have zero velocity (represented in black).

Figure 6.
Rotated (45°)-rectangle-case wind streamlines and contours and dust-particle pathways (source: the author).
Due to the existence of the circular corner, most of the streamlines are trapped between that circular element and the windward surface to be released later with a greater velocity than at the normal edge (represented in a white color gradient). Thus, the two sides and the leeward surface are surrounded by motionless air (represented in black). The procedure is clearly demonstrated in Figure 7. As for the dust particles, it can be concluded that due to the very high wind velocity near the circular edge, dust particles cannot escape the streamlines to the motionless air volume located on side one, next to the circular element. However, they manage to escape to the motionless air on side two, especially to the air column produced by the triangular recess that allows the particles to settle on its adjacent surfaces.
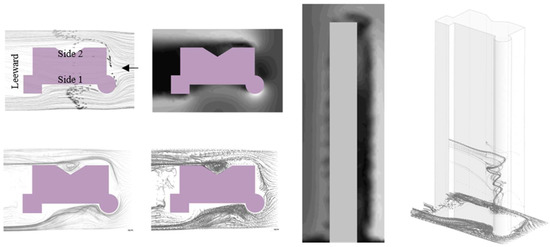
Figure 7.
Rectangle-with-additions-case wind streamlines and contours and dust-particle pathways (source: the author).
5.1.5. Rectangle-with-Additions Case (Orientation 2)
The velocity contours of this case explain how the wind moves around a building with a modified rectangular plan, oriented differently. Part of the wind streamlines hit the building at the center of its windward surface to have zero velocity. In this case, a squared corner element faces the wind, allowing its streamlines to escape the surface with an increasing velocity, but not as high as the velocity produced by the circular element in the previous case (represented in a white color gradient). This leaves the two sides and the leeward surface surrounded by motionless air (represented in black). The procedure is clearly demonstrated in Figure 8. It can be observed that this case results in the greatest dust accumulation so far. As in the other cases, dust particles tend to move with the wind streamlines until they escape to the spaces that host the motionless air columns on the sides. Dust particles manage to approach side two due to the existence of the squared corner element instead of the circular one. Existing in high concentrations in those areas, dust particles will accumulate on the building sides’ surfaces, especially the recessed portions.
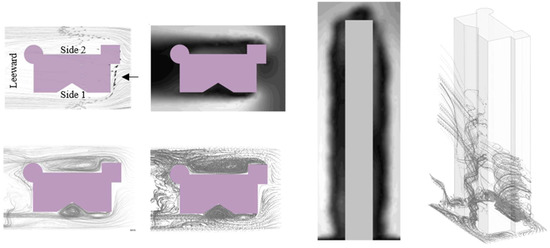
Figure 8.
Rectangle-with-additions (orientation 2)-case wind streamlines and contours and dust-particle pathways (source: the author).
5.1.6. Rectangle-with-Additions Case (Orientation 3)
The velocity contours explain how the wind moves around a building with another modified rectangular plan and another orientation. Wind streamlines hit the building at the center of its recessed windward surface to have zero velocity (represented in black, Figure 9). Due to the length of the windward surface, wind streamlines escape the surface with an increasing velocity that is higher than the velocity in the typical square case (represented in a white color gradient). The squared edge at side two seems to trap the air stream, while the circular edge at side one allows the stream to flow smoothly, leaving motionless air right next to the sides’ surfaces (represented in black). The procedure is clearly demonstrated in Figure 9. The dust particles, in this case, tend to move with the wind streamlines until they approach the motionless air volumes at the sides of the building, accumulating in them to end up settling on the sides’ surfaces. This is clearly observed on the side that hosts the circular edge, as it allows the wind to flow away from the building, which leaves more of the surrounding air on that side intact.
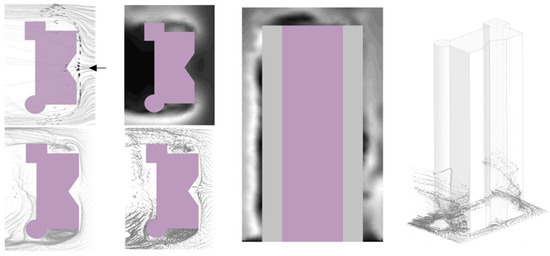
Figure 9.
Rectangle-with-additions (orientation 3)-case wind streamlines and contours and dust-particle pathways (source: the author).
5.1.7. Square Case
The wind velocity contours of this case show that part of the wind streamlines hit the building at the center of its windward surface to have a velocity of zero, forming what is known as the stagnation point (represented in black). The other parts slowly slip on the windward surface due to the friction, reaching out to the building edges to escape the surface with an increasing velocity (represented in white color gradient). This process leaves the two sides and the leeward surface surrounded by motionless air (represented in black) as shown in Figure 10. The dust particles tend to move with the wind streamlines until they start escaping to the spaces that host the motionless air. Existing in high concentrations in those areas, dust will end up accumulating on the building surfaces. In this case, dust particles seem to accumulate only on the sides of the building.
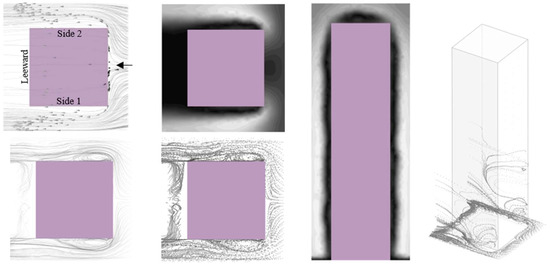
Figure 10.
Square-case wind streamlines and contours and dust-particle pathways (source: the author).
5.1.8. Rotated-Square Case (45°)
The wind velocity contours of this case explain how the wind moves around a building with a rotated-square plan, where a small part of the wind streamlines hit the building corners to have a velocity of zero, forming what is known as the stagnation point (represented in black). The rest of them manage to slip by on the windward surfaces due to the large shear force exerted by the surfaces. Upon reaching the building corners, they escape the surfaces with an increasing velocity (represented in a white color gradient) that is lower than in the previous cases. Thus, a significant black-colored area is left, representing motionless air at the back of the building. The procedure is clearly demonstrated in Figure 11. As for the dust particles, it can be concluded that they tend to move with the wind streamlines until they leave the corners of the building to find their way to the back of the building, where the motionless air exists. Huge vertices are formed, which rise vertically to eventually settle on the leeward surfaces.
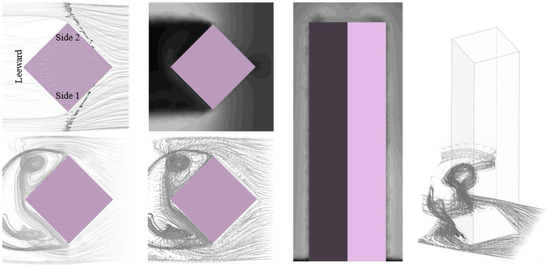
Figure 11.
Rotated-square-case wind streamlines and contours and dust-particle pathways (source: the author).
5.1.9. Square-with-Additions Case
The velocity contours explain how wind moves around a building with a modified-square plan. They show that as soon as the wind hits the building, part of its streamlines hit the center of the curved windward surface to settle there and have zero velocity (represented in black). The remaining parts smoothly slip on the curved surface sides, reaching out to the small straight portions of the surface. Due to the semicircular part, wind streamlines escape the surface with an increasing velocity (represented in a white color gradient) that is relatively lower than the wind velocity of the typical square case. Some surfaces will be surrounded by motionless air (represented in black). Figure 12 illustrates this process in detail. As for the dust particles, it can be concluded that the existence of recessed and projected surfaces in the building design will result in trapping dust particles. Dust particles tend to move with the wind streamlines until they approach the spaces that host vertical columns of motionless air, which in this case, are formed by the recessed and projected surfaces.
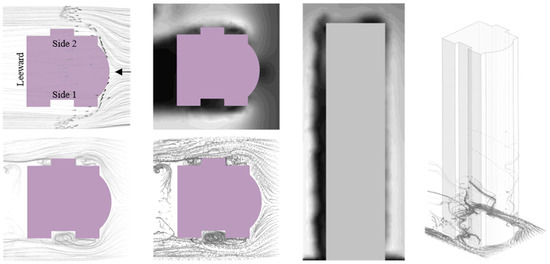
Figure 12.
Square-with-additions-case wind streamlines and contours and dust-particle pathways (source: the author).
Particles escape the streamlines to become trapped in those narrow columns and accumulate on their adjacent surfaces.
5.1.10. Square-with-Additions Case (Orientation 2)
The velocity contours explain how the wind moves around a building with a modified square plan (oriented differently). Part of the wind streamlines hit the building at the center of its projected windward surface to have zero velocity (represented in black). The other parts slip on the rest of the windward surface. Due to the projected surfaces, particles escape the edges with an increasing velocity (represented in white color gradient) that is relatively higher than the velocity in the typical square case. The straight-side surface (side 2) and the leeward surface are thus surrounded by motionless air (represented in black). The procedure is illustrated in Figure 13. As for the dust particles, the corners formed by the projected surface will not allow for dust accumulation in this case. Because the projected surface is in the windward direction, the motionless air columns seem to be very narrow and not able to support dust particles. Therefore, dust particles tend to move with the wind streamlines without accumulating in the dark areas at the building sides due to the high wind velocity at the edges. Instead, the accumulation occurs at the column’s adjacent surfaces. The only escape route for the dust particles will be the area at the back of the building that hosts a compacted motionless air column.
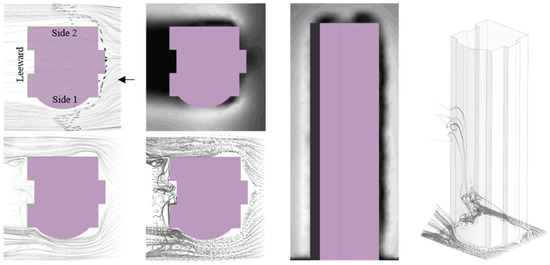
Figure 13.
Square-with-additions (orientation 2)-case wind streamlines and contours and dust-particle pathways (source: the author).
5.1.11. Square-with-Additions Case (Orientation 3)
In this case, the velocity contours show how the wind moves around a building with another modified square plan and another orientation. Part of the wind streamlines hit the building at the center of its windward surface to be trapped in the recessed part with zero velocity (represented in black). The additional parts slip on the windward surface, reaching out to the building edges, to escape the surface with an increasing velocity, similar to the typical square case velocity (represented in a white color gradient). Thus, the straight-side surface and the leeward surface are left with motionless surrounding air (represented in black).
The procedure is clearly demonstrated in Figure 14. As for the dust particles, it can be concluded that this case is quite similar to the typical square case. The use of a recessed surface in the windward direction and a projected surface in the leeward direction helped in accumulating dust.
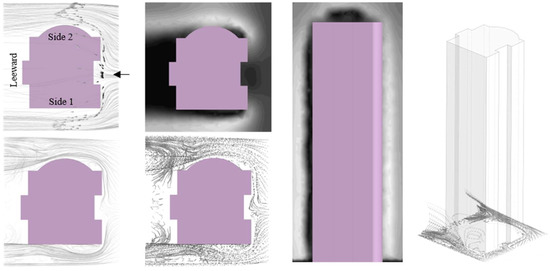
Figure 14.
Square-with-additions (orientation three)-case wind streamlines and contours and dust-particle pathways (source: the author).
Hence, dust particles tend to move with the wind streamlines until they escape to the spaces that host the motionless air at the building’s sides. Existing in high concentrations in those areas, dust will accumulate on the sides’ surfaces.
5.1.12. Triangle Case
For this case, part of the wind streamlines hit the building at the center of its windward surface to have zero velocity (represented in black). Meanwhile, the other parts slowly slip on the windward surface, reaching the building edges to escape the surface with an increasing velocity (represented in a white color gradient). Thus, the back of the building is surrounded by motionless air (represented in black). This is shown in Figure 15, where the dust particles tend to move with the wind streamlines until approaching the backside motionless air. Dust particles eventually escape and form vertically growing vortices that climb on the adjacent surfaces to accumulate on them.
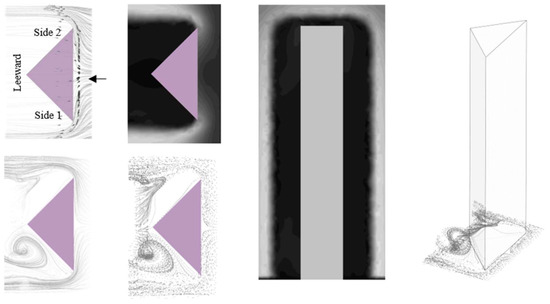
Figure 15.
Triangle-case wind streamlines and contours and dust-particle pathways (source: the author).
5.1.13. Rotated-Triangle Case (180°)
The velocity contour shows how the wind moves around a building with a rotated triangular plan. Part of the wind streamlines hit the building’s corners to have zero velocity (represented in black). The rest of the streamlines slip on the sides’ surfaces to escape them at the edges with an increasing velocity (represented in a white color gradient); the leeward surface is surrounded by motionless air (represented in black). The procedure is clearly demonstrated in Figure 16. The dust particles tend to move with the wind streamlines until they approach the motionless air behind the building, to disperse in that area and settle on its adjacent surface, but in very small amounts that may not be noticeable.
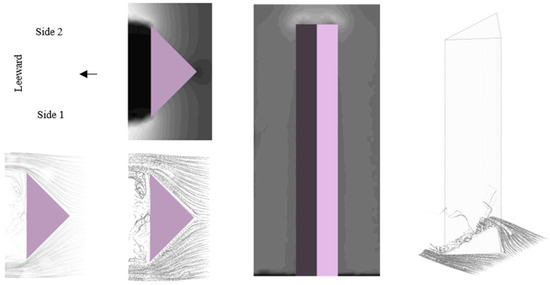
Figure 16.
Rotated-triangle-case wind streamlines and contours and dust-particle pathways (source: the author).
5.1.14. Trapezoid Case
As for the last case, part of the wind streamlines hit the building at the center of its windward surface to have zero velocity (represented in black). Due to the friction, the other parts slowly slip on the windward surface, reaching out to the two edges to escape the side two edge with a higher velocity than the other side’s edge (represented in a white color gradient). Thus, the two sides and the leeward surface are surrounded by motionless air (represented in black). The procedure is clearly demonstrated in Figure 17. It can be concluded that the dust particles tend to move with the wind streamlines until reaching the motionless air areas. However, particles seem to accumulate only on side one’s surface and on the leeward surface. Due to the high wind velocity on side two’s surface, the particles pass by without accumulating.
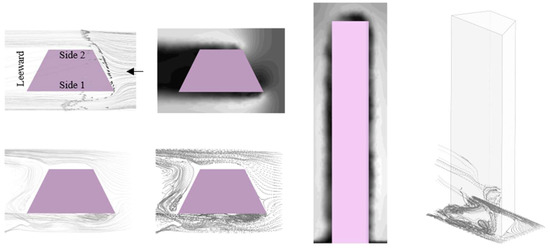
Figure 17.
Trapezoid-case wind streamlines and contours and dust-particle pathways (source: the author).
5.2. Thermal Performance Analysis Results
5.2.1. Sensitivity Analysis of Dust-Particle Diameter and Density
As mentioned previously, the accumulation of dust on a structure’s exterior envelope can impact the overall thermal performance of the structure. The absorptivity of dust is considerably high, thus increasing the surface’s net absorptivity [14]. Consequently, this direct proportionality increases solar heat gain through the dusty exterior walls and roof, raising the demand for cooling loads, especially during the summer season in hot climates. Therefore, it is necessary to examine the link between solar absorptivity and transmittance and accumulated dust. Solar absorptivity can be determined by the average diameter and density of the dust particle [14]. Moreover, the accumulated dust layer was estimated based on the previously mentioned reference. The accumulated dust in g/m2 was calculated then the absorptivity was evaluated according to the accumulated dust for each size of dust particles in μm. The thermal performance for each case was based on the absorptivity value evaluated from the accumulated dust particles of each size in μm Figure 18. As a result, the case with a low-absorptivity value had a high-percentage decrease in the roof conduction (W/m2). A sensitivity test was conducted to assess these criteria. In this context, the diameter of the 14 simulated cases ranged from 4 to 8 μm. Cases with the same diameter are grouped and color-coded as indicated in Figure 18. The results reveal an inverse proportion, as absorptivity decreases with larger dust particles. In contrast, the transmittance increases with the increase in particle size (see Figure 19). Additionally, the impact of the number of dust particles on transmissivity was investigated as a function of dust diameters. It was noticed that particles with a smaller diameter accumulate in larger numbers. Figure 20 shows that simulated cases with 4 μm dust particles amass nearly four times more than those with a diameter of 8 μm. Table 2 shows the minimum, mean, maximum, and accumulated dust in g/m2 for each case.
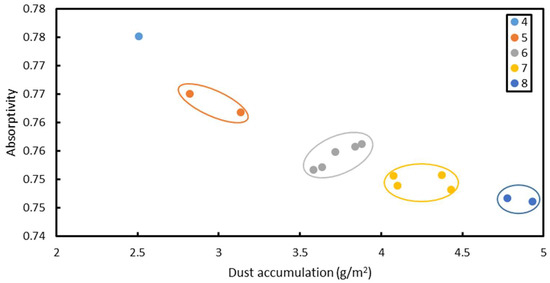
Figure 18.
Effect of dust accumulation on absorptivity as a function of dust diameter.
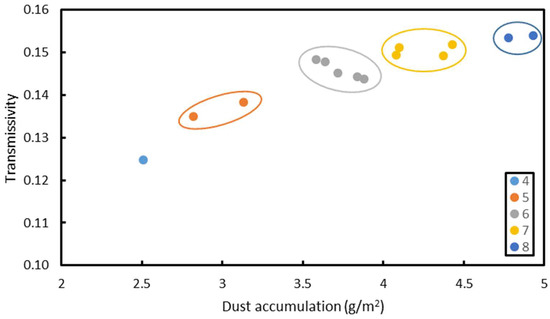
Figure 19.
Effect of dust accumulation on transmissivity as a function of dust diameter.
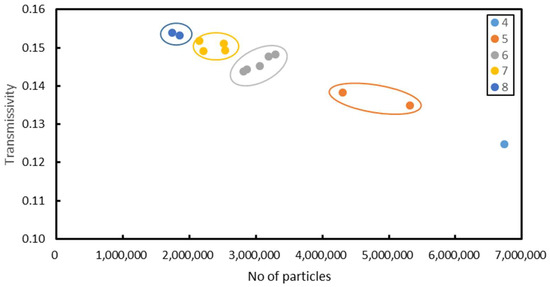
Figure 20.
Effect of particle number on transmissivity as a function of dust diameter.
Table 2.
The minimum, maximum, mean, and accumulated dust for all cases after the simulation.
5.2.2. Thermal Performance of the Simulated Cases
The impact of dust accumulation on the building’s thermal performance was further analyzed according to the building shape of each simulated case. Figure 21 displays the dust absorptivity of the 14 cases. The results reveal that case eight (rotated-rectangle case (45°) had the highest absorptivity. Hence, it is likely to absorb the most solar radiation, increasing the annual cooling load of the structure. On the other hand, the absorptivity of case 14 (trapezoid case) was the lowest, thus performing the best among all cases as the annual cooling load increase is predicted to be the smallest. While a case with a higher absorptivity would perform better during winter, it is important to acknowledge that the annual heat gain during summer has a much greater influence on thermal performance. This is especially significant in hot dry climates. Moreover, the roof’s conduction as a result of dust accumulation was evaluated for each case. The structure’s roof thermal conductivity was analyzed using three varying insulation levels: high, medium, and low. Case eight had the lowest percentage conduction decrease, while case 14 was the most efficient with a decrease of roughly 3.4 percent, as shown in Figure 22. Finally, the annual cooling load due to dust accumulation was assessed, as shown in Figure 23. As expected, case 14 performed the best with results similar to those of cases 1, 5, and 13. This performance reinforces the assumption that the case with the lowest absorptivity allows for the highest decrease in the percentage of the annual cooling by reducing energy consumption by 1.3%.
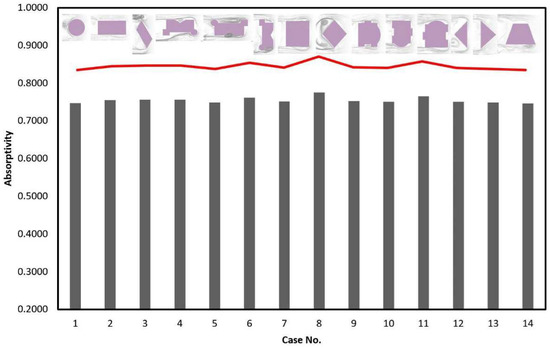
Figure 21.
Absorptivity of all 14 simulated cases.
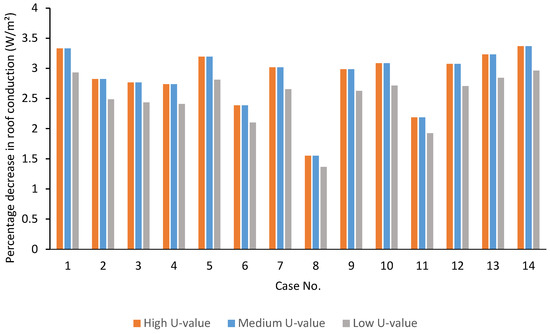
Figure 22.
Percentage decrease in roof conduction of the simulated cases.
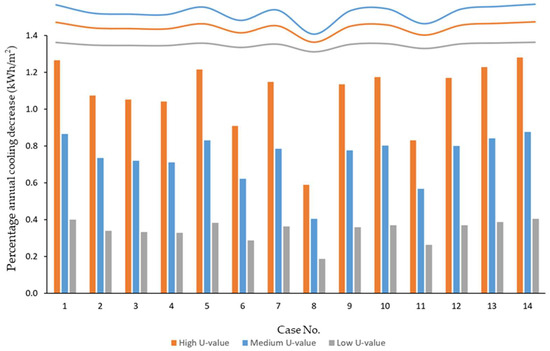
Figure 23.
Percentage annual cooling decrease of the simulated cases.
6. Proposed Design
6.1. Design Guidelines and Shape Development
According to the wind and dust analysis, a set of design guidelines could be determined:
- Dust does not accumulate on the adjacent surfaces of a flowing air stream. On the contrary, it seems to settle on the surfaces of neighboring motionless air.
- Using smooth building forms, such as the circular form, allows wind streamlines to move smoothly around a building. As a result, dust particles cannot find a space with motionless air to run to, and thus, cannot accumulate on the building surfaces.
- Sharp edges in the design work as barriers for wind motion, pushing it away from the building and allowing air (and dust) to settle on the surfaces.
- Wind-stream velocity seems to play an important role in the dust-dispersion process. It is concluded that while dust particles cannot easily escape high-velocity streamlines, it is easier for them to escape low-velocity streamlines. If particles cannot escape the streamlines, they cannot accumulate on surfaces. Hence, increasing the length of the windward surface as well as implementing circular edges in the design would result in increasing the wind velocity.
The use of recessed surfaces seems to be a key element for this research. Those surfaces tend to form motionless air columns away from the wind paths, forming a shelter for the escaping dust particles. As for the dust particles, they start moving in vortices in such areas, to slowly scramble over the surfaces of the building, settling on them, similar to what happens in the case of the rectangle with additions (orientation two case 10). Following the derived outcomes, further geometry manipulation was performed to attain the perfect building shape that succeeds in accumulating dust from the outside and providing a comfortable indoor environment. Accordingly, the most successful case in the earlier stage was modified wall-by-wall and tested after every change to monitor the effect of this change on the dust accumulation process. A plan rotation was then conducted on the successful geometries to test the enhancement that this rotation produced within the accumulation process in each geometry (see Figure 24a,b). At the end of this stage, the geometry that accumulates the most dust was selected.
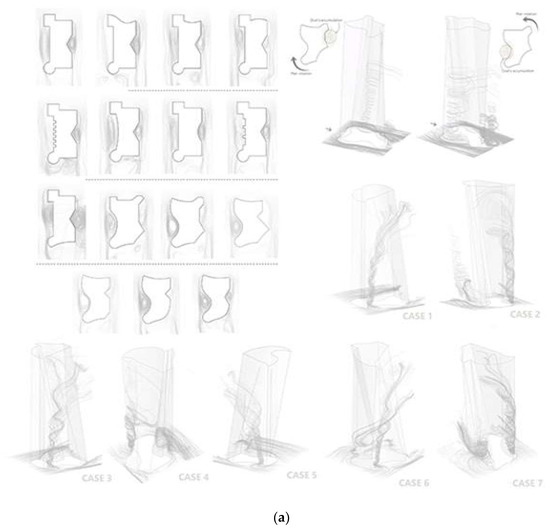
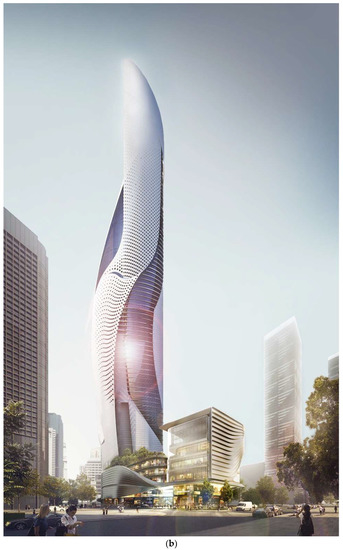
Figure 24.
(a) Adjustment and rotation of plan to improve the dust accumulation (source: the author). (b) Adjustment and rotation of plan to improve the dust accumulation (source: the author).
6.2. Dust Cycle of Proposed Design
As illustrated in Figure 25, step one demonstrates the lower portion of the created geometry that accumulates the dust in two locations of the building. Once the dust starts accumulating and rising in a vortex-like motion, it will end up being trapped in what is known as the dust tube. A dust tube is a cylindrical structure wider at the bottom and narrower at the top. The role of this structure is to trap the accumulated dust and lead it to the dust collecting room. Herein, two dust tubes will be used in this scenario, with their suggested locations indicated by the dashed circles. In addition, one of the dust tubes is shown in the section view in step three. After determining the potential locations of the dust tubes, they were added to the structure in step two, where one of them (the first tube) was added to the building to blend in with the rest of the building’s structure. Meanwhile, the other one (the second tube) was hidden behind a shield-like structure. In step three, dust starts entering the building after being trapped in the top of the dust tube. Air loaded with dust starts performing a pushing force on the door that leads to the dust collecting room, once the room is filled with the dusty air, the door closes, and the filtration process starts. Once the filtration process stops, clean air will leave the building and dust will be collected in small containers which can be changed occasionally. Dust collecting rooms are located on a mechanical floor where the dust can be collected and moved without disturbing the building’s inhabitants. Finally, the concept of biomimicry is applied in which the collected dust is used in planting the balconies of the building and on its roof.
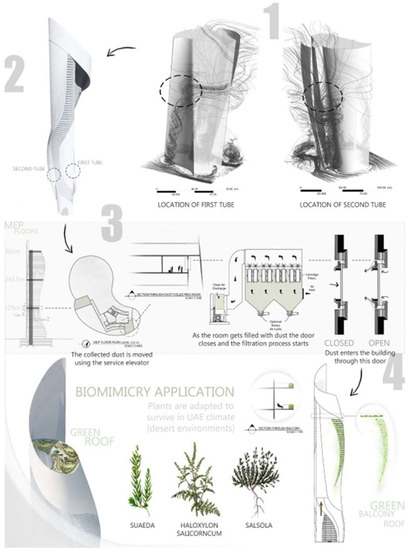
Figure 25.
The cycle that dust goes through once it enters the building (source: the author).
7. Future Potential Projects
Although a single-standing skyscraper that works to clear the air may not make a significant difference, if replicated and implemented effectively, this proposal could be an initial step toward a more significant change. Multiple structures in an area could siphon a substantial amount of dust from the air. Figure 26 shows a top view plan for a portion of Sheikh Zayed road with multiple buildings designed using the dust simulation approach.
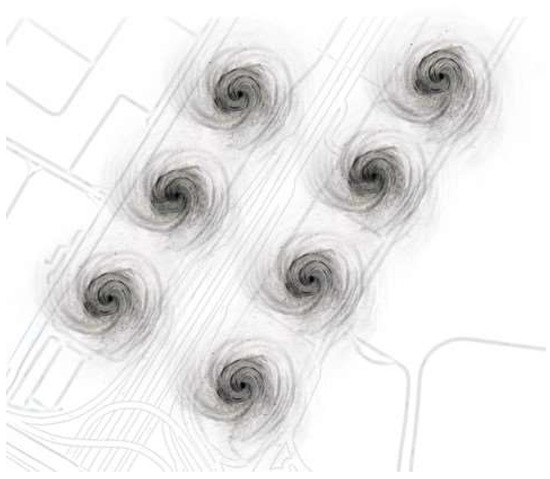
Figure 26.
A small portion of Sheikh Zayed road taken as an example to show the project’s future potentials (source: the author).
8. Conclusions
To conclude, this research aimed at improving the architecture of skyscrapers using the new dust simulation approach. This approach could lead to a new type of skyscraper, a dust-siphoning one, that would have both an engineered and an aesthetic design. The analysis and the simulation studies conducted in this research analyzed 14 cases following different typologies. The study’s findings suggested that the optimal case resulted from the trapezoid shape (Case 14) determined by the simulation results which revealed a 3.4% reduction in roof conduction and a 1.3% reduction in the annual cooling load. The results also highlighted some important guidelines for the primary designing phase, as follows:
- The velocity and direction of the wind should be considered when orienting and designing a building and its elements.
- Projected and recessed surfaces along with the building, especially the lower part of the building, can control where dust would be moving and rising.
- The use of either smooth curved or straight surfaces could either expedite or impede the movement of dust when it hits a building or even when it passes by.
- Sharp edges could be added to a design in an attempt to change the velocity of the dust-loaded wind.
- The correct integration of the right elements in the right positions of a structure enhances the dust-trapping process, as it roughly determines the path that the dust will take along the building’s surfaces.
- The positioning of dust tubes and dust collecting rooms is important to complete the process successfully and to allow for the occurrence of a complete dust cycle.
- Dust accumulation can impact the thermal performance and the annual cooling load of the building.
Creating and developing buildings according to the above-mentioned design guidelines will eventually lead to accomplishing the goal of this study. Furthermore, the use of this biomimetic design approach in the later stage leads to making the resulting structure a sustainable one that imitates the natural process of wind pollination.
Author Contributions
Conceptualization, E.S.M., T.S., T.M., D.A.Q. and S.H.; methodology, E.S.M., T.S. and D.A.Q.; software, T.S. and D.A.Q.; validation, M.A.A., A.H.A.-A. and A.G.O.; formal analysis, M.A.A., A.H.A.-A. and A.G.O.; investigation, T.S., D.A.Q. and S.H.; resources, E.S.M., D.A.Q. and S.H.; data curation, E.S.M., T.S. and R.H.; writing—original draft preparation, E.S.M. and D.A.Q.; writing—review and editing, D.A.Q. and R.H.; visualization, D.A.Q. and S.H.; supervision, T.S., M.A.A., A.H.A.-A. and A.G.O.; project administration, E.S.M., T.S. and T.M.; funding acquisition, E.S.M., T.S. and T.M. All authors have read and agreed to the published version of the manuscript.
Funding
This research received no external funding.
Institutional Review Board Statement
Not applicable.
Informed Consent Statement
Not applicable.
Data Availability Statement
Not applicable.
Acknowledgments
The authors would like to thank the University of Sharjah and Hokkaido University for supporting this research.
Conflicts of Interest
The authors declare no conflict of interest.
Nomenclature
| Symbol | Description | Symbol | Description |
| Static pressure | Dust velocity | ||
| Gravitational body force | Air density | ||
| External body force | Dust density | ||
| Stress tensor | Additional force | ||
| Molecular viscosity | Dust-particle relaxation time | ||
| Unit tensor | Dust-particle diameter | ||
| Dust mass | Drag coefficient | ||
| Fluid phase velocity (air) | Re | Reynolds number |
References
- Ali, M.; Aksamija, A. Toward a better urban life: Integration of cities and tall buildings. In Proceedings of the 4th Architectural Conference on the High-Rise, Amman, Jordan, 9–11 June 2008. [Google Scholar] [CrossRef]
- Helsley, R.W.; Strange, W.C. A game-theoretic analysis of skyscrapers. J. Urban Econ. 2008, 64, 49–64. [Google Scholar] [CrossRef]
- Gradus, Y. Desert architecture—The architecture of extreme. In Desert Development: Man and Technology in Sparselands; Springer: Berlin, Germany, 2012; pp. 81–92. [Google Scholar]
- Baker, W.F.; Korista, D.S.; Novak, L.C. Burj Dubai: Engineering the world’s tallest building. Struct. Des. Tall Spec. Build. 2007, 16, 361–375. [Google Scholar] [CrossRef]
- Hyslop, N.P. Impaired visibility: The air pollution people see. Atmos. Environ. 2009, 43, 182–195. [Google Scholar] [CrossRef]
- Mushtaha, E.S.; Enai, M.; Mori, T. Sustainable Design for the Residences in Gaza City. J. Asian Archit. Build. Eng. 2005, 4, 271–278. [Google Scholar] [CrossRef]
- Mushtaha, E.; Salameh, T.; Kharrufa, S.; Mori, T.; Aldawoud, A.; Hamad, R.; Nemer, T. The impact of passive design strategies on cooling loads of buildings in temperate climate. Case Stud. Therm. Eng. 2021, 28, 101588. [Google Scholar] [CrossRef]
- Aldawoud, A.; Salameh, T.; Kim, Y.K. Double skin façade: Energy performance in the United Arab Emirates. Energy Sources Part B Econ. Plan. Policy 2021, 16, 387–405. [Google Scholar] [CrossRef]
- Ali, M.M.; Al-Kodmany, K. Tall Buildings and Urban Habitat of the 21st Century: A Global Perspective. Buildings 2012, 2, 384–423. [Google Scholar] [CrossRef]
- Alarabiya News. ‘Avoid Driving’, UAE Residents Warned as Dust Storms Smother Roads. 2022. Available online: https://english.alarabiya.net/News/gulf/2022/08/14/-Avoid-driving-UAE-residents-warned-as-dust-storms-smother-roads (accessed on 2 September 2022).
- Salameh, T.; Assad, M.E.H.; Tawalbeh, M.; Ghenai, C.; Merabet, A.; Öztop, H.F. Analysis of cooling load on commercial building in UAE climate using building integrated photovoltaic façade system. Sol. Energy 2020, 199, 617–629. [Google Scholar] [CrossRef]
- World Health Organization. Dust: Definitions and concepts. In Hazard Prevention and Control in the Work Environment: Airborne Dust: Prevention and Control Exchange (PACE); World Health Organization: Geneva, Switzerland, 1999; pp. 1–2. [Google Scholar]
- Salamah, T.; Ramahi, A.; Alamara, K.; Juaidi, A.; Abdallah, R.; Abdelkareem, M.A.; Amer, E.-C.; Olabi, A.G. Effect of dust and methods of cleaning on the performance of solar PV module for different climate regions: Comprehensive review. Sci. Total Environ. 2022, 827, 154050. [Google Scholar] [CrossRef] [PubMed]
- Roumpakias, E.; Stamatelos, T. Surface Dust and Aerosol Effects on the Performance of Grid-Connected Photovoltaic Systems. Sustainability 2020, 12, 569. [Google Scholar] [CrossRef]
- Al-Hasan, A. A new correlation for direct beam solar radiation received by photovoltaic panel with sand dust accumulated on its surface. Sol. Energy 1998, 63, 323–333. [Google Scholar] [CrossRef]
- Saber, H.; Hajiah, A.; Alshehri, S.; Hussain, H. Investigating the Effect of Dust Accumulation on the Solar Reflectivity of Coating Materials for Cool Roof Applications. Energies 2021, 14, 445. [Google Scholar] [CrossRef]
- Algarni, S.; Nutter, D. Influence of dust accumulation on building roof thermal performance and radiant heat gain in hot-dry climates. Energy Build. 2015, 104, 181–190. [Google Scholar] [CrossRef]
- Setoguchi, T. New urban design approaches with snow simulations for cold and snowy cities. J. Asian Archit. Build. Eng. 2008, 7, 93–99. [Google Scholar] [CrossRef]
- Irwin, P. Wind tunnel testing of high-rise buildings. In Wind Tunnel Testing of High-Rise Buildings; Taylor Francis: Abingdon, UK, 2013; p. 20. [Google Scholar]
- ElDin, N.N.; Abdou, A.; ElGawad, I.A. Biomimetic potentials for building envelope adaptation in Egypt. Procedia Environ. Sci. 2016, 34, 375–386. [Google Scholar] [CrossRef]
- Mushtaha, E.; Al-Zwaylif, S.; Merabti, F.; Hanane, I. Border vacuum: A study of walkability, liveability and vibrancy around Dubai mall station. Proc. Inst. Civ. Eng. Urban Des. Plan. 2018, 171, 187–201. [Google Scholar] [CrossRef]
- Mushtaha, E.; Alsyouf, I.; Al Labadi, L.; Hamad, R.; Khatib, N.; Al Mutawa, M. Application of AHP and a mathematical index to estimate livability in tourist districts: The case of Al Qasba in Sharjah. Front. Archit. Res. 2020, 9, 872–889. [Google Scholar] [CrossRef]
- Ansys Fluent 12.0 Theory Guide—16.2.1 Approaches to Multiphase Modeling. Available online: https://www.afs.enea.it/project/neptunius/docs/fluent/html/th/node293.htm#sec-mphase-approaches (accessed on 12 May 2022).
- Morsi, S.A.; Alexander, A.J. An Investigation of Particle Trajectories in Two-Phase Flow Systems. J. Fluid Mech. 1972, 55, 193–208. [Google Scholar] [CrossRef]
- Environment Statistics 2016. 2017. Available online: https://www.scad.gov.ae/Release%20Documents/51211966-dd7b-4e04-9db4-12f746fdf014_AgEnv_ENR_Publication_Annual_Annual_2016_v9.pdf (accessed on 12 May 2022).


Publisher’s Note: MDPI stays neutral with regard to jurisdictional claims in published maps and institutional affiliations. |
© 2022 by the authors. Licensee MDPI, Basel, Switzerland. This article is an open access article distributed under the terms and conditions of the Creative Commons Attribution (CC BY) license (https://creativecommons.org/licenses/by/4.0/).