Article

Mixture Optimization of Sustainable Concrete with Silica Fume Considering CO2 Emissions and Cost

1
Department of Integrated Energy and Infra System, Kangwon National University, Chuncheon-si 24341, Korea
2
Energy and Environment Division, Korean Institute of Ceramic Engineering and Technology, Jinju-si 52851, Korea
3
Department of Architectural Engineering, Kangwon National University, Chuncheon-si 24341, Korea
*
Author to whom correspondence should be addressed.
Buildings 2022, 12(10), 1580; https://doi.org/10.3390/buildings12101580
Submission received: 7 September 2022 / Revised: 27 September 2022 / Accepted: 28 September 2022 / Published: 1 October 2022
(This article belongs to the Special Issue CO2 Neutrality of Sustainable Concrete Materials)

Abstract

:
This research presents a framework for the mixture design of sustainable SF-modified concrete. The design strength at 28 days was scaled to different values (e.g., 30, 40, 50, and 60 MPa). CO2 emissions and cost were chosen as the design variables to optimize. Strength, slump, and carbonation durability with global warming were applied as constraints of optimal design. The analysis revealed that, for low-CO2 concrete, when the design strength was 30 or 40 MPa, to fulfill the requirement of carbonation, the actual concrete strength ought to be 45.39 MPa, which was much greater than the design strength. Carbonation did not affect the mixtures scaled to a high design strength (50 and 60 MPa). The SF/binder ratio was maximum for low-CO2 concrete. Furthermore, for low-total-cost concrete, when the design strength was 30 MPa, the actual strength was 31.28 MPa after considering carbonation. Moreover, when considering global warming, the actual strength should be 33.44 MPa. The SF/binder ratio was minimum for low-cost concrete. Lastly, for low-material-cost concrete, the design was equivalent to the low-total-cost concrete, along with much lower CO2 emissions. In summary, the suggested technique is valuable for the design of sustainable SF-modified concrete with low CO2 and low cost.

1. Introduction

Different waste materials can be used in the production of low-cost concrete with acceptable mechanical properties [1]. Silica fume (SF) is a byproduct of the silicon and ferrosilicon production industry. Silica fume is a highly reactive pozzolanic material which has been increasingly used in concrete production. Concrete containing silica fume shows various benefits, such as low bleeding, high strength, low drying shrinkage, and good resistance to chloride penetration [2].
Many experimental studies have investigated the workability, hydration, strength, and durability properties of SF-modified concrete. Ahmad et al. [3] found that, when the replacement level of silica fume was higher than 4%, as the silica fume content increased, the slump flow of concrete decreased, whereas the compressive strength, tensile strength, and modulus of rupture increased. Abdulkareem et al. [4] proposed that KOH can improve the early-age compressive strength of SF-modified high-strength concrete. Wang et al. [5] found that silica fume can improve the abrasion resistance and compressive strength of concrete due to the pozzolanic reaction of silica fume. Wang et al. [6] found that SF-modified low-heat cement was suitable for use in mass concrete because of its adequate strength and low hydration heat. Lu et al. [7] established a homogenized silica fume/concrete matrix and evaluated strength using the fractal dimension of concrete. Bajja et al. [8] proposed that silica fume can refine concrete pores and decrease the diffusion coefficient. Savija and Lukovic [9], and Papadakis [10] found that silica fume can increase the carbonation depth of concrete.
Mixture design is an important research topic for blended silica fume/concrete. Compared with fundamental experimental studies investigating the properties of SF-modified concrete, those focusing on mixture design are relatively limited. Akalin [11] established an optimal design of composite concrete using the statistical mixture design method considering the setting time, strength, and cost. Khaloo et al. [12] and Ghafari et al. [13] generated a mixture design of SF-modified ultrahigh-strength concrete considering strength and workability. Naseri et al. [14] developed a mixture design of sustainable concrete considering strength, cost, and environmental impacts. Golafshani and Behnood [15] evaluated the strength of blended silica fume/concrete using biogeography-based programming, and they determined the optimal mix design of concrete with varying strengths using constrained biogeography-based optimization. Zhang et al. [16] generated a mixture design of SF-modified concrete using machine learning and a metaheuristic algorithm considering mechanical, cost, and environmental aspects.
Despite the number of studies determining the optimal mixture of SF-modified concrete, some flaws can be identified. First, most previous studies focused on strength and workability. Because adding SF impairs the carbonation resistance of concrete, the carbonation service life may be the dominant constraint factor of SF-modified concrete [10,17,18]; yet, this was not previously considered. Second, these studies mainly evaluated the material cost or CO2 emissions of SF-modified concrete. Whereas SF presents a much greater cost than cement, its CO2 emissions are considerably lower [19]. Thus, in terms of SF-modified concrete, the compositions yielding low-CO2 concrete and low-cost concrete might differ [20]. Previous studies did not distinguish between low-cost concrete and low-CO2 concrete. Third, global warming is an urgent problem which can accelerate carbonation and affect concrete mixture design [21,22,23]; however, this was not considered in previous mixture design approaches.
To address the flaws in previous studies, the aim of this research was to present a framework for the mixture design of sustainable SF-modified concrete. The scope of this study was SF-modified concrete with low CO2 emissions or low cost. The genetic algorithm was used to identify optimal mixtures. Concrete strength, concrete workability (slump), and carbonation service life with global warming were applied as constraints of the genetic algorithm. Five design cases were considered: low-CO2 concrete without carbonation, low-CO2 concrete with carbonation, low-material-cost concrete with carbonation, low-total-cost concrete with carbonation, and low-total-cost concrete with global warming. In line with the analysis of design cases, the significance of carbonation and global warming was highlighted, and the distinction between low-cost concrete and low-CO2 concrete was clarified. Following the introduction, the remainder of this study is structured as follows: Section 2 and Section 3 present the materials and methods and the results and discussion, respectively, while conclusions are drawn in Section 4.

2. Materials and Methods

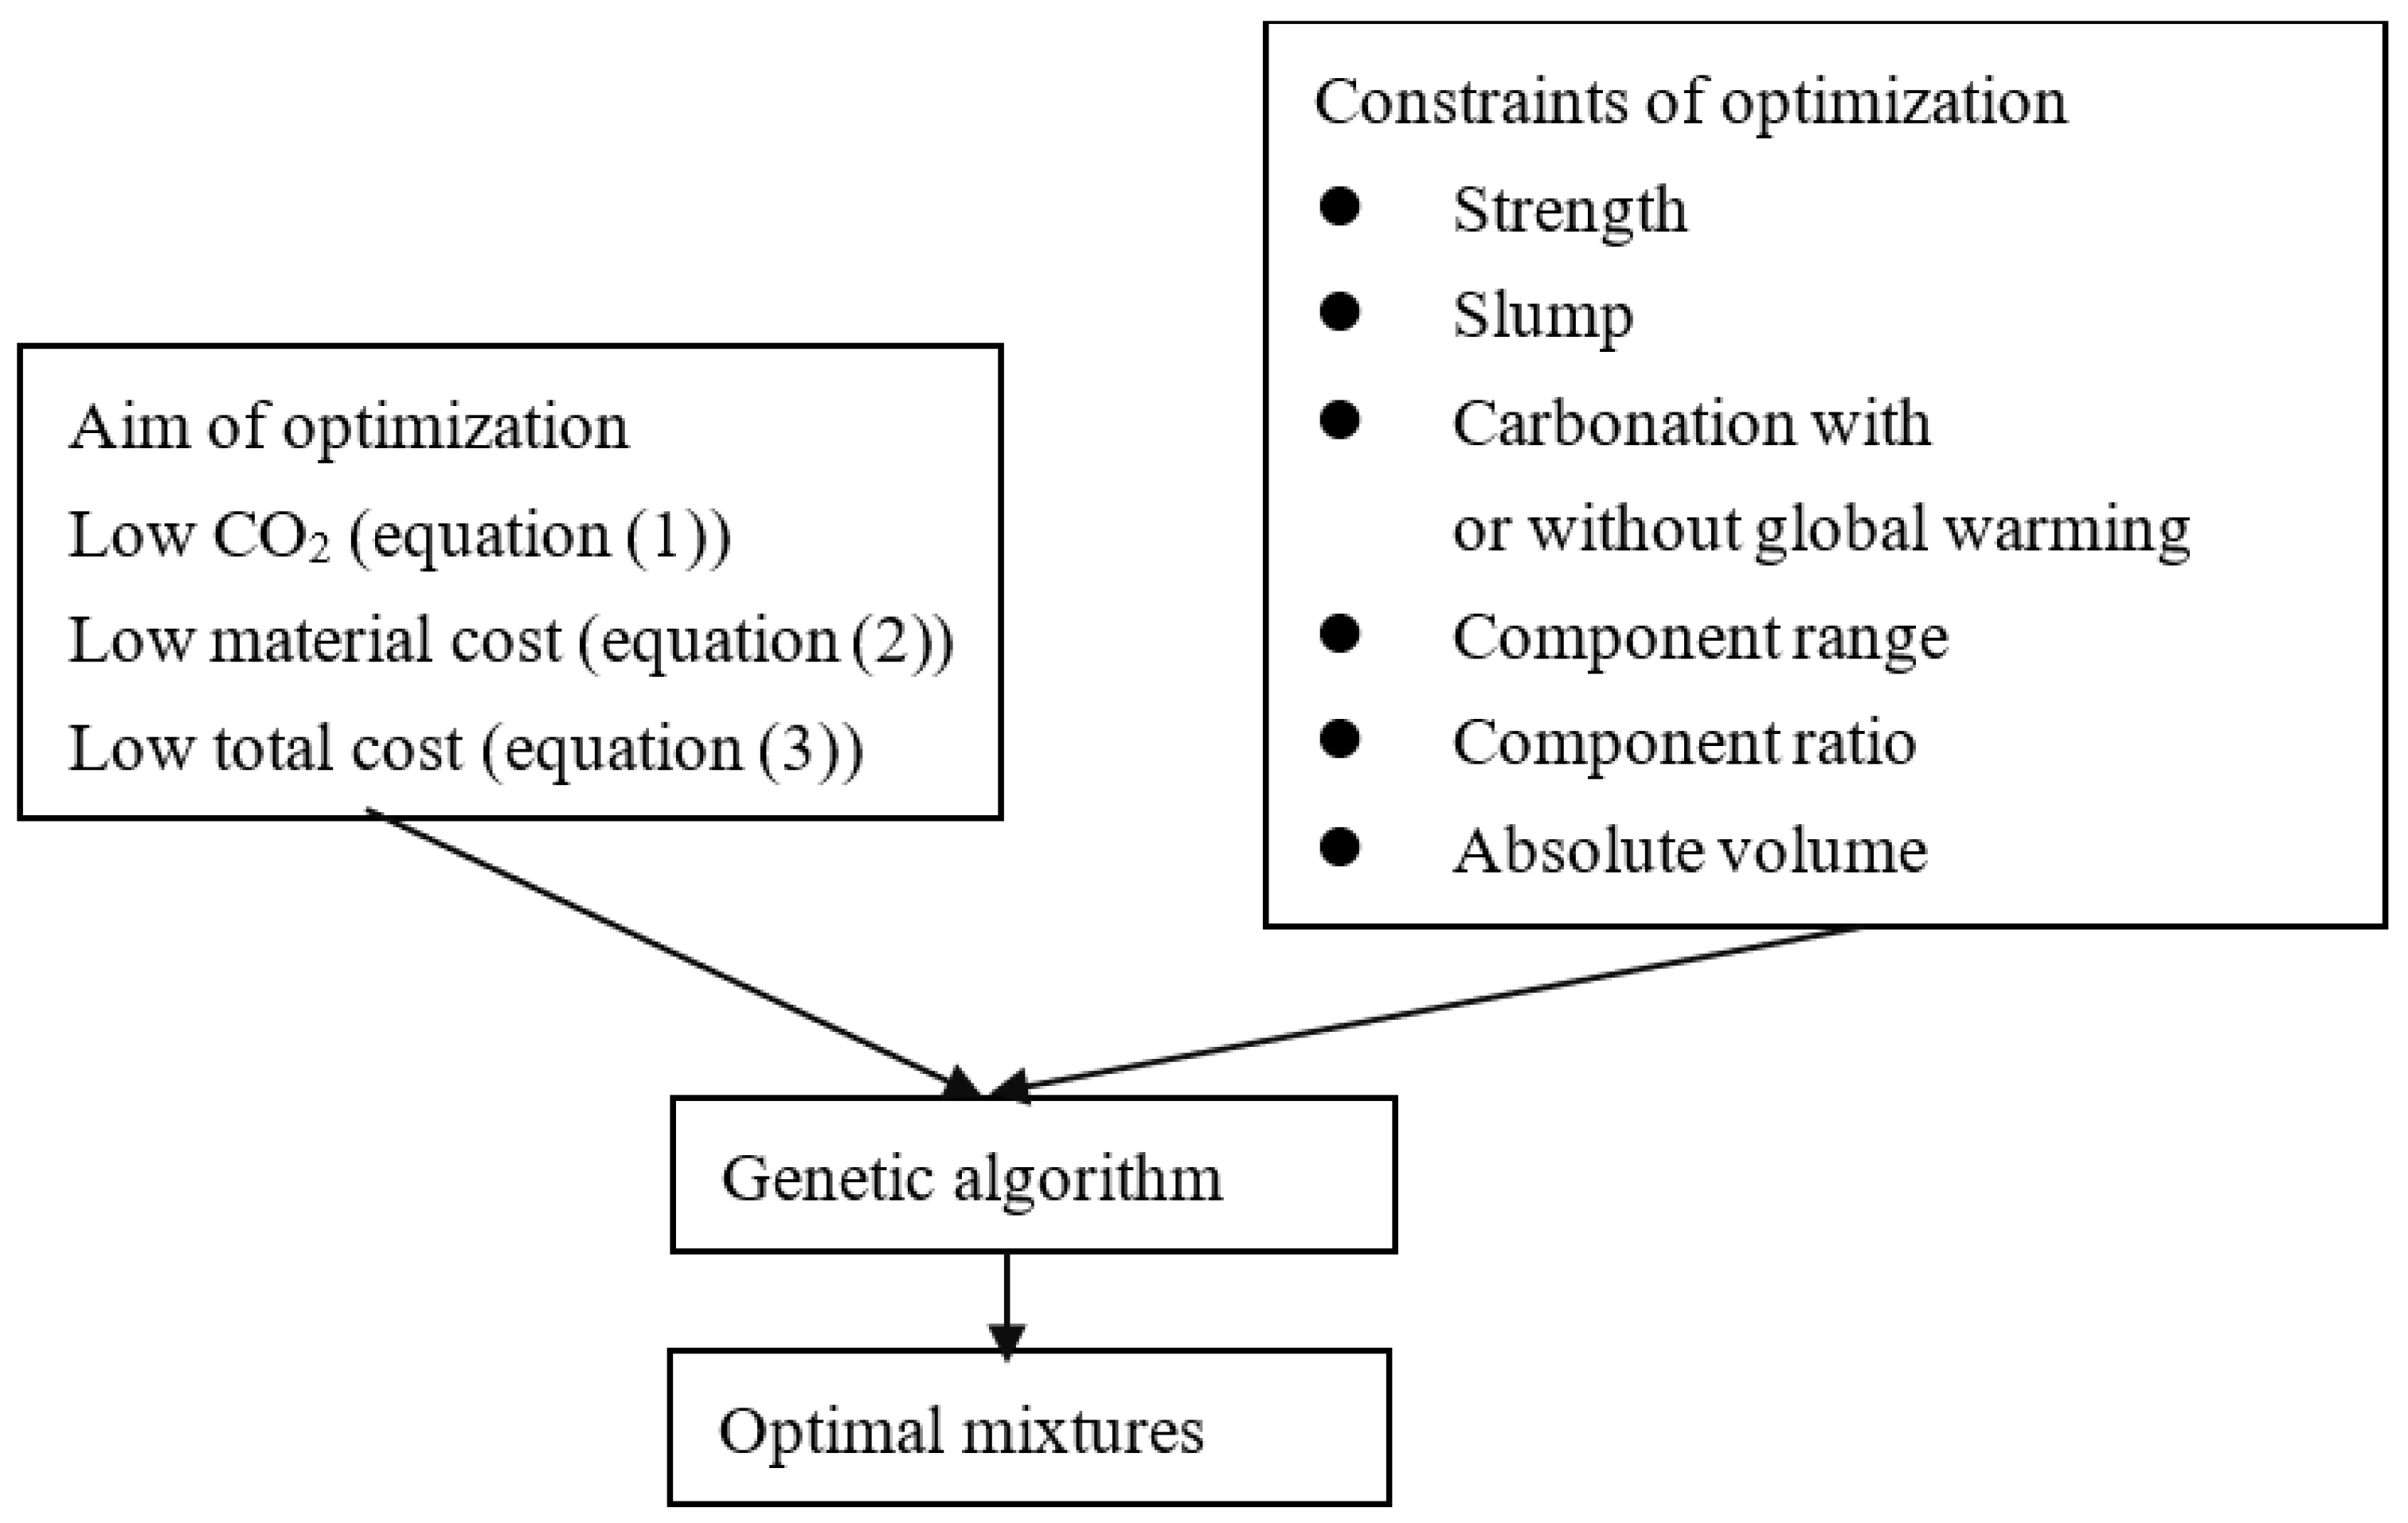
2.1. Aim of Mixture Design

The sustainability of concrete features many aspects, such as CO2 emissions and material cost. The purpose of optimal mixture design depends upon the selected index of sustainability. The CO2 emissions of SF-modified concrete can be calculated using the following formula:
M CO 2 = CO 2 - C C + CO 2 - SF SF + CO 2 - W W + CO 2 - S S + CO 2 - CA CA + CO 2 - SP SP ,
where M CO 2 represents the CO2 emissions of concrete, CO 2 - C , CO 2 - SF , CO 2 - W , CO 2 - S , CO 2 - CA , and CO 2 - SP indicate the CO2 emissions from 1 kg of cement, SF, water, sand, coarse aggregate, and superplasticizer, respectively (shown in Table 1) [24], and C , SF , W , S , CA , and SP denote the masses of cement, SF, water, sand, coarse aggregate, and superplasticizer in concrete, respectively.
The CO2 emission of concrete consists of different phases, such as material phase, production phase, and transportation phase. Compared with other two phases, the CO2 emission from the material phase is much higher [25]. Hence, in this study, we only consider CO2 emission from the material phase. In future work, the CO2 emission from the production phase and transportation phase should be considered for improvement.
Similarly, the material cost of SF-modified concrete can be calculated using the following formula:
COS T M = Pr C C + Pr SF SF + Pr W W + Pr S S + Pr CA CA + Pr SP SP ,
where COS T M is the material cost of concrete, and Pr C , Pr SF , Pr W , Pr S , Pr CA , and Pr SP denote the prices of 1 kg of cement, SF, water, sand, coarse aggregate, and superplasticizer, respectively (shown in Table 1) [19,26].
CO2 emission cost can be established as a function of the mass of CO2 emissions multiplied by the unit cost of CO2. In Table 1, the values of CO2 emission are from [19,24]. The CO2 emission of cement mainly comes from two sources: CO2 emission from calcination of limestone, and CO2 emission from heating of kiln. The CO2 emission of water, silica fume, aggregate, and superplasticizer is from [19,24] considering life cycle assessments, such as extractions of resources, material productions, product manufacture, use, and end-of-life phase. Furthermore, the total cost can be established as the sum of the material cost and CO2 emission cost. Thus, the total cost can be calculated using the following formula:
COS T = COS T M + COS T CO 2 = COS T M + Pr CO 2 M CO 2 ,
where COS T and COS T CO 2 represent the total cost and CO2 emission cost, respectively, and Pr CO 2 is the unit price of CO2 ( Pr CO 2 = 862.897 TWD/ton) [20].

2.2. Constraints of Mixture Design

(1)
The mixture design of concrete is subject to numerous constraints, e.g., the component range of concrete, ratio among concrete components, strength, slump, absolute volume, and carbonation durability [27].
(2)
The component range of concrete positions the mass of concrete components within an upper mass boundary and lower mass boundary, expressed as follows [27]:
lower   mass component   mass upper   mass ,
where the lower mass and upper mass represent the lower and upper mass boundaries of concrete components, respectively, as shown in Table 2 [27].
(3)
The ratio of concrete components, e.g., water/binder ratio, sand/aggregate ratio, SF/binder ratio, water/solid ratio, and aggregate/binder ratio should also be positioned within upper and lower boundaries, expressed as follows:
lower   ratio component   ratio upper   ratio ,
where lower ratio and upper ratio represent the lower and upper ratio boundaries of concrete components, respectively, as shown in Table 3 [27].
(4)
The strength constraint ensures that the actual strength exceeds the projected strength, expressed as follows:
f c ( t ) f cr ( t ) ,
where f c is the actual strength, and f cr is the design strength. Furthermore, the 28-day strength of SF-modified concrete can be calculated using the following formula [2,18,28,29]:
f c = 11.145 ( W / ( C + 3.0 SF ) ) 1.528 ,
where 3.0 is the strength efficiency factor of SF [2,18,28,29]. Thus, the addition of SF can improve concrete strength. It should be noted that some other parameters such as chemical content, mineralogical composition, specific gravity, particle size, or surface area of silica fume, may be relevant in the design of the mixture of concrete. In future studies, these parameters should be considered to improve the performance evaluation model.
(5)
The slump constraint ensures that the actual slump exceeds the projected slump, expressed as follows for SF-modified concrete:
Slump Slump r ,
where Slump and Slump r are the actual slump and design slump, respectively. Moreover, slump can be calculated using the following formula [29,30,31]:
slump = 209.27 W C + SF + 1.34 W 325.1 S S + CA 69.28 SF C + SF + 1.29 SP + 63.3
Equation (9) shows that an increase in water/binder ratio, water content, and superplasticizer content leads to an increase in slump, whereas an increase in SF/binder ratio and sand/aggregate ratio leads to a decrease in concrete slump.
The superplasticizer content can be calculated using the following formula [29,30,31]:
SP = ( 9.20 7.74 W C + SF ) ( 1 + 6.3 SF C + SF ) .
Equation (10) shows that an increase in water/binder ratio or a decrease in SF/binder ratio leads to a decrease in superplasticizer content.
(6)
The absolute volume constraint denotes that the total volume of individual concrete components ought to be 1 m3, expressed as follows [26,27]:
W ρ W + C ρ C + SF ρ SF + CA ρ CA + S ρ S + SP ρ SP + V air = 1 ,
where ρ W , ρ C , ρ SF , ρ CA , ρ S , and ρ SP are the densities of water, cement, SF, coarse aggregate, sand, and superplasticizer, respectively, and V air is the volume of entrapped air in concrete.
(7)
For SF-modified concrete, the carbonation depth increases with SF content. Hence, carbonation durability may limit the use of SF in the concrete industry. This can be expressed as follows:
x c ( t ) CV ,
where x c ( t ) is the concrete carbonation depth, and CV is the cover depth of concrete.
The carbonation depth of SF-modified concrete can be established in line with the efficiency factor of carbonation, which can be calculated using the following formula [18]:
  x c = 2 D [ CO 2 ] 0 t 0.218 ( C + 0.3 SF ) α H ,
D = 6.1 10 6 ( [ W 0.267 ( C + 0.30 SF ) α H ] / 1000 C + 0.30 SF ρ c + W ρ w ) 3 ( 1 RH 100 ) 2.2 exp [ β ( 1 T ref 1 T ) ] ,
where [ CO 2 ] 0 is the CO2 concentration, t is time, D is the CO2 diffusivity, α H is the degree of hydration ( α H = min ( ( W C + 0.3 SF ) 0.4 , 1 ) ) [22,23], RH is the relative humidity of the environment, T ref is the reference temperature ( T ref = 293 K), T is the temperature of the environment, and β is the temperature sensitivity coefficient of CO2 diffusion ( β = 4300) [22,23]. In Equations (13) and (14), [ CO 2 ] 0 , RH , and T represent environmental factors. The denominator of Equation (13) ( 0.218 ( C + 0.3 SF ) α H ) denotes the content of carbonizable substances. ( [ W 0.267 ( C + 0.30 SF ) α H ] / 1000 C + 0.30 SF ρ c + W ρ w ) in Equation (14) is an expression of concrete porosity. Hence, the diffusivity D is related to both concrete material properties and the exposure environment. Additionally, Equations (13) and (14) show that increases in CO2 concentration and temperature lead to an increase in the carbonation depth of concrete. It is worth noting that global warming leads to an increase in CO2 concentration and temperature.
SF leads to a reduction in heat of hydration, while the compressive strength of concrete for 90 or 360 days will be even greater in comparison with ordinary concrete. The performance evaluation model for SF blended concrete does not consider hydration heat and long-term (90 or 360 days) strength. In future work, these points should be considered to expand the functions of proposed methods. Moreover, the tests of CO2 emissions and concrete performance, such as CO2 emissions of concrete components, strength test, and carbonation depth test, should be performed to validate the used equations.

2.3. Genetic Algorithm

Mixture design allows establishing the individual masses of concrete components (e.g., cement, SF, water, sand, stone, and superplasticizer) that can achieve the design goal while fulfilling the various constraints [32,33,34]. These individual component variables can be determined using numerical methods, e.g., the genetic algorithm. The genetic algorithm is a widely used global optimization method. Drawing on the theory of biological evolution, the problem to be solved by the genetic algorithm is simulated as a process of biological evolution. The next-generation solutions are generated through duplication, crossing, mutation, and other operations, whereby the solutions with a low fitness function are gradually eliminated and those with a high fitness function are selected. Accordingly, after N generations of evolution, it is very likely that only individuals with a high fitness function will evolve [30]. The global optimization toolbox in MATLAB (Mathworks, Natick, MA, USA) may be used to determine the optimal mixtures.
The flowchart of the genetic algorithm is presented in Figure 1. The goal was to optimize CO2 emissions, material cost, or total cost. The constraints of optimization considered were compressive strength, slump, carbonation, component range, component ratio, and absolute volume. After inputting the goal and constraints, the optimal mixtures for the design cases were determined.

3. Results and Discussion

This section outlines illustrated design cases with various design strengths. The 28-day strengths were set as 30, 40, 50, and 60 MPa, whereby the first two can be considered ordinary-strength concrete, while the last two can be considered high-strength concrete. The required slump was set as 180 mm. According to the design code [35], the cover depth was set as 25 mm. The environmental temperature was set as 20 °C. The relative humidity of the atmosphere was set as 0.60. The CO2 concentration was set as 0.036%, with exposure starting in the year 2000. The service life was assumed to be half a century. The proportion of entrapped air content was set as 2%.
As presented in Table 4, five design cases were considered: low-CO2 concrete without carbonation, low-CO2 concrete with carbonation, low-material-cost concrete with carbonation, low-total-cost concrete with carbonation, and low-total-cost concrete with global warming and carbonation.
As outlined in Table 5, cases 1 and 2 allowed clarifying the effect of carbonation durability on mixture design, cases 2 and 3 allowed distinguishing between low-CO2 concrete and low-material-cost concrete, cases 3 and 4 allowed distinguishing between low-material-cost concrete and low-total-cost concrete, and cases 4 and 5 allowed clarifying the effect of global warming on mixture design. Furthermore, the comparison of strength levels ranging from 30 to 60 MPa enabled us to determine the effect of design strength on optimal design.

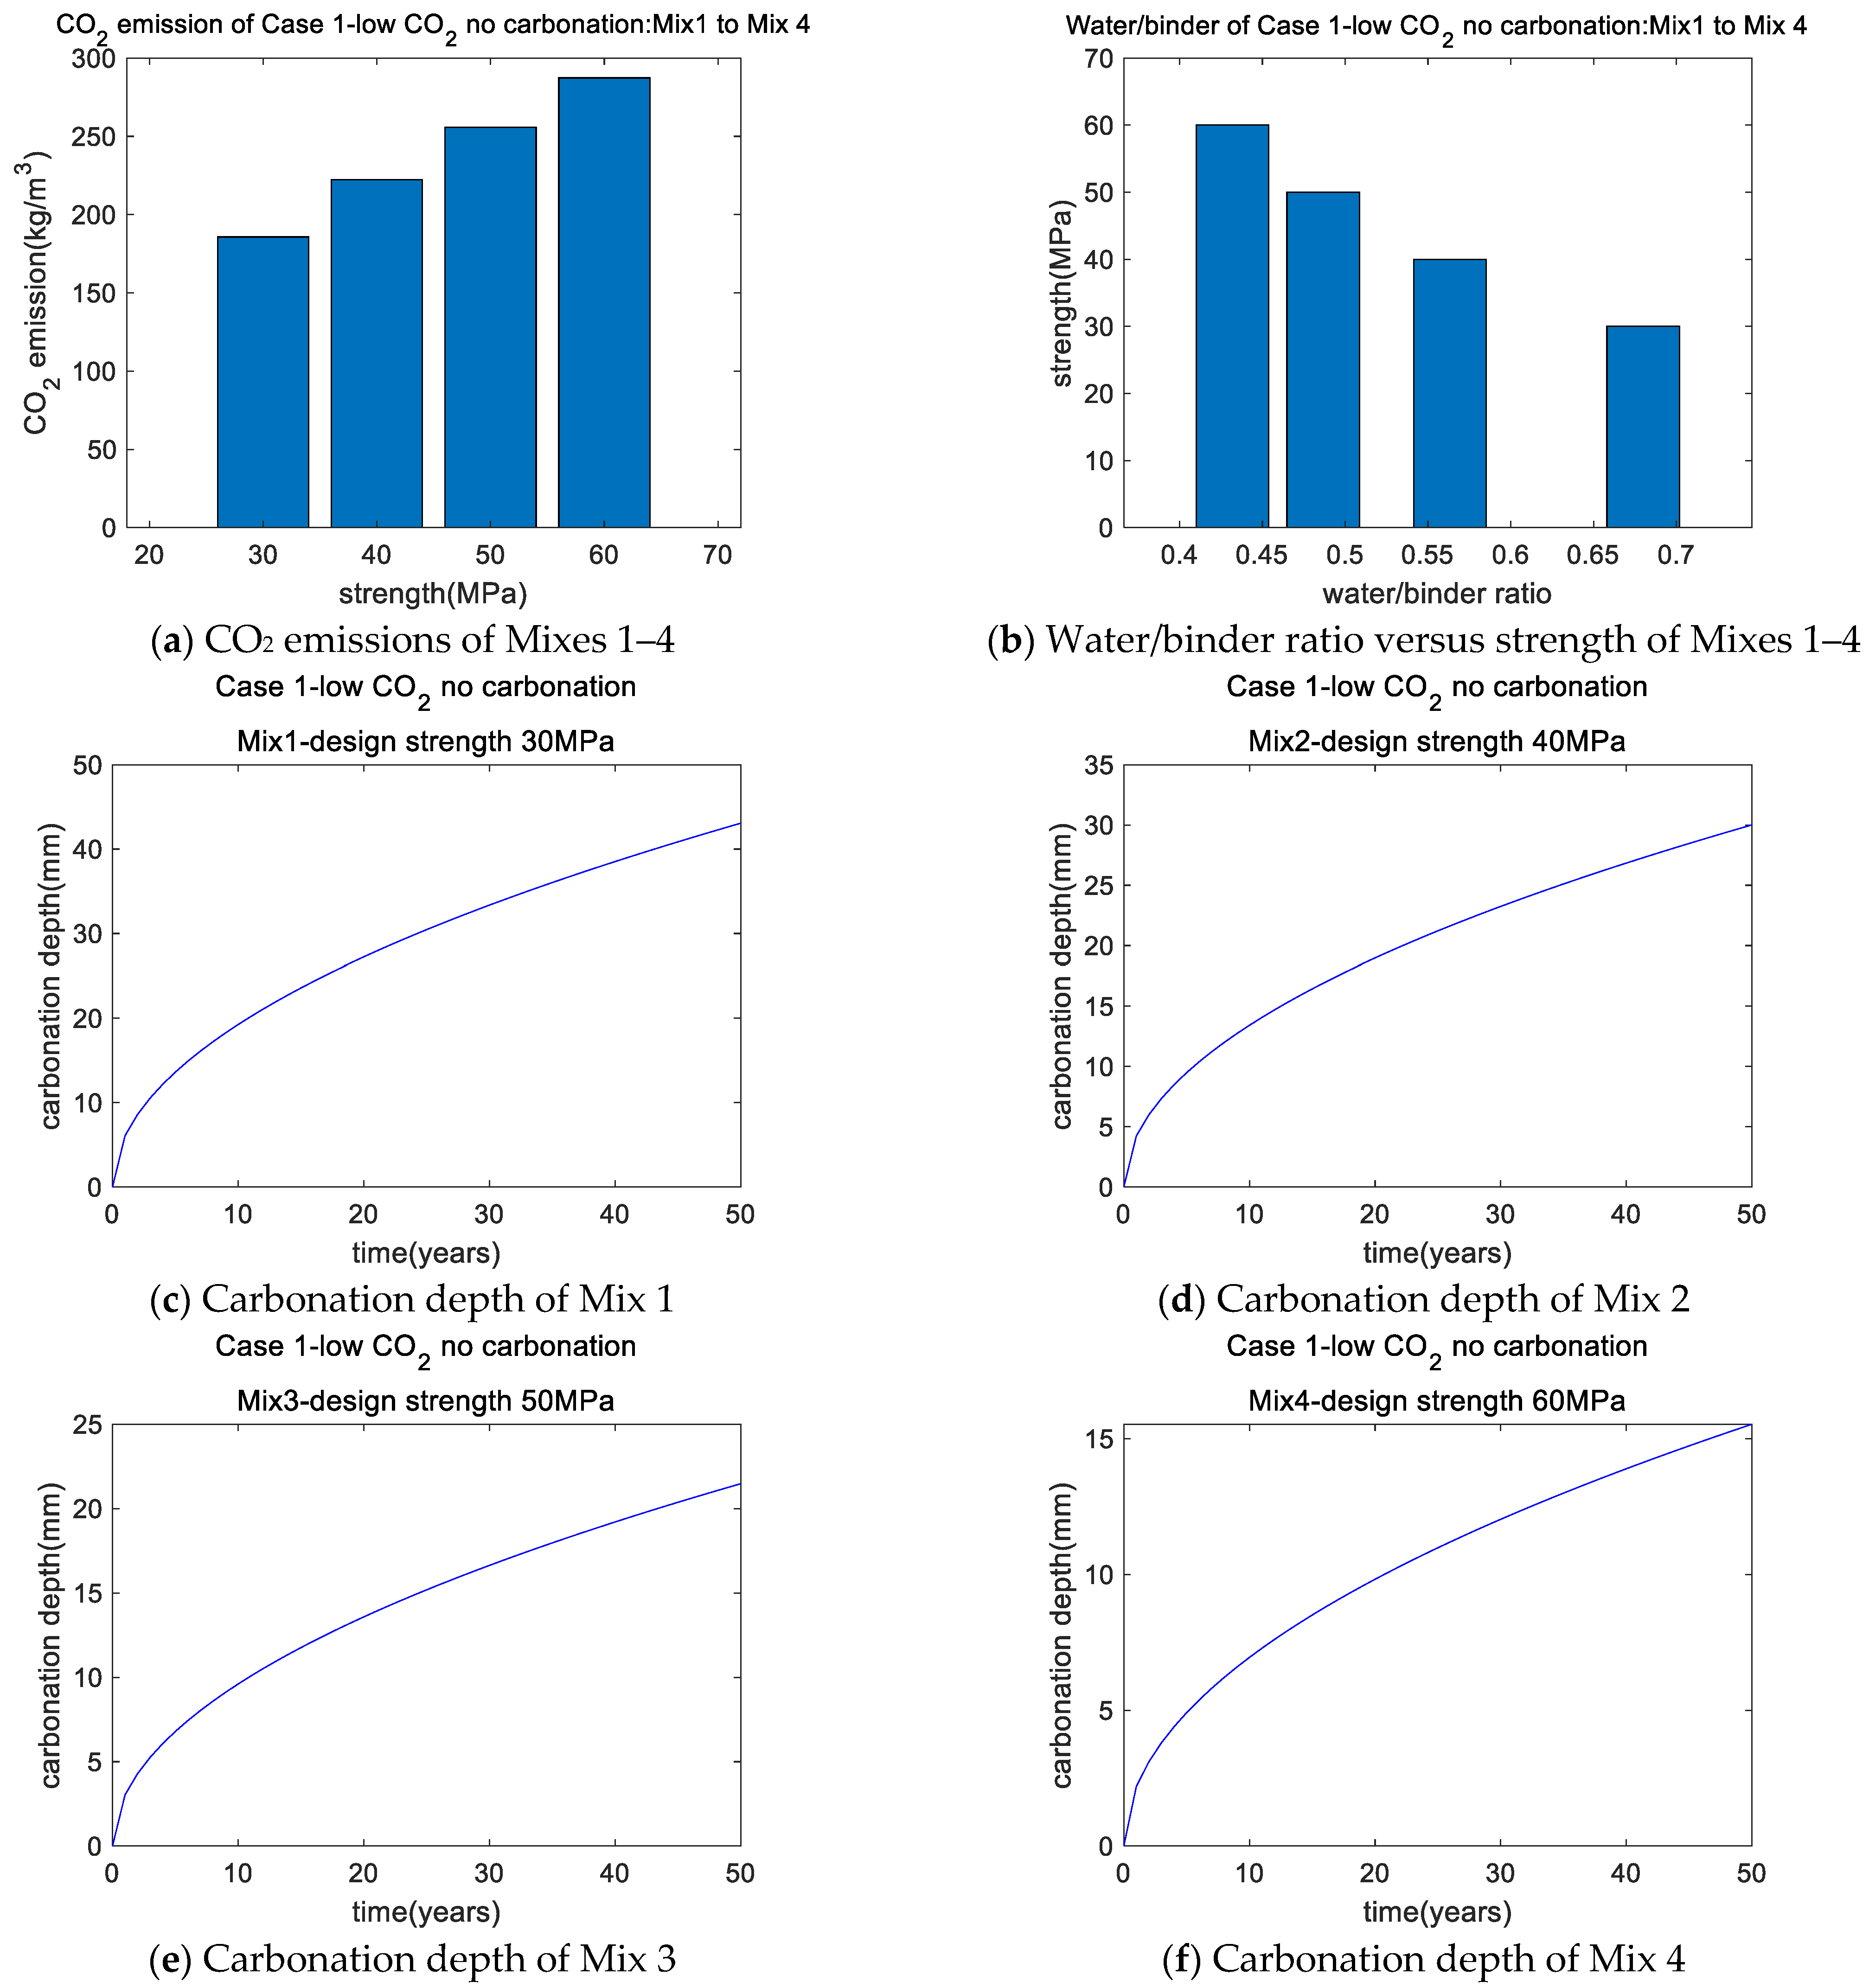
3.1. Case 1: Low-CO2 Concrete without Carbonation

The genetic algorithm enabled us to identify mixtures with low CO2 emissions. The carbonation durability constraint was not considered in this case. The optimal mixtures for case 1 are given in Table 6, while their performance is presented in Table 7. The water content for Mixes 1–4 was similar due to the water/solid ratio constraint, which was toward the lower limit, whereas the SF/binder ratio was toward the upper limit. This is because the CO2 emissions are greater for 1 kg of cement than 1 kg of SF. When the goal of optimization was low CO2 emissions, the SF/binder ratio was pushed toward the upper limit. Additionally, as shown in Figure 2, as the strength of concrete increased, the CO2 emissions of concrete increased (Figure 2a), whereas the water/binder ratio decreased (Figure 2b), in accordance with [30,33,34].
The carbonation depth over time of Mixes 1–4 is depicted in Figure 2c–f. Following a service life of half a century, the carbonation depths of Mixes 1 and 2 exceeded the cover depth limit of 25 mm (Figure 2c,d), whereas the carbonation depths of Mixes 3 and 4 were below this limit (Figure 2e,f). Thus, carbonation durability could be satisfied for high-strength concrete (Mixes 3 and 4 with 50 and 60 MPa, respectively), but not ordinary-strength concrete (Mixes 1 and 2 with 30 and 40 MPa, respectively).

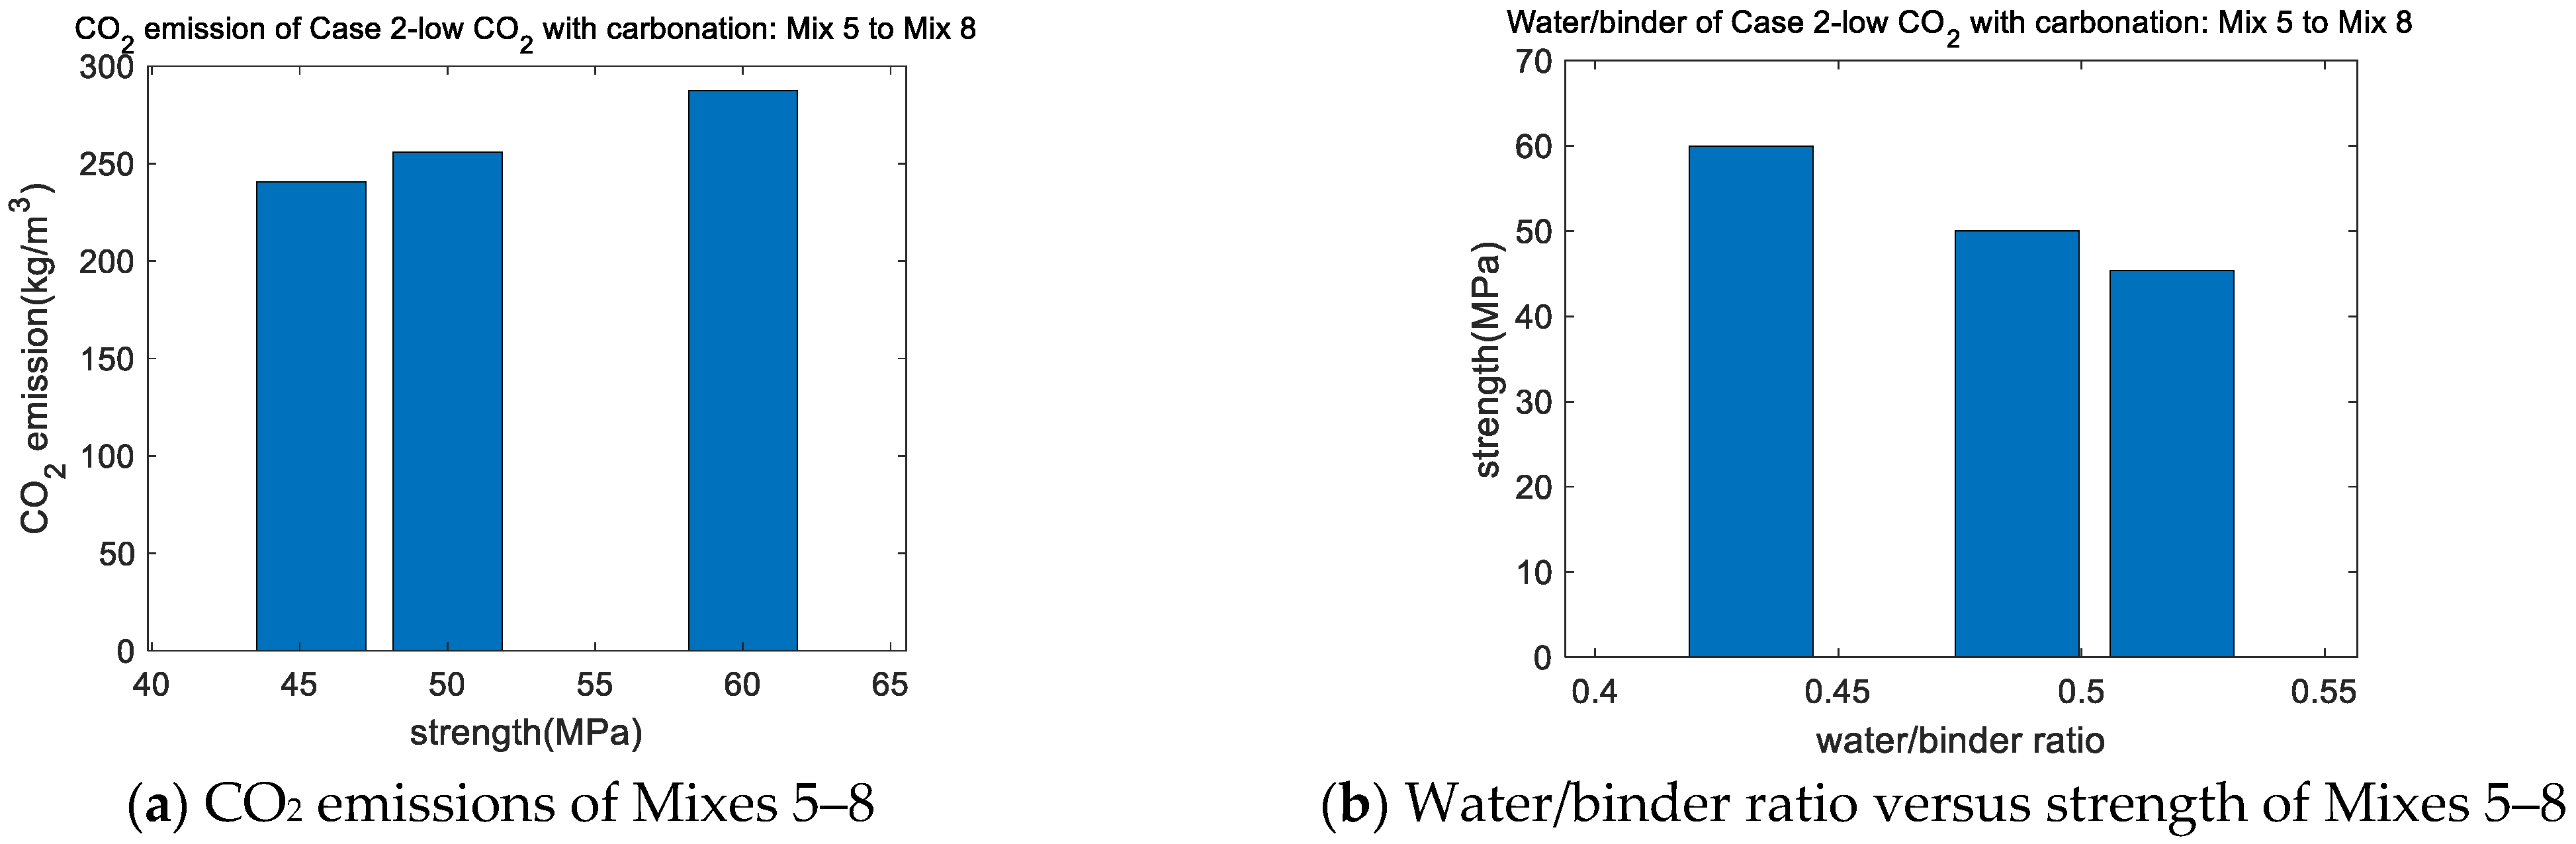
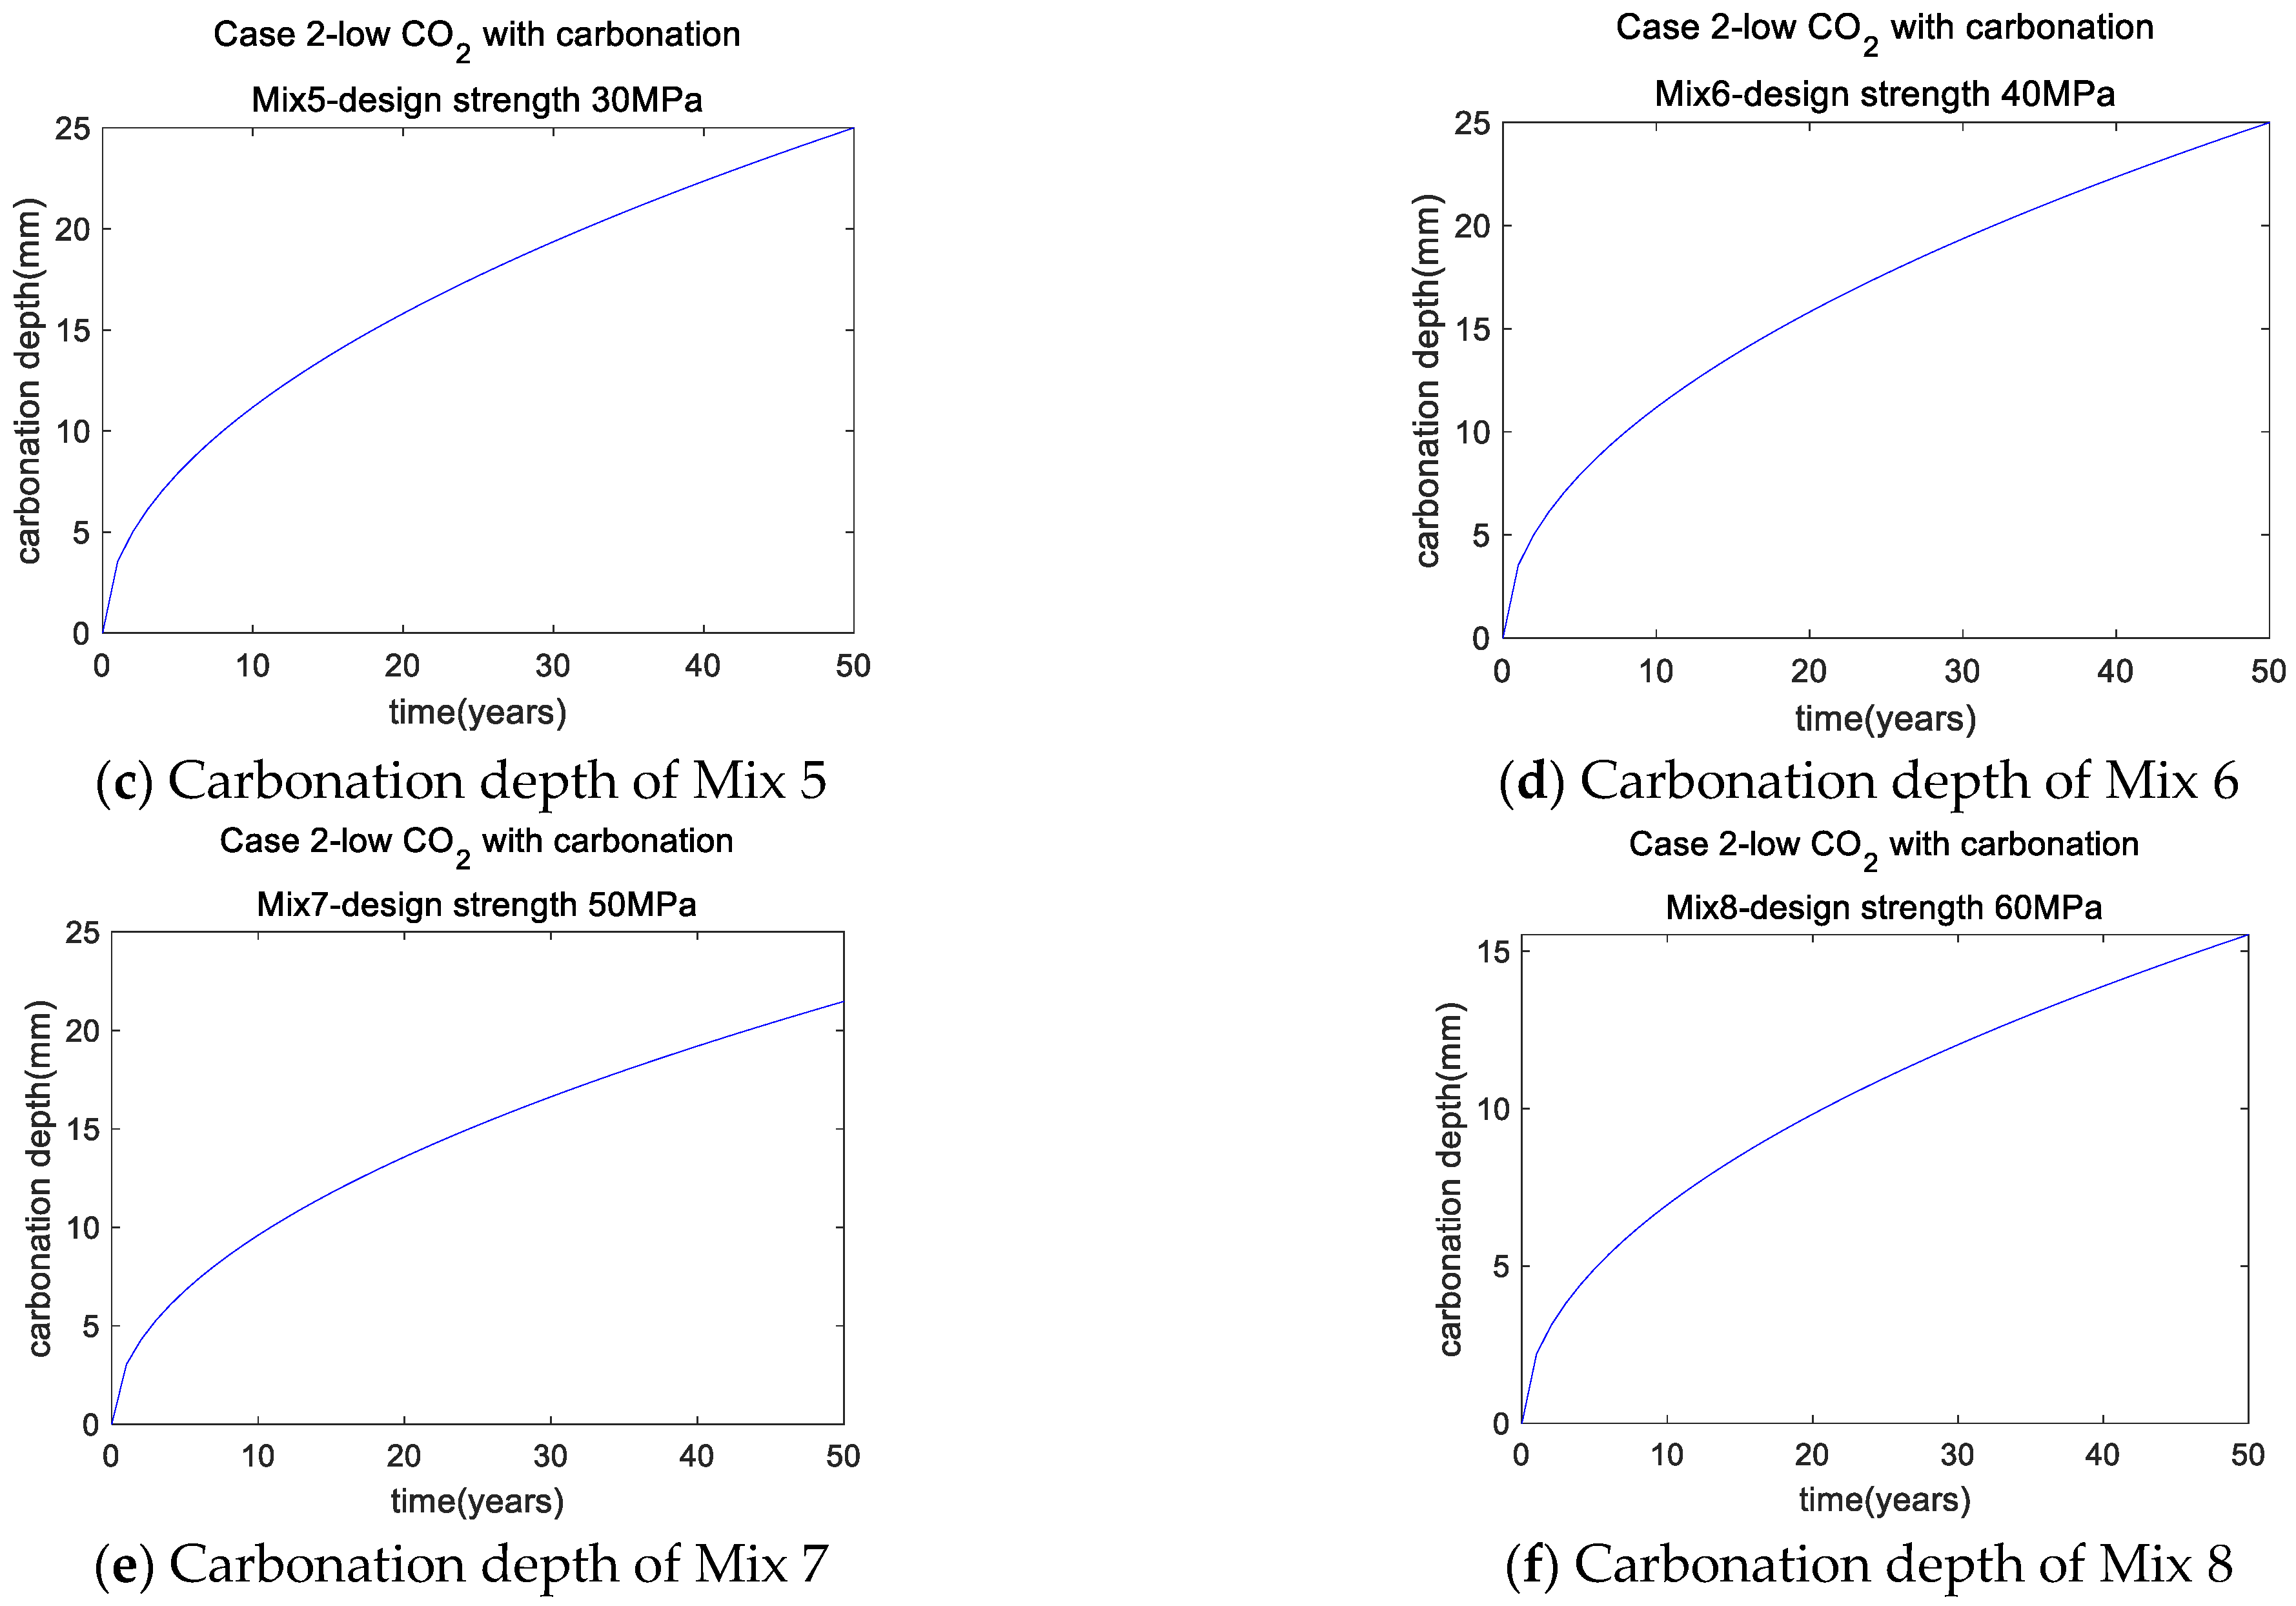
3.2. Case 2: Low-CO2 Concrete with Carbonation

Section 3.1 presents the importance of and demand for carbonation durability for mixture design. The constraints were identical to the previous section except for the addition of carbonation.
The optimal mixtures and their performance are presented in Table 8 and Table 9, respectively. Mixes 5 and 6 had design strengths of 30 MPa and 40 MPa, respectively; however, their actual strengths were identical at 45.39 MPa. This suggests that carbonation durability may be the dominant factor of mixture design for Mixes 5 and 6. To improve carbonation durability, a greater actual strength can be used. The SF/binder ratio for Mixes 5 and 6 was toward the upper limit, as SF presents much lower CO2 emissions than cement. Furthermore, the actual strengths of Mixes 7 and 8 were as projected, suggesting that carbonation did not influence the strength properties of high-strength concrete (50 and 60 MPa). As shown in Figure 3, an increase in concrete strength led to an increase in CO2 emissions (Figure 3a) and a decrease in water/binder ratio (Figure 3b), in accordance with [30,33]. For Mixes 5 and 6, the carbonation depth was equal to the cover depth (Figure 3c,d, respectively), whereas, for Mixes 7 and 8, the carbonation depth was lower than the cover depth (Figure 3e,f, respectively).
Moreover, we can find that Mix 3 in Table 4 is the same as Mix 7 in Table 8. Similarly, Mix 4 in Table 4 is the same as Mix 8 in Table 8. This is because Mix 3 and Mix 4 have higher design strengths (the design strengths of Mix 3 and Mix 4 are 50 MPa and 60 MPa, respectively). Concrete with higher design strengths show higher resistance of carbonation, and the requirement of carbonation durability can be satisfied for these high-strength concretes. In other words, the constraint of carbonation durability does not affect the optimal design results of high-strength concrete.

3.3. Case 3: Low-Material-Cost Concrete with Carbonation

In the previous two sections, the goal of optimal design was low CO2. However, material cost is also a vital index of concrete sustainability. In this section, the material cost of concrete was taken as the goal of optimal design. Using the genetic algorithm, the optimal mixtures with a low material cost were calculated, as presented in Table 10. The performance of the optimal mixtures for Case 3 is outlined in Table 11. First, for Mixes 9–12, the SF/binder ratio was equal to the lower limit, as the material cost of SF is greater than that of cement. Second, for Mix 9, the design strength was 30 MPa but the actual strength was 31.28 MPa, suggesting that carbonation dominated the mix style of Mix 9. After 50 years of service life, the carbonation depth of Mix 9 was equal to the cover depth. Third, as shown in Figure 4, as the strength of concrete increased, the cost of material increased (proven in Figure 4a), whereas the water/binder ratio of concrete (Figure 4b) and the carbonation depth of concrete decreased (Figure 4c–f), in agreement with [32,33,34]. For Mixes 10–12, the carbonation depth after 50 years of service life was lower than the cover depth (Figure 4d–f, respectively).

3.4. Case 4: Low-Total-Cost Concrete with Carbonation

The previous two sections outlined the optimal design of low-CO2 concrete and low-material-cost concrete. However, as CO2 emissions cannot be directly compared to material cost, this study used the carbon price to convert CO2 emissions into CO2 emission cost; furthermore, the total cost was calculated as the sum of material and CO2 emission cost. Using the genetic algorithm, the optimal design of low-total-cost concrete with carbonation (Table 12) was found to overlap with the results in the previous section. This is because the CO2 emission cost, representing approximately 12% of the total cost (Figure 5a), was substantially lower than the material cost; thus, the optimal design was not substantially altered. Figure 5b also shows that an increase in concrete strength led to an increase in total cost.

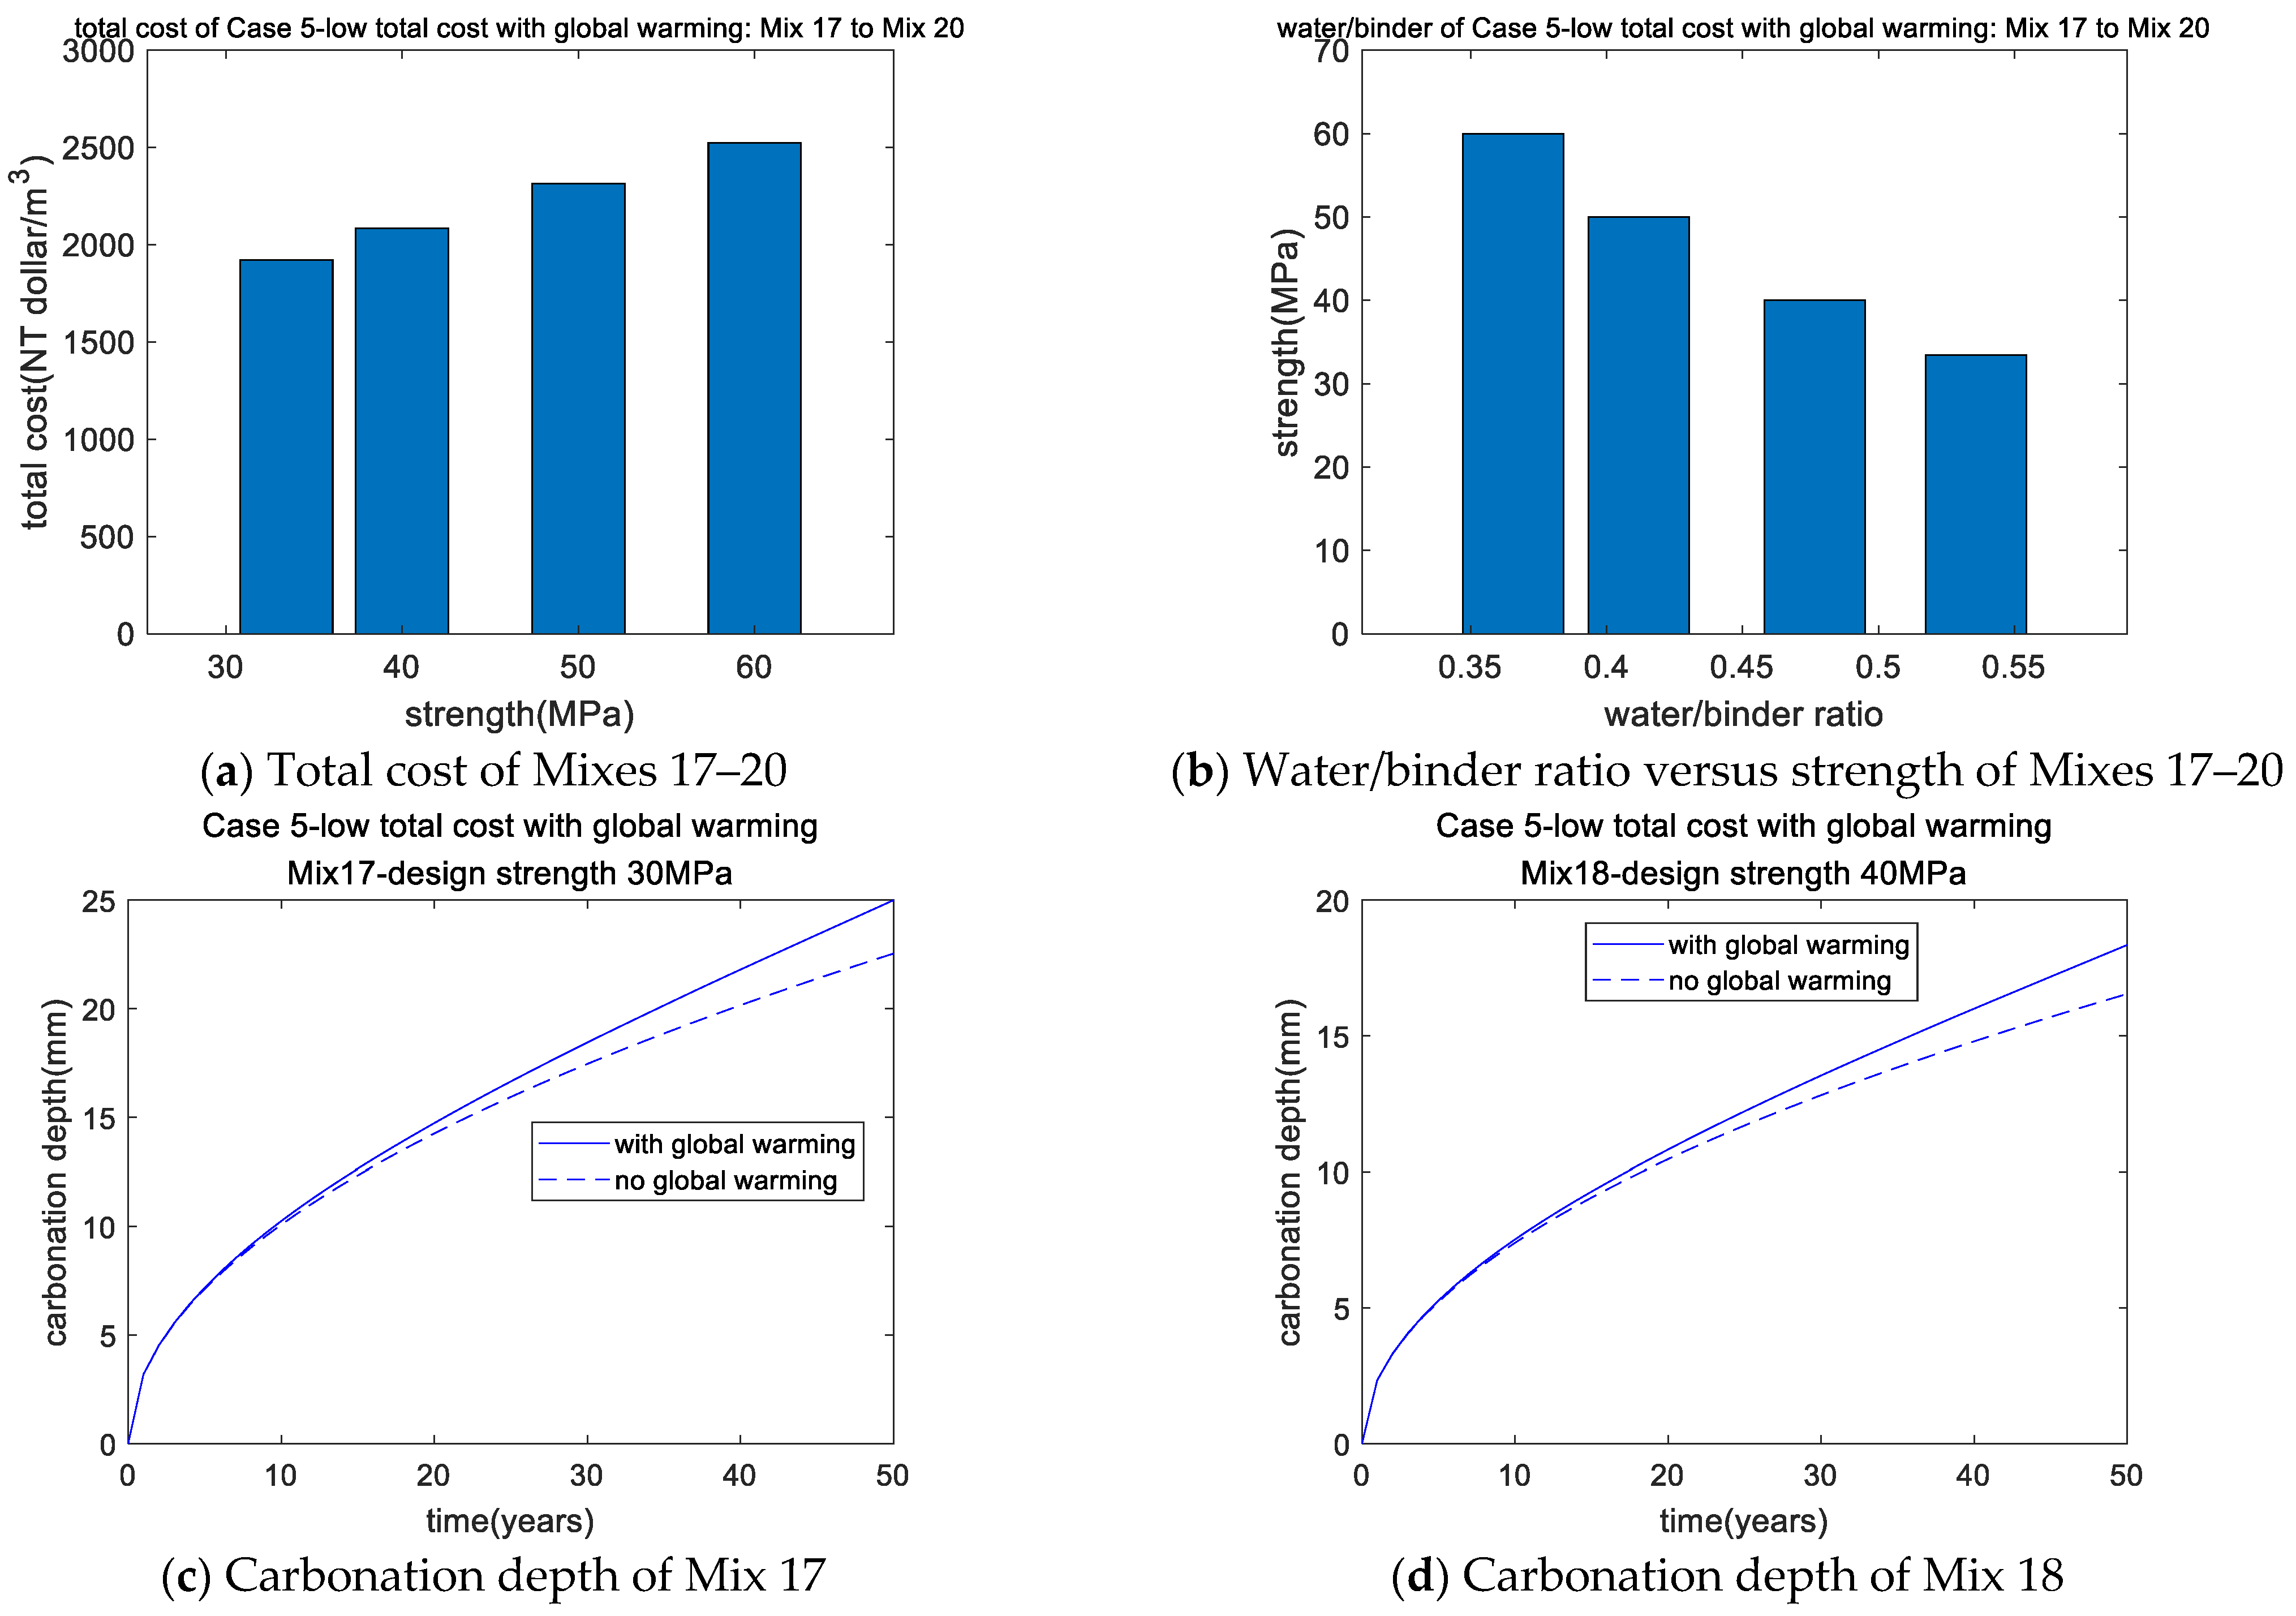
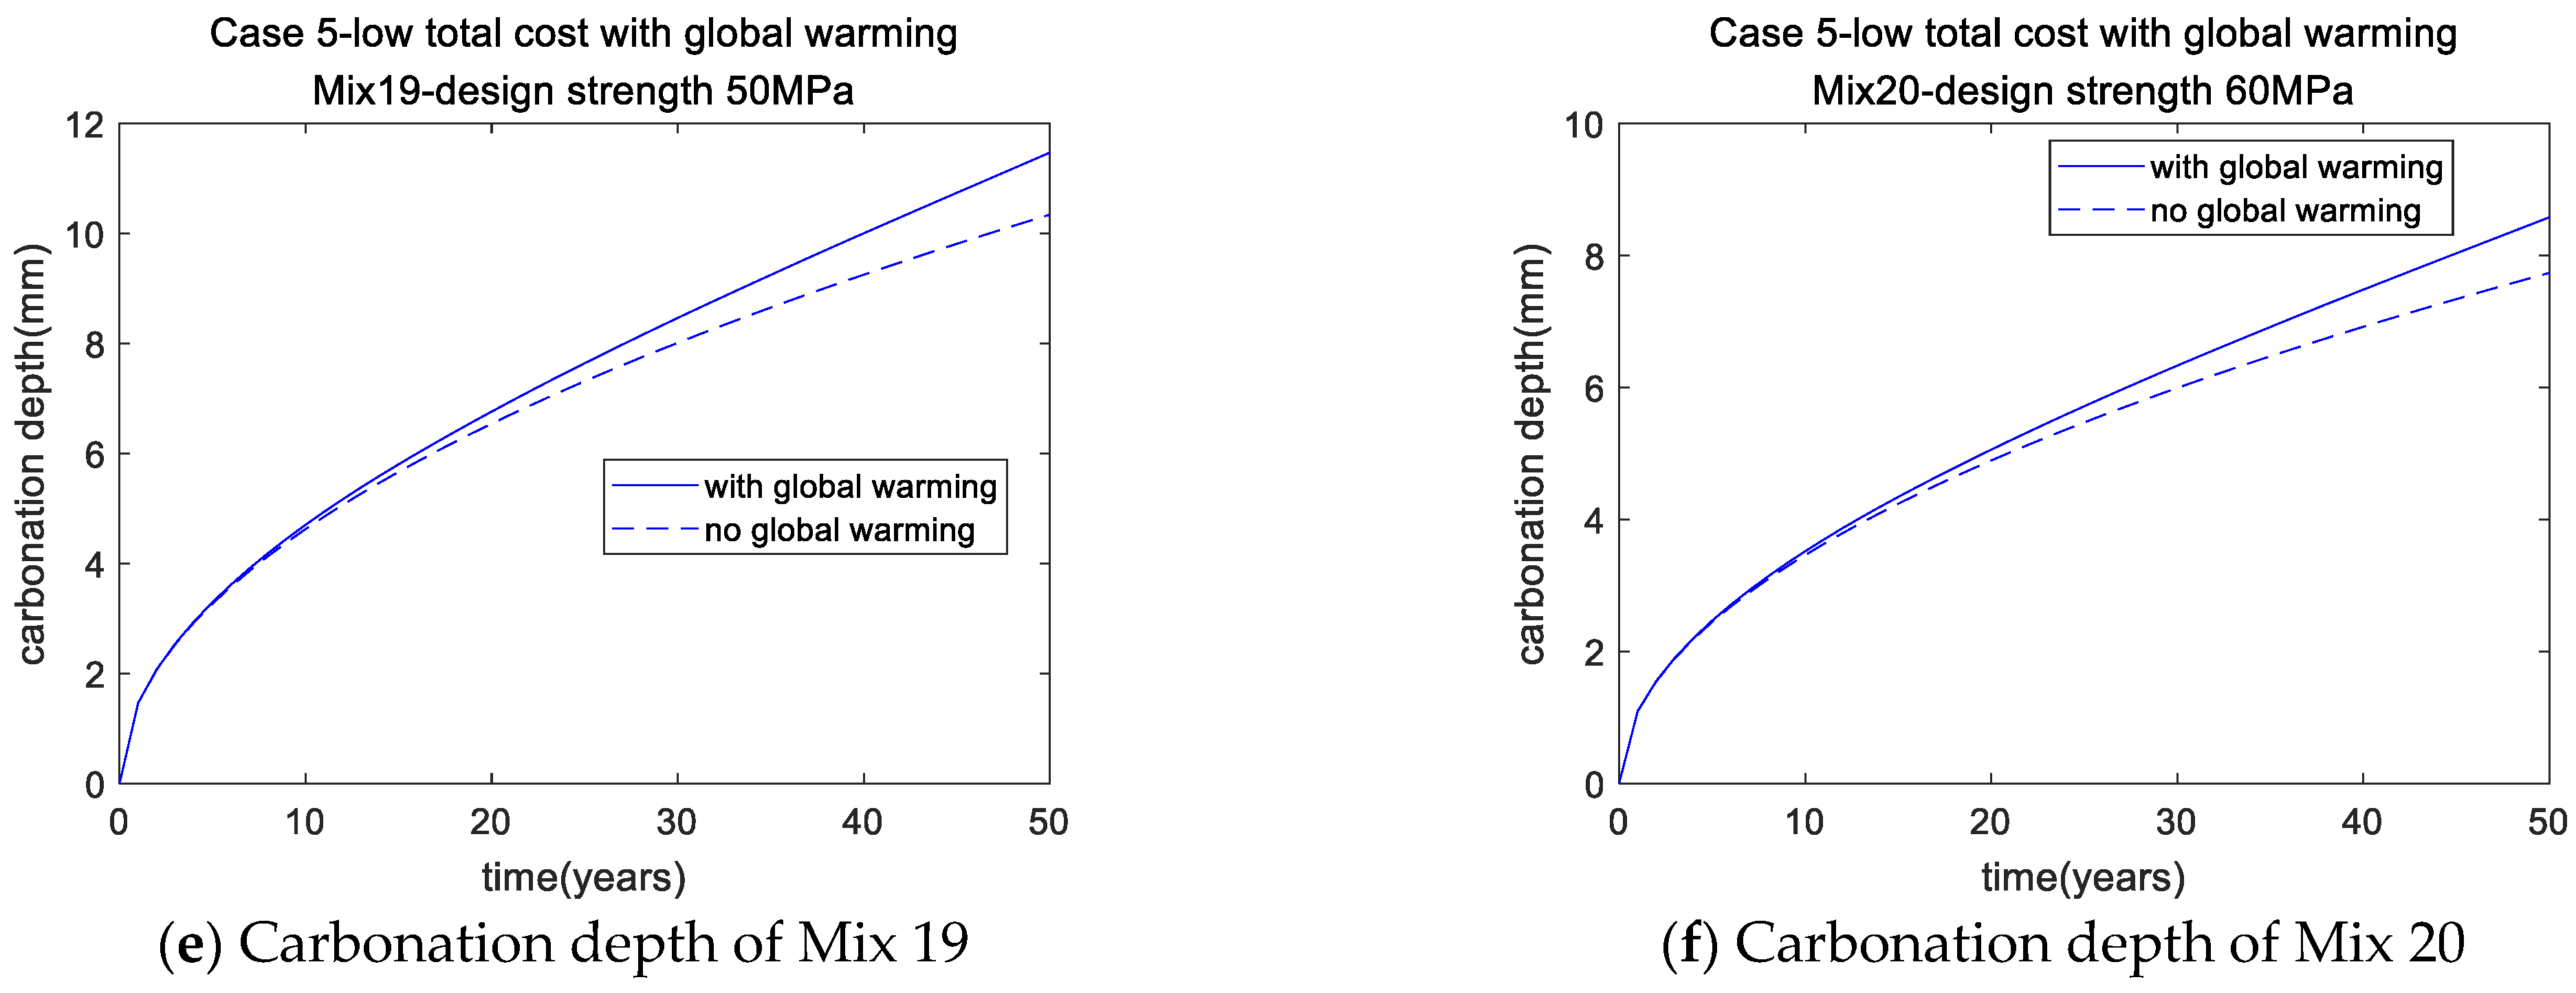
3.5. Case 5: Low-Total-Cost Concrete with Global Warming

In the previous three sections, the effect of carbonation on optimal design was considered. Carbonation is a complex physicochemical process, whose rate varies as a function of the environmental conditions, e.g., CO2 concentration and environmental temperature. Global warming is the unusually rapid increase in Earth’s average surface temperature over the past century primarily due to the greenhouse gases released by people burning fossil fuels. The increases in CO2 concentration and temperature are vital indicators of global warming. Due to global warming, both CO2 concentration and temperature are increasing, consequently affecting the carbonation service life. Thus, concrete mixture design might also be affected.
The Intergovernmental Panel on Climate Change (IPCC) has proposed several representative concentration pathways (RCPs), such as RCP2.6, RCP4.5, RCP6.0, and RCP8.5 [36], representing various global warming scenarios. Among these scenarios, RCP8.5 features the greatest increase in CO2 concentration and temperature. This study considered the effect of RCP8.5 on optimal design, thereby introducing the effect of global warming.
The increases in CO2 concentration and temperature under RCP8.5 are depicted in Figure 6a,b, respectively. To determine the carbonation depth under this global warming scenario, the time-averaged CO2 concentration 0 t [ CO 2 ] t dt t and time-averaged CO2 diffusivity 0 t [ D ] t dt t were utilized [36].
According to the genetic algorithm, the optimal mixtures were determined, as presented in Table 13. The performance of these optimal mixtures for Case 5 is shown in Table 14. The design strength of Mix 17 was 30 MPa; however, its actual strength was 33.44 MPa, as carbonation durability dominated the mixture design to a greater extent than Mix 13 due to global warming. To address carbonation with global warming, a greater binder content and greater strength ought to be used. The results for Mixes 18–20 overlapped with those for Mixes 14–16, respectively, suggesting no influence of global warming. The superior binder content of these mixes led to increased resistance to carbonation even in the face of global warming. Figure 7 shows that, as the strength of concrete increased, the total cost of concrete increased (Figure 7a), whereas the water/binder ratio (Figure 7b) and carbonation depth decreased (Figure 7c–f). Furthermore, the case study results show that the carbonation depth of concrete under global warming was substantially greater than that without global warming, especially toward the end of service life (Figure 7c–f).

3.6. Discussion

In contrast to previous studies, the suggested design framework revealed several improvements, as outlined below.
Firstly, previous mixture design studies did not pay enough attention to carbonation durability. In this study, it was found that carbonation durability is not a critical issue for high-strength concrete, but it has an effect on ordinary-strength concrete. Thus, it is vital to identify the threshold strength under which carbonation durability should be considered. This can be achieved using the proposed design method, which revealed that this threshold strength is dependent upon the goal and constraints of design. For low-CO2 concrete, low-cost concrete, and low-cost concrete with global warming, the threshold strengths were 45.39 MPa, 31.28 MPa, and 33.44 MPa, respectively.
Secondly, previous mixture design studies did not consider the impact of global warming. This study found that global warming had a significant impact on the mixture design of ordinary-strength concrete (30 MPa), but it failed to influence the higher-strength mixtures (40, 50, and 60 MPa). Hence, for 30 MPa concrete, additional engineering techniques, such as increasing the cover depth, using additional coating, and increasing the design strength, should be used to improve the service life with respect to carbonation durability.
Thirdly, previous studies mainly focused on low-cost concrete or low-CO2 concrete, whereas the difference between low-cost concrete and low-CO2 concrete was not clarified. In this study, the proposed method enabled the design of low-cost concrete or low-CO2 concrete, which were found to differ as a function of the SF content due to its higher price but lower CO2 emissions. Thus, the proposed method was proven to be flexible in finding optimal mixtures for different goals.
Fourthly, the final application of this paper can be the optimal design of sustainable silica fume blended concrete. To use the proposed method, the aim of the optimal design (Equations (1)–(3)) should be established. Moreover, the constraints of optimal design should be added. Finally, optimal mixtures can be found considering both the aim and the constraints of optimal design. In addition, the sustainable design of silica fume blended concrete consists of many sub-aims, such as low-CO2 and low-cost. The proposed method considers these different design aims and is suitable for various design cases.
Lastly, for various design codes, the calculation equations for strength, slump, and carbonation depth of SF-modified concrete might differ [10,17,18,22,23]. However, the genetic algorithm can be used as an optimization process for various constraint equations, thus allowing other researchers to determine the optimal mixture designs for their circumstances using the proposed integrated design framework. The findings are interesting and may be valuable in the design stage of construction to establish the cover depth in accordance with environmental exposure or the types of elements. Nevertheless, some further research based on laboratory tests may be relevant to validate the findings.

4. Conclusions

This study proposed an integrated mixture design framework for sustainable SF-modified concrete, which implemented the genetic algorithm to determine optimal mixtures. Strength, slump, and carbonation with or without global warming were considered as constraints of optimization, whereas CO2 emissions, material cost, and total cost were established as the goals of optimization. According to the analysis of five design cases, the following conclusions could be drawn:
(1)
Case 1 (low-CO2 concrete without carbonation) showed that the carbonation durability constraint could be fulfilled for high-strength concrete (Mixes 3 and 4, 50 MPa and 60 MPa, respectively) but not ordinary-strength concrete (Mixes 1 and 2, 30 MPa and 40 MPa, respectively). For all mixes, the SF/binder ratio was toward the upper limit due to the substantially lower CO2 emissions of SF than cement.
(2)
Case 2 (low-CO2 concrete with carbonation) showed variations in the actual strength of ordinary-strength concrete with respect to their design strength (Mixes 5 and 6, 45.39 MPa for both), suggesting that carbonation dominated the mixture design. Thus, to satisfy the carbonation durability, greater actual strength can be obtained. On the other hand, no such influence was found on high-strength concrete (Mixes 7 and 8).
(3)
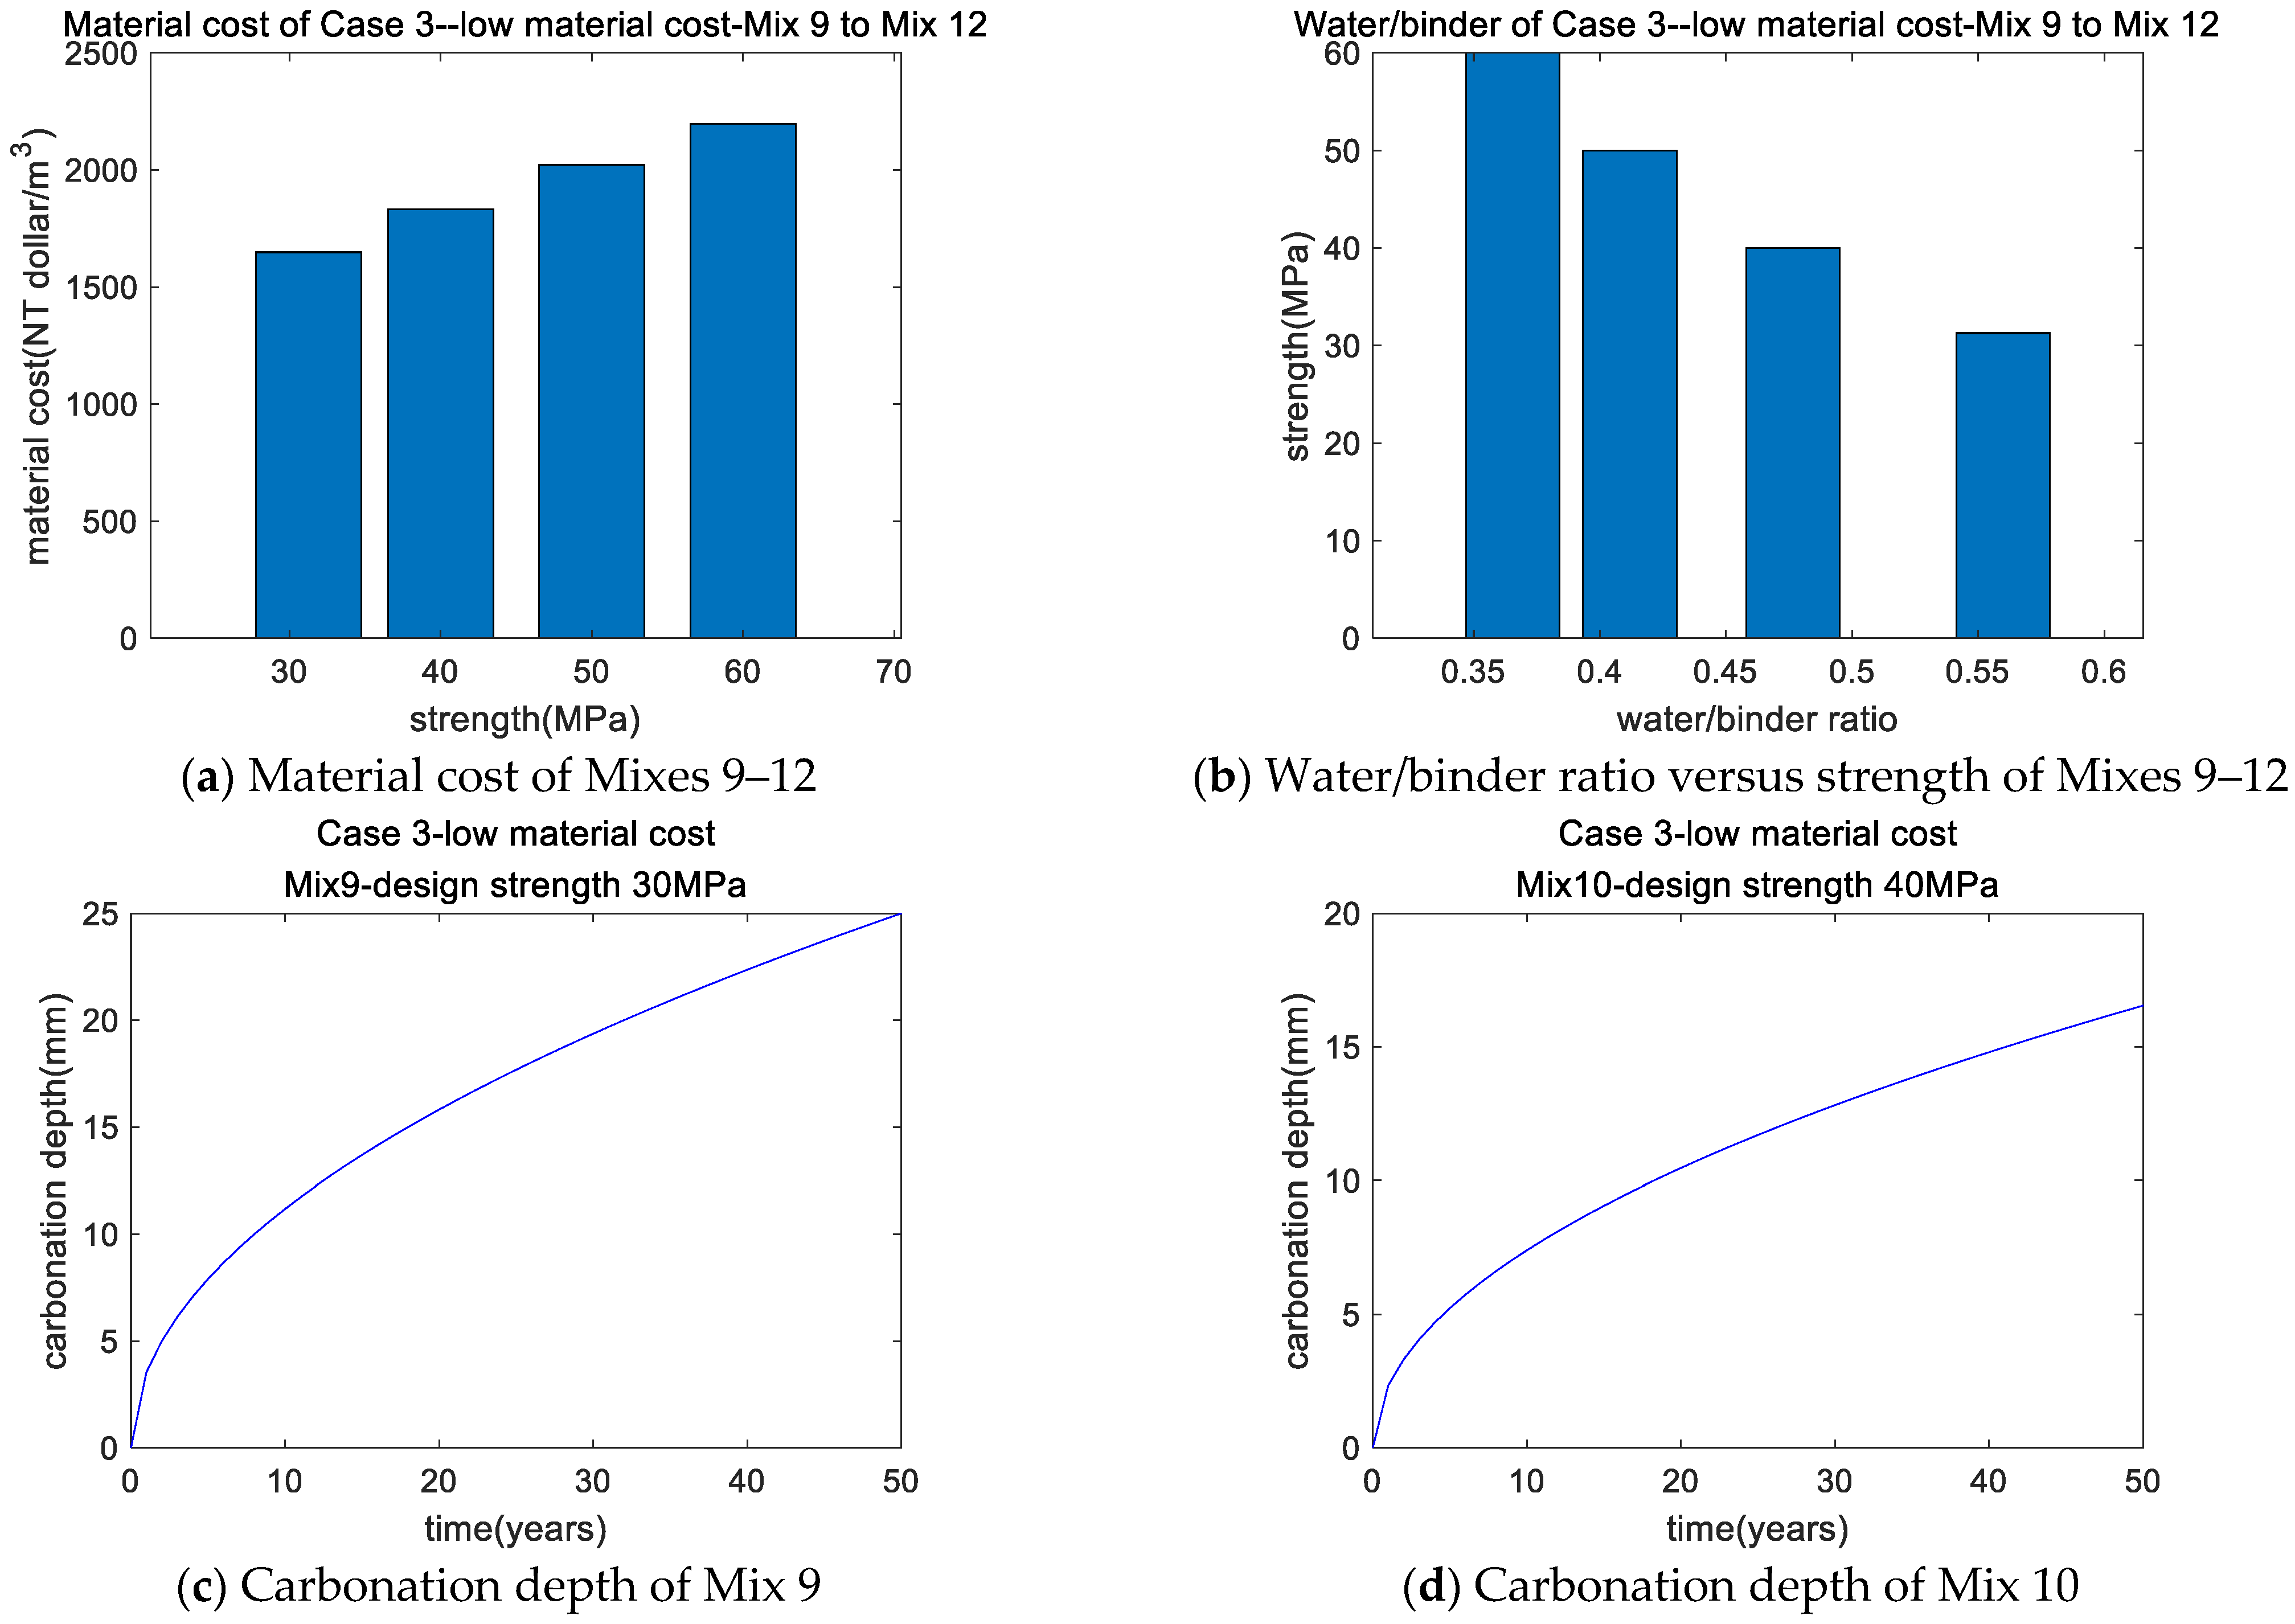
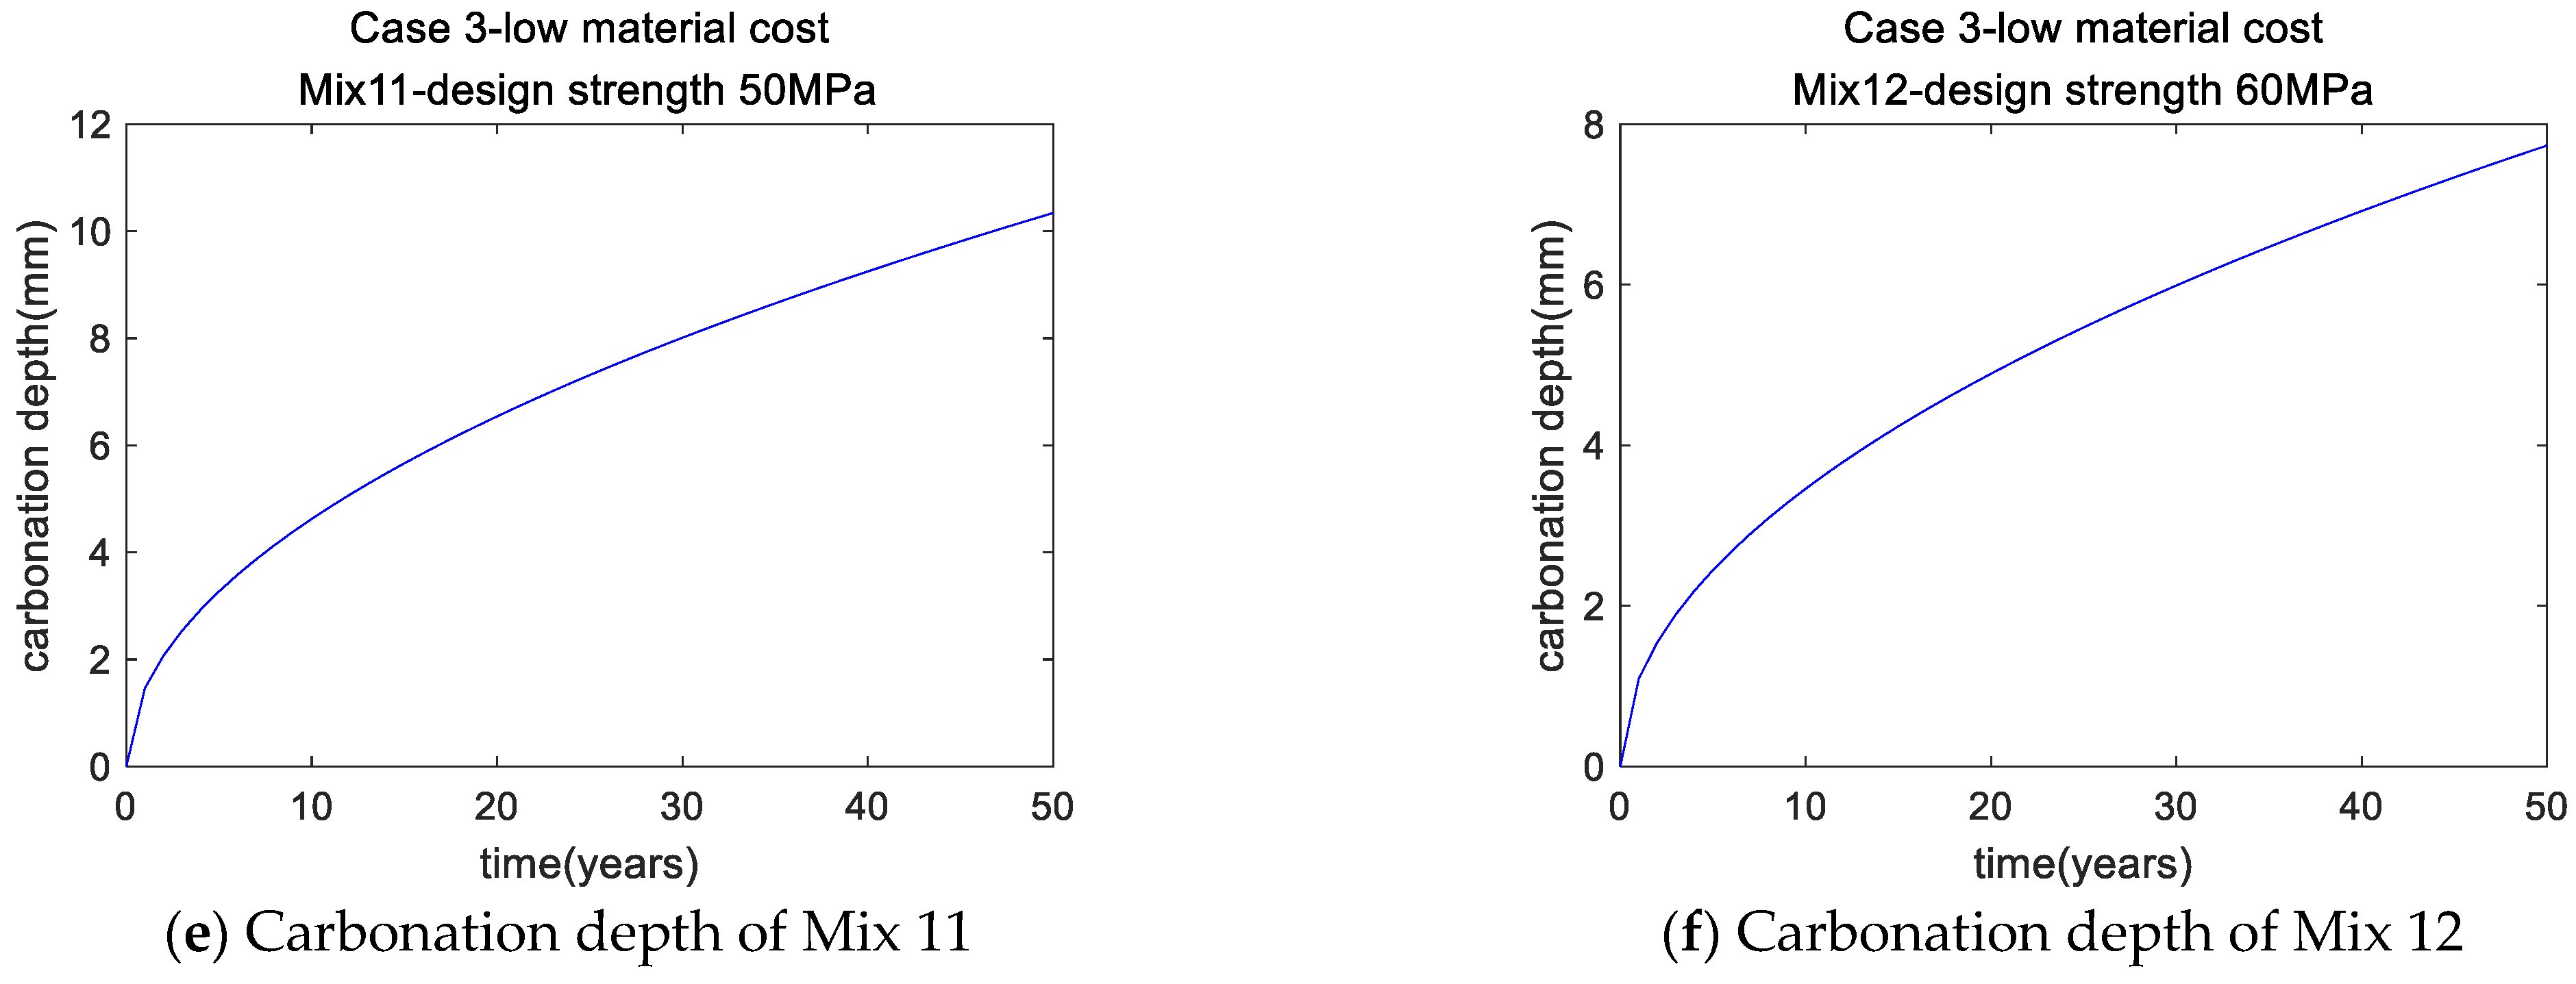
Case 3 (low-material-cost concrete with carbonation) revealed that the SF/binder ratio was toward the lower limit for Mixes 9–12, due to the greater material price of SF compared to cement. Additionally, for Mix 9, the actual strength (31.28 MPa) was greater than the design strength (30 MPa), suggesting that carbonation dominated the mixture design. After 50 years of service life, the carbonation depth of Mix 9 was equal to the cover depth.
(4)
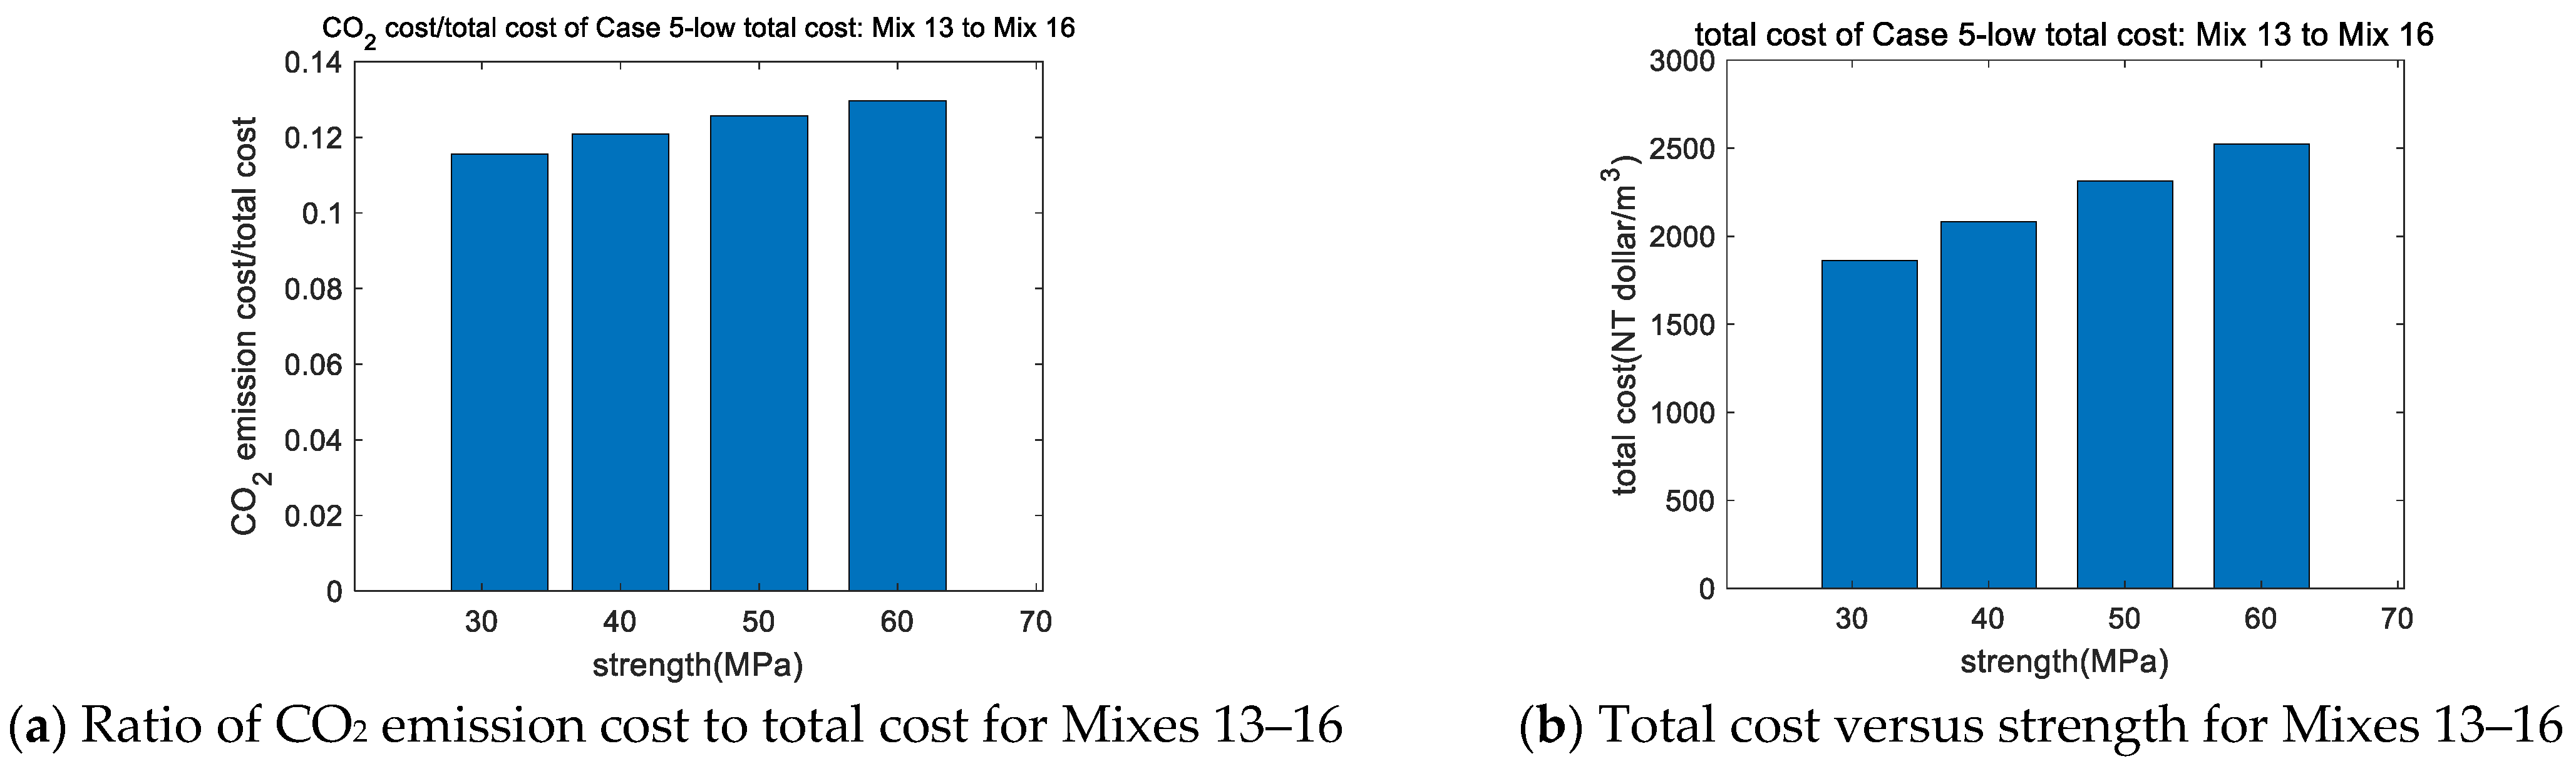
Case 4 (low-total-cost concrete with carbonation) revealed similar results for Mixes 13–16 to those for Mixes 9–12, respectively, as the cost of CO2 emissions (12% of total cost) was substantially less than the material cost and, thus, did not influence the outcome.
(5)
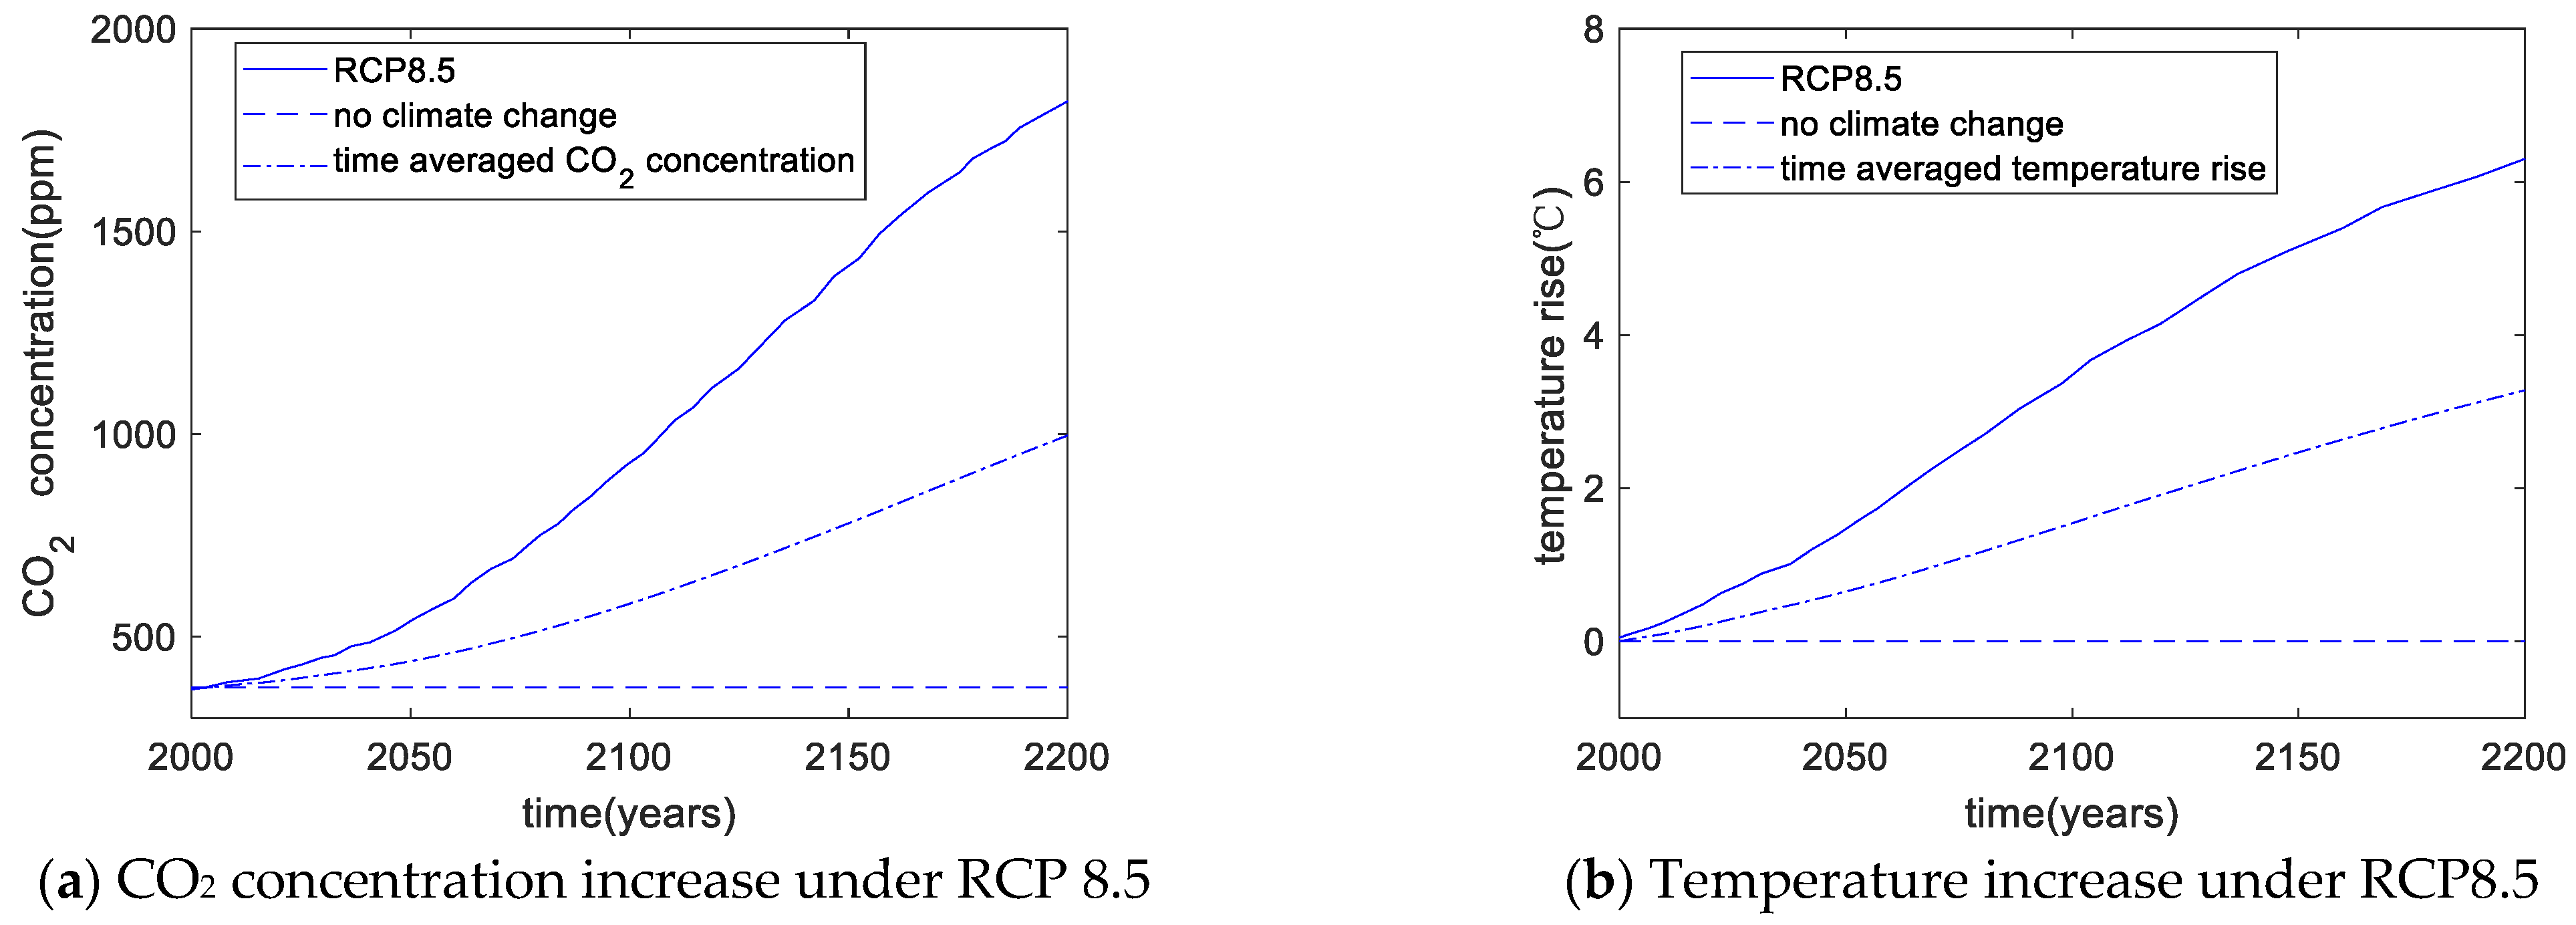
Case 5 (low-total-cost concrete with carbonation and global warming) showed that, for Mix 17 (design strength of 30 MPa), global warming led to an increase in actual strength from 31.28 to 33.44 MPa. Thus, to fulfill the constraints of carbonation with global warming, a greater binder content or greater strength ought to be used. However, global warming was not found to influence the mixture design of higher-strength concretes (40, 50, and 60 MPa).
In the future, the following aspects should be considered: CO2 emissions from production phase and transportation phase; a performance evaluation model considering the chemical content, mineralogical composition, specific gravity, particle size, or surface area of the silica fume; a performance evaluation model for hydration heat and long-term (90 or 360 days) strength.
In summary, the proposed framework is able to strive for different goals (CO2 emission, material cost, or total cost) as a function of various constraints (strength, workability, and carbonation durability with or without global warming). The suggested technique can be used as a general process for the optimal design of sustainable SF-modified concrete.

Author Contributions

Methodology, Y.-S.W., X.-Y.W. and H.-K.C.; supervision, H.-K.C.; validation, H.-K.C.; visualization, Y.-S.W. and H.-K.C.; writing—original draft, X.-Y.W., H.-K.C.; writing—review and editing, X.-Y.W., Y.-S.W. and H.-K.C. All authors have read and agreed to the published version of the manuscript.

Funding

This research was supported by the National Research Foundation of Korea (NRF) (NRF-2020R1A2C4002093).

Data Availability Statement

The data presented in this study are available from the corresponding author upon reasonable request.

Conflicts of Interest

The authors declare no conflict of interest.

Nomenclature

VariableDefinition
M CO 2 CO2 emission of concrete
CO 2 - C CO2 emission of 1 kg of cement
CO 2 - SF CO2 emission of 1 kg of silica fume
CO 2 - W CO2 emission of 1 kg of water
CO 2 - S CO2 emission of 1 kg of sand
CO 2 - CA CO2 emission of 1 kg of coarse aggregate
CO 2 - SP CO2 emission of 1 kg of superplasticizer
C Mass of cement
SF Mass of silica fume
W Mass of water
S Mass of sand
CA Mass of coarse aggregate
SP Mass of superplasticizer
COS T M Cost of materials
Pr C Unit cost of cement
Pr SF Unit cost of silica fume
Pr W Unit cost of water
Pr S Unit cost of sand
Pr CA Unit cost of coarse aggregate
Pr SP Unit cost of superplasticizer
Pr CO 2 Unit cost of CO2 emission
COS T CO 2 cost of CO2 emission
COS T Total cost of concrete (sum of material and CO2 emission)
f c 28 days strength of concrete
f cr Design strength of concrete
Slump Slump of concrete
Slump r Design slump of concrete
ρ W Density of water
ρ C Density of cement
ρ SF Density of silica fume
ρ CA Density of coarse aggregate
ρ S Density of sand
ρ SP Density of superplasticizer
V air Volume of entrapped air
x c ( t ) Carbonation depth
CV Cover depth
[ CO 2 ] 0 CO2 concentration
t Time
D CO2 diffusivity
RH Relative humidity
T ref Reference temperature (293 K)
T Environmental temperature
α H Degree of hydration
β Temperature sensitivity factor of CO2 diffusion
0 t [ CO 2 ] t dt t Time-averaged CO2 concentration
0 t [ D ] t dt t Time-averaged CO2 diffusivity

References

  1. Khatib, J.M.; Jahami, A.; Elkordi, A.; Abdelgader; Sonebi, M. Structural Assessment of Reinforced Concrete Beams Incorporating Waste Plastic Straws. Environments 2020, 7, 96–110. [Google Scholar] [CrossRef]
  2. Sulthan, S.T.; Anjaiah, Y. A Study on Efficiency Factor of Silica Fume. Int. J. Mod. Trends Sci. Technol. 2018, 4, 55–62. [Google Scholar]
  3. Ahmad, S.; Umar, A.; Masood, A.; Nayeem, M. Performance of self-compacting concrete at room and after elevated temperature incorporating Silica fume. Adv. Concr. Constr. 2019, 7, 31–37. [Google Scholar] [CrossRef]
  4. Abdulkareem, O.M.; Ben Fraj, A.; Bouasker, M.; Khelidj, A. Mixture design and early age investigations of more sustainable UHPC. Constr. Build. Mater. 2018, 163, 235–246. [Google Scholar] [CrossRef] [Green Version]
  5. Wang, L.; Zhou, S.H.; Shi, Y.; Tang, S.W.; Chen, E. Effect of silica fume and PVA fiber on the abrasion resistance and volume stability of concrete. Compos. Part B Eng. 2017, 130, 28–37. [Google Scholar] [CrossRef]
  6. Wang, L.; Jin, M.; Wu, Y.; Zhou, Y.; Tang, S. Hydration, shrinkage, pore structure and fractal dimension of silica fume modified low heat Portland cement-based materials. Constr. Build. Mater. 2021, 272, 121952. [Google Scholar] [CrossRef]
  7. Lü, Q.; Qiu, Q.; Zheng, J.; Wang, J.; Zeng, Q. Fractal dimension of concrete incorporating silica fume and its correlations to pore structure, strength and permeability. Constr. Build. Mater. 2019, 228, 116986. [Google Scholar] [CrossRef]
  8. Bajja, Z.; Dridi, W.; Darquennes, A.; Bennacer, R.; Le Bescop, P.; Rahim, M. Influence of slurried silica fume on microstructure and tritiated water diffusivity of cement pastes. Constr. Build. Mater. 2017, 132, 85–93. [Google Scholar] [CrossRef]
  9. Šavija, B.; Luković, M. Carbonation of cement paste: Understanding, challenges, and opportunities. Constr. Build. Mater. 2016, 117, 285–301. [Google Scholar] [CrossRef] [Green Version]
  10. Papadakis, V.G. Effect of supplementary cementing materials on concrete resistance against carbonation and chloride ingress. Cem. Concr. Res. 2000, 30, 291–299. [Google Scholar] [CrossRef]
  11. Akalin, O. Eco-Cement Optimization Using Statistical Mixture Design Method. ACI Mater. J. 2014, 111, 391–398. [Google Scholar] [CrossRef]
  12. Khaloo, A.R.; Karimi, H.; Asadollahi, S.; Dehestani, M. A New Mixture Design Method for Ultra-High-Strength Concrete. ACI Mater. J. 2017, 114, 215–224. [Google Scholar] [CrossRef]
  13. Ghafari, E.; Costa, H.; Júlio, E. Statistical mixture design approach for eco-efficient UHPC. Cem. Concr. Compos. 2015, 55, 17–25. [Google Scholar] [CrossRef]
  14. Naseri, H.; Jahanbakhsh, H.; Hosseini, P.; Moghadas Nejad, F. Designing sustainable concrete mixture by developing a new machine learning technique. J. Clean. Prod. 2020, 258, 120578. [Google Scholar] [CrossRef]
  15. Golafshani, E.M.; Behnood, A. Estimating the optimal mix design of silica fume concrete using biogeography-based programming. Cem. Concr. Compos. 2019, 96, 95–105. [Google Scholar] [CrossRef]
  16. Zhang, J.; Huang, Y.; Ma, G.; Nener, B. Mixture optimization for environmental, economical and mechanical objectives in silica fume concrete: A novel frame-work based on machine learning and a new meta-heuristic algorithm. Resour. Conserv. Recycl. 2021, 167, 105395. [Google Scholar] [CrossRef]
  17. Papadakis, V.G. Experimental investigation and theoretical modeling of silica fume activity in concrete. Cem. Concr. Res. 1999, 29, 79–86. [Google Scholar] [CrossRef]
  18. Papadakis, V.G.; Tsimas, S. Supplementary cementing materials in concrete-Part I: Efficiency and design. Cem. Concr. Res. 2002, 32, 1525–1532. [Google Scholar] [CrossRef]
  19. Huang, W.; Kazemi-Kamyab, H.; Sun, W.; Scrivener, K. Effect of replacement of silica fume with calcined clay on the hydration and microstructural development of eco-UHPFRC. Mater. Des. 2017, 121, 36–46. [Google Scholar] [CrossRef]
  20. Park, H.S.; Kwon, B.; Shin, Y.; Kim, Y.; Hong, T.; Choi, S.W. Cost and CO2 Emission Optimization of Steel Reinforced Concrete Columns in High-Rise Buildings. Energies 2013, 6, 5609–5624. [Google Scholar] [CrossRef]
  21. Stewart, M.G.; Wang, X.; Nguyen, M.N. Climate change adaptation for corrosion control of concrete infrastructure. Struct. Saf. 2012, 35, 29–39. [Google Scholar] [CrossRef]
  22. Lee, H.-S.; Lim, S.-M.; Wang, X.-Y. Optimal Mixture Design of Low-CO2 High-Volume Slag Concrete Considering Climate Change and CO2 Uptake. Int. J. Concr. Struct. Mater. 2019, 13, 56. [Google Scholar] [CrossRef]
  23. Lee, H.-S.; Wang, X.-Y. Hydration Model and Evaluation of the Properties of Calcined Hwangtoh Binary Blends. Int. J. Concr. Struct. Mater. 2021, 15, 11. [Google Scholar] [CrossRef]
  24. Long, G.; Gao, Y.; Xie, Y. Designing more sustainable and greener self-compacting concrete. Constr. Build. Mater. 2015, 84, 301–306. [Google Scholar] [CrossRef]
  25. Yang, K.-H.; Jung, Y.-B.; Cho, M.-S.; Sung-Ho, T. Effect of supplementary cementitious materials on reduction of CO2 emissions from concrete. J. Clean. Prod. 2015, 103, 774–783. [Google Scholar] [CrossRef]
  26. Yeh, I.-C. Computer-aided design for optimum concrete mixtures. Cem. Concr. Compos. 2007, 29, 193–202. [Google Scholar] [CrossRef]
  27. Yeh, I.-C. Optimization of concrete mix proportioning using a flattened simplex–centroid mixture design and neural networks. Eng. Comput. 2009, 25, 179–190. [Google Scholar] [CrossRef]
  28. Babu, K.G.; Prakash, P.V.S. Efficiency of silica fume in concrete. Cem. Concr. Res. 1995, 25, 1273–1283. [Google Scholar] [CrossRef]
  29. Duval, R.; Kadri, E.H. Influence of silica fume on the workability and the compressive strength of high-performance concretes. Cem. Concr. Res. 1998, 28, 533–547. [Google Scholar] [CrossRef]
  30. Lim, C.-H.; Yoon, Y.-S.; Kim, J.-H. Genetic algorithm in mix proportioning of high-performance concrete. Cem. Concr. Res. 2004, 34, 409–420. [Google Scholar] [CrossRef]
  31. Kadri, E.H.; Aggoun, S.; De Schutter, G. Interaction between C3A, silica fume and naphthalene sulphonate superplasticiser in high performance concrete. Constr. Build. Mater. 2009, 23, 3124–3128. [Google Scholar] [CrossRef]
  32. Bilal, H.; Chen, T.; Ren, M.; Gao, X.; Su, A. Influence of silica fume, metakaolin & SBR latex on strength and durability performance of pervious concrete. Constr. Build. Mater. 2021, 275, 122124. [Google Scholar] [CrossRef]
  33. Mo, Z.; Gao, X.; Su, A. Mechanical performances and microstructures of metakaolin contained UHPC matrix under steam curing conditions. Constr. Build. Mater. 2021, 268, 121112. [Google Scholar] [CrossRef]
  34. Zhang, J.; Chen, T.; Gao, X. Incorporation of self-ignited coal gangue in steam cured precast concrete. J. Clean. Prod. 2021, 292, 126004. [Google Scholar] [CrossRef]
  35. CEN. Eurocode 2: Design of Concrete Structures; British Standards Institution: London, UK, 2006. [Google Scholar]
  36. Kwon, S.J.; Na, U.J.; Park, S.S.; Jung, S.H. Service life prediction of concrete wharves with early-aged crack: Probabilistic approach for chloride diffusion. Struct. Saf. 2009, 31, 75–83. [Google Scholar] [CrossRef]
Figure 1. Framework of optimal design.
Buildings 12 01580 g001
Figure 2. Performance of Case 1: Mixes 1–4 (low CO2 without carbonation).
Buildings 12 01580 g002
Figure 3. Performance of Case 2: Mixes 5–8 (low CO2 with carbonation).
Buildings 12 01580 g003aBuildings 12 01580 g003b
Figure 4. Performance of Case 3: Mixes 9–12 (low material cost).
Buildings 12 01580 g004aBuildings 12 01580 g004b
Figure 5. Performance of Case 4: Mixes 13–16 (low total cost).
Buildings 12 01580 g005
Figure 6. Increases in CO2 concentration and temperature under RCP8.5.
Buildings 12 01580 g006
Figure 7. Performance of Case 5: Mixes 17–20 (low total cost with global warming).
Buildings 12 01580 g007aBuildings 12 01580 g007b
Table 1. CO2 emissions, cost, and density of concrete components [19,24].
CementSilica FumeWaterCoarse AggregateFine AggregateSuperplasticizer
CO2 emissions (kg/kg)0.830.000310.0001960.00750.00260.25
Cost (TWD/kg)2.2522.50.010.300.2525.1
Density (kg/m3)315022001000254026001200
Table 2. Upper and lower mass boundaries of concrete components.
CementSilica FumeWaterCoarse AggregateFine Aggregate
Lower mass boundary500120780600
Upper mass boundary54030025011501100
Table 3. Upper and lower ratio boundaries of concrete components.
Water/BinderSF/BinderSand/AggregateAggregate/BinderWater/Solid
Low ratio boundary0.250.050.402.70.08
Upper ratio boundary0.850.150.528.40.12
Table 4. Optimal design cases of SF-modified concrete.
CasesMixturesAimCarbonation ConstraintDesign Strength
Case 1Mixes 1–4Low CO2No carbonation30, 40, 50, 60 MPa
Case 2Mixes 5–8Low CO2Carbonation30, 40, 50, 60 MPa
Case 3Mixes 9–12Low material costCarbonation30, 40, 50, 60 MPa
Case 4Mixes 13–16Low total costCarbonation30, 40, 50, 60 MPa
Case 5Mixes 17–20Low total costCarbonation with global warming30, 40, 50, 60 MPa
Table 5. Highlighted points of design cases.
Highlighted PointComparison
CarbonationCase 1 to Case 2
Difference between low-CO2 and low-material-cost concreteCase 2 to Case 3
Difference between low-material-cost and low-total-cost concreteCase 3 to Case 4
Global warmingCase 4 to Case 5
Table 6. Optimal design mixtures for Case 1: low-CO2 concrete without carbonation (unit: kg/m3).
CementSFWaterFine AggregateCoarse
Aggregate
Superplasticizer
Mix 1210.3037.11168.23964.87890.657.66
Mix 2254.1644.85168.43939.33867.079.41
Mix 3294.5651.98168.68916.24845.7610.57
Mix 4332.4258.66168.95894.83826.0011.39
Table 7. Performance of optimal design mixtures for Case 1: low-CO2 concrete without carbonation.
Strength
(MPa)
Slump
(mm)
CO2 Emissions
(kg/m3)
Carbonation
Depth (mm)
Water/Binder
Ratio
SF/Binder
Ratio
Water/Solid Ratio
Mix 130.00261.11185.6943.070.680.150.08
Mix 240.00239.22222.3030.010.560.150.08
Mix 350.00225.02255.9021.470.490.150.08
Mix 460.00214.98287.3315.530.430.150.08
Table 8. Optimal design mixtures for Case 2: low-CO2 concrete with carbonation (unit: kg/m3).
CementSFWaterFine AggregateCoarse
Aggregate
Superplasticizer
Mix 5276.3148.76168.56926.63855.3510.09
Mix 6
(Mix 5)
276.3148.76168.56926.63855.3510.09
Mix 7294.5651.98168.68916.24845.7610.57
Mix 8332.4258.66168.95894.83826.0011.39
Table 9. Performance of optimal design mixtures for Case 2: low-CO2 concrete with carbonation.
Strength
(MPa)
Slump
(mm)
CO2 Emissions
(kg/m3)
Carbonation
Depth (mm)
Water/Binder
Ratio
SF/Binder
Ratio
Mix 545.39230.90240.7325.000.520.15
Mix 645.39230.90240.7325.000.520.15
Mix 750.00225.02255.9021.470.490.15
Mix 860.00214.98287.3315.530.430.15
Table 10. Optimal design mixtures for Case 3: low-material-cost concrete with carbonation (unit: kg/m3).
CementSFWaterFine AggregateCoarse
Aggregate
Superplasticizer
Mix 9287.7915.15169.60944.90872.216.40
Mix 10338.9917.84170.08919.96849.197.25
Mix 11393.5420.71170.62893.61824.877.91
Mix 12444.7823.41171.15868.99802.148.38
Table 11. Performance of optimal design mixtures for Case 3: low-material-cost concrete with carbonation.
Strength
(MPa)
Slump
(mm)
Material Cost
(TWD/m3)
Carbonation
Depth (mm)
Water/Binder
Ratio
SF/binder
Ratio
Mix 931.28243.111648.5625.000.560.05
Mix 1040.00227.421832.5016.550.480.05
Mix 1150.00215.442022.5010.340.410.05
Mix 1260.00207.062197.357.730.370.05
Table 12. Optimal design mixtures for Case 4: low-total-cost concrete with carbonation (unit: kg/m3).
CementSFWaterFine AggregateCoarse
Aggregate
Superplasticizer
Mix 13 (Mix 9)287.7915.15169.60944.90872.216.40
Mix 14
(Mix 10)
338.9917.84170.08919.96849.197.25
Mix 15
(Mix 11)
393.5420.71170.62893.61824.877.91
Mix 16
(Mix 12)
444.7823.41171.15868.99802.148.38
Table 13. Optimal design mixtures for Case 5: low-total-cost concrete with global warming (unit: kg/m3).
CementSFWaterFine AggregateCoarse
Aggregate
Superplasticizer
Mix 17300.8315.83169.72938.52866.336.64
Mix 18
(Mix 10)
338.9917.84170.08919.96849.197.25
Mix 19
(Mix 11)
393.5420.71170.62893.61824.877.91
Mix 20
(Mix 12)
444.7823.41171.15868.99802.148.38
Table 14. Performance of optimal design mixtures for Case 5: low-total-cost concrete with global warming.
Strength
(MPa)
Slump
(mm)
Total
Cost
(TWD/m3)
Carbonation
Depth (mm)
Water/Binder
Ratio
SF/Binder
Ratio
Mix 1733.44238.581920.7225.000.540.05
Mix 1840.00227.422084.4518.350.480.05
Mix 1950.00215.442313.4311.470.410.05
Mix 2060.00207.062524.898.580.370.05
Publisher’s Note: MDPI stays neutral with regard to jurisdictional claims in published maps and institutional affiliations.

