Article

Experimental and Numerical Investigation of the Cross-Sectional Mechanical Behavior of a Steel–Concrete Immersed Tube Tunnel

1
CCCC Highway Bridges National Engineering Research Center Co., Ltd., Beijing 100120, China
2
Shenzhen-Zhongshan Link Administration Center, Zhongshan 528449, China
3
School of Civil Engineering, Beijing Jiaotong University, Beijing 100044, China
*
Authors to whom correspondence should be addressed.
Buildings 2022, 12(10), 1553; https://doi.org/10.3390/buildings12101553
Submission received: 8 September 2022 / Revised: 21 September 2022 / Accepted: 23 September 2022 / Published: 28 September 2022
(This article belongs to the Special Issue Steel-Concrete Composite Structures: Design and Construction)

Abstract

:
This paper presents a proposed static test and numerical study on the mechanical properties of steel-shell–concrete-structure-immersed tunnel nodes, which is used to investigate the seismic performance and damage mechanism of steel-shell–concrete-structure-immersed tunnel nodes. The test is based on the immersed tube tunnel project in the deep China channel, and the nodes representing the outermost and innermost vertical walls of the immersed tube tunnel, i.e., L-shaped and T-shaped node specimens, were designed and fabricated at a scale of 1:5, and the specimens were mainly subjected to the combined effect of vertical axial compression and lateral displacement loads. The test results show that the L-shaped node will exhibit brittle damage characteristics with high lateral load carrying capacity and energy dissipation capacity during the ultimate load phase, while the T-shaped node exhibits bending damage with better ductility, so the outermost vertical wall should be locally reinforced to ensure the necessary ductility of the structure in the actual project. In addition, by comparing the numerical calculation and experimental results, it is found that there is good agreement in terms of load–displacement curves and crack distribution, which shows that the modeling method proposed in this paper can accurately simulate the mechanical properties of immersed tunnel nodes and can guide the section design of immersed tunnels with steel shell–concrete structures.

1. Introduction

Due to the good mechanical properties of the double steel plate–concrete combination structure, it has been used in a large number of applications, including in marine structures, nuclear structures and some other protective structures. Moreover, part of the tunnel structure also uses a double steel plate–concrete combination structure. At present, many studies have been conducted on the mechanical properties of the double steel plate–concrete structure, but research on its seismic performance is still lacking.
In the construction of an immersed tunnel, a number of prefabricated pipes are floated to the site, which sink one by one, and then the connection between the pipes in the water is completed. Finally, the construction of related works is carried out so that these pipes form a whole to become a tunnel-type transportation carrier for land traffic at both ends of the water body [1]. Immersed tube tunnels work well in areas with poor foundation conditions, especially in areas where soft foundations, riverbeds or seabeds are shallow and easy to excavate with water-based dredging equipment. The main structural forms of immersed tube tunnels are reinforced concrete structures, steel shell structures and steel–concrete combination structures [2]. Steel shell immersed tube tunnels emerged in the United States, and reinforced concrete immersed tube tunnels emerged in Europe [3]. The world’s first immersed tube tunnel for traffic was the Detroit River Railway Tunnel in the United States in 1910, which used a steel shell structure. Subsequently, almost at the same time, the two countries of Britain and Japan built on the basis of these two technologies and proposed a double steel plate–concrete combination immersed tube tunnel, also known as a sandwich steel mixed combination immersed tube tunnel, and Japan applied this technology to the construction of an actual tunnel project [2].
A double steel plate–concrete composite structure is a new high-performance composite structure [
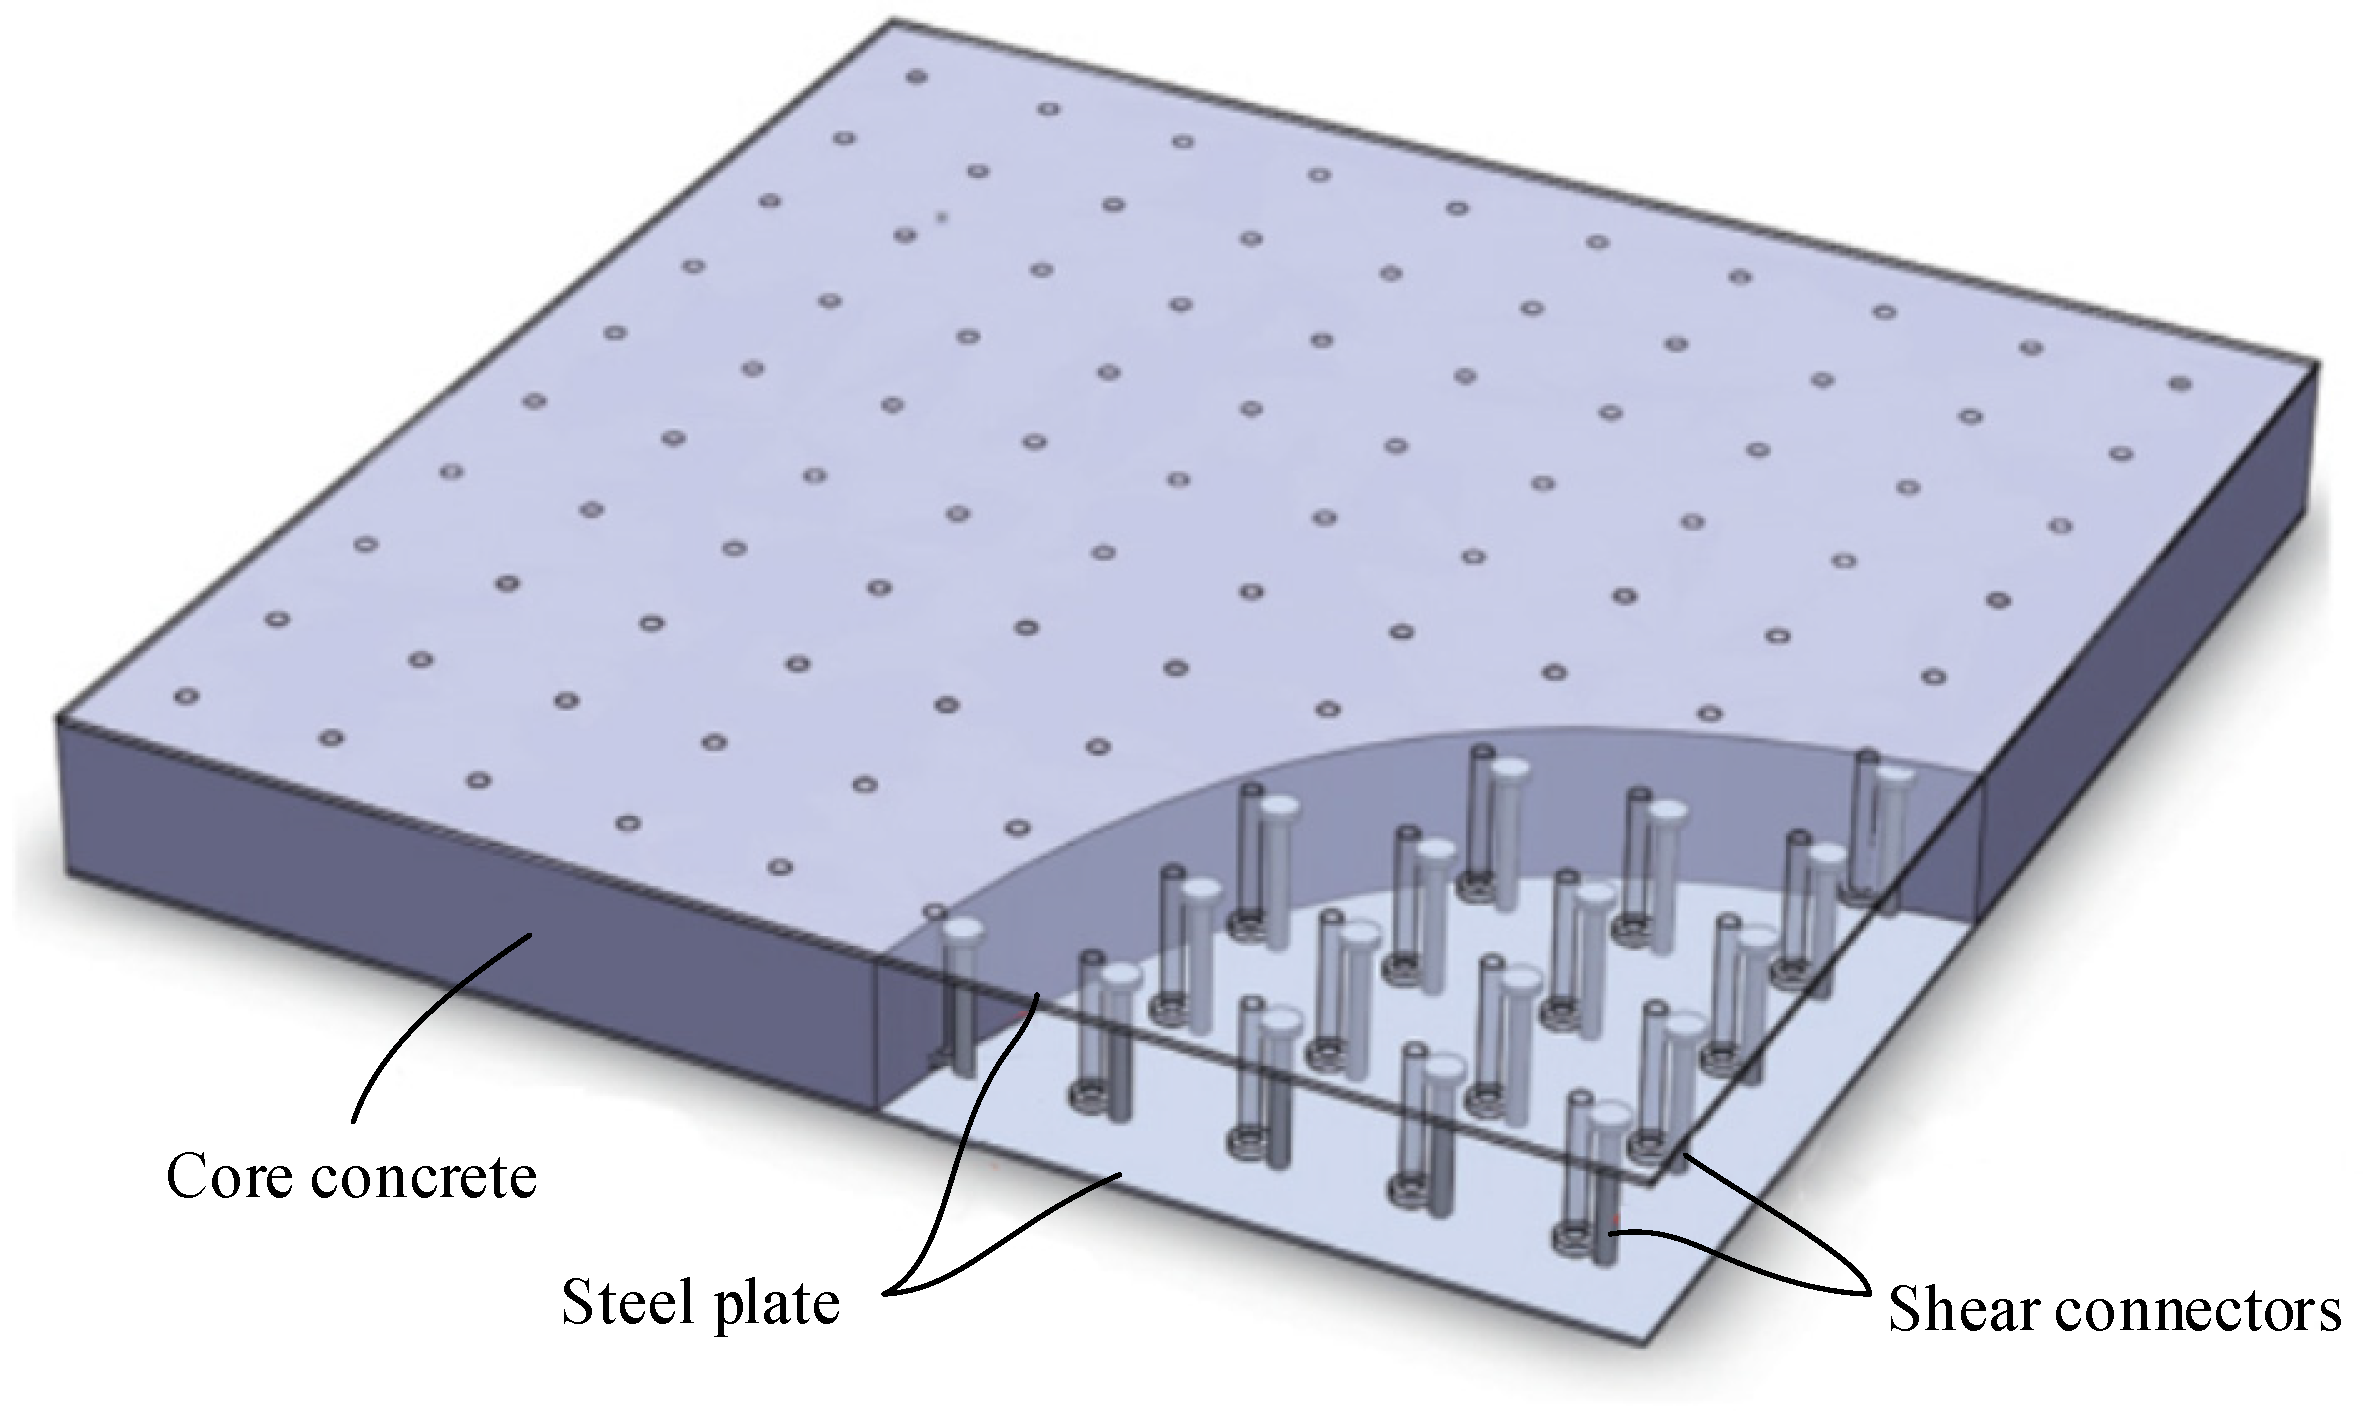
4]. In foreign countries, it is known as an SCS composite structure (steel–concrete–steel composite structure) or DCS composite structure (double skin composite structure). In China, it is sometimes called a steel plate composite structure. The composition of this structure is shown in Figure 1 [5]. Usually, the shear connectors are first connected between the two clad steel plates and installed in place on both sides of the steel plate, and, finally, the concrete is filled inside the two sides of the steel plate so that the clad steel plate and the core concrete (high-performance concrete and ordinary concrete) can be closely combined through the pegs, thus forming a combination of high shear strength structural systems. This structure can make full use of the material properties of concrete and steel [6]. Under load, the internal concrete is in a three-direction stress state with enhanced strength and plasticity, while the outer clad steel plates do not buckle prematurely under the tension of the shear connectors and the support of the concrete. Hence, this structure has the advantages of high strength, high stiffness, good ductility, good impact resistance and good construction efficiency.
Research on double plate-concrete composite structures started in the 1970s and can be broadly divided into two directions: wall elements [7], which are usually monolithic, T-shaped and L-shaped shear walls of buildings and are mainly related to in-plane performance, and beam elements, which are generally used for marine elements, protective structures and tunnel structures [8] and are mainly related to out-of-plane performance. In 1975, Montague [9] developed a double steel plate–concrete combination structure oil storage cylinder for oil extraction and storage in the North Sea. In 1976, Solomon et al. [10] proposed a double steel plate–concrete combination structure with structural adhesive bonding at the steel-mixed interface for large- and medium-span bridge panels. In 1977, to improve the performance of traditional reinforced concrete (RC) structures or prestressed concrete (PC) structures under the combined effects of temperature, internal pressure and strong bottom restraint, Ichikawa et al. [11] proposed the use of a double steel liner as the containment structure for nuclear power plant buildings. In the early double steel plate–concrete combination structure, the steel plate and concrete mainly relied on the interfacial bonding force between them to work together, and the force was prone to slip damage. Later, to optimize the design, shear joints were gradually used in the steel–concrete combined structure, and the addition of shear joints led to a substantial improvement in the structural integrity and stiffness. In 1986, Tomlinson et al. [12] proposed an overlapping pinned double steel plate–concrete combined structure form in the Welsh Trans-Conwy River immersed tunnel project. Subsequently, a large number of studies on sandwich structure immersed tube tunnels were carried out in the UK [13], 1:3 physical model experiments were conducted and the British Steel Construction Association developed a design code for double steel plate–concrete combination structures in 1994 [14], but no actual projects of sandwich structure immersed tube tunnels were subsequently built. In 1988, Japan proposed a combination of steel shell, bulkhead, ribs and inner filling. In 1988, Japan proposed a compartmentalized double steel plate–concrete combination immersed tube structure with a combined layer of concrete and built sandwich steel–concrete combination immersed tube tunnels, such as the Kobe Port Island Tunnel (1999), Naha Tunnel (2011) and New Wakato Tunnel (2012). The proposed completion of the Deep China Passage in 2024 is the first time in China that a new steel shell–concrete combined structure of an immersed tube tunnel was implemented, and it adopted a steel shell immersed tube design similar to the “sandwich” structure.
The above studies show that, with the further development of marine structures, nuclear structures, protective structures and tunnel structures, a large number of research reports related to double steel plate–concrete combined structures have appeared at home and abroad. However, since the actual number of tunnels built with double steel plate–concrete combined structures is quite small, and their structural systems are not as clear and explicit as reinforced concrete or steel structures, some mechanical performance indicators of structural immersed tube tunnels still need to be verified. Therefore, based on a deep-medium immersed tube tunnel project, this paper carries out research related to the seismic performance and damage mechanism of steel-shell–concrete-structure-immersed tube tunnel nodes under earthquake action.

2. Experimental Program

2.1. Design of Test Pieces

The tests were conducted in the context of the immersed tunnel project in the Shenzhen–Zhongshan Bridge, which meets the requirements of “Code for Design of Road Tunnel (JTG D70-2004)” [15], “General Specification for Design of Highway Bridge and Culverts (JTG D60-2015) ” [16] and “Code for Quality and Acceptance of Concrete Structure Construction (GB50204-2015)x [17]. The immersed tunnel of Shenzhen–Zhongshan Bridge project is an SCS composite structure with the symmetrical cross section shown in Figure 2. Based on the design of immersed tunnel, L-shaped and T-shaped node specimens were designed. The two nodes in the tunnel are shown in Figure 2. Among them, both the L-shaped and T-shaped specimens have a scaling ratio of 1:5, representing the nodes at the outermost and innermost vertical walls, respectively.
The design details of the T-shaped and L-shaped specimens are shown in Figure 3 and Figure 4. As shown, the T-shaped specimen is 1750 mm high and 1900 mm long, and the thickness values of the base plate and vertical wall are 300 mm and 160 mm, respectively. The L-shaped specimen is 1800 mm high and 2100 mm long, and the thickness values of the base plate and vertical wall of the specimen are 300 mm. The dimension has less influence on the results. Therefore, the longitudinal length of both the L-shaped and T-shaped node specimens in this paper is taken as 600 mm.

2.2. Material Properties

The casting and curing of the concrete were carried out at the National Engineering Research Center for Bridges in Gu’an in China, and the specimens were made of commercial concrete with a C50 strength grade. After 28 days of curing, the compressive strength of the cubes was measured as 49.8 MPa according to the standard test method [18]. Three different strength grades of steel were used for the steel plates, Q345, Q390 and Q420, and the average values of the flexural strength ratio and elongation of the different grades of steel were 1.39 and 0.32, respectively. The measured material parameters of each grade of steel are detailed in Table 1.

2.3. Loading Devices

The cross section of the immersed tube tunnel of the main project of the Shenzhen–Zhongshan Channel adopts the design scheme of two holes and one tube gallery, and the load working conditions are schematically shown in Figure 5 during the normal use phase. The calculated water depth of the tunnel is 16.54 m. The thickness of the top gravel backfill is 2 m, and the net back silting thickness is 11.14 m. The gravity of former is 22 kN/m3 and the latter is 15 kN/m3. The tunnel is fully loaded with 5 vehicles in a single hole laterally. The vehicle load is adopted from “General Specification for Design of Highway Bridge and Culverts (JTG D60-2015)” [16]. The calculation takes a longitudinal 15 m of tunnel and assumes that the vehicle loads within the selected range can be distributed over the entire hole. To analyze the internal force of the structure in the normal use phase, a 1-meter-long structure was taken as the object of analysis, and, using Midas Civil, a two-dimensional frame model was established, and the force test was carried out on the cross section of the tube section in the operation phase. According to the results of the analysis, the vertical axial force at the root section of the outer wall is 4242 kN and that of the inner wall is 4460 kN. These two sections are critical sections for the specimens.
The loading devices for the L- and T-node specimens are shown in Figure 6a,b, respectively. As seen from the figures, a transverse hydraulic servo with a maximum loading tonnage of ±3000 kN and a displacement stroke of ±300 mm is connected to the specimen at one end to apply the reciprocating load and to the reaction wall at the other end. The axial pressure load is applied by a hydraulic jack arranged on top of the specimen. One end of the vertical jack is connected to the steel beam at the top of the nodal specimen to apply a uniform load. The other end of the jack is connected to the top reaction beam by a row of rollers, with the aim of ensuring that the direction of the axial load acting on the top of the member is always vertically downward during the loading process. To achieve the stress level of each specimen at the operational stage of loading, concentrated load values of 502.4 kN and 531.6 kN were applied to the top of the L-shaped and T-shaped node specimens, respectively, through the jacks. The compressive stresses at the critical sections in the action of the combination of the two mentioned loads and the self-weight are the same as those calculated by Midas Civil. In addition, baffles were arranged on both sides of the base plate along the loading direction to suppress the potential slippage of the specimens during the loading process.

2.4. Loading System

In this paper, a proposed static test was carried out for the nodal specimens of an immersed tube tunnel, and the loading regime referred to the seismic test procedure for buildings [19]. During the test, the axial compression load is first applied to the specimen and kept constant during the application of the reciprocal load so that the member is at a stress level consistent with the loading condition of the immersed tunnel in its operational phase. During the lateral load application, the basic principles are as follows: (1) the test uses a displacement control loading system; (2) for L-shaped node specimens, each level of loading is cycled once. For the T-shaped node specimen, before the structure yields, each level of loading is cycled once, and, after yielding, each level of loading is cycled twice. When the lateral load capacity of the member drops to 85% of the peak load capacity or there is a sharp drop in the vertical load capacity, the structure is defined as having failed and the loading is terminated. The loading regimes for the L-shaped and T-shaped nodes with time are shown in Figure 7a,b. In the loading test, the positive and negative directions are agreed upon as follows: the direction is defined as positive when the actuator applies thrust and vice versa.

2.5. Measurement Solution

The lateral load applied during the loading test was measured by a transducer built into the actuator, and the vertical load was measured by a transducer connected to the jack. Displacement sensors were arranged along the height of the specimen, where the lateral displacement of the center of the actuator was measured by the sensor arranged on the other side of the specimen at the same height position. Considering the possible relative slip between the bottom plate and the base of the specimen during the test, displacement gauges are arranged in the middle of the bottom plate along the loading direction to monitor the potential slip between them during the test. This study focuses on the seismic performance of steel-shell–concrete-structure-immersed tunnel nodes with steel sections as the structural skeleton; concrete is filled inside and the structure lacks reinforcement. To monitor the development of the steel plate and concrete deformation, strain gauges were arranged at key locations of the structure, and the specific measurement points were arranged as shown in Figure 8a,b.

3. Analysis of Experimental Results

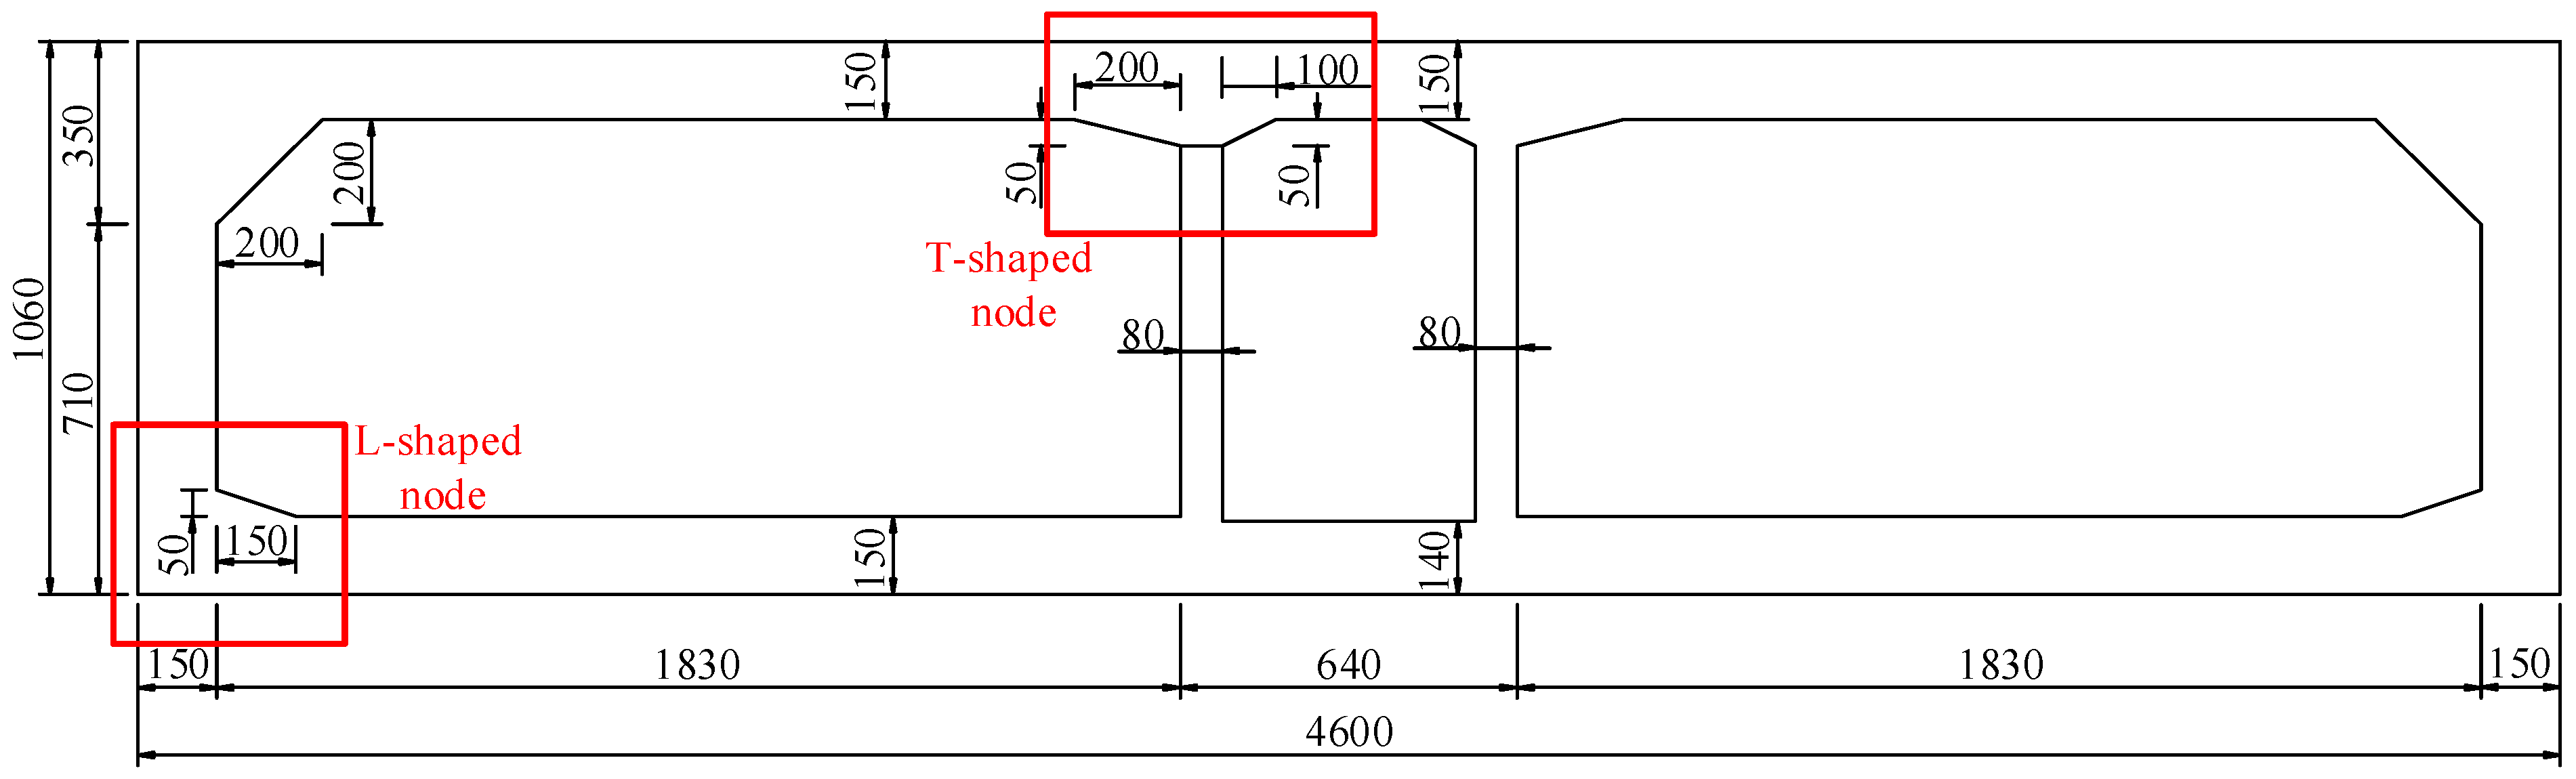
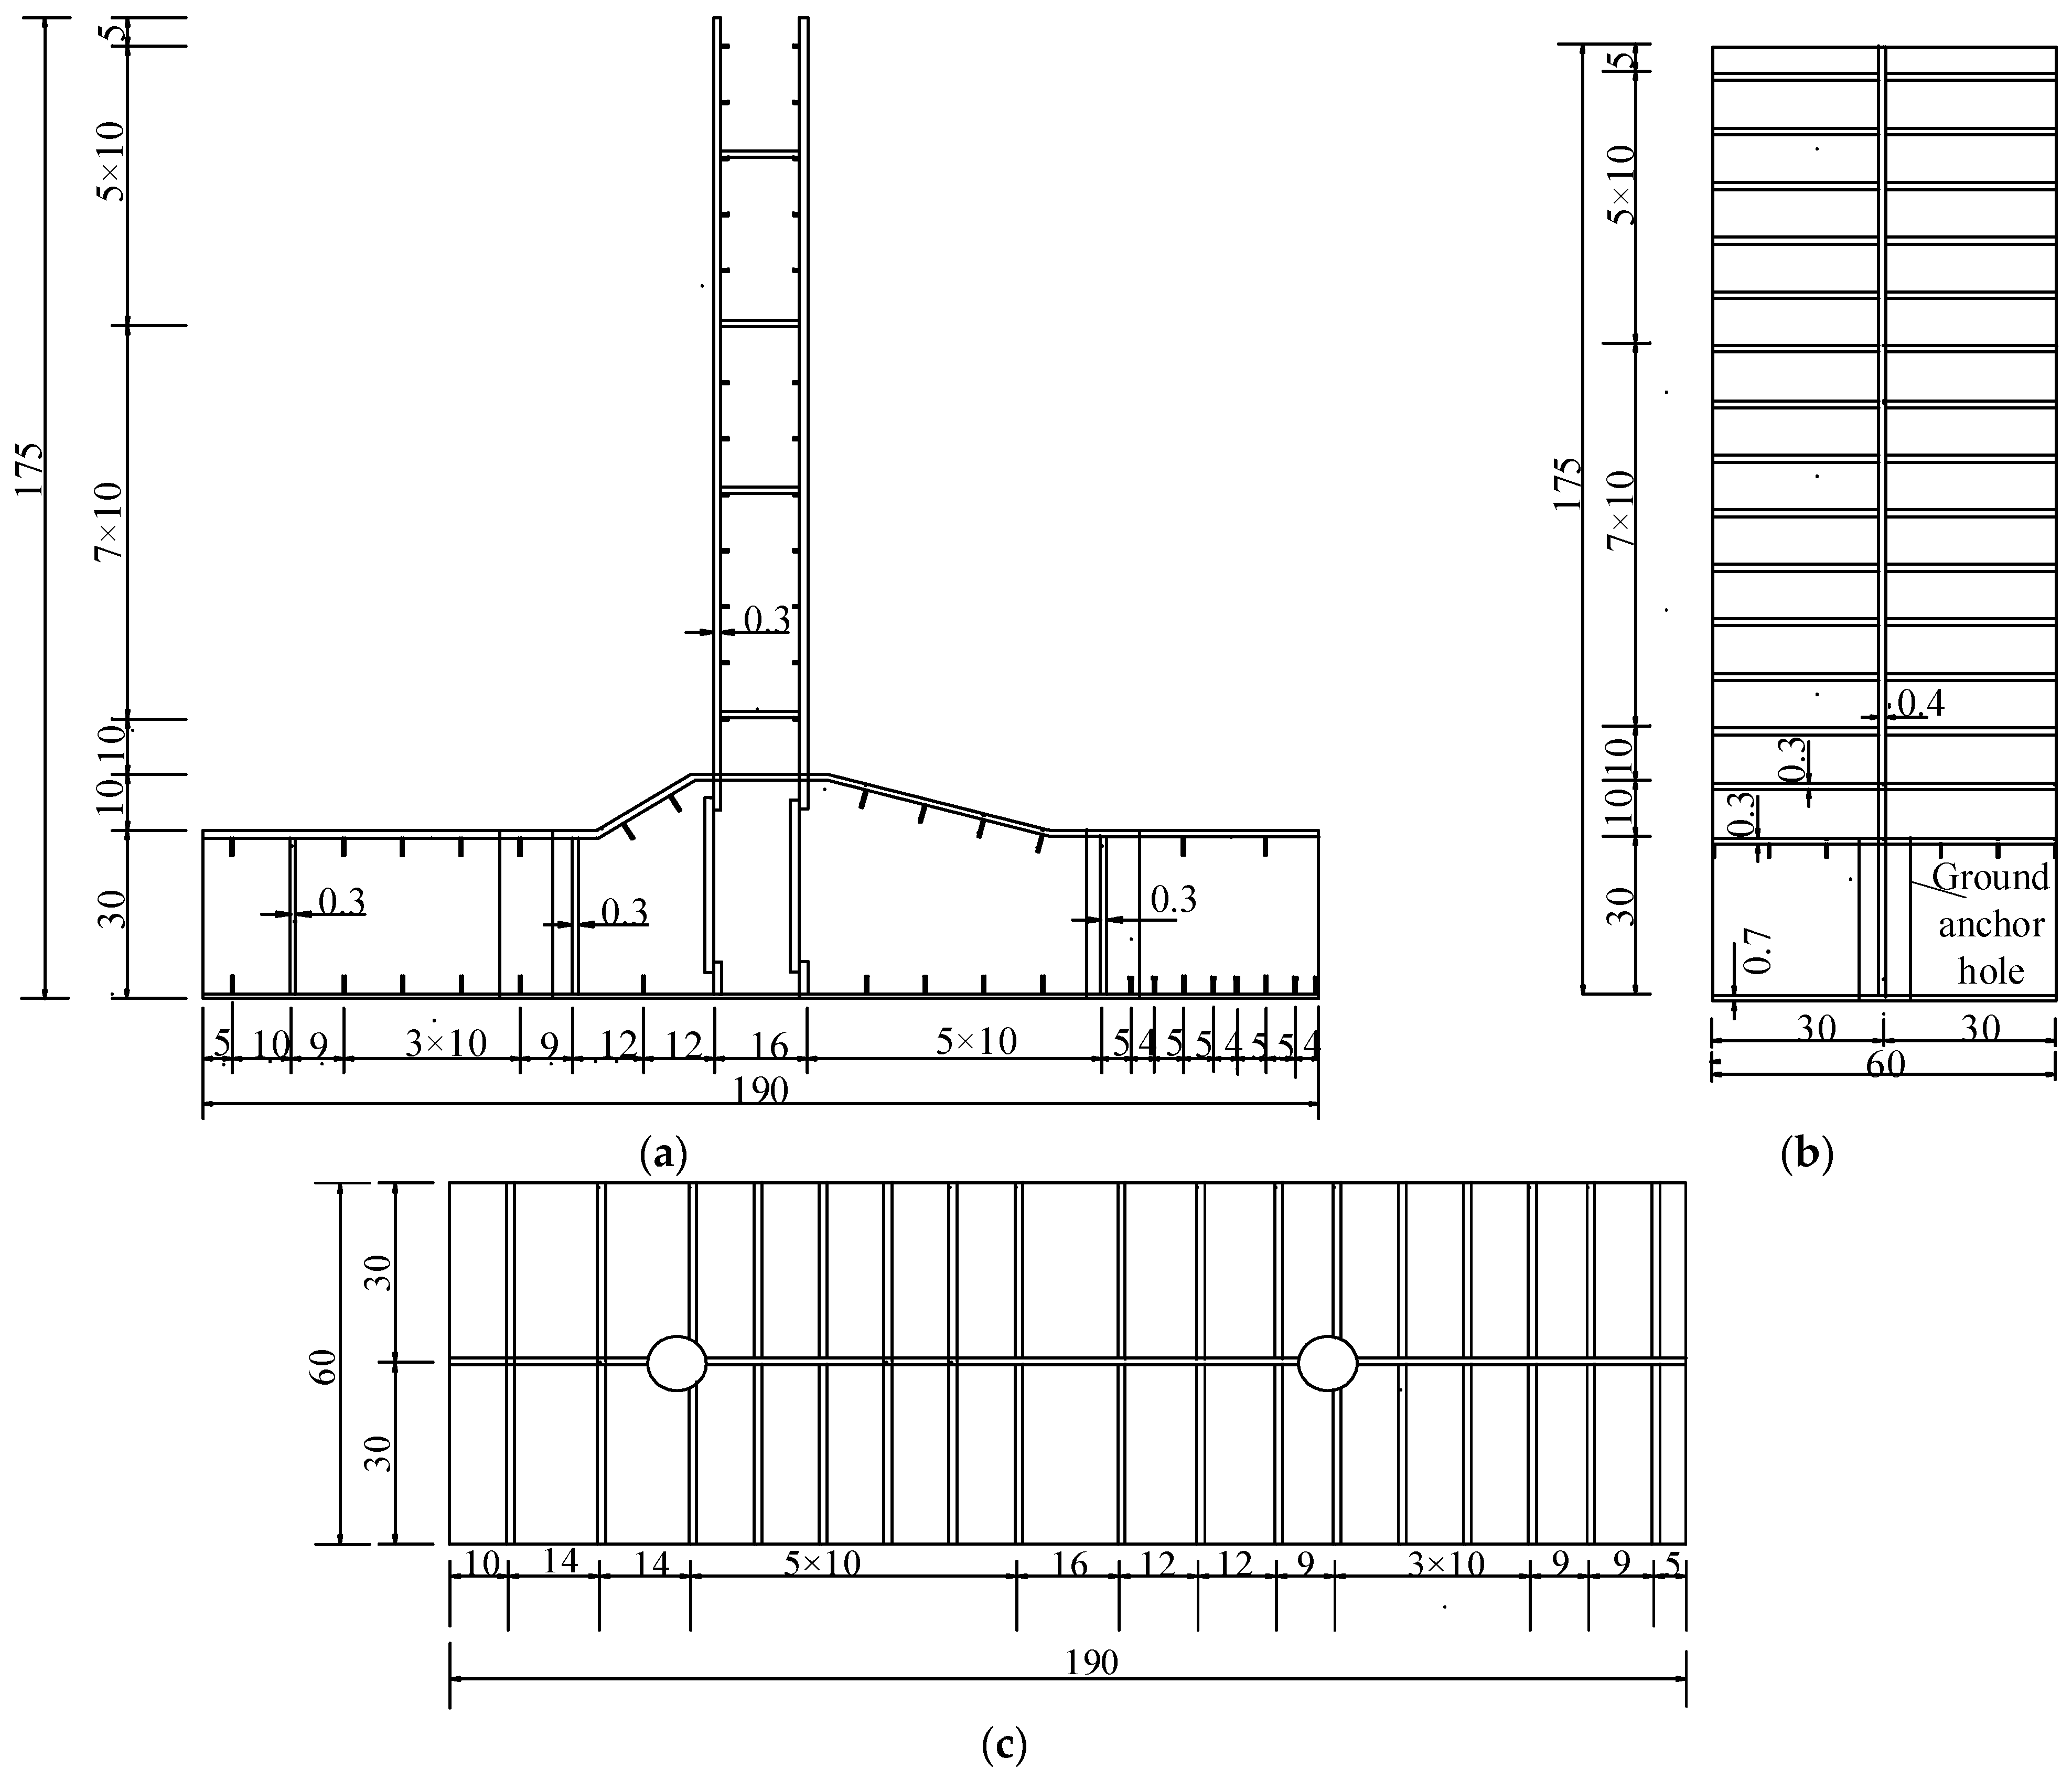
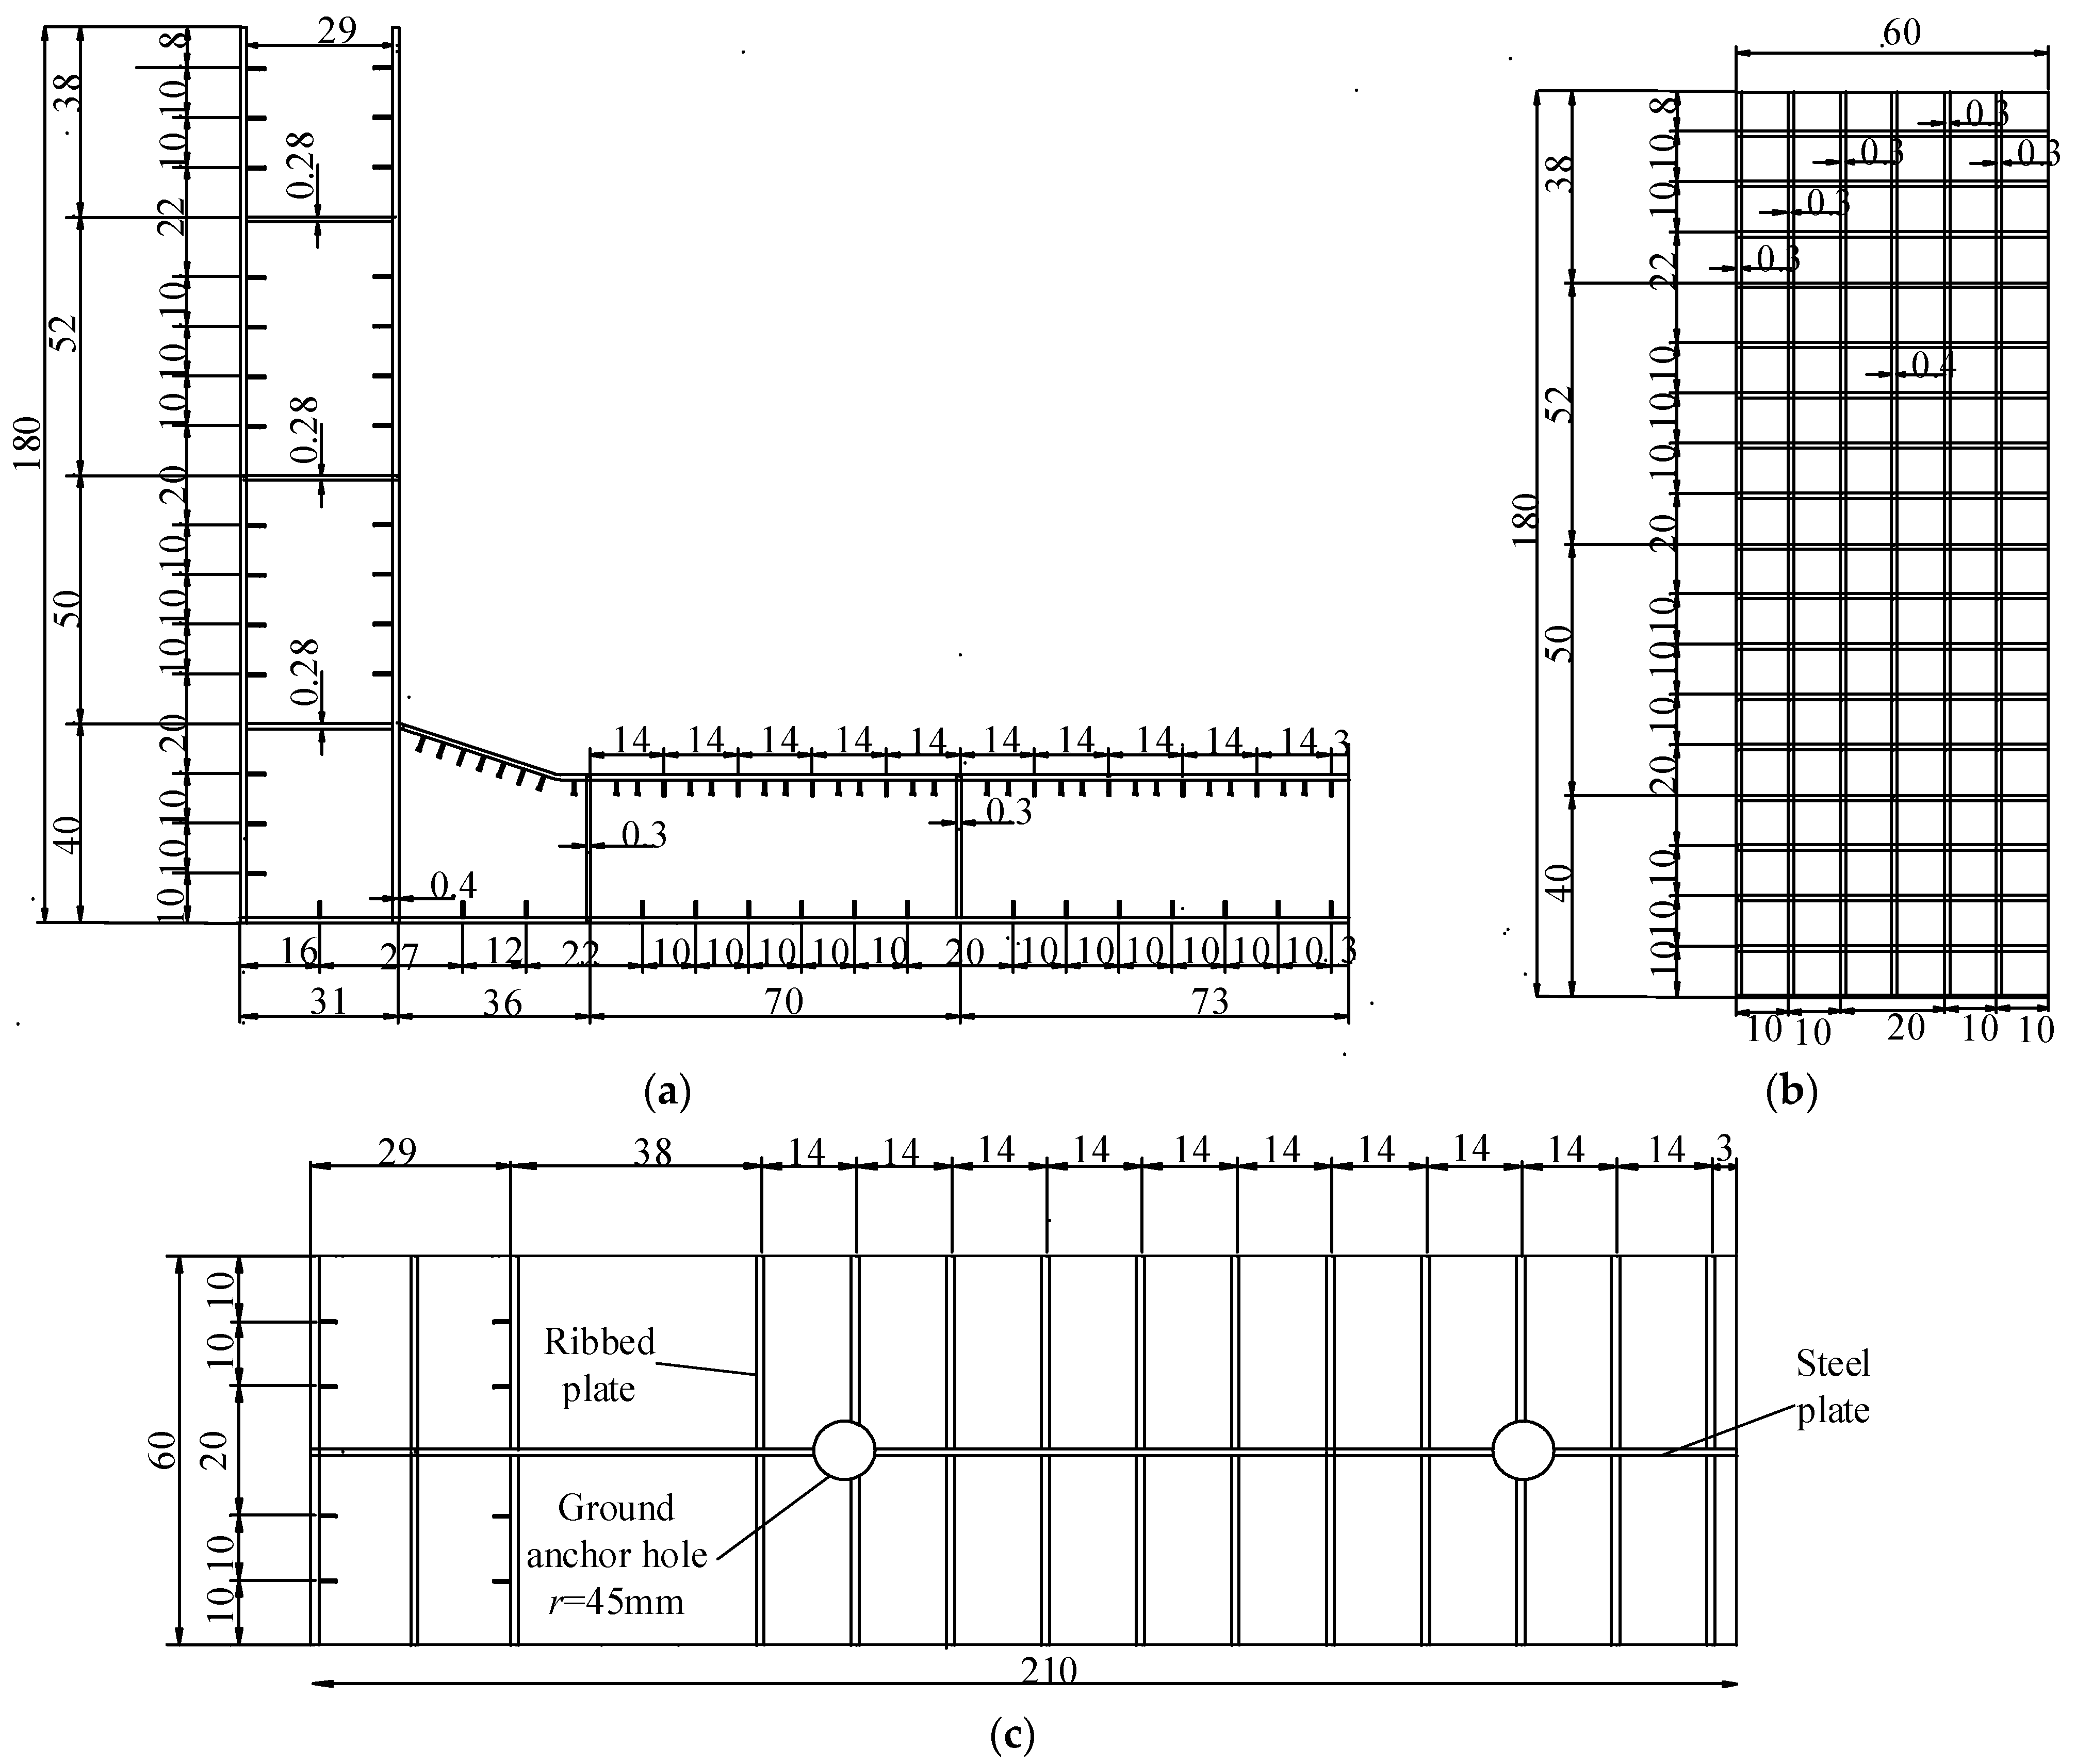
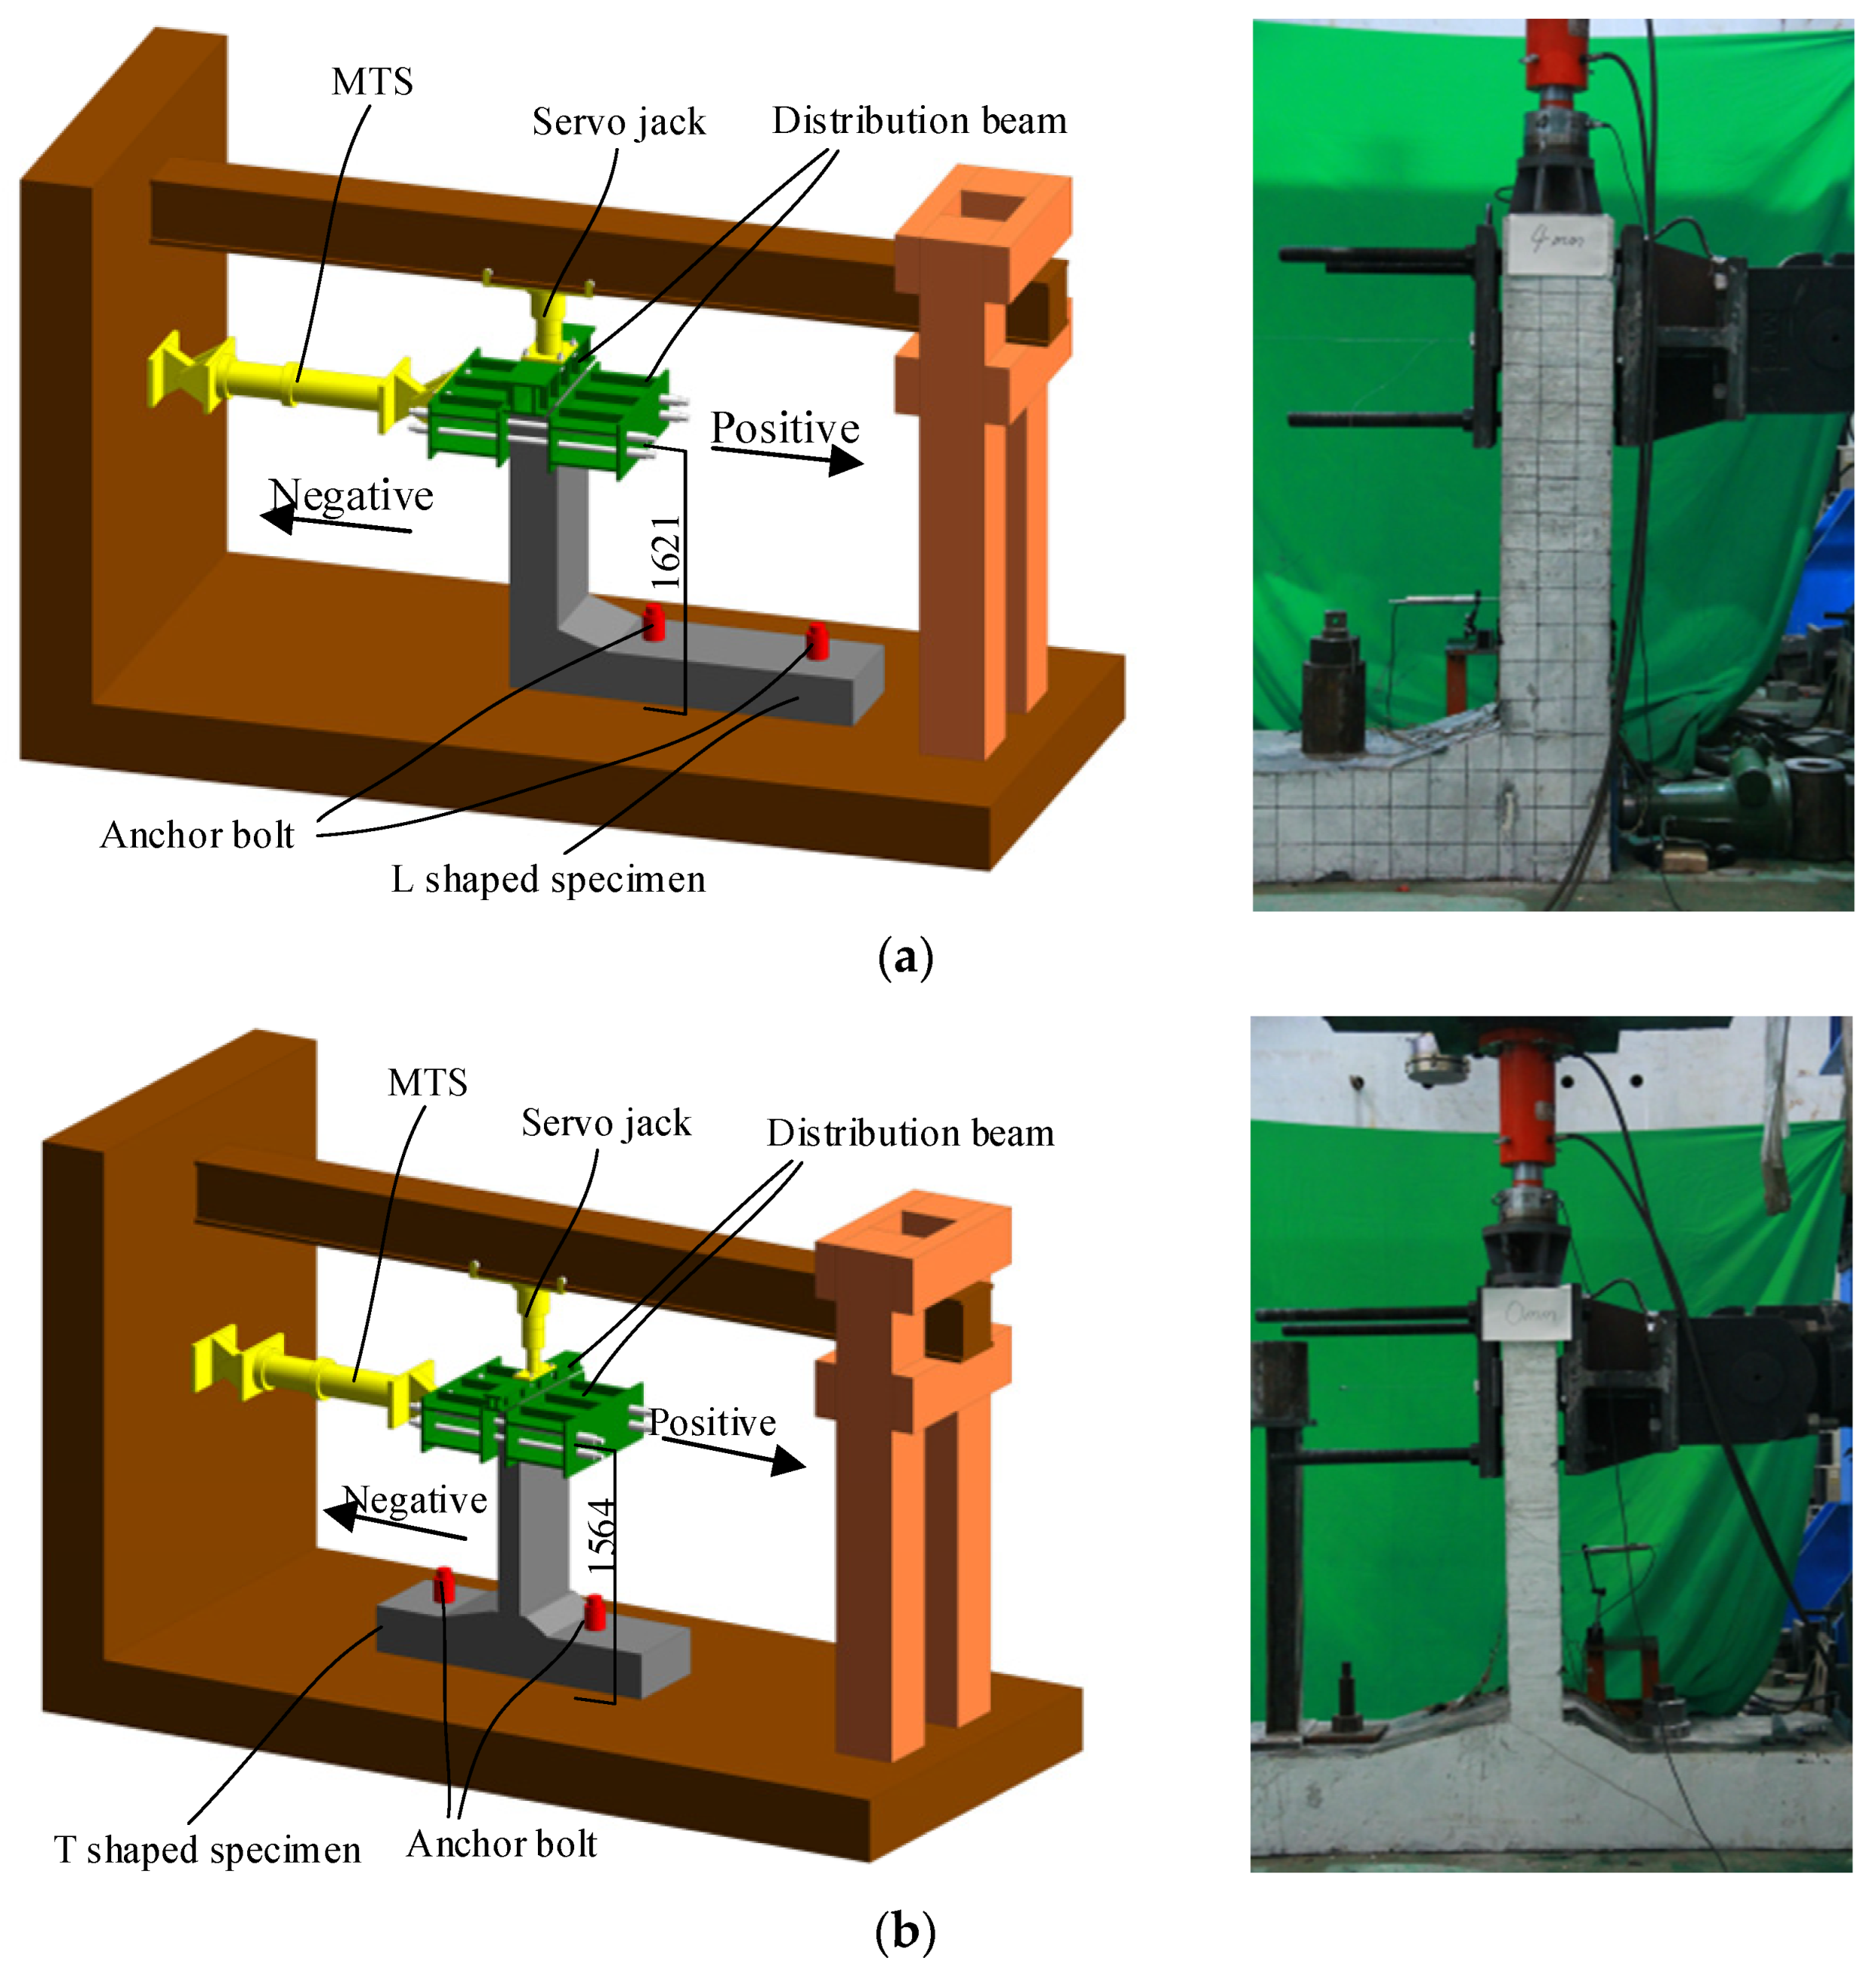
To study the seismic performance of immersed tunnel nodes of steel shell–concrete structures, this paper relies on actual projects—designs of L- and T-shaped reduced-scale specimens of an immersed tunnel—and completes the proposed static test loading. The main results of the tests are provided in this section, including the observation of damage phenomena, load–displacement hysteresis curves, skeleton curves and cumulative hysteresis energy dissipation. Based on the observations of structural deformation and crack distribution under all levels of loading, the damage mechanism of immersed tunnel nodes under earthquake action is analyzed. Further analysis of the load carrying capacity, ductility, deformation and energy dissipation capacity of the immersed tunnel nodes is carried out using the measured structural load–displacement curves.

3.1. Damage Observation

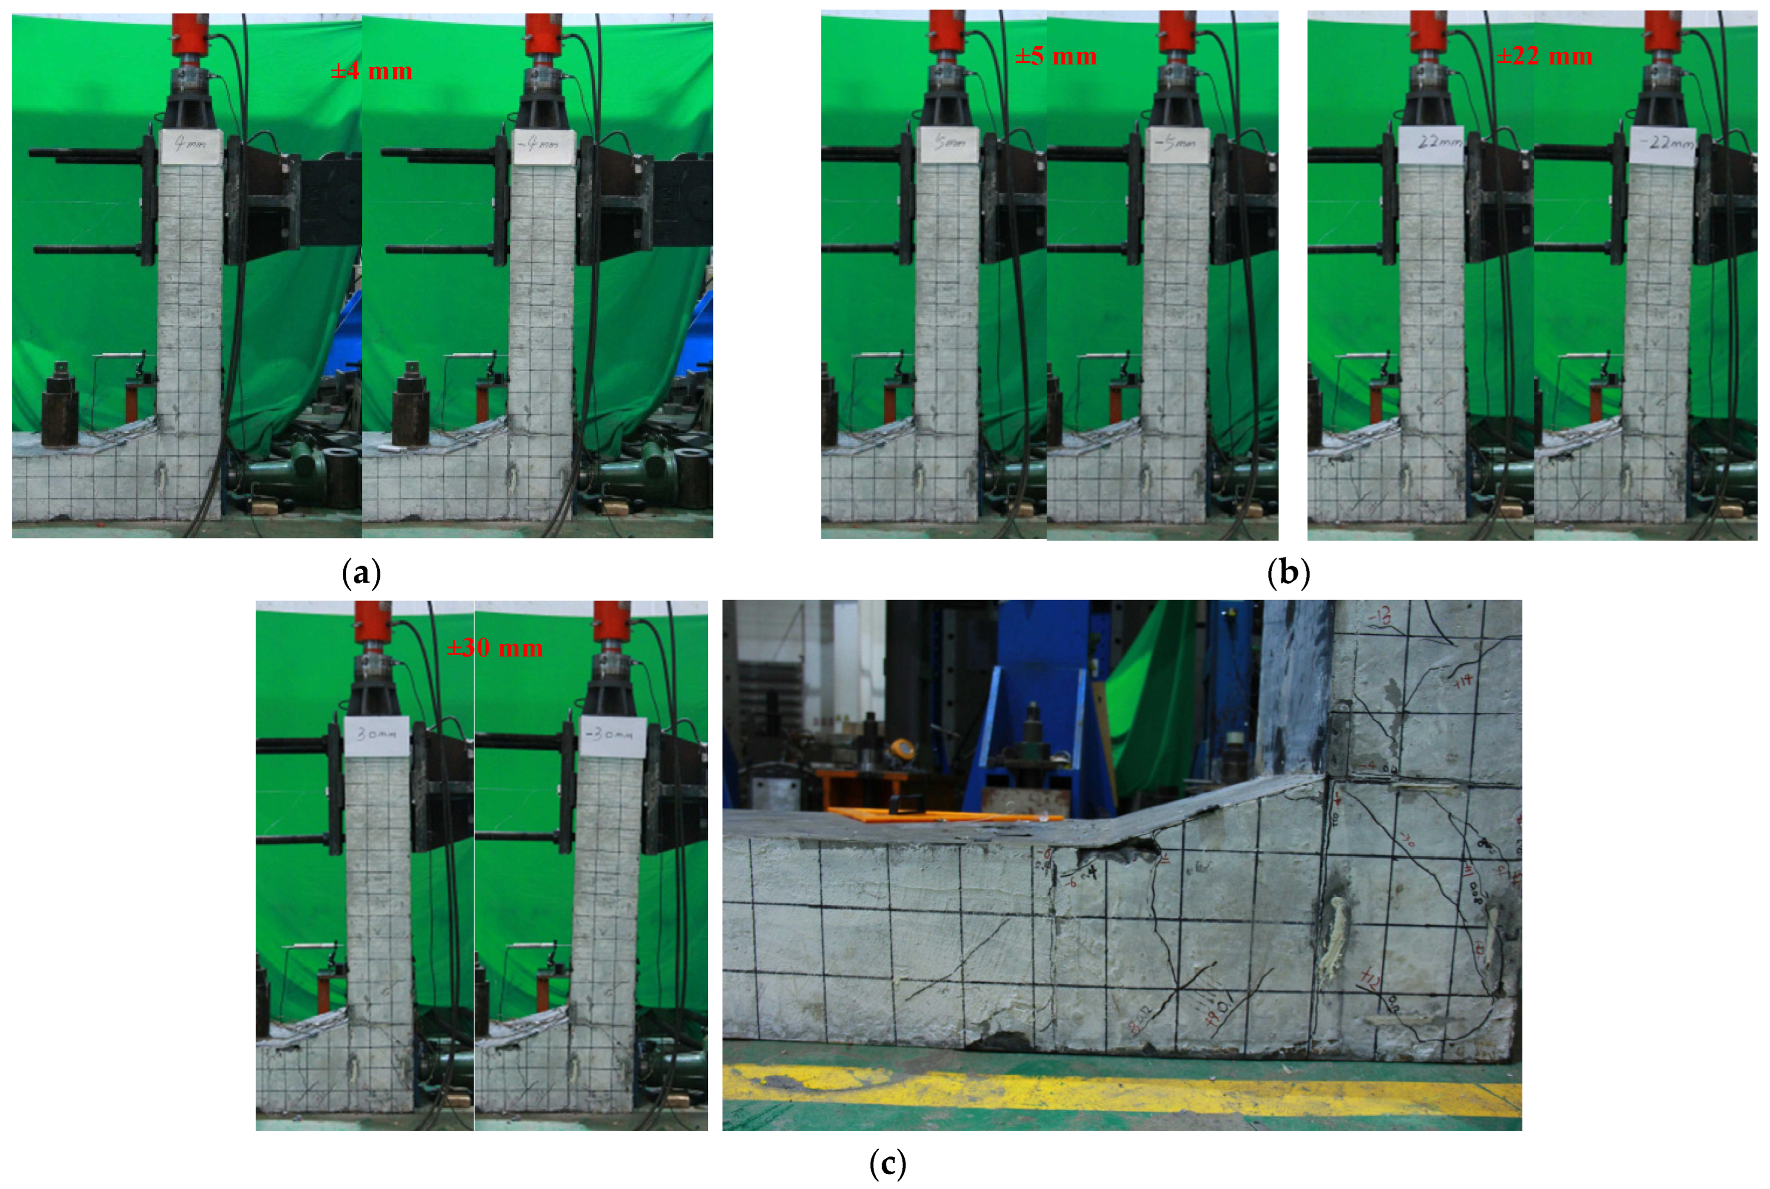
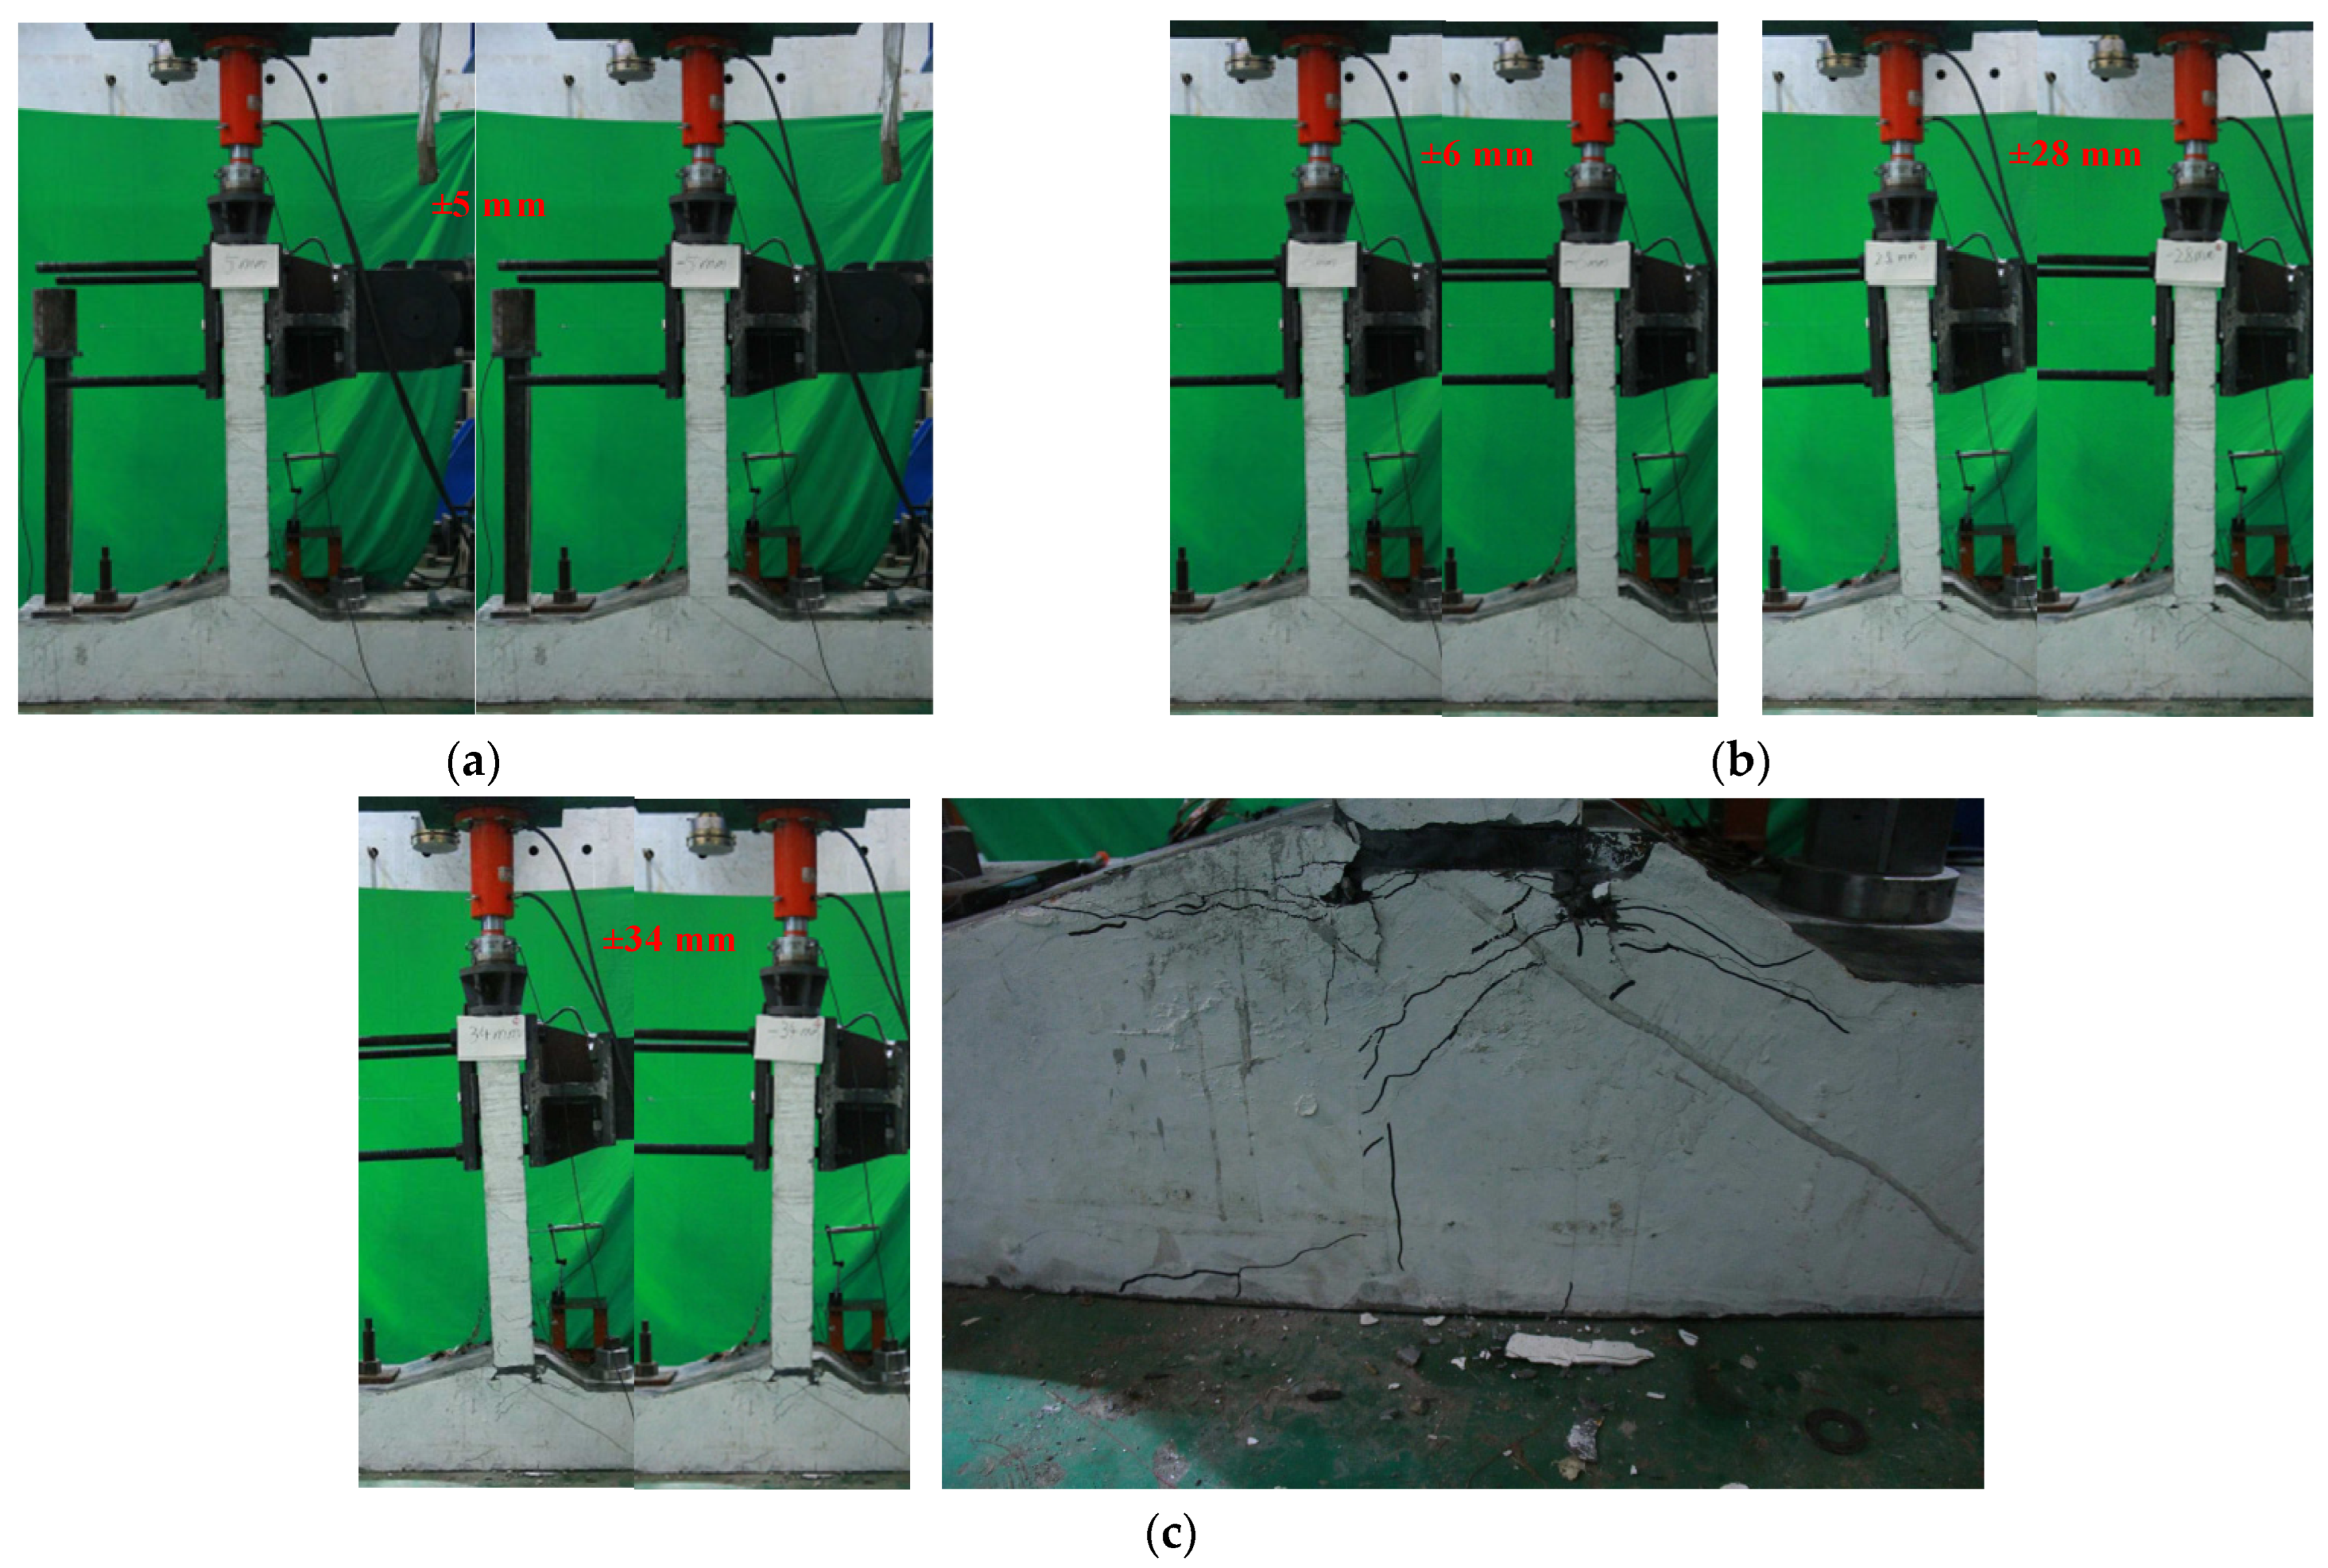
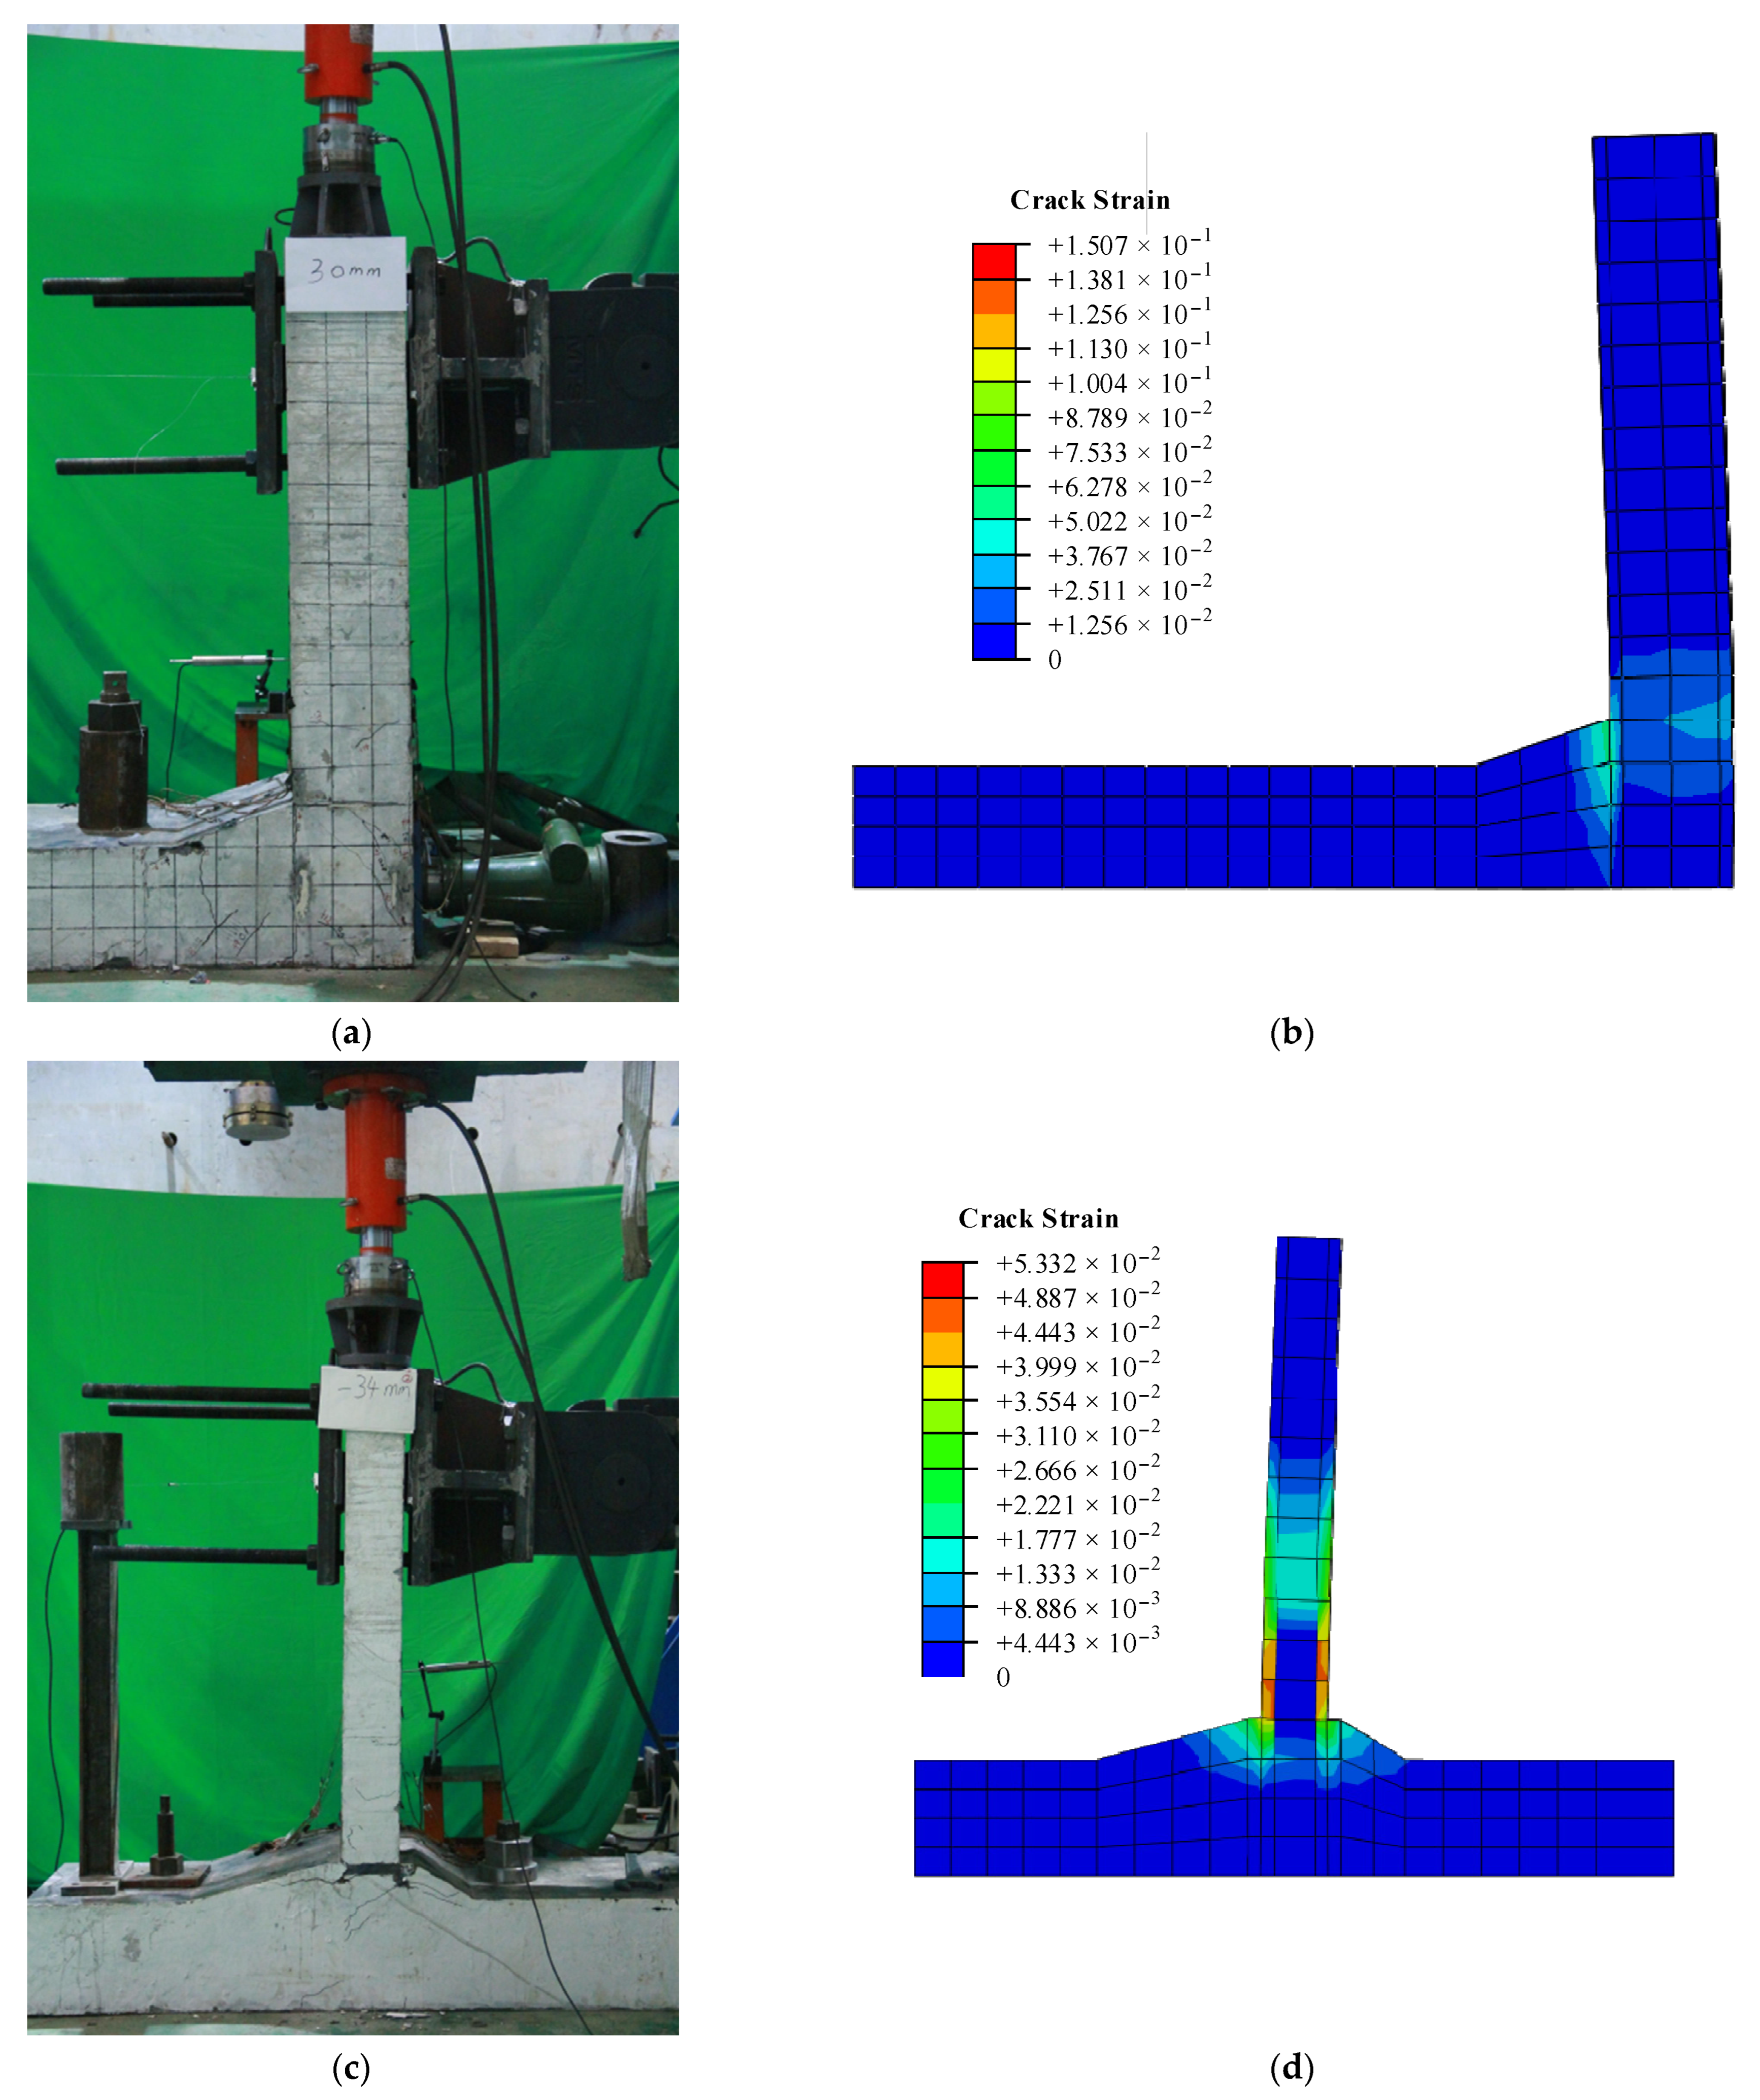
To accurately capture the damage process of the specimens and clarify the damage mechanism, the crack development and distribution on the surface of the members were observed by the crack observer at the end of each loading level. The observed crack distribution of the L-shaped and T-shaped nodal specimens at the end of each loading level is presented in Figure 9 and Figure 10.
For the L-shaped node specimen, the specimen showed no cracks when the displacement of the loaded end increased from 0 to 4 mm. When the lateral displacement increased to 5 mm, a microcrack along the vertical through-length was produced in the core area of the node near the axillary corner position, and the crack width was 0.22 mm, accompanied by slight noise from the deformation of the steel plate. With a further increase in load, the cracks in the core area further developed, and several diagonal cracks appeared near the location of the bottom plate. At the same time, transverse tension cracks appeared in the concrete at the upper part of the axillary angle and gradually developed along the through-length. When the lateral displacement reached 13 mm, concrete spalling occurred near the lower part of the axillary angle. At the same time, transverse tension cracks appeared at the position of the vertical wall approximately 20 cm above the height range of the core area. As the load increased, the cracks developed further, and the concrete kept spalling off from the surface of the specimen, accompanied by a loud sound from the deformation of the steel plate. The lateral displacement increased from 22 mm to 30 mm, and oblique cracks appeared in the lower right corner of the bottom slab and gradually developed and penetrated along the core area. The lateral displacement reached 30 mm, the steel plate and concrete fell off in the axillary corner and core area and the structure cracked significantly. The analysis concluded that the steel plate and concrete could not work together at this time: the structure failed and showed brittle damage characteristics.
For the T-node specimen, the lateral displacement increased from 0 to 5 mm, and no obvious cracks were observed on the surface of the member. The lateral displacement increased from 6 mm to 9 mm, and transverse bending cracks appeared on the face parallel to the loading direction at the vertical wall position and gradually propagated upward, accompanied by a slight noise from the deformation of the steel plate. With increasing load, the cracks in the core area of the node developed continuously. The lateral displacement increased from 16 mm to 22 mm, the width of the crack in the core area further increased and the bending crack at the location near the axillary corner gradually developed to pass along the lateral length. At the same time, the concrete located at the upper corner point of the core area showed slight spalling. The lateral displacement reached 28 mm, the concrete cracking width at the position where the vertical wall intersected with the axillary angle further increased and the concrete on the surface of the member kept spalling. When the lateral displacement reached 34 mm, a large amount of concrete spalling occurred on the surface of the core area, and the steel plate at the intersection of the vertical wall and the axillary angle was peeled off from the concrete, accompanied by a large noise from the structure. At this time, the lateral bearing capacity of the member dropped to 85% of the peak bearing capacity, and the structure failed. From the loading test results, it can be seen that, under the action of reciprocating loading, the T-node specimen underwent more favorable bending damage.

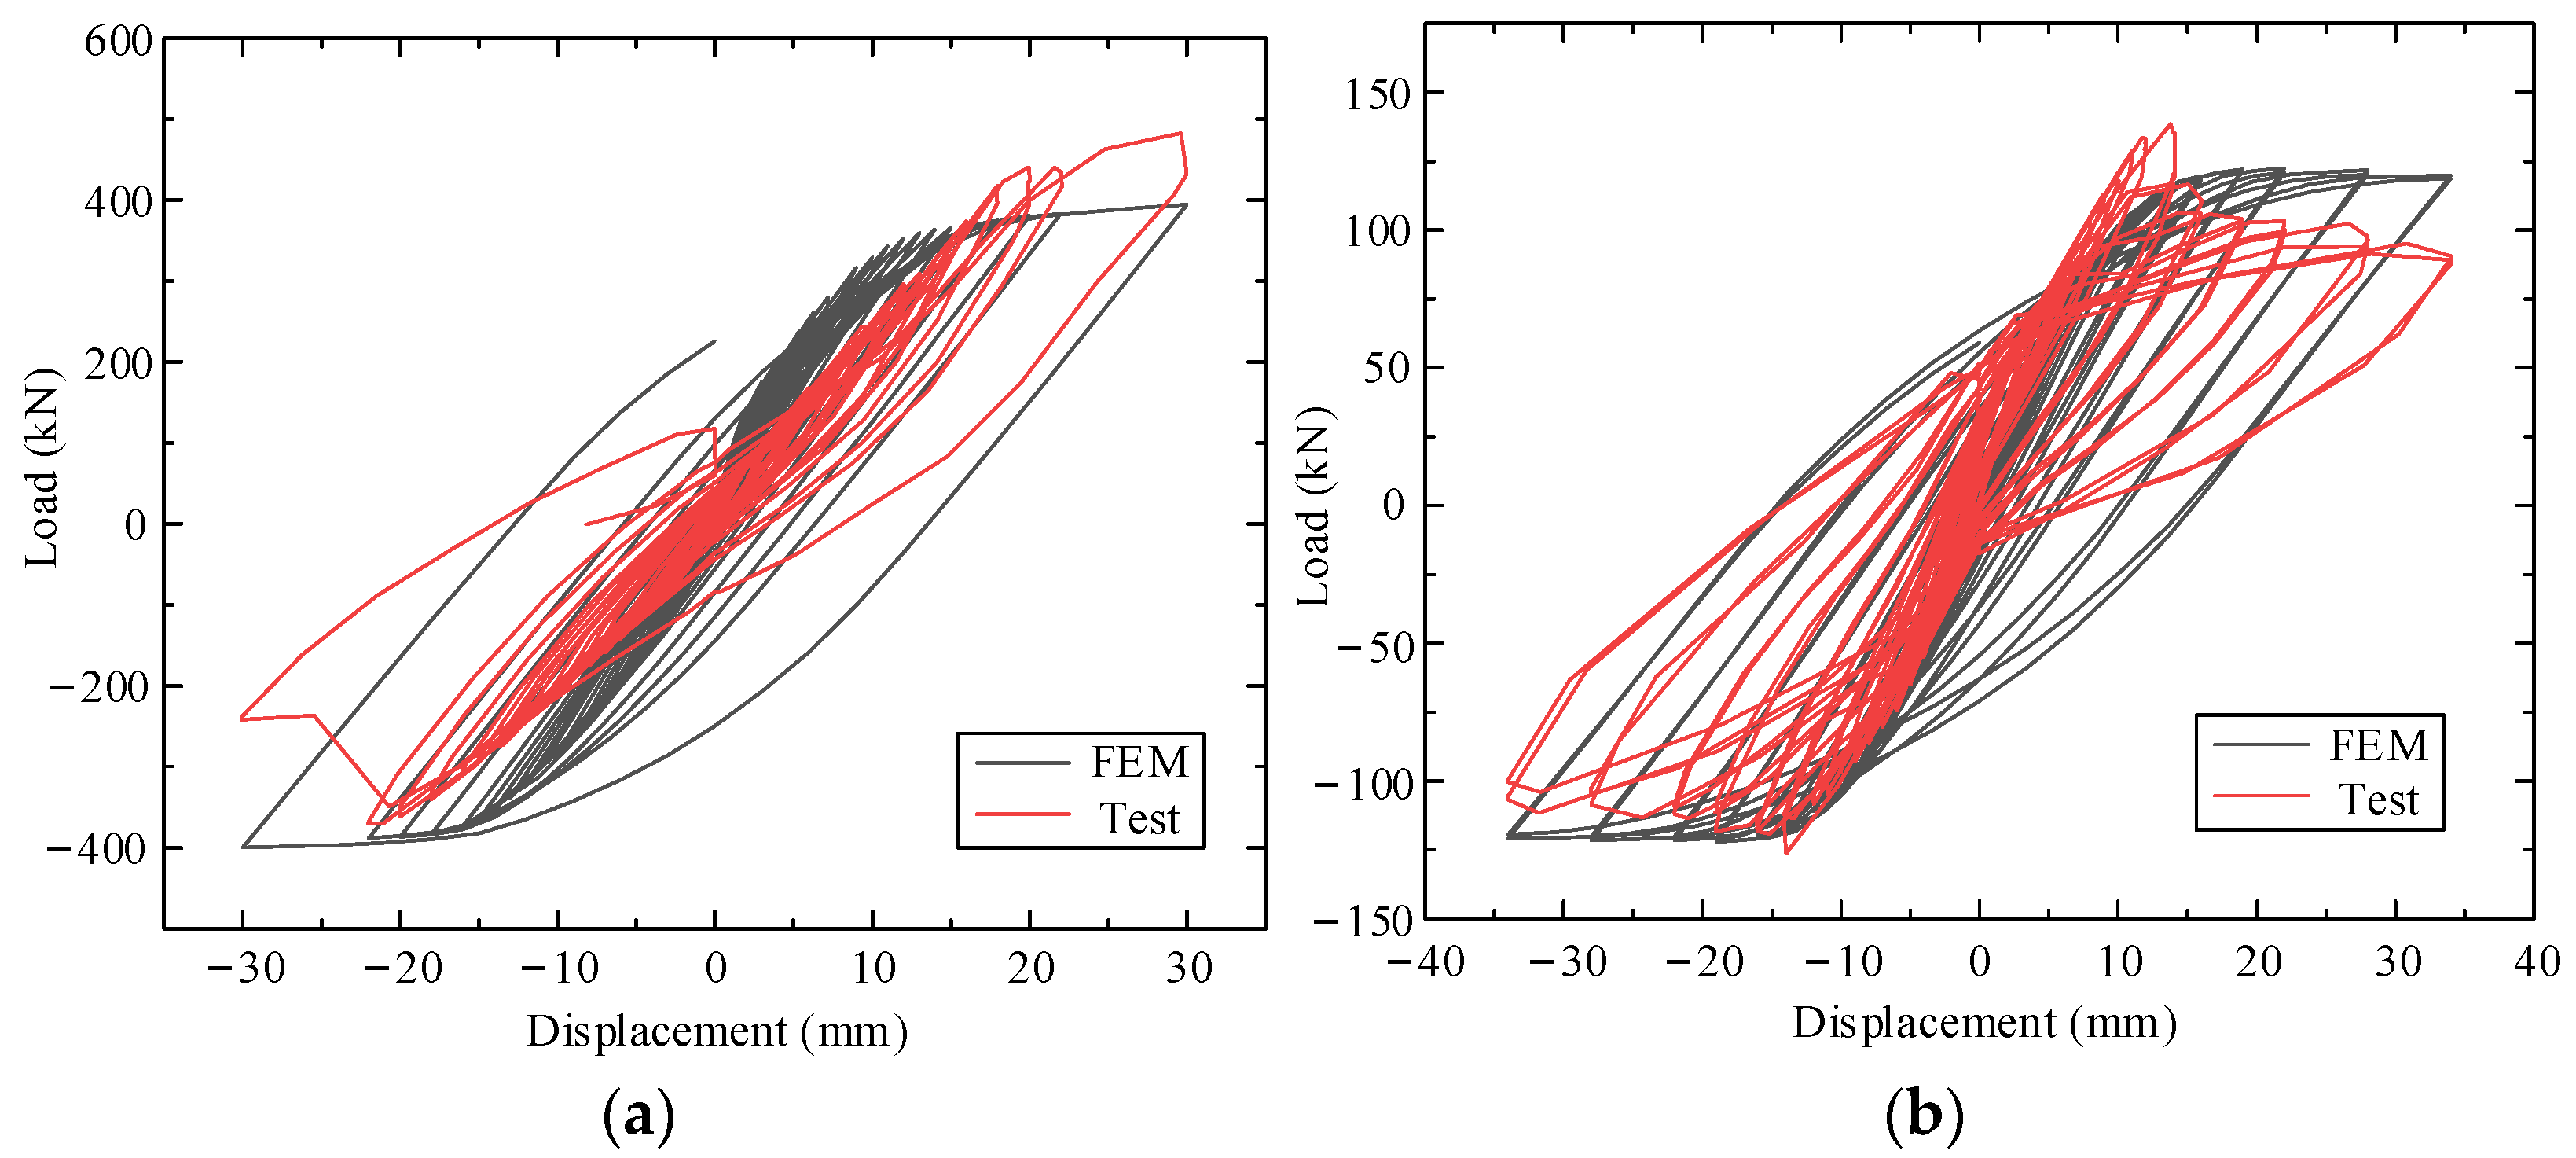
3.2. Load–Displacement Curves

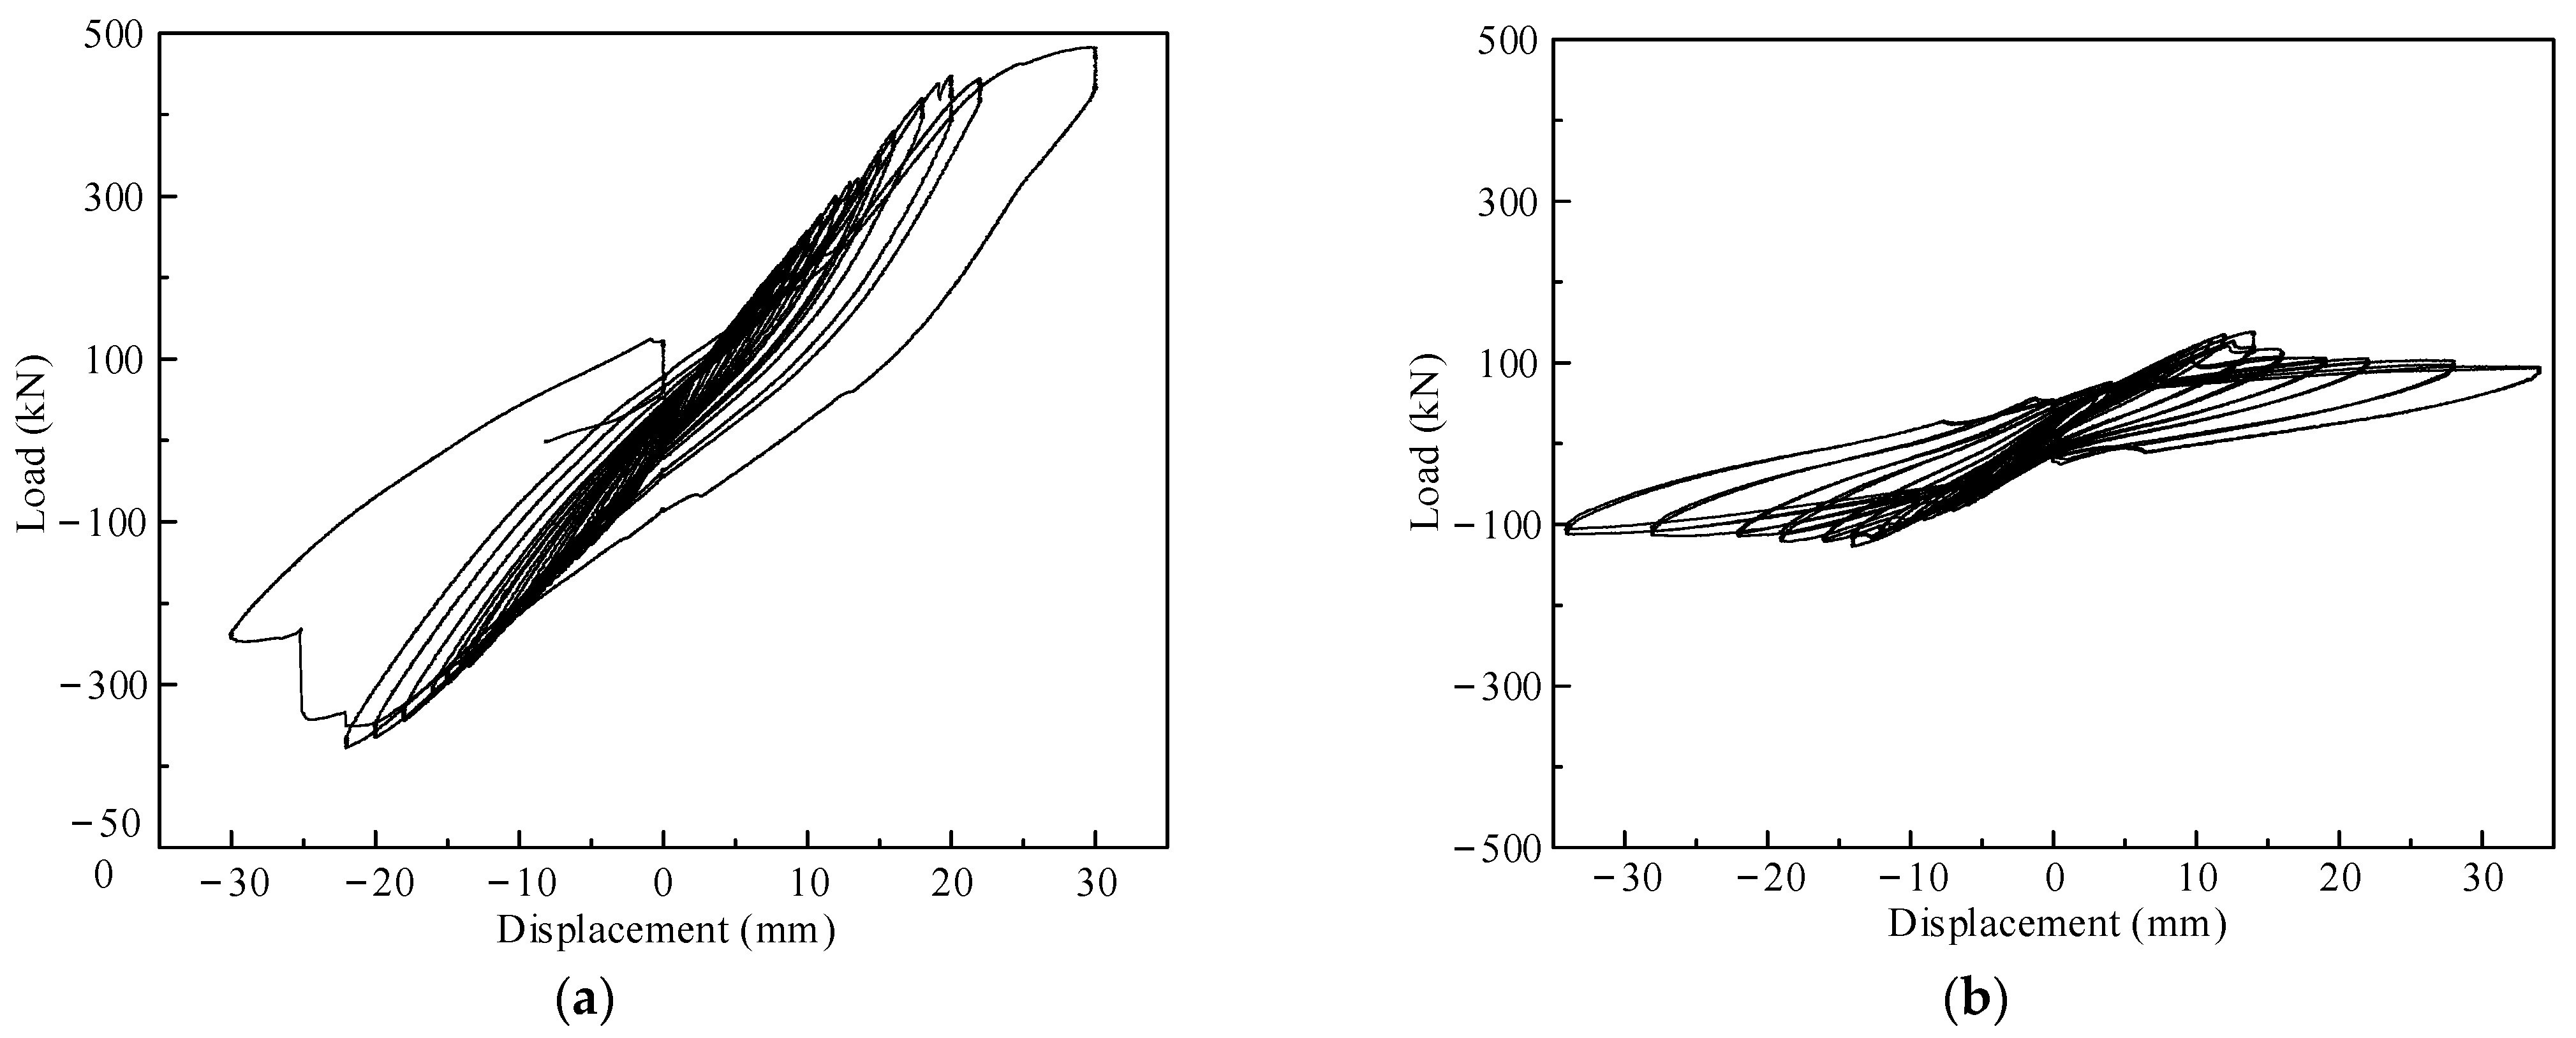
The load displacement curves of the L-shaped and T-shaped nodal specimens are provided in Figure 11. As shown, it can be seen that the L-shaped specimen exhibits better mechanical properties. At the same displacement level, the lateral bearing capacity of the L-shaped specimen is higher than that of the T-shaped specimen. Additionally, the larger envelope area of the load–displacement curve of the L-shaped specimen implies a higher energy dissipation capacity of the member, which may be due to the larger value of the vertical wall thickness of the L-shaped specimen (300 mm versus 160 mm). The measured load–displacement curves of the T-shaped specimens have good symmetry compared to those of the L-shaped specimens, which is consistent with the geometry of the specimens and the configuration of the steel plates having symmetrical characteristics. In addition, the results show that the hysteresis curve of the T-shaped specimen has a good pinching effect, and the load–displacement curve of the L-shaped specimen shows significant asymmetry in the loading direction. Moreover, the positive load carrying capacity (push) is significantly higher than the negative load carrying capacity (pull) along the loading direction. This is mainly caused by the asymmetry of the specimen geometry and steel plate configuration. At the end of reverse loading, the lateral bearing capacity of the L-shaped specimen decreases sharply, which is a brittle damage type and consistent with the damage characteristics of the test where the steel plate and concrete are detached and the two cannot be stressed together, and the structure fails due to the loss of integrity.

3.3. Skeleton Curves

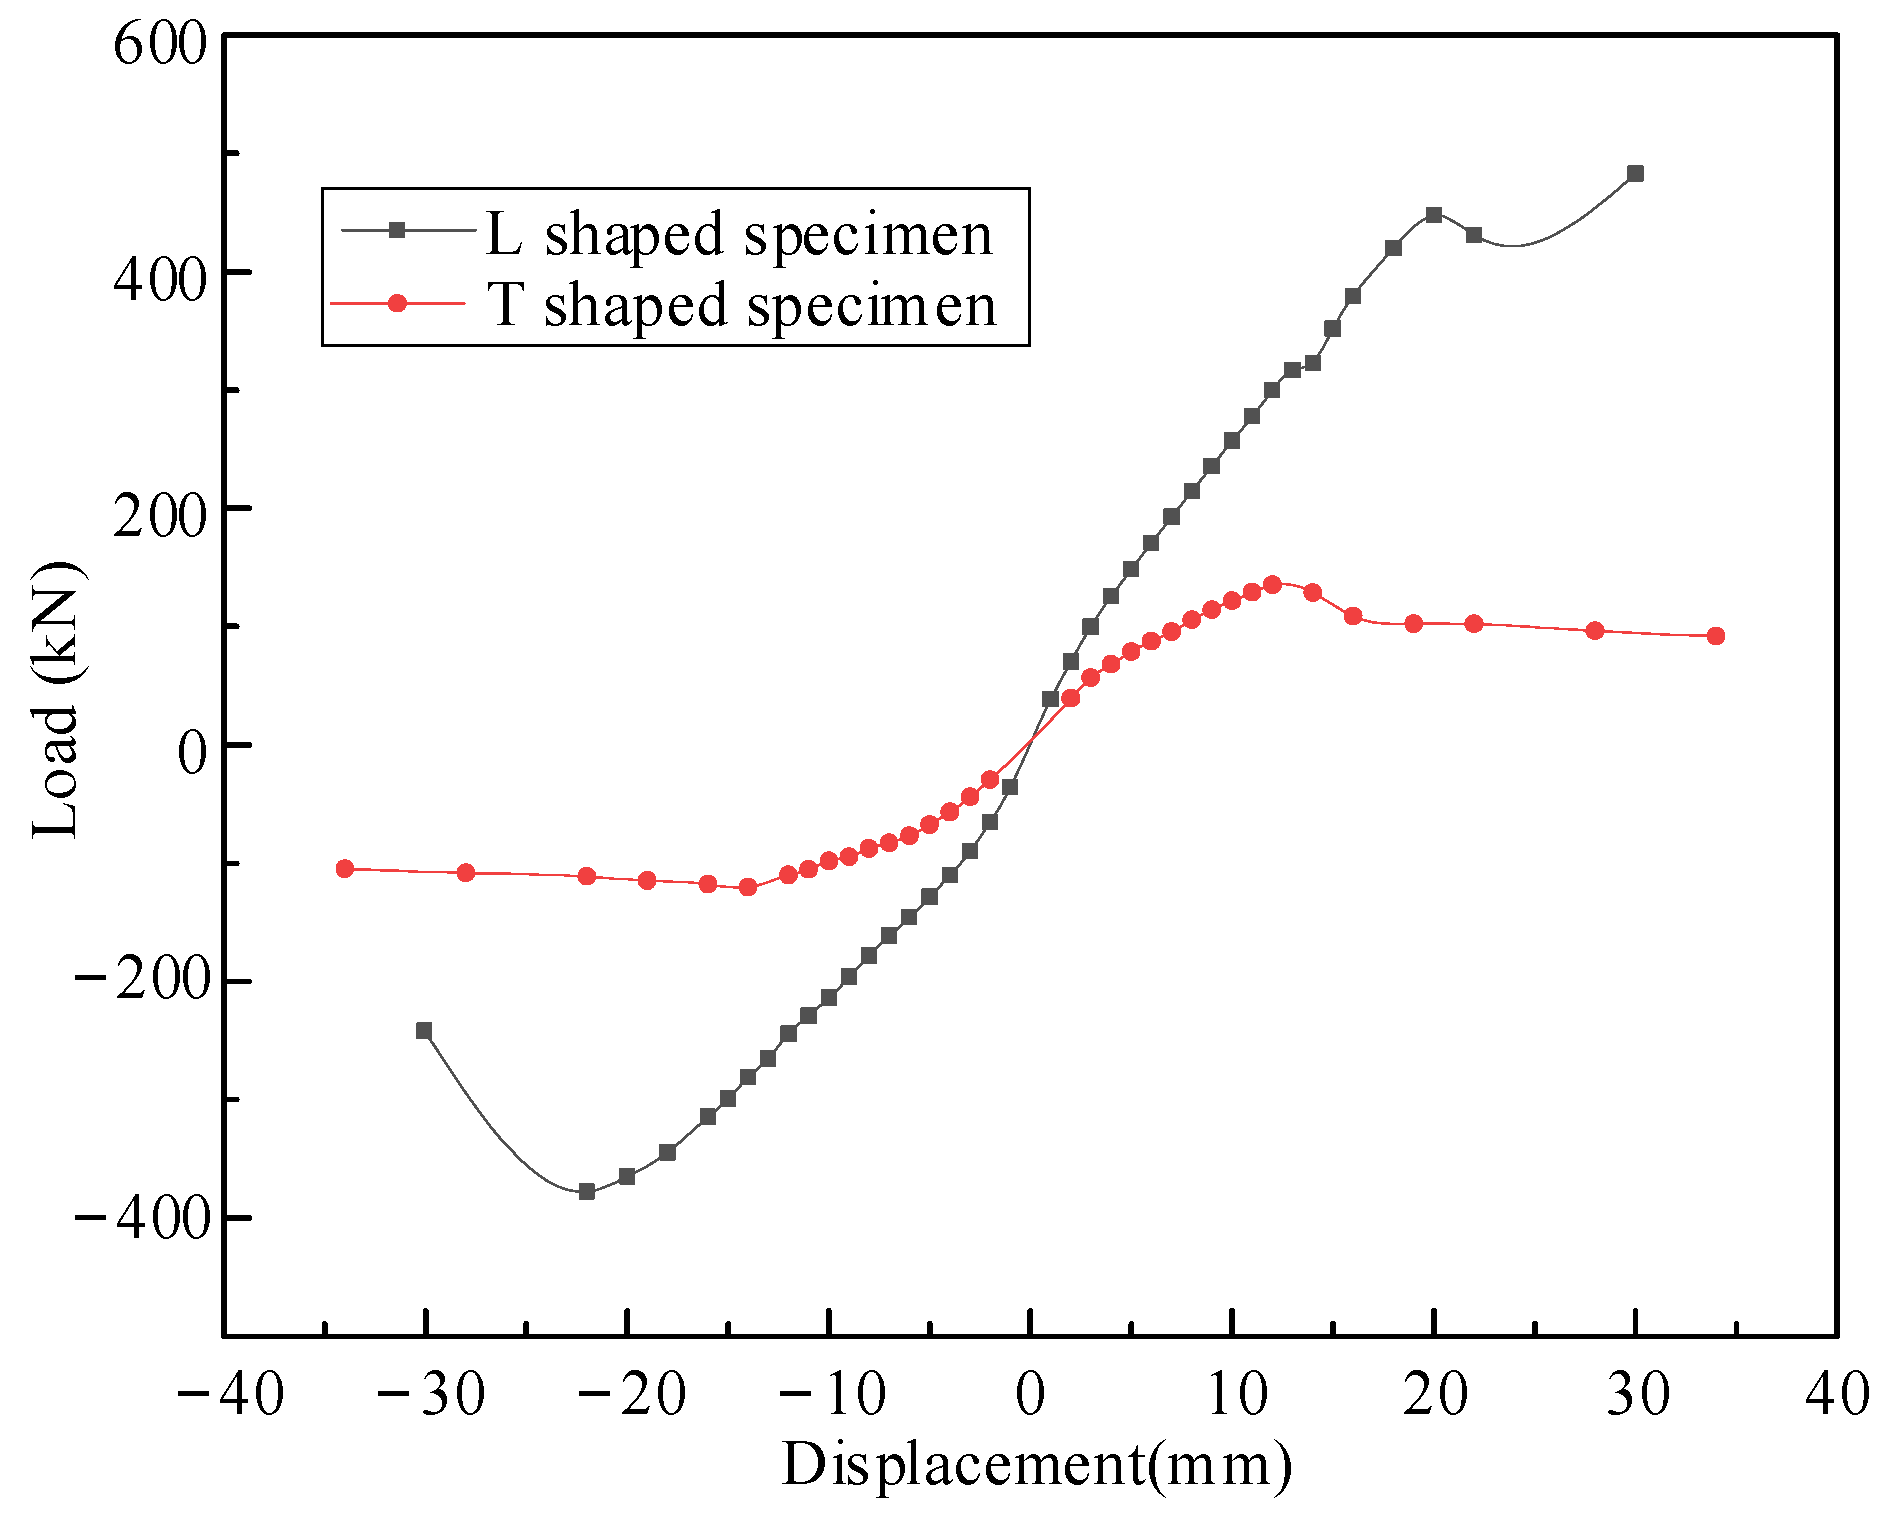
To further explore the mechanical properties of the members, the skeleton curves of the L- and T-shaped specimens are provided in 
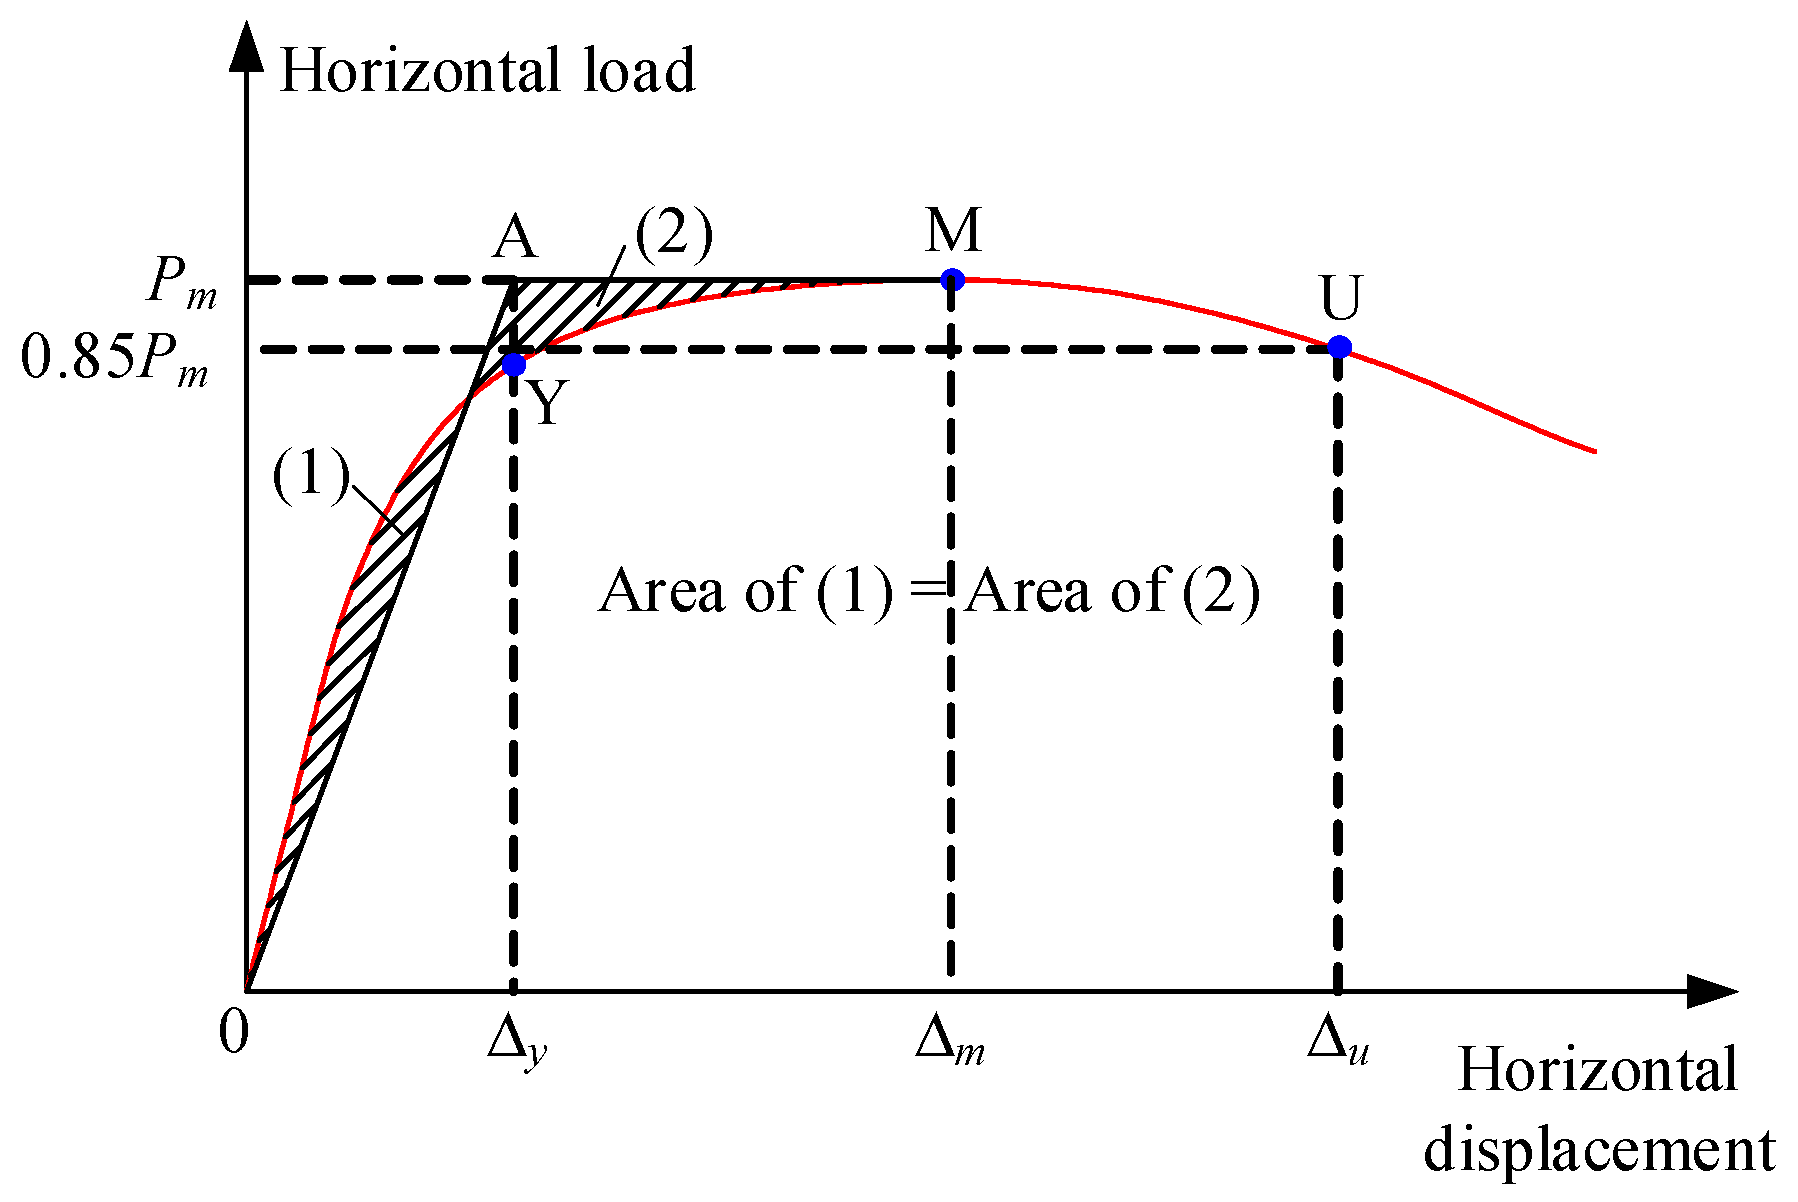
Figure 12. When the load–displacement curve of the structure corresponds to a point where the load value drops to 85% of the peak load, the structure is considered to be damaged. In this study, the yield displacement of the frame is determined based on the method of equivalent elastic–plastic energy absorption [20], and the relevant calculation sketch is shown in Figure 13. First, an inclined line is drawn from the origin and intersects the horizontal line drawn past the peak point M. The intersection point is denoted as A and makes the area of the two shaded parts provided in Figure 13 equal. Then, a vertical line is made through point A, and the intersection with the skeleton curve is recorded as Y. The intersection point Y is the equivalent yield point, and the corresponding displacement and load are the equivalent yield displacement and load, respectively. From the determined equivalent yield point and skeleton curve, the equivalent yield displacement, equivalent yield load, peak load, ultimate displacement and ductility coefficient of the member are calculated. It should be noted that the above parameters are calculated in two loading directions, positive and negative, and the results are shown in Table 2.
As observed from the above table, the mechanical properties of the T-shaped specimens exhibit good symmetry, while those of the L-shaped specimens exhibit more obvious asymmetry. For the L-shaped specimen, the peak bearing capacity values along the positive and negative loading directions were 447.74 kN and −377.63 kN, respectively, with a difference of 18.57%. The reason for this difference is the asymmetry of the geometry and steel plate configuration of the L-shaped specimen. In addition, compared with the L-shaped specimen, the T-shaped specimen has better ductility but lower lateral load capacity. The analysis suggests the following possible reasons: (1) the L-shaped specimen has nonuniform damage and strength degradation in two different loading directions during loading due to the asymmetry of the geometry and steel plate arrangement; (2) the L-shaped specimen has a larger value of vertical wall thickness compared with the T-shaped specimen. In contrast, the T-shaped specimens had larger ultimate deformation values (34 mm versus 30 mm) when the specimens underwent damage. Therefore, in the actual project, the mechanical properties of the immersed tunnel structure will be controlled by the L-shaped nodes, which also coincides with the test observations of the node tests.
The ductility coefficient of the T-shaped specimen is 4.91 along the two different loading directions, while the ductility coefficient of the L-shaped specimen is 2.05. The L-shaped node of the immersed tube tunnel is vulnerable to damage when an earthquake occurs, which should be considered in engineering practice. The negative bearing capability of the L-shaped node needs to be enhanced. Some measures can be taken to achieve the results, such as strengthening the connection between the steel and concrete, enhancing welds near the core area and axillary corner and adding connectors between steel partitions and concrete within the tunnel.

3.4. Dissipation of Energy

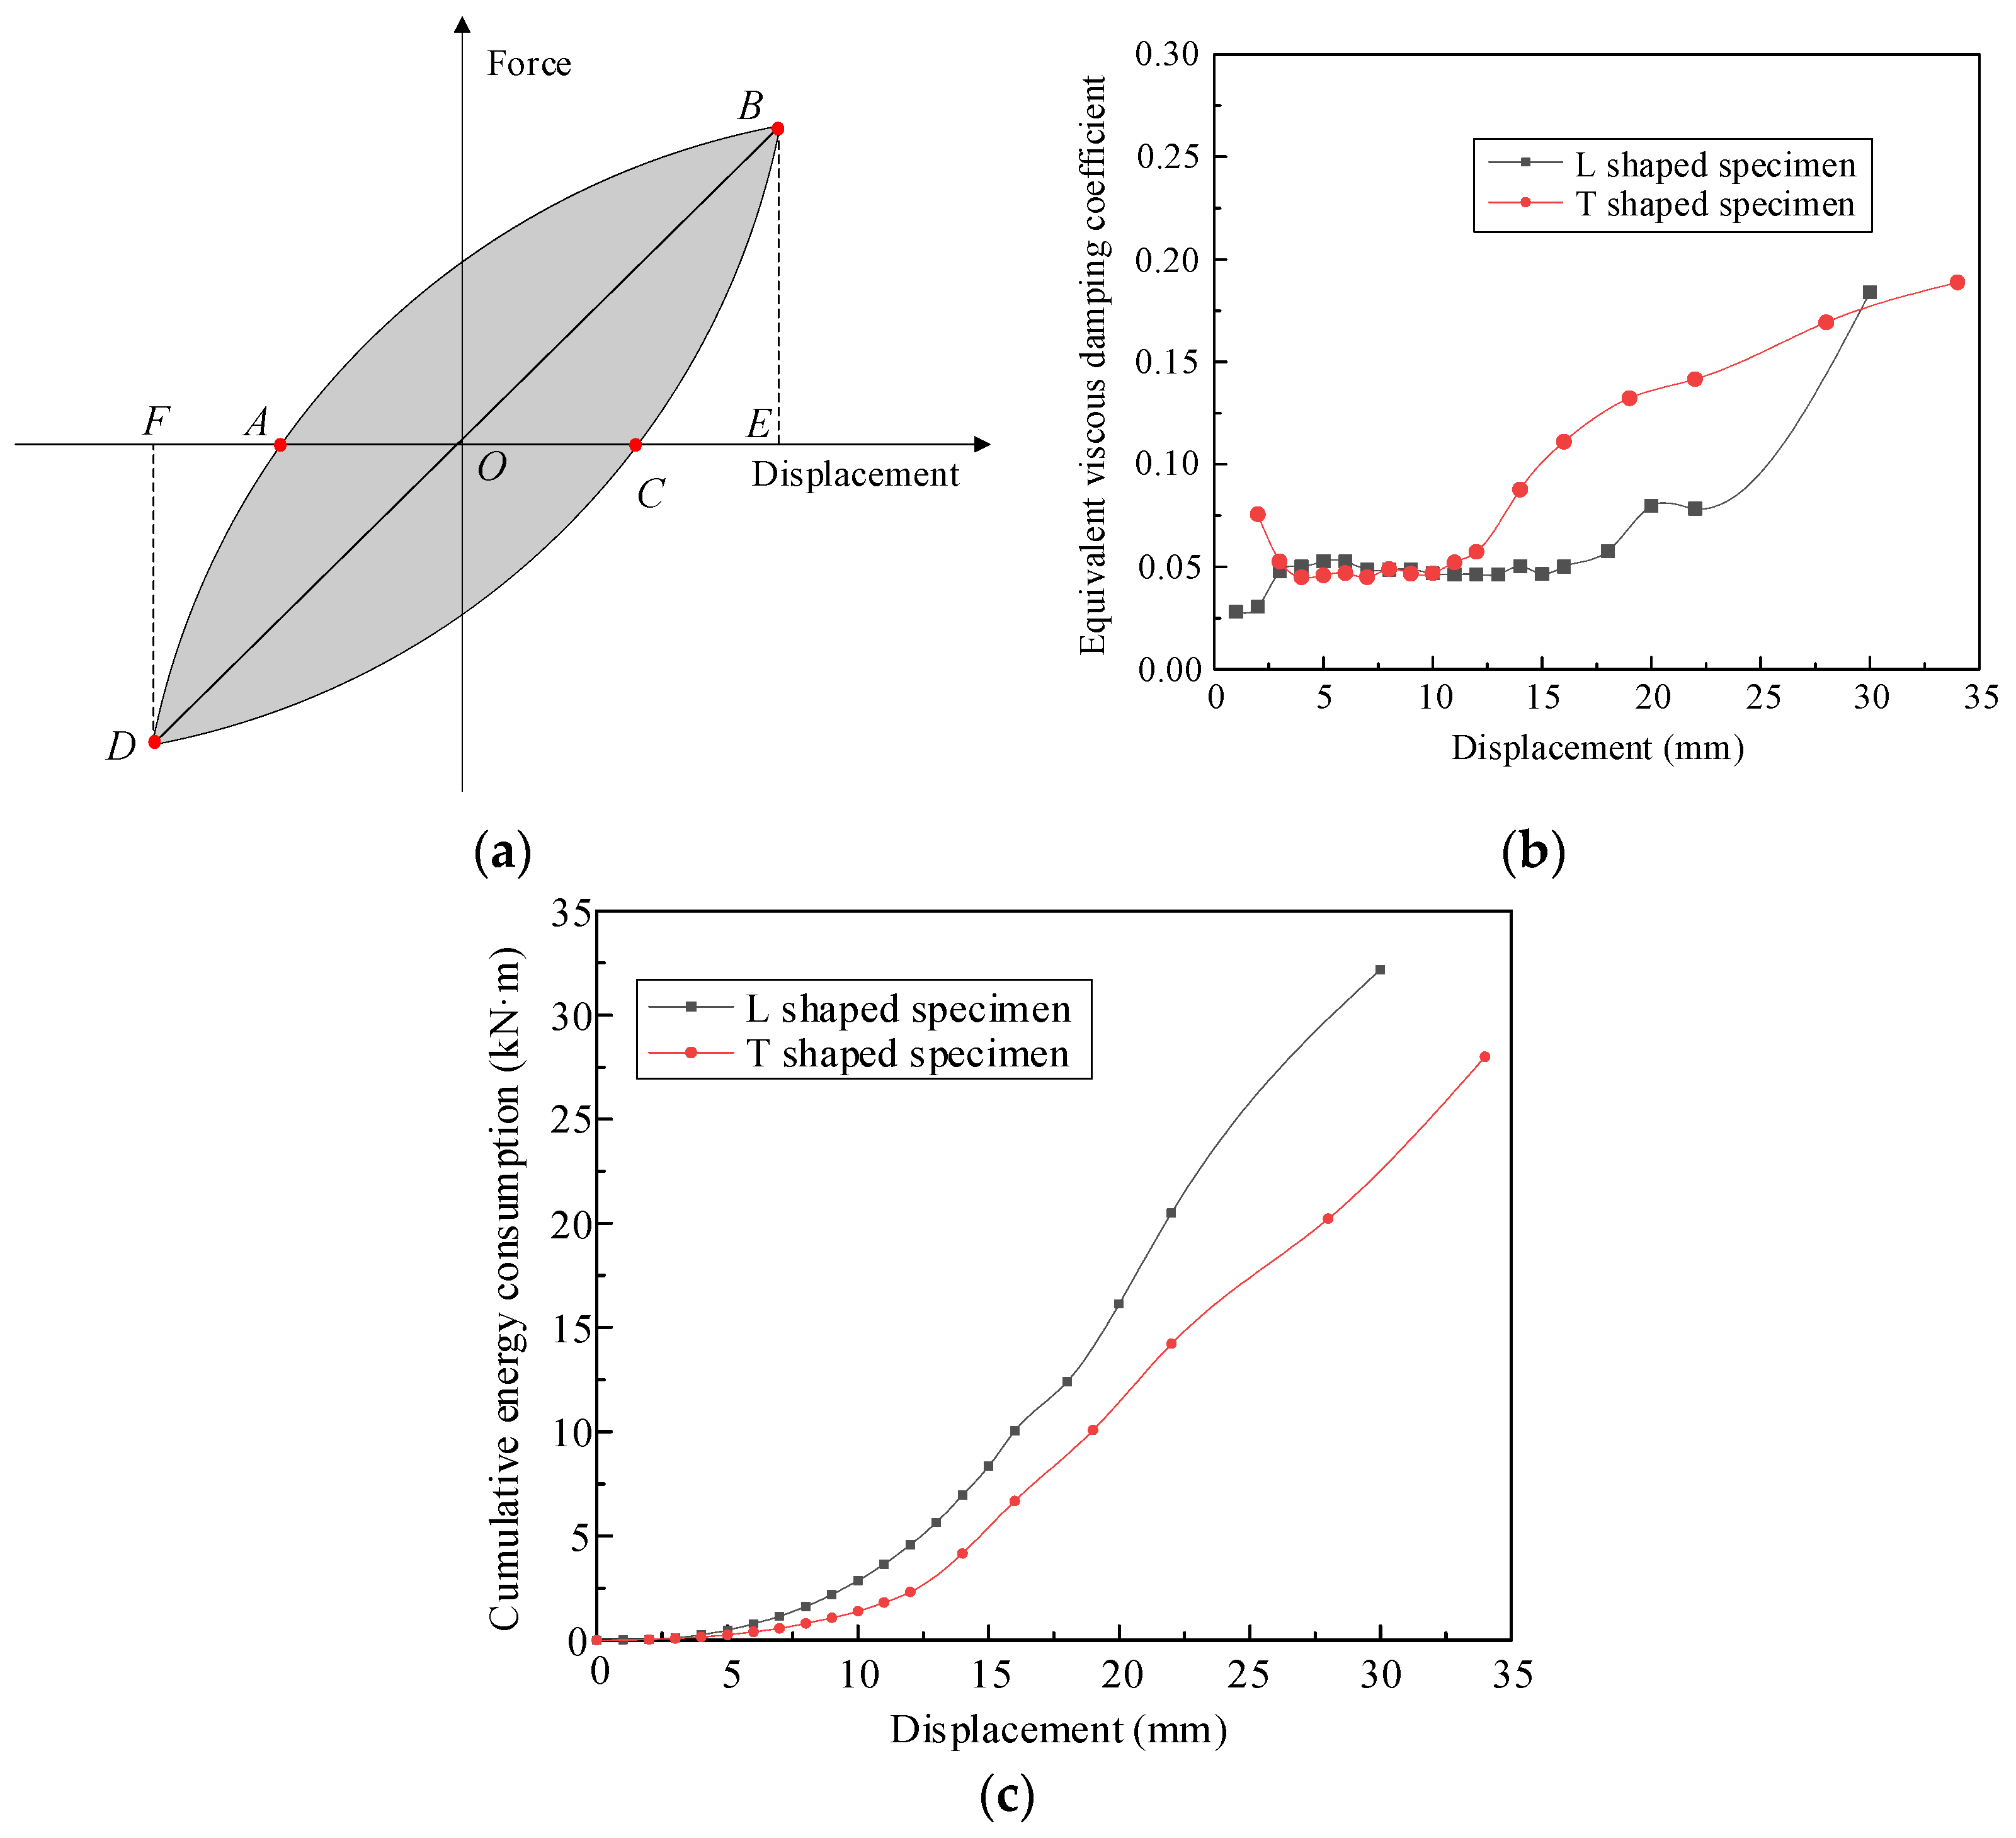
It is well known that the area of the hysteresis loop envelope represents the energy dissipated by the structure during the reciprocal loading process. Currently, there are two important parameters commonly used to measure the energy dissipation capacity of a structure: the cumulative structural energy dissipation value and the equivalent viscous damping coefficient. The former refers to the cumulative energy dissipated by the structure after each level of loading, while the latter represents the ratio of the total energy dissipated by the structure to the total elastic potential energy stored in the structure during a loading cycle. For a typical hysteresis loop, as shown in Figure 14a, the equivalent viscous damping coefficient can be calculated using the following equation [21,22,23,24,25,26]:
ξ e q = 1 2 π A A B C D A O F D + A O B E
In the above equation, AABCD refers to the area of the closed figure enclosed by the hysteresis loop and the energy dissipated by the structure in one loading cycle, and AOFD + AOBE refers to the sum of the areas of the triangles OFD and OBE, representing the total elastic potential energy stored in the structure. Based on the above defined equations, the curves of the cumulative energy dissipated and the equivalent viscous damping coefficient relative to the displacement change for the L-shaped and T-shaped specimens are calculated as shown in Figure 14b. The displacements marked in the figure are obtained by first taking the absolute values of the displacements at the forward and reverse loading ends under each level of loading and then summing them and taking the average value.
As shown in Figure 14c, the cumulative energy dissipation of each specimen increases approximately exponentially with the displacement at the loading end. With increasing loading displacement, the damage to the structure accumulates, and plastic deformation fully develops, which leads to a gradual increase in the energy dissipation of the members. In addition, the cumulative energy dissipation of L-shaped specimens was larger than that of T-shaped specimens at the same displacement level, which was mainly due to the relatively larger value of the vertical wall thickness of L-shaped specimens (300 mm versus 160 mm).
As shown in Figure 14b, the equivalent viscous damping coefficients of the specimens increased monotonically with increasing loading end displacement. At the beginning of the test, the difference between the equivalent viscous damping coefficients of the L-shaped and T-shaped node specimens is small. After the displacement of the loaded end exceeded 10 mm, the T-shaped specimen had a larger equivalent viscous damping coefficient than the L-shaped specimen at the same displacement level. Therefore, it can be assumed that the T-shaped specimen has better ductility than the L-shaped specimen after the structure enters the plastic phase. The L-shaped specimen is an asymmetric structure. During the test, the specimen did not reach the ultimate state when it was positively loaded, which was significantly lower than that of the T-shaped specimen when it was loaded negatively. The reason for the results is that the axillary corner and the core area of the L-shaped specimen are subjected to large stresses, producing brittle damage. While the T-shaped specimen wall is weaker, it is more likely to develop plastic deformation at the boundary of the wall bottom and the axillary corner. The equivalent viscous damping coefficients of the L-shaped and T-shaped specimens are 0.18 and 0.19, respectively, when structural damage occurs.

4. Numerical Simulation

To examine the accuracy of the test results and to provide a reference for the design of immersed tube tunnels with steel shell–concrete structures, a three-dimensional fine finite element model of the model specimen was established based on finite element software ABAQUS, and a nonlinear analysis was carried out with reference to the actual loading regime. To verify the accuracy of the simulation results, the measured results are compared with the calculated results. Additionally, specific information on the numerical model and the validation process is provided in this section.

4.1. Numerical Models

Figure 15a,b shows schematic diagrams of the finite element models of the L-shaped and T-shaped specimens established in this paper. The concrete is simulated by a three-dimensional solid unit (C3D8), and the steel plate is simulated by a shell unit. The steel plate and concrete are bound to each other without considering the slip between them. The concrete material is modeled with a plastic loss model [27], which can better consider the structural strength and stiffness degradation due to the continuous accumulation of material damage under reciprocal loading. For the compressed section, the stress value corresponding to the elastic limit point is 1 3 f c , and the stress value corresponding to the ultimate compressive strain is 0.85 f c . Without considering the nonlinearity of the concrete in tension, the elastic modulus of the concrete in tension and in the compression elastic section takes equal values. The threefold model is used for the steel, and the strain at the initial point of strain hardening is 0.025. The intrinsic models of the concrete and steel are shown in Figure 15c,d.
The specimens are mounted and positioned as shown in Section 2 of this paper, and all the specimens are fixed to the laboratory pedestal by bolts and limiters, thus limiting the translational displacement of the members along all directions. In this paper, a simplified treatment is used to simulate the connection between the specimen and the laboratory pedestal, i.e., the bottom of the model is set as a fixed constraint, thus constraining the degrees of freedom of the structure along all directions. The loading regime used in the nonlinear analysis is consistent with the test, as shown in Figure 7. In the proposed static test, the axial compression load is uniformly distributed on top of the specimen through the loading beam. Thus, the axial compression loads in the finite element model are uniformly applied to the structure through the loading plates arranged at the top of the members.

4.2. Finite Element Model Verification

The comparative results of the load–displacement curves of the L- and T-shaped specimens obtained from the experiments and numerical simulations are provided. As shown in Figure 16, the calculated results of both L- and T-shaped specimens agree well with the experimental results. In the unloading phase of the curves, there is a certain difference between the calculated and experimental results. The considered reason is that cracks and gaps are created within the concrete when the loads are subjected, resulting in a hysteresis loop that is not full. It is difficult for the FEM to perfectly simulate this damage property of concrete. As seen from Table 3, the calculated lateral bearing capacities of the L-shaped and T-shaped specimens differed from the measured values by 8% and −8.7%, respectively, and they were in good agreement.
In addition, to verify the accuracy of the finite element model, this paper also compares the observed and calculated crack distributions of the members obtained at the end of the loading test, as shown in Figure 17. A comparison of the observed and calculated crack distributions of the L-shaped specimen is shown in Figure 17a,b. The numerical calculation can simulate the bending cracks at the bottom of the vertical wall of the L-shaped specimen. At the lower end of the vertical wall, a concentrated crack in the horizontal direction is observed along the back of the wall. At the same time, a crack along the vertical penetration is observed at the location where the vertical wall intersects with the axillary corner. This is consistent with the damage phenomenon that the L-shaped specimen was declared to have failed when the loading end was displaced up to 30 mm due to peeling of the steel plate from the concrete and loss of integrity. As shown in Figure 17c,d, for the T-shaped specimen, the crack distribution and damage mode along the nodal core and vertical wall height direction of the T-shaped specimen obtained from the simulation are in good agreement with the experimental observations. In summary, the finite element models of L- and T-shaped specimens can correctly simulate the crack distribution and potential damage modes of the structure.
From the above analysis, it can be seen that the three-dimensional fine finite element models established in this paper for L-shaped and T-shaped specimens can better reproduce the load–displacement curves of the structure as well as the crack distribution and potential damage modes, thus proving the accuracy and reasonableness of the finite element models established in this paper. Therefore, there is sufficient confidence that the models established can provide a reference for the design of immersed tube tunnels in actual projects.

5. Conclusions

This paper focuses on the experimental and numerical study of the mechanical properties of immersed tunnel nodes in steel shell–concrete structures. The paper designs and fabricates L- and T-shaped node specimens with a scaled-down ratio of 1:5. The tests adopt a proposed quasi-static loading scheme to study the seismic performance and damage mechanisms of the immersed tunnel nodes of steel shell–concrete structures under earthquake action. In addition, a rigorous numerical model of the nodal specimens based on ABAQUS is established in this paper.
(1) In the damage stage, the concrete and steel plates in the core area of both L-shaped and T-shaped specimen nodes were severely peeled. Among them, the crack development in the core area of the L-shaped specimen node is not obvious, and, in the ultimate load stage, the bearing capacity of the specimen decreases sharply, showing the characteristics of brittle damage. In contrast, the cracks in the core area of the T-shaped specimen node were fully developed, and the concrete spalling was serious, showing more favorable bending damage.
(2) The test results show that the L-shaped specimen has a higher lateral bearing capacity and energy dissipation capacity, which may be due to the larger value of the vertical wall thickness of the L-shaped specimen (300 mm versus 160 mm). The equivalent viscous damping coefficient of the T-shaped specimen is higher than that of the L-shaped specimen at the same displacement level, indicating that the T-shaped node has better ductility. Therefore, in engineering practice, local strengthening of the outermost vertical wall should be carried out to improve the ductility of steel-shell–concrete-structure-immersed tube tunnels.
(3) The numerical calculations and experimental results show good agreement in terms of load–displacement curves and crack distribution, indicating that the present modeling method can better simulate the mechanical properties of the immersed tunnel nodes. Therefore, the modeling method used in this paper can be used to guide the section design of immersed tube tunnels with steel shell–concrete structures.
In this paper, only the mechanical properties of the immersed tube tunnel nodes are investigated, and further experimental studies are required to clarify the seismic performance of the overall structure of the immersed tube tunnel under the effect of free field transverse deformation caused by strong earthquakes.

Author Contributions

Conceptualization, S.-Y.S.; methodology, L.Z; validation, Y.-W.G.; formal analysis, Y.-Y.Z. and W.L.; investigation, Y.-Y.Z.; resources, S.-Y.S.; data curation, W.L. and J.-X.L.; writing—original draft preparation, W.L.; writing—review and editing, L.Z.; visualization, Y.-Y.Z. and Y.-W.G.; supervision, L.Z.; project administration, S.-Y.S. All authors have read and agreed to the published version of the manuscript.

Funding

The research was funded by the financial support provided by the R D Plan Project in Key Areas of Guangdong Province (2019b111105002), the Projects of Central Guidance for Local Science and Technology Development (226Z0801G).

Informed Consent Statement

Informed consent was obtained from all individual participants included in the study.

Data Availability Statement

The data provided in this study could be released upon reasonable request. The authors state that all data, models or code generated or used during the study are available from the corresponding author by request. The responsibility for scientific accuracy and content remains entirely with the authors.

Acknowledgments

The authors express their thanks to the people helping with this work, and acknowledge the valuable suggestions from the peer reviewers.

Conflicts of Interest

The authors declare no conflict of interest.

References

  1. Gursoy, A. Immersed steel tube tunnels: An American experience. Tunn. Undergr. Space Technol. 1995, 10, 439–453. [Google Scholar] [CrossRef]
  2. Akimoto, K.; Hashidate, Y.; Kitayama, H.; Kumagai, K. Immersed Tunnels in Japan: Recent Technological Trends. In Proceedings of the International Symposium on Underwater Technology, Tokyo, Japan, 19 April 2002. [Google Scholar]
  3. Saveur, J.; Grantz, W. Chapter 3 structural design of immersed tunnels. Tunn. Undergr. Space Technol. 1997, 12, 93–109. [Google Scholar] [CrossRef]
  4. Liew, J.R.; Sohel, K.; Koh, C. Impact tests on steel-concrete-steel sandwich beams with lightweight concrete core. Eng. Struct. 2009, 31, 2045–2059. [Google Scholar] [CrossRef]
  5. Yan, J.B.; Wang, J.Y.; Liew, J.Y.R.; Qian, X. Punching shear behavior of steel-concrete-steel sandwich composite plate under patch loads. J. Constr. Steel Res. 2016, 121, 50–64. [Google Scholar]
  6. Fan, J.; Zhu, Y.; Cui, B.; Huang, L.; Spencer, B.F. Experimental and numerical investigations on large-scale concrete-filled double-steel-plate composite structures. Eng. Struct. 2021, 231, 111749. [Google Scholar] [CrossRef]
  7. Mo, J.; Uy, B.; Li, D.; Tai, T.; Tran, H. A review of the behaviour and design of steel–concrete composite shear walls. Structures 2021, 31, 1230–1253. [Google Scholar] [CrossRef]
  8. Nie, J. Application of Steel-Concrete Composite Structure in Ocean Engineering. Steel Constr. 2020, 35, 20–33. [Google Scholar]
  9. Montague, P. A simple composite construction for cylindrical shells subjected to external pressure. J. Mech. Eng. Sci. 1975, 17, 105–113. [Google Scholar] [CrossRef]
  10. Solomon, S.K.; Smith, D.W.; Cusens, A.R. Flexural tests of steel-concrete-steel sandwiches. Mag. Concr. Res. 1976, 28, 13–20. [Google Scholar] [CrossRef]
  11. Ichikawa, K.; Isobeta, O.; Kawamata, S. Design and analysis of reactor containment of steel-concrete composite laminated shell. In Proceedings of the International Association for Structural Mechanics in Reactor Technology (IASMIRT), San Francisco, CA, USA, 15–19 August 1977. [Google Scholar]
  12. Tomlinson, M.J.; Tomlinson, A.; Chapman, M.L.; Jefferson, A.D.; Wright, H.D. Shell composite construction for shallow draft immersed tube tunnels. In Immersed Tunnel Techniques; ICE Publishing: London, UK, 1993. [Google Scholar]
  13. Lunniss, R.; Baber, J. Immersed Tunnels; CRC Press: Boca Raton, FL, USA, 2013. [Google Scholar]
  14. Narayanan, R.; Roberts, T.M.; Naji, F. Design Guide for Steel-Concrete-Steel Sandwich Construction (Volume 1): General Principles and Rules for Basic Elements; Steel Construction Institute: Chicago, IL, USA, 1994. [Google Scholar]
  15. Chongqing Communications Research and Design Institute. Code for design of Road Tunnel; JTG D70-2004; China Communications Press: Beijing, China, 2004. (In Chinese) [Google Scholar]
  16. Ministry of Transport of the People’s Republic of China. General Specifications for Design of Highway Bridges and Culverts; JTG D60-2015; China Communication Press: Beijing, China, 2015. (In Chinese)
  17. Ministry of Housing and Urban-Rural Development of the People’s Republic of China. Code for Quality Acceptance of Concrete Structure Construction; GB50204-2015; China Construction Industry Press: Beijing, China, 2015. (In Chinese)
  18. CMC (China Ministry of Construction). Standard for Test Method of Mechanical Properties on Ordinary Concrete; GB/T 50081-2002; China Construction Industry Press: Beijing, China, 2002. (In Chinese)
  19. Ministry of Housing and Urban-Rural Development of the People’s Republic of China. Specification for Seismic Test of Buildings; JGJ/T 101-2015; China Construction Industry Press: Beijing, China, 2015. (In Chinese)
  20. Park, R. Evaluation of ductility of structures and structural assemblages from laboratory testing. Bull. N. Z. Soc. Earthq. Eng. 1989, 22, 155–166. [Google Scholar] [CrossRef]
  21. Huang, F.; Wu, S.; Luo, X.; Chen, B.; Lin, Y. Pseudo-static low cycle test on the mechanical behavior of PHC pipe piles with consideration of soil-pile interaction. Eng. Struct. 2018, 171, 992–1006. [Google Scholar] [CrossRef]
  22. Sun, Z.; Wang, D.; Wang, T.; Wu, S.; Guo, X. Investigation on seismic behavior of bridge piers with thin-walled rectangular hollow section using quasi-static cyclic tests. Eng. Struct. 2019, 200, 109708. [Google Scholar] [CrossRef]
  23. Jia, J.; Zhang, K.; Wu, S.; Guo, Y.; Du, X.; Wang, X. Seismic performance of self-centering precast segmental bridge columns under different lateral loading directions. Eng. Struct. 2020, 221, 111037. [Google Scholar] [CrossRef]
  24. Jja, J.; Zhao, L.; Wu, S.; Wang, X.; Bai, Y.; Wei, Y. Experimental investigation on the seismic performance of low-level corroded and retrofitted reinforced concrete bridge columns with CFRP fabric. Eng. Struct. 2020, 209, 110225. [Google Scholar]
  25. Li, S.; Wei, B.; Tan, H.; Li, C.; Zhao, X. Equivalence of Friction and Viscous Damping in a Spring-Friction System with Concave Friction Distribution. J. Test. Eval. 2020, 49, 372–395. [Google Scholar] [CrossRef]
  26. Wu, S.; Li, H.; Wang, X.; Li, R.; Tian, C.; Hou, Q. Seismic performance of a novel partial precast RC shear wall with reserved cast-in-place base and wall edges. Soil Dyn. Earthq. Eng. 2022, 152, 107038. [Google Scholar] [CrossRef]
  27. Nie, J.; Wang, Y. A comparative study of concrete principal structure models in ABAQUS for simulating the static behavior of structures. Eng. Mech. 2013, 30, 59–67. [Google Scholar]
Figure 1. Double steel plate–concrete combination structure [5].
Buildings 12 01553 g001
Figure 2. Cross section of the immersed tunnel (unit: cm).
Buildings 12 01553 g002
Figure 3. Design details of the T-shaped specimen (unit: cm). (a) Front view; (b) side view; (c) top view.
Buildings 12 01553 g003
Figure 4. Design details of the L-shaped specimen (unit: cm). (a) Front view; (b) side view; (c) top view.
Buildings 12 01553 g004
Figure 5. Schematic diagram of the load conditions.
Buildings 12 01553 g005
Figure 6. Diagram of the loading device. (a) L-shaped specimen; (b) T-shaped specimen.
Buildings 12 01553 g006
Figure 7. Specimen loading system. (a) L-shaped specimen; (b) T-shaped specimen.
Buildings 12 01553 g007
Figure 8. Specimen measurement point layout plan. (a) L-shaped specimen; (b) T-shaped specimen.
Buildings 12 01553 g008
Figure 9. Test phenomena of L-shaped specimens. (a) Uncracked stage (4 mm); (b) cracking stage (5 to 22 mm); (c) damage phase (30 mm).
Buildings 12 01553 g009
Figure 10. Test phenomenon of the T-shaped specimen. (a) Uncracked stage (5 mm); (b) cracking stage (6 to 28 mm); (c) damage phase (34 mm).
Buildings 12 01553 g010
Figure 11. Hysteresis curve of the specimen. (a) L-shaped specimen; (b) T-shaped specimen.
Buildings 12 01553 g011
Figure 12. Specimen skeleton curve.
Buildings 12 01553 g012
Figure 13. Equivalent yield point calculation diagram.
Buildings 12 01553 g013
Figure 14. Specimen energy dissipation index. (a) Typical hysteresis loop; (b) equivalent viscous damping coefficient; (c) cumulative hysteresis energy consumption.
Buildings 12 01553 g014
Figure 15. Finite element model of the specimen and material ontology. (a) L-shaped specimen; (b) T-shaped specimen; (c) concrete principal structure; (d) steel principal structure.
Buildings 12 01553 g015aBuildings 12 01553 g015b
Figure 16. Comparison of the measured and calculated load displacement curves. (a) Shaped specimen; (b) shaped specimen.
Buildings 12 01553 g016
Figure 17. Comparison of the measured and calculated results of the crack distributions of specimens. (a) L-shaped specimen test phenomenon (30 mm); (b) calculated results for the L-shaped specimen (30 mm); (c) T-shaped specimen test phenomenon (−34 mm); (d) calculated results for the T-shaped specimen (−34 mm).
Buildings 12 01553 g017
Table 1. Material properties.
GradeYield Strength fy (MPa)Ultimate Strength fu (MPa)fu/fyElongation Ratio
Q345342.1472.11.380.325
Q390392.4549.41.400.320
Q420419.8583.51.390.327
Table 2. Mechanical properties of the specimen.
SpecimensLoad DirectionPy (kN)Δy (mm)Pm (kN)Δm (mm)Δu (mm)μ
L-shaped specimensForward317.1313.17447.7430.0230.022.19
Backward−314.46−16.01−377.63−22.0330.061.88
T-shaped specimensForward95.836.96135.4412.0134.004.89
Backward−82.14−6.89−120.32−14.03−34.004.93
Table 3. Comparison of the measured and calculated lateral bearing capacities of specimens.
SpecimenAxial Force (kN)VTest (kN)VFEA (kN)VFEA/VTest
L-specimen502.4370.11399.621.080
T-specimen531138.57126.460.913
Publisher’s Note: MDPI stays neutral with regard to jurisdictional claims in published maps and institutional affiliations.

