Article

Energy Optimization for Fenestration Design: Evidence-Based Retrofitting Solution for Office Buildings in the UAE

1
Department of Architectural Engineering, United Arab Emirates University, Al Ain 15551, United Arab Emirates
2
Healthy and Sustainable Buildings Research Center, Department of Architecture, Ajman University, Ajman 346, United Arab Emirates
*
Author to whom correspondence should be addressed.
Buildings 2022, 12(10), 1541; https://doi.org/10.3390/buildings12101541
Submission received: 16 August 2022 / Revised: 15 September 2022 / Accepted: 21 September 2022 / Published: 27 September 2022
(This article belongs to the Special Issue ZEMCH—Zero Energy Mass Custom Home International Research 2021)

Abstract

:
With the prevalent use of large glazings, particularly in office buildings, offices receive an abundance of light and are among the largest consumers of electricity. Moreover, in an extreme hot arid climate such as in the UAE, achieving comfortable daylighting levels without increasing solar heat gain is a challenge, in which the window or fenestration design plays an essential role. This research adopts a case study of a higher education (HE) office building on the United Arab Emirates University (UAEU) campus, selected to investigate an evidence-based retrofitting solution for the west façade that can be applied in existing office buildings in the UAE in order to reduce cooling energy load as well as enhance indoor environmental quality. To achieve an evidence-based retrofitting solution, the research design built upon a comprehensive exploratory investigation that included indoor environmental quality physical monitoring and occupant satisfaction surveying. Model simulation was performed by means of DesignBuilder software to perform a single- and multiparameter sensitivity analysis for three key passive window design parameters, i.e., window-to-wall ratio, glazing type, and external shading, aimed towards minimizing annual cooling load and solar heat gain, while maintaining appropriate indoor daylight illuminance levels. The results highlight the importance of the window-to-wall ratio (WWR), as it is the single most significant parameter effecting total energy consumption and daylighting levels. The results recommend 20–30% WWR as the optimum range in the west façade. However, by utilizing high performance glazing types and external shading, equal energy savings can be achieved with a larger WWR. Double Low E tinted glazing and 0.4 projection shading overhang and side fin revealed a noteworthy reduction of energy use intensity of 14%. The study concludes with final retrofitting solutions and design recommendations that aim to contribute validated knowledge towards enhancing window performance in a hot arid climate to guide architects and stakeholders to apply a range of passive parameters towards reducing energy consumption and improving occupant comfort in office buildings.

1. Introduction

As climate change is now evident, achieving high energy efficiency levels for new buildings and applying retrofit solutions to existing buildings will reduce the negative impacts of climate change and improve the indoor environmental quality of building occupants. According to the literature, air conditioning and artificial lighting account for 40–60% and 20–30%, respectively, of the total energy consumption in office buildings [1]. Natural daylight along with solar radiation are the main factors affecting the building’s energy performance as well as building occupant’s thermal comfort and visual comfort [2]. The building envelope has a significant impact on many performance aspects of an office building throughout its life cycle, including energy consumption, daylight, material usage, and occupant comfort. A hot arid climate increases the challenges of adapting daylighting strategies in buildings as extreme solar radiation and the high temperatures affect cooling energy consumption drastically [3]. Dubai reports up to 850 W/m2 of solar irradiance during the summer, with associated sky illuminance levels reaching 75,000 lux to 107,500 lux. This level exceeds the comfortable indoor daylight level, which ranges from 300 to 500 lux [4], so care must be taken in glass selection and shading to reduce the negative impact on occupancy thermal and lighting comfort.
Worldwide, the building and construction sector accounts for 39% of energy-related emissions [5]. These emissions are expected to be significantly higher in the United Arab Emirates due to the high cooling demand and inefficient energy performance of existing buildings. Commercial buildings account for the largest end-user energy consumption, especially at 35.9% [6]. Due to this high energy consumption, recently, regulations and green building standards have been placed to address sustainability in buildings. Different cities in the UAE have implemented multiple sustainable energy efficiency regulation initiatives. Considering this, Abu Dhabi established The ESTIDAMA Pearl green building rating system rating in 2010. Additionally, Dubai introduced green building regulation Al sa’fat, which is mandatory for all government buildings since 2011 [7]. These regulations are used differently between different emirates and are slowly becoming mandatory in the whole country. However, those regulations focus primarily on new buildings in the UAE, older buildings constructed earlier than those regulations offer room to address façade design for office building.
The outside layer of a conventional buildings, with few installed shade devices, captures excessive solar heat, causing overheating due to excessive light levels [8]. It is also relevant to increasing the cooling load and cooling energy required to achieve adequate thermal comfort levels in office environments. This research study looks for identifying the most effective retrofitting solutions and recommendations that can be adopted by office buildings in the UAE in order to reduce cooling energy load as well as enhance indoor thermal and visual comfort. By taking into consideration the local climate, window-to-wall ratio, glazing materials, external shading, and further validating proposed retrofit solutions through model simulation to reveal the possible opportunities for energy savings in an existing office building through cooling energy reduction. Findings and suggestion of this research study promote applying retrofitting solutions for existing office buildings for energy optimization towards improving occupant thermal and visual comfort. The main findings of this research contribute to providing design recommendations on façade retrofit solutions to reduce cooling energy consumption while maintaining user comfort in regard to the harsh UAE climate. This façade study will be used to predict the current energy use for cooling and retrofitting a possible reduction in cooling energy, aiming to enhance thermal and visual comfort, by simulation studies as well as surveys and monitoring.

2. Literature Review

A fenestration design for energy efficiency involves coordinating and optimizing various interconnected design principles and factors. Different studies have used a combination of passive daylight strategies to enhance building energy consumption. For hot and dry climates, the literature suggests highly insulating building envelops, low WWR with very low U-values, shadings, and high reflectance of the outer shell surface [9]. Window design parameters mainly consider orientation, WWR, glazing properties, and shading devices [10].
Research by Lee et al. [11] states that the overall heat transfer coefficient (or U-value) of windows is around five times more than other elements of a building’s envelope (e.g., walls, doors, etc.). If windows are improperly designed, they can be accountable for visual and thermal indoor discomfort, as well as increased energy consumption in a building. The design of windows substantially affects the energy performance of a building relative to solar heat gain; additionally, it directly affects the indoor daylighting levels and distribution [12]. The main factors that have been suggested in several studies are glazing types (SHGC) [12], U-value [13], window-to-wall ratio (WWR) [14], which explores the appropriate daylight levels as well as the heat transmission through openings as well as orientation, and AC system (HVAC) selection [15].
The purpose of windows in office buildings is to allow sunlight in and provide adequate visibility while minimizing heat loss [16].
Optimal WWR allows the least amount of energy to be used for cooling, heating, and lighting over the course of a year [17]. Additionally, orientation and climate are very important considerations for window placement. In particular, because hot dry climates are characterized by higher cooling energy use, statistics also confirmed that increases in WWR [18] in hot dry climates lead to average total EUI increases. And placing higher WWR on western façades than on east, south, and north had the worst impact on annual energy consumption [11]. In terms of the optimal WWR, multiple studies within hot and dry regions suggest different WWR. A recent study (2020) in Saudi Arabia revealed that a combination of applying thermal insulation along with minimizing WWR is necessary in existing buildings [19]. The authors followed up this paper with another investigation towards finding the optimum WWR in hot regions of SA. They concluded that, for optimal WWR for energy performance and daylight, the WWR must range between 20% to 30% [20]. Similarly, for Iran’s hot and dry climate, a comprehensive analysis between WWR and irradiance distribution shows that the most appropriate value of WWR is 30% or more for better daylight efficiency [21]. Several studies emphasize results revealing the descriptive statistics suggested average total EUI increases with WWR [15,22,23]. When it comes to multiparameter studies that compare the effectiveness of optimizing WWR to glazing type, a study conducted in hot summer zone in China adopted the life cycle assessment to find that selecting a lower U-value window is more effective than WWR controlled for reducing the life cycle environmental impact in the building designing process [14]. Recent studies [24,25] have pointed out that initial design decisions can have a significant impact on building exterior design, such as WWR and glazing selection, which can affect embodied and operational environmental impacts, such as carbon, energy, and resources. It shows that enhanced glass reduced operational energy demand by 8.3%, but increased the embodied impact by 10% and an additional 7.0–7.6 months for cumulative environmental payback. Moreover optimization cannot always offset the exclusion of a more environmentally suitable alternative at later design stages.
Moreover, the level of insulation of the building plays another role in the overall performance and WWR design; research reveals that the optimum WWR average values are 23.5% for the least insulated building and increases to 25.9% for the most insulated building [26].
The glazing is a fundamental building component that is responsible for daylight, ventilation, and aesthetics. Despite these benefits, the glazing still offers the lowest insulating value in the building envelope. Aboulnaga [3] investigated office building energy performance in the UAE; he found that 70% of buildings in Dubai have an 80–100% fully glazed façade. The study findings reveal glazing with a shading coefficient (SC) below 0.20 perform better in terms of visible light transmittance (VT) and relative heat gain. When discussing retrofitting windows in hot climate regions, research highlights the significance of selecting the glazing material with a lower solar heat gain coefficient (SHGC) over multilayered glazing [27]. The study tested two glazing types that consider a better performance of the U-Value and SHGC (however, they did not consider the VT). Because the existing glazing had adequate U-value and SHGC levels of 2.4 and 0.36, respectively, the results of changing it were very minimal (3.6%) in terms of cooling energy reduction. Moreover, it was found that the reduction in both the solar heat gain coefficient and window U-value in addition to the increase in the solar reflectance of the opaque parts are promising measures for reducing the energy demand [28].
Abdelsalam [13] analyzed the impact of different glazing systems on the annual energy consumption of buildings in the UAE, highlighting the effect of the solar heat gain in a hot humid climate that significantly influence the cooling load and the total energy consumption of a building. The results show that the “Double Low-E Spectrally Selective Clear 3 mm-13 mm-6 mm Air” and the “Double Electrochromic absorptive colored 6 mm-6 mm Air” reveal the best energy performances among other investigated glazing types, which achieve a potential to save up to almost 60% compared to the single glazing energy performance, while permitting daylight and views to the outdoors [13]. Thickness, coating, tint, and filled gas type between panes are also important parameters for determining thermal and daylight aspects of a glazing. The researcher remarks highlight that the size of the gap between glazing panes and the type of the gas fill impact the performance of glazing. Argon or Krypton gas fills show better performance than air. Moreover, in the UAE, the Estidama pearl building rating system [7] recommends the following numbers for the general buildings glazing system (SHGC = 0.3, VT = 0.42, U-value = 1.9 W/m2 K), which is generally offered through high performance glazing types of low-E coatings and spectrally selective glazing, as backed up by the research.
Combining different strategies, a study in the UAE analyzed the effectiveness of implementing a combination of passive measures, such as shading elements and upgrading walls and windows’ thermal insulation, and found 18.5% savings in cooling energy consumption and 14.5% in total grid electricity consumption [22]. Moreover, another study concerning hot US climate zones applied additional strategies to reach an added 30% energy savings, which were achieved through features such as high-performance windows, daylighting controls, and HVAC upgrades, along with some locations requiring wall insulation and shading devices. In a study of a hot Italian climate, it was proposed that larger WWR are acceptable if spectral selective glazing is installed [26].
Direct sunlight in office buildings, especially in hot arid areas, may cause discomfort due to more overheating than defused light and glare. Multiple studies suggest that external shading provisions are considered a solution that can reduce glare and room temperature by 6 °C. Freewan [29] tested vertical fins on a southwest-facing façade on a university building’s envelope in Jordan. The study results suggest reduced air temperature by up to 6% average of reduction of 5% in July and August. Multiple parameters can affect the performance of the exterior shading, such as the sloped slats, depth of projection, and shading types.
Alkhateeb [22] tested the impact of different shading types—horizontal, vertical, and egg crate shading—on retrofitting on southeast and southwest windows of office buildings in the UAE. The results showed that the egg-crate shading design provided the highest energy saving of 1.6%, while the horizontal overhangs offered 1.2% and vertical shading with saving of 0.99% only. A study performed by Ali [30] tested the impact of the vertical shading length on the thermal performance of residential buildings using all buildings’ orientations. The findings of the study suggest 100 cm length on vertical louvers for all the orientations, while 12 cm louvers recorded higher temperature in all orientations. The temperature on the western side decreased by 2 °C using the 100 cm vertical louvers. The sloping degree of external shading slats is considered one of the essential parameters for better thermal performance and occupant views [31].
Additionally, Hammad [8] tested office buildings on Abu Dhabi with dynamic louvers. The study tested all building orientations and suggested an optimal static angle of −20° for the south orientation and 20° for the east- and west-oriented façades. The results show that energy improved by 34.02%, 28.57%, and 30.31% for the south, east, and west orientations, respectively. The use of dynamic louvers was slightly more effective than static louvers. On the other hand, Al-Sallal [32] argues that an external dynamic shading system is not recommended due to the UAE’s high dust climate. Static external shading with the optimal sloping degree can be more energy and cost-effective. Furthermore, studies accompanied with multiple passive strategies recommend external shading at least on the south envelope. For instance, Taleb [33] applied in her eight passive strategies study, external slats horizontally rotated at 45° on southeast façade. The results aided in reduced annual energy consumption by up to 23.6% performance.
The studies reviewed confirm that passive window design parameters and daylight strategies offer the potential to reduce the total building energy use significantly. Energy optimization and daylight are two relatively interdependent concepts in terms of solar heat gain, sunlight distribution, the orientation of windows, and visible transmittance [34]. Window design evidently plays a significant role in reducing cooling energy demand, especially in hot climate regions. Studying the window orientation, window-to-wall ratio, glazing type, and external shading is recommended to utilize natural daylight. Challenges occur through aims to provide the ideal balance among the considered parameters while minimizing the contradiction between them. The state of research is highlighted by retrofitting case studies and simulations that test one or a combination of the covered passive strategies. The literature reveals several recommendations made regarding each of the best window-to-wall ratio, glazing type, and external shading, which achieve significant cooling energy reductions along with maintaining daylight savings and adequate visual comfort level. The most notable studies and recommendations are highlighted in Table 1.

3. Methodology

This study used a mixed methodology exploratory investigation to investigate an evidence-based retrofitting solution that office buildings in the UAE can adopt for energy reduction and user comfort. A research framework, illustrated in Figure 1, has been developed accordingly. The framework adopts three main stages and tow milestones. First, a literature review is completed to acts as a guide that covers a range of background information, including the energy status in the UAE, retrofit vs. new built, energy retrofit and user comfort, and energy retrofit strategies, measures, challenges, and case studies. Second, the exploratory investigation stage gathers and analyzes all the necessary case study information to achieve an evidence-based design solution and validate it. Third, the exploratory investigation stage collected data through three sources. Firstly, building architectural drawings, construction details, and energy consumption bills are obtained of the tested building. Secondly, physical monitoring data is used to measure the existing indoor environment quality. Thirdly, a user satisfaction questionnaire is conducted to understand the perception of the occupants and its relation to physical monitoring.

3.1. Exploratory Investigation

To investigate the comprehensive Post Occupancy Evaluation (POE), the occupancy survey and indoor monitoring began in early 2020 and ended in March 2020 due to COVID-19 lockdowns and office closures. It will help to understand the indoor environmental state and issues in the case study building, as well as to calibrate the baseline model to validate and to evaluate the sensitive study’s scenarios.

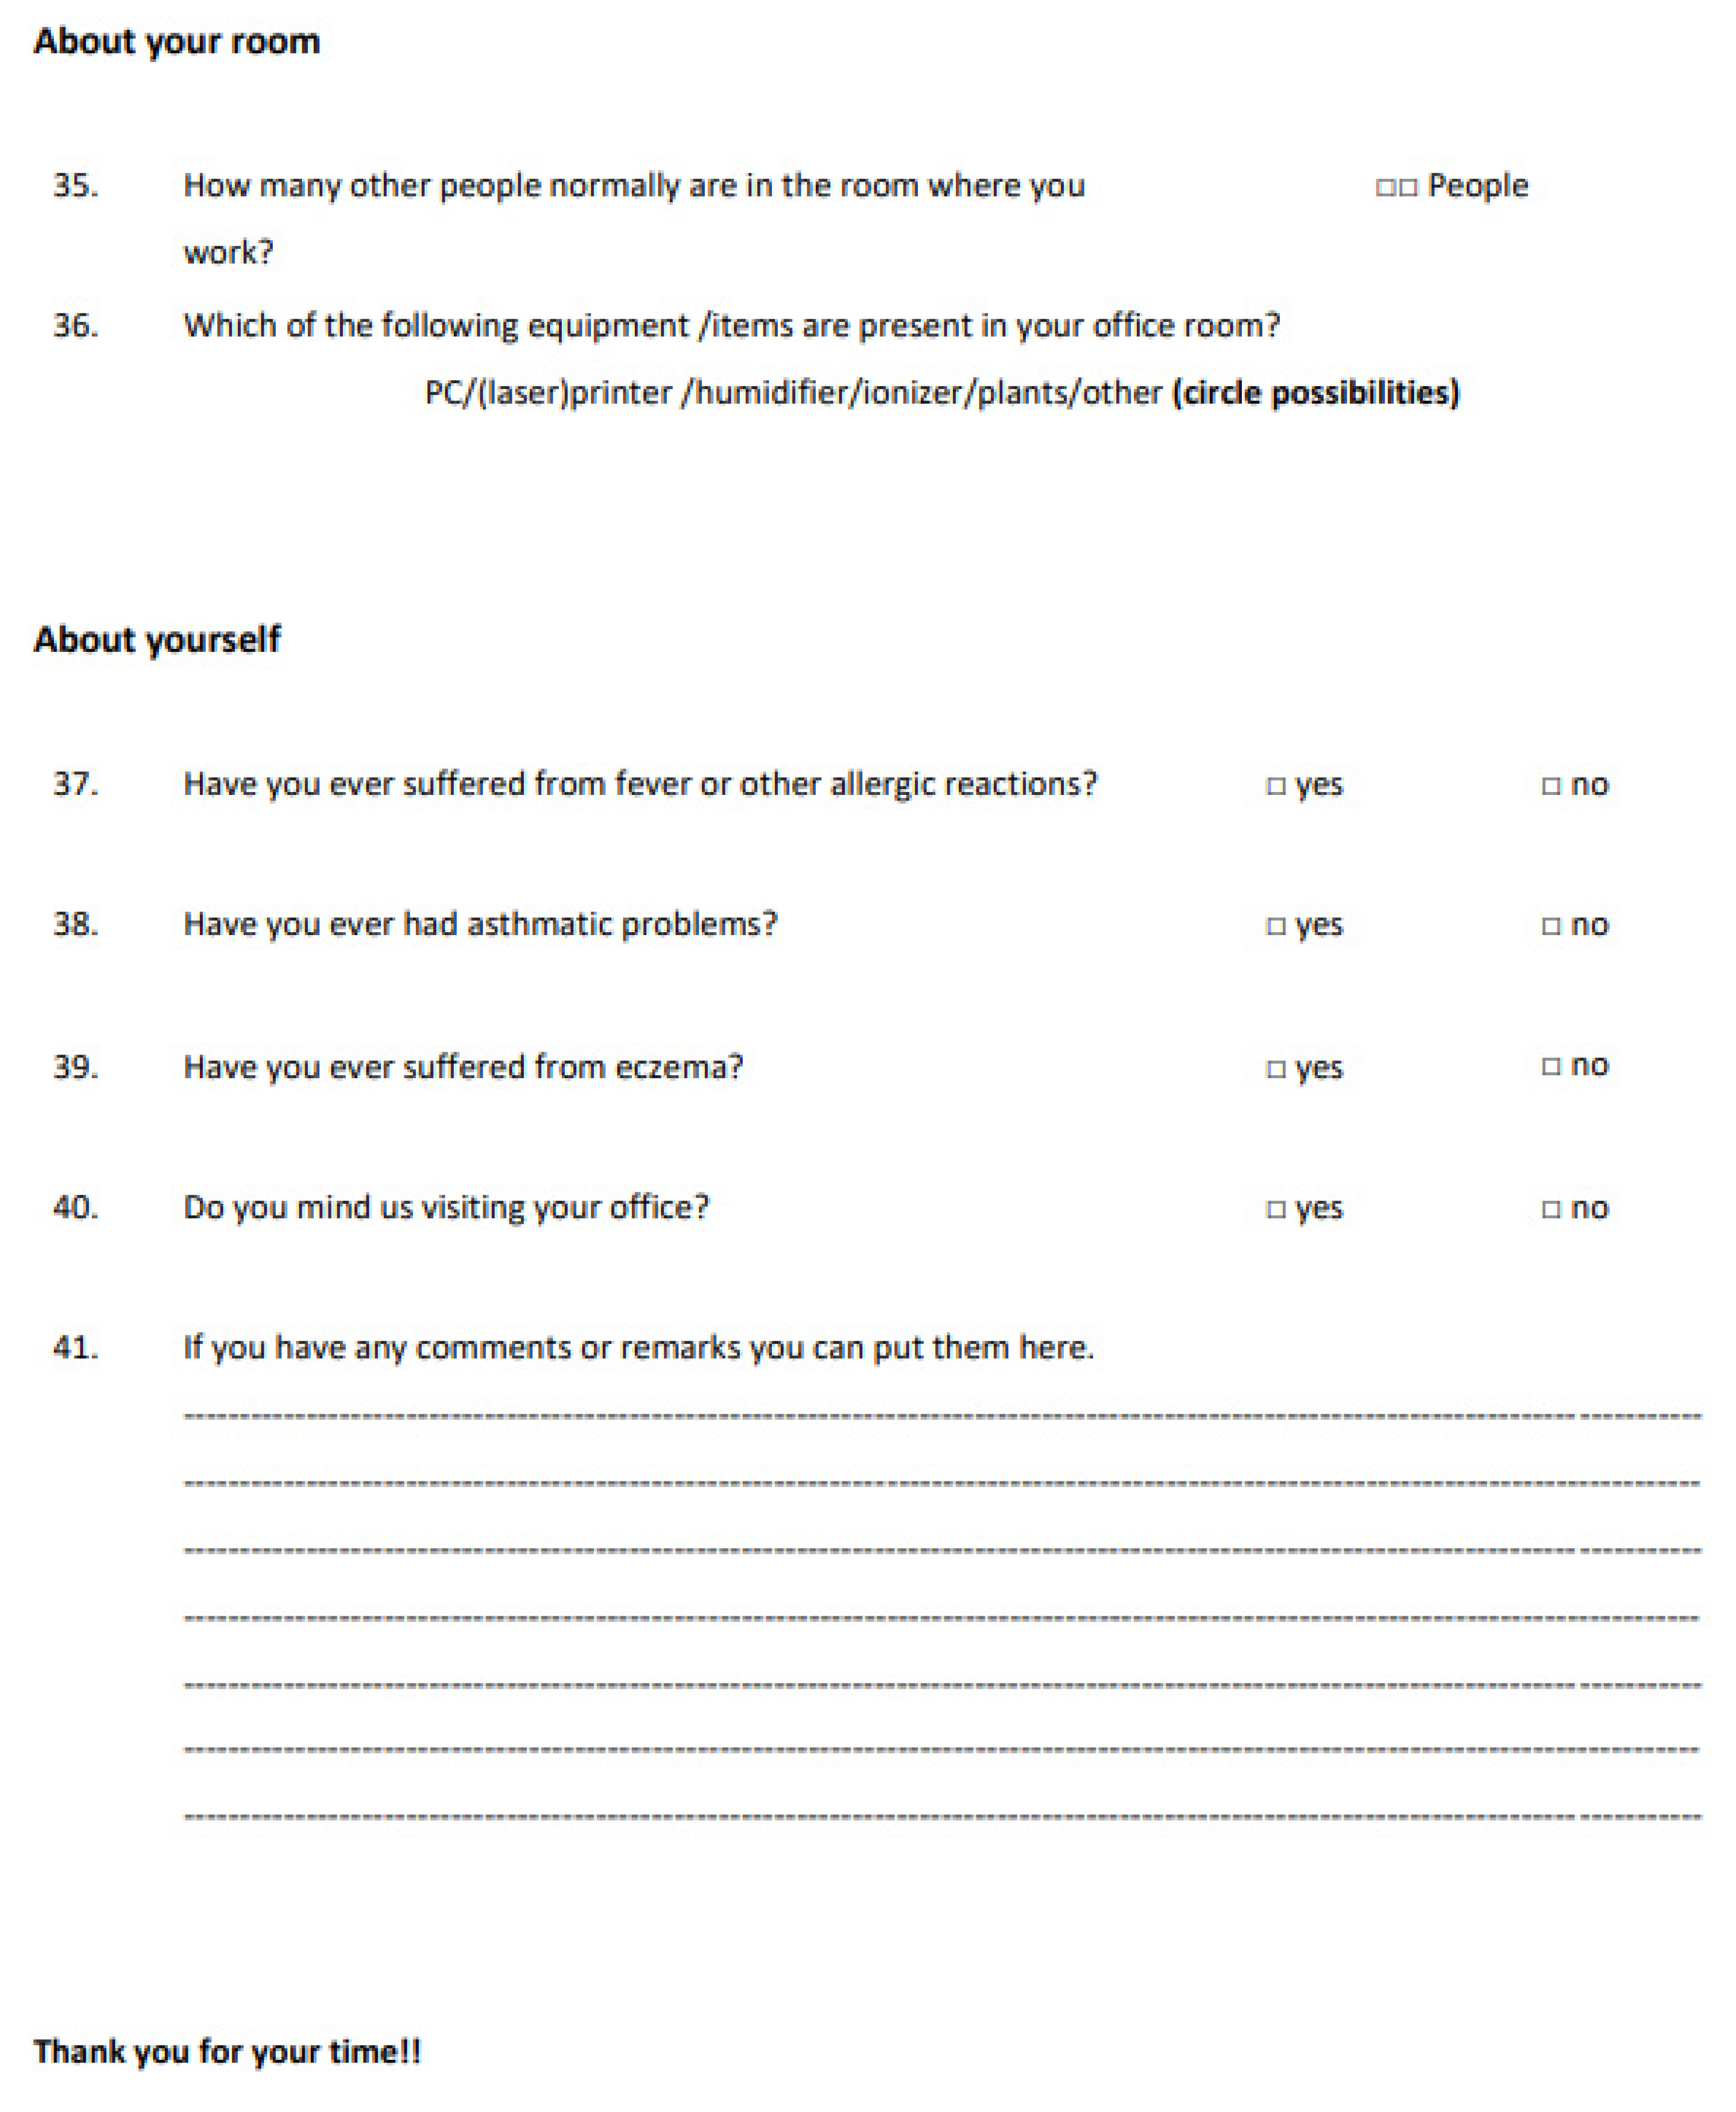
3.1.1. User Satisfaction Questionnaire

A questionnaire was developed and distributed to investigate the perceptions of the building’s occupants and identify the causes of discomfort and dissatisfaction with the indoor office environment. Occupant perception was measured using a standardized four-point Likert frequency scale. A set of survey questions adopted in the Indoor Environmental Quality Handbook [35] were modified to suit the building context and individual characteristics of the case study building. Survey questions consist of three main sections. We started with a background section that includes resident demographics and occupational characteristics. Second, we investigated residents’ perceptions of the causes of discomfort and dissatisfaction with indoor environmental quality (IEQ) and their frequency of occurrence. The final section contains questions on the prevalence of health-related symptoms experienced at work that are directly linked to the overall IEQ. The survey questionnaire can be found in Appendix A.

3.1.2. Indoor Environmental Monitoring

To obtain air temperature (°C) profiles and relative humidity (RH in%), we used specific devices, such as HOBO U12 data loggers, in selected open workspaces and closed offices to assess comfort and lighting quality to perform continuous measurements. Illuminance levels are measured by spot measurements using a portable environment meter to obtain a realistic approximation of the illumination (lux) that the operator receives from the work surface via the PRECISION GOLD multifunction environment meter (model N09AQ). This step helps collect actual data about indoor conditions experienced by users, and the specification of the data loggers is shown in Table 2.

3.2. Sensitivity Analysis

After finalizing the literature review and exploratory investigation, the first milestone was achieved: the case study problem identification. Following that is the sensitivity analysis for the window retrofitting parameters stage utilizing model simulation. DesignBuilder software was used to test the energy performance of the existing case study model against the suggested retrofit solutions based on the previous two stages. The sensitivity analysis stage is split into a single parameter sensitivity analysis and a multiparameter sensitivity analysis, which take place correspondingly. This final milestone proposes an evidence-based fenestration design solution and general recommendations, concluding this study.
To find the ideal window retrofit solution, the second step uses information gathered by model simulation, which is in line with international and regional recommendations, such as Abu Dhabi’s Estidama regulations and LEED. Today, energy optimization of buildings can be achieved with dynamic simulation tools [10]. DesignBuilder software was used to create a series of alternative model scenarios to conduct comparative studies with existing reference building models. This software was used as the EnergyPlus analysis engine and was chosen for its ability to accurately calculate solar collection, annual energy consumption, and solar irradiance distribution based on local weather data.
The simulated model included a typical building block, including the main workspace, enclosed office, lounge area, and corridor surrounded by the west façade. Three parameters of window design were tested: WWR, glazing type, and shading device. The testing occurred at two levels: single parameter level and multiparameter level. The tested scenarios were then related to average daylight irradiance to meet the appropriate daylight comfort level according to WELL building standard. A combination of two-step processes can achieve results validation that extracts in-depth research findings, enhances research, and provides evidence-based design recommendations. The steps taken in this methodology have previously been used and recognized in building energy optimization practices around the world [36], and this study aims to find passive exterior design recommendations for the UAE’s harsh climate and occupant comfort.

3.3. Case Study Building and Climate

The case study building selected for this study is located on the United Arab Emirates University campus in Al-Ain, UAE. Al-Ain is a city on the outskirts of Abu Dhabi characterized by a hot and dry desert climate, with long, very hot summers (38 °C on average) and warm winters (18 °C on average), with an average relative humidity of 60% [37]. The building, classified as an F1 building, is a three-story higher education office building. The floor has several functions covering approximately 600 users, including open workspaces, closed offices, lecture rooms, conference rooms, laboratories and faculty, students, researchers, and other employees. In terms of mechanical specifications, an air handling unit (13 AHU) is located on the roof and uses duct cooling system to cool the building. In addition, the lighting system in the offices includes only T5 flounce lamps. Figure 2 shows exterior images of the building and a zoom in illustration of the tested west façade.

4. Exploratory Investigation Summary

User Satisfaction Questionarie and Monitoring Analysis

Data from a total of 90 residents were collected and analyzed. Table 3 shows the demographic information of the respondents. The proportion of women was higher than that of men at 58% and 42%, respectively. Ages in the 20s and 30s made up the majority of respondents, consisting of 78% of the sample. This is mainly because the study focuses on open offices and reception areas, with few young researchers and administrative and higher academic faculty.
Similarly, the survey results highlighted that 55% of respondents reported that the indoor thermal conditions were “too cold”. Moreover, 31% respondents reported “temperature change”, along with a few notable outliers reporting “too warm” and “warm surface”, which were tracked to be located along the west façade of the building. These results highlight the problem of cooling setpoint temperatures set by facility management exhibiting undesirable loss of cooling energy, causing more discomfort to the occupants. In addition, occupants situated along the west façade stated to be dissatisfied with the thermal comfort.
On the other hand, indoor illuminance (703 lux on average) appeared as exceeding the recommended range for office buildings (300–500 lux). Moreover, the highest relative occupants’ complaints indicated “too much artificial light” and “daylight reflection or glare”. Additionally, the majority of complaints came from occupants in open and closed offices along the west orientation. These results again show operational loss of lighting energy that contributes to the discomfort of the occupants and an emphasis on the west orientation. More details on the current state of the baseline conditions and survey finding are highlighted in Table 4 and more details of the POE and monitoring analysis of this case study building can be found in a previous paper [38].

5. Single Parameter Sensitivity Analysis

5.1. Baseline Model Calibration and Validation

The baseline model adopted the existing conditions of the case study building. After plugging in the dataset for the actual indoor conditions data from POE evaluations with as-built construction drawings, set point cooling temperatures, HVAC operation, lighting schedules, envelope construction details, and thermal zoning, the baseline model was calibrated and validated. The calibrating input data are shown in Table 5, and a more detailed explanation can be found in another paper [39] which studied the energy performance gap in the case study building.
According to ASHRAE (The American Society of Heating, Refrigerating and Air-Conditioning Engineers) Guideline 14–2014, if the difference between actual data and simulation results is ±5% for the NMBE (Normalized Mean Bias Error) and ±15% for CVRMSE (Coefficient of Variation of the Root Mean Square Error), the simulation model can be accepted as validated [40]. In this study, the NMBE is the monthly energy consumption and the CVRMSE is the annual energy consumption.
The total energy consumption of the building in 2019 was 1,385,878 kWh (see Table 6) and the energy use intensity (EUI) of the case study building was 194.6 (kWh/m2) based on the total conditioned floor area (7120 m2) and the energy consumption. After calibration, the monthly and annual energy consumption of the simulation model can be seen in Table 6 and the difference between the simulation model and the actual energy consumption achieved the acceptable level as validated. The EUI of CVRSMSE is 1.4% higher, at 197.4 kWh/m2.
However, the energy usage of the case study buildings is confirmed to be higher than the UAE’s best practice for energy-efficient buildings consuming 110–160 kWh/m2 [41]. The simulated baseline uses common blocks along the western front, as shown in Figure 3.
The energy use distribution (see Figure 4) shows HVAC as maximum energy consumption (cooling) at 139.8 (kWh/m2), accounting for 71% of the total building energy use. Typical HVAC energy consumption for office buildings ranges from 39–55% [42,43,44] across different climate zones. This can be tracked down mainly by two issues. The first is the lower setpoint and setback temperature (21 °C and 24 °C, respectively) set by the facility management team. Second, the increase in WWR has resulted in an increase in the total cooling load of the office building due to the heat gains through the windows. Additionally, as shown in Internal Heat Gain Sources (see Figure 5), the highest internal heat gain source was exterior windows with an annual heat gain of 91.5 kWh/m2, demonstrating the seriousness of solar heat gain. These early results highlight existing problems posed by POE evaluations.

5.2. Sensitivity Analysis for WWR

DesignBuilder software supported WWR optimization evaluation through EnergyPlus calculations. After plotting all energy simulation data via Microsoft Excel, Figure 6 summarizes key building energy use trends, as WWR varies from 0% to 100% with 10% increments. Overall trends show a more pronounced increase in HVAC (cooling) energy consumption compared to a slight decrease in artificial lighting energy, with WWR progressing accordingly. Considering only the balance of HVAC (cooling) and lighting energy consumption to achieve minimum EUI, the optimal WWR was 20%, achieving a 14.5% reduction in energy usage compared to the baseline model. Figure 6, on the other hand, shows the effect of WWR on the average illuminance experienced by the office occupants. Here, 300–500 lux is met in the range of 20–30% of WWR, depending on the lighting comfort standards stated in the literature. Therefore, the optimal WWR for the west façades of office buildings located in the UAE is 20–30% (see Figure 7). Further discussions of the WWR findings can be found in a previous paper [45].

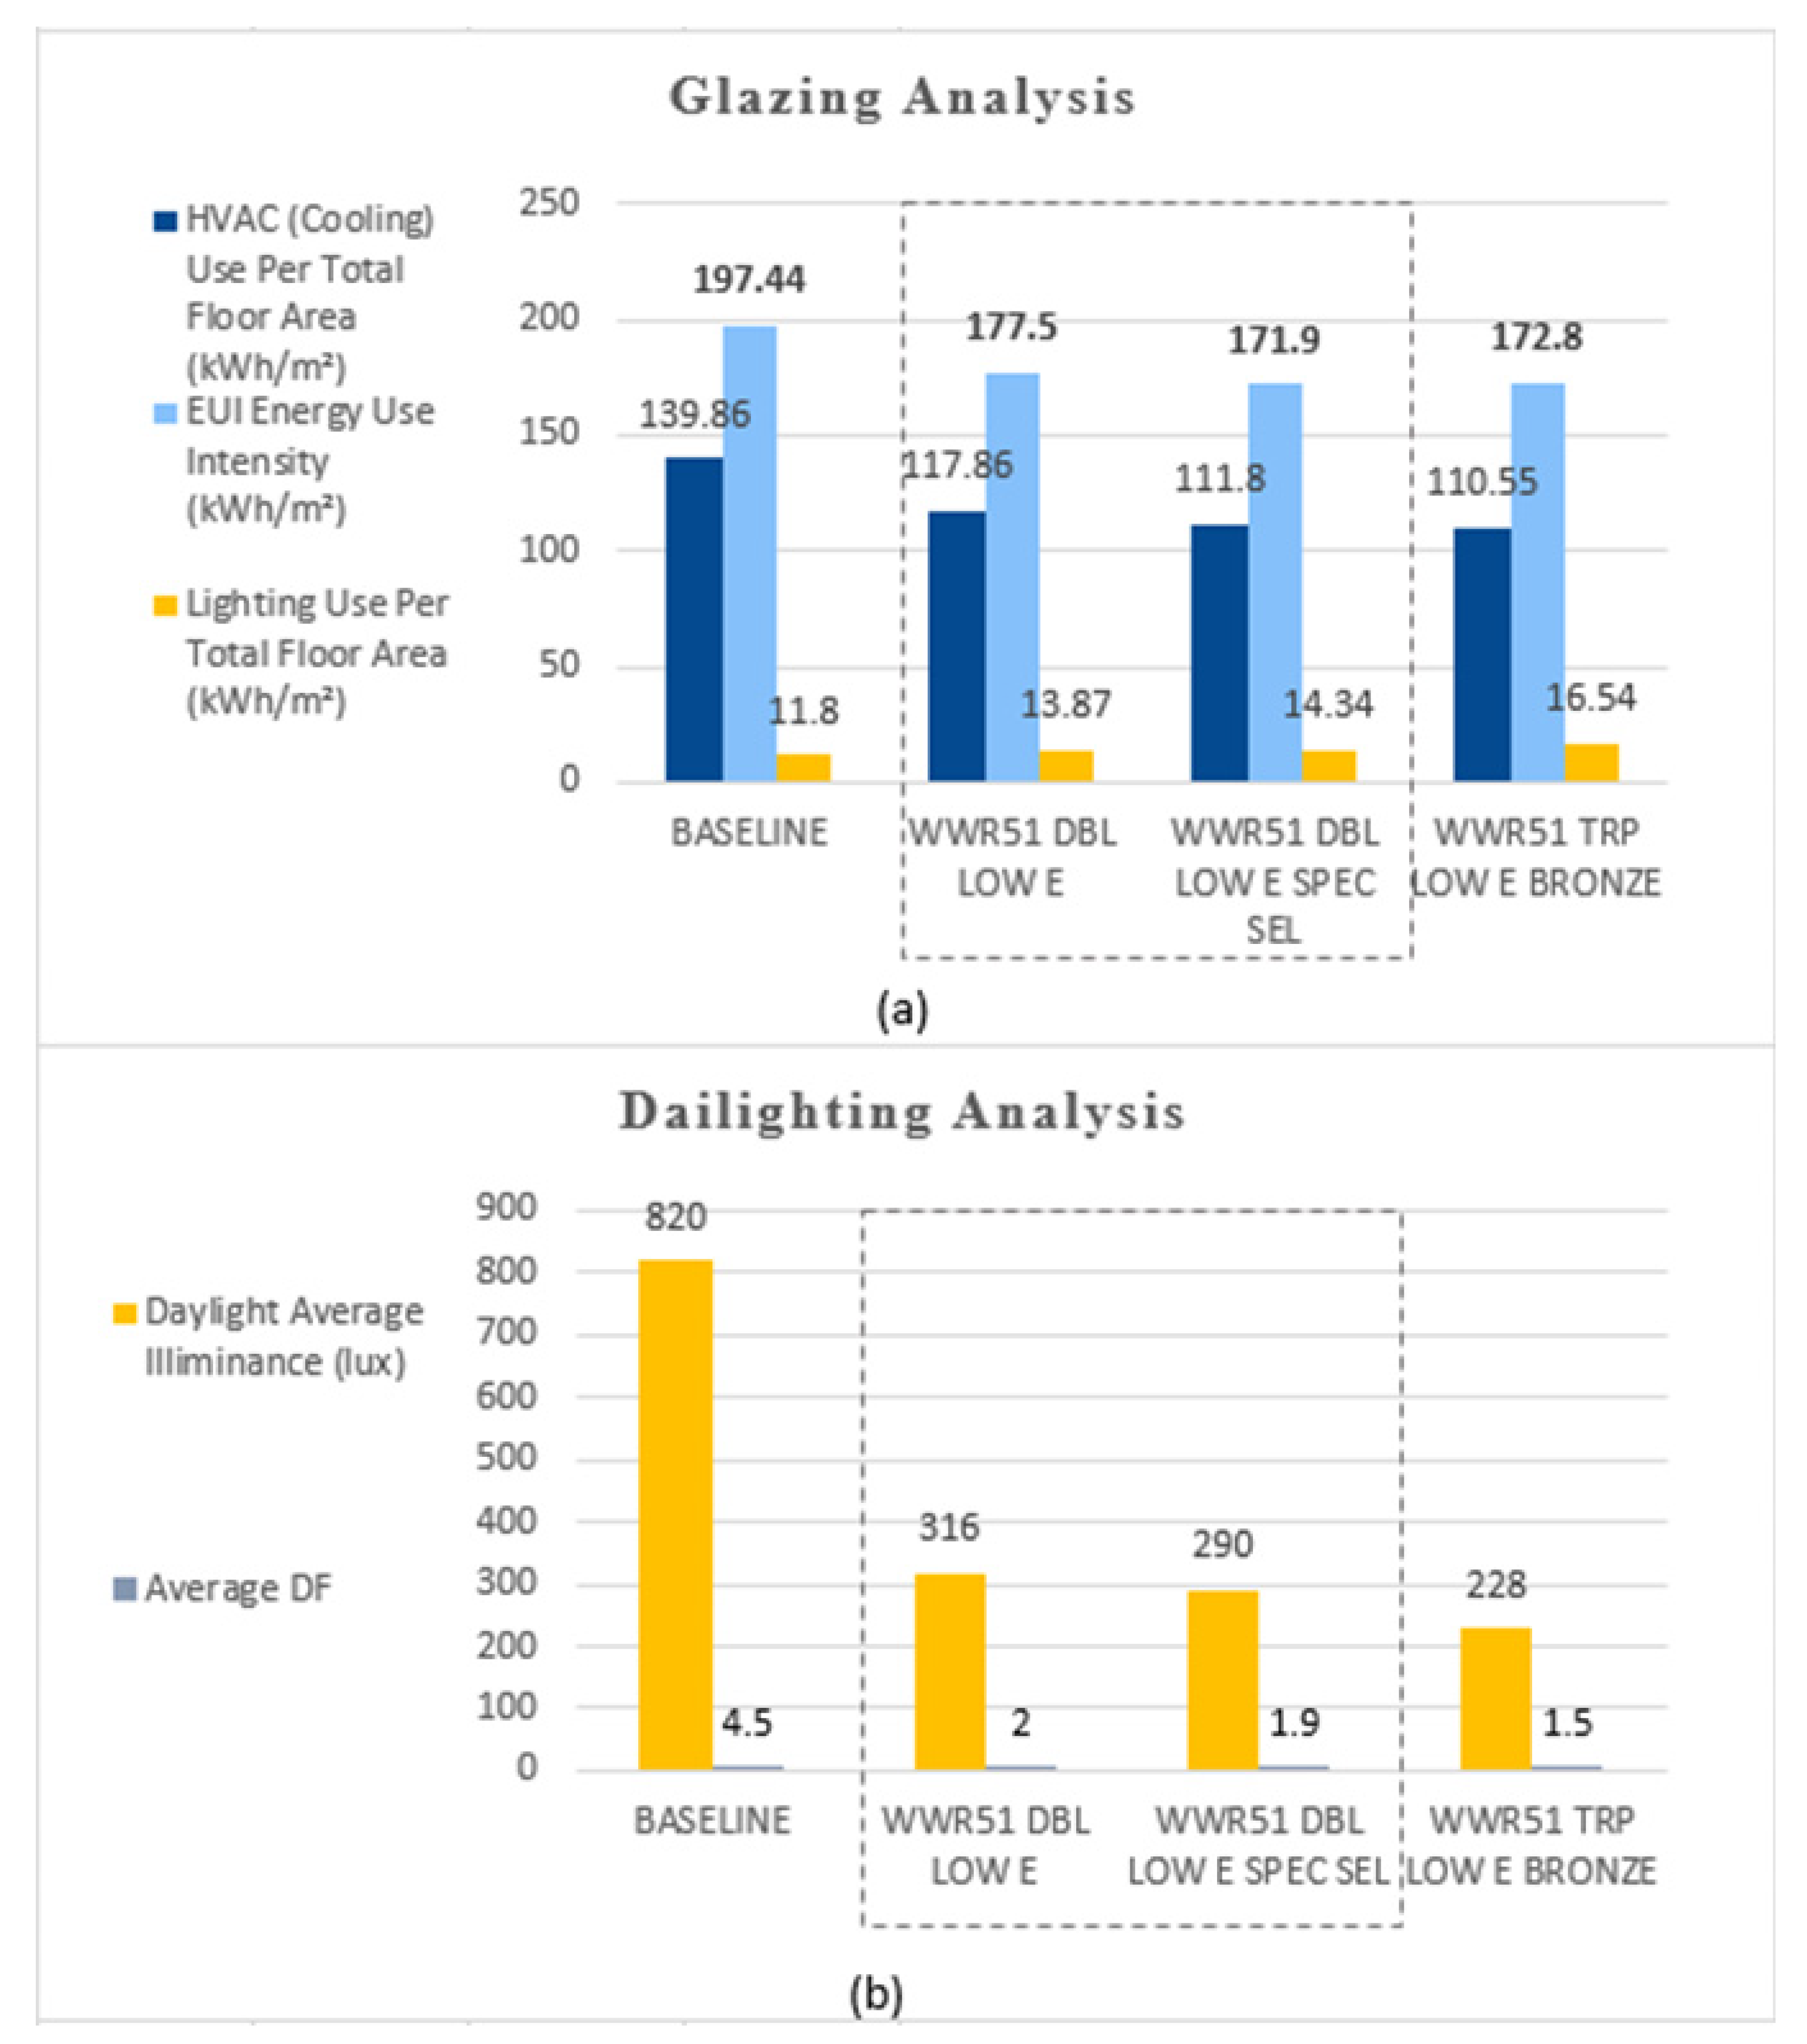
5.3. Sensitivity Analysis for Glazing Type

Towards the glazing type sensitivity analysis, three proposed types of glazing have been tested against the baseline existing glazing. The proposed glazing types were selected based on the literature review recommendations along with Estidama pearl rating recommendations for energy efficiency [7]. To optimize the building’s energy use and daylighting levels, three key glazing properties were accountable for the glazing’s performance, which are the Solar Heat Gain Coefficient (SHGC), Visible Transmittance (VT), and U-Value. The existing case study glazing is double reflective glazing with SHGC of 0.69, VT of 0.7, and U-Value of 2.70 W/m2 K. The performance of the existing glazing is passable by itself; however, potential room for improvement was achieved when other glazing technologies were applied and tested, such as double glazing with Low-E coating, spectrally selective technology, or triple glazing with metallic coating. The three tested glazing types and properties are listed in Table 7.
Notable results of the glazing type sensitivity analysis simulation (see Figure 8):
  • Double low emissivity metallic coating spectrally selective glazing revealed the highest energy performance of 13% reduction in EUI.
  • Double low emissivity metallic coating tinted glazing revealed a close 10% reduction in EUI, along with the best daylighting performance of daylighting factor 2 and 316 average lux level.
  • Triple low emissivity metallic coating bronze glazing was revealed to be not as effective, as it produced low daylighting levels and increased artificial lighting energy consumption.
Figure 8. Effect of glazing type on building energy use (a) and daylight illuminance (b) (optimum performance highlighted in the dotted box).
Buildings 12 01541 g008

5.4. Sensitivity Analysis for External Shading

To test the effect of external shading on building energy use and daylight levels, 10 shading alternatives have been tested against the baseline of no external shading. They were proposed based on the literature review findings. The alternatives included horizontal louvers, overhangs, and side fins of different depths and angles. As the model tested the west façade, the orientation plays a significant role in the shading performance and design. Simulation results find that horizontal louvres offer the least energy savings (5–6%) with varied angles and projection depths. On the other hand, the best performance was achieved by overhang + side fins (0.8 m projection), with a reduction of total energy use of 8% and adequate average illuminance level of 299 lux (see Figure 9 and Figure 10). This shading option offered 42% reduction in solar gains from external windows, from a baseline of 91.5 to 52.8 (kWh/m2). Figure 9 shows the effect of different external shading options on the total building energy use and daylighting levels on the west façade.

6. Multiparameter Sensitivity Analysis

For the multiparameter sensitivity analysis, all combinations were tested against each other. As the WWR, glazing type, and external shading are three interdependent fenestration design parameters, a notable finding was that the combination of the best-performing single alternatives together does not generally result in better performing results, and in a lot of cases, the combination of the best-performing single alternatives resulted in insignificant total building energy reduction and drastically reduced daylighting comfort levels. Ten different combinations of two to three parameters were highlighted and compared to each other in terms of building energy use and daylight illuminance levels, as shown in Table 8.
Notable results of the multiparameter sensitivity analysis simulation:
  • The most optimal size of the windows was 30% and 40% of WWR when combined with energy-efficient glazings and external shadings (Rank 1 to 5).
  • Combinations of 20% WWR and any energy efficient glazing types were rank as 8th and 9th and it performed worser than 20% WWR with current glazing (see Figure 11).
  • The combination of 30% WWR and double low E tinted glazing revealed the best performance overall in EUI and daylight (Rank 1) and 15.6% EUI reduction could be achieved with low E and SPEC SEL glazing (Rank 2).
  • The combination of 40% WWR and 0.8 projection shading overhang and side fin revealed the best daylighting conditions of 344 lux with EUI 11.3% reduction (Rank 3).
  • The combination of 51% WWR and double Low E tinted glazing revealed the second-best daylighting condition of 316, but not a noticeable reduction of EUI of 10.1% (Rank 7).

7. Final Design Discussion and Recommendations

The proposed research design aimed to find evidence-based fenestration design for Energy Optimization. The sensitivity analysis presents a summary of the results and recommendations for fenestration design of the west façade of an office building.
Summary of findings and recommendations from the sensitivity analysis:
  • The optimum WWR for the west-facing façade in a hot arid climate regarding both building energy performance and occupants’ comfort is 20–30%.
  • UAE Estidama glazing recommendations for general buildings are only viable on larger WWRs in terms of energy efficiency, but must be carefully integrated when applying other passive design strategies (such as in lower WWR and external shading) to ensure occupants’ comfort and reduced artificial lighting energy use.
  • The WWR is the most significant passive façade design parameter (compared to glazing type and external shading) that impacts the overall building energy use, as well as visual and thermal comfort (achieving up to 15% total energy reduction).
  • External shading is the least significant passive façade design parameter compared to WWR and glazing type (achieving up to 8% total energy reduction).
The results reveal the three best-performing alternatives for the fenestration design on the west façade of the case study. The best performance was achieved only by reducing the window-to-wall ratio from 51% (existing) to 20% (proposed) with a final energy use intensity (EUI) of 168.7 kWh/m2. Following that are two similarly performing design combinations. Replacing the glazing type with double low emissivity metallic coating tinted glazing along with 30 WWR achieves similar EUI results, i.e., 169 kWh/m2. Moreover, adding an external shading device (overhang and side fins with 0.4 m projection) combined with replacing the glazing type with double low emissivity metallic coating tinted glazing along with 40 WWR achieves similar EUI results, i.e., 169.2 kWh/m2. The findings highlight the significance of WWR on energy use intensity and lighting and thermal comfort. Furthermore, multiparameter sensitivity analysis is more complex and less effective than single parameter sensitivity analysis.
The simulation study illustrates the effect of replacing several retrofitting solutions along with different WWRs, glazing types, and external shading options towards minimizing the annual cooling load and external window solar heat gain, while maintaining adequate indoor daylight illuminance levels. The main findings highlight the importance of the WWR on influencing the cooling load along with the selection of complementary glazing type and external shading. Considering the WWR alone was able to achieve 15% annual energy use reduction by minimizing the WWR from 51% to 20%. Although the energy savings of this option (option A in Figure 12) are viable, considering the retrofitting cost may question the viability as there are multiple construction methods to approach this solution. Nevertheless, considering the WWR in the design stage is the most important parameter to consider in terms of overall cost savings including construction, cooling energy, and lighting energy costs.
As for the glazing type sensitivity analysis, the study features the viability of the spectrally selective glazing technology used in the double low emissivity metallic coating spectrally selective glazing type, as it presented the best energy performance. These findings validate ESTIDAMA energy efficiency recommendations along with the literature of previous research [7,13,16,46]. However, when it comes to the comprehensive performance of the indoor daylighting comfort level, again, careful consideration of the WWR is recommended. The results found that lower WWR do not require advanced glazing technologies; otherwise, the combination of both may cause poor indoor daylighting comfort levels and possible increased annual energy consumption caused by increased lighting energy. As for the development of office buildings which commonly share the characteristic of increased WWR (more than 40%) [34], an advanced glazing technology performance is advised to decrease annual energy use, while maintaining comfortable indoor daylighting conditions. Option B in Figure 12 provides a relatively viable solution that allows for larger WWR than option A (30% WWR) with the same performance (169 Kwh/m2) simply by upgrading the glazing type used.
Option C in Figure 12, achieves the same energy performance (169 Kwh/m2) while allowing for an increased WWR of 40% by including external overhang and side fins with 0.4 m projection on the west windows. Selecting an appropriate external shading structure or design is a challenging task especially when including the performance of the energy consumption and indoor daylighting conditions. The engineer or architect must study the effect of the external shading structure proportional to the size of the window or WWR and the type of glazing used comprehensively. Results find that larger WWR in the west orientation requires larger overhang and side fin projections proportionally to maintain adequate daylighting levels. This selection of external shading structure offers ease in construction and low cost, whether as a retrofit project on an existing office building with no external shading installed or in a new office building design.

8. Conclusions

Adopting a case study of a higher education office building in the UAE, this study explores the retrofitting of multiple west-facing windows with the aim of reducing the energy consumption of the building and improving the comfort of its occupants. Conducting comprehensive POE assessments and simulation studies are needed to explore opportunities. The main findings of this research contribute to providing design recommendations on façade retrofit solutions to reduce cooling energy consumption while maintaining user comfort in regard to the harsh UAE climate. Moreover, results support and encourage architects to achieve better energy performance of existing and new office buildings in hot and dry climate while ensuring excellent occupant satisfaction levels.
The results highlight the importance of the window-to-wall ratio (WWR), as it is the single most significant parameter effecting total energy consumption and daylighting levels. The results suggest 20–30% WWR as the optimum range in the west façade. However, by utilizing high performance glazing types and external shading, equal energy savings can be achieved with a larger WWR. Double low E tinted glazing and 0.4 projection shading overhang and side fin achieve a noteworthy reduction in building energy use intensity, i.e., of 14%.
The limitations faced in this project includes some software constraints when it came to the external shading investigation. Future studies should aim to focus in more detail on the shading device and utilize different simulation software in order to test more variations of external shading devices in diagonal and repeated vertical settings that were missed in the current simulation study. Moreover, performing a detailed cost analysis for the suggested retrofit solutions and recommendations may further validate or disprove the viability of their performance and feasibility of construction.

Limitation and Future Study

This study only has focused the cooling energy consumption and daylight quality by comparing and combining selected WWR, glazing, and shadings for western façade of the UAEU office building. Moreover, we used simulation software to determine the optimal solutions. This needs field testing and measure data to confirm the solutions, as well as another survey to figure out how these solutions improve user satisfaction.
The findings from this study could be applied to the west façade, but the impact on the south and east façades still needs to be evaluated. For the retrofitting project to reflect realistic scenarios, a cost analysis is needed, which can affect the selection of optimal solutions.

Author Contributions

Conceptualization, Y.K.K. and Y.A.; methodology, Y.A. and Y.K.K.; software, Y.A.; validation, Y.K.K., Y.A. and A.A.; formal analysis, Y.A. and Y.K.K.; investigation, Y.A. and Y.K.K.; resources, Y.A. and R.A.; data curation, Y.A. and R.A.; writing—original draft preparation, Y.A. and R.A.; writing—review and editing, Y.K.K. and A.A.; visualization, Y.A.; supervision, Y.K.K. and A.A.; project administration, Y.K.K.; funding acquisition, Y.K.K. All authors have read and agreed to the published version of the manuscript.

Funding

This research was funded by the United Arab Emirates University (UAEU) grant number [G00002953], and the APC was funded by UAEU.

Institutional Review Board Statement

Not applicable.

Informed Consent Statement

Not applicable.

Acknowledgments

The authors would like to acknowledge the great support by the United Arab Emirates University (UAEU) for funding this study under the research grant STARTUP 2018 (G00002953) and also allowing the use of its university building for research and the building occupants who participated the POE study.

Conflicts of Interest

The authors declare no conflict of interest.

Appendix A

Figure A1. Questionnaire for occupants—indoor air quality (IAQ).
Buildings 12 01541 g0a1aBuildings 12 01541 g0a1bBuildings 12 01541 g0a1cBuildings 12 01541 g0a1d

References

  1. Li, D.H.W.; Lam, J.C.; Wong, S.L. Daylighting and its effects on peak load determination. Energy 2005, 30, 1817–1831. [Google Scholar] [CrossRef]
  2. Li, D.H.W.; Wong, S.L. Daylighting and energy implications due to shading effects from nearby buildings. Appl. Energy 2007, 84, 1199–1209. [Google Scholar] [CrossRef]
  3. Aboulnaga, M.M. Towards green buildings: Glass as a building element—The use and misuse in the gulf region. Renew. Energy 2006, 31, 631–653. [Google Scholar] [CrossRef]
  4. International WELL Building Institute. The WELL Building Standard; International WELL Building Institute: New York, NY, USA, 2020. [Google Scholar]
  5. Rawal, R.; Schweiker, M.; Kazanci, O.B.; Vardhan, V. Personal comfort systems: A review on comfort, energy, and economics. Energy Build. 2020, 214, 109858. [Google Scholar] [CrossRef]
  6. Sustainability Report; DEWA: Dubai, United Arab Emirates, 2020.
  7. EGBC. The Pearl Rating System for Estidama; ADUPC: Abu Dhabi, United Arab Emirates, 2010. [Google Scholar]
  8. Hammad, F.; Abu-Hijleh, B. The energy savings potential of using dynamic external louvers in an office building. Energy Build. 2010, 42, 1888–1895. [Google Scholar] [CrossRef]
  9. Anastaselos, D.; Oxizidis, S.; Papadopoulos, A.M. Suitable thermal insulation solutions for Mediterranean climatic conditions: A case study for four Greek cities. Energy Effic. 2017, 10, 1081–1098. [Google Scholar] [CrossRef]
  10. Kültür, S.; Türkeri, N.; Knaack, U. A Holistic Decision Support Tool for Facade Design. Buildings 2019, 9, 186. [Google Scholar] [CrossRef]
  11. Lee, J.W.; Jung, H.J.; Park, J.Y.; Lee, J.B.; Yoon, Y. Optimization of building window system in Asian regions by analyzing solar heat gain and daylighting elements. Renew. Energy 2013, 50, 522–531. [Google Scholar] [CrossRef]
  12. Ihara, T.; Gustavsen, A.; Jelle, B.P. Effect of facade components on energy efficiency in office buildings. Appl. Energy 2015, 158, 422–432. [Google Scholar] [CrossRef]
  13. Abdelsalam, A. Assessing the energy performance of modern glass facade systems. MATEC Web Conf. 2017, 120, 08001. [Google Scholar] [CrossRef] [Green Version]
  14. Su, X.; Zhang, X. Environmental performance optimization of window–wall ratio for different window type in hot summer and cold winter zone in China based on life cycle assessment. Energy Build. 2010, 42, 198–202. [Google Scholar] [CrossRef]
  15. Krarti, M.; Deneuville, A. Comparative evaluation of optimal energy efficiency designs for French and US office buildings. Energy Build. 2015, 93, 332–344. [Google Scholar] [CrossRef]
  16. Bruno, R. Optimization of glazing systems in Non-Residential buildings: The role of the optical properties of air-conditioned environments. Build. Environ. 2017, 126, 147–160. [Google Scholar] [CrossRef]
  17. Phillips, R.; Troup, L.; Fannon, D.; Eckelman, M. Triple bottom line sustainability assessment of window-to-wall ratio in US office buildings. Build. Environ. 2020, 182, 107057. [Google Scholar] [CrossRef]
  18. Troup, L.; Phillips, R.; Eckelmana, M.J.; Fannon, D. Effect of window-to-wall ratio on measured energy consumption in US office buildings. Energy Build. 2019, 203, 109434. [Google Scholar] [CrossRef]
  19. Alwetaishi, M.; Taki, A. Investigation into energy performance of a school building in a hot climate: Optimum of window-to-wall ratio. Indoor Built Environ. 2020, 29, 24–39. [Google Scholar] [CrossRef]
  20. Alwetaishi, M.; Benjeddou, O. Impact of Window to Wall Ratio on Energy Loads in Hot Regions: A Study of Building Energy Performance. Energies 2021, 14, 1080. [Google Scholar] [CrossRef]
  21. Mahdavinejad, M. Horizontal distribution of illuminance with reference to Window Wall Ratio (WWR) in office buildings in hot and dry climate, case of Iran, Tehran. Appl. Mech. Mater. 2012, 110–116, 72–76. [Google Scholar] [CrossRef]
  22. Alkhateeb, E.; Hijleh, B.A. Potential of Upgrading Federal Buildings in the United Arab Emirates to Reduce Energy Demand. Procedia Eng. 2017, 180, 61–70. [Google Scholar] [CrossRef]
  23. Shaeri, J.; Habibi, A.; Yaghoubi, M.; Chokhachian, A. The optimum window-to-wall ratio in office buildings for hot–humid, hot–dry, and cold climates in Iran. Environments 2019, 6, 45. [Google Scholar] [CrossRef] [Green Version]
  24. Feehana, A.; Nagpalb, H.; Marvugliab, A.; Gallaghera, J. Adopting an integrated building energy simulation and life cycle assessment framework for the optimisation of facades and fenestration in building envelopes. J. Build. Eng. 2021, 43, 103138. [Google Scholar] [CrossRef]
  25. Esteghamati, M.Z.; Sharifnia, H.; Ton, D.; Asiatico, P.; Reichard, G.; Flint, M.M. Sustainable early design exploration of mid-rise office buildings with different subsystems using comparative life cycle assessment. J. Build. Eng. 2022, 48, 104004. [Google Scholar] [CrossRef]
  26. Marino, C.; Nucara, A.; Pietrafesa, M. Does window-to-wall ratio have a significant effect on the energy consumption of buildings? A parametric analysis in Italian climate conditions. J. Build. Eng. 2017, 13, 169–183. [Google Scholar] [CrossRef]
  27. Afshari, A.; Nikolopoulou, C.; Martin, M. Life-Cycle Analysis of Building Retrofits at the Urban Scale—A Case Study in United Arab Emirates. Sustainability 2014, 6, 453–473. [Google Scholar] [CrossRef]
  28. Lim, Y.-W.; Kandar, M.Z.; Ahmad, M.H.; Ossen, D.R.; Abdullah, A.M. Building façade design for daylighting quality in typical government office building. Build. Environ. 2012, 57, 194–204. [Google Scholar] [CrossRef]
  29. Freewan, A.A.Y. Impact of external shading devices on thermal and daylighting performance of offices in hot climate regions. Sol. Energy 2014, 102, 14–30. [Google Scholar] [CrossRef]
  30. Ali, A.A.E.-M.M. Using simulation for studying the influence of vertical shading devices on the thermal performance of residential buildings (Case study: New Assiut City). Ain Shams Eng. J. 2012, 3, 163–174. [Google Scholar]
  31. Bansal, N.K.; Hauser, G.; Minke, G. Passive Building Design: A Handbook of Natural Climatic Control; Elsevier: Amsterdam, The Netherlands, 1994. [Google Scholar]
  32. Al-Sallal, K.A. Daylighting and visual performance: Evaluation of classroom design issues in the UAE. Int. J. Low Carbon Technol. 2010, 5, 201–209. [Google Scholar] [CrossRef]
  33. Taleb, H.M. Using passive cooling strategies to improve thermal performance and reduce energy consumption of residential buildings in U.A.E. buildings. Front. Archit. Res. 2014, 3, 154–165. [Google Scholar] [CrossRef]
  34. Asim, A.; Prakash, O.; Kumar, A.; Hasnain, S.M.M.; Verma, P.; Zare, A.; Dwivedi, G.; Pandey, A. Dynamic analysis of daylight factor, thermal comfort and energy performance under clear sky conditions for building: An experimental validation. Mater. Sci. Energy Technol. 2022, 5, 52–65. [Google Scholar]
  35. Bluyssen, P.M. The Indoor Environment Handbook: How to Make Buildings Healthy and Comfortable; Earthscan: London, UK, 2009. [Google Scholar]
  36. Khoukhi, M.; Darsaleh, A.; Ali, S. Retrofitting an Existing Office Building in the UAE Towards Achieving Low-Energy Building. Sustainability 2020, 12, 2573. [Google Scholar] [CrossRef]
  37. Climate & Weather Averages in Al Ain, Abu Dhabi, United Arab Emirates. 2015. Available online: https://www.timeanddate.com/weather/united-arab-emirates/al-ain/climate (accessed on 15 September 2022).
  38. Kim, Y.K.; Abdou, Y.; Abdou, A.; Altan, H. Indoor Environmental Quality Assessment and Occupant Satisfaction: A Post-Occupancy Evaluation of a UAE University Office Building. Buildings 2022, 12, 986. [Google Scholar] [CrossRef]
  39. Kim, Y.K.; Bande, L.; Tabet Aoul, K.A.; Altan, H. Dynamic Energy Performance Gap Analysis of a University Building: Case Studies at UAE University Campus, UAE. Sustainability 2021, 13, 120. [Google Scholar] [CrossRef]
  40. ASHRAE Guideline 14. Measurement of Energy, Demand, and Water Savings. 2014. Available online: https://webstore.ansi.org/Standards/ASHRAE/ashraeguideline142014 (accessed on 15 September 2022).
  41. Clarke, K. 80% Energy Consumed by Buildings. Khaleej Times, 3 February 2016. [Google Scholar]
  42. Liu, Y. A Process Model for Heating, Ventilating and Air Conditioning Systems Design for Advanced Energy Retrofit Projects. Master’s Thesis, Pennsylvania State University, State College, PA, USA, 2012. [Google Scholar]
  43. Cateland, R.P. Energy Efficiency Solutions; Nova Science: New York, NY, USA, 2009. [Google Scholar]
  44. Residovic, C. The New NABERS Indoor Environment tool—The Next Frontier for Australian Buildings. Procedia Eng. 2017, 180, 303–310. [Google Scholar] [CrossRef]
  45. Abdou, Y.; Ki Kim, Y. Investigating Optimal Window to Wall Ratio towards Reducing Cooling Energy Consumption of Offices in the UAE. In Proceedings of the ZEMCH International Conference, Dubai, United Arab Emirates, 26–28 October 2021. [Google Scholar]
  46. Hee, W.J. The role of window glazing on daylighting and energy saving in buildings. Renew. Sustain. Energy Rev. 2015, 42, 323–343. [Google Scholar] [CrossRef]
Figure 1. Research design used for the study. Source: the authors.
Buildings 12 01541 g001
Figure 2. Case study building typical floor plan and exterior photos (west-facing selected block indicated in red).
Buildings 12 01541 g002
Figure 3. Baseline simulation model typical block bounded by the west façade (average WWR 51%).
Buildings 12 01541 g003
Figure 4. Baseline model energy use distribution.
Buildings 12 01541 g004
Figure 5. Baseline model energy use distribution of internal heat gain sources.
Buildings 12 01541 g005
Figure 6. Effect of west façade WWR on building energy use per total floor area (baseline simulation values highlighted in bold).
Buildings 12 01541 g006
Figure 7. Effect of west façade WWR on the average illuminance (lux) in a typical office.
Buildings 12 01541 g007
Figure 9. The effect of different external shading options on the total building energy use (a) and daylighting levels (b) of the west façade (best performance highlighted in dotted box).
Buildings 12 01541 g009
Figure 10. The best-performing external shading option of overhang and side fins with 0.8 m projection for the west façade existing windows.
Buildings 12 01541 g010
Figure 11. Summary of the highest performing results of WWR, glazing types, and external shading options in terms of the total building energy use (a) and daylighting levels (b) on the west façade (optimum performance highlighted in dotted box).
Buildings 12 01541 g011
Figure 12. Illustrations of the highest-performing evidence-based design options for the west façade energy optimization.
Buildings 12 01541 g012
Table 1. A summary of notable literature recommendations for fenestration façade design parameters in hot arid climates.
AuthorLocationParameterRecommendation
[19]Saudi ArabiaWWRWWR to not exceed 35%, 25%, and 20% for northwest, southeast, and southwest orientations, respectively.
[19]Saudi ArabiaWWRWWR for energy performance and daylight, the WWR must range between 20% to 30%, depending on the orientation and altitude, in order to provide the optimal daylight factor combined with building energy performance.
[21]IranWWRThe optimum window area for the eastern and western building façades for hot and humid is 30–50%; and for hot and dry it is 20–60%.
[3]UAEGlazing Type Solar coefficient below 0.20 best in terms of light transmittance and relative heat gain.
[13]UAEGlazing TypeElectrochromic and spectrally selective glazing technologies can help reduce the heat gain due to solar radiation better than other investigated glazing types.
[22]UAE External shading Egg-crate shading design provided the highest energy saving in contrast to horizontal and vertical louvers on the southeast and southwest windows.
[30]Egypt External shading Vertical louvers with higher depth
(100 cm best, 12 cm worst) on all the building orientations.
[8]UAEExternal shadingLouver of optimal static angle of −20° for south and a 20° for the east and west oriented façades.
Table 2. Data loggers and specification.
LoggerImageParaments
Measured
RangeAccuracyMeasuring
Intervals
HOBO U12Buildings 12 01541 i001Temperature (°C)
RH (%)
Temperature: −20° to 70 °C RH: 5% to 95%Temperature: ±0.35 °C RH: ±2.5%15 min
PRECISION GOLD
Multifunction
Environment
Meter
Buildings 12 01541 i002Acoustic (dB)Sound: 35 to 130 dBSound: ±3.5 dB
Lighting (lux)Lux: 0 to 20,000 LuxLux: ±5% rdg + 10 dgts
Table 3. POE occupants’ demographic information.
Total (N)GenderAge GroupJob Description
MaleFemale20–3030–4040–50ResearcherPostgraduate
Students
Specailist
Engineer
Secretary
9038 (42%)52 (58%)70 (78%)19 (21%)1
(1%)
54
(60%)
14
(16%)
18
(20%)
4
(4%)
The POE evaluation indicated several issues and complaints, most notably the heat and lighting conditions in the cast study building. For indoor temperature, 99% of recorded temperatures (average temperature 21.5 °C) were below the range recommended by WELL for hot and dry climates (24 °C to 26 °C).
Table 4. Comparative summary of IEQ monitoring and surveying results.
Monitoring
Parameters
ThresholdTotal
Average
% Above ThresholdHealth Related Symptoms% of Occupants’ ReportOverall Mean Score (0–3)
Temperature24–26 °C21.5 °C99%Too cold55%1.10
Too warm19%
Temp. change31%
Cold feet39%
Warm surface25%
Runny nose31%
RH30–60%53%27%Dry air31%1.10
Thermal comfort23%
Dry/watering eyes32%
Dry skin34%
Lighting300–500 lux703 lux100%Too much light (daylight)14%0.46
Insufficient light (daylight)12%
Too much light (artificial)19%
Insufficient light (artificial)8%
Reflection or glare (artificial)10%
Reflection or glare (daylight)14%
Acoustic55 dBA53 dBA38%Noise (occupants)38%1.20
Noise (machinery)13%
Table 5. Simulation models’ specification and input data for calibration.
Before CalibrationAfter Calibration
Wall
Roof
Floor
Window
0.537 (W/m2 K)
0.403 (W/m2 K)
1.423 (W/m2 K)
2.7 (W/m2 K, SHGC: 0.67)
0.537 (W/m2 K)
0.403 (W/m2 K)
1.423 (W/m2 K)
2.7 (W/m2 K, SHGC: 0.67)
HVAC13 AHU with VAV
(0.3 m/s to 13.2 m/s)
13 AHU with CAV
(8 m/s)
Cooling set temperature24 °C (28 °C) *21.5 °C (23 °C) **
Airtightness0.6 ACH1.5 ACH **
Lighting9.7 W/m29.7 W/m2 ***
SoftwareDesignbuilder V6.1 and EnergyPlus V8.9
SimulationAl Ain Airport weather station Hourly EPW file
8760 h for simulation
* Cooling set temperature and setback temperature based on ASHRAE Standard 55 2007. ** Input data for calibration, based on POE study and monitoring. *** Lighting power density remains the same and the after-calibration model has changed the schedule as 24 h on, and operating schedules for HAVC and occupancy reflected the university schedule and Ramadan. VAV: Various Air Volume, CAV: Constant Air Volume, ACH: Air Change Hour.
Table 6. Before and after calibration of energy simulation results and actual energy consumption of the case study building in 2019.
Design Builder Energy Simulation ResultsActual Energy Consumption (kWh/Year)
Before Calibration (kWh/Year)
(Difference by % from Actual)
After Calibration (kWh/Year)
(Difference by % from
Actual)
JAN61,717 (44%)106,975 (3%)110,395
FEB61,800 (44%)107,119 (3%)110,401
MAR76,893 (24%)105,524 (4%)101,082
APR80,857 (29%)107,809 (5%)113,351
MAY97,120 (14%)118,494 (4%)113,320
JUN95,287 (22%)124,049 (4%)121,622
JUL96,710 (18%)128,947 (8%)118,032
AUG100,514 (10%)114,018 (2%)111,632
SEP88,384 (31%)122,845 (4%)127,863
OCT84,397 (32%)125,829 (1%)124,297
NOV68,631 (43%)122,260 (2%)119,809
DEC60,934 (47%)118,618 (4%)114,074
Total
(EUI kWh/m2)
973,242 (30%)
(136.7)
1,398,888 (1.4%)
(197.4)
1,385,878
(194.6)
Table 7. Glazing types for simulation details and properties.
Glazing TypeWWRSHGCVTU-ValueRecommendation Source
Baseline: Double reflective glazing51%0.690.702.70-
Double Low emissivity metallic coating tinted glazing51%0.370.401.70Relative Literature Review
Double Low emissivity metallic coating spectrally selective glazing51%0.280.401.60UAE baseline–Estidama
Triple Low emissivity metallic coating BRONZE51%0.240.201.20Relative Literature Review
Table 8. The effect of multiparameters on EUL and lux of the west façade.
WWRMulti
Parameters
SHGCU-Value
(W/2m K)
EUI (kWh/m2)
(% Difference from Baseline)
LuxRank
51%
(Baseline)
None0.692.70197.4820
20%Low E0.371.70170.3 (13.7%)1718
Low E and SPEC SEL0.281.60169.3 (14.2%)1669
30%Low E0.371.70169.0 (14.4%)2861
Low E SPEC SEL0.281.60166.7 (15.6%)2592
Overhang and Fin 0.8 0.692.70171.4 (13.2%)2504
40%Overhang and Fin 0.80.692.70175.0 (11.3%)3445
Low E
Overhang and Fin 0.8
0.371.70169.2 (14.3%)2593
51%Low E0.371.70177.5 (10.1%)3167
Low E and SPEC SEL0.281.70171.9 (12.9%)2906
Low E
Overhang and Fin 0.8
0.371.70174.4 (11.7%)16710
None: Double reflective glazing. Low E: double low emissivity metallic coating tinted glazing. SPEC SEL: double low emissivity metallic coating spectrally selective glazing. Overhang and Fin 0.8: please fee Figure 10.
Publisher’s Note: MDPI stays neutral with regard to jurisdictional claims in published maps and institutional affiliations.

